college completion: roadblocks & strategies
DESCRIPTION
College Completion: Roadblocks & Strategies. Appalachian Higher Education Network Conference Asheville, NC – June 10-12, 2014 Presented by: Zornitsa Georgieva & Dr. Marjie Flanigan. - PowerPoint PPT PresentationTRANSCRIPT
College Completion:Roadblocks & Strategies
Appalachian Higher Education Network Conference
Asheville, NC – June 10-12, 2014Presented by: Zornitsa Georgieva &
Dr. Marjie Flanigan
Your Presenters
Zorrie Georgieva, M.S., WVU, Educational Research; former Program Coordinator, Academic Success Center, Concord University; Graduate Assistant, WVU Program Evaluation and Research Center
Dr. Marjie Flanigan, Vice President of Student Affairs & Dean of Students, Concord University
Presenters’ BackgroundExperience with TRIO programs, particularly
Student Support Services (SSS)Began Academic Success Center (ASC) in
2008 to address need for retention for non-SSS students
ASC is a “one-stop shop” to eliminate barriers to remaining in college/Concord
Zorrie—Educational Research, Academic Support, Admissions
Marjie—Student Affairs, Retention programs, Financial Aid
Objectives
Identify factors that affect college graduationoGoal is to increase college graduation
Provide a longitudinal perspective of college graduation (trajectory)
Determine key points to strategically intervene to increase chances of graduation
Share data from one case study of a small, rural university
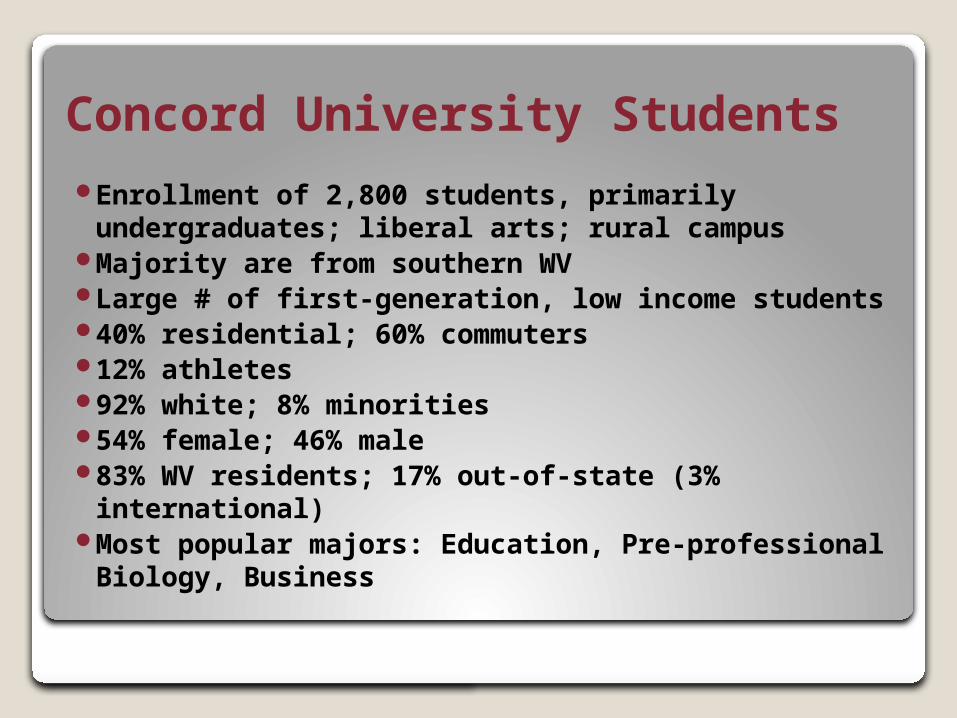
Concord University Students Enrollment of 2,800 students, primarily
undergraduates; liberal arts; rural campus Majority are from southern WV Large # of first-generation, low income students 40% residential; 60% commuters 12% athletes 92% white; 8% minorities 54% female; 46% male 83% WV residents; 17% out-of-state (3%
international) Most popular majors: Education, Pre-professional
Biology, Business
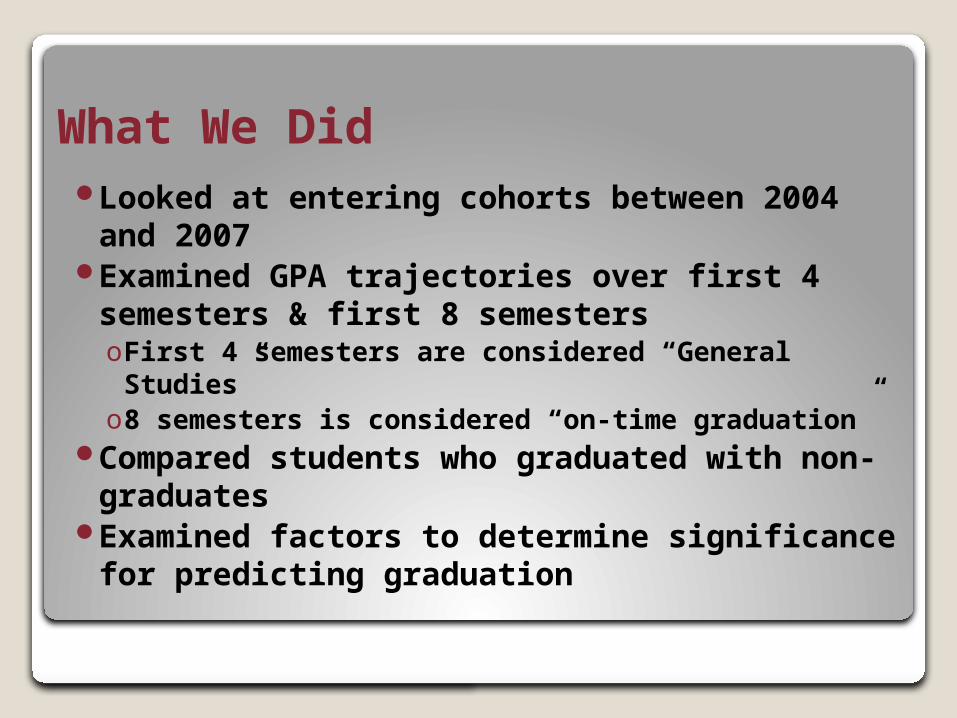
What We DidLooked at entering cohorts between 2004
and 2007Examined GPA trajectories over first 4
semesters & first 8 semestersoFirst 4 semesters are considered “General
Studies”o8 semesters is considered “on-time graduation”
Compared students who graduated with non-graduates
Examined factors to determine significance for predicting graduation
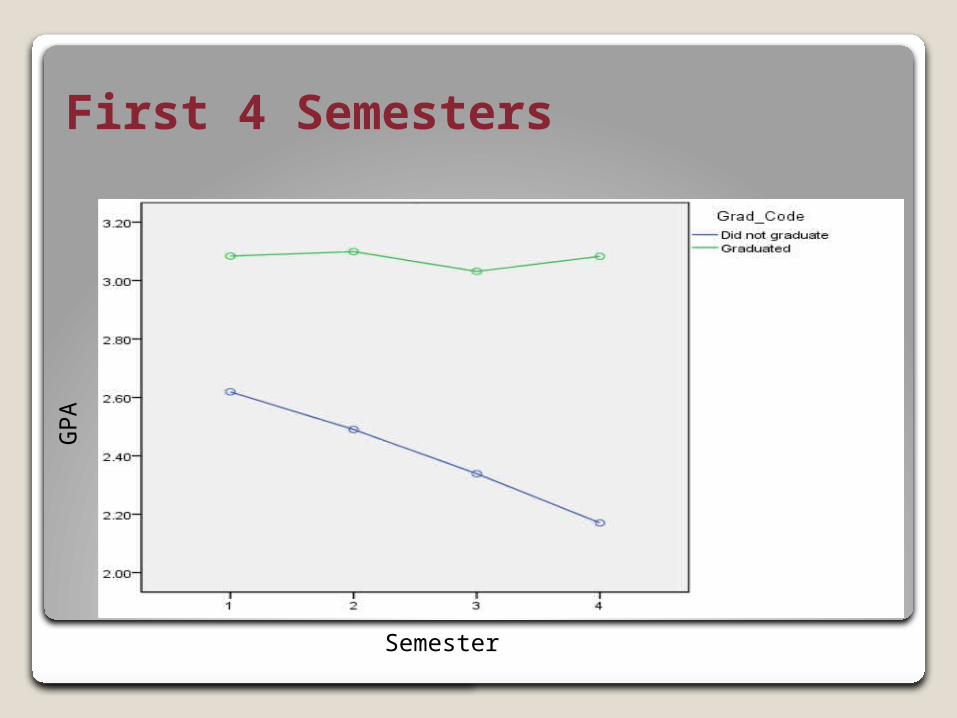
First 4 SemestersGPA
Semester
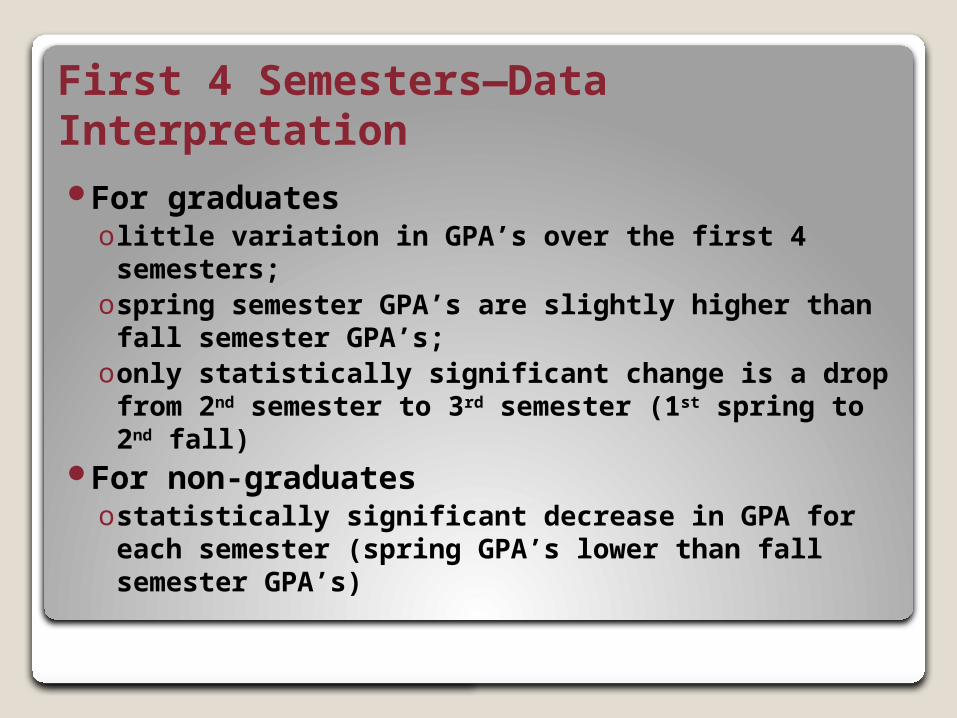
First 4 Semesters—Data InterpretationFor graduates
o little variation in GPA’s over the first 4 semesters;
ospring semester GPA’s are slightly higher than fall semester GPA’s;
oonly statistically significant change is a drop from 2nd semester to 3rd semester (1st spring to 2nd fall)
For non-graduatesostatistically significant decrease in GPA for
each semester (spring GPA’s lower than fall semester GPA’s)
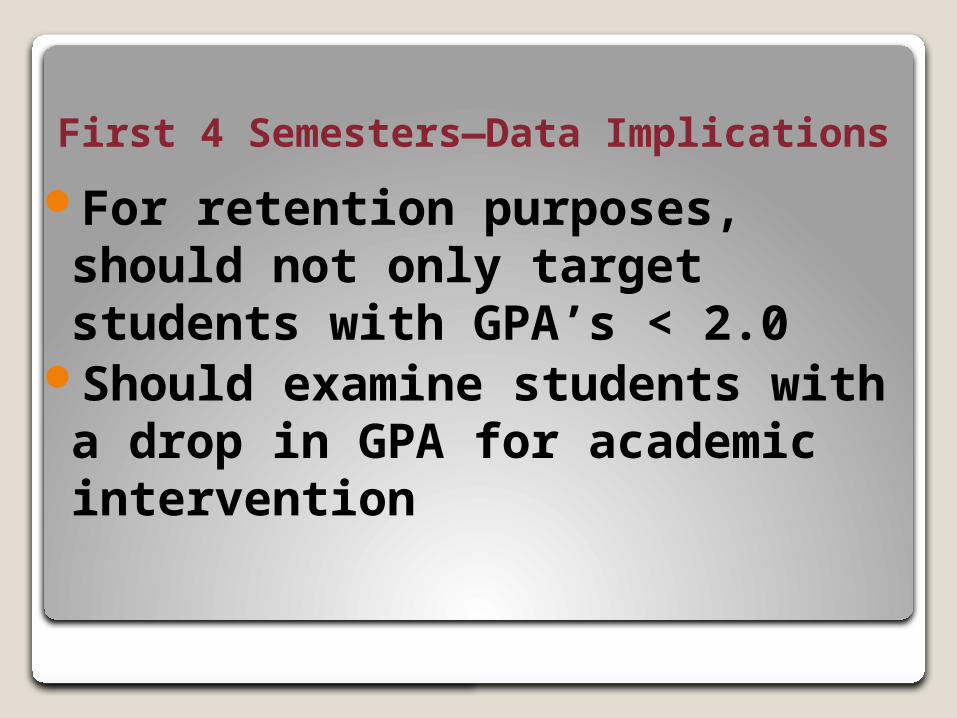
First 4 Semesters—Data Implications
For retention purposes, should not only target students with GPA’s < 2.0
Should examine students with a drop in GPA for academic intervention
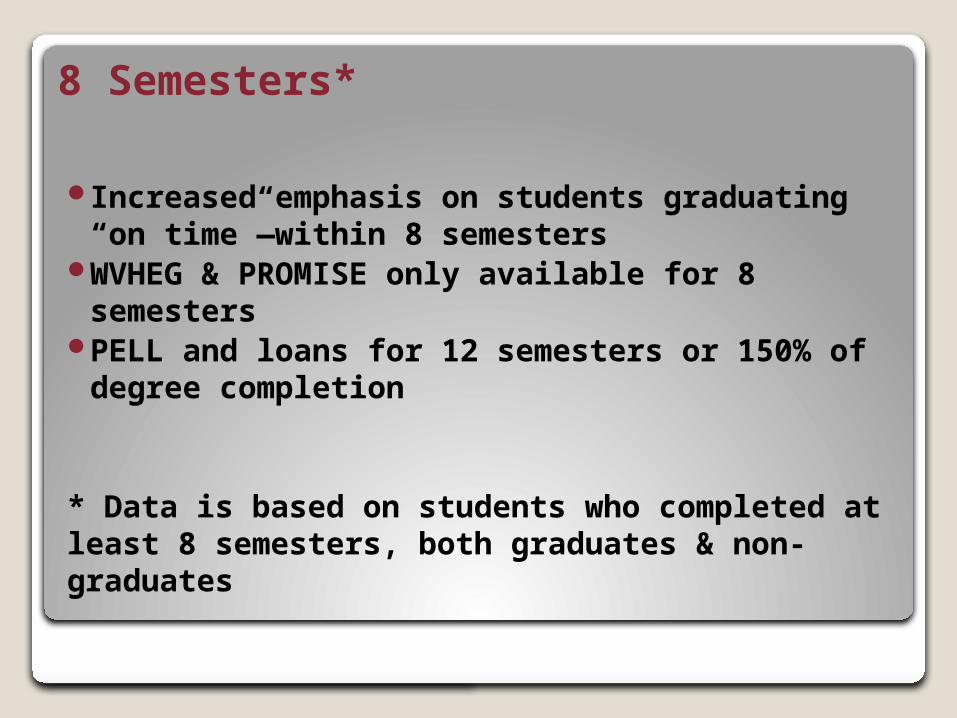
8 Semesters*
Increased emphasis on students graduating “on time”—within 8 semesters
WVHEG & PROMISE only available for 8 semesters
PELL and loans for 12 semesters or 150% of degree completion
* Data is based on students who completed at least 8 semesters, both graduates & non-graduates
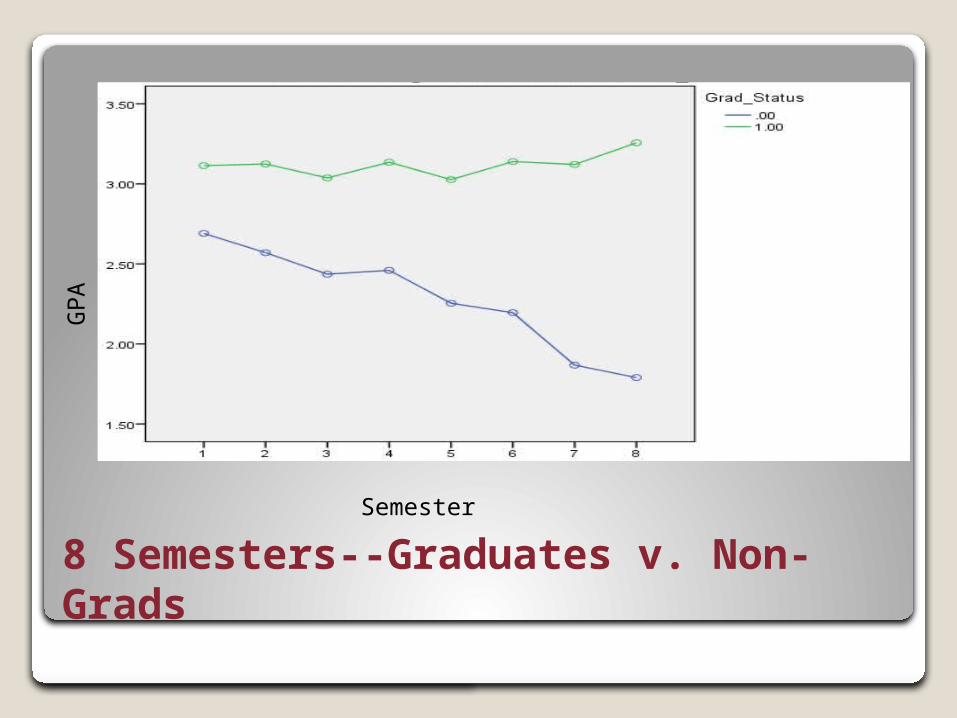
8 Semesters--Graduates v. Non-Grads
GPA
Semester
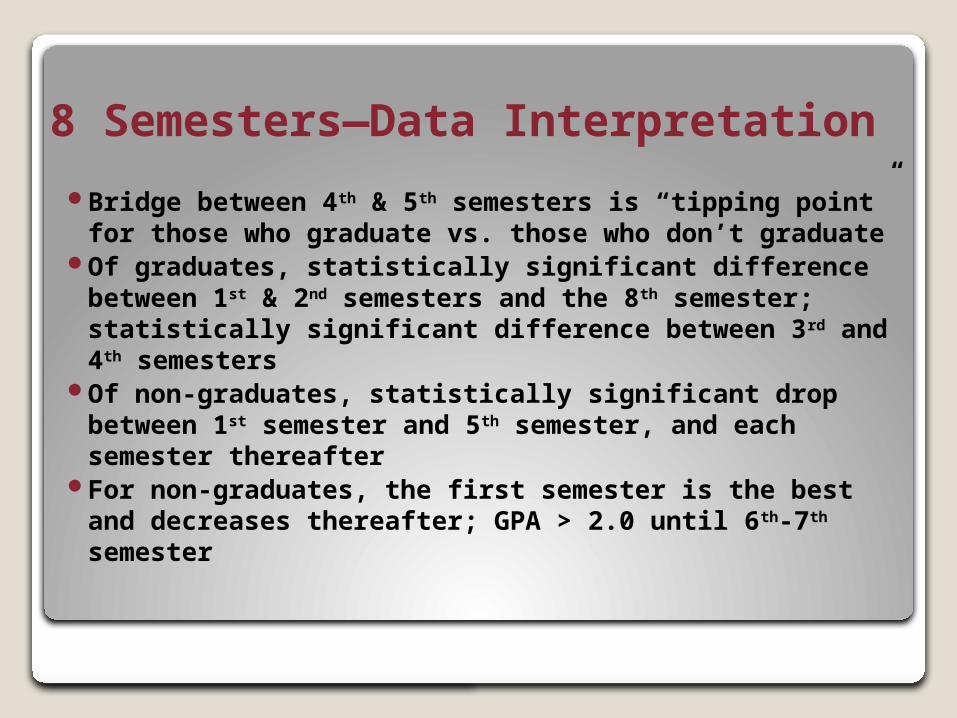
8 Semesters—Data Interpretation
Bridge between 4th & 5th semesters is “tipping point” for those who graduate vs. those who don’t graduate
Of graduates, statistically significant difference between 1st & 2nd semesters and the 8th semester; statistically significant difference between 3rd and 4th semesters
Of non-graduates, statistically significant drop between 1st semester and 5th semester, and each semester thereafter
For non-graduates, the first semester is the best and decreases thereafter; GPA > 2.0 until 6th-7th semester
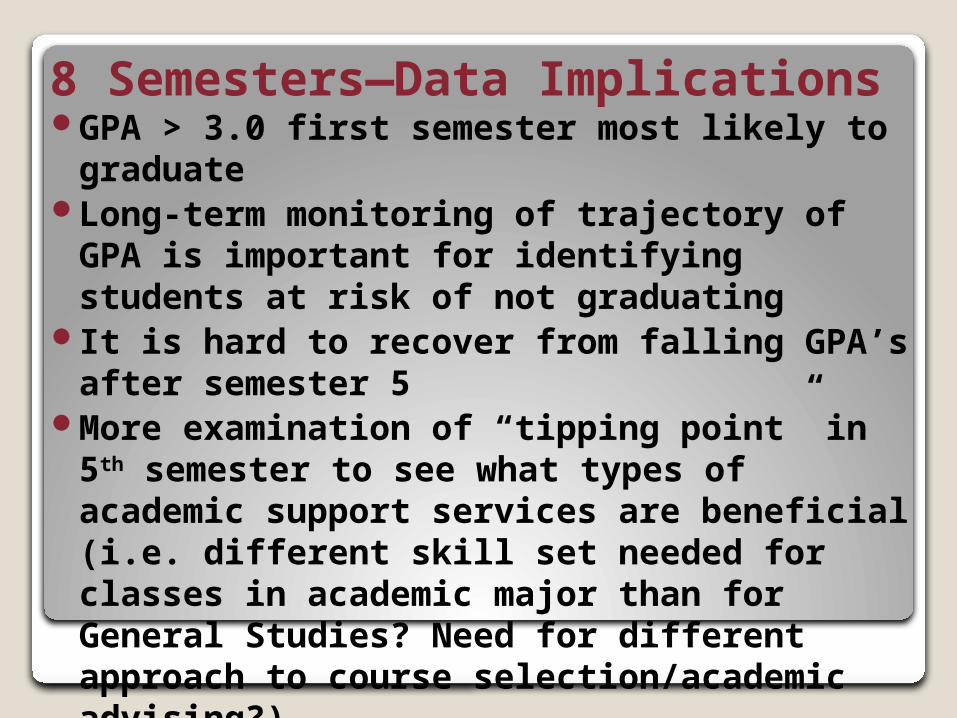
8 Semesters—Data ImplicationsGPA > 3.0 first semester most likely to
graduateLong-term monitoring of trajectory of GPA
is important for identifying students at risk of not graduating
It is hard to recover from falling GPA’s after semester 5
More examination of “tipping point” in 5th semester to see what types of academic support services are beneficial (i.e. different skill set needed for classes in academic major than for General Studies? Need for different approach to course selection/academic advising?)
First Semester GPA Predictive Model
ACT ScoreHigh School GPA
(Linear regression analysis)
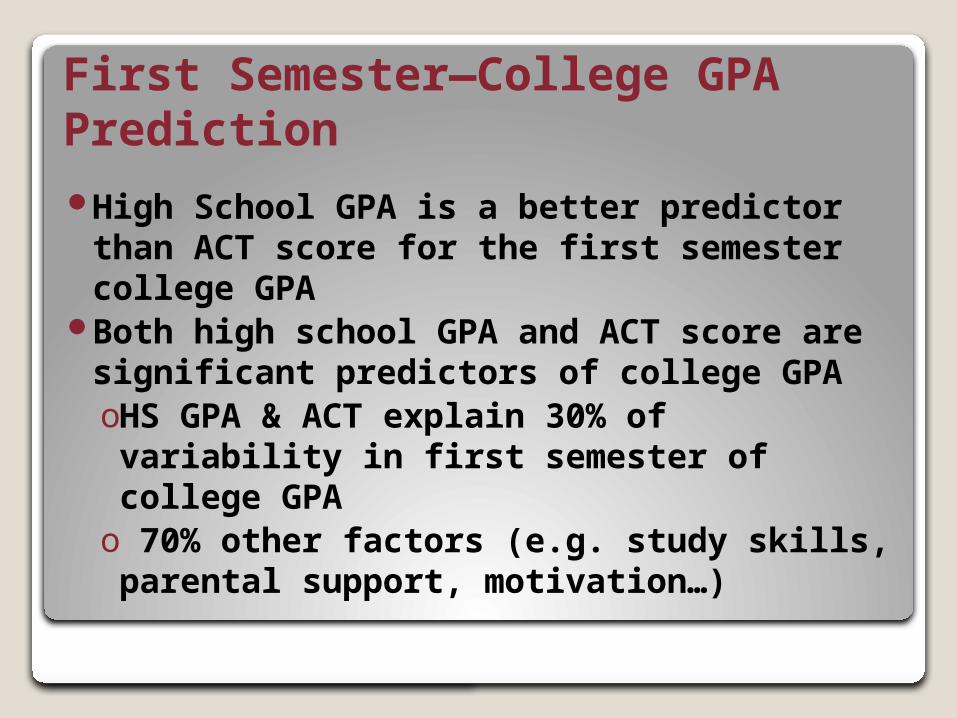
First Semester—College GPA PredictionHigh School GPA is a better predictor
than ACT score for the first semester college GPA
Both high school GPA and ACT score are significant predictors of college GPAoHS GPA & ACT explain 30% of variability in first semester of college GPAo 70% other factors (e.g. study skills, parental support, motivation…)
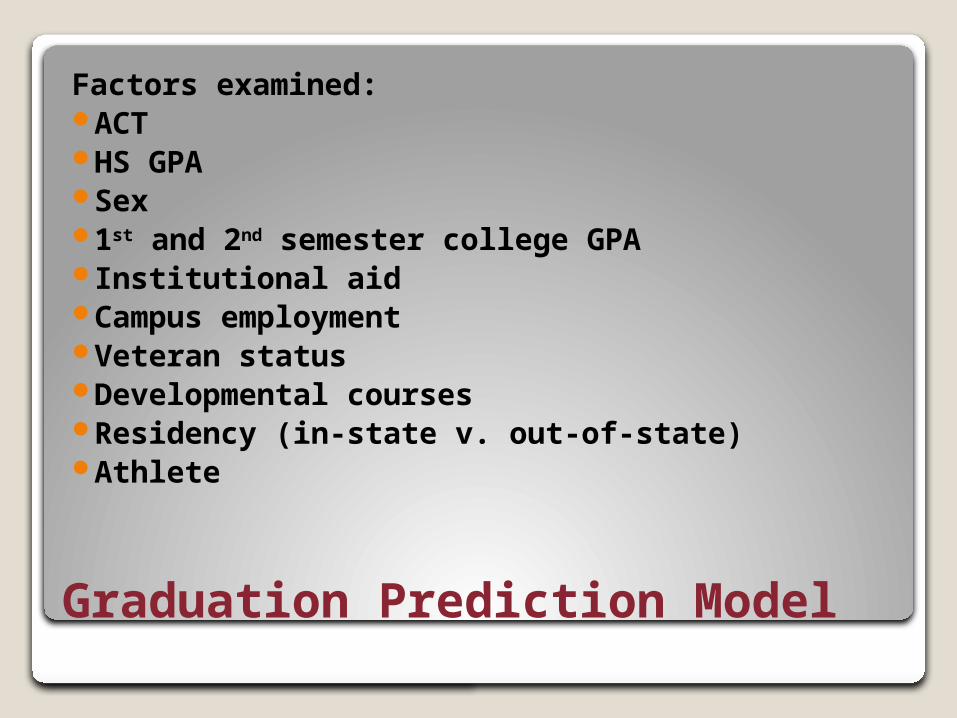
Graduation Prediction Model
Factors examined:ACTHS GPASex1st and 2nd semester college GPAInstitutional aidCampus employmentVeteran statusDevelopmental coursesResidency (in-state v. out-of-state)Athlete
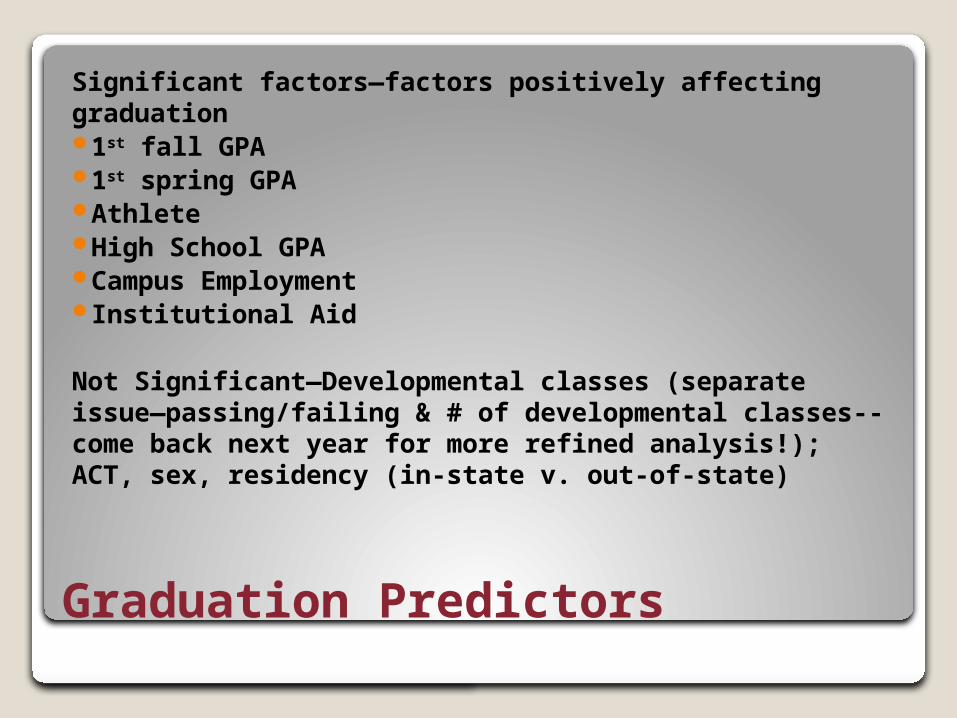
Graduation Predictors
Significant factors—factors positively affecting graduation 1st fall GPA 1st spring GPA Athlete High School GPA Campus Employment Institutional Aid
Not Significant—Developmental classes (separate issue—passing/failing & # of developmental classes--come back next year for more refined analysis!); ACT, sex, residency (in-state v. out-of-state)
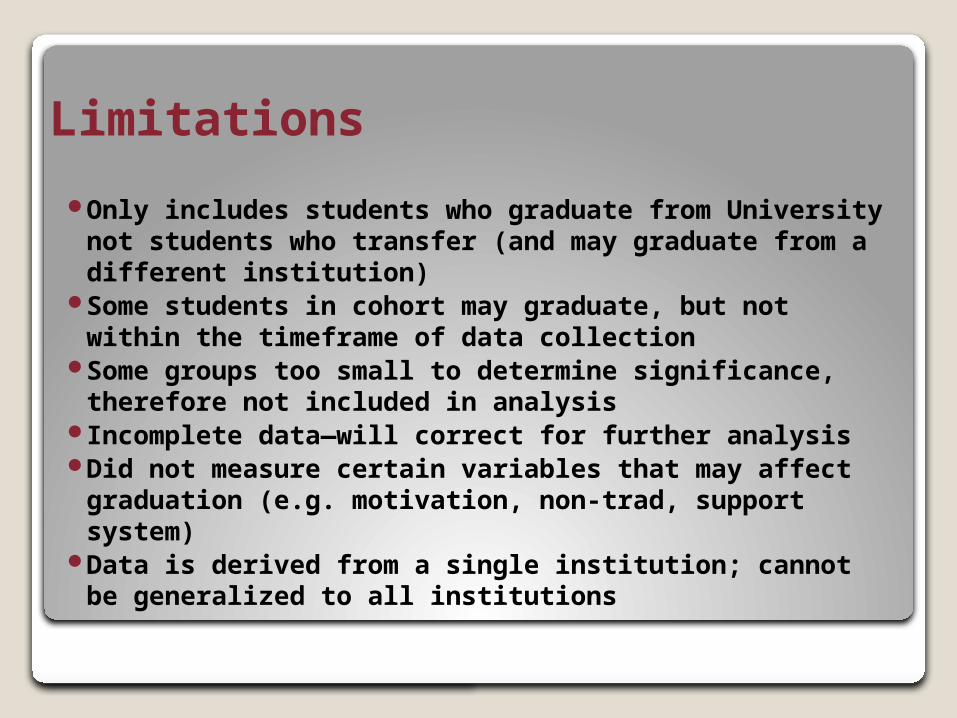
Limitations
Only includes students who graduate from University not students who transfer (and may graduate from a different institution)
Some students in cohort may graduate, but not within the timeframe of data collection
Some groups too small to determine significance, therefore not included in analysis
Incomplete data—will correct for further analysis Did not measure certain variables that may affect
graduation (e.g. motivation, non-trad, support system)
Data is derived from a single institution; cannot be generalized to all institutions
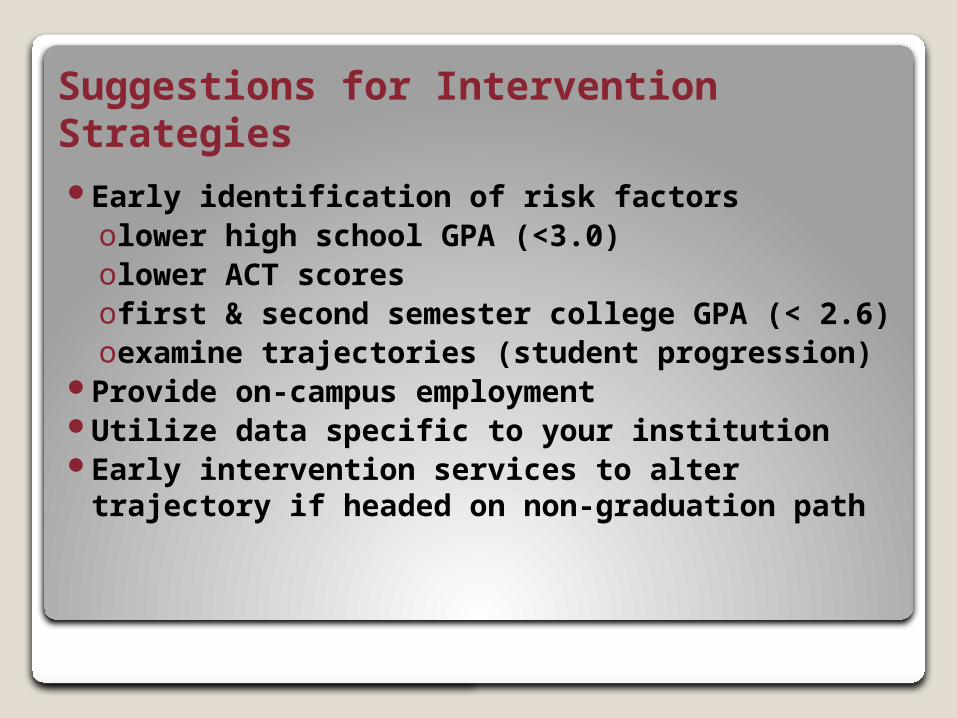
Suggestions for Intervention StrategiesEarly identification of risk factors olower high school GPA (<3.0)olower ACT scores ofirst & second semester college GPA (< 2.6)oexamine trajectories (student progression)
Provide on-campus employmentUtilize data specific to your institutionEarly intervention services to alter trajectory
if headed on non-graduation path
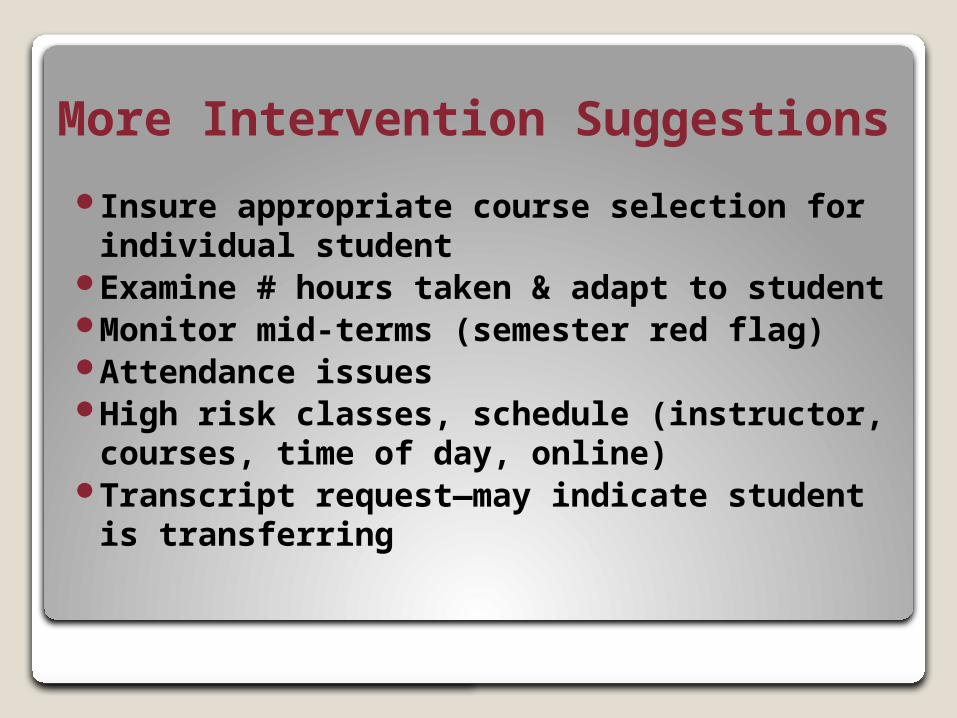
More Intervention Suggestions
Insure appropriate course selection for individual student
Examine # hours taken & adapt to student
Monitor mid-terms (semester red flag)Attendance issuesHigh risk classes, schedule (instructor,
courses, time of day, online)Transcript request—may indicate
student is transferring
Future Investigation
Developmental Courses (effect on graduation of passing course on first attempt; grade in class; # of developmental courses required)
Veteran statusAcademic majorTypes & Amount of Institutional Aid Traditional versus non-traditionalOn campus versus commuter

Thanks for your attention & participation!!
Questions???