colludingagainstworkers: evidencefrombelgium,1845-1913
TRANSCRIPT
Colluding Against Workers:Evidence from Belgium, 1845-1913
Vincent Delabastita∗
KU Leuven
Michael Rubens†
KU Leuven
November 30, 2021
Job market paper - Vincent Delabastita(Latest version here)
AbstractDespite prominent examples of anti-competitive practices by employers, collu-sion has received limited attention in research on the sources of labor marketpower. We study collusive wage-setting behavior by 227 coal firms in Belgiumfrom 1845-1913, a setting in which collusive wage-setting was legally tolerated,whereas worker collusion was forbidden. We propose an empirical framework toidentify collusion in labor markets using production, cost, and wage data. Wefind evidence for substantial collusion against workers, which is consistent withanecdotal evidence. Collusion was stable throughout Belgium’s Industrial Rev-olution from 1845 to 1900, but increased sharply after the turn of the century.This surge in collusion coincided with the emergence of coal cartels.
JEL classification codes: L40, J42, N33
Keywords: Collusion, Conduct, Industrial Revolution, Oligopsony
∗Email: [email protected]†Email: [email protected]
Acknowledgements: We thank Frans Buelens, Erik Buyst, Jan De Loecker, Marc Deloof, MohamedSaleh, Jo Van Biesebroeck, Gertjan Verdickt, Hillary Vipond and Patrick Wallis for helpful commentsand suggestions. Vincent Delabastita and Michael Rubens both benefited from a PhD Fellowship(Aspirant) of the Research Foundation - Flanders (FWO), grant numbers 11F8619N and 11A4618Nrespectively. We are grateful to Filip Strubbe from the Belgian National Archives for help withthe data sources. The paper also benefited from feedback by seminar participants at CambridgeUniversity, KU Leuven and LSE.
1 Introduction
There are growing concerns about the increasing levels of labor market power held
by firms.1 A key open question is whether such wage-setting power is the result of
collusion between employers on the labor market, or derives from other sources of
labor market power, such as labor market frictions, concentration, or employer dif-
ferentiation.2 Several high-profile cases against high-tech firms, fast-food chains and
oil companies over the past decade suggest that anti-competitive practices, such as
anti-poaching and wage-fixing agreements, prevail in labor markets today (Krueger &
Ashenfelter, 2018, Naidu, Posner, & Weyl, 2018, 597-598). Moreover, there is ample
anecdotal evidence of employer collusion against workers throughout economic history,
through labor market institutions such as guilds and employers’ associations. Despite
this evidence, collusive wage-setting behavior by employers is mostly absent from cur-
rent empirical research on oligopsony power.3 Being able to identify the sources of
‘monopsony’ or ‘oligopsony’ power on labor markets is crucial when designing policies
to constrain such market power.4 For instance, antitrust policy against collusive prac-
tices has a key role in addressing oligopsony power if it is due to employer collusion,
but not if it arises from firms exploiting labor market frictions.
In this paper, we propose a novel empirical approach to detect and quantify
employer collusion in labor markets by using firm-level production, cost, and wage
data. We apply this method to study the level, evolution, and drivers of wage collu-
sion amongst 227 Belgian coal firms between 1845 and 1913. These 69 years of data
cover most of the industrialization of Belgium, the first country on the Continent to
participate in the Industrial Revolution. A common problem when empirically study-
ing collusion in current-day settings, is that it is illegal in most countries, and hence
hard to observe. Our approach, which builds on methods from empirical industrial
organization, has the benefit that it does not require observing collusive behavior or
1See, for instance, Krueger (2018) and surveys in Manning (2021) and Sokolova and Sorensen (2021).2Recent examples include Caldwell and Harmon (2019) for oligopsony power due to search frictions,
Card, Cardoso, Heining, and Kline (2018) for heterogeneous worker tastes over firm-specific(dis)amenities, and Schubert, Stansbury, and Taska (2021) for labor market concentration.
3In his well-known literature review, Manning (2011, 979) already considered the potential role ofcollusion on labor markets an “open question”. We find that little has changed since then.
4For the remainder of the paper, we use the terms ‘oligopsony’ rather than ‘monopsony’, becauseactual monopsonies are scarce.
1
structures such as cartels. Moreover, given that collusion between firms on both labor
and product markets was tolerated by the Belgian government during the 19th century,
we observe information on collusive wage-setting through employers’ associations, and
use it to validate our results.
The historical setting of Belgian coal mining offers an interesting context in which
to study employer collusion for three additional reasons. First, the archives of the
Belgian Administration des Mines provide us with a wealth of fine-grained production,
employment, and wage data at the firm level, covering an unusually long period that
includes a part of the first and the entire second Industrial Revolution.5 Furthermore,
we are able to enhance the data from these archives with a wide range of micro-level
sources on firm characteristics and worker commuting patterns. Our integrated data
set consequently gives us a unique view of how labor market power and collusion
evolves as countries industrialize and develop. Second, the coal industry has limited
scope for product differentiation, the dimensions of coal differentiation are observed,
and firms are ‘single-product’ firms. This facilitates the estimation of the model,
although our model can still be extended to settings with differentiated goods and
multi-product firms. In spite of this ‘special’ feature on the goods market side, we
argue that our findings on employer collusion during the Industrial Revolution have
some external validity beyond the coal mining industry. Belgian coal mines were
usually not geographically isolated in mining towns, but located within commuting
distance from large industrial cities.6 The local labor market conditions were therefore
very similar for both coal firms and manufacturing firms, and, if the former could
collude against their workers, there is reason to believe the latter may have done so
as well.7 Finally, the coal industry is interesting in its own right from a historical
perspective due to its size and central role in the Industrial Revolution (Fernihough
& O’Rourke, 2021). In the last two decades of the 19th century, coal mines employed
10% of industrial workers in Belgium, more than any other extractive or manufacturing
5The Administration, the official engineering institute tasked to supervise the state’s mining conces-sions, has its roots in the French period. Due to these roots, their close statistical, firm-levelmonitoring was an anomaly in Belgium’s prominent laissez-faire policy environment, and excep-tionally allows us to identify labor market conduct and its drivers in a setting where limitedinstitutional checks and balances were in place.
6This is very different from earlier historical studies on labor market power power of coal miningfirms, which typically focus on the US (for example, Boal, 1995).
7We have anecdotal information that this was the case in, for instance, the steel manufacturingindustry in Belgium.
2
industry (Buyst, forthcoming).
The key empirical challenge when studying collusive behavior by firms, be it on
product or factor markets, is that both marginal costs of production and competitive
conduct are unobserved. The usual approach to studying collusion in empirical in-
dustrial organization is to rely on rotations of the goods demand curve (Bresnahan,
1987). We follow a different approach that relies on combining a model of production
to infer marginal costs, as in De Loecker and Warzynski (2012), with a model of labor
supply in the tradition of Berry (1994) and Card et al. (2018).8 Our identification
strategy follows two steps. First, we identify the wage markdown, the wedge between
worker wages and their marginal product, by estimating the coal mining production
function and comparing first order cost-minimization conditions between labor and
intermediate inputs from the production-cost approach, as in Morlacco (2017).9 This
allows us to separately identify the product price markup, the wedge between marginal
costs and the prices of goods, from the wage markdown under any model of competi-
tive conduct. Second, we need to know how much of this markdown wedge is due to
collusion between firms, or to other sources of labor market power. We identify the
wage markdown under the assumption that there is no collusion between firms on the
labor market by using a discrete-choice model in the spirit of Berry (1994) for labor
supply, as in Card et al. (2018) and Azar, Berry, and Marinescu (2019). This labor
supply model, which can be estimated using data on wages, labor market shares, and
labor demand shifters, allows us to identify the optimal wage markdown in a counter-
factual world without employer collusion. Finally, comparing the ‘conduct-free’ and
‘non-collusive’ markdowns gives a measure for the degree of employer collusion in the
market. To document the empirical soundness of our approach, this paper validates
the estimates of employer collusion by making use of observable historical examples
and drivers of employer collusion.
A caveat to our approach is that the discrete choice models of labor supply assume
a friction-less labor market, and that firms only derive market power from either labor
8A similar approach was taken by De Loecker and Scott (2016) on the product market side, with-out explicitly focusing on collusion, but making a more general point on conduct identificationinstead.
9This requires the assumption that intermediate input markets are perfectly competitive. Otherapproaches that use the same normalization are Mertens (2020), and Brooks, Kaboski, Li, andQian (2021).
3

market concentration or firm differentiation and non-wage amenities. We argue that
this fits well within the context of the 19th century Belgian labor market. Historical
evidence suggests few institutional barriers to switching jobs, and we present a selection
of empirical tests to verify this. Our approach could also be extended to other settings
in which labor market frictions, such as hiring and firing costs or worker-side switching
costs, are of first-order importance. The non-collusive benchmark model to which the
‘conduct-free’ markdown is compared should then allow for labor market frictions.10
Our findings can be summarized as follows. First, we find evidence for a substan-
tial degree of employer collusion throughout the entire period of 1845-1913. Through-
out the 19th century, the wage markdown was around 50% higher in reality than it
would have been in the absence of collusion between employers, and this difference was
relatively stable. This is, at first sight, surprising: we study an unconcentrated labor
market with low labor market shares, frequent entry and exit, and a mobile labor force
(due to the well-developed Belgian railroad network), and would therefore anticipate
little scope for collusion. However, a majority of coal firm executives met on a weekly
basis to discuss wage-setting, in the meetings of so-called employers’ associations. We
find that wage collusion among the members of these associations was, indeed, around
20% higher compared to non-member firms. Furthermore, we find that wage collusion
was anti-cyclical, which is in line with collusion theory (Rotemberg & Saloner, 1986).
Second, we find evidence of a substantial increase in employer collusion starting around
1900: the markdown became more than twice as high than the non-collusive mark-
down. The timing of this spike in employer collusion coincided with the emergence of
coal cartels on the Belgian and European coal markets in the late 1890s, which fits
into the broader emergence of cartels across many industries during that time period.
Downstream cartels lead to reduced output, and hence also to reduced labor demand,
which reinforces collusive behavior on labor markets as well.
Our work connects to three broad strands of literature. First, we contribute to
a vast literature on imperfectly competitive labor markets. As surveyed in Manning
(2021), this literature is split into two traditions, depending on the source of wage-
setting power by firms. In equilibrium search models, in the tradition of Burdett and10See Manning (2021) for a general discussion. There exist discrete choice demand models with
switching costs, see Honka (2014) for an example and Farrell and Klemperer (2007) for a moregeneral discussion. Adding labor market frictions to the model would also require modifying theidentifying restrictions for the production function, markdowns, and markups.
4
Mortensen (1998), firms have some wage-setting power due to search frictions.11 On
the other hand, in differentiated firms models such as Card et al. (2018); Azar et
al. (2019); Lamadon, Mogstad, and Setzler (forthcoming); Berger, Herkenhoff, and
Mongey (2019), employers obtain some wage-setting power from the fact that they
are not perfect substitutes from the worker’s point of view. Both these bodies of
literatures assume, however, that firms set wages non-cooperatively. In contrast, we
allow for collusive wage-setting by employers and extend the latter class of models with
differentiated employers to allow for cooperative wage-setting, and quantify the degree
of employer collusion. Moreover, our results reveal that employers do take advantage
of a lack of institutional barriers to collusion, and this indicates that employer collusion
is a source of labor market power to be taken seriously.
Second, we build on a long history of studying collusion in the industrial organi-
zation literature. Most of the empirical literature on collusion follows a ‘demand-side’
approach in the tradition of Bresnahan (1987). As was mentioned earlier, the key
challenge faced by these models is that both marginal costs and conduct are usually
latent. Possible approaches are to identify shifts in collusion, rather than its level, as
in Ciliberto and Williams (2014), to rely on in-sample variation in ownership, as in
Miller and Weinberg (2017), or to find instruments that are orthogonal to affect only
marginal costs but not conduct, or vice-versa (C. Michel & Weiergraeber, 2018). If
one has production-cost data, however, a production model like in De Loecker and
Warzynski (2012) can be used to identify markups without making explicit conduct
assumptions. De Loecker and Scott (2016) compares the demand- and cost-side iden-
tification of markups for the beer industry, and suggests the combination of these
approaches to identify conduct. We follow up on this suggestion, but in the context
of wage collusion in oligopsony, rather than product price collusion in oligopoly.12
Another novelty of this paper is to examine the effects of product market cartels on
upstream collusion. We discuss the conditions under which collusion can differ between
input and output markets, and provide evidence of how goods market cartels affect
labor market competition, using observable information on coal cartels in Belgium.
Third, our results present new evidence on the economic history of employer11Examples include Postel-Vinay and Robin (2002) and Cahuc, Postel-Vinay, and Robin (2006),
among many others.12Rubens (2021) also combines a factor supply model with a production model, but for a different
purpose, recovering markups and markdowns in the presence of non-substitutable inputs.
5
collusion and anti-competitive labor market institutions. Various historical examples
of collusive behavior have emerged in the historical literature. For instance, medieval
economies were characterized by feudal landlords fighting in unison to keep labor costs
low: in 14th-century England, wage caps were imposed on nominal wages forming a de
facto cartel between feudal lords; it was only when labor scarcity kept increasing in the
wake of the Black Death that the ability to coordinate broke down (Jedwab, Johnson,
& Koyama, forthcoming).13 Also guilds, organizations that characterized craft and
mercantile activities in European economies for centuries, were prime culprits: in her
seminal overview, Ogilvie (2019, 190-191) finds that labor market manipulation was a
widespread practice, and documents more than hundred instances of guilds imposing
wage ceilings on its members. Moreover, domestic textile production, in which ‘putting
out’ activities remained an invaluable source of income for many until deep in the
19th century, was traditionally also characterized by collusion between textile firms
(Humphries & Schneider, 2019, 152).
Examples of collusion are not limited to pre-industrial forms of labor organiza-
tion. Throughout the 19th century, employers increasingly unionized in employers’
associations, in which employers sought to defend common commercial interests, con-
trol their labor force and counter emerging trade unions.14 A prominent example can
be found in British coal mining during the Victorian era, where multiple coal owners’
associations actively coordinated to fix wages (Church, 1986, 651-674). Finally and
relatedly, this tendency of coal firms to unionize translated into a surge of coal cartels
after the turn of the century across Continental Europe, providing opportunities for
collusion not only on the product market, but also on the labor market (for a concise
overview on European coal cartels, see Murray & Silvestre, 2020, 679-680). This trend
towards cartel formation can also be regarded in the context of concerns regarded
“bigness” in gilded-age United States, where cartels and collusive market behavior was
rife (Lamoreaux, 2019). Despite this large body of historical and anecdotal evidence
13Interestingly and relatedly, the case of feudalism is also a particular case of labor coercion. Similarto the case of employer collusion, the many historical examples of labor coercion have longhad only a limited impact on economics (Acemoglu & Wolitzky, 2011). Recently, a range ofhistorical empirical studies have proven coercion’s prevalence in industrial labor markets (Naidu& Yuchtman, 2013) as well as its long-run effects (Dell, 2010).
14Empirical research on the role of employers’ organizations is scarce, however. Exceptions with ahitorical focus can be found in Yarmie (1980) for the UK and Vanthemsche (1995) for Belgium.A current-day analysis of employer unions is done by Martins (2020), who studies how firmperformance measures differ between members of such unions and other firms.
6
of the importance of employer collusion, there is little quantitative evidence for the
level and evolution of this employer collusion throughout the Industrial Revolution,
which is where this paper contributes.15
The remainder of this paper is structured as follows. Section 2 introduces a
general model which proposes a new approach to quantifying the degree of collusion in
a market. It does so by combining a model of production with a model of factor supply
and/or goods demand. Section 3 discusses the historical setting of Belgian coal mining
during the 19th and early 20th century, and presents the data. In Section 4, we estimate
the degree of collusion between Belgian mining firms when setting miner wages using
the model from section 2. We also investigate correlations of employer collusion with
observable information on employer associations and business cycle fluctuations, to
validate our collusion estimates. Finally, in Section 5, we assess the effects of the
spread of coal market cartels around 1900 on employer collusion, and investigate the
interaction between upstream and downstream collusion. Finally, Section 6 concludes.
2 Identifying conduct with production and cost data
2.1 Intuition
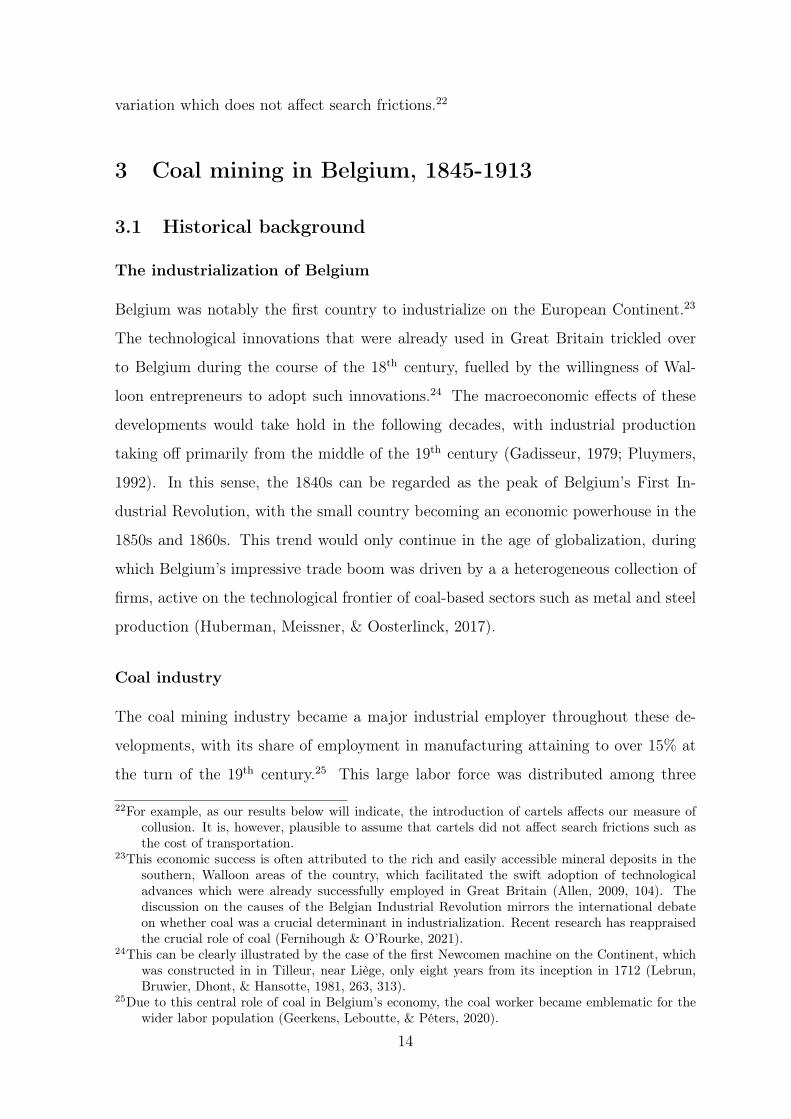
Figure 1 illustrates the key empirical challenge addressed in this paper. Consider a
firm that faces an upward-sloping labor supply curve. For expositional purposes only,
assume that the goods market is perfectly competitive.16 The firm sets the profit-
maximizing wage W ∗ at a markdown µ∗ below the marginal product of labor, which is
equal to the marginal labor cost MC∗. If we were able to observe this marginal cost,
we could then calculate the wage markdown by comparing marginal costs to wages.
However, marginal costs are latent and must be inferred using a model of firm behavior
and the firms’ input suppliers.
The marginal cost curve will differ depending on whether there is collusion or not.
Suppose there is collusion between firms, meaning that firms internalize some of the
15Whereas collusion between employers was usually legal, there were legal restrictions on striking andunionization. Naidu and Yuchtman (2018) present evidence of substantial firm-specific rents in19th-century US labor markets, facilitated by legal restrictions on striking efficacy.
16Our identification strategy will allow for imperfect competition on both factor and goods markets.Figure F.1 extends to a setting with imperfect factor and goods markets.
7
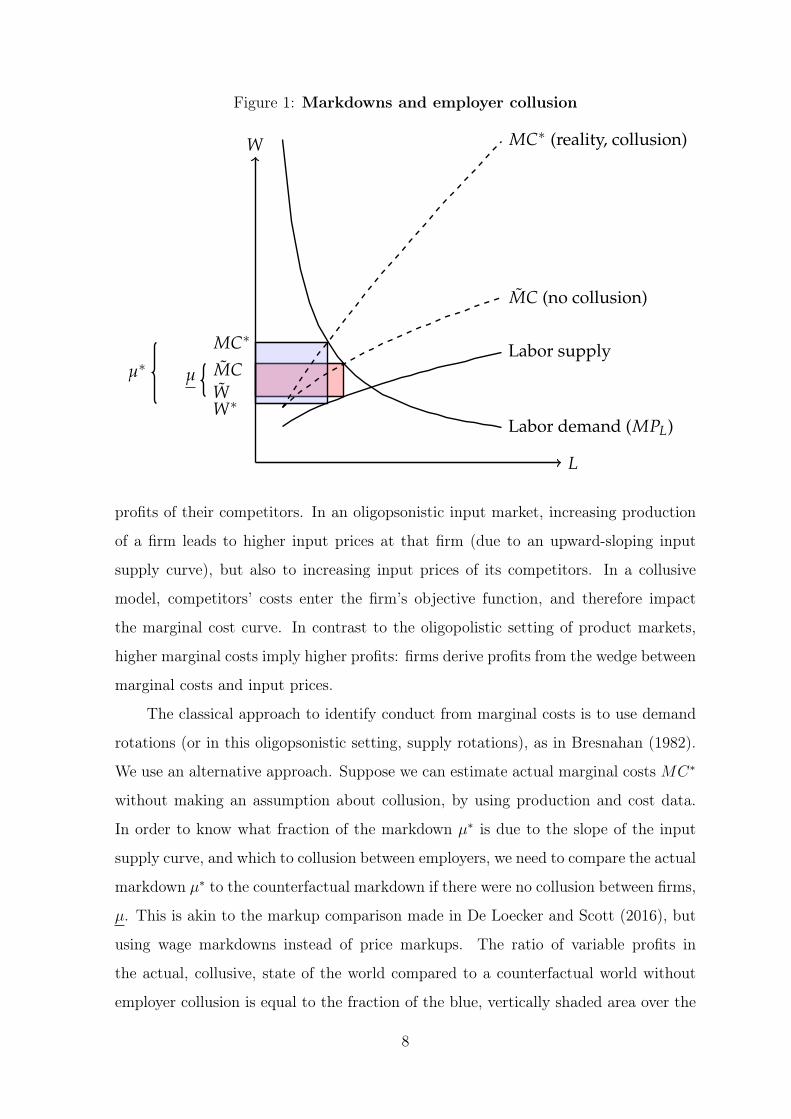
Figure 1: Markdowns and employer collusion
MC∗
M̃CW̃W∗
M̃C (no collusion)
MC∗ (reality, collusion)
Labor demand (MPL)
Labor supply
L
W
µµ∗
profits of their competitors. In an oligopsonistic input market, increasing production
of a firm leads to higher input prices at that firm (due to an upward-sloping input
supply curve), but also to increasing input prices of its competitors. In a collusive
model, competitors’ costs enter the firm’s objective function, and therefore impact
the marginal cost curve. In contrast to the oligopolistic setting of product markets,
higher marginal costs imply higher profits: firms derive profits from the wedge between
marginal costs and input prices.
The classical approach to identify conduct from marginal costs is to use demand
rotations (or in this oligopsonistic setting, supply rotations), as in Bresnahan (1982).
We use an alternative approach. Suppose we can estimate actual marginal costs MC∗
without making an assumption about collusion, by using production and cost data.
In order to know what fraction of the markdown µ∗ is due to the slope of the input
supply curve, and which to collusion between employers, we need to compare the actual
markdown µ∗ to the counterfactual markdown if there were no collusion between firms,
µ. This is akin to the markup comparison made in De Loecker and Scott (2016), but
using wage markdowns instead of price markups. The ratio of variable profits in
the actual, collusive, state of the world compared to a counterfactual world without
employer collusion is equal to the fraction of the blue, vertically shaded area over the
8
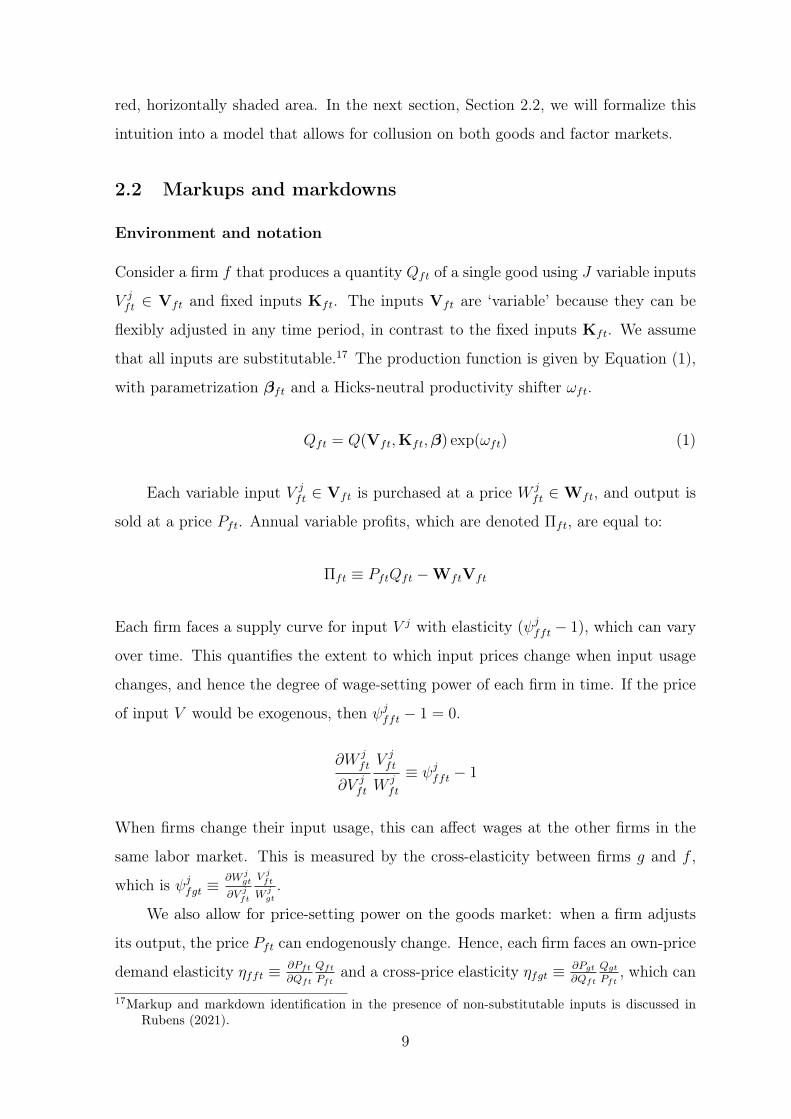
red, horizontally shaded area. In the next section, Section 2.2, we will formalize this
intuition into a model that allows for collusion on both goods and factor markets.
2.2 Markups and markdowns
Environment and notation
Consider a firm f that produces a quantity Qft of a single good using J variable inputs
V jft ∈ Vft and fixed inputs Kft. The inputs Vft are ‘variable’ because they can be
flexibly adjusted in any time period, in contrast to the fixed inputs Kft. We assume
that all inputs are substitutable.17 The production function is given by Equation (1),
with parametrization βft and a Hicks-neutral productivity shifter ωft.
Qft = Q(Vft,Kft,β) exp(ωft) (1)
Each variable input V jft ∈ Vft is purchased at a price W j
ft ∈Wft, and output is
sold at a price Pft. Annual variable profits, which are denoted Πft, are equal to:
Πft ≡ PftQft −WftVft
Each firm faces a supply curve for input V j with elasticity (ψjfft − 1), which can vary
over time. This quantifies the extent to which input prices change when input usage
changes, and hence the degree of wage-setting power of each firm in time. If the price
of input V would be exogenous, then ψjfft − 1 = 0.
∂W jft
∂V jft
V jft
W jft
≡ ψjfft − 1
When firms change their input usage, this can affect wages at the other firms in the
same labor market. This is measured by the cross-elasticity between firms g and f ,
which is ψjfgt ≡
∂W jgt
∂V jft
V jft
W jgt
.
We also allow for price-setting power on the goods market: when a firm adjusts
its output, the price Pft can endogenously change. Hence, each firm faces an own-price
demand elasticity ηfft ≡ ∂Pft
∂Qft
Qft
Pftand a cross-price elasticity ηfgt ≡ ∂Pgt
∂Qft
Qgt
Pft, which can
17Markup and markdown identification in the presence of non-substitutable inputs is discussed inRubens (2021).
9
both be zero if product prices are exogenous to each individual firm.
Behavior
Each market contains a set of firms Ft. The firm’s objective function is given by
Equation (2): a firm f assigns weights γfgt to the sales of each competitor g ∈ Ft\{f},and weights λfgt to the costs of each competitor, with 0 < γfgt < 1 and 0 < λfgt <
1. If firms f and g are perfectly colluding on factor markets (when choosing input
quantities that minimize joint costs), then λfgt = 1, if they do not cooperate then
λfgt = 0. Similarly, γfgt = 1 implies perfect collusion downstream (cooperatively
choosing output to maximize joint profits), and γfgt = 0 no collusion downstream.
maxVft
(Πft +
∑g∈Ft\{f}
[γfgtPgtQgt − λfgt(WgtVgt)
])(2)
The usual model assumes that firms place a weight on the entire profits of their com-
petitors, meaning that λfgt = γfgt. However, we allow for different weights on the sales
and costs of the competitors to allow for a different degree of firm collusion on factor
and product markets. Different levels of collusion downstream and upstream becomes
possible as soon as there is more than one input, where least one input is being traded
in a competitive market. Firms can, for instance, collude downstream by jointly low-
ering output without lowering labor, by substituting from intermediate inputs towards
labor. This way, they can collude downstream, but still compete against each other in
factor markets. If there is only one input, or if inputs are non-substitutable, output
cannot be changed without changing each input, and then there must be an equal
degree of collusion upstream and downstream: λfgt = γfgt.
Markup and markdown expressions
The output elasticity of a variable input j is denoted θjft ≡∂Qft
∂V jft
V jft
Qft. Deriving the
first order condition for labor and materials from Equation (2) results in the following
system of J equations, one for every variable input j:
∑e∈Ft
λfgtψfgtW j
gVjg
W jf V
jf
+ 1∑g∈Ft
γfgtηfgtPgQg
PfQf+ 1
=θjft
W jftV
jft
PftQft
(3a)
10

Assume there exists at least one variable input j∗ for which all firms are price-
takers on the input market, meaning that ψj∗
fg = 0 ∀f, g. Writing Equation (3a) for
that input gives the expression for the price markup µqft, Equation (3b). This is the
degree to which the goods price exceeds its marginal cost, with the right-hand side
being equal to the expression from De Loecker and Warzynski (2012).
µqft ≡ (
∑e∈Ft
γfgtηfgtPgtQgt
PftQft
+ 1)−1 =θj
∗
ft
W j∗ft V
j∗ft
PftQft
(3b)
Substituting (3b) into (3a) gives Equation (4), which expresses the input price
markdown µjft.
18 The right-hand side is the input price markdown, which is identified
by comparing the relative wedges between the marginal products of the variable input
and its price to the wedge between marginal product and price of the input that for
which the firm is a price-taker:
µjft ≡
∑c∈Ft
λfgtψfgt
W jgtV
jgt
W jftV
jft
+ 1 =θjftW
j∗
ft Vj∗
ft
θj∗
ftWjftV
jft
(4)
2.3 Employer collusion
Factor market collusion
The right hand-side of Equation (4) is identified if the production function coefficients
are identified. In order to know the left-hand side, we need to know (i) the own- and
cross-input price elasticities ψfgt for all firms, and (ii) the collusion weights matrix
Λt. The former can be obtained by using labor supply estimation. For the latter,
we can make assumptions regarding the level of collusion, allowing us to calculate
Equation (4).
Consider the case in which firms do not collude on their input markets, meaning
that Λft is the identity matrix: λfgt = 0 if f 6= g, and λfft = 1 ∀f . The left-hand
side of Equation (4) then simplifies to ψjfft: the markdown of input j is equal to its
input supply elasticity: µjft = ψj
fft. This is a lower bound to the markdown, and we
denote this lower bound as µjft = ψj
fft.
The markdown µjft, which can be calculated using the right-hand side of Equa-
18The same normalization was used in Morlacco (2017), in a non-collusive setting.
11
tion (4) will lie somewhere above the non-collusive lower bound µjft. We express the
degree of collusion exerted by firm f as the ratio between the actual level of markdown
and this lower-bound estimate: µjft/µ
jft.
Collusion downstream
The entire discussion until now abstracted from collusion downstream: we do not need
to know the demand parameters ηfgt or the degree of collusion downstream Γft in order
to quantify collusion in input markets, because all the expressions are normalized with
respect to the goods price markup µqft. If we knew the demand parameters ηfgt, we
could also quantify the degree of collusion downstream, and test whether there is a
different degree of collusion in goods and factor markets. We could also test other
conduct assumptions by comparing the cost-side and input supply-model markdowns,
such as whether firms are differentiated or whether firms set wages simultaneously or
consecutively.
2.4 Caveats
There are three important caveats to the analysis above: technological change, em-
ployee labor market power, and frictions. As we will argue here, however, the historical
setting of our empirical analysis alleviates these concerns.
Labor-saving technological change
First, in order to correctly identify markups and markdowns, it is crucial to identify
all heterogeneity in the output elasticity θft across firms and over time.19. This is
especially true for markdowns: any latent variation in θft not captured by the model
will show up as variation in markdowns, although it is in reality due to technological
differences between firms. We rely on detailed technology data to allow for, and test,
labor-saving technological change in our setting.
Employee market power
Second, the model assumes that input suppliers are price-takers because employees
were not allowed to unionize, whereas employer unions were tolerated. If workers had19See also Demirer (2020) who makes this point for markups
12
unionized, this would bring us to a bilateral oligopoly setting, and a bilateral oligopoly
model with centralized bargaining would have been better suited for the analysis.
Labor market frictions
Third, there could be labor market frictions, such as search frictions or switching costs
from the point of view of the workers. These are another reason why the actual mark-
down and the markdown from the frictionless differentiated firms model could differ.20
We argue, however, that such frictions are not a credible source of oligopsony power
in our setting. First, we regress our collusion estimate on observable shifters of search
and migration costs and worker switching costs, in the form of the mines’ connection
to railroad and tramway networks and the abolition of legal constraints on worker
mobility. We do not get results that are economically meaningful (for a discussion, see
Appendix C.1). This would not have been the case if labor market frictions had been
of first-order importance, because our collusion measure would have been correlated
with drivers of such frictions in that case. Second, the historical record indicates that
search frictions were quite limited in 19th-century Belgium. Labor contracts were of
an informal nature, and hiring and firing costs were nonexistent (Van den Eeckhout,
2005). Furthermore, Belgium’s expansive transport network meant that transport
costs were low, and that the average Belgian worker was mobile (Huberman, 2008).
More specific to our context, Belgian coal firms indeed experienced a high turnover of
personnel. Historical evidence shows that coal workers were highly mobile: on average,
more than half of the Liège-based coal workers changed workplace between 10 to 24
times within their career (Leboutte, 1988, 49).21
Finally, it is important to emphasize that, even if some frictions do exist (such as
moving costs for workers), this only affects the level of our collusion estimate. In other
words, we can still rely on our estimates to assess changes in collusion with respect to
20We leave the extension to allow for both frictions and employer collusion to future work.21This claim is based on the micro-level analysis of the so-called livrets of Liège-based coal workers.
Employees in the coal mining sector typically had to possess a livret, a sort of worker’s passport,to partake in insurance schemes regarding accidents and pension funds. Theoretically, thesecould be considered to be a source of labor market friction, as employers could withhold themfrom their workers. In practice, however, micro-evidence thus shows that this requirement didnot stop coal workers from being highly mobile among employers. Furthermore, legal changessuch as its general abolition in 1883 do not show as credible sources of variation in our collusionestimates. We refer to Appendix C.1 for more details.
13
variation which does not affect search frictions.22
3 Coal mining in Belgium, 1845-1913
3.1 Historical background
The industrialization of Belgium
Belgium was notably the first country to industrialize on the European Continent.23
The technological innovations that were already used in Great Britain trickled over
to Belgium during the course of the 18th century, fuelled by the willingness of Wal-
loon entrepreneurs to adopt such innovations.24 The macroeconomic effects of these
developments would take hold in the following decades, with industrial production
taking off primarily from the middle of the 19th century (Gadisseur, 1979; Pluymers,
1992). In this sense, the 1840s can be regarded as the peak of Belgium’s First In-
dustrial Revolution, with the small country becoming an economic powerhouse in the
1850s and 1860s. This trend would only continue in the age of globalization, during
which Belgium’s impressive trade boom was driven by a a heterogeneous collection of
firms, active on the technological frontier of coal-based sectors such as metal and steel
production (Huberman, Meissner, & Oosterlinck, 2017).
Coal industry
The coal mining industry became a major industrial employer throughout these de-
velopments, with its share of employment in manufacturing attaining to over 15% at
the turn of the 19th century.25 This large labor force was distributed among three
22For example, as our results below will indicate, the introduction of cartels affects our measure ofcollusion. It is, however, plausible to assume that cartels did not affect search frictions such asthe cost of transportation.
23This economic success is often attributed to the rich and easily accessible mineral deposits in thesouthern, Walloon areas of the country, which facilitated the swift adoption of technologicaladvances which were already successfully employed in Great Britain (Allen, 2009, 104). Thediscussion on the causes of the Belgian Industrial Revolution mirrors the international debateon whether coal was a crucial determinant in industrialization. Recent research has reappraisedthe crucial role of coal (Fernihough & O’Rourke, 2021).
24This can be clearly illustrated by the case of the first Newcomen machine on the Continent, whichwas constructed in in Tilleur, near Liège, only eight years from its inception in 1712 (Lebrun,Bruwier, Dhont, & Hansotte, 1981, 263, 313).
25Due to this central role of coal in Belgium’s economy, the coal worker became emblematic for thewider labor population (Geerkens, Leboutte, & Péters, 2020).
14
provinces in Belgium’s industrial belt, from east to west being Hainaut, Namur and
Liège.26 Coal mining in Hainaut - Belgium’s prime producer of coal - flourished around
Mons (the Borinage), due to its excellent canal connections to Flanders and France,
and Charleroi, where heavy industries based on English techniques would bolster size-
able demand, much like in Liège (Van der Wee, 1996, 68-69). Mines in Namur were
typically small-scale, familial enterprises, geared towards local markets.
In this paper, we focus on the coal mines in Liège and Namur: together these
provinces represented approximately 3 out of 10 coal workers in Belgium, and 20 to
25% of Belgian coal production throughout the 19th century.27 There were on average
60 coal firms per year in the Liège basin, and 19 in the Namur basin. The main
buyers of coal were households (22% of sales), steel mills (20%), railroads (13%), cokes
producers (10%) and non-ferrous metal manufacturers (10%), together accounting for
three quarters of sales (De Leener, 1908). An important change in the competitive
environment of the Liège-based coal industry happened on July 1, 1897, when 27
coal firms in Liège entered a cartel, the Syndicat de Charbonnages Liégeois. This
fitted within a broader trend of cartelization in Belgium across many industries.28 We
foreground the role of this cartel era in Section 5.
Production process
Extracting coal required, roughly speaking, three steps. First, the underground coal
seam had to be reached by digging a mine shaft. Second, the coal had to be ex-
tracted. This was done manually by the miners, (abatteurs), with a pickaxe, and there
was barely any mechanization of coal cutting in Belgium throughout our sample pe-
riod.29 Third, the lumps were hauled to the surface in containers or minecarts by
26See the map in Figure A7 in Appendix A. A distinction is typically made between the coal basins ofthe Borinage, Centre, Charleroi (all three in the province of Hainaut), Basse-Sambre (in Namur)and Liège.
27These employment shares are based on the industrial censuses of 1846 and 1896, allowing forcomparison through the adaptation by Delabastita and Goos (2021). Production shares are basedon Statistique de la Belgique (1858) and the Annales de Mines de Belgique (Administration desMines, 1896, 505).
28The number of official Belgian cartels increased sharply during the 1880s and 1890s (as shown inFigure A10 in Appendix A). These cartels were allowed, and incorporated as legal entities.
29Pneumatic coal cutting machines would only be implemented in Liège coal mining around 1908.At the 1905 world fair in Liège, organized to showcase the region’s industrial leadership, localindustrialists had to grudgingly admit that the introduction of mechanical cutting techniqueswas hampered by difficult geological conditions (Drèze, 1905, 816).
15
mules and laborers, hiercheurs, often young children and women.30 In contrast to the
cutting process, coal haulage was gradually mechanized throughout our sample pe-
riod, with the introduction of steam-powered underground mining locomotives, which
were introduced around 1812. Two other forms of mechanization were crucial and
increasingly adopted in the successful exploitation of Belgian coal mines throughout
the 19th century. First, ventilation was important, as Belgian mines - and those in
Liège in particular - were vulnerable to sudden releases of firedamp. This was done
using steam-powered ventilation fans from the 1870s onwards. Second, water had to be
pumped out of the mines, as many were located near rivers and other bodies of water.
Early mechanization efforts, with the invention of the Newcomen pump, focused on
this challenge. The increasing depth of Walloon mine pits required continued capital
investments in these three technology types, which were typically steam-powered, but
from 1893 onwards also electrically-powered (Gaier, 1988, 72).
There is some differentiation between the different types of coal being produced,
mainly depending on its percentage of volatile matter, which determines its usage.
Four coal types are distinguished in the data set, with volatile contents between 13-18%
(Houille maigre sans flamme, anthracite coal), 18-26% (Houille sèche courte flamme,
26-32% (Houille maigre longue flamme), and >32% (Houille grasse longue flamme).
The first type was mainly used by household for heating purposes. The second type was
used in steam engines. The latter two types were used mainly for railroad locomotives,
in combination with the other coal types. Mines often extracted a combination of these
coal types, depending on the geological conditions of the mine location.
Labor relations
Partly due to the high population density in Belgium, manufacturing and mining
firms could easily tap into a large reservoir of low-cost labor (Mokyr, 1976). Belgium
was indeed labeled as a low-wage country by contemporaries, despite its industrial
successes. Government intervention on labor markets remained all but nonexistent
throughout the 19th century, as politicians held true to the liberal, laissez-faire prin-
30An important innovation lied in the successful combination of interior rails and horse-drawn car-riages in the second decade of the 19th century (Gaier, 1988, 79). The tight nature of manyLiège mines made the introduction of equine power challenging, however, and experimentationwith new rail and mine cart systems would increase its applicability throughout the 19th century(Caulier-Mathy, 1971, 217-219).
16
ciples on which Belgium was founded in 1830. Moreover, suffrage was conditional
on wealth, with merely 1% of the population holding voting rights until 1893. This
pushed questions on topics such as worker rights and living conditions to the political
periphery.31 At the root of this governmental indifference, was an unbridled confidence
in the workings of the market mechanism.32
Labor relations in 19th-century Belgium were determined by laws that were put
in place under French rule in the beginning of said century, and generally appear
to have placed laborers in a unfavorable position33 through one distinct institutional
feature: the inability of laborers to make any collective demands regarding working
conditions.34 More specifically, labor coalitions were prohibited until 1866, when this
article was replaced by stark limitations on strikes.35 The purpose of this legislation
was to ensure freedom of labor, with proponents citing the need for an unbridled
mechanism of supply and demand. Large-scale labor movements consequently knew
little to no development for the larger part of the 19th century, or as Chlepner (1972,
27) aptly puts it: “it is not necessary to describe at length what does not exist”.36 Case
in point is the syndical activity of Belgian coal mine workers. In the social movements
of the 1880s and onward, coal mine workers were prominent participants, but they
31Indeed, international comparisons of legislation with regards to child labor, working time and factoryinspection, consistently rank 19th-century Belgium amongst least regulated countries in Europe(Huberman & Lewchuk, 2003).
32Illustrative of this spirit is the following quote by Minister of Public Works Alexandre Jamar, whosummarized the government’s position in 1869 as:
Let us say first of all that the intervention, in determining the wages, government orany other influence foreign to free competition of supply and demand, is a conceptionof which it is hardly need to point out the Utopian character. However painful be asituation created by the lowering of labor remuneration, we can only endure it. Nocoercive reaction is possible, however generous the principle may be. There is, in thatorder of ideas, nothing to try to modify the current state of things. (Ministère desTravaux Publics, 1869, xiii)
33The particular case of Belgium was perhaps most strikingly summarized by Karl Marx, who calledBelgium “the model state of continental constitutionalism, the snug, well-hedged, little paradiseof the landlord, the capitalist, and the priest” (1985, 47).
34Other than this feature and the aforementioned livret, most aspects of the labor relationship, such asworking time, safety measures and method of wage payment, were largely agreed upon informallyor orally (Van den Eeckhout, 2005).
35Strikes, the most important instrument of trade unions, remained illegal until 1921, when the articleof 24 May 1921 was installed to warrant freedom of coalition.
36The few Belgian trade unions which did form, were exclusive of nature and focused on limitinglabor supply in urban craft industries. Trade unions able to successfully mobilize large parts ofthe labor force would only arise in the last two decades of the century and only truly leave theirmark on economic policy in the 20th century (Vandaele, 2004, 270-271).
17
largely failed to materialize their demands.37 A reason for this can be found in the
lack of centralized syndical actions, as the Belgian federation is considered to have
been the “weak link in the international chain of mining syndicalism” (J. Michel, 1977,
467).38
In theory, this legislation also rendered collusion of employers illegal. However,
the original law articles stipulated for much harsher punishment for laborer collusion,
as well as included a vague and difficult-to-prove condition for employer collusion to be
“unjust” and “abusive” to be punishable (Stevens, 1998, 402). Accordingly, employer
syndicates did arise throughout the 19th century. Important in the case of Liège
coal mining is that several mines united in the form of the Union des charbonnages
Liégeois in 1840. We empirically examine the collusive role of this organization, as
well as present more historical evidence in Section 4.4.
Contemporary observations suggest that there were indeed rents in 19th-century
labor markets to be colluded over. In his 1844 work on the causes of poverty in Belgium,
journalist and government statistician Edouard Ducpétiaux devoted much attention
to roles of “ill-defined liberty”, labor relations between workers and industrialist - who
were in a “state of constant strike against each other” -, and the need for better
agreement between labor supply and demand (Ducpétiaux, 1844, 18-34).39. In 1846,
the chief engineer of the seventh mining district, Liège, took notice of coalitions from
both employees and, more often, employers to influence wage levels (Ministère de
l’Intérieur, 1846, 320). In Hainaut, managers of coal firms controlled by the universal
bank Société Générale de Belgique openly compared the wages paid at their respective
firms, and deviations from collusive wage levels were heavily frowned upon.40 This
37Indeed, the coal sector was by far the biggest social battleground in terms of numbers of strikesand employees involved at the turn of the 19th century. The share of successful strikes from theperspective of the labor force, however, was notably lower than the industry average, indicatinga strong position of the employer (see Figure A6 in Appendix A).
38This was especially the case in the Liège coal basin, where the scattered and heterogeneous natureof local mining companies hindered the formation of collective action (J. Michel, 1977, 470).
39Or, in his words: “The worker must not be able to lay down the law for the master; neither shouldthe master be able to lay down the law to the worker” (Ducpétiaux, 1844, 26)
40The minutes of their monthly meetings can still be consulted (Mottequin, 1973). Comparativetables of the wages paid at the respective firms were presented and discussed. For instance, atthe meeting of 23 February 1863, one of the managers had to defend the elevated wage levels at hisfirm by pointing to the difficult geological conditions of his exploitation (Mottequin, 1973, 367).It is important to emphasize that such inter-firm capital connections played a less important rolein Liège and Namur (Kurgan-van Hentenryk & Puissant, 1990, 206-207). We return to this issuein Appendix B.1.3.
18
short analysis of the institutional features of Belgian labor markets suggests that such
commentaries might have had truth to them.41 In a context where policy interference
was limited, where the limited legislation that was in place was discriminated against
supply side of labor markets, and where employers openly cooperated in unions and
cartels, collusion against labor supply might have been particularly abundant.
3.2 Data
Production and cost data
Our main data source is a novel data set which collects annual reports by the Admin-
istration des Mines, a state agency which employed engineers to annually inspect coal
mines.42 This data set was collected and cleaned by us, and we refer to Appendix B
for all details concerning the data collection and processing. The Administration data
is typically organized around mining concessions, in which the state grants permission
to a person or firm to mine its natural resources. Concessions could be composed of
multiple mines (production units). In theory, the same individual or firm could op-
erate multiple concessions simultaneously, but in practice, however, this almost never
happened in the Liège and Namur bassins as firms who owned multiple concessions
immediately merged these into a single concession. Hence, we can assume that the
concession-level unit of observation in the data corresponds to mutually independent
firms.43
For the 227 firms in our data set, we observe both the total amount of coal ex-
tracted, as well as prices, both at the firm-year-level between 1845 and 1913. Coal
output and prices are reported separately for each of the four coal types. Employment
(in numbers of employees and days worked) is observed at the firm-year-level, with a
41It is also worth noting that the case of the mining worker received a prominent place in contemporarysocial commentary. In his seminal work on British living standards, Engels (1892, 241-260)dedicated a chapter to lament the “cheating” and “plundering” by the “coal kings”. In France,novelist Émile Zola centered his famous Germinal around the woes of the mine worker andthe excesses of the bourgeoisie. Also in Belgium, contemporary critics have foregrounded thesituation of laborers in coal mining. Socialist accounts have linked the miners’ prominent role inthe 1886 movements to their nefarious treatment by “parasites”, very much like in Zola’s realistnovel (Destrée & Vandervelde, 1898, 60).
42More historical background on this agency and the reports is in Appendix B.1.1.43We motivate this assumption in depth in Appendix B.1.3.
19
distinction between underground and surface workers.44 For each of these respective
categories, gross and net wages were also recorded.45 Besides labor costs, the data
reports firm-level expenditure data on, literally, ‘non-labor ordinary expenses’ and
‘extraordinary expenses’.46 We also observe the total horsepower for various machine
types, up to 1899. To make this information tractable over the long period of obser-
vation, we aggregate them into two categories of machines: coal haulage (extraction)
and water pumping (épuisement).47 Furthermore, the count sheets also consistently
record the use of horses in the mining activities, again up to 1899.
Additional data sets
We complement the production-cost data with various other data sources.48 We obtain
yearly information on each firm’s membership of an employers’ association by digitizing
the monthly Bulletin of the Union des Charbonnages, Mines et Usines Métallurgiques
de la Province de Liège, for the Liège basin, and of the Association Charbonnière et
l’industrie houillière des bassins de Charleroi et de la Basse-Sambre, for the Namur
basin. We also observe membership in coal cartels using the cartel lists from De Leener
(1904).
Data on the working population in the various provinces in our data set are
taken from the ten-yearly population censuses, as adapted by Buyst (forthcoming).
We linearly interpolate the employment estimates from these census years to obtain
yearly data. Next, we link the municipalities in which the firms are located to data
on opening dates of railroad and tramway stations. Hence, we know for every firm in
every year whether it is connected to the railroad and tramway networks, or not.
Finally, we use the Consumer Price Index (CPI) of Segers (2003) and the extension
thereof to 1845 using Scholliers’ index (1995) to deflate all monetary variables in the
data set.44For some years, especially the earlier and later periods, the counts also differentiate workers based
on their age and gender.45For the earlier periods, the distinction between gross and net wages (typically due to participation
in insurance schemes) was irrelevant.46Wibail (1934) argues that the latter category include all expenses that involve ‘mine construction,
mine transformation and other expansion costs’, which we interpret mainly as fixed capital costs.Further information on the construction of the cost variables can be found in Appendix B.1.2.
47For several years, we also have comprehensive information on use of horsepower in ventilation(aérage) and other purposes. These variables are, however, highly collinear with the other twomechanization variables.
48More information on the construction of these variables is provided in Appendix B.2.
20
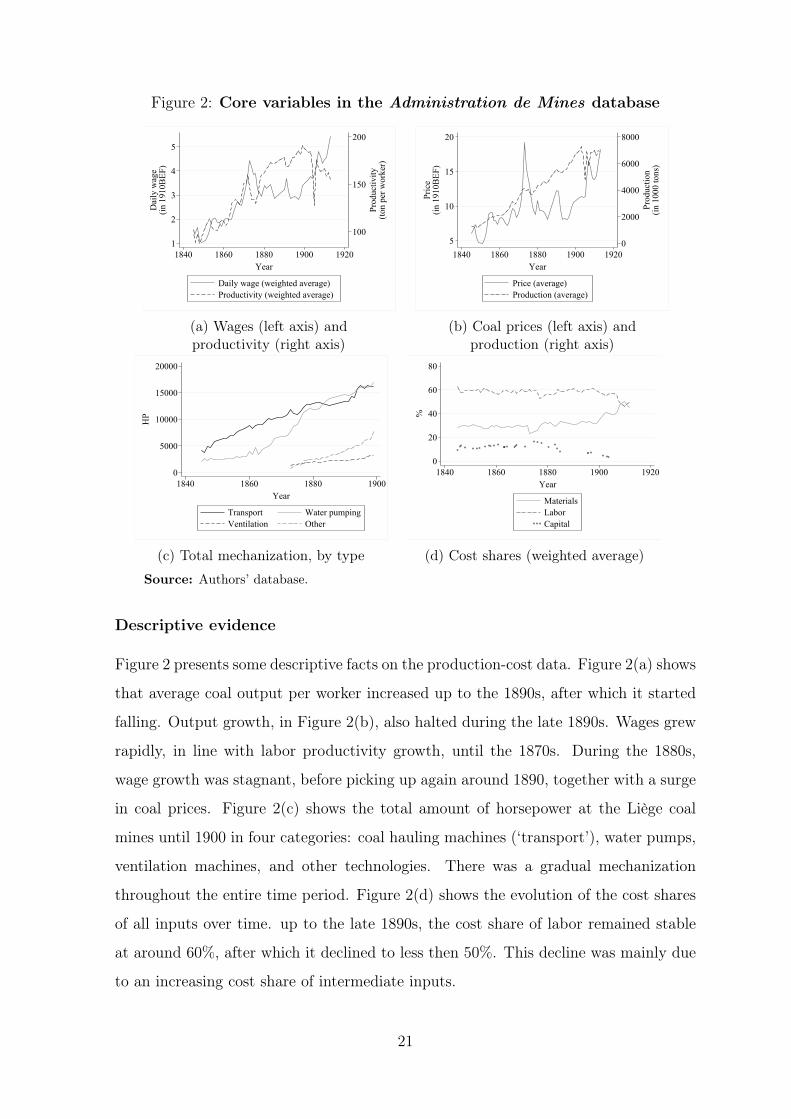
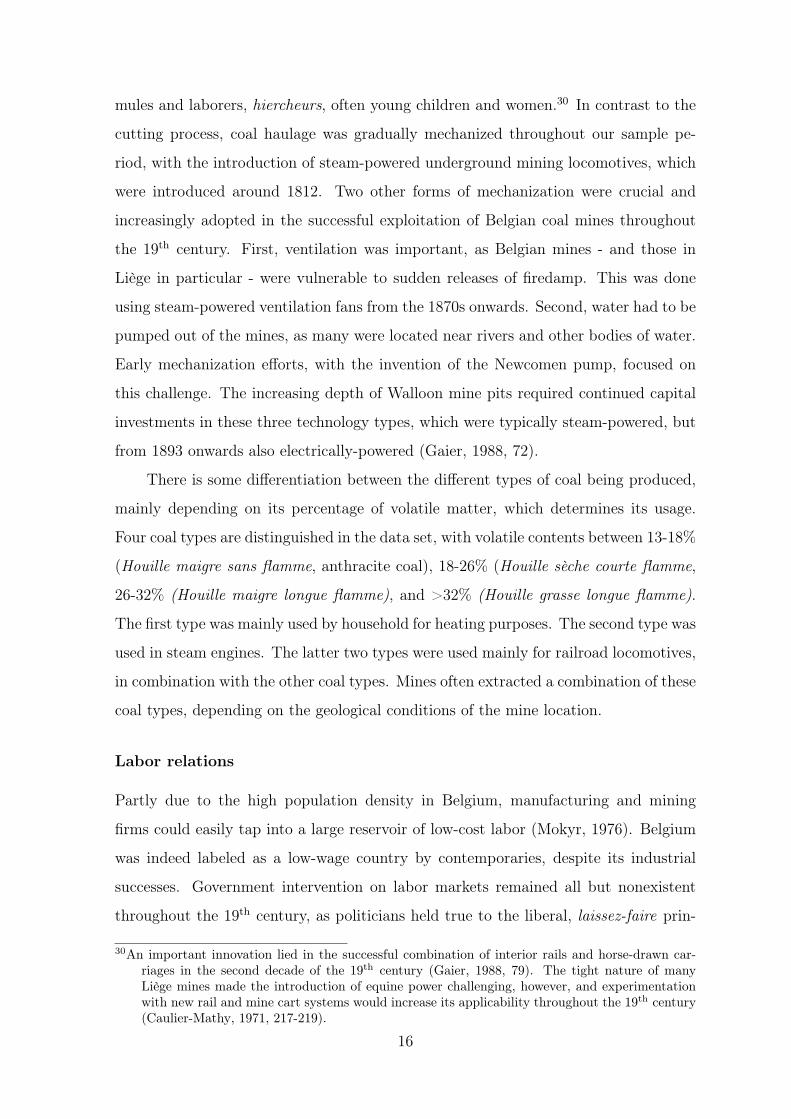
Figure 2: Core variables in the Administration de Mines database
100
150
200
Prod
uctiv
ity(to
n pe
r wor
ker)
1
2
3
4
5D
aily
wag
e(in
191
0BEF
)
1840 1860 1880 1900 1920Year
Daily wage (weighted average)Productivity (weighted average)
(a) Wages (left axis) andproductivity (right axis)
0
2000
4000
6000
8000
Prod
uctio
n(in
100
0 to
ns)
5
10
15
20
Pric
e(in
191
0BEF
)
1840 1860 1880 1900 1920Year
Price (average)Production (average)
(b) Coal prices (left axis) andproduction (right axis)
0
5000
10000
15000
20000
HP
1840 1860 1880 1900Year
Transport Water pumpingVentilation Other
(c) Total mechanization, by type
0
20
40
60
80
%
1840 1860 1880 1900 1920Year
MaterialsLaborCapital
(d) Cost shares (weighted average)
Source: Authors’ database.
Descriptive evidence
Figure 2 presents some descriptive facts on the production-cost data. Figure 2(a) shows
that average coal output per worker increased up to the 1890s, after which it started
falling. Output growth, in Figure 2(b), also halted during the late 1890s. Wages grew
rapidly, in line with labor productivity growth, until the 1870s. During the 1880s,
wage growth was stagnant, before picking up again around 1890, together with a surge
in coal prices. Figure 2(c) shows the total amount of horsepower at the Liège coal
mines until 1900 in four categories: coal hauling machines (‘transport’), water pumps,
ventilation machines, and other technologies. There was a gradual mechanization
throughout the entire time period. Figure 2(d) shows the evolution of the cost shares
of all inputs over time. up to the late 1890s, the cost share of labor remained stable
at around 60%, after which it declined to less then 50%. This decline was mainly due
to an increasing cost share of intermediate inputs.
21
4 Empirical model of collusion in the coal industry
We tailor the general model from Section 2 to the context of the 19th century Belgian
coal mining industry to quantify the degree of employer collusion and employer differ-
entiation. The model consists of two parts: a model of how firms produce and choose
inputs, and a model of how workers choose firms.
4.1 Labor demand
Production model
Output Qft indicates the tonnage of coal extracted during a given year by firm f , and
Pft is the mine-gate coal price per ton. There is limited differentiation in coal quality
hft, which is observed.49 Firms use two variable inputs: labor Lft, which is measured
as the average number of miners employed throughout the year, and the amount of
intermediate inputs purchased, Mft. The capital stock consists of steam engines used
for water pumping, coal hauling, and ventilation. The value of total capital used at
each mine is denoted Kft. Logarithms of variables are denoted in lowercases.
Machines may have had non-Hicks-neutral effects, for instance because they were
labor-saving. Our preferred specification of the production function in Equation (5)
takes this into account through the coefficient βlk. The output elasticities of labor and
capital are equal to θlft = βl + βlkkft and θkft = βk + βlklft. The output elasticity of
materials is assumed to be the same for all firms, θmft = βm. High-quality coal may be
harder to extract, which is measured by the coefficient βh.
qft = βllft + βmmft + βkkft + βlkkftlft + βhfthft + ωft (5)
Coal is sold at a price Pft. We do not make any behavioral assumptions on
demand for coal, price-setting and competition on coal markets, or the definition of
coal markets. We allow for coal firms to be either price-takers or price-setters on the
coal market. Hence, the markup of prices above marginal costs cft, µft =Pft
cft, can
49Quality differences are mainly due to variation in caloric content. We observe the breakdown ofcoal output into three quality categories.
22
flexibly vary across firms and over time.50
Identification
In order to identify the production function, we impose timing assumptions on firms’
input choices, as proposed by Olley and Pakes (1996). Let the productivity transition
be given by the AR(1) process in Equation (6a), with an unexpected productivity
shock υft.
ωft = g(ωft−1) + υft (6a)
We assume that labor and intermediate inputs are variable and static inputs,
and hence chosen after the productivity shock υft is observed by the firm at time t,
while capital is fixed and dynamic, so investment is chosen before the productivity
shock is observed, at time t − 1. Coal quality xft cannot be flexibly chosen after the
productivity shock either.51 More formally, we can thus write as following:
E[υft|(lfr−1,mfr−1, kfr, hfr)
]r∈[2,...,t]
= 0 (6b)
The usual approach in the literature is to invert the intermediate input demand func-
tion to recover the latent productivity level ωft, which can be used to construct the
productivity shock υft using the productivity law of motion (Levinsohn & Petrin, 2003;
Ackerberg, Caves, & Frazer, 2015). This approach hinges on productivity being the
only latent, serially correlated input demand shifter. However, input demand varies
due to markup and markdown variation as well. The approach with input inversion can
still be used when making additional parametric assumptions about the distribution
of markups and markdowns. Another possibility is to impose more structure on the
productivity transition process. Following Blundell and Bond (2000), the productivity
transition can be rewritten as a linear function with serial correlation ρ, Equation (6c).
By taking ρ differences of Equation (6c), one can express the productivity shock υft as
50This markup is usually one or above one. If there is a markdown of wages below marginal costsand buyer power by the coal buyers, such as the railroads, it is even theoretically possible thatmarkups are below one, which would not mean that coal firms are loss-making (due to themarkdown of wages below marginal costs).
51Coal quality is mainly determined by geological conditions that are exogenous to the firm once itis in operation.
23
a function of estimable coefficients without having to invert the input demand function.
ωft = ρωft−1 + υft (6c)
We pursue this approach as it allows us to not impose additional structure on the
distribution of markups and markdowns across firms and over time. This comes at the
cost of ruling out a richer productivity transition function g(.), and of not coping with
selection bias due to endogenous entry and exit. As is often noted in the literature,
however, moving to an unbalanced panel, in which we do not select negatively on
market exit, already alleviates most concerns of selection bias.52
Estimation
Rewriting the moment conditions from Equation (6b), and only using the lags up to
one year, the moment conditions are given by Equation (7).53
E[qft − ρqft−1 − β0(1− ρ)− βl(lft − ρlft−1)−
βm(mft − ρmft−1)− βk(kft − ρkft−1)− βlk(lftkft − ρlft−1kft−1)− βh(hft − ρhft−1)
|(lft−1,mft−1, kft, kft−1, lft−1kft, lft−1kft−1, hft, hft−1)]
= 0 (7)
As the estimation procedure requires lagged variables to be observed, we can
estimate the model only on years for which the prior year is included in the data
set as well, which reduces the sample size to 4003 observations. This also excludes
firms which do not use capital or intermediate inputs, as logarithms are taken. Labor
is measured as the number of workers times the number of days worked. Materials
are measured using the ‘ordinary expenses’ variable, which is reported in the data.
Capital is constructed by using the perpetual inventory method on the ‘extraordinary
expenses’ category, which we describe more in detail in Appendix B.3. Coal quality is
measured as the fraction of coal output that is ‘fat’ coal with a high caloric content.
52See Olley and Pakes (1996) and De Loecker, Goldberg, Khandelwal, and Pavcnik (2016).53In theory, one could use more lags, but this further reduces the data set, which is already small.
24
Results
The production function estimates are in the top panel of Table 1 (i.e. Table 1(a)). We
foreground two specifications of Equation (5): one which boils down to a Cobb-Douglas
production function in which βlk = 0, and another in which we allow for labor-saving
and labor-augmenting technological change through βlk. The former’s estimates can
be found in column (I), the latter’s in column (II).
On average, elasticities with respect to the different inputs labor (β̂l), capital (β̂k)
and materials (β̂m) are similar across both our specifications. These confirm the his-
torical record that Belgian coal mining was indeed very labor intensive. Furthermore,
allowing for factor-biased technology adoption indicates that capital investments were
labor-replacing, given the negative estimate of βlk. This also aligns with the aforemen-
tioned mechanization of coal transport, in which steam power gradually replaced man
power. Finally, it is also important to emphasize that, while the average elasticities
are quite similar in both specifications, this hides substantial variation in elasticities
at firm level. Given that we aim to estimate markdowns and collusion at firm level,
it is really crucial to fully account for the labor-saving effects of technological change,
as in the specification in column (II).
4.2 Labor supply
Worker utility and choices
We specify a differentiated employers Bertrand model in the spirit of Berry (1994) and
Card et al. (2018). Each period, homogeneous workers i in a labor market ` choose
to work for a coal firm f from a set of differentiated firms F`t. Every firm belongs
to exactly one labor market `, and firms are also grouped in geographical nests n,
which are subsets of the market `. The utility of each worker is given by Equation (8).
Worker utility depends on the wage paid by the firm to all of its miners; firms do
not wage discriminate within one type of workers. It also depends on observable firm
characteristics Xft. We include the usage of technologies to extract water and haul
coal, measured by their respective horsepower, as shifters of worker utility: miners
presumably prefer working in mines with good water-extracting technology and with
mechanized hauling. This is backed up by the fact that, as aforementioned, most
25
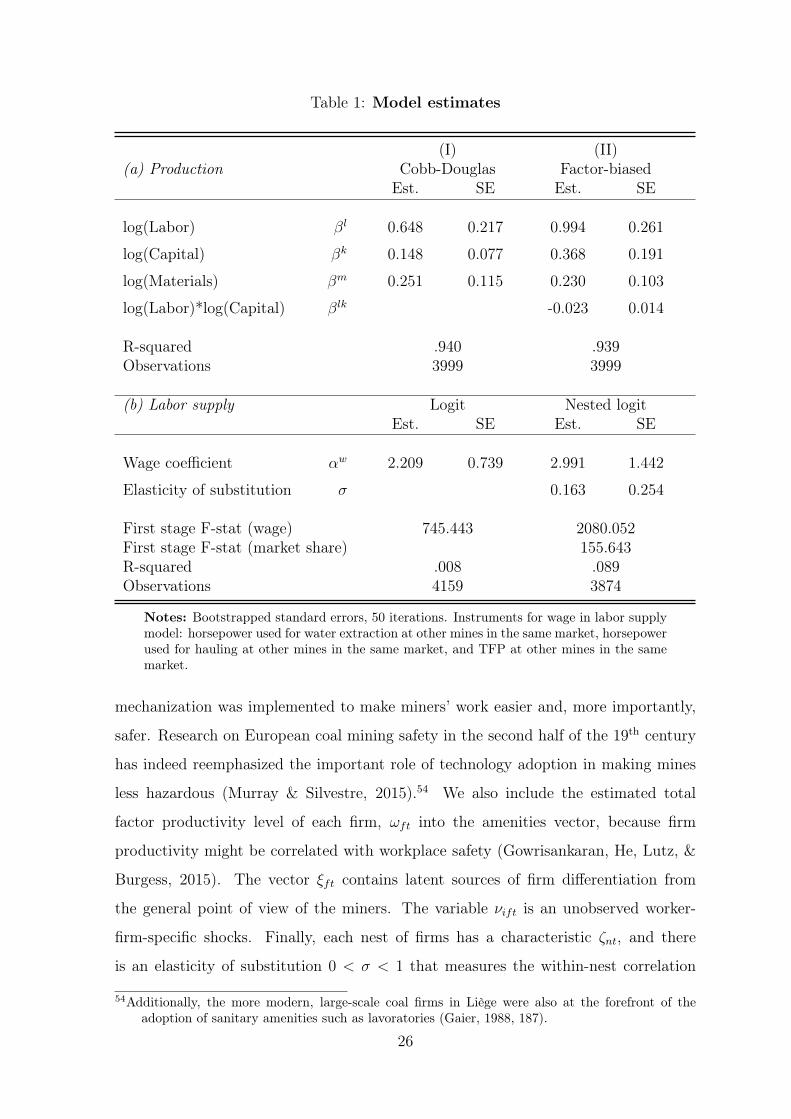
Table 1: Model estimates
(I) (II)(a) Production Cobb-Douglas Factor-biased
Est. SE Est. SE
log(Labor) βl 0.648 0.217 0.994 0.261
log(Capital) βk 0.148 0.077 0.368 0.191
log(Materials) βm 0.251 0.115 0.230 0.103
log(Labor)*log(Capital) βlk -0.023 0.014
R-squared .940 .939Observations 3999 3999
(b) Labor supply Logit Nested logitEst. SE Est. SE
Wage coefficient αw 2.209 0.739 2.991 1.442
Elasticity of substitution σ 0.163 0.254
First stage F-stat (wage) 745.443 2080.052First stage F-stat (market share) 155.643R-squared .008 .089Observations 4159 3874
Notes: Bootstrapped standard errors, 50 iterations. Instruments for wage in labor supplymodel: horsepower used for water extraction at other mines in the same market, horsepowerused for hauling at other mines in the same market, and TFP at other mines in the samemarket.
mechanization was implemented to make miners’ work easier and, more importantly,
safer. Research on European coal mining safety in the second half of the 19th century
has indeed reemphasized the important role of technology adoption in making mines
less hazardous (Murray & Silvestre, 2015).54 We also include the estimated total
factor productivity level of each firm, ωft into the amenities vector, because firm
productivity might be correlated with workplace safety (Gowrisankaran, He, Lutz, &
Burgess, 2015). The vector ξft contains latent sources of firm differentiation from
the general point of view of the miners. The variable νift is an unobserved worker-
firm-specific shocks. Finally, each nest of firms has a characteristic ζnt, and there
is an elasticity of substitution 0 < σ < 1 that measures the within-nest correlation
54Additionally, the more modern, large-scale coal firms in Liège were also at the forefront of theadoption of sanitary amenities such as lavoratories (Gaier, 1988, 187).
26
in utilities: if σ = 0, all products are symmetric substitutes, if σ approaches one,
products within the same segment are perfect substitutes. The coefficients αx measure
the degree to which miners care about the different covariates in the utility function.
Uift = αwW lft + αxXft + ζft + ζnt + (1− σ)νift (8)
Workers have an outside option of working in any other industry than coal mining
in the same market, of which the utility is normalized to zero. As documented in
Section 2.4, search and switching costs are assumed to be zero, and the model is
static: workers only care about their current utility and can switch firms or switch to
the outside option in any period t without cost.
The labor market share of firm f is denoted slft ≡Lft
L`t, with L`t being the total
employment across all firms and the outside option. The market share of the outside
option is sl0t. Assuming that the shock νift is EV(1) distributed leads to the labor
supply function in Equation (9):
slft − sl0t = αwW lft + σslft|nα
xXft + ζft (9)
The inverse wage elasticity of labor supply ψLfft is given by:
ψlfft = 1 + (αw(
1
1− σ −σ
1− σsft|n − slft)Wft)
−1 (10)
Identification
One cannot simply estimate Equation (9) using OLS because firms take into account
their attractiveness ζft when choosing wages. In order to identify the labor supply
functions (10), we need shifters of labor demand that do not enter the worker’s utility
function. We rely the on characteristics space of the other employers in the same
market as demand shifters at firm f , similarly to the instruments suggested by Berry,
Levinsohn, and Pakes (1995). More specifically, we rely on the observable amenities of
other firms in the same labor market (number of water extraction machines, number
of coal hauling machines, and total factor productivity) as demand shifters for firm
f . The assumption is that the usage of these technologies and productivity at com-
peting firms affect equilibrium wages, as they affect worker utility, but do not change
27
the utility of workers at firm f , conditional on the wage rate, productivity, and tech-
nologies used at firm f . We denoted the averages of these technology characteristics
at other mines in the same arrondissement (district), municipality and town into the
instrumental variables vector Zft.
Labor market definitions
It is important to characterize labor markets in a correct manner (for a discussion, see
Manning & Petrongolo, 2017). We define labor markets at the province level, with
sub-provincial nests at the 2-digit postal code level, which roughly corresponded to
‘arrondissements’ (groups of municipalities). A survey of all commuting workers at the
two largest coal mines in the Liège basin in 1905 by Mahaim (1911) shows that 93.3%
of workers were recruited from the same province and 64% from the same 2-digit postal
code. The remaining workers did not live in the provinces of the other bassins (Hainaut
or Namur), but rather in nearby Limburg, where no coal mines were present at the
time. Hence, we can safely assume that the Liège and Namur coal basins were isolated
labor markets, which did not compete with each other for workers. The average worker
lived 5.54 km from the mine, and 90% of the workers lived closer than 16 km from the
mine. The cumulative distribution of commuting distances is in Figure A9 (Appendix
A). Most workers walked to the mine (84.7%), 13.9% commuted daily by train, and
1.4% commuted during the weekend and lived close to the mine during the week, away
from their family.55 We add the sub-provincial nests because firms that are located
close to each other are probably tighter competitors than firms that are located at the
opposite sides within the same province. In Liège, there were on average 60 firms at
the province-level, and 12 per 2-digit postal code, and in Namur 19 and 6, respectively.
The average province-level employment share within coal mining was 1.7% in Liège
and 5.3% in Namur, and 11.0% and 17.1% at the 2-digit postal code level. Given that
workers could choose to work outside of coal mining as well, we define the total market
size L0t as the working population in each province, rather than the number of coal
miners.56 The outside option is hence equal to the share of the working population in
55We return to the role of transportation networks in Appendix C.1, in which we present a robustnesscheck to validate our labor market definition.
56We observe this number only in census years, and infer it using linear interpolation for the remainingyears.
28
each province that is not employed in coal mining.
Estimation
In the observable covariates matrix Xft, we include the horsepower of water extraction
machines, and the horsepower coal hauling machines. As was discussed before, these
were likely to affect miner utility. In addition, we also include the average wage in
non-mining industries as a covariate, as this shifts the utility derived from the outside
option. This wage level is the same for all firms in a given year. We also include total
industry sales across all manufacturing industries, as a measure for the business cycle,
which could again affects the outside option of the workers.
Results
The estimates of the labor supply model are in Table 1(b). In column (I), we set
the elasticity of substitution σ equal to zero, which corresponds to the standard logit
model. In column (II), we also estimate the elasticity of substitution, which is hence
a nested logit model. Standard errors are block-bootstrapped within firms with 50
iterations. In both cases, the chosen instruments perform well, and the estimated
coefficients are generally economically and statistically significant. Interestingly, the
labor supply elasticity with respect to wages is particularly high. This closely aligns
with anecdotal evidence, as Belgian coal workers had the reputation to change mines
“for a penny” (Leboutte, 1988, 47).
4.3 Markdowns
Having established the empirical approaches from the labor demand (i.e. the produc-
tion approach) and the labor supply sides, we can now estimate collusion by comparing
said methods. The actual markdowns are estimated through the production-side ap-
proach, through which we can directly compare the marginal product of labor with its
remuneration. Next, we can then use the obtained labor supply elasticities from the
labor supply approach to define counter-factual markdowns under different conduct
assumptions. Bringing these elements together, we are finally able to pinpoint the
parameter of interest: the level of employer collusion.
29

Actual markdown
We allow for oligopsony power on the labor market, but assume that intermediate
input prices are exogenous to each individual firm. Given that Belgian coal firms
were well-integrated in the Belgian manufacturing sector, both from a supply chain
and a geographic perspective, it is indeed reasonable to assume that coal firms had to
compete with other industrial sectors for material inputs. The cost-side estimate for
the wage markdown µLft is equal to the right-hand side of Equation (4):
µlft =
θlftWmftMft
θmftWlftLft
The markup µQft can be calculated by looking at the wedge between the marginal
product and price of intermediate inputs:
µqft =
θmftWm
ftMft
PftQft
The estimates are in Table 2(a): using the Cobb-Douglas model, the markdown is
estimated to be 2.3 on average, which implies that the marginal product of labor is 2.3
times larger than wages. Wages are hence marked down below the marginal product
of miners by 56%. The 90% confidence interval on the average markdown lies between
1.6 and 3.9. With the factor-biased model, the average markdown is lower at 1.9 with
a CI on [1.6;4.0]. The estimates hence show a large degree of oligopsony power over
workers. The average coal price markup is estimated is 0.74, with a 90% confidence
interval of [0.51;1.08]. The point estimate indicates that coal prices are 25% lower
than marginal costs, but this does not imply that mines are loss-making: they also
exert profits from the wedge between marginal costs and wages. The markup ratio is
not significantly different from one, so we cannot reject that coal prices are equal to
marginal costs. This is consistent with the institutional feature that coal markets were
integrated and unconcentrated, and with the fact that coal is a not very differentiated
product. Indeed, recent historical research has highlighted the increasingly integrated
nature of the European coal market throughout the 19th century (Murray & Silvestre,
2020). Our results are consistent with this finding. The yearly evolution of average
markups and markdowns can be found in Figure F.2 in Appendix D.
30
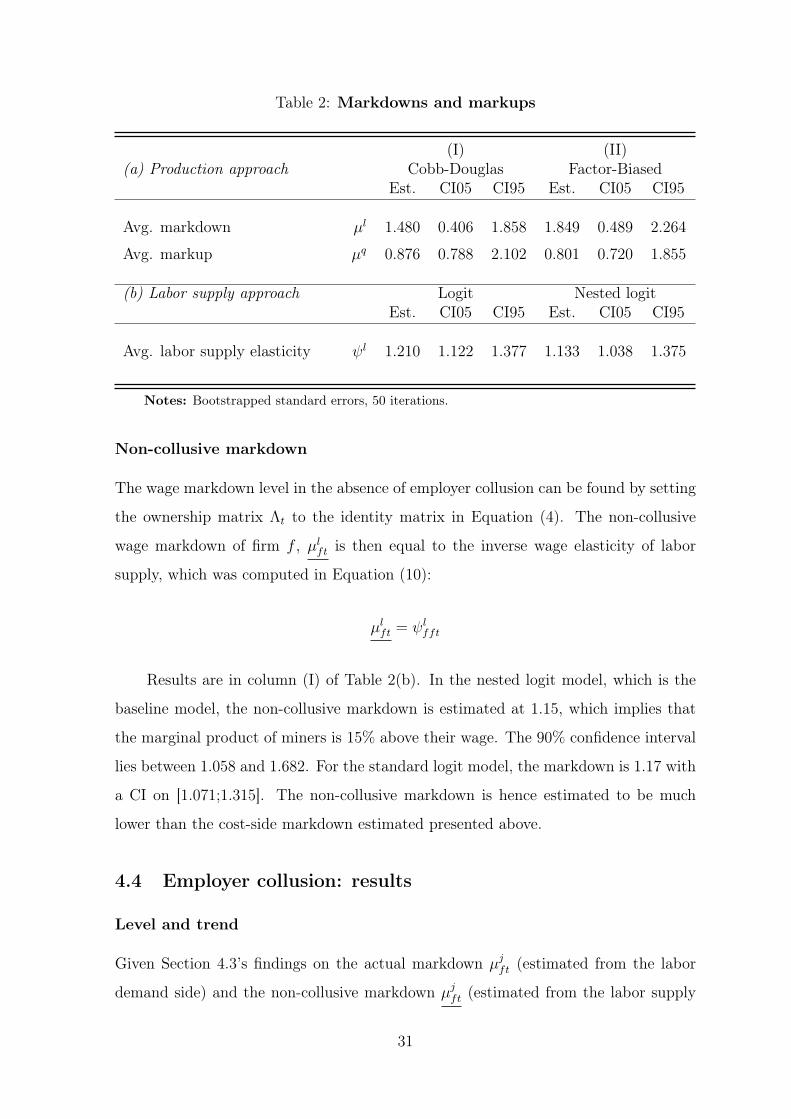
Table 2: Markdowns and markups
(I) (II)(a) Production approach Cobb-Douglas Factor-Biased
Est. CI05 CI95 Est. CI05 CI95
Avg. markdown µl 1.480 0.406 1.858 1.849 0.489 2.264
Avg. markup µq 0.876 0.788 2.102 0.801 0.720 1.855
(b) Labor supply approach Logit Nested logitEst. CI05 CI95 Est. CI05 CI95
Avg. labor supply elasticity ψl 1.210 1.122 1.377 1.133 1.038 1.375
Notes: Bootstrapped standard errors, 50 iterations.
Non-collusive markdown
The wage markdown level in the absence of employer collusion can be found by setting
the ownership matrix Λt to the identity matrix in Equation (4). The non-collusive
wage markdown of firm f , µlft is then equal to the inverse wage elasticity of labor
supply, which was computed in Equation (10):
µlft = ψl
fft
Results are in column (I) of Table 2(b). In the nested logit model, which is the
baseline model, the non-collusive markdown is estimated at 1.15, which implies that
the marginal product of miners is 15% above their wage. The 90% confidence interval
lies between 1.058 and 1.682. For the standard logit model, the markdown is 1.17 with
a CI on [1.071;1.315]. The non-collusive markdown is hence estimated to be much
lower than the cost-side markdown estimated presented above.
4.4 Employer collusion: results
Level and trend
Given Section 4.3’s findings on the actual markdown µjft (estimated from the labor
demand side) and the non-collusive markdown µjft (estimated from the labor supply
31
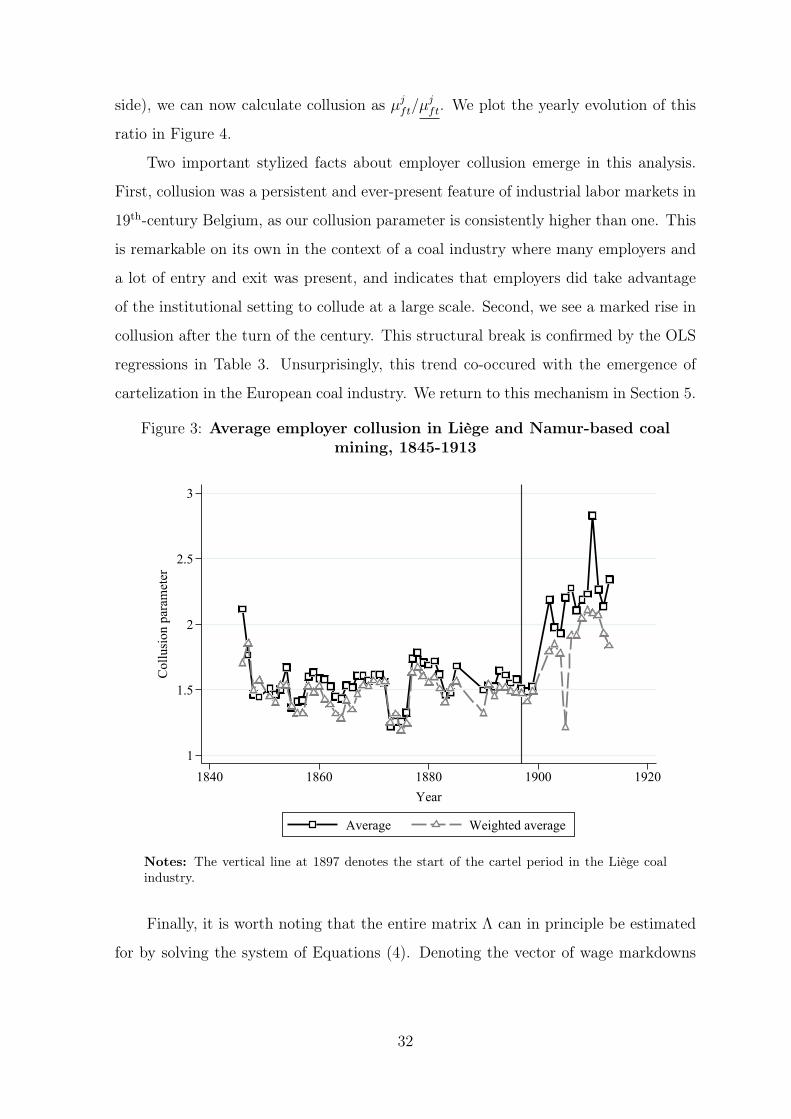
side), we can now calculate collusion as µjft/µ
jft. We plot the yearly evolution of this
ratio in Figure 4.
Two important stylized facts about employer collusion emerge in this analysis.
First, collusion was a persistent and ever-present feature of industrial labor markets in
19th-century Belgium, as our collusion parameter is consistently higher than one. This
is remarkable on its own in the context of a coal industry where many employers and
a lot of entry and exit was present, and indicates that employers did take advantage
of the institutional setting to collude at a large scale. Second, we see a marked rise in
collusion after the turn of the century. This structural break is confirmed by the OLS
regressions in Table 3. Unsurprisingly, this trend co-occured with the emergence of
cartelization in the European coal industry. We return to this mechanism in Section 5.
Figure 3: Average employer collusion in Liège and Namur-based coalmining, 1845-1913
1
1.5
2
2.5
3
Col
lusi
on p
aram
eter
1840 1860 1880 1900 1920Year
Average Weighted average
Notes: The vertical line at 1897 denotes the start of the cartel period in the Liège coalindustry.
Finally, it is worth noting that the entire matrix Λ can in principle be estimated
for by solving the system of Equations (4). Denoting the vector of wage markdowns
32
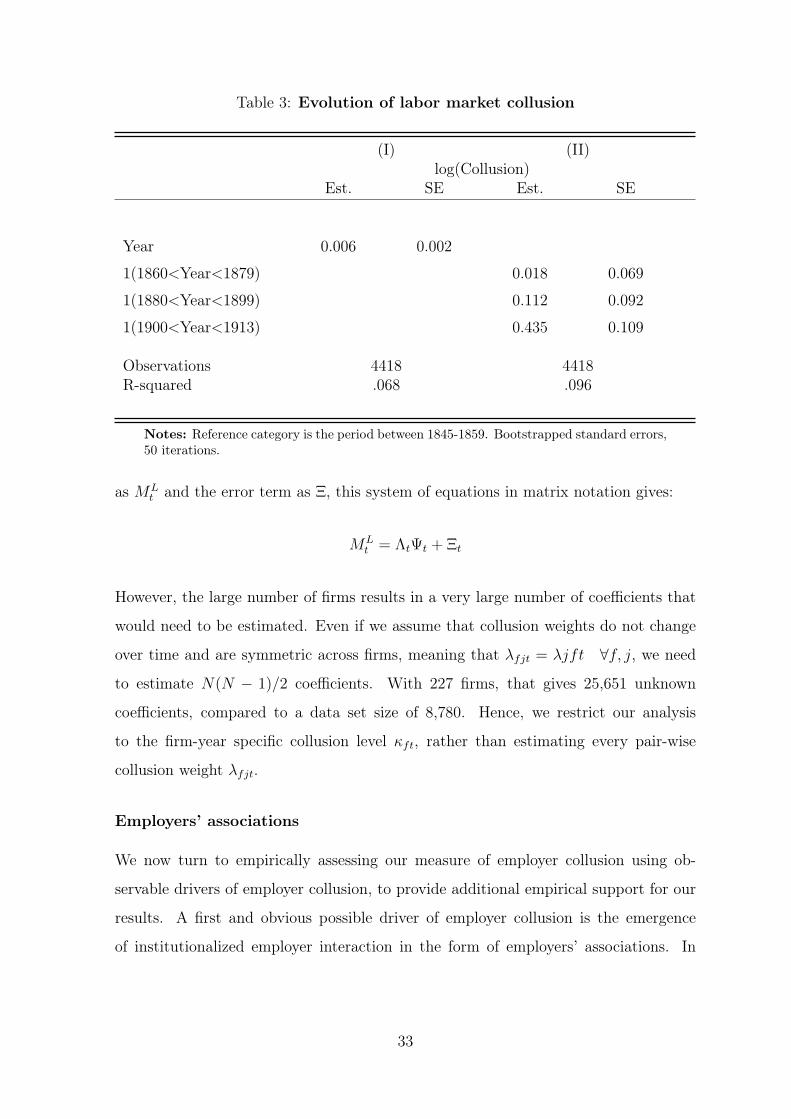
Table 3: Evolution of labor market collusion
(I) (II)log(Collusion)
Est. SE Est. SE
Year 0.006 0.002
1(1860<Year<1879) 0.018 0.069
1(1880<Year<1899) 0.112 0.092
1(1900<Year<1913) 0.435 0.109
Observations 4418 4418R-squared .068 .096
Notes: Reference category is the period between 1845-1859. Bootstrapped standard errors,50 iterations.
as MLt and the error term as Ξ, this system of equations in matrix notation gives:
MLt = ΛtΨt + Ξt
However, the large number of firms results in a very large number of coefficients that
would need to be estimated. Even if we assume that collusion weights do not change
over time and are symmetric across firms, meaning that λfjt = λjft ∀f, j, we need
to estimate N(N − 1)/2 coefficients. With 227 firms, that gives 25,651 unknown
coefficients, compared to a data set size of 8,780. Hence, we restrict our analysis
to the firm-year specific collusion level κft, rather than estimating every pair-wise
collusion weight λfjt.
Employers’ associations
We now turn to empirically assessing our measure of employer collusion using ob-
servable drivers of employer collusion, to provide additional empirical support for our
results. A first and obvious possible driver of employer collusion is the emergence
of institutionalized employer interaction in the form of employers’ associations. In
33
1840, local coal mines united in the form the the Union des Charbonnages Liégeois.57
One of the main tasks of this union was to “coordinate salary fluctuations, in order
to avoid the danger of temporarily high salaries which could harm the entire coal
region” (De Leener, 1904, 234). This cooperation would later be formalized in 1868
with the establishment of organization’s statutes and the inclusion of other mines and
metalworks, under the name of the Union des charbonnages, mines et usines métal-
lurgiques de la province de Liège. Its committee would convene on a monthly basis to
discuss recent events, and to propose courses of actions to serve the common good.
While this collective had the rather vague pretense of defending the interests of the
local coal and metal industries, their yearly reports reveal a wide range of topics in
which they attempted to pressure policy decisions. In the context of labor relations,
the Union sought to specifically fight government intervention in issues such as child
labor58 and female labor59, as well as any form of labor inspection60 or concessions to
labor unions.61 Furthermore, they lobbied strongly in favor of the controversial livret.62
Overall, contemporary economists regarded the Union as a prime meeting location for
Liège employers to coordinate all kinds of employment decisions (De Leener, 1909,
138). This becomes clear when one considers the Union’s reaction to changes in the
legal framework of industrial labor. For example, the Union called to life a monthly
commission to formulate “uniform rules” as to the application of the new labor accident
insurance law of 1903 (Union des charbonnages (...), 1906, 30).
57Similar initiatives surfaced in the other Belgian coal bassins. The other region in our dataset, Basse-Sambre, was recognized by more small-scale, family-run firms, lacking formal co-hesion. Charleroi’s employers’ association attempted to gain control over this area, but withoutwidespread success in terms of membership (see Appendix B.2 for more details).
58“It is only by descending in the mines at an early age that young miners acquire what is called the‘instinct of the coal miner” ’ (Union des charbonnages (...), 1872, 131). “All these jobs, it mustbe admitted, are not very strenuous and it would be difficult, if not sometimes impossible, fortheir execution, to replace the children by adults who, for the most part, would not submit tothem” (Union des charbonnages (...), 1887, 124).
59“We protest again against the regulation of the work of the adult woman, which constitutes aflagrant violation of individual freedom” (Union des charbonnages (...), 1889, 48).
60In a letter to the new-founded Ministry of Industry and Labor, the Union’s committee deemeda new law on mine inspection “useless”, because it would do little to prevent individual acci-dents, and “dangerous”, because it would be a cause of conflict in industrial relations (Union descharbonnages (...), 1896, 15).
61According to the Union, such concessions would be “a question of placing an instrument of war inthe hands of the workers”. “As for the mining delegates, their intervention will be a cause ofstrife, struggles, false maneuvers” (Union des charbonnages (...), 1895, 17).
62“Without livret, the workers will be able to abandon the establishments en masse and throw dis-ruption in industry”; “when the benefits of instruction and education penetrate further amongthem, we will be the first to applaud this progressive movement” (Union des charbonnages (...),1869, 10-11).
34
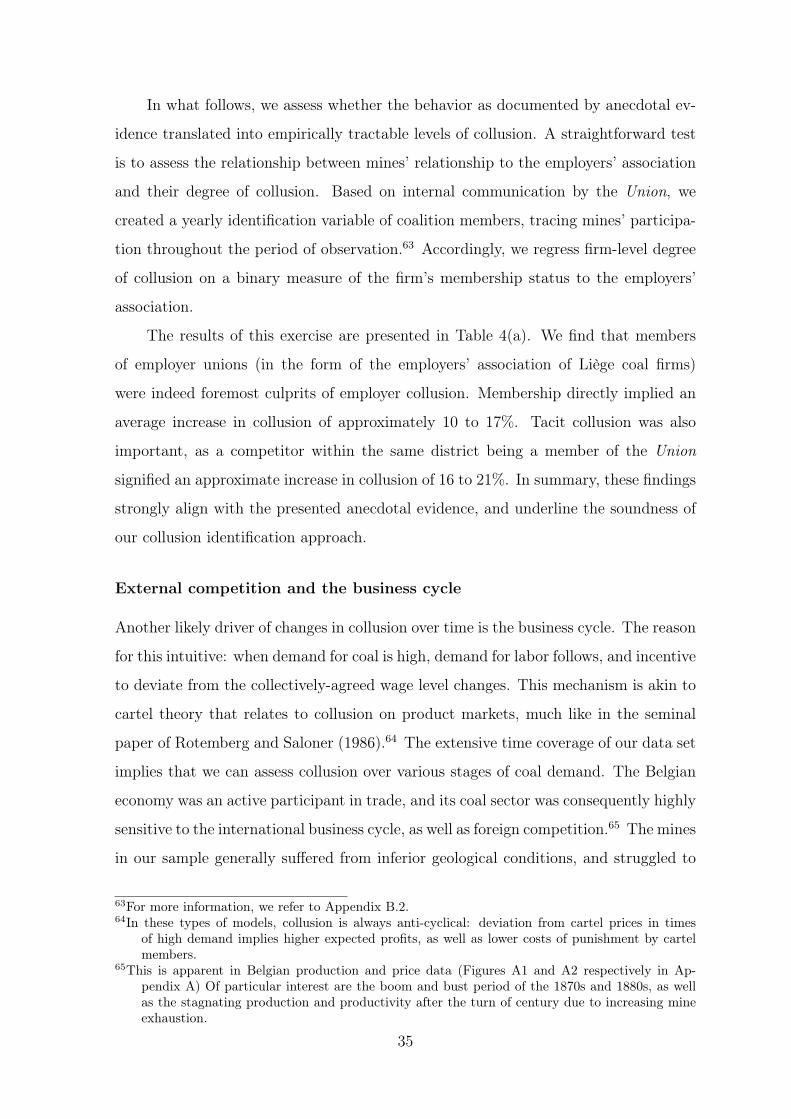
In what follows, we assess whether the behavior as documented by anecdotal ev-
idence translated into empirically tractable levels of collusion. A straightforward test
is to assess the relationship between mines’ relationship to the employers’ association
and their degree of collusion. Based on internal communication by the Union, we
created a yearly identification variable of coalition members, tracing mines’ participa-
tion throughout the period of observation.63 Accordingly, we regress firm-level degree
of collusion on a binary measure of the firm’s membership status to the employers’
association.
The results of this exercise are presented in Table 4(a). We find that members
of employer unions (in the form of the employers’ association of Liège coal firms)
were indeed foremost culprits of employer collusion. Membership directly implied an
average increase in collusion of approximately 10 to 17%. Tacit collusion was also
important, as a competitor within the same district being a member of the Union
signified an approximate increase in collusion of 16 to 21%. In summary, these findings
strongly align with the presented anecdotal evidence, and underline the soundness of
our collusion identification approach.
External competition and the business cycle
Another likely driver of changes in collusion over time is the business cycle. The reason
for this intuitive: when demand for coal is high, demand for labor follows, and incentive
to deviate from the collectively-agreed wage level changes. This mechanism is akin to
cartel theory that relates to collusion on product markets, much like in the seminal
paper of Rotemberg and Saloner (1986).64 The extensive time coverage of our data set
implies that we can assess collusion over various stages of coal demand. The Belgian
economy was an active participant in trade, and its coal sector was consequently highly
sensitive to the international business cycle, as well as foreign competition.65 The mines
in our sample generally suffered from inferior geological conditions, and struggled to
63For more information, we refer to Appendix B.2.64In these types of models, collusion is always anti-cyclical: deviation from cartel prices in times
of high demand implies higher expected profits, as well as lower costs of punishment by cartelmembers.
65This is apparent in Belgian production and price data (Figures A1 and A2 respectively in Ap-pendix A) Of particular interest are the boom and bust period of the 1870s and 1880s, as wellas the stagnating production and productivity after the turn of century due to increasing mineexhaustion.
35
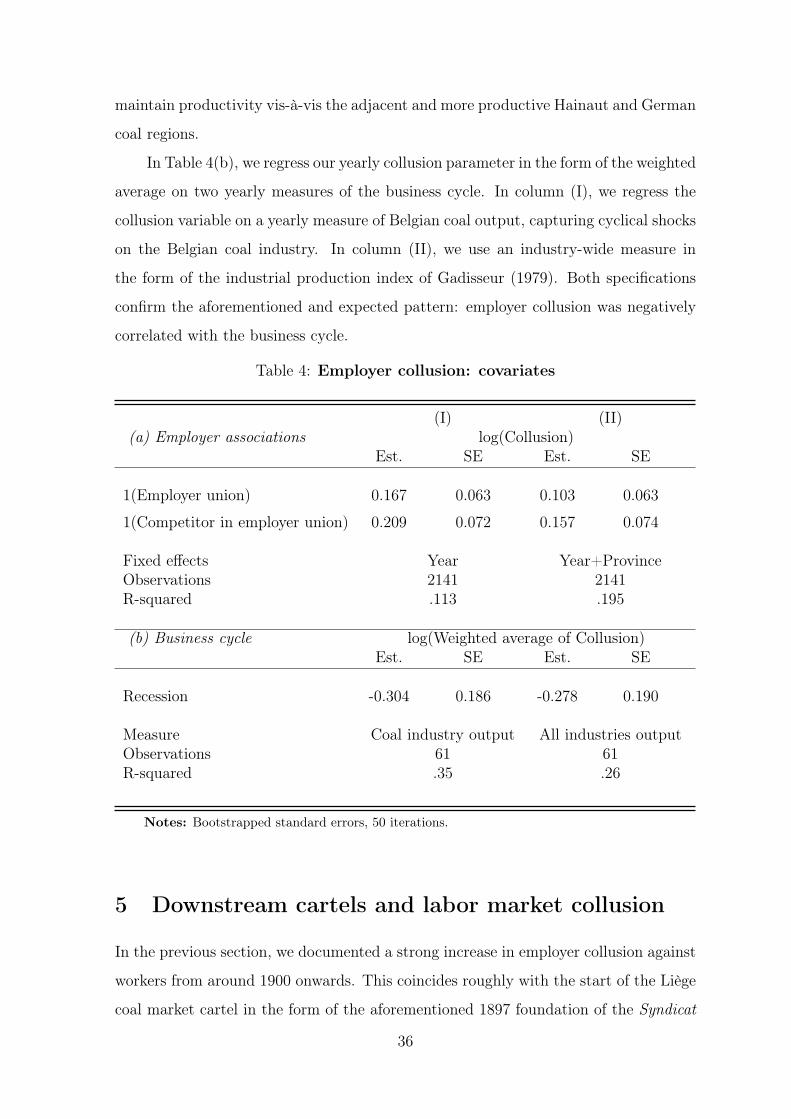
maintain productivity vis-à-vis the adjacent and more productive Hainaut and German
coal regions.
In Table 4(b), we regress our yearly collusion parameter in the form of the weighted
average on two yearly measures of the business cycle. In column (I), we regress the
collusion variable on a yearly measure of Belgian coal output, capturing cyclical shocks
on the Belgian coal industry. In column (II), we use an industry-wide measure in
the form of the industrial production index of Gadisseur (1979). Both specifications
confirm the aforementioned and expected pattern: employer collusion was negatively
correlated with the business cycle.
Table 4: Employer collusion: covariates
(I) (II)(a) Employer associations log(Collusion)
Est. SE Est. SE
1(Employer union) 0.167 0.063 0.103 0.063
1(Competitor in employer union) 0.209 0.072 0.157 0.074
Fixed effects Year Year+ProvinceObservations 2141 2141R-squared .113 .195
(b) Business cycle log(Weighted average of Collusion)Est. SE Est. SE
Recession -0.304 0.186 -0.278 0.190
Measure Coal industry output All industries outputObservations 61 61R-squared .35 .26
Notes: Bootstrapped standard errors, 50 iterations.
5 Downstream cartels and labor market collusion
In the previous section, we documented a strong increase in employer collusion against
workers from around 1900 onwards. This coincides roughly with the start of the Liège
coal market cartel in the form of the aforementioned 1897 foundation of the Syndicat
36
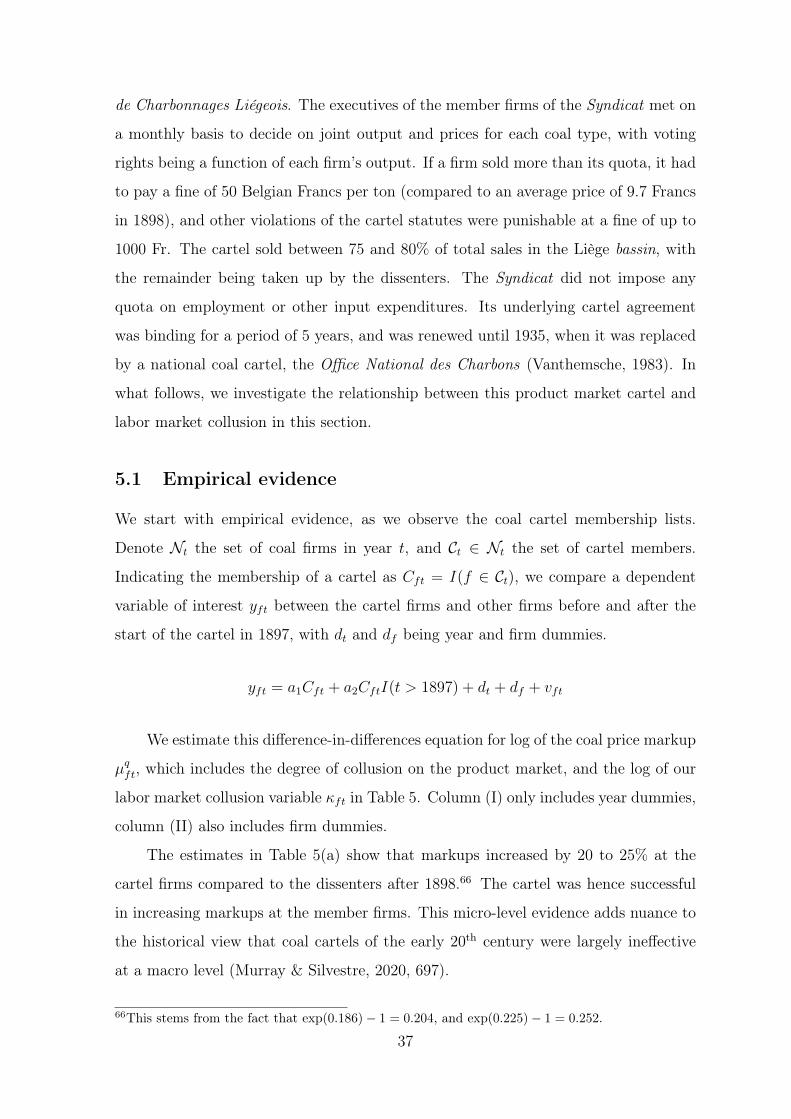
de Charbonnages Liégeois. The executives of the member firms of the Syndicat met on
a monthly basis to decide on joint output and prices for each coal type, with voting
rights being a function of each firm’s output. If a firm sold more than its quota, it had
to pay a fine of 50 Belgian Francs per ton (compared to an average price of 9.7 Francs
in 1898), and other violations of the cartel statutes were punishable at a fine of up to
1000 Fr. The cartel sold between 75 and 80% of total sales in the Liège bassin, with
the remainder being taken up by the dissenters. The Syndicat did not impose any
quota on employment or other input expenditures. Its underlying cartel agreement
was binding for a period of 5 years, and was renewed until 1935, when it was replaced
by a national coal cartel, the Office National des Charbons (Vanthemsche, 1983). In
what follows, we investigate the relationship between this product market cartel and
labor market collusion in this section.
5.1 Empirical evidence
We start with empirical evidence, as we observe the coal cartel membership lists.
Denote Nt the set of coal firms in year t, and Ct ∈ Nt the set of cartel members.
Indicating the membership of a cartel as Cft = I(f ∈ Ct), we compare a dependent
variable of interest yft between the cartel firms and other firms before and after the
start of the cartel in 1897, with dt and df being year and firm dummies.
yft = a1Cft + a2CftI(t > 1897) + dt + df + vft
We estimate this difference-in-differences equation for log of the coal price markup
µqft, which includes the degree of collusion on the product market, and the log of our
labor market collusion variable κft in Table 5. Column (I) only includes year dummies,
column (II) also includes firm dummies.
The estimates in Table 5(a) show that markups increased by 20 to 25% at the
cartel firms compared to the dissenters after 1898.66 The cartel was hence successful
in increasing markups at the member firms. This micro-level evidence adds nuance to
the historical view that coal cartels of the early 20th century were largely ineffective
at a macro level (Murray & Silvestre, 2020, 697).
66This stems from the fact that exp(0.186)− 1 = 0.204, and exp(0.225)− 1 = 0.252.
37
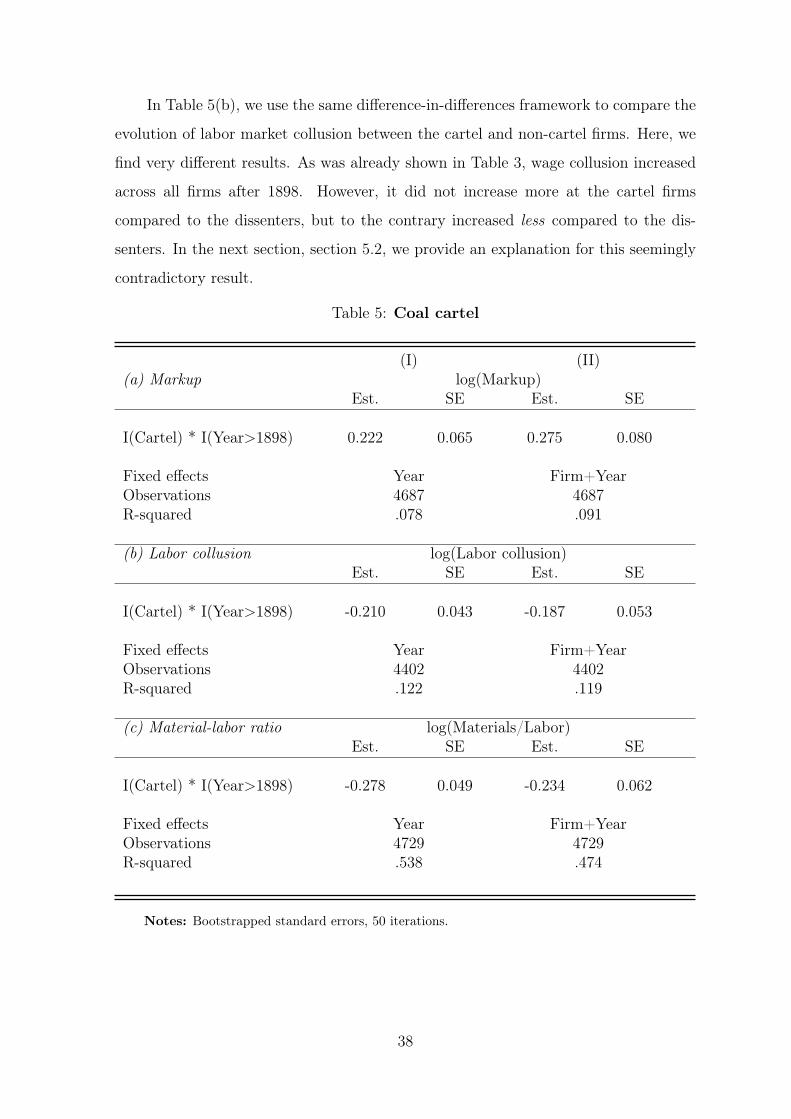
In Table 5(b), we use the same difference-in-differences framework to compare the
evolution of labor market collusion between the cartel and non-cartel firms. Here, we
find very different results. As was already shown in Table 3, wage collusion increased
across all firms after 1898. However, it did not increase more at the cartel firms
compared to the dissenters, but to the contrary increased less compared to the dis-
senters. In the next section, section 5.2, we provide an explanation for this seemingly
contradictory result.
Table 5: Coal cartel
(I) (II)(a) Markup log(Markup)
Est. SE Est. SE
I(Cartel) * I(Year>1898) 0.222 0.065 0.275 0.080
Fixed effects Year Firm+YearObservations 4687 4687R-squared .078 .091
(b) Labor collusion log(Labor collusion)Est. SE Est. SE
I(Cartel) * I(Year>1898) -0.210 0.043 -0.187 0.053
Fixed effects Year Firm+YearObservations 4402 4402R-squared .122 .119
(c) Material-labor ratio log(Materials/Labor)Est. SE Est. SE
I(Cartel) * I(Year>1898) -0.278 0.049 -0.234 0.062
Fixed effects Year Firm+YearObservations 4729 4729R-squared .538 .474
Notes: Bootstrapped standard errors, 50 iterations.
38
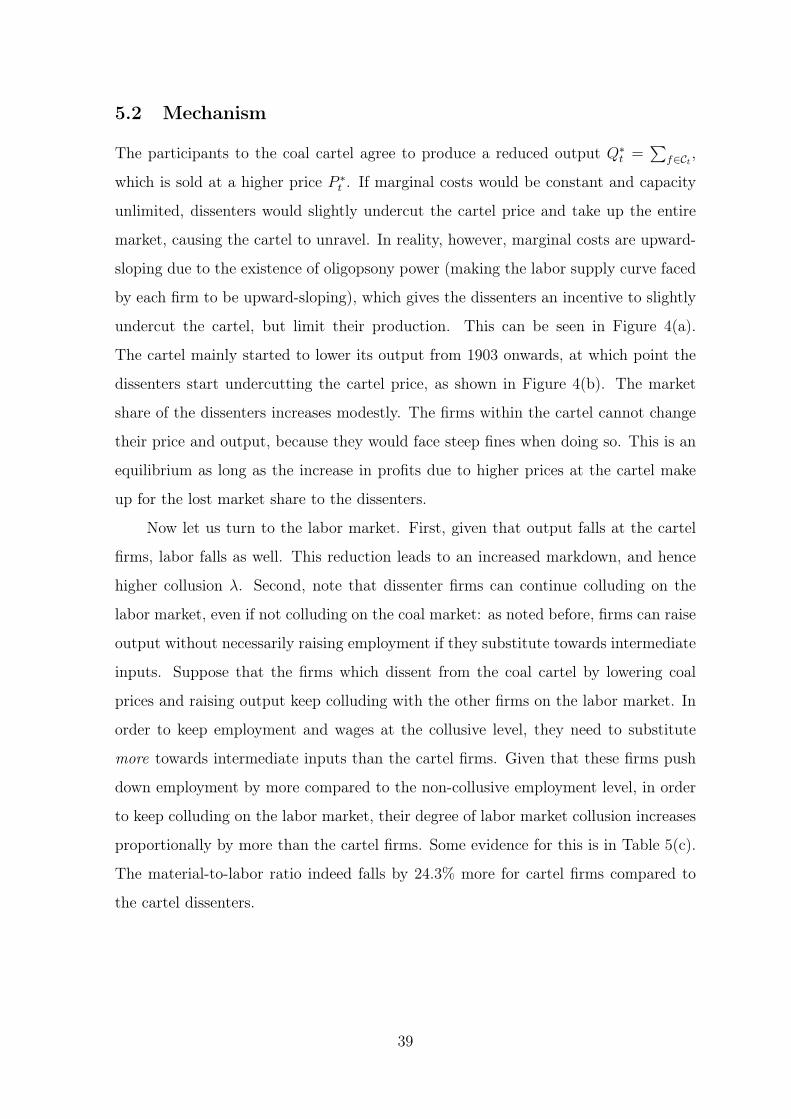
5.2 Mechanism
The participants to the coal cartel agree to produce a reduced output Q∗t =∑
f∈Ct ,
which is sold at a higher price P ∗t . If marginal costs would be constant and capacity
unlimited, dissenters would slightly undercut the cartel price and take up the entire
market, causing the cartel to unravel. In reality, however, marginal costs are upward-
sloping due to the existence of oligopsony power (making the labor supply curve faced
by each firm to be upward-sloping), which gives the dissenters an incentive to slightly
undercut the cartel, but limit their production. This can be seen in Figure 4(a).
The cartel mainly started to lower its output from 1903 onwards, at which point the
dissenters start undercutting the cartel price, as shown in Figure 4(b). The market
share of the dissenters increases modestly. The firms within the cartel cannot change
their price and output, because they would face steep fines when doing so. This is an
equilibrium as long as the increase in profits due to higher prices at the cartel make
up for the lost market share to the dissenters.
Now let us turn to the labor market. First, given that output falls at the cartel
firms, labor falls as well. This reduction leads to an increased markdown, and hence
higher collusion λ. Second, note that dissenter firms can continue colluding on the
labor market, even if not colluding on the coal market: as noted before, firms can raise
output without necessarily raising employment if they substitute towards intermediate
inputs. Suppose that the firms which dissent from the coal cartel by lowering coal
prices and raising output keep colluding with the other firms on the labor market. In
order to keep employment and wages at the collusive level, they need to substitute
more towards intermediate inputs than the cartel firms. Given that these firms push
down employment by more compared to the non-collusive employment level, in order
to keep colluding on the labor market, their degree of labor market collusion increases
proportionally by more than the cartel firms. Some evidence for this is in Table 5(c).
The material-to-labor ratio indeed falls by 24.3% more for cartel firms compared to
the cartel dissenters.
39
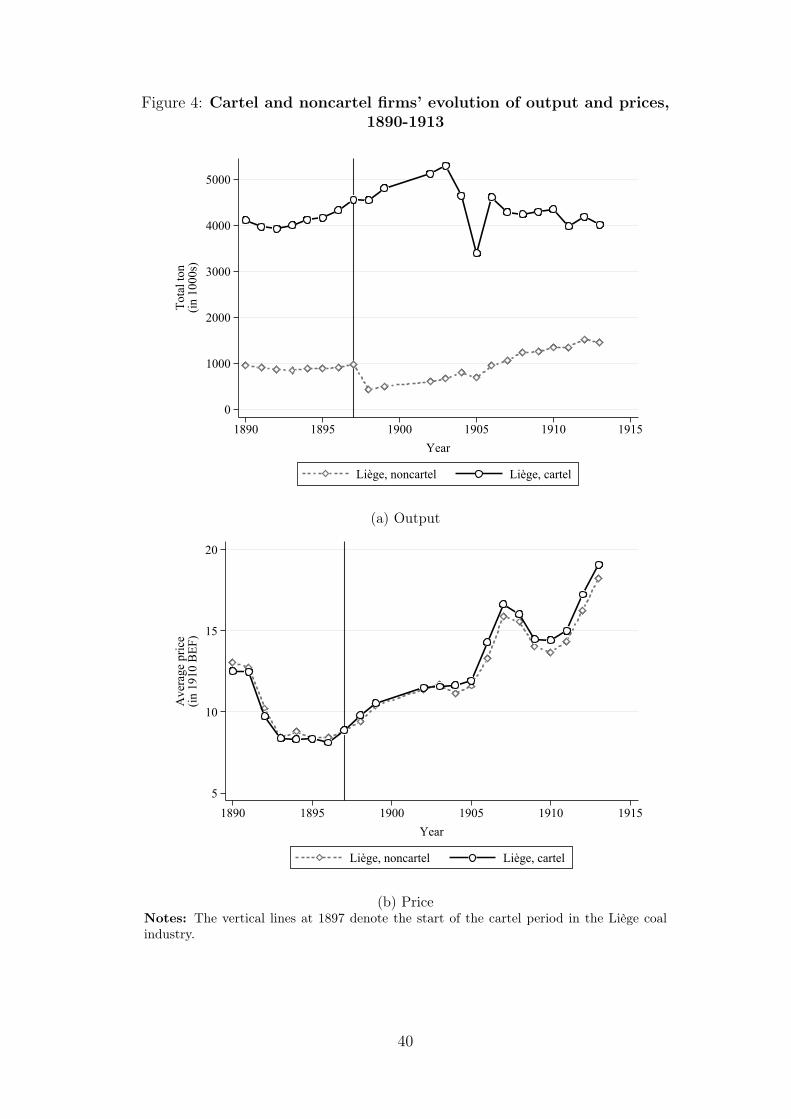
Figure 4: Cartel and noncartel firms’ evolution of output and prices,1890-1913
0
1000
2000
3000
4000
5000To
tal t
on(in
100
0s)
1890 1895 1900 1905 1910 1915Year
Liège, noncartel Liège, cartel
(a) Output
5
10
15
20
Ave
rage
pric
e(in
191
0 B
EF)
1890 1895 1900 1905 1910 1915Year
Liège, noncartel Liège, cartel
(b) PriceNotes: The vertical lines at 1897 denote the start of the cartel period in the Liège coalindustry.
40
6 Conclusions
In this paper, we point to a substantial body of both current-day and historical evi-
dence to argue that employer collusion is a credible source of labor market power. To
make research on such forms of anti-competitive behavior empirically tractable, this
paper proposes an empirical approach to measure collusion behavior using data on
production, costs, wages and employment. This method is then applied to a newly
digitized data set based on the archives of the Belgian mining department, the Admin-
istration des Mines, whose supervisory duties translated into consistent, micro-level
engineer reports covering all coal mining production activities throughout a large part
of Belgium’s industrialization. Our estimates reveal the existence of widespread and
persistent collusion in industrial labor markets. Our collusion parameter is also closely
related to observable, historical examples of labor market collusion in the form of em-
ployers’ associations. Furthermore, we find that collusion was particularly prominent
in times of economic upswings, as incentives to collude against workers became higher,
which is in line with a modified version of the Rotemberg and Saloner model (1986).
We foreground the crucial role of interaction between collusion upstream (on the
labor market) and downstream (on the product market). First, we identify the marked
impact of the Syndicat de Charbonnages Liégeois on the mark-ups of its members
through limitations on coal production. The latter, however, has far-reaching effects
on labor market collusion as well. Reductions in production translated into reduction
in labor inputs as well, increasing collusion. Importantly, noncartel firms were able
to uphold (tacit) collusion at the labor market alongside cartel members and increase
production simultaneously through input substitution. As a consequence, this mech-
anism grants us new insights on the differentiated but connected nature of upstream
and downstream collusion. In this sense, concerns regarding increasing collusion on
product markets might have important labor market consequences as well, and this
finding emphasizes the policy relevance of battling anti-competitive practices.
Our findings on the ubiquitous nature of employer collusion thus highlight the
importance of an active antitrust policy regarding labor market issues. Not only is
the rise of labor oligopsony a topic worth of attention to policy makers (Naidu et al.,
2018), battling employer collusion requires active detection of hidden practices such as
41

wage fixing, sharing wage information and “no-poaching” agreements. In this context,
research on the detection of employer collusion undoubtedly has an important role to
play.
42
References
Acemoglu, D., & Wolitzky, A. (2011). The economics of labor coercion. Econometrica,79 (2), 555–600.
Ackerberg, D. A., Caves, K., & Frazer, G. (2015). Identification properties of recentproduction function estimators. Econometrica, 83 (6), 2411-2451.
Allen, R. C. (2009). The British Industrial Revolution in global perspective. Cambridge:Cambridge University Press.
Azar, J., Berry, S., & Marinescu, I. E. (2019). Estimating labor market power (Mimeo).IESE Business School.
Berger, D. W., Herkenhoff, K. F., & Mongey, S. (2019). Labor market power (Tech.Rep.). National Bureau of Economic Research.
Berry, S. (1994). Estimating discrete-choice models of product differentiation. TheRAND Journal of Economics , 242–262.
Berry, S., Levinsohn, J., & Pakes, A. (1995). Automobile prices in market equilibrium.Econometrica, 64 (4), 841-890.
Blundell, R., & Bond, S. (2000). GMM estimation with persistent panel data: Anapplication to production functions. Econometric Reviews , 19 (3), 321–340.
Boal, W. M. (1995). Testing for employer monopsony in turn-of-the-century coalmining. The RAND Journal of Economics , 519–536.
Bresnahan, T. F. (1982). The oligopoly solution concept is identified. EconomicsLetters , 10 (1-2), 87–92.
Bresnahan, T. F. (1987). Competition and collusion in the American automobileindustry: The 1955 price war. The Journal of Industrial Economics , 35 (4),457–482.
Brooks, W. J., Kaboski, J. P., Kondo, I. O., Li, Y. A., & Qian, W. (2021). Infras-tructure investment and labor monopsony power (Working Paper No. 28977).National Bureau of Economic Research.
Brooks, W. J., Kaboski, J. P., Li, Y. A., & Qian, W. (2021). Exploitation of la-bor? Classical monopsony power and labor’s share. Journal of DevelopmentEconomics , 150 , 102627.
Burdett, K., & Mortensen, D. T. (1998). Wage differentials, employer size, andunemployment. International Economic Review , 257–273.
Buyst, E. (forthcoming). Changes in the occupational structure of Belgium: Newestimates for the 1846–1910 period. In O. Saito & L. Shaw-Taylor (Eds.), Occu-pational structure, industrialization and economic growth in a comparative per-spective. Cambridge: Cambridge University Press.
Cahuc, P., Postel-Vinay, F., & Robin, J.-M. (2006). Wage bargaining with on-the-job
43
search: Theory and evidence. Econometrica, 74 (2), 323–364.Caldwell, S., & Harmon, N. (2019). Outside options, bargaining, and wages: Evidence
from coworker networks (Mimeo). MIT.Capitaine, F. (1858). Essai biographique sur Henri Joseph Orban. Liège: J.-G.
Carmanne Imprimeur.Card, D., Cardoso, A. R., Heining, J., & Kline, P. (2018). Firms and labor market
inequality: Evidence and some theory. Journal of Labor Economics , 36 (S1),S13–S70.
Caulier-Mathy, N. (1971). La modernisation des charbonnages Liégeois pendant lapremière moitié du XIXe siècle: Techniques d’exploitation (Vol. 192). Paris:Société d’Édition Les Belles Lettres.
Chlepner, B.-S. (1972). Cent ans d’histoire sociale en Belgique. Brussels: Éditions del’Université de Bruxelles.
Church, R. (1986). History of the British coal industry. Volume 3. 1830-1913: Victo-rian pre-eminence. Oxford: Clarendon Press.
Ciliberto, F., & Williams, J. W. (2014). Does multimarket contact facilitate tacitcollusion? Inference on conduct parameters in the airline industry. The RANDJournal of Economics , 45 (4), 764–791.
Degrève, D. (1982). Le commerce extérieur de la Belgique, 1830-1913-1939: Présenta-tion critique des données statistiques (Vol. 1b). Brussels: Palais des Académies.
Delabastita, V., & Goos, M. (2021). Steamy arithmetic: 19th-century technologicalchange, employment and wages (Mimeo). KU Leuven.
De Leener, G. (1904). Les syndicats industriels en Belgique (2nd ed.). Brussels: Mischet Thron.
De Leener, G. (1908). Étude sur le marché charbonnier Belge. Brussels: Misch etThron.
De Leener, G. (1909). L’organisation syndicale des chefs d’industrie: Étude sur lessyndicats industriels en Belgique. Brussels: Misch et Thron.
Dell, M. (2010). The persistent effects of Peru’s mining mita. Econometrica, 78 (6),1863–1903.
De Loecker, J., Goldberg, P. K., Khandelwal, A. K., & Pavcnik, N. (2016). Prices,markups, and trade reform. Econometrica, 84 (2), 445-510.
De Loecker, J., & Scott, P. T. (2016). Estimating market power evidence from the USbrewing industry (Tech. Rep.). National Bureau of Economic Research.
De Loecker, J., & Warzynski, F. (2012). Markups and firm-level export status. Amer-ican Economic Review , 102 (6), 2437–71.
Delrée, H., & Linard de Guertechin, A. (1963). Esquisse historique de la législation etde l’Administration des Mines. Annales des Mines de Belgique(1), 45–59.
44

Demirer, M. (2020). Production function estimation with factor-augmenting technol-ogy: An application to markups (Mimeo). Microsoft Research.
Destrée, J., & Vandervelde, E. (1898). Le socialisme en Belgique. Paris: V. Giard &E. Brière.
Drèze, G. (1905). Le livre d’or de l’Exposition Universelle et Internationale de 1905:Histoire complète de l’exposition de Liège (Vol. 2). Liège: Imp. Aug. Bénard.
Ducpétiaux, E. (1844). Le paupérisme en Belgique: Causes et remèdes. Brussels:Librairie polytechnique d’Aug. Decq.
Engels, F. (1892). The condition of the working-class in England in 1844: With prefacewritten in 1892. London: Swan Sonnenschein & Co.
Farrell, J., & Klemperer, P. (2007). Coordination and lock-in: Competition withswitching costs and network effects. Handbook of industrial organization, 3 ,1967–2072.
Fernihough, A., & O’Rourke, K. H. (2021). Coal and the European Industrial Revo-lution. The Economic Journal , 131 (635), 1135–1149.
Gadisseur, J. (1979). Le produit physique de l’économie Belge 1831-1913: Présentationcritique des données statistiques (Unpublished doctoral dissertation). Universitéde Liège, Liège.
Gaier, C. (1988). Huit siècles de houillerie Liégeoise: Histoire des hommes et ducharbon à Liège. Liège: Editions du Perron.
Geerkens, É., Leboutte, R., & Péters, A. (2020). Le travail des ouvriers mineurs enBelgique (ca 1830-1930). Revue du Nord(2), 289–309.
Gowrisankaran, G., He, C., Lutz, E. A., & Burgess, J. L. (2015). Productivity, safety,and regulation in underground coal mining: Evidence from disasters and fatalities(Tech. Rep.). National Bureau of Economic Research.
Honka, E. (2014). Quantifying search and switching costs in the US auto insuranceindustry. The RAND Journal of Economics , 45 (4), 847–884.
Huberman, M. (2008). Ticket to trade: Belgian labour and globalization before 1914.The Economic History Review , 61 (2), 326–359.
Huberman, M., & Lewchuk, W. (2003). European economic integration and the labourcompact, 1850–1913. European Review of Economic History , 7 (1), 3–41.
Huberman, M., Meissner, C. M., & Oosterlinck, K. (2017). Technology and geographyin the Second Industrial Revolution: New evidence from the margins of trade.The Journal of Economic History , 77 (1), 39–89.
Humphries, J., & Schneider, B. (2019). Spinning the industrial revolution. TheEconomic History Review , 72 (1), 126–155.
Jedwab, R., Johnson, N., & Koyama, M. (forthcoming). The economic impact of theBlack Death. Journal of Economic Literature.
45

Krueger, A. B. (2018). Reflections on dwindling worker bargaining power and monetarypolicy. In Luncheon address at the Jackson Hole Economic Symposium (Vol. 24).
Krueger, A. B., & Ashenfelter, O. (2018). Theory and evidence on employer collusionin the franchise sector (Working Paper No. 24831). National Bureau of EconomicResearch.
Kurgan-van Hentenryk, G., & Puissant, J. (1990). Industrial relations in the Bel-gian coal industry since the end of the nineteenth century. In G. D. Feldman& K. Tenfelde (Eds.), Workers, owners and politics in coal mining: An interna-tional comparison of industrial relations (pp. 203–270). Oxford: Berg Publish-ers.
Kurgan-Van Hentenryk, G., Puissant, J., & Montens, V. (1996). Dictionnaire despatrons en Belgique: Les hommes, les entreprises, les réseaux. Brussels: DeBoeck Université.
Lamadon, T., Mogstad, M., & Setzler, B. (forthcoming). Imperfect competition,compensating differentials and rent sharing in the US labor market. AmericanEconomic Review .
Lamoreaux, N. R. (2019). The problem of bigness: From standard oil to google.Journal of Economic Perspectives , 33 (3), 94–117.
Leboutte, R. (1988). Le livret d’ouvrier dans la province de Liège: Une source mécon-nue en histoire sociale. Présentation et premier résultats d’exploitation. Liège:Editions du Musée de la Vie Wallone.
Leboutte, R. (1991). Mortalité par accident dans les mines de charbon en Belgiqueaux XIXe-XXe siècles. Revue du Nord , 73 (293), 703–736.
Lebrun, P., Bruwier, M., Dhont, J., & Hansotte, G. (1981). Essai sur la révolutionindustrielle en Belgique: 1770-1847. Brussels: Palais des Académies.
Levinsohn, J., & Petrin, A. (2003). Estimating production functions using inputs tocontrol for unobservables. The Review of Economic Studies , 70 (2), 317–341.
Mahaim, E. (1911). Les ouvriers mineurs abonnés aux chemins de fer en Belgique.Annales des Mines de Belgique, 16 , 69-115.
Manning, A. (2011). Imperfect competition in the labor market. In O. Ashenfel-ter & D. Card (Eds.), Handbook of labor economics (Vol. 4B, pp. 973–1041).Amsterdam: Elsevier.
Manning, A. (2021). Monopsony in labor markets: A review. ILR Review , 74 (1),3–26.
Manning, A., & Petrongolo, B. (2017). How local are labor markets? Evidence froma spatial job search model. American Economic Review , 107 (10), 2877–2907.
Martins, P. S. (2020). What do employers’ associations do? (Tech. Rep. No. 13705).IZA Institute of Labor Economics.
46
Marx, K., & Engels, F. (1985). Marx & Engels collected works: Volume 21 Marx andEngels 1867–1870. London: Lawrence & Wishart.
Mertens, M. (2020). Labor market power and the distorting effects of internationaltrade. International Journal of Industrial Organization, 68 (102562), 1-16.
Michel, C., & Weiergraeber, S. (2018). Estimating industry conduct in differentiatedproducts markets (Mimeo). Universitat Pompeu Fabra.
Michel, J. (1977). Un maillon plus faible du syndicalisme minier: La fédérationnationale des mineurs Belges avant 1914. Revue Belge de Philologie et d’Histoire,55 (2), 425–473.
Miller, N. H., & Weinberg, M. C. (2017). Understanding the price effects of theMillerCoors joint venture. Econometrica, 85 (6), 1763–1791.
Mokyr, J. (1976). Industrialization in the Low Countries, 1795-1850. London: YaleUniversity Press.
Morlacco, M. (2017). Market power in input markets: Theory and evidence fromFrench manufacturing (Mimeo). University of Southern California.
Mottequin, P. (1973). Réunions du comité des directeurs des travaux des charbonnagesdu Couchant de Mons, patronnées par la Société Générale (1848-1876). Leuven:Éditions Nauwelaerts.
Murray, J. E., & Silvestre, J. (2015). Small-scale technologies and European coal minesafety, 1850–1900. The Economic History Review , 68 (3), 887–910.
Murray, J. E., & Silvestre, J. (2020). Integration in European coal markets, 1833–1913.The Economic History Review , 73 (3), 668–702.
Naidu, S., Posner, E. A., & Weyl, G. (2018). Antitrust remedies for labor marketpower. Harvard Law Review , 132 , 536–601.
Naidu, S., & Yuchtman, N. (2013). Coercive contract enforcement: Law and the labormarket in nineteenth century industrial Britain. American Economic Review ,103 (1), 107–44.
Naidu, S., & Yuchtman, N. (2018). Labor market institutions in the gilded age ofAmerican economic history. In L. P. Cain, P. V. Fishback, & P. W. Rhode(Eds.), The Oxford handbook of American economic history. Oxford: OxfordUniversity Press.
Ogilvie, S. (2019). The European guilds: An economic analysis. Princeton: PrincetonUniversity Press.
Olley, G. S., & Pakes, A. (1996). The dynamics of productivity in the telecommuni-cations equipment industry. Econometrica, 64 (6), 1263–1297.
Pluymers, B. (1992). De Belgische industriële produktie 1811-1846: Reconstructie vaneen databank van de fysieke produktie en de bruto-toegevoegde waarde (Mimeo).Department of Economics, KU Leuven.
47
Postel-Vinay, F., & Robin, J.-M. (2002). Equilibrium wage dispersion with workerand employer heterogeneity. Econometrica, 70 (6), 2295–2350.
Rotemberg, J. J., & Saloner, G. (1986). A supergame-theoretic model of price warsduring booms. American Economic Review , 76 (3), 390–407.
Rubens, M. (2021). Monopsony power and factor biased technology adoption (Mimeo).KU Leuven.
Scholliers, P. (1995). A century of real industrial wages in Belgium, 1840–1939. InP. Scholliers & V. Zamagni (Eds.), Labour’s reward: Real wages and economicchange in 19th- and 20th-century Europe (pp. 106–137). Aldershot: EdwardElgar Publishing.
Schubert, G., Stansbury, A., & Taska, B. (2021). Employer concentration and outsideoptions (Mimeo). Harvard University.
Segers, Y. (2003). Economische groei en levensstandaard: Particuliere consumptie envoedselverbruik in België, 1800-1913. Leuven: Leuven University Press.
Sokolova, A., & Sorensen, T. (2021). Monopsony in labor markets: A meta-analysis.ILR Review , 74 (1), 27-55.
Stevens, F. (1998). Het coalitieverbod in België (1795–1866). In Liber amicorum RogerBlanpain (pp. 395–413). Bruges: Die Keure.
Vandaele, K. (2004). ‘In het getal ligt onze macht’: Een politiek-wetenschappelijkeanalyse van de vakbondsledenevolutie in België 1898-1995 (Unpublished doctoraldissertation). Ghent University, Ghent.
Van den Eeckhout, P. (2005). Van werkboekje tot arbeidscontract. De negentiende-eeuwse arbeidsrelaties revisited. Journal of Belgian History , 35 (2-3), 153–200.
Van der Wee, H. (1996). The Industrial Revolution in Belgium. In M. Teich &R. Porter (Eds.), The Industrial Revolution in national context: Europe and theUSA (pp. 64–77). Cambridge: Cambridge University Press.
Van Overfelt, W., Annaert, J., De Ceuster, M., & Deloof, M. (2009). Do universalbanks create value? Universal bank affiliation and company performance inBelgium, 1905–1909. Explorations in Economic History , 46 (2), 253–265.
Vanthemsche, G. (1983). De Belgische overheid en de kartels tijdens het interbellum:Situering en analyse van de wetgeving op de verplichte kartelvorming. Revuebelge de Philologie et d’Histoire, 61 (4), 851–894.
Vanthemsche, G. (1995). De geschiedenis van de Belgische werkgeversorganisaties:Ankerpunten en onderzoekshorizonten. NEHA-Bulletin, 9 (1), 3–20.
Wibail, A. (1934). L’évolution économique de l’industrie charbonnière Belge depuis1831. Bulletin de l’Institut des Sciences Économiques , 6 (1), 3–30.
Yarmie, A. H. (1980). Employers’ organizations in mid-Victorian England. Interna-tional Review of Social History , 25 (2), 209–235.
48
Data sources & government reports
Administration des Mines. (1831–1933). Inventaire des archives de la deuxième in-spection générale des mines: Liège (1831–1933). Brussels: State Archives inBelgium, Brussels. (BE-A0510.254, Series 101–124 & 179–204)
Administration des Mines. (1896–1913). Annales des mines de Belgique. Brussels:Ministère de l’Industrie et Travail.
Association charbonnière (...). (1931). L’association charbonnière et l’industrie houil-lière des bassins de Charleroi et de la Basse-Sambre. Couillet: Éditions SogédiS.A.
Demeur, A. (1878). Les sociétés commerciales de la Belgique: Années 1876, 1877,1878. Brussels: Chez l’Éditeur.
Laureyssens, J. (1975). Industriële naamloze vennootschappen in België 1819-1857(Vol. 78). Leuven: Nauwelaerts.
Ministère de l’Intérieur. (1846). Enquête sur la condition des classes ouvrières etsur le travail des enfants. Tome II: Réponses, mémoires et rapports des cham-bres de commerce, des ingénieurs des mines et des colleges médicaux. Brussels:Imprimerie de Th. Lesigne.
Ministère des Travaux Publics. (1869). Résultats de l’enquête ouverte par les officiersde Corps des Mines mines sur la situation des ouvriers dans les mines et lesusines métallurgiques de la Belgique. Brussels: Imprimerie Bruylant-Christopheet Compagnie.
Office du Travail. (1896a). Recensement général des industries & des métiers (31octobre 1896): Volume II: Répartion par commune des industries et des métiers:Hainaut, Liège, Limbourg, Luxembourg, Namur. Brussels: Hayez.
Office du Travail. (1896b). Recensement général des industries & des métiers (31octobre 1896): Volume I: Répartion par commune des industries et des métiers:Anvers, Brabant, Flandre Occidentale, Flandre orientale. Brussels: Hayez.
Office du Travail. (1903). Statistique des grèves en Belgique: 1896-1900. Brussels: J.Lebègue & Compagnie.
Office du Travail. (1907). Statistique des grèves en Belgique: 1901-1905. Brussels: J.Lebègue & Compagnie.
Office du Travail. (1911). Statistique des grèves et lock-out en Belgique: 1906-1910.Brussels: J. Lebègue & Compagnie.
Recueil Financier. (1893). Le recueil financier annuel: 1893-1894. Brussels:l’Industrie.
Statistique de la Belgique. (1858). Mines, minières, usines minéralurgiques et machinesà vapeur: 1851 à 1855. Brussels: Ministre de l’Intérieur.
49
Union des charbonnages (...). (1869–1913). Bulletin de l’Union des charbonnages,mines et usines métallurgiques de la province de Liège. Liège: Imprimerie H.Vaillant-Carmanne.
50
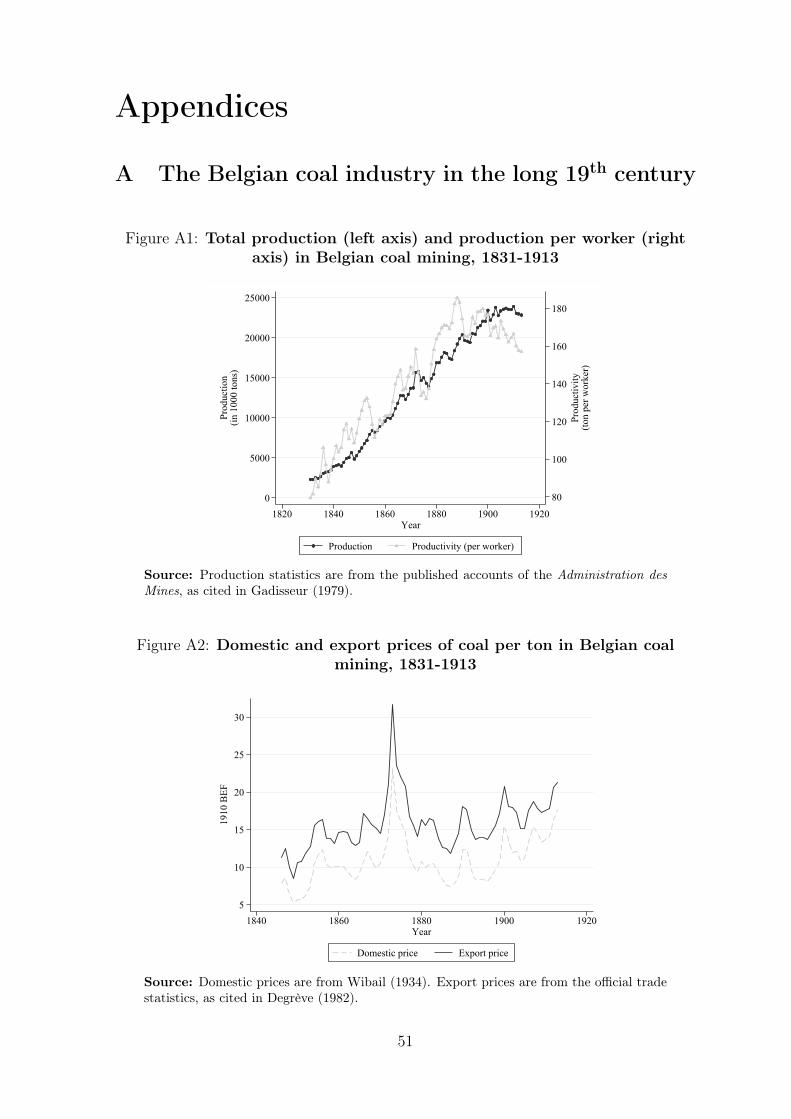
Appendices
A The Belgian coal industry in the long 19th century
Figure A1: Total production (left axis) and production per worker (rightaxis) in Belgian coal mining, 1831-1913
80
100
120
140
160
180
Prod
uctiv
ity(to
n pe
r wor
ker)
0
5000
10000
15000
20000
25000
Prod
uctio
n(in
100
0 to
ns)
1820 1840 1860 1880 1900 1920Year
Production Productivity (per worker)
Source: Production statistics are from the published accounts of the Administration desMines, as cited in Gadisseur (1979).
Figure A2: Domestic and export prices of coal per ton in Belgian coalmining, 1831-1913
5
10
15
20
25
30
1910
BEF
1840 1860 1880 1900 1920Year
Domestic price Export price
Source: Domestic prices are from Wibail (1934). Export prices are from the official tradestatistics, as cited in Degrève (1982).
51
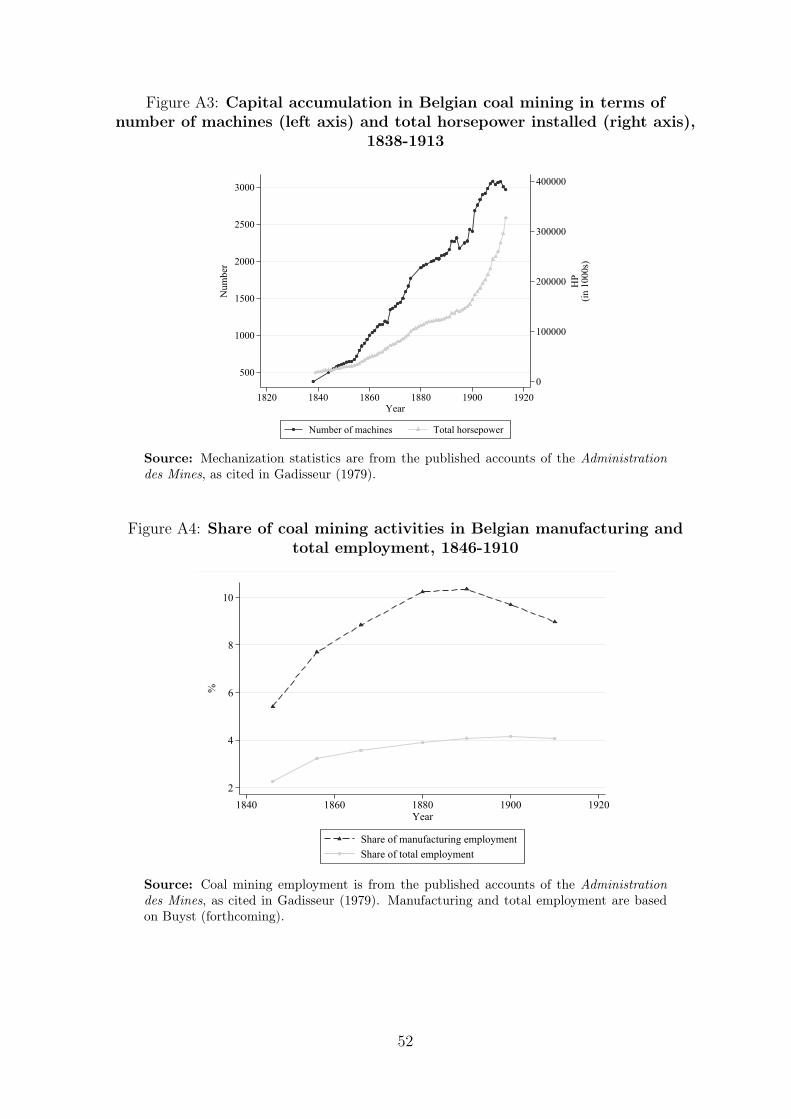
Figure A3: Capital accumulation in Belgian coal mining in terms ofnumber of machines (left axis) and total horsepower installed (right axis),
1838-1913
0
100000
200000
300000
400000
HP
(in 1
000s
)
500
1000
1500
2000
2500
3000
Num
ber
1820 1840 1860 1880 1900 1920Year
Number of machines Total horsepower
Source: Mechanization statistics are from the published accounts of the Administrationdes Mines, as cited in Gadisseur (1979).
Figure A4: Share of coal mining activities in Belgian manufacturing andtotal employment, 1846-1910
2
4
6
8
10
%
1840 1860 1880 1900 1920Year
Share of manufacturing employmentShare of total employment
Source: Coal mining employment is from the published accounts of the Administrationdes Mines, as cited in Gadisseur (1979). Manufacturing and total employment are basedon Buyst (forthcoming).
52
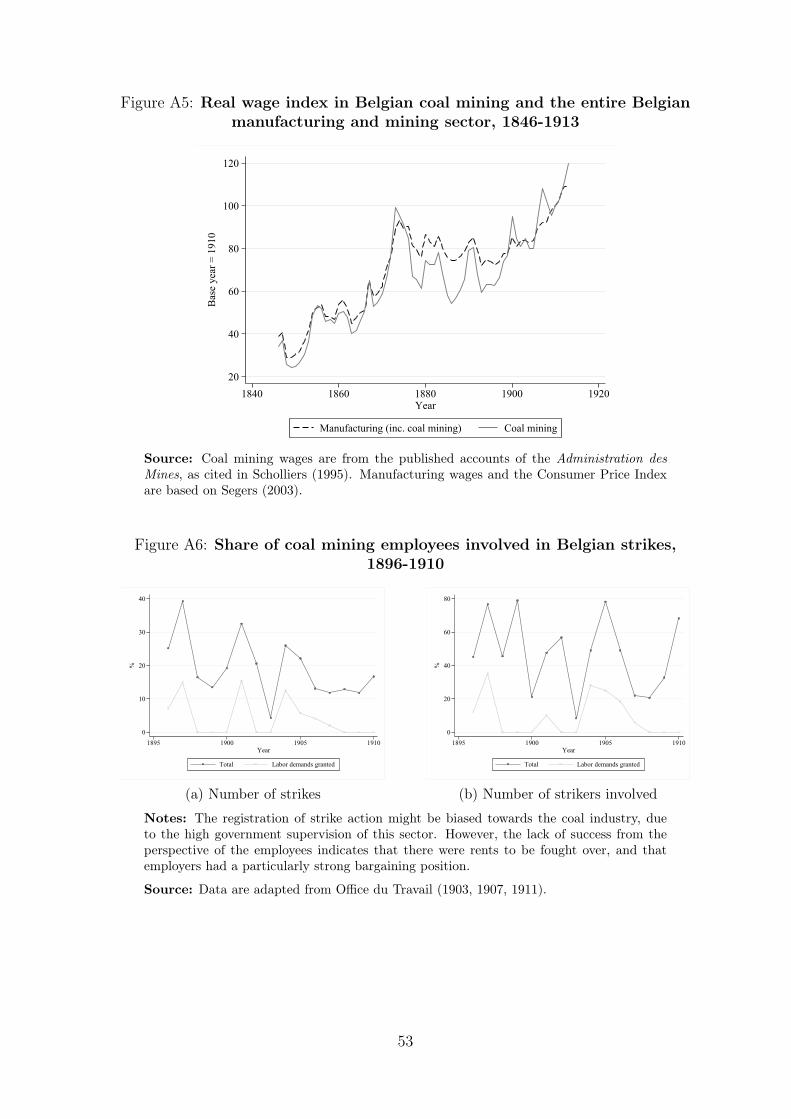
Figure A5: Real wage index in Belgian coal mining and the entire Belgianmanufacturing and mining sector, 1846-1913
20
40
60
80
100
120
Bas
e ye
ar =
191
0
1840 1860 1880 1900 1920Year
Manufacturing (inc. coal mining) Coal mining
Source: Coal mining wages are from the published accounts of the Administration desMines, as cited in Scholliers (1995). Manufacturing wages and the Consumer Price Indexare based on Segers (2003).
Figure A6: Share of coal mining employees involved in Belgian strikes,1896-1910
0
10
20
30
40
%
1895 1900 1905 1910Year
Total Labor demands granted
(a) Number of strikes
0
20
40
60
80
%
1895 1900 1905 1910Year
Total Labor demands granted
(b) Number of strikers involved
Notes: The registration of strike action might be biased towards the coal industry, dueto the high government supervision of this sector. However, the lack of success from theperspective of the employees indicates that there were rents to be fought over, and thatemployers had a particularly strong bargaining position.
Source: Data are adapted from Office du Travail (1903, 1907, 1911).
53
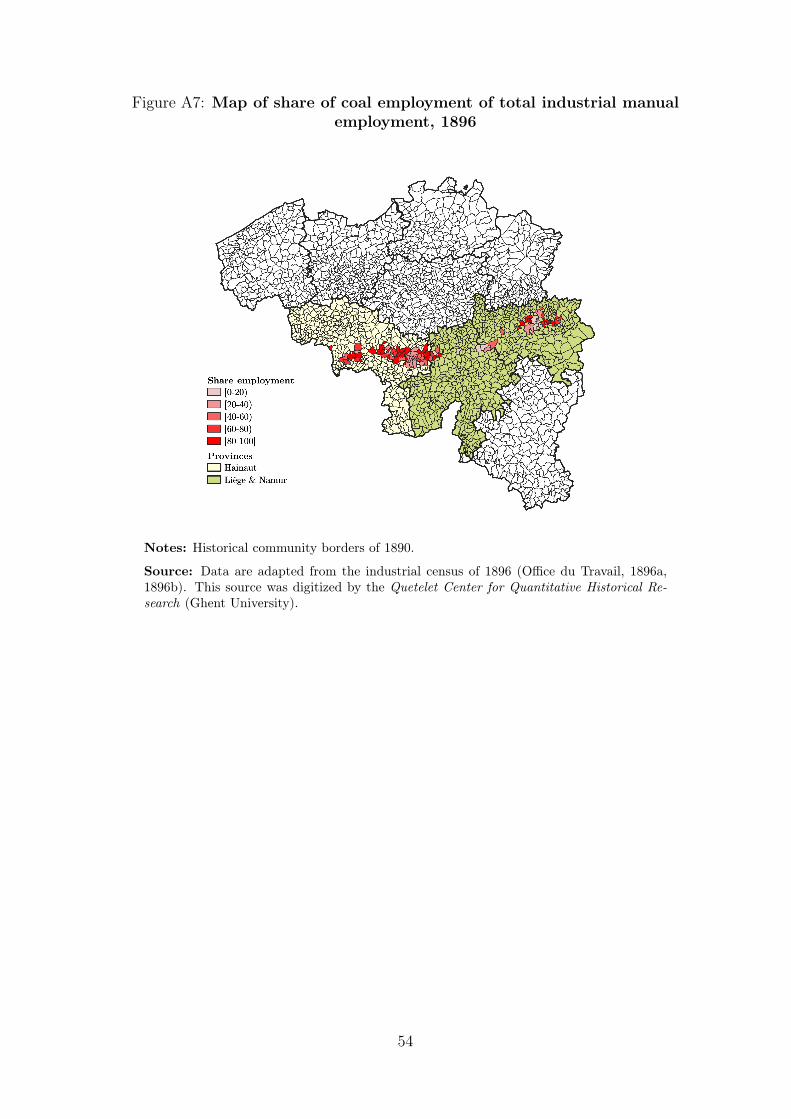
Figure A7: Map of share of coal employment of total industrial manualemployment, 1896
Notes: Historical community borders of 1890.
Source: Data are adapted from the industrial census of 1896 (Office du Travail, 1896a,1896b). This source was digitized by the Quetelet Center for Quantitative Historical Re-search (Ghent University).
54
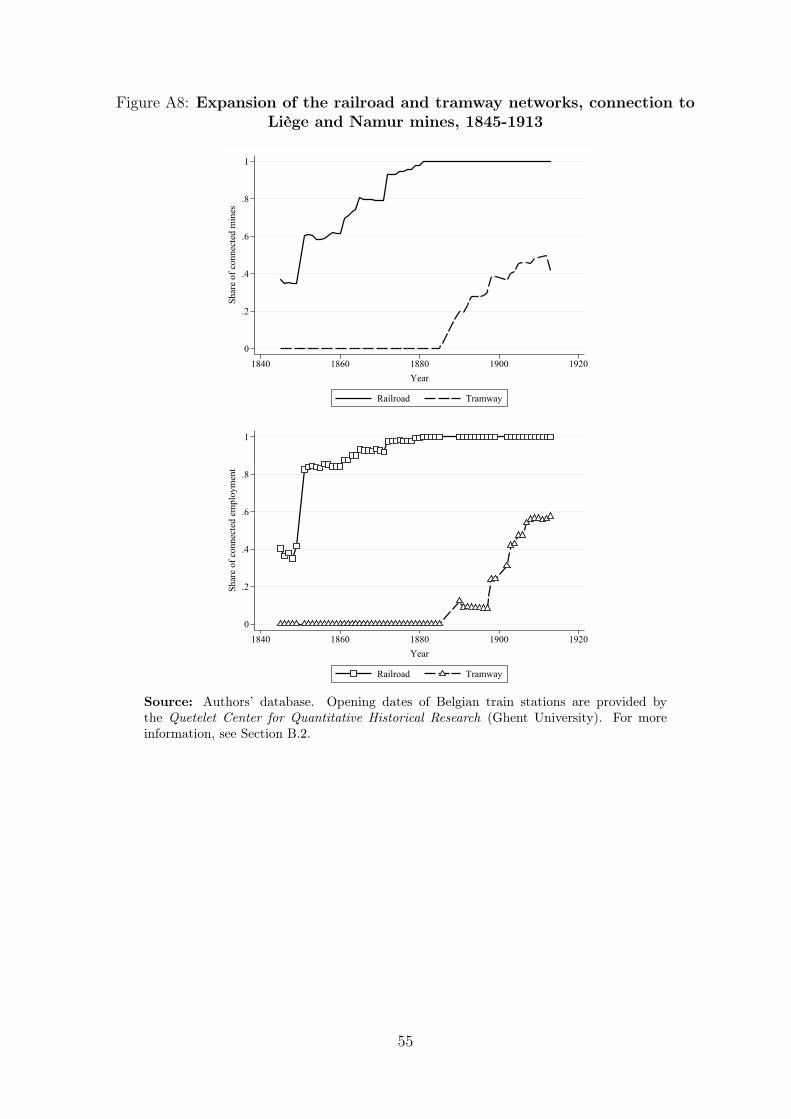
Figure A8: Expansion of the railroad and tramway networks, connection toLiège and Namur mines, 1845-1913
0
.2
.4
.6
.8
1
Shar
e of
con
nect
ed m
ines
1840 1860 1880 1900 1920Year
Railroad Tramway
0
.2
.4
.6
.8
1
Shar
e of
con
nect
ed e
mpl
oym
ent
1840 1860 1880 1900 1920Year
Railroad Tramway
Source: Authors’ database. Opening dates of Belgian train stations are provided bythe Quetelet Center for Quantitative Historical Research (Ghent University). For moreinformation, see Section B.2.
55
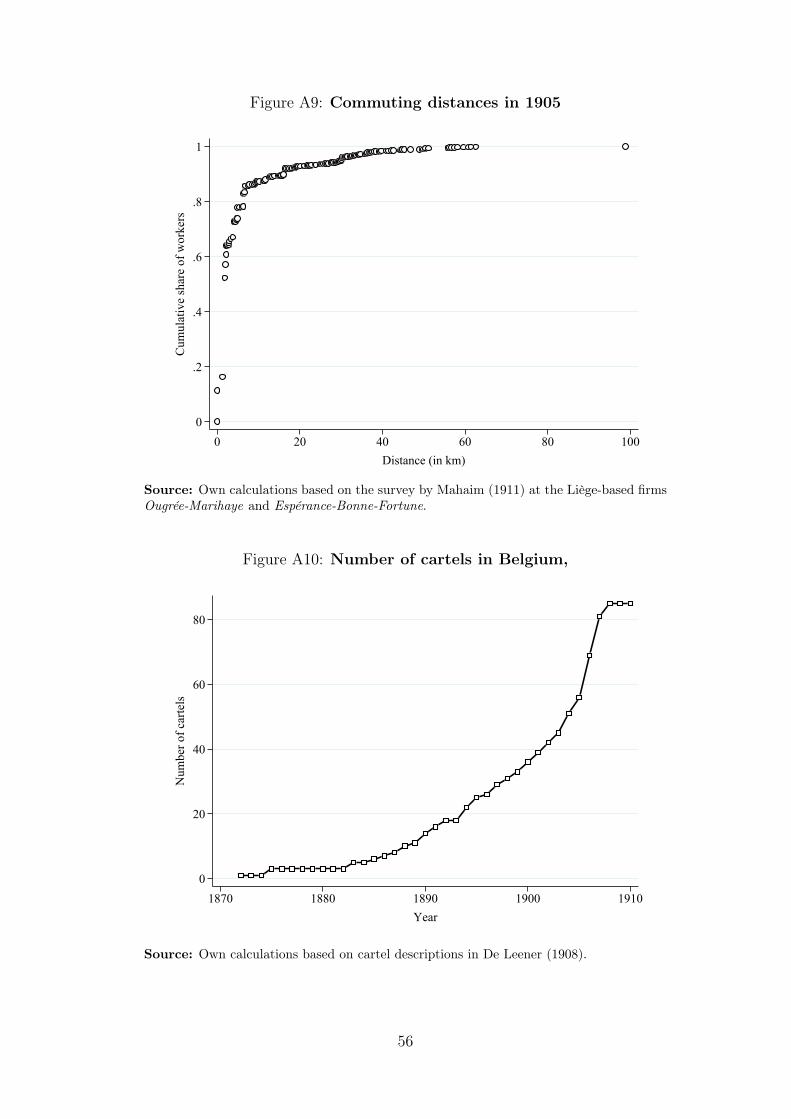
Figure A9: Commuting distances in 1905
0
.2
.4
.6
.8
1
Cum
ulat
ive
shar
e of
wor
kers
0 20 40 60 80 100Distance (in km)
Source: Own calculations based on the survey by Mahaim (1911) at the Liège-based firmsOugrée-Marihaye and Espérance-Bonne-Fortune.
Figure A10: Number of cartels in Belgium,
0
20
40
60
80
Num
ber o
f car
tels
1870 1880 1890 1900 1910Year
Source: Own calculations based on cartel descriptions in De Leener (1908).
56
B Data
B.1 Administration des Mines archives
B.1.1 Historical background
The institutional framework of Belgian coal mining was installed by the French state,
which governed the region from 1794 to 1814. By law of 28 July 1791, all mineral
resources belonged to the state, and could only be exploited under concession and
surveillance of the state. Accordingly, the Conseil des Mines was founded: this gov-
ernment institute dispatched inspectors and mining engineers to all mining concessions
on a yearly basis. While these visits were initially of a rather advisory nature, the role
of the mine inspection would gradually be expanded towards an effective supervision
unit in terms of “vices, dangers or abuses” by the end of the French period (Caulier-
Mathy, 1971, 117).67 The fall of the French empire, and Belgium’s annexation to
the Netherlands, would not have a major impact on the French mining legislation in
place, (Leboutte, 1991, 707).68 In fact, the new Belgian government would call to life
the Conseil des Mines de Belgique by the law of 2 May 1837, which would fill the
institutional gap left behind by its French counterpart (Geerkens et al., 2020, 293).
Due to its French roots, the close supervision of the mining industry presents us
with a valuable exception on the aforementioned laissez-faire principles of the Belgian
state. Crucially, this translated into a vast body of statistical inquiries and visit re-
ports. We leverage this archival information to construct a micro-level panel data set,
covering all coal mining activities in Liège and Namur on a yearly basis. The oldest
consistent data we could retrieve, traces back to 1845, allowing us to build a compre-
hensive data set from 1845 to 1913. This endeavour was facilitated by the consistent
nature of reporting by the engineers of the Administration des Mines, allowing for the
67Important was the law of 21 April 1810, which imposed a set of requirements (cahier de charges)on mine exploitations to guarantee their competencies. Official engineers were tasked to verifyand enforce these regulations under the banner of the Administration des Mines, established on3 January 1813.
68From a governance perspective, some changes were implemented as most state engineers quit Bel-gium after the retreat of the imperial army in 1814. The French engineer Boüesnel would,however, stay and be appointed Chief Engineer under Dutch rule. He would subsequently alsoenter Belgian service, providing continuity and knowledge transfers to the mining department(Delrée & Linard de Guertechin, 1963, 54-55).
57
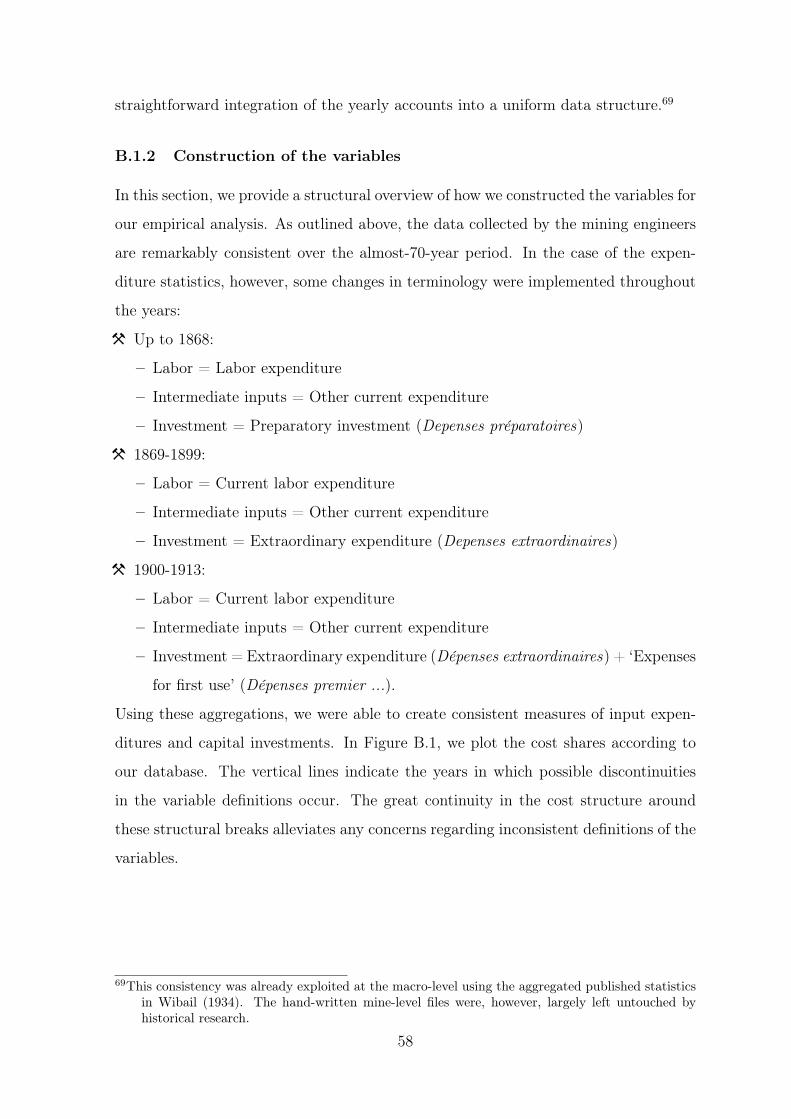
straightforward integration of the yearly accounts into a uniform data structure.69
B.1.2 Construction of the variables
In this section, we provide a structural overview of how we constructed the variables for
our empirical analysis. As outlined above, the data collected by the mining engineers
are remarkably consistent over the almost-70-year period. In the case of the expen-
diture statistics, however, some changes in terminology were implemented throughout
the years:
³ Up to 1868:
– Labor = Labor expenditure
– Intermediate inputs = Other current expenditure
– Investment = Preparatory investment (Depenses préparatoires)
³ 1869-1899:
– Labor = Current labor expenditure
– Intermediate inputs = Other current expenditure
– Investment = Extraordinary expenditure (Depenses extraordinaires)
³ 1900-1913:
– Labor = Current labor expenditure
– Intermediate inputs = Other current expenditure
– Investment = Extraordinary expenditure (Dépenses extraordinaires) + ‘Expenses
for first use’ (Dépenses premier ...).
Using these aggregations, we were able to create consistent measures of input expen-
ditures and capital investments. In Figure B.1, we plot the cost shares according to
our database. The vertical lines indicate the years in which possible discontinuities
in the variable definitions occur. The great continuity in the cost structure around
these structural breaks alleviates any concerns regarding inconsistent definitions of the
variables.
69This consistency was already exploited at the macro-level using the aggregated published statisticsin Wibail (1934). The hand-written mine-level files were, however, largely left untouched byhistorical research.
58
Figure B.1: Structural composition of the expenses, 1845-1913
0
50000
100000
150000(in
100
0s 1
910B
EF)
1840 1860 1880 1900 1920Year
LaborIntermediate inputInvestment
Source: Authors’ database.
59
B.1.3 Concession and firm composition
As outlined in Section B.2, Belgium’s coal mining sector was organized around con-
cessions, in which firms conditionally received mining rights to the state’s mineral
resources. The general regulation was thus generally organized according to these con-
cessions. Such concessions were typically independent and separate production units,
with their own respective directeurs des travaux (managers). In the main analysis, we
consequently considered these concessions to be independent firms.
Nevertheless, it is important to emphasize that this assumption potentially dis-
cards certain firm dynamics regarding the acquisition and merger of mining conces-
sions. Firms were legally allowed to own multiple concessions70, and this implies that
our estimates of employer collusion are potentially biased upwards by within-firm co-
ordination. We argue, however, that this is not a likely driver behind our observations
on the ubiquity of collusive wage-setting. For the period 1896-1913, we do have access
to comprehensive accounts of active mining concessions and their respective sociétés
exploitantes (exploiting firms), in the form of the Tableaux des mines de houille en ac-
tivité (Administration des Mines, 1896–1913). Table B.1 reveals that, for the bassins
of Liège and Namur, all but one firm exploited a single concession in 1896. By 1913
(see Table B.2), there were still only two exceptions to this rule.71 This confirms that
our empirical evidence on employer collusion for this period is not driven merely by
labor market coordination across concessions within single firms.
Going back in time, however, our view on the firm-concession relationship becomes
somewhat more obscure. Fortunately, we were able to reconstruct the histories of most
Liège- and Namur-based Sociétés Anonymes (or S.A., an equivalent to public compa-
nies). This type of enterprise was very popular among the biggest coal companies, as
it facilitated funds acquisition the in the capital-intensive business of mining. In other
words, the biggest holdings - which are arguably the most likely to have exploited
multiple concessions - are covered by our manually collected database of 19th-century70Article 31 in the law of 21 April 1810 reads:
Several concessions may be brought together in the hands of the same concessionaire,either as an individual or as a representative of a company, but at the expense of main-taining the operation of each concession.
71Multiple-concession firms appear to have been located primarily in the Bassin du Couchant deMons, not surprisingly the area in which universal banks had the strongest hold on the coalindustry: we return to this issue of inter-firm ownership below.
60
public coal companies.
In general, it appears that firms preferred to unite concessions under their su-
pervision, as “their reunion and a single concession can only be advantageous to the
good development and economic exploitation of the mine”.72 Specific reasons include
the removal of fences (for example, see Demeur, 1878, 672), the ability to mine veins
under concession borders (for example, see Recueil Financier, 1893, 159), as well as
administrative simplicity in terms of government supervision. As a consequence, most
firm mergers or acquisitions were actually followed by the unification of the firms’
concessions as well.73
A more prevalent connection between the concessions in our database appeared
to have in been the form of common and, more importantly, inter-firm ownership.
Collusion due to common ownership is probable if powerful investment banks had
a strong hand in multiple exploitations. As discussed in Section 3.1, Hainaut-based
coal firms with their mutual ties to the Société Générale de Belgique were indeed
openly colluding in wage setting. In the case of Liège- and Namur-based coal mining,
however, this appears to have been less apparent. Our analysis of the portfolio of the
Société Générale, by far the most powerful and omnipresent universal bank in 19th-
century Belgium (Van Overfelt, Annaert, De Ceuster, & Deloof, 2009), reveals that
its involvement in coal mining was strongly confined to the aforementioned bassins
in Hainaut.74 In Figure B.2, we decompose coal production in Liège and Namur by
whether a firm had some financial ties (in the form of stock ownership) with the
Société Générale. This illustrates that the universal bank’s control over this industry
was limited, and that its development over time does little to explain the observed
employer collusion surge after the turn of the century. This conclusion aligns with
historical appraisals of the industrial relations in Liège during that era (Kurgan-van
Hentenryk & Puissant, 1990).
72This is a quote from the royal decree regarding the unification of the concessions from the SA descharbonnages de la Chartreuse et Violette (Demeur, 1878, 680-681).
73For examples, see the aforementioned case of SA des charbonnages de la Chartreuse et Violette, aswell as the SA des charbonnages de Bonne-Fin, who fully acquired the concession of Baneux inAugust 1863. Early next year, the concessions of Bonne-Fin and Baneux were accordingly united(Laureyssens, 1975, 139).
74We thank Gertjan Verdickt and the StudieCentrum voor Onderneming en Beurs or SCOB (Uni-versity of Antwerp) for help with this data.
61
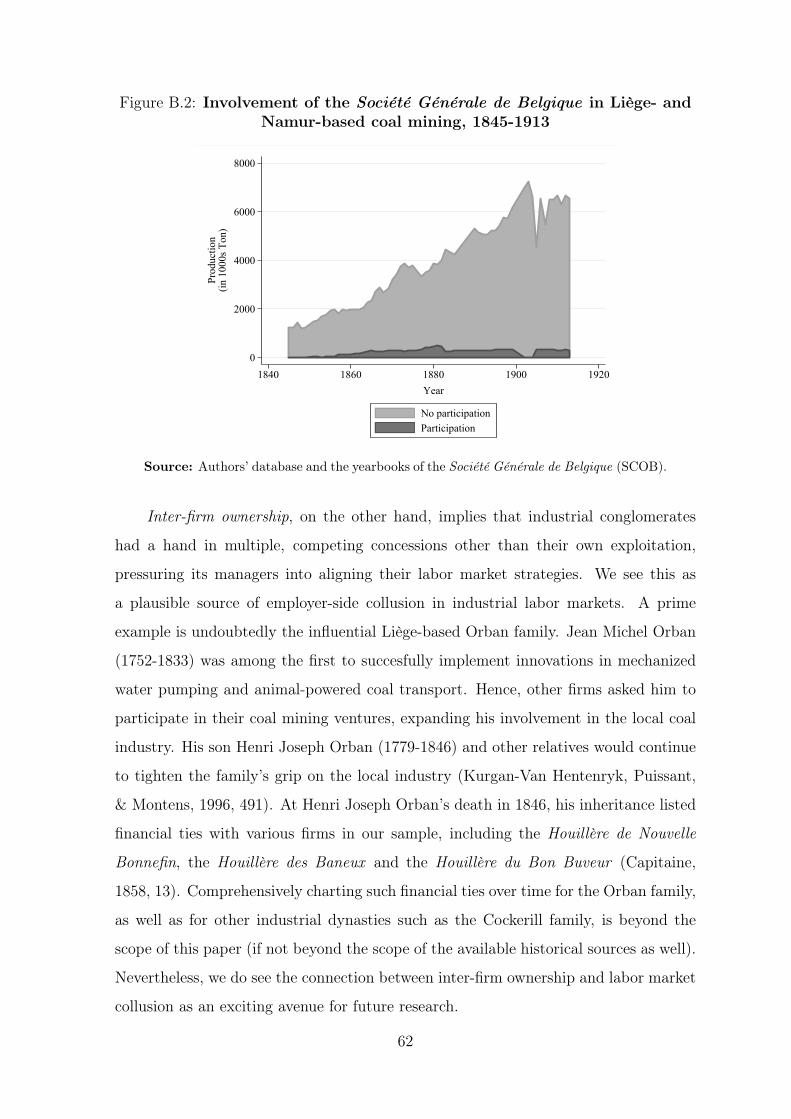
Figure B.2: Involvement of the Société Générale de Belgique in Liège- andNamur-based coal mining, 1845-1913
0
2000
4000
6000
8000
Prod
uctio
n(in
100
0s T
on)
1840 1860 1880 1900 1920Year
No participationParticipation
Source: Authors’ database and the yearbooks of the Société Générale de Belgique (SCOB).
Inter-firm ownership, on the other hand, implies that industrial conglomerates
had a hand in multiple, competing concessions other than their own exploitation,
pressuring its managers into aligning their labor market strategies. We see this as
a plausible source of employer-side collusion in industrial labor markets. A prime
example is undoubtedly the influential Liège-based Orban family. Jean Michel Orban
(1752-1833) was among the first to succesfully implement innovations in mechanized
water pumping and animal-powered coal transport. Hence, other firms asked him to
participate in their coal mining ventures, expanding his involvement in the local coal
industry. His son Henri Joseph Orban (1779-1846) and other relatives would continue
to tighten the family’s grip on the local industry (Kurgan-Van Hentenryk, Puissant,
& Montens, 1996, 491). At Henri Joseph Orban’s death in 1846, his inheritance listed
financial ties with various firms in our sample, including the Houillère de Nouvelle
Bonnefin, the Houillère des Baneux and the Houillère du Bon Buveur (Capitaine,
1858, 13). Comprehensively charting such financial ties over time for the Orban family,
as well as for other industrial dynasties such as the Cockerill family, is beyond the
scope of this paper (if not beyond the scope of the available historical sources as well).
Nevertheless, we do see the connection between inter-firm ownership and labor market
collusion as an exciting avenue for future research.
62
Figure B.3: Example of one of the count sheets of the Administration des Mines
Source: Administration des Mines (1831–1933, Series 103).
63

Table B.1: Concession and firm concordance in Liège and Namur, 1896
Bassin & District Concession Firm
Bassin de Namur 5 Hazard SC du charbonnage du Hazard5 Auvelais Saint-Roch SA des charbonnages de Saint-Roch-Auvelais5 Falisolle SA du charbonnage de Falisolle5 Arsimont SA du charbonnage d’Arsimont5 Ham-sur-Sambre SA des charbonnages de Ham-sur-Sambre et Moustier5 Malonne SA des charbonnages de Malonne et Floreffe5 Le Château SC du charbonnage de Château5 Basse-Marlagne SC du charbonnage de Basse-Marlagne5 Stud-Rouvroy SC du charbonnage de Stud-Rouvroy5 Andenelle SC du charbonnage d’Andenelle5 Groynne SC du charbonnage de Groynne
Bassin de Liège 6 Bonnier SA du charbonnage du Bonnier6 Sarts-au-Berleur SA du charbonnage du Corbeau-au-Berleur6 Gosson-Lagasse SA des charbonnages de Gosson Lagasse6 Horloz SA des charbonnages du Horloz6 Kessales-Artistes SA des charbonnages des Kessales6 Concorde SA des charbonnages réunis de la Concorde6 Nouvelle-Montagne SA de Nouvelle-Montagne6 Halbosart Famille Farcy6 Ben Desoer et Compagnie6 Marihaye SA des charbonnages de Marihaye6 Bois de Gives et Saint-Paul SC des charbonnages de Gives et Saint-Paul7 Angleur SA des charbonnages d’Angleur7 Sclessin-Val Benoit SA des charbonnages du Bois d’Avroy7 Espérance et Bonne Fortune SA des charbonnages d’Espérance et Bonne Fortune7 La Haye SA des charbonnages de La Haye7 Patience-Beaujonc SA des charbonnages de Patience-Beaujonc7 Bonne-Fin Bâneux SA des charbonnages de Bonne-Fin7 Ans et Glain SA des Mines de houile d’Ans7 Grande-Bacnure SA de la Grande Bacnure7 Petite-Bacnure SA des charbonnages de la Petite Bacnure7 Belle-Vue et Bien Venue SA des charbonnages de Belle-Vue et Bien-Venue7 Espérance (Herstal) SA de Bonne-Espérance et Batterie7 Batterie SA de Bonne-Espérance et Batterie7 Abhooz et Bonne-Foi-Hareng SA des charbonnages d’Abhooz et Bonne-Foi-Hareng7 Bicquet-Gorée SA des charbonnages d’Oupeye8 Cockerill SA John Cockerill8 Cowette-Rufin SC de Cowette-Rufin, Grand-Henri8 Crahay SA de Maireux et Bas-Bois8 Hasard-Melin SA du Hasard8 Herman-Pixherotte SC de Herman-Pixherotte8 Herve-Wergifosse SA de Herve-Wergifosse8 Lonette SA de Lonette8 Micheroux SA dus Bois de Micheroux8 Minerie SA de la Minerie8 Ougrée SA d’Ougrée8 Près de Fléron SC des Près de Fléron8 Quatre Jean SA des Quatre Jean8 Six-Bonniers Société charbonnière des Six-Bonniers8 Steppes SC du canal de Fond-Piquette8 Trou-Souris-Houlleux-Homvent Charbonnages réunis de l’Est de Liège8 Wandre Suermondt, frères8 Wérister SA de Wérister
Notes: Sociétés Anonymes and Sociétés Civiles are abbreviated as SA and SC respectively.Firms underlined and in blue are multiple-concession firms.
Source: Annales des Mines de Belgique (1896–1913, vol. I).
64
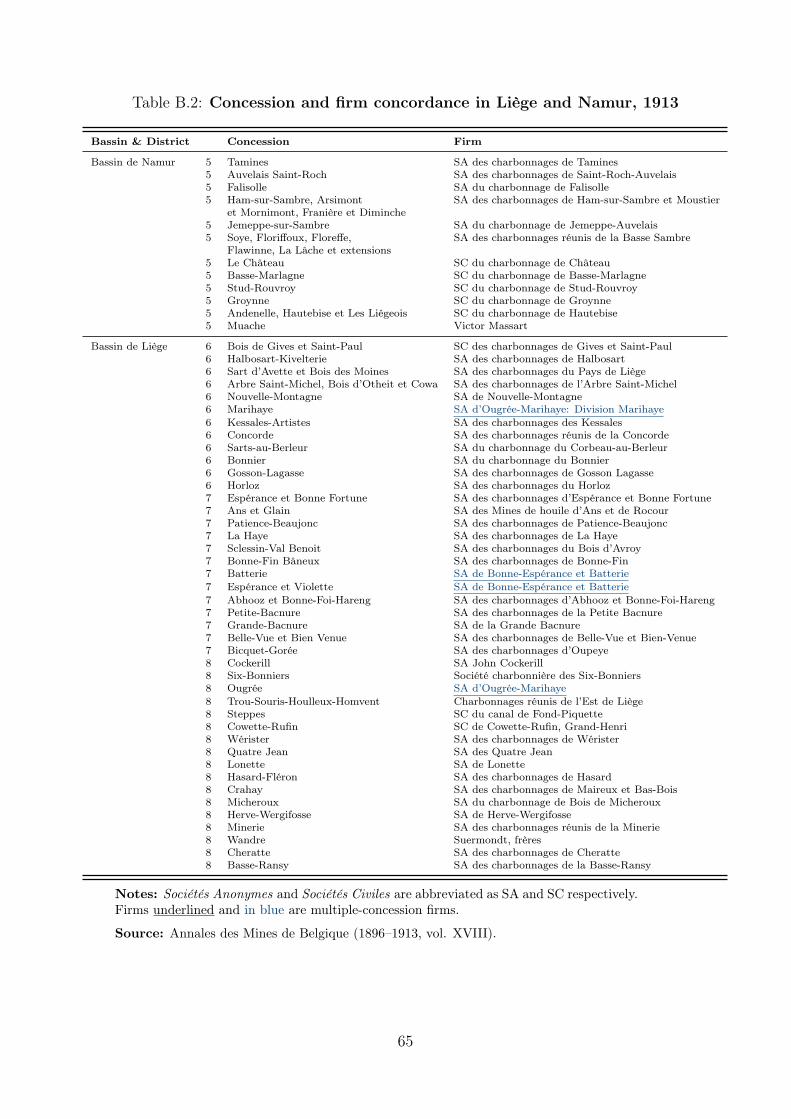
Table B.2: Concession and firm concordance in Liège and Namur, 1913
Bassin & District Concession Firm
Bassin de Namur 5 Tamines SA des charbonnages de Tamines5 Auvelais Saint-Roch SA des charbonnages de Saint-Roch-Auvelais5 Falisolle SA du charbonnage de Falisolle5 Ham-sur-Sambre, Arsimont SA des charbonnages de Ham-sur-Sambre et Moustier
et Mornimont, Franière et Diminche5 Jemeppe-sur-Sambre SA du charbonnage de Jemeppe-Auvelais5 Soye, Floriffoux, Floreffe, SA des charbonnages réunis de la Basse Sambre
Flawinne, La Lâche et extensions5 Le Château SC du charbonnage de Château5 Basse-Marlagne SC du charbonnage de Basse-Marlagne5 Stud-Rouvroy SC du charbonnage de Stud-Rouvroy5 Groynne SC du charbonnage de Groynne5 Andenelle, Hautebise et Les Liégeois SC du charbonnage de Hautebise5 Muache Victor Massart
Bassin de Liège 6 Bois de Gives et Saint-Paul SC des charbonnages de Gives et Saint-Paul6 Halbosart-Kivelterie SA des charbonnages de Halbosart6 Sart d’Avette et Bois des Moines SA des charbonnages du Pays de Liège6 Arbre Saint-Michel, Bois d’Otheit et Cowa SA des charbonnages de l’Arbre Saint-Michel6 Nouvelle-Montagne SA de Nouvelle-Montagne6 Marihaye SA d’Ougrée-Marihaye: Division Marihaye6 Kessales-Artistes SA des charbonnages des Kessales6 Concorde SA des charbonnages réunis de la Concorde6 Sarts-au-Berleur SA du charbonnage du Corbeau-au-Berleur6 Bonnier SA du charbonnage du Bonnier6 Gosson-Lagasse SA des charbonnages de Gosson Lagasse6 Horloz SA des charbonnages du Horloz7 Espérance et Bonne Fortune SA des charbonnages d’Espérance et Bonne Fortune7 Ans et Glain SA des Mines de houile d’Ans et de Rocour7 Patience-Beaujonc SA des charbonnages de Patience-Beaujonc7 La Haye SA des charbonnages de La Haye7 Sclessin-Val Benoit SA des charbonnages du Bois d’Avroy7 Bonne-Fin Bâneux SA des charbonnages de Bonne-Fin7 Batterie SA de Bonne-Espérance et Batterie7 Espérance et Violette SA de Bonne-Espérance et Batterie7 Abhooz et Bonne-Foi-Hareng SA des charbonnages d’Abhooz et Bonne-Foi-Hareng7 Petite-Bacnure SA des charbonnages de la Petite Bacnure7 Grande-Bacnure SA de la Grande Bacnure7 Belle-Vue et Bien Venue SA des charbonnages de Belle-Vue et Bien-Venue7 Bicquet-Gorée SA des charbonnages d’Oupeye8 Cockerill SA John Cockerill8 Six-Bonniers Société charbonnière des Six-Bonniers8 Ougrée SA d’Ougrée-Marihaye8 Trou-Souris-Houlleux-Homvent Charbonnages réunis de l’Est de Liège8 Steppes SC du canal de Fond-Piquette8 Cowette-Rufin SC de Cowette-Rufin, Grand-Henri8 Wérister SA des charbonnages de Wérister8 Quatre Jean SA des Quatre Jean8 Lonette SA de Lonette8 Hasard-Fléron SA des charbonnages de Hasard8 Crahay SA des charbonnages de Maireux et Bas-Bois8 Micheroux SA du charbonnage de Bois de Micheroux8 Herve-Wergifosse SA de Herve-Wergifosse8 Minerie SA des charbonnages réunis de la Minerie8 Wandre Suermondt, frères8 Cheratte SA des charbonnages de Cheratte8 Basse-Ransy SA des charbonnages de la Basse-Ransy
Notes: Sociétés Anonymes and Sociétés Civiles are abbreviated as SA and SC respectively.Firms underlined and in blue are multiple-concession firms.
Source: Annales des Mines de Belgique (1896–1913, vol. XVIII).
65
B.2 Other sources
³ Membership of the Union des charbonnages
To quantify membership of the l’Union des charbonnages, mines et usines métal-
lurgiques de la province de Liège throughout the years, we constructed a yearly binary
membership variable for each firm in our data set. In their monthly Bulletin publica-
tions (1869–1913), the organization disseminated the minutes of its meetings, as well
as noteworthy news in the local coal industry. On a yearly basis, a complete list of
its members was also published. We used the latter as a source for our membership
variable.
³ Employers’ associations in Namur
Most bassins in Belgium had their own respective employers’ organizations, much like
the Union. However, the smaller and diluted Namur coal industry - the other bassin in
our data set next to Liège, Basse-Sambre - was an exception. The Charleroi-based As-
sociation des charbonnages du bassin de Charleroi did attempt to gain control over this
area. In order to attract more Namur-based coal mines, the organization changed their
name into L’Association charbonnière et l’industrie houillière des bassins de Charleroi
et de la Basse-Sambre (Association charbonnière (...), 1931, 30). Membership lists of
said organization reveal that the reach of these efforts was very limited in terms of
membership, however.
³ Access to the railroad network
We assigned the coal mines’ location to their respective communities. The transport
database of the Quetelet Center for Quantitative Historical Research (Ghent Univer-
sity) gives us access to the opening years of all train and tramway stations in Belgium.
Combining these two pieces of information, we were able to retrace all coal mines’
approximate year of connection to the Belgian railroad network.
³ Cartel membership
The work of contemporary economist Georges De Leener is without a doubt considered
to be the seminal source on Belgian cartels of that era (for example, see Vanthemsche,
66
1995, 18). We obtain the cartel membership list in 1905 from De Leener (1909). We
trace this cartel membership data back to 1898 by taking into account name changes
of mines, and assume that no firms entered or exited the cartel between 1898-1905.
This results in 27 cartel firms in 1898, which is in line with anecdotal evidence in
De Leener (1904). After 1905, we take into account the exit of the Gosson-Lagasse
mine in 1907, mentioned by De Leener (1909), and for the remainder we assume that
the cartel membership remained stable, as no mention of any other exiters or entrants
was made in De Leener (1909).
67
B.3 Capital stock
In this section, we describe how we construct the capital stock Kft. In every year
between 1846 and 1912, we observe capital investment Ift, from the variable dépenses
extraordinaires. We specify the usual capital accumulation equation:
Kft = Kft−1(1− δ) + Ift
In order to determine the amount of of depreciation, we estimate the capital tran-
sition process for both machine horsepower and equine horsepower. The estimates
are in Table B.3. If no investment has taken place in the previous year, machine
horsepower decreases by 12.7%, and equine horsepower by 15.1%. If there has been
investment in the previous year, machine horsepower increases by 1.7%, but equine
horsepower remains stable: investments in horses were mainly replacement invest-
ments, not expanding the amount of horses used. Given that the depreciation rates
lied around 13%, we set δ = 0.13 in order to calculate the capital stock. For years in
which investment data are missing, we linearly interpolate missing investments.
One problem is which capital stock to assume in the first year of the data set, 1845.
This was most likely not zero. We proceed as follows to find the initial capital stock.
We regress yearly investment on changes in the number of horsepower for excavation
and extraction, K1 and K2, and the change in the number of horses Kh, in order to
recover the price per horse and the price per unit of horsepower for each machine.
Ift = W 1(K1ft −K1
ft−1) +W 2(K2ft −K2
ft−1) +W h(Khft −Kh
ft−1) + uft
Next, we compute the initial capital stock in 1845 as:
Kf,1845 = W 1K1f,1845 +W 2K2
f,1845 +W hKhf,1845
We assume the deflated prices per horse and horsepower are constant across firms and
years. This assumption could be violated if machine technologies became cheaper over
time. However, we only need the price per horsepower and horse in 1845 to construct
the initial capital stock, not the price per horsepower and horse in every year.
68
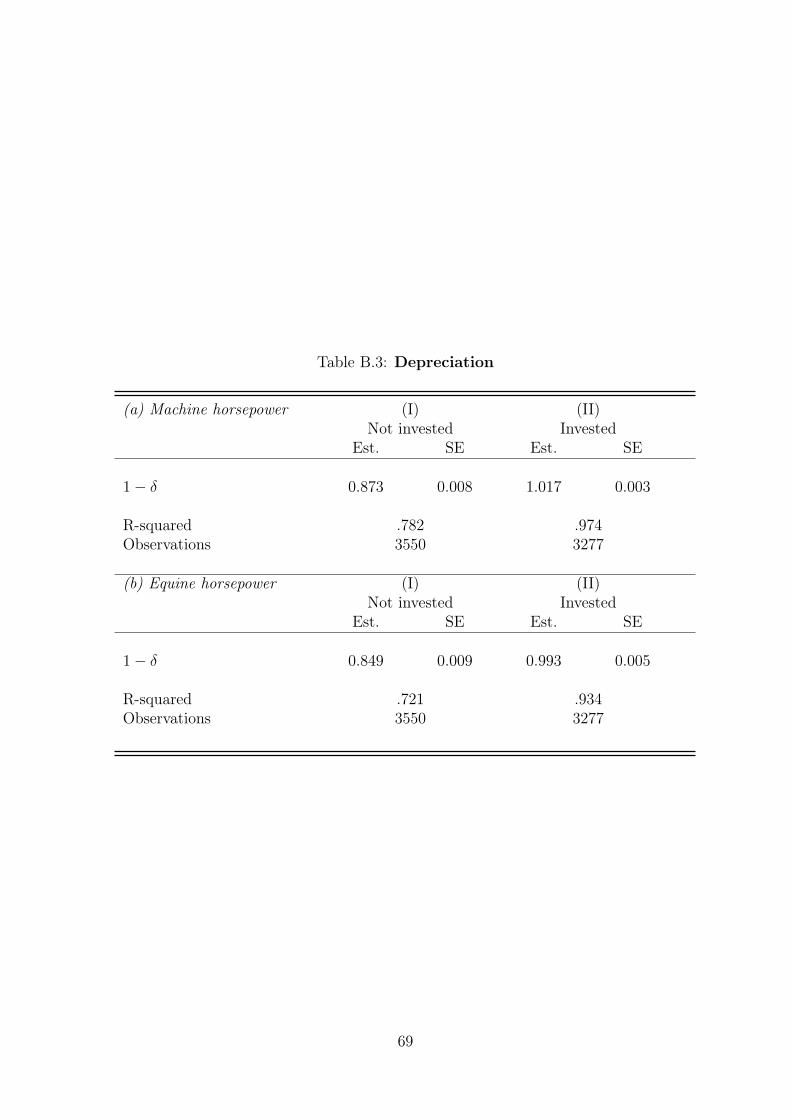
Table B.3: Depreciation
(a) Machine horsepower (I) (II)Not invested Invested
Est. SE Est. SE
1− δ 0.873 0.008 1.017 0.003
R-squared .782 .974Observations 3550 3277
(b) Equine horsepower (I) (II)Not invested Invested
Est. SE Est. SE
1− δ 0.849 0.009 0.993 0.005
R-squared .721 .934Observations 3550 3277
69
C Robustness checks
C.1 Labor market frictions
We propose the following robustness checks to assess the role of search frictions in
our empirical approach. In our main analysis, we assumed that search frictions play
a negligible role. To provide further empirical support to this claim, we assess the
relationship between our collusion estimates and observable variation in search fric-
tions. If our assumption is correct, we should see little to no correlation between both
variables.
A first shift in search frictions is the roll-out of the Belgian train network. Con-
nection to the railroad network allows local employees to switch to their outside option
at a lower cost, which decreases oligopsony power.75 Under the assumption that search
frictions were already sufficiently low, however, we thus expect this channel to have
little quantitative impact on our collusion results.
The case of Belgium is a particularly interesting case to study such impacts of the
roll-out of a transportation network, as the country was an early and keen adopter of
train transportation network. Starting from the 1835 inauguration of the first train
line on the European Continent, the world’s densest transportation network of that era
was rolled out throughout the 19th century. This made that the Belgian labor force
became increasingly mobile, reinforced by a government-subsidized worker ticketing
program (Huberman, 2008). A town’s or mine’s connection to the train network thus
had a potentially vast impact on local labor market dynamics and the potential for
collusion.
We empirically assess this channel as follows. The vector Drrft contains dummies
that indicate whether a coal mine is located in a town that is connected to the railroad
network and the tramway network at time t.76 We regress log employer collusion on
these dummies and alternatively include mine, year, and both mine and year fixed
75See also the study by Brooks, Kaboski, Kondo, Li, and Qian (2021), who find pro-competitiveeffects of the expansion of highways in India.
76We refer to Figure A8 in Appendix A for a graphical representation of this data.
70
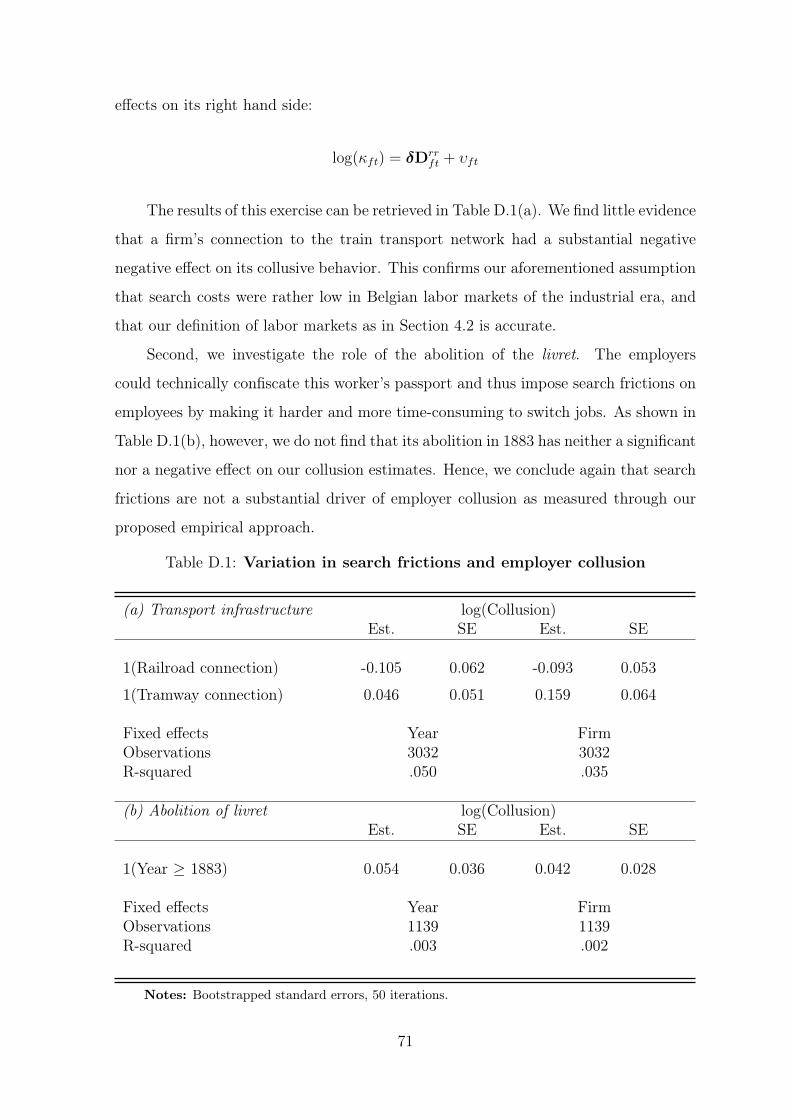
effects on its right hand side:
log(κft) = δDrrft + υft
The results of this exercise can be retrieved in Table D.1(a). We find little evidence
that a firm’s connection to the train transport network had a substantial negative
negative effect on its collusive behavior. This confirms our aforementioned assumption
that search costs were rather low in Belgian labor markets of the industrial era, and
that our definition of labor markets as in Section 4.2 is accurate.
Second, we investigate the role of the abolition of the livret. The employers
could technically confiscate this worker’s passport and thus impose search frictions on
employees by making it harder and more time-consuming to switch jobs. As shown in
Table D.1(b), however, we do not find that its abolition in 1883 has neither a significant
nor a negative effect on our collusion estimates. Hence, we conclude again that search
frictions are not a substantial driver of employer collusion as measured through our
proposed empirical approach.
Table D.1: Variation in search frictions and employer collusion
(a) Transport infrastructure log(Collusion)Est. SE Est. SE
1(Railroad connection) -0.105 0.062 -0.093 0.053
1(Tramway connection) 0.046 0.051 0.159 0.064
Fixed effects Year FirmObservations 3032 3032R-squared .050 .035
(b) Abolition of livret log(Collusion)Est. SE Est. SE
1(Year ≥ 1883) 0.054 0.036 0.042 0.028
Fixed effects Year FirmObservations 1139 1139R-squared .003 .002
Notes: Bootstrapped standard errors, 50 iterations.
71
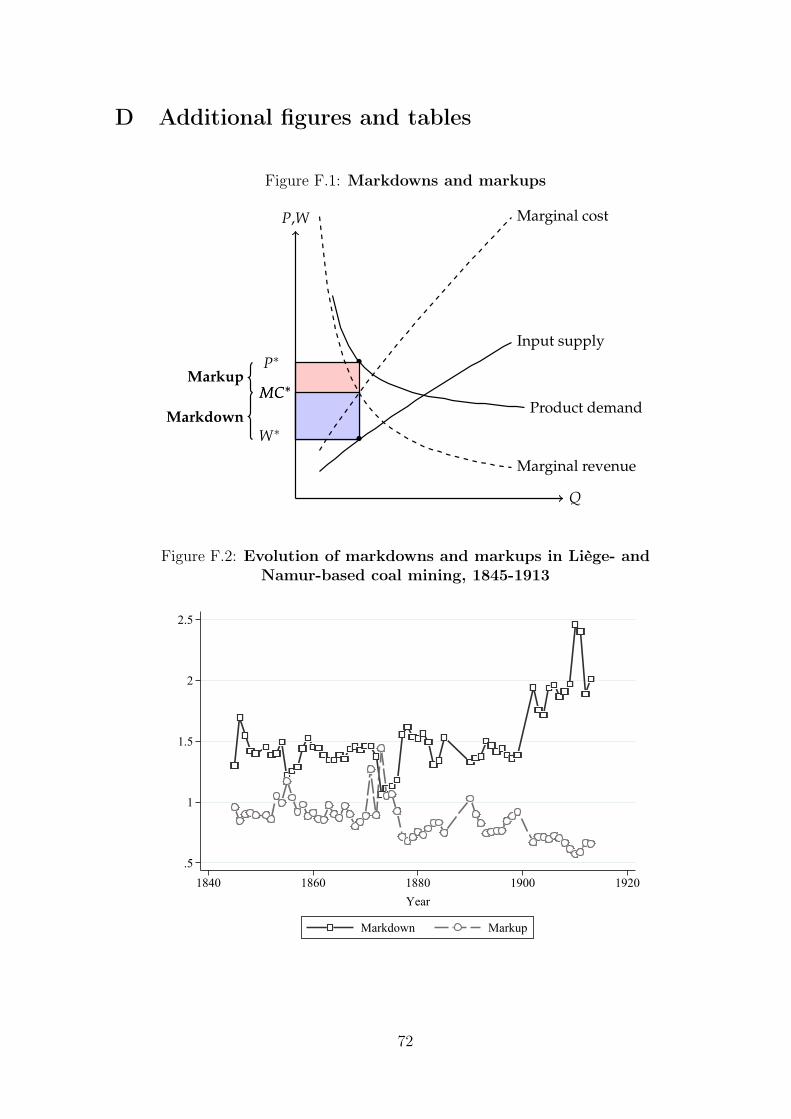
D Additional figures and tables
Figure F.1: Markdowns and markups
•P∗
MC∗MC∗
•W∗
Marginal revenue
Marginal cost
Product demand
Input supply
Q
P,W
Markup
Markdown
Figure F.2: Evolution of markdowns and markups in Liège- andNamur-based coal mining, 1845-1913
.5
1
1.5
2
2.5
1840 1860 1880 1900 1920Year
Markdown Markup
72