comal county - new braunfels isd - 2005 texas school survey of drug and alcohol use
TRANSCRIPT

8/14/2019 COMAL COUNTY - New Braunfels ISD - 2005 Texas School Survey of Drug and Alcohol Use
http://slidepdf.com/reader/full/comal-county-new-braunfels-isd-2005-texas-school-survey-of-drug-and-alcohol 1/114

8/14/2019 COMAL COUNTY - New Braunfels ISD - 2005 Texas School Survey of Drug and Alcohol Use
http://slidepdf.com/reader/full/comal-county-new-braunfels-isd-2005-texas-school-survey-of-drug-and-alcohol 2/114
8/14/2019 COMAL COUNTY - New Braunfels ISD - 2005 Texas School Survey of Drug and Alcohol Use
http://slidepdf.com/reader/full/comal-county-new-braunfels-isd-2005-texas-school-survey-of-drug-and-alcohol 3/114
New BraunfelsSpring 2005
________________________________________________________________________________
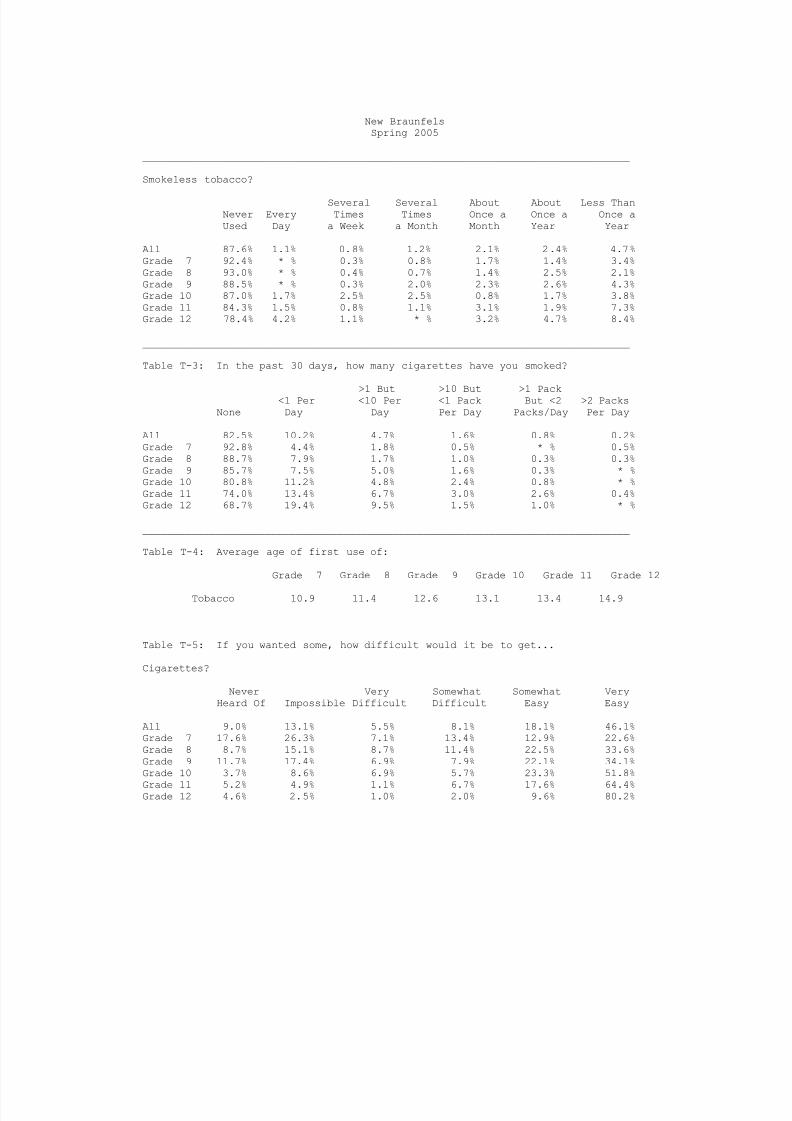
Smokeless tobacco?
Several Several About About Less ThanNever Every Times Times Once a Once a Once aUsed Day a Week a Month Month Year Year
All 87.6% 1.1% 0.8% 1.2% 2.1% 2.4% 4.7%Grade 7 92.4% * % 0.3% 0.8% 1.7% 1.4% 3.4%Grade 8 93.0% * % 0.4% 0.7% 1.4% 2.5% 2.1%Grade 9 88.5% * % 0.3% 2.0% 2.3% 2.6% 4.3%Grade 10 87.0% 1.7% 2.5% 2.5% 0.8% 1.7% 3.8%Grade 11 84.3% 1.5% 0.8% 1.1% 3.1% 1.9% 7.3%Grade 12 78.4% 4.2% 1.1% * % 3.2% 4.7% 8.4%
________________________________________________________________________________
Table T-3: In the past 30 days, how many cigarettes have you smoked?
>1 But >10 But >1 Pack<1 Per <10 Per <1 Pack But <2 >2 PacksNone Day Day Per Day Packs/Day Per Day
All 82.5% 10.2% 4.7% 1.6% 0.8% 0.2%Grade 7 92.8% 4.4% 1.8% 0.5% * % 0.5%Grade 8 88.7% 7.9% 1.7% 1.0% 0.3% 0.3%Grade 9 85.7% 7.5% 5.0% 1.6% 0.3% * %Grade 10 80.8% 11.2% 4.8% 2.4% 0.8% * %Grade 11 74.0% 13.4% 6.7% 3.0% 2.6% 0.4%Grade 12 68.7% 19.4% 9.5% 1.5% 1.0% * %
________________________________________________________________________________
Table T-4: Average age of first use of:
Grade 7 Grade 8 Grade 9 Grade 10 Grade 11 Grade 12
Tobacco 10.9 11.4 12.6 13.1 13.4 14.9
________________________________________________________________________________
Table T-5: If you wanted some, how difficult would it be to get...
Cigarettes?
Never Very Somewhat Somewhat VeryHeard Of Impossible Difficult Difficult Easy Easy
All 9.0% 13.1% 5.5% 8.1% 18.1% 46.1%Grade 7 17.6% 26.3% 7.1% 13.4% 12.9% 22.6%Grade 8 8.7% 15.1% 8.7% 11.4% 22.5% 33.6%Grade 9 11.7% 17.4% 6.9% 7.9% 22.1% 34.1%Grade 10 3.7% 8.6% 6.9% 5.7% 23.3% 51.8%
Grade 11 5.2% 4.9% 1.1% 6.7% 17.6% 64.4%Grade 12 4.6% 2.5% 1.0% 2.0% 9.6% 80.2%
8/14/2019 COMAL COUNTY - New Braunfels ISD - 2005 Texas School Survey of Drug and Alcohol Use
http://slidepdf.com/reader/full/comal-county-new-braunfels-isd-2005-texas-school-survey-of-drug-and-alcohol 4/114
New BraunfelsSpring 2005
________________________________________________________________________________
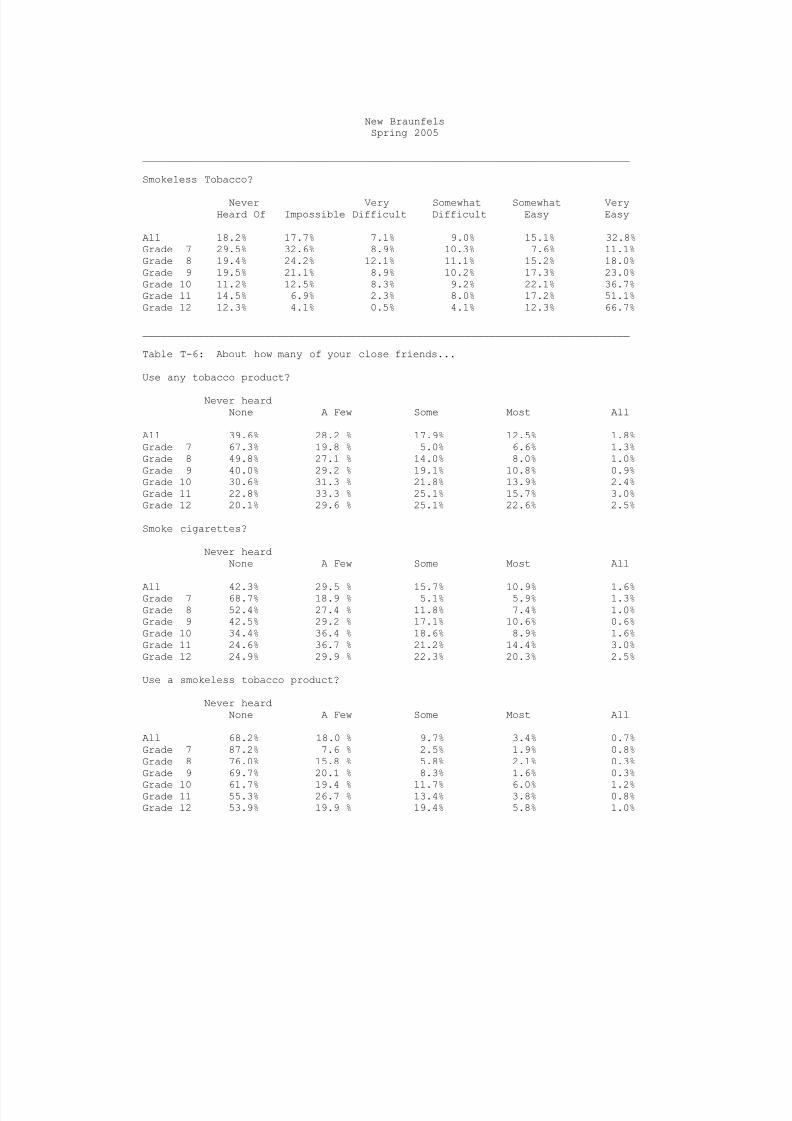
Smokeless Tobacco?
Never Very Somewhat Somewhat VeryHeard Of Impossible Difficult Difficult Easy Easy
All 18.2% 17.7% 7.1% 9.0% 15.1% 32.8%Grade 7 29.5% 32.6% 8.9% 10.3% 7.6% 11.1%Grade 8 19.4% 24.2% 12.1% 11.1% 15.2% 18.0%Grade 9 19.5% 21.1% 8.9% 10.2% 17.3% 23.0%Grade 10 11.2% 12.5% 8.3% 9.2% 22.1% 36.7%Grade 11 14.5% 6.9% 2.3% 8.0% 17.2% 51.1%Grade 12 12.3% 4.1% 0.5% 4.1% 12.3% 66.7%
________________________________________________________________________________
Table T-6: About how many of your close friends...
Use any tobacco product?
Never heardNone A Few Some Most All
All 39.6% 28.2 % 17.9% 12.5% 1.8%Grade 7 67.3% 19.8 % 5.0% 6.6% 1.3%Grade 8 49.8% 27.1 % 14.0% 8.0% 1.0%Grade 9 40.0% 29.2 % 19.1% 10.8% 0.9%Grade 10 30.6% 31.3 % 21.8% 13.9% 2.4%Grade 11 22.8% 33.3 % 25.1% 15.7% 3.0%Grade 12 20.1% 29.6 % 25.1% 22.6% 2.5%
Smoke cigarettes?
Never heardNone A Few Some Most All
All 42.3% 29.5 % 15.7% 10.9% 1.6%Grade 7 68.7% 18.9 % 5.1% 5.9% 1.3%Grade 8 52.4% 27.4 % 11.8% 7.4% 1.0%Grade 9 42.5% 29.2 % 17.1% 10.6% 0.6%Grade 10 34.4% 36.4 % 18.6% 8.9% 1.6%Grade 11 24.6% 36.7 % 21.2% 14.4% 3.0%Grade 12 24.9% 29.9 % 22.3% 20.3% 2.5%
Use a smokeless tobacco product?
Never heardNone A Few Some Most All
All 68.2% 18.0 % 9.7% 3.4% 0.7%Grade 7 87.2% 7.6 % 2.5% 1.9% 0.8%Grade 8 76.0% 15.8 % 5.8% 2.1% 0.3%Grade 9 69.7% 20.1 % 8.3% 1.6% 0.3%
Grade 10 61.7% 19.4 % 11.7% 6.0% 1.2%Grade 11 55.3% 26.7 % 13.4% 3.8% 0.8%Grade 12 53.9% 19.9 % 19.4% 5.8% 1.0%
8/14/2019 COMAL COUNTY - New Braunfels ISD - 2005 Texas School Survey of Drug and Alcohol Use
http://slidepdf.com/reader/full/comal-county-new-braunfels-isd-2005-texas-school-survey-of-drug-and-alcohol 5/114
New BraunfelsSpring 2005
________________________________________________________________________________
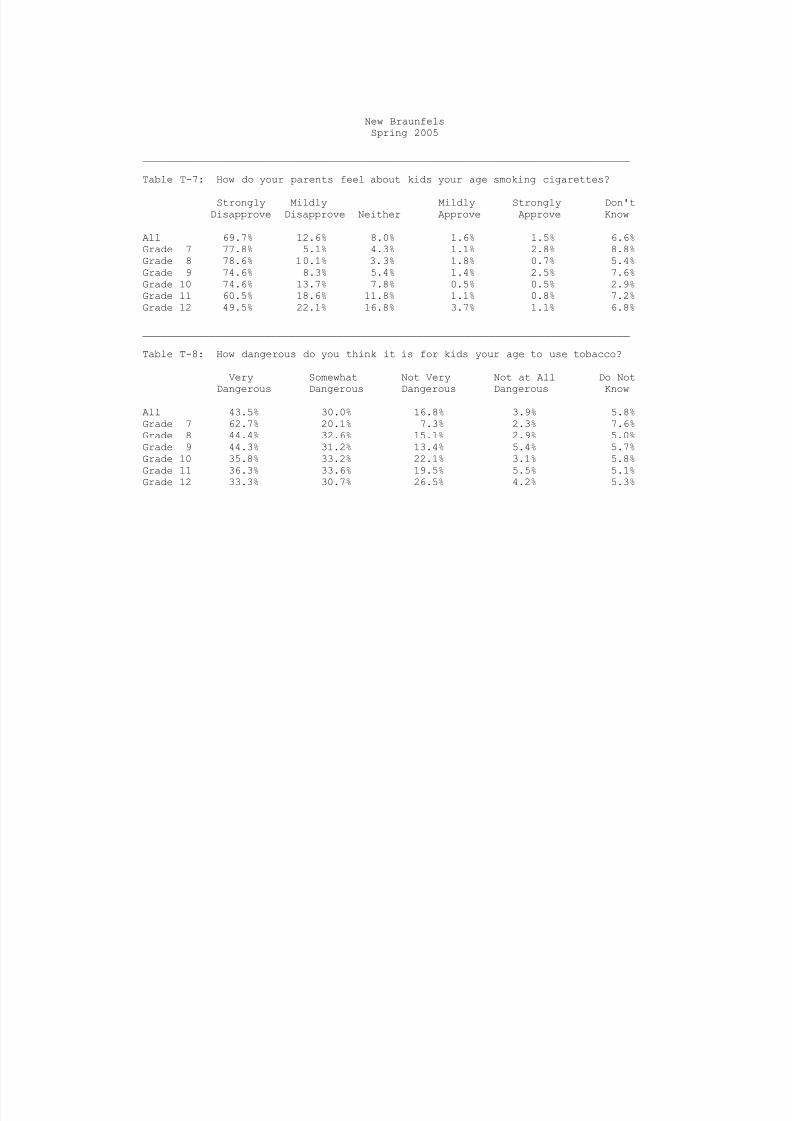
Table T-7: How do your parents feel about kids your age smoking cigarettes?
Strongly Mildly Mildly Strongly Don'tDisapprove Disapprove Neither Approve Approve Know
All 69.7% 12.6% 8.0% 1.6% 1.5% 6.6%Grade 7 77.8% 5.1% 4.3% 1.1% 2.8% 8.8%Grade 8 78.6% 10.1% 3.3% 1.8% 0.7% 5.4%Grade 9 74.6% 8.3% 5.4% 1.4% 2.5% 7.6%Grade 10 74.6% 13.7% 7.8% 0.5% 0.5% 2.9%Grade 11 60.5% 18.6% 11.8% 1.1% 0.8% 7.2%Grade 12 49.5% 22.1% 16.8% 3.7% 1.1% 6.8%
________________________________________________________________________________
Table T-8: How dangerous do you think it is for kids your age to use tobacco?
Very Somewhat Not Very Not at All Do Not
Dangerous Dangerous Dangerous Dangerous KnowAll 43.5% 30.0% 16.8% 3.9% 5.8%Grade 7 62.7% 20.1% 7.3% 2.3% 7.6%Grade 8 44.4% 32.6% 15.1% 2.9% 5.0%Grade 9 44.3% 31.2% 13.4% 5.4% 5.7%Grade 10 35.8% 33.2% 22.1% 3.1% 5.8%Grade 11 36.3% 33.6% 19.5% 5.5% 5.1%Grade 12 33.3% 30.7% 26.5% 4.2% 5.3%
8/14/2019 COMAL COUNTY - New Braunfels ISD - 2005 Texas School Survey of Drug and Alcohol Use
http://slidepdf.com/reader/full/comal-county-new-braunfels-isd-2005-texas-school-survey-of-drug-and-alcohol 6/114
New BraunfelsSpring 2005
________________________________________________________________________________
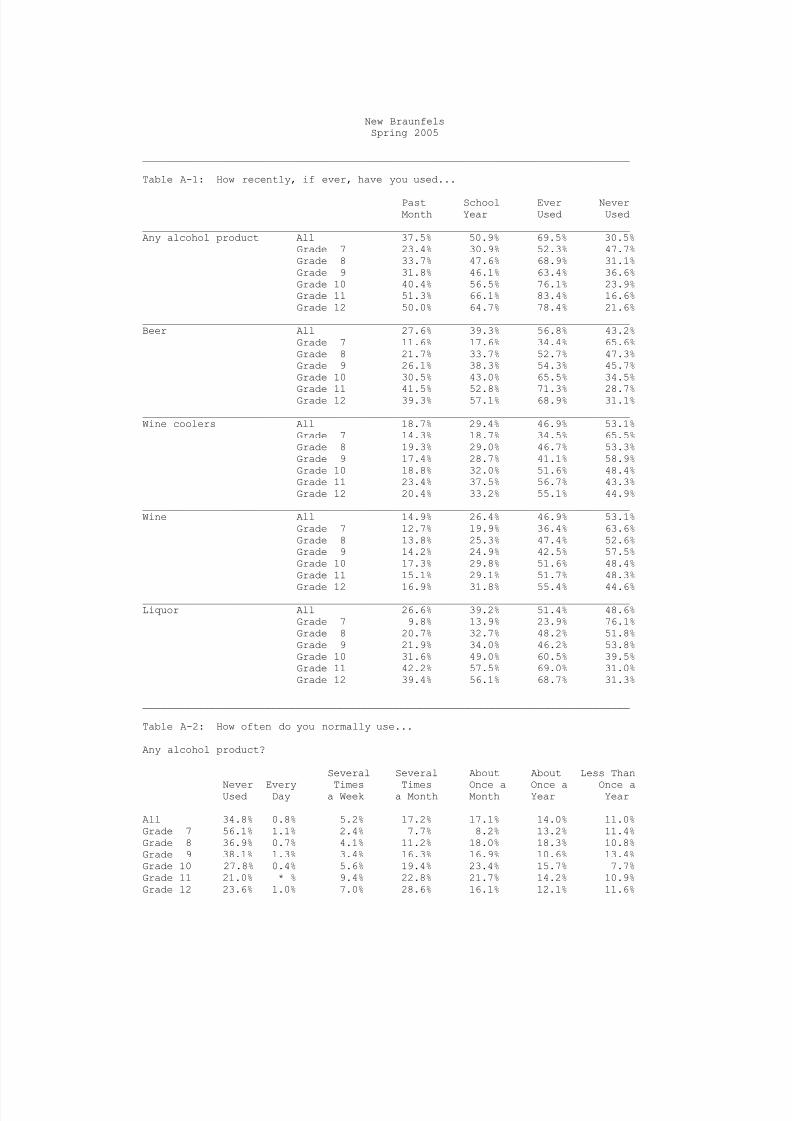
Table A-1: How recently, if ever, have you used...
Past School Ever NeverMonth Year Used Used
________________________________________________________________________________Any alcohol product All 37.5% 50.9% 69.5% 30.5%
Grade 7 23.4% 30.9% 52.3% 47.7%Grade 8 33.7% 47.6% 68.9% 31.1%Grade 9 31.8% 46.1% 63.4% 36.6%Grade 10 40.4% 56.5% 76.1% 23.9%Grade 11 51.3% 66.1% 83.4% 16.6%Grade 12 50.0% 64.7% 78.4% 21.6%
________________________________________________________________________________Beer All 27.6% 39.3% 56.8% 43.2%
Grade 7 11.6% 17.6% 34.4% 65.6%Grade 8 21.7% 33.7% 52.7% 47.3%Grade 9 26.1% 38.3% 54.3% 45.7%Grade 10 30.5% 43.0% 65.5% 34.5%
Grade 11 41.5% 52.8% 71.3% 28.7%Grade 12 39.3% 57.1% 68.9% 31.1%________________________________________________________________________________Wine coolers All 18.7% 29.4% 46.9% 53.1%
Grade 7 14.3% 18.7% 34.5% 65.5%Grade 8 19.3% 29.0% 46.7% 53.3%Grade 9 17.4% 28.7% 41.1% 58.9%Grade 10 18.8% 32.0% 51.6% 48.4%Grade 11 23.4% 37.5% 56.7% 43.3%Grade 12 20.4% 33.2% 55.1% 44.9%
________________________________________________________________________________Wine All 14.9% 26.4% 46.9% 53.1%
Grade 7 12.7% 19.9% 36.4% 63.6%Grade 8 13.8% 25.3% 47.4% 52.6%Grade 9 14.2% 24.9% 42.5% 57.5%Grade 10 17.3% 29.8% 51.6% 48.4%Grade 11 15.1% 29.1% 51.7% 48.3%
Grade 12 16.9% 31.8% 55.4% 44.6%________________________________________________________________________________Liquor All 26.6% 39.2% 51.4% 48.6%
Grade 7 9.8% 13.9% 23.9% 76.1%Grade 8 20.7% 32.7% 48.2% 51.8%Grade 9 21.9% 34.0% 46.2% 53.8%Grade 10 31.6% 49.0% 60.5% 39.5%Grade 11 42.2% 57.5% 69.0% 31.0%Grade 12 39.4% 56.1% 68.7% 31.3%
________________________________________________________________________________
Table A-2: How often do you normally use...
Any alcohol product?
Several Several About About Less Than
Never Every Times Times Once a Once a Once aUsed Day a Week a Month Month Year Year
All 34.8% 0.8% 5.2% 17.2% 17.1% 14.0% 11.0%Grade 7 56.1% 1.1% 2.4% 7.7% 8.2% 13.2% 11.4%Grade 8 36.9% 0.7% 4.1% 11.2% 18.0% 18.3% 10.8%Grade 9 38.1% 1.3% 3.4% 16.3% 16.9% 10.6% 13.4%Grade 10 27.8% 0.4% 5.6% 19.4% 23.4% 15.7% 7.7%Grade 11 21.0% * % 9.4% 22.8% 21.7% 14.2% 10.9%Grade 12 23.6% 1.0% 7.0% 28.6% 16.1% 12.1% 11.6%
8/14/2019 COMAL COUNTY - New Braunfels ISD - 2005 Texas School Survey of Drug and Alcohol Use
http://slidepdf.com/reader/full/comal-county-new-braunfels-isd-2005-texas-school-survey-of-drug-and-alcohol 7/114
New BraunfelsSpring 2005
________________________________________________________________________________
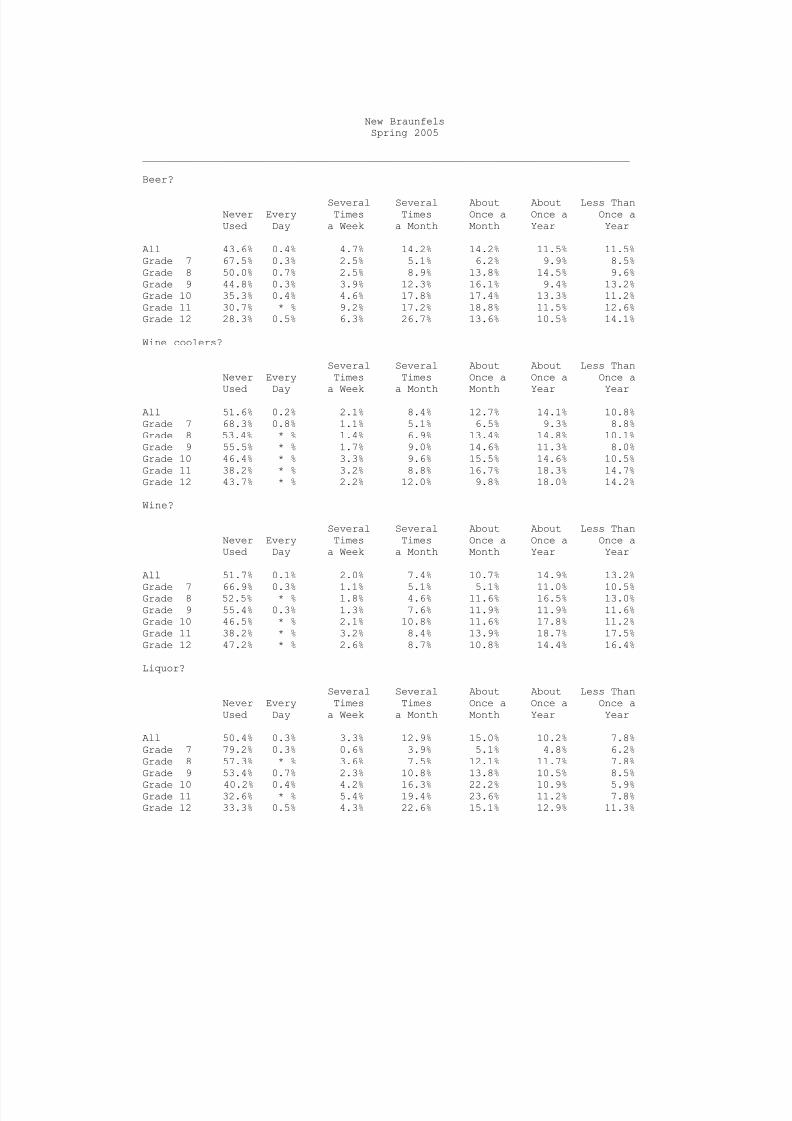
Beer?
Several Several About About Less ThanNever Every Times Times Once a Once a Once aUsed Day a Week a Month Month Year Year
All 43.6% 0.4% 4.7% 14.2% 14.2% 11.5% 11.5%Grade 7 67.5% 0.3% 2.5% 5.1% 6.2% 9.9% 8.5%Grade 8 50.0% 0.7% 2.5% 8.9% 13.8% 14.5% 9.6%Grade 9 44.8% 0.3% 3.9% 12.3% 16.1% 9.4% 13.2%Grade 10 35.3% 0.4% 4.6% 17.8% 17.4% 13.3% 11.2%Grade 11 30.7% * % 9.2% 17.2% 18.8% 11.5% 12.6%Grade 12 28.3% 0.5% 6.3% 26.7% 13.6% 10.5% 14.1%
Wine coolers?
Several Several About About Less ThanNever Every Times Times Once a Once a Once a
Used Day a Week a Month Month Year YearAll 51.6% 0.2% 2.1% 8.4% 12.7% 14.1% 10.8%Grade 7 68.3% 0.8% 1.1% 5.1% 6.5% 9.3% 8.8%Grade 8 53.4% * % 1.4% 6.9% 13.4% 14.8% 10.1%Grade 9 55.5% * % 1.7% 9.0% 14.6% 11.3% 8.0%Grade 10 46.4% * % 3.3% 9.6% 15.5% 14.6% 10.5%Grade 11 38.2% * % 3.2% 8.8% 16.7% 18.3% 14.7%Grade 12 43.7% * % 2.2% 12.0% 9.8% 18.0% 14.2%
Wine?
Several Several About About Less ThanNever Every Times Times Once a Once a Once aUsed Day a Week a Month Month Year Year
All 51.7% 0.1% 2.0% 7.4% 10.7% 14.9% 13.2%
Grade 7 66.9% 0.3% 1.1% 5.1% 5.1% 11.0% 10.5%Grade 8 52.5% * % 1.8% 4.6% 11.6% 16.5% 13.0%Grade 9 55.4% 0.3% 1.3% 7.6% 11.9% 11.9% 11.6%Grade 10 46.5% * % 2.1% 10.8% 11.6% 17.8% 11.2%Grade 11 38.2% * % 3.2% 8.4% 13.9% 18.7% 17.5%Grade 12 47.2% * % 2.6% 8.7% 10.8% 14.4% 16.4%
Liquor?
Several Several About About Less ThanNever Every Times Times Once a Once a Once aUsed Day a Week a Month Month Year Year
All 50.4% 0.3% 3.3% 12.9% 15.0% 10.2% 7.8%Grade 7 79.2% 0.3% 0.6% 3.9% 5.1% 4.8% 6.2%Grade 8 57.3% * % 3.6% 7.5% 12.1% 11.7% 7.8%Grade 9 53.4% 0.7% 2.3% 10.8% 13.8% 10.5% 8.5%
Grade 10 40.2% 0.4% 4.2% 16.3% 22.2% 10.9% 5.9%Grade 11 32.6% * % 5.4% 19.4% 23.6% 11.2% 7.8%Grade 12 33.3% 0.5% 4.3% 22.6% 15.1% 12.9% 11.3%

8/14/2019 COMAL COUNTY - New Braunfels ISD - 2005 Texas School Survey of Drug and Alcohol Use
http://slidepdf.com/reader/full/comal-county-new-braunfels-isd-2005-texas-school-survey-of-drug-and-alcohol 8/114
New BraunfelsSpring 2005
________________________________________________________________________________
Table A-3: When you drink the following alcoholic beverages, how many drinks do
you usually have at one time, on average?Beer
Never Ever 5 or More 1 to 4 Less Than 1
All 43.4% 56.6% 17.5% 25.2% 13.9%Grade 7 64.6% 35.4% 5.2% 15.7% 14.4%Grade 8 47.1% 52.9% 10.9% 24.2% 17.7%Grade 9 43.1% 56.9% 15.0% 25.9% 16.0%Grade 10 36.3% 63.7% 20.0% 27.8% 15.9%Grade 11 32.3% 67.7% 26.0% 33.5% 8.2%Grade 12 32.0% 68.0% 32.0% 25.5% 10.5%
Wine Coolers
Never Ever 5 or More 1 to 4 Less Than 1
All 51.2% 48.8% 10.5% 28.3% 10.0%Grade 7 65.5% 34.5% 5.8% 19.4% 9.3%Grade 8 51.2% 48.8% 8.0% 32.1% 8.7%Grade 9 55.6% 44.4% 10.6% 24.1% 9.6%Grade 10 48.5% 51.5% 12.0% 28.2% 11.2%Grade 11 38.4% 61.6% 13.1% 36.2% 12.3%Grade 12 44.4% 55.6% 14.8% 32.1% 8.7%
Wine
Never Ever 5 or More 1 to 4 Less Than 1
All 52.2% 47.8% 4.4% 25.0% 18.4%Grade 7 62.6% 37.4% 2.7% 16.4% 18.3%Grade 8 51.4% 48.6% 4.5% 26.2% 17.9%Grade 9 55.2% 44.8% 4.5% 21.6% 18.7%
Grade 10 48.8% 51.2% 5.4% 26.9% 19.0%Grade 11 43.2% 56.8% 5.3% 32.2% 19.3%Grade 12 49.5% 50.5% 4.6% 29.1% 16.8%
Liquor
Never Ever 5 or More 1 to 4 Less Than 1
All 48.2% 51.8% 16.1% 25.6% 10.1%Grade 7 76.4% 23.6% 4.7% 10.5% 8.4%Grade 8 53.8% 46.2% 13.9% 19.8% 12.5%Grade 9 51.7% 48.3% 16.5% 20.6% 11.1%Grade 10 36.9% 63.1% 17.4% 33.6% 12.0%Grade 11 31.7% 68.3% 22.6% 38.9% 6.8%Grade 12 30.6% 69.4% 24.5% 35.2% 9.7%

8/14/2019 COMAL COUNTY - New Braunfels ISD - 2005 Texas School Survey of Drug and Alcohol Use
http://slidepdf.com/reader/full/comal-county-new-braunfels-isd-2005-texas-school-survey-of-drug-and-alcohol 9/114
New BraunfelsSpring 2005
________________________________________________________________________________
Table A-4: During the past twelve months, how often have you had five or more
drinks at one time?Beer
Several Several Less ThanNever Ever Times/Week Times/Month Once/Month
All 65.1% 34.9% 3.0% 16.8% 15.2%Grade 7 84.3% 15.7% 1.3% 5.0% 9.4%Grade 8 71.2% 28.8% 2.1% 11.5% 15.3%Grade 9 67.6% 32.4% 2.3% 16.3% 13.7%Grade 10 60.5% 39.5% 2.9% 21.0% 15.6%Grade 11 47.7% 52.3% 6.5% 23.1% 22.7%Grade 12 53.4% 46.6% 3.1% 28.0% 15.5%
Wine CoolersSeveral Several Less Than
Never Ever Times/Week Times/Month Once/Month
All 70.4% 29.6% 1.7% 12.4% 15.5%Grade 7 82.7% 17.3% 1.6% 6.5% 9.2%Grade 8 71.1% 28.9% 1.4% 10.8% 16.7%Grade 9 73.3% 26.7% 1.7% 13.0% 12.0%Grade 10 68.3% 31.7% 1.2% 13.3% 17.1%Grade 11 59.8% 40.2% 3.4% 14.9% 21.8%Grade 12 63.6% 36.4% 1.1% 17.6% 17.6%
WineSeveral Several Less Than
Never Ever Times/Week Times/Month Once/Month
All 73.7% 26.3% 1.5% 9.5% 15.3%Grade 7 84.7% 15.3% 1.1% 5.8% 8.5%Grade 8 74.3% 25.7% 0.7% 9.2% 15.8%Grade 9 75.1% 24.9% 2.0% 9.3% 13.6%
Grade 10 68.8% 31.2% 0.9% 11.1% 19.2%Grade 11 67.4% 32.6% 3.1% 10.0% 19.5%Grade 12 69.4% 30.6% 1.1% 12.9% 16.7%
LiquorSeveral Several Less Than
Never Ever Times/Week Times/Month Once/Month
All 63.9% 36.1% 2.9% 18.0% 15.2%Grade 7 85.6% 14.4% 1.1% 4.9% 8.4%Grade 8 70.2% 29.8% 3.5% 12.3% 14.0%Grade 9 67.1% 32.9% 3.0% 16.1% 13.8%Grade 10 58.6% 41.4% 2.1% 22.2% 17.2%Grade 11 47.1% 52.9% 5.0% 27.8% 20.1%Grade 12 49.2% 50.8% 2.6% 28.8% 19.4%
8/14/2019 COMAL COUNTY - New Braunfels ISD - 2005 Texas School Survey of Drug and Alcohol Use
http://slidepdf.com/reader/full/comal-county-new-braunfels-isd-2005-texas-school-survey-of-drug-and-alcohol 10/114
New BraunfelsSpring 2005
________________________________________________________________________________
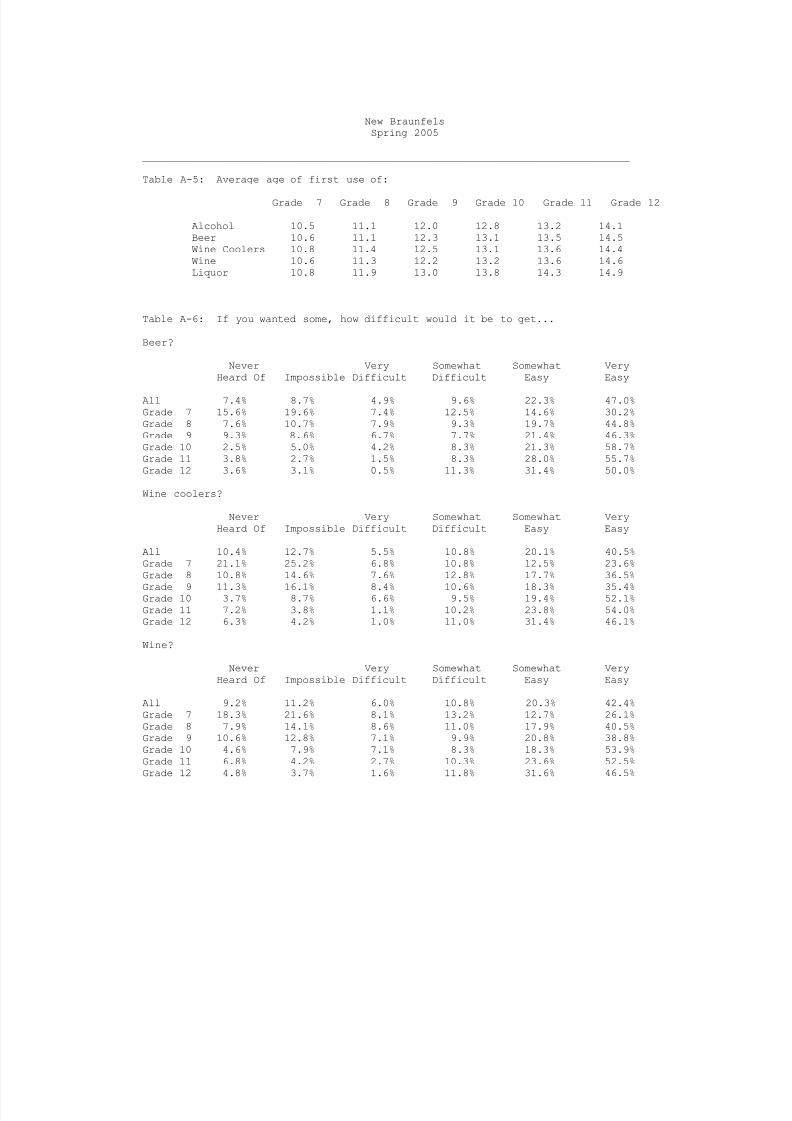
Table A-5: Average age of first use of:
Grade 7 Grade 8 Grade 9 Grade 10 Grade 11 Grade 12
Alcohol 10.5 11.1 12.0 12.8 13.2 14.1Beer 10.6 11.1 12.3 13.1 13.5 14.5Wine Coolers 10.8 11.4 12.5 13.1 13.6 14.4Wine 10.6 11.3 12.2 13.2 13.6 14.6Liquor 10.8 11.9 13.0 13.8 14.3 14.9
________________________________________________________________________________
Table A-6: If you wanted some, how difficult would it be to get...
Beer?
Never Very Somewhat Somewhat VeryHeard Of Impossible Difficult Difficult Easy Easy
All 7.4% 8.7% 4.9% 9.6% 22.3% 47.0%Grade 7 15.6% 19.6% 7.4% 12.5% 14.6% 30.2%Grade 8 7.6% 10.7% 7.9% 9.3% 19.7% 44.8%Grade 9 9.3% 8.6% 6.7% 7.7% 21.4% 46.3%Grade 10 2.5% 5.0% 4.2% 8.3% 21.3% 58.7%Grade 11 3.8% 2.7% 1.5% 8.3% 28.0% 55.7%Grade 12 3.6% 3.1% 0.5% 11.3% 31.4% 50.0%
Wine coolers?
Never Very Somewhat Somewhat VeryHeard Of Impossible Difficult Difficult Easy Easy
All 10.4% 12.7% 5.5% 10.8% 20.1% 40.5%Grade 7 21.1% 25.2% 6.8% 10.8% 12.5% 23.6%Grade 8 10.8% 14.6% 7.6% 12.8% 17.7% 36.5%
Grade 9 11.3% 16.1% 8.4% 10.6% 18.3% 35.4%Grade 10 3.7% 8.7% 6.6% 9.5% 19.4% 52.1%Grade 11 7.2% 3.8% 1.1% 10.2% 23.8% 54.0%Grade 12 6.3% 4.2% 1.0% 11.0% 31.4% 46.1%
Wine?
Never Very Somewhat Somewhat VeryHeard Of Impossible Difficult Difficult Easy Easy
All 9.2% 11.2% 6.0% 10.8% 20.3% 42.4%Grade 7 18.3% 21.6% 8.1% 13.2% 12.7% 26.1%Grade 8 7.9% 14.1% 8.6% 11.0% 17.9% 40.5%Grade 9 10.6% 12.8% 7.1% 9.9% 20.8% 38.8%Grade 10 4.6% 7.9% 7.1% 8.3% 18.3% 53.9%Grade 11 6.8% 4.2% 2.7% 10.3% 23.6% 52.5%Grade 12 4.8% 3.7% 1.6% 11.8% 31.6% 46.5%
8/14/2019 COMAL COUNTY - New Braunfels ISD - 2005 Texas School Survey of Drug and Alcohol Use
http://slidepdf.com/reader/full/comal-county-new-braunfels-isd-2005-texas-school-survey-of-drug-and-alcohol 11/114
New BraunfelsSpring 2005
________________________________________________________________________________
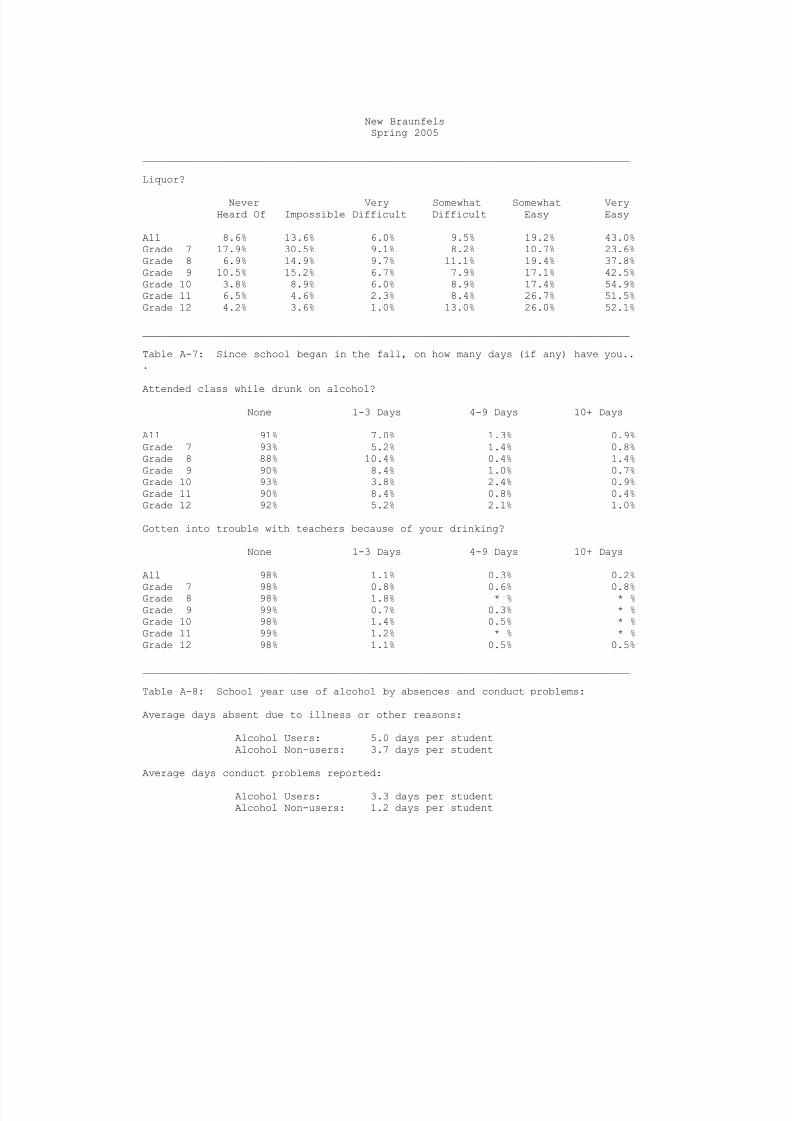
Liquor?
Never Very Somewhat Somewhat VeryHeard Of Impossible Difficult Difficult Easy Easy
All 8.6% 13.6% 6.0% 9.5% 19.2% 43.0%Grade 7 17.9% 30.5% 9.1% 8.2% 10.7% 23.6%Grade 8 6.9% 14.9% 9.7% 11.1% 19.4% 37.8%Grade 9 10.5% 15.2% 6.7% 7.9% 17.1% 42.5%Grade 10 3.8% 8.9% 6.0% 8.9% 17.4% 54.9%Grade 11 6.5% 4.6% 2.3% 8.4% 26.7% 51.5%Grade 12 4.2% 3.6% 1.0% 13.0% 26.0% 52.1%
________________________________________________________________________________
Table A-7: Since school began in the fall, on how many days (if any) have you...
Attended class while drunk on alcohol?None 1-3 Days 4-9 Days 10+ Days
All 91% 7.0% 1.3% 0.9%Grade 7 93% 5.2% 1.4% 0.8%Grade 8 88% 10.4% 0.4% 1.4%Grade 9 90% 8.4% 1.0% 0.7%Grade 10 93% 3.8% 2.4% 0.9%Grade 11 90% 8.4% 0.8% 0.4%Grade 12 92% 5.2% 2.1% 1.0%
Gotten into trouble with teachers because of your drinking?
None 1-3 Days 4-9 Days 10+ Days
All 98% 1.1% 0.3% 0.2%
Grade 7 98% 0.8% 0.6% 0.8%Grade 8 98% 1.8% * % * %Grade 9 99% 0.7% 0.3% * %Grade 10 98% 1.4% 0.5% * %Grade 11 99% 1.2% * % * %Grade 12 98% 1.1% 0.5% 0.5%
________________________________________________________________________________
Table A-8: School year use of alcohol by absences and conduct problems:
Average days absent due to illness or other reasons:
Alcohol Users: 5.0 days per studentAlcohol Non-users: 3.7 days per student
Average days conduct problems reported:
Alcohol Users: 3.3 days per studentAlcohol Non-users: 1.2 days per student
8/14/2019 COMAL COUNTY - New Braunfels ISD - 2005 Texas School Survey of Drug and Alcohol Use
http://slidepdf.com/reader/full/comal-county-new-braunfels-isd-2005-texas-school-survey-of-drug-and-alcohol 12/114
New BraunfelsSpring 2005
________________________________________________________________________________
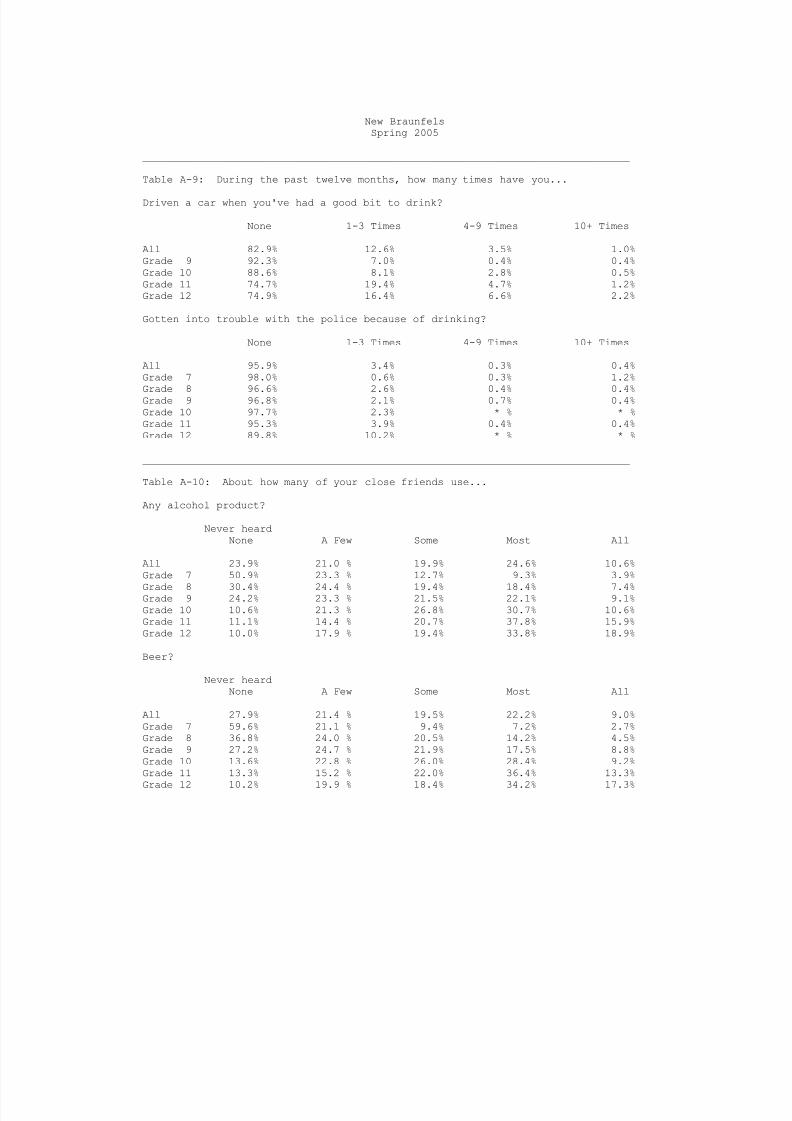
Table A-9: During the past twelve months, how many times have you...
Driven a car when you've had a good bit to drink?
None 1-3 Times 4-9 Times 10+ Times
All 82.9% 12.6% 3.5% 1.0%Grade 9 92.3% 7.0% 0.4% 0.4%Grade 10 88.6% 8.1% 2.8% 0.5%Grade 11 74.7% 19.4% 4.7% 1.2%Grade 12 74.9% 16.4% 6.6% 2.2%
Gotten into trouble with the police because of drinking?
None 1-3 Times 4-9 Times 10+ Times
All 95.9% 3.4% 0.3% 0.4%Grade 7 98.0% 0.6% 0.3% 1.2%
Grade 8 96.6% 2.6% 0.4% 0.4%Grade 9 96.8% 2.1% 0.7% 0.4%Grade 10 97.7% 2.3% * % * %Grade 11 95.3% 3.9% 0.4% 0.4%Grade 12 89.8% 10.2% * % * %
________________________________________________________________________________
Table A-10: About how many of your close friends use...
Any alcohol product?
Never heardNone A Few Some Most All
All 23.9% 21.0 % 19.9% 24.6% 10.6%Grade 7 50.9% 23.3 % 12.7% 9.3% 3.9%
Grade 8 30.4% 24.4 % 19.4% 18.4% 7.4%Grade 9 24.2% 23.3 % 21.5% 22.1% 9.1%Grade 10 10.6% 21.3 % 26.8% 30.7% 10.6%Grade 11 11.1% 14.4 % 20.7% 37.8% 15.9%Grade 12 10.0% 17.9 % 19.4% 33.8% 18.9%
Beer?
Never heardNone A Few Some Most All
All 27.9% 21.4 % 19.5% 22.2% 9.0%Grade 7 59.6% 21.1 % 9.4% 7.2% 2.7%Grade 8 36.8% 24.0 % 20.5% 14.2% 4.5%Grade 9 27.2% 24.7 % 21.9% 17.5% 8.8%Grade 10 13.6% 22.8 % 26.0% 28.4% 9.2%Grade 11 13.3% 15.2 % 22.0% 36.4% 13.3%
Grade 12 10.2% 19.9 % 18.4% 34.2% 17.3%
8/14/2019 COMAL COUNTY - New Braunfels ISD - 2005 Texas School Survey of Drug and Alcohol Use
http://slidepdf.com/reader/full/comal-county-new-braunfels-isd-2005-texas-school-survey-of-drug-and-alcohol 13/114
New BraunfelsSpring 2005
________________________________________________________________________________
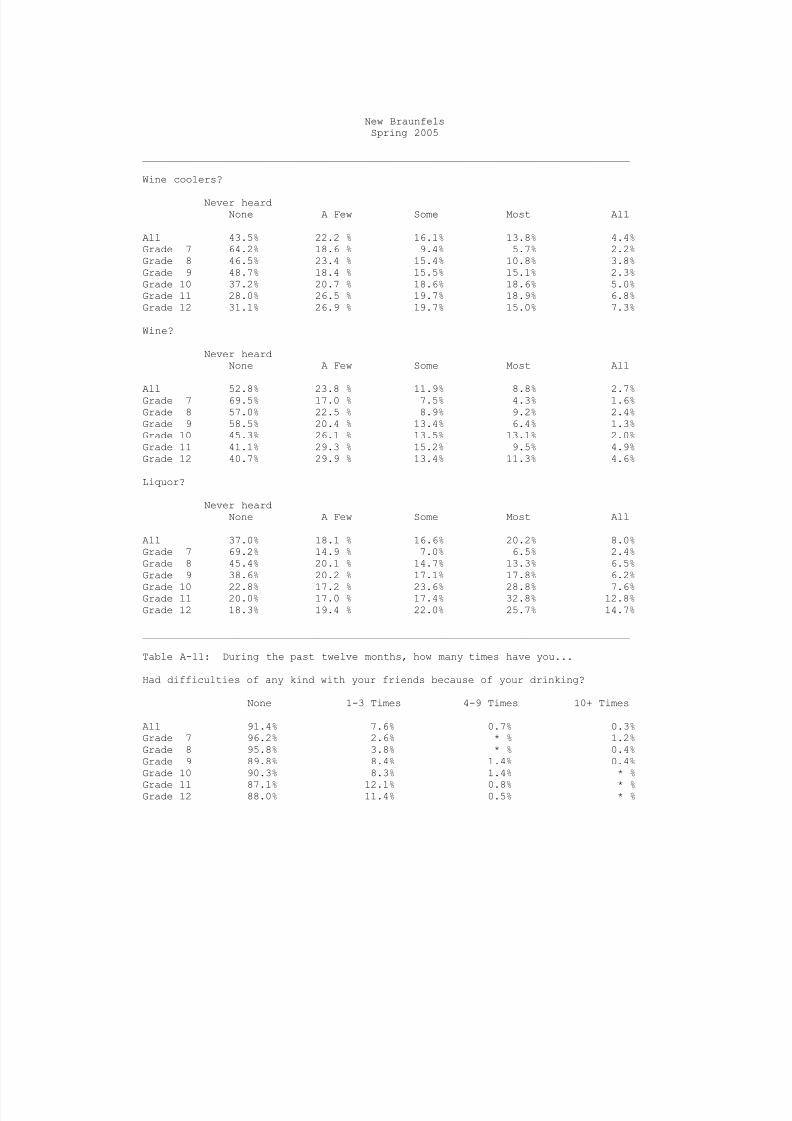
Wine coolers?
Never heardNone A Few Some Most All
All 43.5% 22.2 % 16.1% 13.8% 4.4%Grade 7 64.2% 18.6 % 9.4% 5.7% 2.2%Grade 8 46.5% 23.4 % 15.4% 10.8% 3.8%Grade 9 48.7% 18.4 % 15.5% 15.1% 2.3%Grade 10 37.2% 20.7 % 18.6% 18.6% 5.0%Grade 11 28.0% 26.5 % 19.7% 18.9% 6.8%Grade 12 31.1% 26.9 % 19.7% 15.0% 7.3%
Wine?
Never heardNone A Few Some Most All
All 52.8% 23.8 % 11.9% 8.8% 2.7%Grade 7 69.5% 17.0 % 7.5% 4.3% 1.6%Grade 8 57.0% 22.5 % 8.9% 9.2% 2.4%Grade 9 58.5% 20.4 % 13.4% 6.4% 1.3%Grade 10 45.3% 26.1 % 13.5% 13.1% 2.0%Grade 11 41.1% 29.3 % 15.2% 9.5% 4.9%Grade 12 40.7% 29.9 % 13.4% 11.3% 4.6%
Liquor?
Never heardNone A Few Some Most All
All 37.0% 18.1 % 16.6% 20.2% 8.0%Grade 7 69.2% 14.9 % 7.0% 6.5% 2.4%Grade 8 45.4% 20.1 % 14.7% 13.3% 6.5%Grade 9 38.6% 20.2 % 17.1% 17.8% 6.2%
Grade 10 22.8% 17.2 % 23.6% 28.8% 7.6%Grade 11 20.0% 17.0 % 17.4% 32.8% 12.8%Grade 12 18.3% 19.4 % 22.0% 25.7% 14.7%
________________________________________________________________________________
Table A-11: During the past twelve months, how many times have you...
Had difficulties of any kind with your friends because of your drinking?
None 1-3 Times 4-9 Times 10+ Times
All 91.4% 7.6% 0.7% 0.3%Grade 7 96.2% 2.6% * % 1.2%Grade 8 95.8% 3.8% * % 0.4%Grade 9 89.8% 8.4% 1.4% 0.4%Grade 10 90.3% 8.3% 1.4% * %
Grade 11 87.1% 12.1% 0.8% * %Grade 12 88.0% 11.4% 0.5% * %
8/14/2019 COMAL COUNTY - New Braunfels ISD - 2005 Texas School Survey of Drug and Alcohol Use
http://slidepdf.com/reader/full/comal-county-new-braunfels-isd-2005-texas-school-survey-of-drug-and-alcohol 14/114
New BraunfelsSpring 2005
________________________________________________________________________________
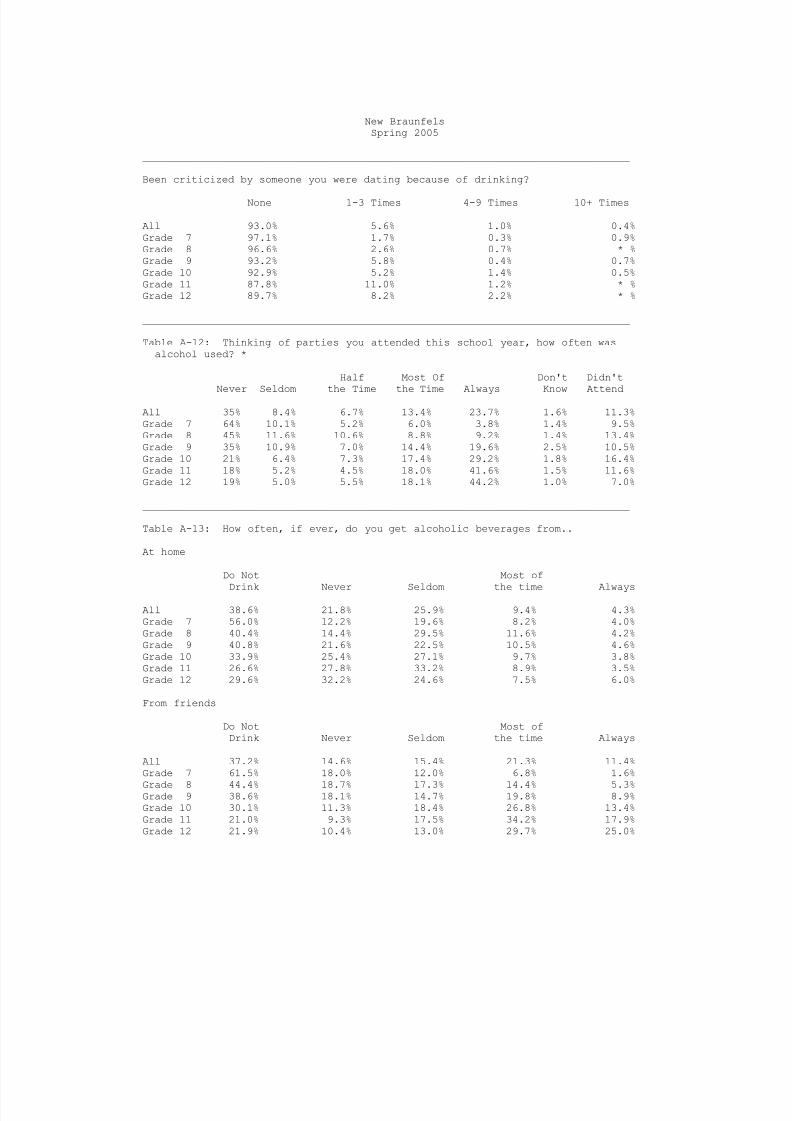
Been criticized by someone you were dating because of drinking?
None 1-3 Times 4-9 Times 10+ Times
All 93.0% 5.6% 1.0% 0.4%Grade 7 97.1% 1.7% 0.3% 0.9%Grade 8 96.6% 2.6% 0.7% * %Grade 9 93.2% 5.8% 0.4% 0.7%Grade 10 92.9% 5.2% 1.4% 0.5%Grade 11 87.8% 11.0% 1.2% * %Grade 12 89.7% 8.2% 2.2% * %
________________________________________________________________________________
Table A-12: Thinking of parties you attended this school year, how often wasalcohol used? *
Half Most Of Don't Didn't
Never Seldom the Time the Time Always Know AttendAll 35% 8.4% 6.7% 13.4% 23.7% 1.6% 11.3%Grade 7 64% 10.1% 5.2% 6.0% 3.8% 1.4% 9.5%Grade 8 45% 11.6% 10.6% 8.8% 9.2% 1.4% 13.4%Grade 9 35% 10.9% 7.0% 14.4% 19.6% 2.5% 10.5%Grade 10 21% 6.4% 7.3% 17.4% 29.2% 1.8% 16.4%Grade 11 18% 5.2% 4.5% 18.0% 41.6% 1.5% 11.6%Grade 12 19% 5.0% 5.5% 18.1% 44.2% 1.0% 7.0%
________________________________________________________________________________
Table A-13: How often, if ever, do you get alcoholic beverages from..
At home
Do Not Most of
Drink Never Seldom the time Always
All 38.6% 21.8% 25.9% 9.4% 4.3%Grade 7 56.0% 12.2% 19.6% 8.2% 4.0%Grade 8 40.4% 14.4% 29.5% 11.6% 4.2%Grade 9 40.8% 21.6% 22.5% 10.5% 4.6%Grade 10 33.9% 25.4% 27.1% 9.7% 3.8%Grade 11 26.6% 27.8% 33.2% 8.9% 3.5%Grade 12 29.6% 32.2% 24.6% 7.5% 6.0%
From friends
Do Not Most ofDrink Never Seldom the time Always
All 37.2% 14.6% 15.4% 21.3% 11.4%Grade 7 61.5% 18.0% 12.0% 6.8% 1.6%
Grade 8 44.4% 18.7% 17.3% 14.4% 5.3%Grade 9 38.6% 18.1% 14.7% 19.8% 8.9%Grade 10 30.1% 11.3% 18.4% 26.8% 13.4%Grade 11 21.0% 9.3% 17.5% 34.2% 17.9%Grade 12 21.9% 10.4% 13.0% 29.7% 25.0%
8/14/2019 COMAL COUNTY - New Braunfels ISD - 2005 Texas School Survey of Drug and Alcohol Use
http://slidepdf.com/reader/full/comal-county-new-braunfels-isd-2005-texas-school-survey-of-drug-and-alcohol 15/114
New BraunfelsSpring 2005
________________________________________________________________________________
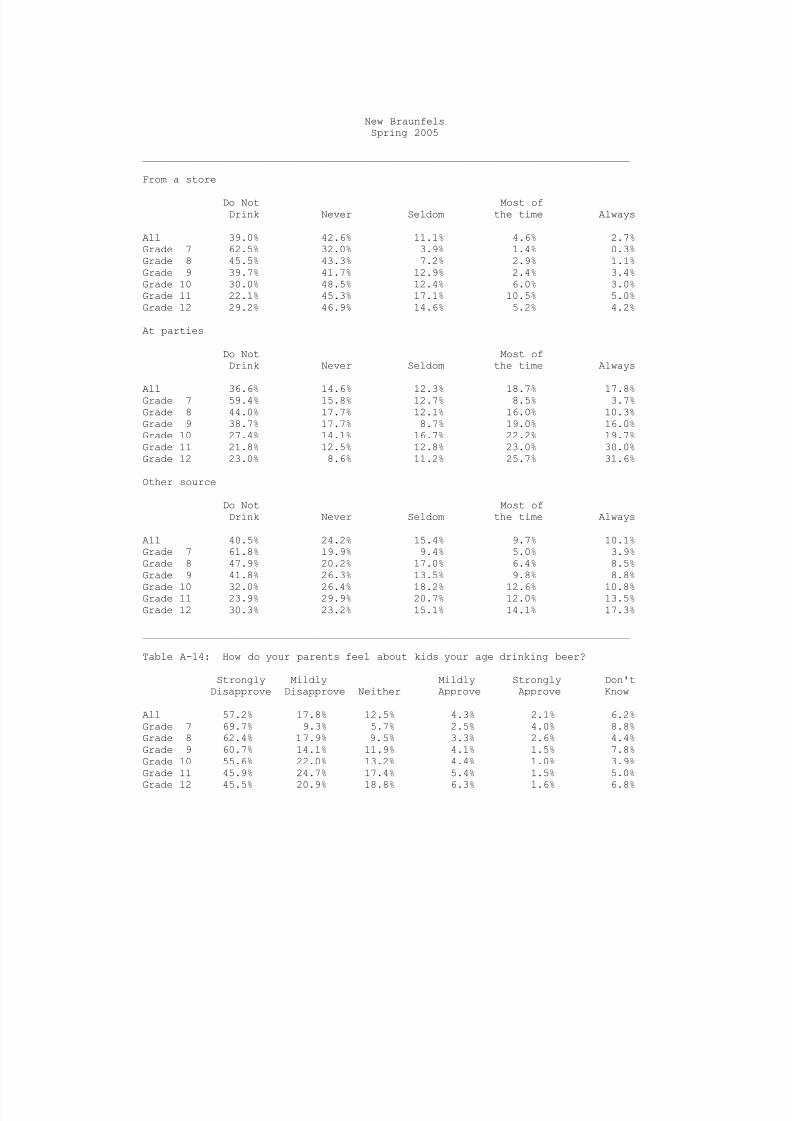
From a store
Do Not Most ofDrink Never Seldom the time Always
All 39.0% 42.6% 11.1% 4.6% 2.7%Grade 7 62.5% 32.0% 3.9% 1.4% 0.3%Grade 8 45.5% 43.3% 7.2% 2.9% 1.1%Grade 9 39.7% 41.7% 12.9% 2.4% 3.4%Grade 10 30.0% 48.5% 12.4% 6.0% 3.0%Grade 11 22.1% 45.3% 17.1% 10.5% 5.0%Grade 12 29.2% 46.9% 14.6% 5.2% 4.2%
At parties
Do Not Most ofDrink Never Seldom the time Always
All 36.6% 14.6% 12.3% 18.7% 17.8%Grade 7 59.4% 15.8% 12.7% 8.5% 3.7%Grade 8 44.0% 17.7% 12.1% 16.0% 10.3%Grade 9 38.7% 17.7% 8.7% 19.0% 16.0%Grade 10 27.4% 14.1% 16.7% 22.2% 19.7%Grade 11 21.8% 12.5% 12.8% 23.0% 30.0%Grade 12 23.0% 8.6% 11.2% 25.7% 31.6%
Other source
Do Not Most ofDrink Never Seldom the time Always
All 40.5% 24.2% 15.4% 9.7% 10.1%Grade 7 61.8% 19.9% 9.4% 5.0% 3.9%Grade 8 47.9% 20.2% 17.0% 6.4% 8.5%Grade 9 41.8% 26.3% 13.5% 9.8% 8.8%
Grade 10 32.0% 26.4% 18.2% 12.6% 10.8%Grade 11 23.9% 29.9% 20.7% 12.0% 13.5%Grade 12 30.3% 23.2% 15.1% 14.1% 17.3%
________________________________________________________________________________
Table A-14: How do your parents feel about kids your age drinking beer?
Strongly Mildly Mildly Strongly Don'tDisapprove Disapprove Neither Approve Approve Know
All 57.2% 17.8% 12.5% 4.3% 2.1% 6.2%Grade 7 69.7% 9.3% 5.7% 2.5% 4.0% 8.8%Grade 8 62.4% 17.9% 9.5% 3.3% 2.6% 4.4%Grade 9 60.7% 14.1% 11.9% 4.1% 1.5% 7.8%Grade 10 55.6% 22.0% 13.2% 4.4% 1.0% 3.9%Grade 11 45.9% 24.7% 17.4% 5.4% 1.5% 5.0%
Grade 12 45.5% 20.9% 18.8% 6.3% 1.6% 6.8%
8/14/2019 COMAL COUNTY - New Braunfels ISD - 2005 Texas School Survey of Drug and Alcohol Use
http://slidepdf.com/reader/full/comal-county-new-braunfels-isd-2005-texas-school-survey-of-drug-and-alcohol 16/114
New BraunfelsSpring 2005
________________________________________________________________________________
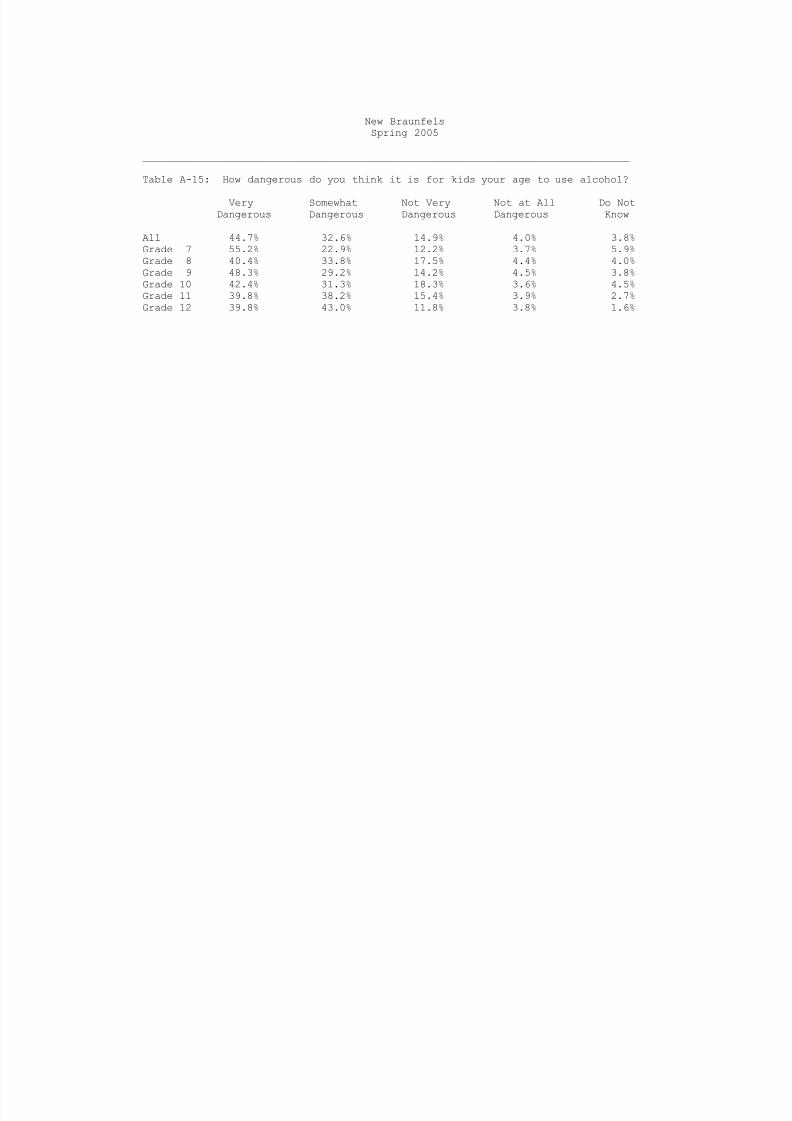
Table A-15: How dangerous do you think it is for kids your age to use alcohol?
Very Somewhat Not Very Not at All Do NotDangerous Dangerous Dangerous Dangerous Know
All 44.7% 32.6% 14.9% 4.0% 3.8%Grade 7 55.2% 22.9% 12.2% 3.7% 5.9%Grade 8 40.4% 33.8% 17.5% 4.4% 4.0%Grade 9 48.3% 29.2% 14.2% 4.5% 3.8%Grade 10 42.4% 31.3% 18.3% 3.6% 4.5%Grade 11 39.8% 38.2% 15.4% 3.9% 2.7%Grade 12 39.8% 43.0% 11.8% 3.8% 1.6%

8/14/2019 COMAL COUNTY - New Braunfels ISD - 2005 Texas School Survey of Drug and Alcohol Use
http://slidepdf.com/reader/full/comal-county-new-braunfels-isd-2005-texas-school-survey-of-drug-and-alcohol 17/114
8/14/2019 COMAL COUNTY - New Braunfels ISD - 2005 Texas School Survey of Drug and Alcohol Use
http://slidepdf.com/reader/full/comal-county-new-braunfels-isd-2005-texas-school-survey-of-drug-and-alcohol 18/114
New BraunfelsSpring 2005
________________________________________________________________________________
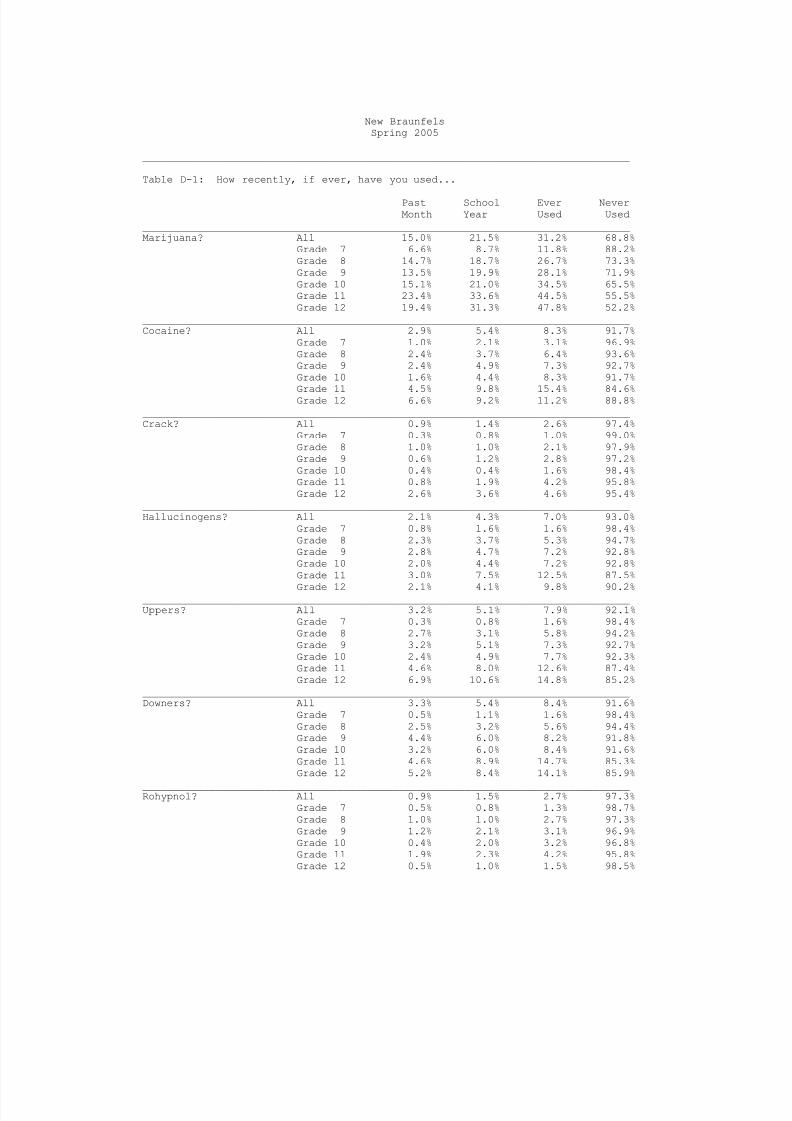
Table D-1: How recently, if ever, have you used...
Past School Ever NeverMonth Year Used Used
________________________________________________________________________________Marijuana? All 15.0% 21.5% 31.2% 68.8%
Grade 7 6.6% 8.7% 11.8% 88.2%Grade 8 14.7% 18.7% 26.7% 73.3%Grade 9 13.5% 19.9% 28.1% 71.9%Grade 10 15.1% 21.0% 34.5% 65.5%Grade 11 23.4% 33.6% 44.5% 55.5%Grade 12 19.4% 31.3% 47.8% 52.2%
________________________________________________________________________________Cocaine? All 2.9% 5.4% 8.3% 91.7%
Grade 7 1.0% 2.1% 3.1% 96.9%Grade 8 2.4% 3.7% 6.4% 93.6%Grade 9 2.4% 4.9% 7.3% 92.7%Grade 10 1.6% 4.4% 8.3% 91.7%
Grade 11 4.5% 9.8% 15.4% 84.6%Grade 12 6.6% 9.2% 11.2% 88.8%________________________________________________________________________________Crack? All 0.9% 1.4% 2.6% 97.4%
Grade 7 0.3% 0.8% 1.0% 99.0%Grade 8 1.0% 1.0% 2.1% 97.9%Grade 9 0.6% 1.2% 2.8% 97.2%Grade 10 0.4% 0.4% 1.6% 98.4%Grade 11 0.8% 1.9% 4.2% 95.8%Grade 12 2.6% 3.6% 4.6% 95.4%
________________________________________________________________________________Hallucinogens? All 2.1% 4.3% 7.0% 93.0%
Grade 7 0.8% 1.6% 1.6% 98.4%Grade 8 2.3% 3.7% 5.3% 94.7%Grade 9 2.8% 4.7% 7.2% 92.8%Grade 10 2.0% 4.4% 7.2% 92.8%Grade 11 3.0% 7.5% 12.5% 87.5%
Grade 12 2.1% 4.1% 9.8% 90.2%________________________________________________________________________________Uppers? All 3.2% 5.1% 7.9% 92.1%
Grade 7 0.3% 0.8% 1.6% 98.4%Grade 8 2.7% 3.1% 5.8% 94.2%Grade 9 3.2% 5.1% 7.3% 92.7%Grade 10 2.4% 4.9% 7.7% 92.3%Grade 11 4.6% 8.0% 12.6% 87.4%Grade 12 6.9% 10.6% 14.8% 85.2%
________________________________________________________________________________Downers? All 3.3% 5.4% 8.4% 91.6%
Grade 7 0.5% 1.1% 1.6% 98.4%Grade 8 2.5% 3.2% 5.6% 94.4%Grade 9 4.4% 6.0% 8.2% 91.8%Grade 10 3.2% 6.0% 8.4% 91.6%Grade 11 4.6% 8.9% 14.7% 85.3%Grade 12 5.2% 8.4% 14.1% 85.9%
________________________________________________________________________________Rohypnol? All 0.9% 1.5% 2.7% 97.3%
Grade 7 0.5% 0.8% 1.3% 98.7%Grade 8 1.0% 1.0% 2.7% 97.3%Grade 9 1.2% 2.1% 3.1% 96.9%Grade 10 0.4% 2.0% 3.2% 96.8%Grade 11 1.9% 2.3% 4.2% 95.8%Grade 12 0.5% 1.0% 1.5% 98.5%
8/14/2019 COMAL COUNTY - New Braunfels ISD - 2005 Texas School Survey of Drug and Alcohol Use
http://slidepdf.com/reader/full/comal-county-new-braunfels-isd-2005-texas-school-survey-of-drug-and-alcohol 19/114
New BraunfelsSpring 2005
________________________________________________________________________________
Past School Ever Never
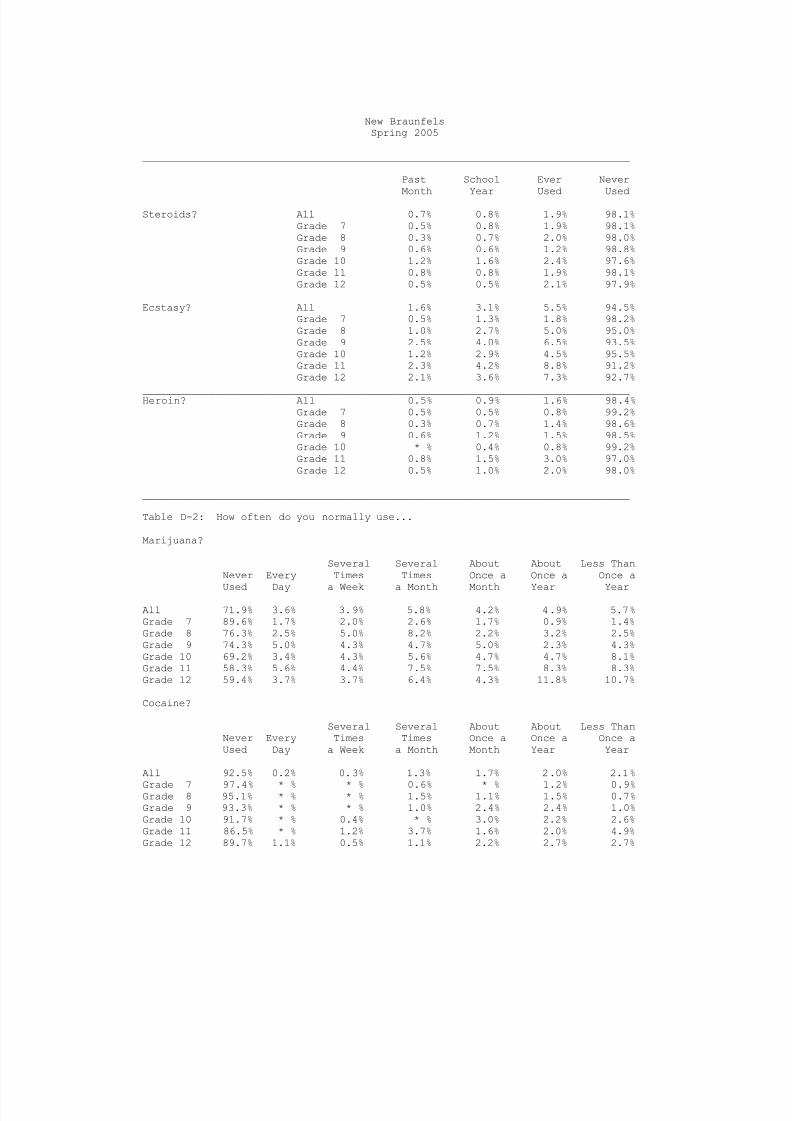
Month Year Used Used________________________________________________________________________________Steroids? All 0.7% 0.8% 1.9% 98.1%
Grade 7 0.5% 0.8% 1.9% 98.1%Grade 8 0.3% 0.7% 2.0% 98.0%Grade 9 0.6% 0.6% 1.2% 98.8%Grade 10 1.2% 1.6% 2.4% 97.6%Grade 11 0.8% 0.8% 1.9% 98.1%Grade 12 0.5% 0.5% 2.1% 97.9%
________________________________________________________________________________Ecstasy? All 1.6% 3.1% 5.5% 94.5%
Grade 7 0.5% 1.3% 1.8% 98.2%Grade 8 1.0% 2.7% 5.0% 95.0%Grade 9 2.5% 4.0% 6.5% 93.5%Grade 10 1.2% 2.9% 4.5% 95.5%Grade 11 2.3% 4.2% 8.8% 91.2%Grade 12 2.1% 3.6% 7.3% 92.7%
________________________________________________________________________________Heroin? All 0.5% 0.9% 1.6% 98.4%Grade 7 0.5% 0.5% 0.8% 99.2%Grade 8 0.3% 0.7% 1.4% 98.6%Grade 9 0.6% 1.2% 1.5% 98.5%Grade 10 * % 0.4% 0.8% 99.2%Grade 11 0.8% 1.5% 3.0% 97.0%Grade 12 0.5% 1.0% 2.0% 98.0%
________________________________________________________________________________
Table D-2: How often do you normally use...
Marijuana?
Several Several About About Less ThanNever Every Times Times Once a Once a Once a
Used Day a Week a Month Month Year Year
All 71.9% 3.6% 3.9% 5.8% 4.2% 4.9% 5.7%Grade 7 89.6% 1.7% 2.0% 2.6% 1.7% 0.9% 1.4%Grade 8 76.3% 2.5% 5.0% 8.2% 2.2% 3.2% 2.5%Grade 9 74.3% 5.0% 4.3% 4.7% 5.0% 2.3% 4.3%Grade 10 69.2% 3.4% 4.3% 5.6% 4.7% 4.7% 8.1%Grade 11 58.3% 5.6% 4.4% 7.5% 7.5% 8.3% 8.3%Grade 12 59.4% 3.7% 3.7% 6.4% 4.3% 11.8% 10.7%
Cocaine?
Several Several About About Less ThanNever Every Times Times Once a Once a Once aUsed Day a Week a Month Month Year Year
All 92.5% 0.2% 0.3% 1.3% 1.7% 2.0% 2.1%
Grade 7 97.4% * % * % 0.6% * % 1.2% 0.9%Grade 8 95.1% * % * % 1.5% 1.1% 1.5% 0.7%Grade 9 93.3% * % * % 1.0% 2.4% 2.4% 1.0%Grade 10 91.7% * % 0.4% * % 3.0% 2.2% 2.6%Grade 11 86.5% * % 1.2% 3.7% 1.6% 2.0% 4.9%Grade 12 89.7% 1.1% 0.5% 1.1% 2.2% 2.7% 2.7%

8/14/2019 COMAL COUNTY - New Braunfels ISD - 2005 Texas School Survey of Drug and Alcohol Use
http://slidepdf.com/reader/full/comal-county-new-braunfels-isd-2005-texas-school-survey-of-drug-and-alcohol 20/114
New BraunfelsSpring 2005
________________________________________________________________________________
Crack?
Several Several About About Less ThanNever Every Times Times Once a Once a Once aUsed Day a Week a Month Month Year Year
All 97.7% * % 0.1% 0.3% 0.5% 0.5% 0.8%Grade 7 98.8% * % * % 0.3% * % 0.9% * %Grade 8 98.5% * % * % 0.4% 0.4% * % 0.7%Grade 9 97.9% * % * % 0.3% * % 1.0% 0.7%Grade 10 98.7% * % * % * % 0.4% * % 0.9%Grade 11 96.4% * % 0.4% 0.4% 0.8% 1.2% 0.8%Grade 12 95.7% * % * % 0.5% 1.6% * % 2.2%
Hallucinogens?
Several Several About About Less ThanNever Every Times Times Once a Once a Once a
Used Day a Week a Month Month Year YearAll 93.6% 0.1% 0.3% 0.5% 1.6% 2.4% 1.6%Grade 7 97.4% * % * % 0.3% 0.6% 0.9% 0.9%Grade 8 94.7% * % 0.4% 0.4% 1.5% 1.5% 1.5%Grade 9 93.0% * % * % 1.0% 3.0% 1.7% 1.3%Grade 10 92.8% 0.4% 0.4% * % 1.3% 3.4% 1.7%Grade 11 90.4% * % 0.8% 1.2% 2.0% 4.0% 1.6%Grade 12 92.8% * % * % * % 1.1% 3.3% 2.8%
Uppers?
Several Several About About Less ThanNever Every Times Times Once a Once a Once aUsed Day a Week a Month Month Year Year
All 91.9% 0.3% 0.1% 1.3% 3.1% 1.3% 2.0%
Grade 7 97.9% * % * % 0.3% 0.6% 0.6% 0.6%Grade 8 94.1% 0.4% * % 1.8% 1.8% 1.1% 0.7%Grade 9 90.8% 0.7% 0.3% 0.7% 3.4% 2.4% 1.7%Grade 10 92.2% 0.4% * % 0.9% 3.0% 1.7% 1.7%Grade 11 88.2% 0.4% 0.4% 1.6% 4.1% 1.2% 4.1%Grade 12 86.7% * % * % 2.8% 6.1% 0.6% 3.9%
Downers?
Several Several About About Less ThanNever Every Times Times Once a Once a Once aUsed Day a Week a Month Month Year Year
All 91.5% 0.5% 0.2% 1.3% 3.2% 1.3% 1.9%Grade 7 98.2% * % * % 0.3% 0.6% 0.6% 0.3%Grade 8 93.3% 0.7% * % 1.9% 1.9% 1.5% 0.7%Grade 9 91.6% 0.7% 0.3% 1.3% 3.0% 2.0% 1.0%
Grade 10 91.6% 0.4% * % 1.3% 2.5% 2.1% 2.1%Grade 11 87.6% 0.8% 0.4% 1.6% 5.6% 0.4% 3.6%Grade 12 85.3% 0.6% 0.6% 1.7% 6.2% 1.1% 4.5%

8/14/2019 COMAL COUNTY - New Braunfels ISD - 2005 Texas School Survey of Drug and Alcohol Use
http://slidepdf.com/reader/full/comal-county-new-braunfels-isd-2005-texas-school-survey-of-drug-and-alcohol 21/114
New BraunfelsSpring 2005
________________________________________________________________________________
Rohypnol?
Several Several About About Less ThanNever Every Times Times Once a Once a Once aUsed Day a Week a Month Month Year Year
All 98.0% 0.1% 0.2% 0.1% 0.7% 0.6% 0.3%Grade 7 98.7% * % 0.3% * % 0.6% 0.3% * %Grade 8 97.7% 0.4% * % * % 0.8% 0.8% 0.4%Grade 9 97.9% * % 0.3% * % 1.0% 0.7% * %Grade 10 96.9% 0.4% * % * % 0.9% 0.9% 0.9%Grade 11 96.6% * % 0.4% 0.4% 0.8% 0.8% 0.8%Grade 12 100.0% * % * % * % * % * % * %
Steroids?
Several Several About About Less ThanNever Every Times Times Once a Once a Once a
Used Day a Week a Month Month Year YearAll 98.5% 0.2% 0.2% 0.1% 0.4% 0.2% 0.5%Grade 7 98.5% * % 0.3% * % 0.6% 0.6% * %Grade 8 97.7% 0.4% * % * % 0.8% 0.4% 0.8%Grade 9 99.0% * % * % 0.3% * % 0.3% 0.3%Grade 10 97.3% 0.9% 0.5% * % 0.5% * % 0.9%Grade 11 98.3% * % 0.4% * % 0.4% * % 0.8%Grade 12 100.0% * % * % * % * % * % * %
Ecstasy?
Several Several About About Less ThanNever Every Times Times Once a Once a Once aUsed Day a Week a Month Month Year Year
All 94.5% * % 0.3% 0.4% 1.1% 1.6% 2.1%
Grade 7 98.5% * % * % 0.3% 0.3% 0.6% 0.3%Grade 8 96.2% * % * % 0.4% 1.5% 0.8% 1.1%Grade 9 93.5% * % 0.3% 0.7% 1.7% 2.4% 1.4%Grade 10 95.2% * % 0.9% 0.4% 0.4% 2.2% 0.9%Grade 11 90.3% * % 0.8% 0.4% 0.8% 2.0% 5.7%Grade 12 93.3% * % * % * % 1.7% 1.7% 3.4%
Heroin?
Several Several About About Less ThanNever Every Times Times Once a Once a Once aUsed Day a Week a Month Month Year Year
All 98.4% 0.1% 0.2% 0.3% 0.3% 0.5% 0.3%Grade 7 99.4% * % 0.3% * % 0.3% * % * %Grade 8 99.6% * % * % * % * % 0.4% * %Grade 9 97.6% * % * % 0.7% 0.7% 1.0% * %
Grade 10 99.1% * % 0.4% * % * % 0.4% * %Grade 11 96.4% 0.4% 0.4% 0.4% 0.8% 0.4% 1.2%Grade 12 98.3% * % * % 0.6% * % 0.6% 0.6%

8/14/2019 COMAL COUNTY - New Braunfels ISD - 2005 Texas School Survey of Drug and Alcohol Use
http://slidepdf.com/reader/full/comal-county-new-braunfels-isd-2005-texas-school-survey-of-drug-and-alcohol 22/114
New BraunfelsSpring 2005
________________________________________________________________________________
Table D-3: Average age of first use of:
Grade 7 Grade 8 Grade 9 Grade 10 Grade 11 Grade 12
Marijuana 11.9 12.4 12.6 13.8 13.9 14.9Cocaine 12.0 13.3 13.6 14.6 15.1 15.7Crack * * * * 15.3 *Hallucinogens * 12.7 13.5 13.6 14.9 15.6Uppers * 12.7 13.3 14.3 14.6 16.0Downers * 12.8 13.5 14.3 14.8 15.7Rohypnol * * * * * *Steroids * * * * * *Ecstasy * 13.2 14.0 14.5 15.5 15.9Heroin * * * * * *
________________________________________________________________________________
Table D-4: Age of first use of marijuana by family situation:
Two parent family
Never 9/Under 10-11 12-13 14-15 16-17 18/Over
All 73.7% 1.2% 2.6% 7.6% 9.6% 5.0% 0.4%Grade 7 89.5% 0.4% 2.0% 6.9% 1.2% * % * %Grade 8 82.6% 0.6% 2.8% 10.1% 3.9% * % * %Grade 9 77.7% 1.5% 3.9% 8.7% 8.3% * % * %Grade 10 71.8% 1.2% 3.1% 4.9% 15.3% 3.1% 0.6%Grade 11 57.7% 1.8% 2.5% 11.0% 12.9% 14.1% * %Grade 12 55.8% 1.7% 0.8% 3.3% 19.2% 16.7% 2.5%
Other family situation
Never 9/Under 10-11 12-13 14-15 16-17 18/Over
All 57.4% 1.2% 5.5% 15.1% 14.8% 5.9% * %Grade 7 81.1% 1.8% 6.3% 10.8% * % * % * %Grade 8 63.2% 1.9% 9.4% 18.9% 6.6% * % * %Grade 9 57.5% 0.9% 8.5% 19.8% 13.2% * % * %Grade 10 53.2% 2.6% 1.3% 14.3% 22.1% 6.5% * %Grade 11 50.5% * % 6.1% 17.2% 16.2% 10.1% * %Grade 12 38.4% * % * % 8.2% 32.9% 20.5% * %
________________________________________________________________________________
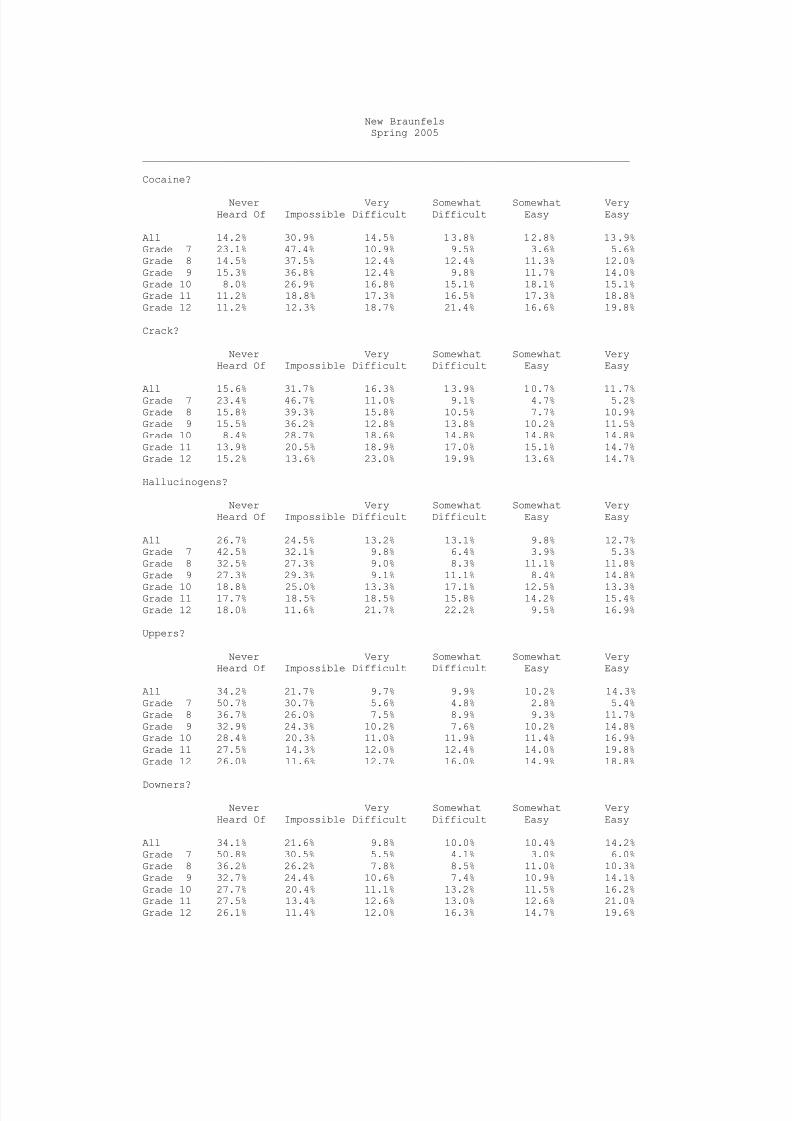
Table D-5: If you wanted some, how difficult would it be to get..
Marijuana?
Never Very Somewhat Somewhat VeryHeard Of Impossible Difficult Difficult Easy Easy
All 9.6% 22.7% 6.2% 10.3% 16.6% 34.5%Grade 7 19.4% 43.8% 6.9% 6.6% 7.5% 15.8%Grade 8 8.5% 28.2% 6.5% 9.2% 16.3% 31.3%Grade 9 11.4% 26.1% 6.8% 7.8% 13.0% 34.9%Grade 10 4.5% 15.6% 7.8% 10.7% 20.6% 40.7%Grade 11 6.5% 9.6% 4.2% 12.7% 24.2% 42.7%Grade 12 5.3% 7.5% 4.3% 16.6% 20.3% 46.0%
8/14/2019 COMAL COUNTY - New Braunfels ISD - 2005 Texas School Survey of Drug and Alcohol Use
http://slidepdf.com/reader/full/comal-county-new-braunfels-isd-2005-texas-school-survey-of-drug-and-alcohol 23/114
8/14/2019 COMAL COUNTY - New Braunfels ISD - 2005 Texas School Survey of Drug and Alcohol Use
http://slidepdf.com/reader/full/comal-county-new-braunfels-isd-2005-texas-school-survey-of-drug-and-alcohol 24/114
New BraunfelsSpring 2005
________________________________________________________________________________
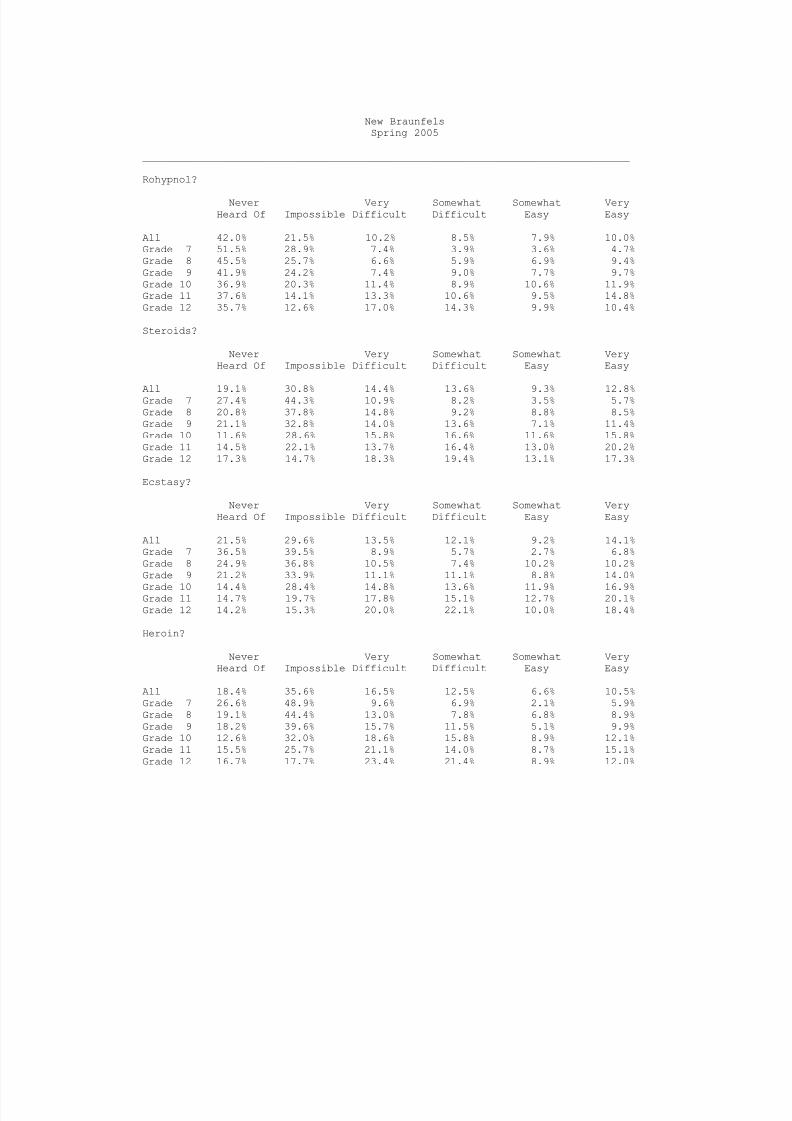
Rohypnol?
Never Very Somewhat Somewhat VeryHeard Of Impossible Difficult Difficult Easy Easy
All 42.0% 21.5% 10.2% 8.5% 7.9% 10.0%Grade 7 51.5% 28.9% 7.4% 3.9% 3.6% 4.7%Grade 8 45.5% 25.7% 6.6% 5.9% 6.9% 9.4%Grade 9 41.9% 24.2% 7.4% 9.0% 7.7% 9.7%Grade 10 36.9% 20.3% 11.4% 8.9% 10.6% 11.9%Grade 11 37.6% 14.1% 13.3% 10.6% 9.5% 14.8%Grade 12 35.7% 12.6% 17.0% 14.3% 9.9% 10.4%
Steroids?
Never Very Somewhat Somewhat VeryHeard Of Impossible Difficult Difficult Easy Easy
All 19.1% 30.8% 14.4% 13.6% 9.3% 12.8%Grade 7 27.4% 44.3% 10.9% 8.2% 3.5% 5.7%Grade 8 20.8% 37.8% 14.8% 9.2% 8.8% 8.5%Grade 9 21.1% 32.8% 14.0% 13.6% 7.1% 11.4%Grade 10 11.6% 28.6% 15.8% 16.6% 11.6% 15.8%Grade 11 14.5% 22.1% 13.7% 16.4% 13.0% 20.2%Grade 12 17.3% 14.7% 18.3% 19.4% 13.1% 17.3%
Ecstasy?
Never Very Somewhat Somewhat VeryHeard Of Impossible Difficult Difficult Easy Easy
All 21.5% 29.6% 13.5% 12.1% 9.2% 14.1%Grade 7 36.5% 39.5% 8.9% 5.7% 2.7% 6.8%Grade 8 24.9% 36.8% 10.5% 7.4% 10.2% 10.2%Grade 9 21.2% 33.9% 11.1% 11.1% 8.8% 14.0%
Grade 10 14.4% 28.4% 14.8% 13.6% 11.9% 16.9%Grade 11 14.7% 19.7% 17.8% 15.1% 12.7% 20.1%Grade 12 14.2% 15.3% 20.0% 22.1% 10.0% 18.4%
Heroin?
Never Very Somewhat Somewhat VeryHeard Of Impossible Difficult Difficult Easy Easy
All 18.4% 35.6% 16.5% 12.5% 6.6% 10.5%Grade 7 26.6% 48.9% 9.6% 6.9% 2.1% 5.9%Grade 8 19.1% 44.4% 13.0% 7.8% 6.8% 8.9%Grade 9 18.2% 39.6% 15.7% 11.5% 5.1% 9.9%Grade 10 12.6% 32.0% 18.6% 15.8% 8.9% 12.1%Grade 11 15.5% 25.7% 21.1% 14.0% 8.7% 15.1%Grade 12 16.7% 17.7% 23.4% 21.4% 8.9% 12.0%

8/14/2019 COMAL COUNTY - New Braunfels ISD - 2005 Texas School Survey of Drug and Alcohol Use
http://slidepdf.com/reader/full/comal-county-new-braunfels-isd-2005-texas-school-survey-of-drug-and-alcohol 25/114
New BraunfelsSpring 2005
________________________________________________________________________________
Table D-6: Since school began in the fall, on how many days (if any) have you..
Attended class while high from marijuana use?
None 1-3 Days 4-9 Days 10+ Days
All 89% 6.7% 1.7% 3.1%Grade 7 94% 3.3% 1.1% 1.7%Grade 8 86% 8.1% 2.5% 3.2%Grade 9 89% 5.6% 2.1% 3.1%Grade 10 89% 6.7% 2.4% 1.4%Grade 11 84% 10.3% 1.1% 5.0%Grade 12 88% 6.3% 1.1% 4.2%
Attended class while high from use of some other drug?
None 1-3 Days 4-9 Days 10+ Days
All 93% 5.2% 1.1% 1.2%Grade 7 96% 2.7% 0.5% 1.1%Grade 8 91% 7.7% 1.1% 0.4%Grade 9 94% 2.8% 1.1% 1.8%Grade 10 94% 4.3% 0.5% 0.9%Grade 11 89% 7.6% 2.3% 1.1%Grade 12 91% 6.3% 1.0% 2.1%
Gotten into trouble with teachers because of your drug use?
None 1-3 Days 4-9 Days 10+ Days
All 98% 1.4% 0.5% 0.3%Grade 7 98% 0.6% 1.1% 0.6%Grade 8 97% 2.8% * % * %Grade 9 99% 0.7% 0.3% 0.3%Grade 10 98% 0.9% 0.5% 0.5%
Grade 11 98% 1.9% 0.4% * %Grade 12 97% 1.6% 0.5% 0.5%
________________________________________________________________________________
Table D-7: School year use of marijuana by absences and conduct problems:
Average days absent due to illness or other reasons:
Marijuana Users: 5.0 days per studentMarijuana Non-users: 4.2 days per student
Average days conduct problems reported:
Marijuana Users: 5.0 days per studentMarijuana Non-users: 1.5 days per student
8/14/2019 COMAL COUNTY - New Braunfels ISD - 2005 Texas School Survey of Drug and Alcohol Use
http://slidepdf.com/reader/full/comal-county-new-braunfels-isd-2005-texas-school-survey-of-drug-and-alcohol 26/114
New BraunfelsSpring 2005
________________________________________________________________________________
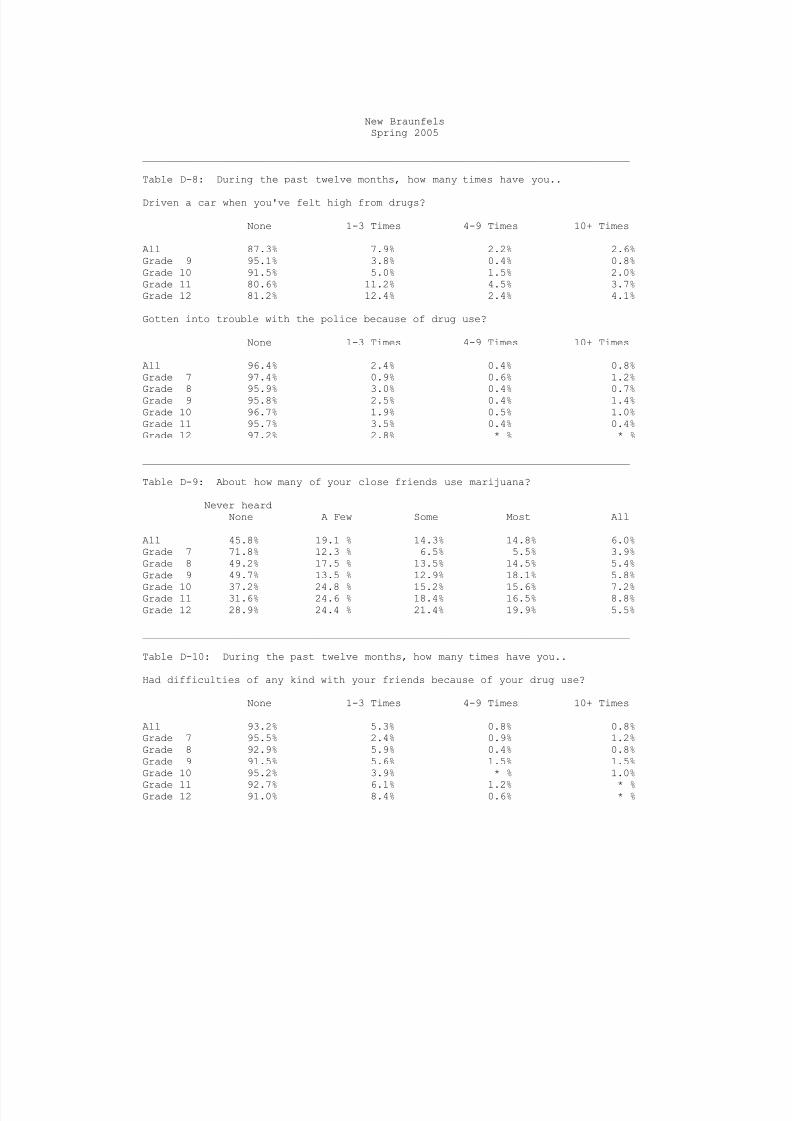
Table D-8: During the past twelve months, how many times have you..
Driven a car when you've felt high from drugs?
None 1-3 Times 4-9 Times 10+ Times
All 87.3% 7.9% 2.2% 2.6%Grade 9 95.1% 3.8% 0.4% 0.8%Grade 10 91.5% 5.0% 1.5% 2.0%Grade 11 80.6% 11.2% 4.5% 3.7%Grade 12 81.2% 12.4% 2.4% 4.1%
Gotten into trouble with the police because of drug use?
None 1-3 Times 4-9 Times 10+ Times
All 96.4% 2.4% 0.4% 0.8%Grade 7 97.4% 0.9% 0.6% 1.2%
Grade 8 95.9% 3.0% 0.4% 0.7%Grade 9 95.8% 2.5% 0.4% 1.4%Grade 10 96.7% 1.9% 0.5% 1.0%Grade 11 95.7% 3.5% 0.4% 0.4%Grade 12 97.2% 2.8% * % * %
________________________________________________________________________________
Table D-9: About how many of your close friends use marijuana?
Never heardNone A Few Some Most All
All 45.8% 19.1 % 14.3% 14.8% 6.0%Grade 7 71.8% 12.3 % 6.5% 5.5% 3.9%Grade 8 49.2% 17.5 % 13.5% 14.5% 5.4%Grade 9 49.7% 13.5 % 12.9% 18.1% 5.8%
Grade 10 37.2% 24.8 % 15.2% 15.6% 7.2%Grade 11 31.6% 24.6 % 18.4% 16.5% 8.8%Grade 12 28.9% 24.4 % 21.4% 19.9% 5.5%
________________________________________________________________________________
Table D-10: During the past twelve months, how many times have you..
Had difficulties of any kind with your friends because of your drug use?
None 1-3 Times 4-9 Times 10+ Times
All 93.2% 5.3% 0.8% 0.8%Grade 7 95.5% 2.4% 0.9% 1.2%Grade 8 92.9% 5.9% 0.4% 0.8%Grade 9 91.5% 5.6% 1.5% 1.5%Grade 10 95.2% 3.9% * % 1.0%
Grade 11 92.7% 6.1% 1.2% * %Grade 12 91.0% 8.4% 0.6% * %
8/14/2019 COMAL COUNTY - New Braunfels ISD - 2005 Texas School Survey of Drug and Alcohol Use
http://slidepdf.com/reader/full/comal-county-new-braunfels-isd-2005-texas-school-survey-of-drug-and-alcohol 27/114
New BraunfelsSpring 2005
________________________________________________________________________________
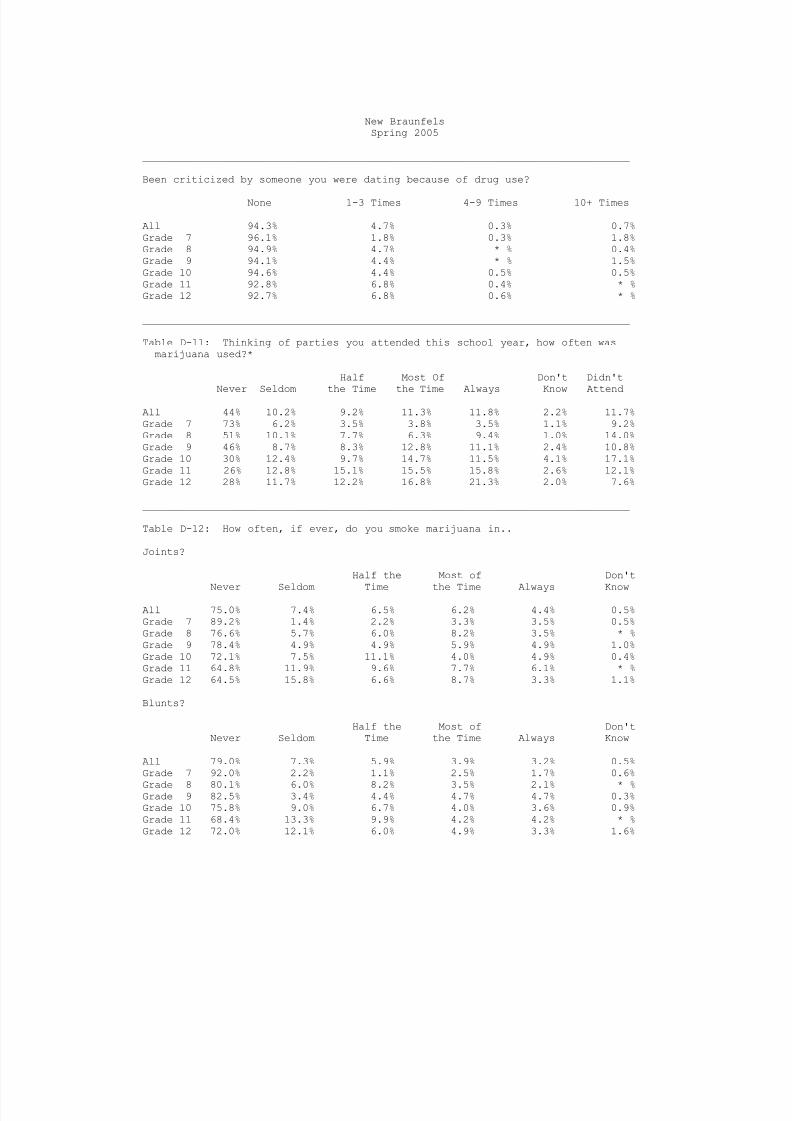
Been criticized by someone you were dating because of drug use?
None 1-3 Times 4-9 Times 10+ Times
All 94.3% 4.7% 0.3% 0.7%Grade 7 96.1% 1.8% 0.3% 1.8%Grade 8 94.9% 4.7% * % 0.4%Grade 9 94.1% 4.4% * % 1.5%Grade 10 94.6% 4.4% 0.5% 0.5%Grade 11 92.8% 6.8% 0.4% * %Grade 12 92.7% 6.8% 0.6% * %
________________________________________________________________________________
Table D-11: Thinking of parties you attended this school year, how often wasmarijuana used?*
Half Most Of Don't Didn't
Never Seldom the Time the Time Always Know AttendAll 44% 10.2% 9.2% 11.3% 11.8% 2.2% 11.7%Grade 7 73% 6.2% 3.5% 3.8% 3.5% 1.1% 9.2%Grade 8 51% 10.1% 7.7% 6.3% 9.4% 1.0% 14.0%Grade 9 46% 8.7% 8.3% 12.8% 11.1% 2.4% 10.8%Grade 10 30% 12.4% 9.7% 14.7% 11.5% 4.1% 17.1%Grade 11 26% 12.8% 15.1% 15.5% 15.8% 2.6% 12.1%Grade 12 28% 11.7% 12.2% 16.8% 21.3% 2.0% 7.6%
________________________________________________________________________________
Table D-12: How often, if ever, do you smoke marijuana in..
Joints?
Half the Most of Don't
Never Seldom Time the Time Always Know
All 75.0% 7.4% 6.5% 6.2% 4.4% 0.5%Grade 7 89.2% 1.4% 2.2% 3.3% 3.5% 0.5%Grade 8 76.6% 5.7% 6.0% 8.2% 3.5% * %Grade 9 78.4% 4.9% 4.9% 5.9% 4.9% 1.0%Grade 10 72.1% 7.5% 11.1% 4.0% 4.9% 0.4%Grade 11 64.8% 11.9% 9.6% 7.7% 6.1% * %Grade 12 64.5% 15.8% 6.6% 8.7% 3.3% 1.1%
Blunts?
Half the Most of Don'tNever Seldom Time the Time Always Know
All 79.0% 7.3% 5.9% 3.9% 3.2% 0.5%Grade 7 92.0% 2.2% 1.1% 2.5% 1.7% 0.6%
Grade 8 80.1% 6.0% 8.2% 3.5% 2.1% * %Grade 9 82.5% 3.4% 4.4% 4.7% 4.7% 0.3%Grade 10 75.8% 9.0% 6.7% 4.0% 3.6% 0.9%Grade 11 68.4% 13.3% 9.9% 4.2% 4.2% * %Grade 12 72.0% 12.1% 6.0% 4.9% 3.3% 1.6%

8/14/2019 COMAL COUNTY - New Braunfels ISD - 2005 Texas School Survey of Drug and Alcohol Use
http://slidepdf.com/reader/full/comal-county-new-braunfels-isd-2005-texas-school-survey-of-drug-and-alcohol 28/114
New BraunfelsSpring 2005
________________________________________________________________________________
Bongs or water pipes?
Half the Most of Don'tNever Seldom Time the Time Always Know
All 80.1% 8.0% 4.3% 3.9% 3.3% 0.4%Grade 7 92.0% 2.2% 1.1% 1.9% 2.5% 0.3%Grade 8 82.0% 7.0% 6.3% 3.2% 1.4% * %Grade 9 81.5% 5.4% 3.0% 4.7% 4.7% 0.7%Grade 10 77.2% 9.4% 5.8% 4.5% 2.2% 0.9%Grade 11 71.6% 12.6% 4.6% 6.1% 5.0% * %Grade 12 72.8% 13.6% 6.0% 3.3% 3.8% 0.5%
Pipes?
Half the Most of Don'tNever Seldom Time the Time Always Know
All 76.9% 6.8% 5.2% 6.3% 4.2% 0.5%Grade 7 91.7% 2.8% 0.8% 1.9% 2.5% 0.3%Grade 8 79.2% 7.0% 6.0% 5.3% 2.1% 0.4%Grade 9 79.7% 6.0% 4.3% 4.7% 4.7% 0.7%Grade 10 76.1% 6.2% 7.1% 6.2% 3.1% 1.3%Grade 11 64.2% 9.2% 6.9% 11.2% 8.5% * %Grade 12 66.7% 10.8% 7.0% 10.2% 4.8% 0.5%
Some other way?
Half the Most of Don'tNever Seldom Time the Time Always Know
All 86.4% 6.0% 2.0% 1.7% 2.3% 1.5%Grade 7 94.7% 0.3% 0.8% 1.9% 1.4% 0.8%Grade 8 86.4% 6.6% 2.4% 2.1% 1.4% 1.0%Grade 9 87.2% 3.7% 2.0% 2.0% 3.4% 1.7%
Grade 10 84.8% 7.2% 1.3% 1.8% 2.2% 2.7%Grade 11 80.9% 9.7% 3.9% 1.2% 2.7% 1.6%Grade 12 82.2% 10.6% 1.7% 1.1% 2.8% 1.7%
________________________________________________________________________________
Table D-13: How do your parents feel about kids your age using marijuana?
Strongly Mildly Mildly Strongly Don'tDisapprove Disapprove Neither Approve Approve Know
All 78.8% 6.3% 4.9% 1.9% 1.9% 6.2%Grade 7 81.4% 3.4% 2.6% 0.9% 4.0% 7.7%Grade 8 82.8% 5.5% 3.3% 2.2% 1.8% 4.4%Grade 9 78.5% 4.7% 4.4% 3.3% 1.8% 7.3%Grade 10 79.4% 9.3% 4.9% 1.5% 1.0% 3.9%Grade 11 75.6% 6.1% 7.3% 2.3% 1.9% 6.9%
Grade 12 74.6% 9.8% 7.3% 1.6% 0.5% 6.2%
8/14/2019 COMAL COUNTY - New Braunfels ISD - 2005 Texas School Survey of Drug and Alcohol Use
http://slidepdf.com/reader/full/comal-county-new-braunfels-isd-2005-texas-school-survey-of-drug-and-alcohol 29/114
8/14/2019 COMAL COUNTY - New Braunfels ISD - 2005 Texas School Survey of Drug and Alcohol Use
http://slidepdf.com/reader/full/comal-county-new-braunfels-isd-2005-texas-school-survey-of-drug-and-alcohol 30/114
New BraunfelsSpring 2005
________________________________________________________________________________
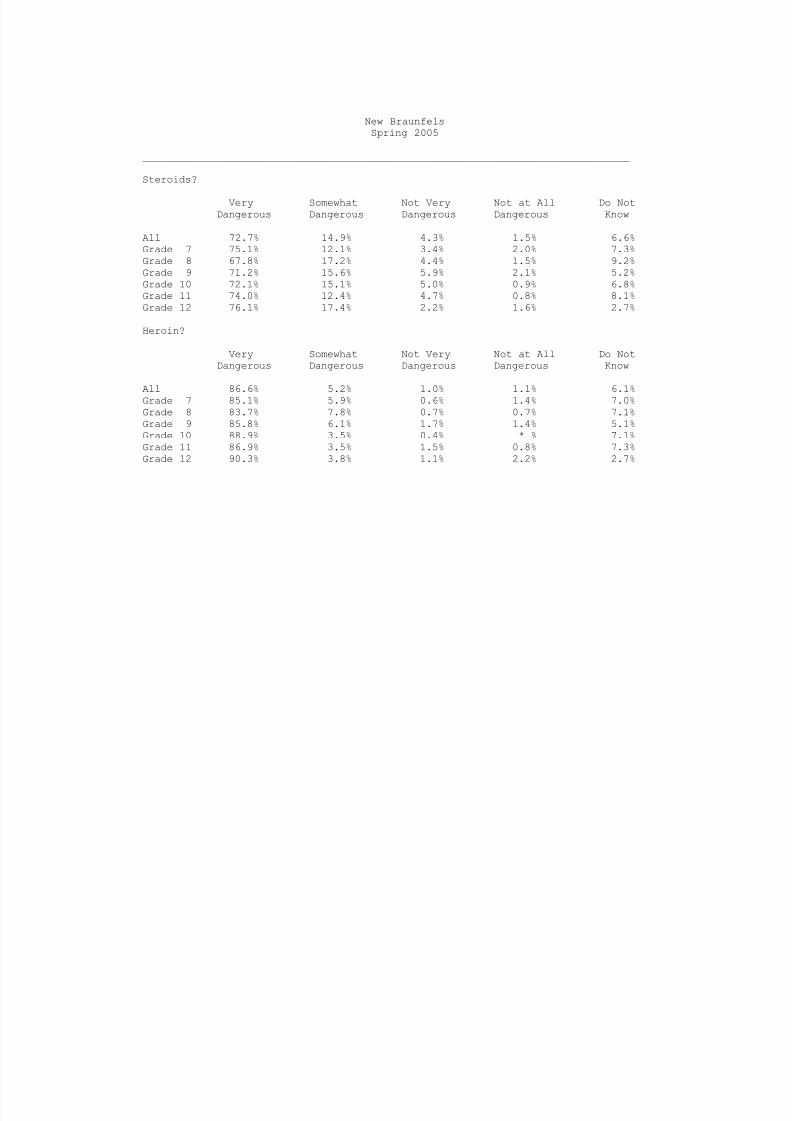
Steroids?
Very Somewhat Not Very Not at All Do NotDangerous Dangerous Dangerous Dangerous Know
All 72.7% 14.9% 4.3% 1.5% 6.6%Grade 7 75.1% 12.1% 3.4% 2.0% 7.3%Grade 8 67.8% 17.2% 4.4% 1.5% 9.2%Grade 9 71.2% 15.6% 5.9% 2.1% 5.2%Grade 10 72.1% 15.1% 5.0% 0.9% 6.8%Grade 11 74.0% 12.4% 4.7% 0.8% 8.1%Grade 12 76.1% 17.4% 2.2% 1.6% 2.7%
Heroin?
Very Somewhat Not Very Not at All Do NotDangerous Dangerous Dangerous Dangerous Know
All 86.6% 5.2% 1.0% 1.1% 6.1%Grade 7 85.1% 5.9% 0.6% 1.4% 7.0%Grade 8 83.7% 7.8% 0.7% 0.7% 7.1%Grade 9 85.8% 6.1% 1.7% 1.4% 5.1%Grade 10 88.9% 3.5% 0.4% * % 7.1%Grade 11 86.9% 3.5% 1.5% 0.8% 7.3%Grade 12 90.3% 3.8% 1.1% 2.2% 2.7%

8/14/2019 COMAL COUNTY - New Braunfels ISD - 2005 Texas School Survey of Drug and Alcohol Use
http://slidepdf.com/reader/full/comal-county-new-braunfels-isd-2005-texas-school-survey-of-drug-and-alcohol 31/114
8/14/2019 COMAL COUNTY - New Braunfels ISD - 2005 Texas School Survey of Drug and Alcohol Use
http://slidepdf.com/reader/full/comal-county-new-braunfels-isd-2005-texas-school-survey-of-drug-and-alcohol 32/114
New BraunfelsSpring 2005
________________________________________________________________________________
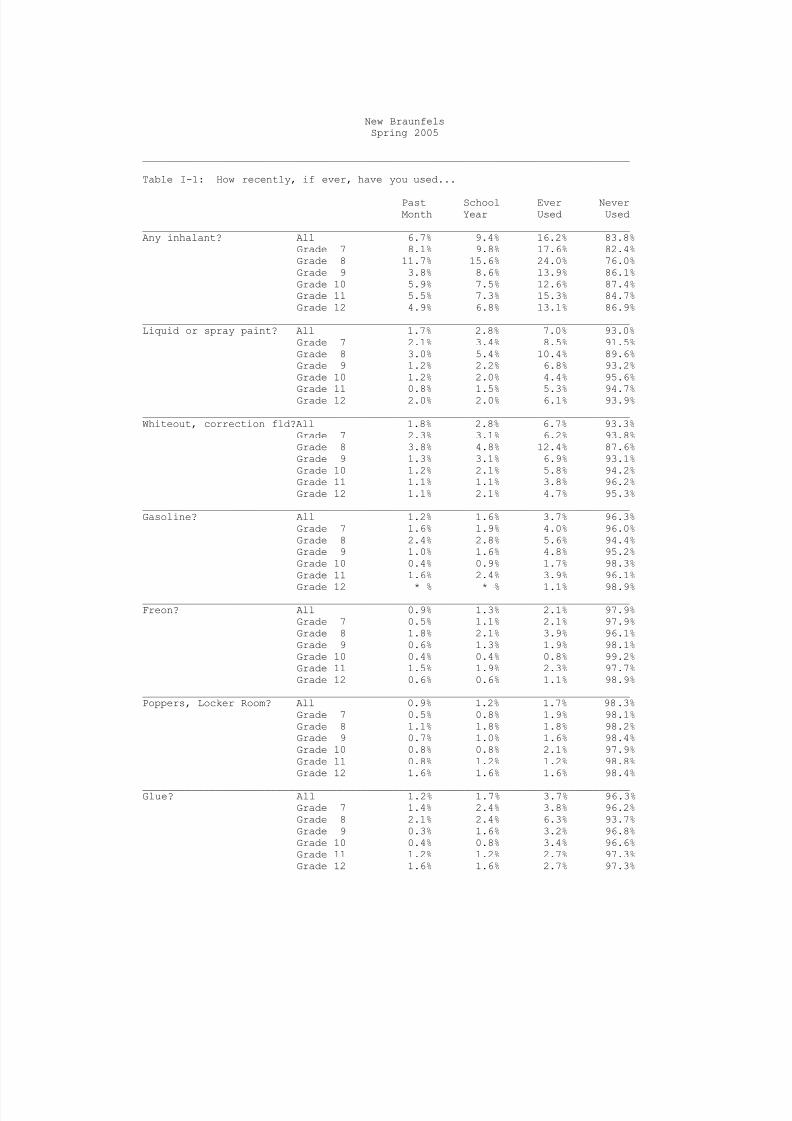
Table I-1: How recently, if ever, have you used...
Past School Ever NeverMonth Year Used Used
________________________________________________________________________________Any inhalant? All 6.7% 9.4% 16.2% 83.8%
Grade 7 8.1% 9.8% 17.6% 82.4%Grade 8 11.7% 15.6% 24.0% 76.0%Grade 9 3.8% 8.6% 13.9% 86.1%Grade 10 5.9% 7.5% 12.6% 87.4%Grade 11 5.5% 7.3% 15.3% 84.7%Grade 12 4.9% 6.8% 13.1% 86.9%
________________________________________________________________________________Liquid or spray paint? All 1.7% 2.8% 7.0% 93.0%
Grade 7 2.1% 3.4% 8.5% 91.5%Grade 8 3.0% 5.4% 10.4% 89.6%Grade 9 1.2% 2.2% 6.8% 93.2%Grade 10 1.2% 2.0% 4.4% 95.6%
Grade 11 0.8% 1.5% 5.3% 94.7%Grade 12 2.0% 2.0% 6.1% 93.9%________________________________________________________________________________Whiteout, correction fld?All 1.8% 2.8% 6.7% 93.3%
Grade 7 2.3% 3.1% 6.2% 93.8%Grade 8 3.8% 4.8% 12.4% 87.6%Grade 9 1.3% 3.1% 6.9% 93.1%Grade 10 1.2% 2.1% 5.8% 94.2%Grade 11 1.1% 1.1% 3.8% 96.2%Grade 12 1.1% 2.1% 4.7% 95.3%
________________________________________________________________________________Gasoline? All 1.2% 1.6% 3.7% 96.3%
Grade 7 1.6% 1.9% 4.0% 96.0%Grade 8 2.4% 2.8% 5.6% 94.4%Grade 9 1.0% 1.6% 4.8% 95.2%Grade 10 0.4% 0.9% 1.7% 98.3%Grade 11 1.6% 2.4% 3.9% 96.1%
Grade 12 * % * % 1.1% 98.9%________________________________________________________________________________Freon? All 0.9% 1.3% 2.1% 97.9%
Grade 7 0.5% 1.1% 2.1% 97.9%Grade 8 1.8% 2.1% 3.9% 96.1%Grade 9 0.6% 1.3% 1.9% 98.1%Grade 10 0.4% 0.4% 0.8% 99.2%Grade 11 1.5% 1.9% 2.3% 97.7%Grade 12 0.6% 0.6% 1.1% 98.9%
________________________________________________________________________________Poppers, Locker Room? All 0.9% 1.2% 1.7% 98.3%
Grade 7 0.5% 0.8% 1.9% 98.1%Grade 8 1.1% 1.8% 1.8% 98.2%Grade 9 0.7% 1.0% 1.6% 98.4%Grade 10 0.8% 0.8% 2.1% 97.9%Grade 11 0.8% 1.2% 1.2% 98.8%Grade 12 1.6% 1.6% 1.6% 98.4%
________________________________________________________________________________Glue? All 1.2% 1.7% 3.7% 96.3%
Grade 7 1.4% 2.4% 3.8% 96.2%Grade 8 2.1% 2.4% 6.3% 93.7%Grade 9 0.3% 1.6% 3.2% 96.8%Grade 10 0.4% 0.8% 3.4% 96.6%Grade 11 1.2% 1.2% 2.7% 97.3%Grade 12 1.6% 1.6% 2.7% 97.3%
8/14/2019 COMAL COUNTY - New Braunfels ISD - 2005 Texas School Survey of Drug and Alcohol Use
http://slidepdf.com/reader/full/comal-county-new-braunfels-isd-2005-texas-school-survey-of-drug-and-alcohol 33/114
New BraunfelsSpring 2005
________________________________________________________________________________
Past School Ever Never
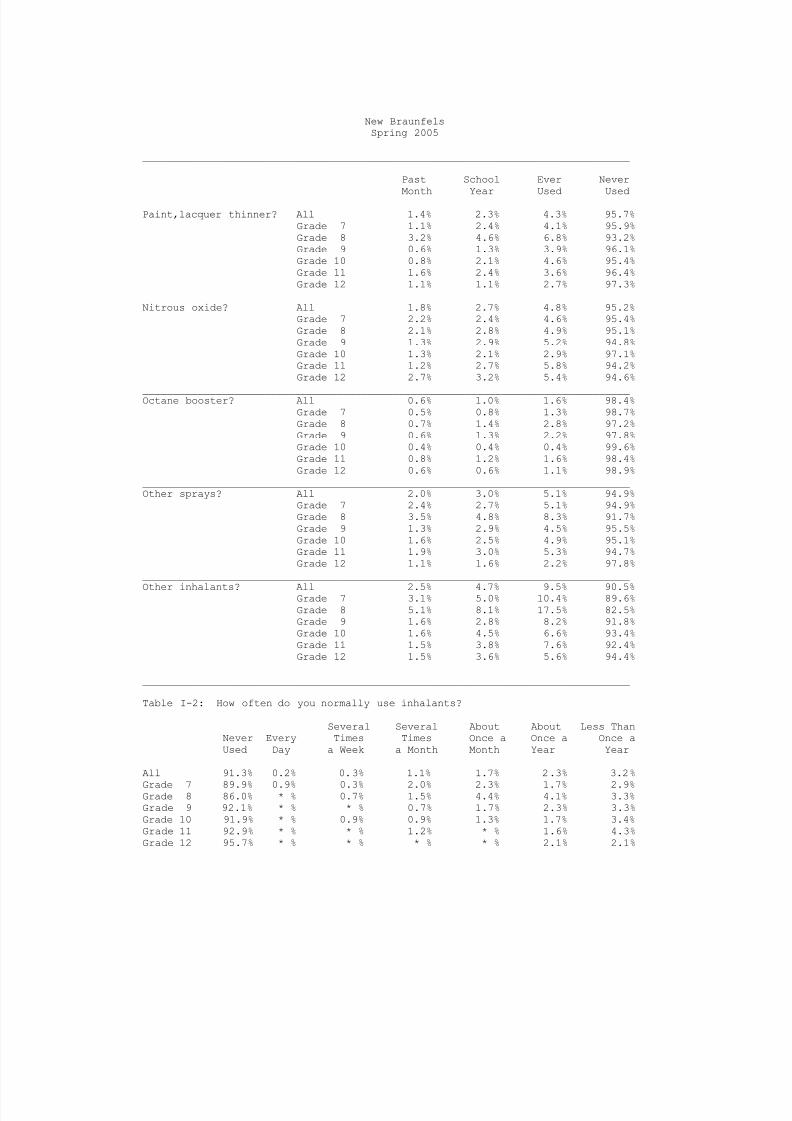
Month Year Used Used________________________________________________________________________________Paint,lacquer thinner? All 1.4% 2.3% 4.3% 95.7%
Grade 7 1.1% 2.4% 4.1% 95.9%Grade 8 3.2% 4.6% 6.8% 93.2%Grade 9 0.6% 1.3% 3.9% 96.1%Grade 10 0.8% 2.1% 4.6% 95.4%Grade 11 1.6% 2.4% 3.6% 96.4%Grade 12 1.1% 1.1% 2.7% 97.3%
________________________________________________________________________________Nitrous oxide? All 1.8% 2.7% 4.8% 95.2%
Grade 7 2.2% 2.4% 4.6% 95.4%Grade 8 2.1% 2.8% 4.9% 95.1%Grade 9 1.3% 2.9% 5.2% 94.8%Grade 10 1.3% 2.1% 2.9% 97.1%Grade 11 1.2% 2.7% 5.8% 94.2%Grade 12 2.7% 3.2% 5.4% 94.6%
________________________________________________________________________________Octane booster? All 0.6% 1.0% 1.6% 98.4%Grade 7 0.5% 0.8% 1.3% 98.7%Grade 8 0.7% 1.4% 2.8% 97.2%Grade 9 0.6% 1.3% 2.2% 97.8%Grade 10 0.4% 0.4% 0.4% 99.6%Grade 11 0.8% 1.2% 1.6% 98.4%Grade 12 0.6% 0.6% 1.1% 98.9%
________________________________________________________________________________Other sprays? All 2.0% 3.0% 5.1% 94.9%
Grade 7 2.4% 2.7% 5.1% 94.9%Grade 8 3.5% 4.8% 8.3% 91.7%Grade 9 1.3% 2.9% 4.5% 95.5%Grade 10 1.6% 2.5% 4.9% 95.1%Grade 11 1.9% 3.0% 5.3% 94.7%Grade 12 1.1% 1.6% 2.2% 97.8%
________________________________________________________________________________
Other inhalants? All 2.5% 4.7% 9.5% 90.5%Grade 7 3.1% 5.0% 10.4% 89.6%Grade 8 5.1% 8.1% 17.5% 82.5%Grade 9 1.6% 2.8% 8.2% 91.8%Grade 10 1.6% 4.5% 6.6% 93.4%Grade 11 1.5% 3.8% 7.6% 92.4%Grade 12 1.5% 3.6% 5.6% 94.4%
________________________________________________________________________________
Table I-2: How often do you normally use inhalants?
Several Several About About Less ThanNever Every Times Times Once a Once a Once aUsed Day a Week a Month Month Year Year
All 91.3% 0.2% 0.3% 1.1% 1.7% 2.3% 3.2%
Grade 7 89.9% 0.9% 0.3% 2.0% 2.3% 1.7% 2.9%Grade 8 86.0% * % 0.7% 1.5% 4.4% 4.1% 3.3%Grade 9 92.1% * % * % 0.7% 1.7% 2.3% 3.3%Grade 10 91.9% * % 0.9% 0.9% 1.3% 1.7% 3.4%Grade 11 92.9% * % * % 1.2% * % 1.6% 4.3%Grade 12 95.7% * % * % * % * % 2.1% 2.1%
8/14/2019 COMAL COUNTY - New Braunfels ISD - 2005 Texas School Survey of Drug and Alcohol Use
http://slidepdf.com/reader/full/comal-county-new-braunfels-isd-2005-texas-school-survey-of-drug-and-alcohol 34/114
New BraunfelsSpring 2005
________________________________________________________________________________
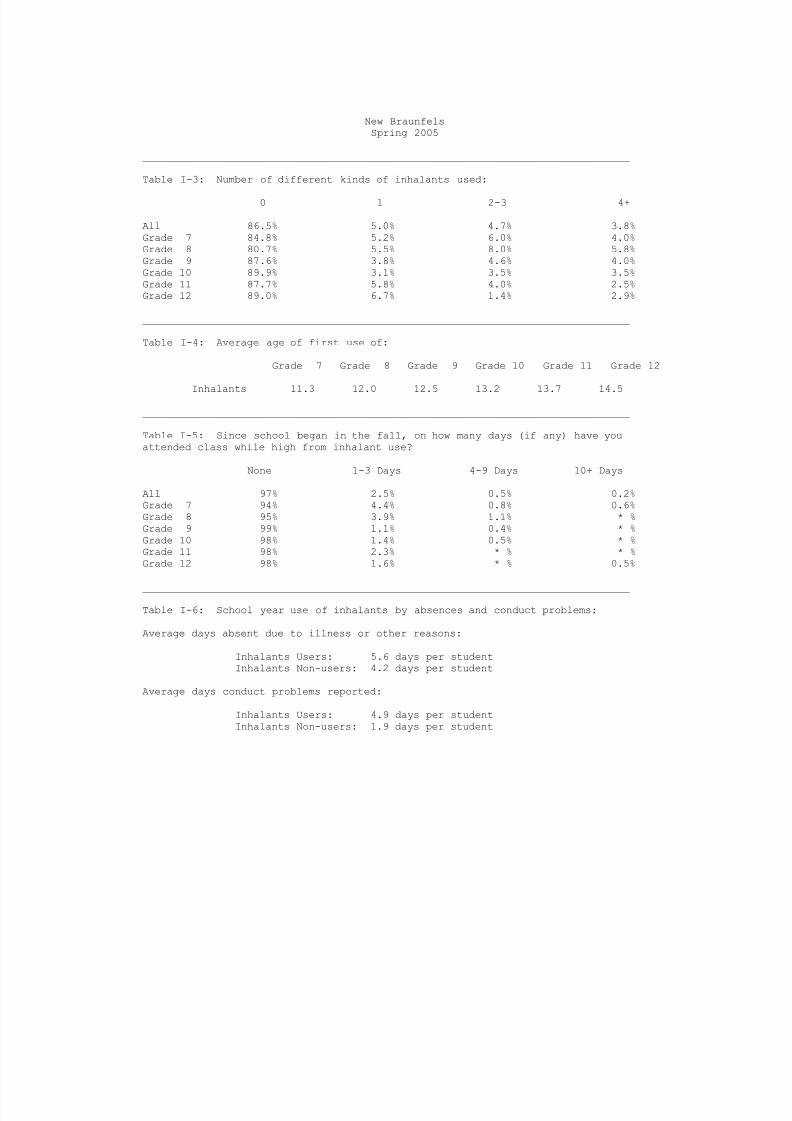
Table I-3: Number of different kinds of inhalants used:
0 1 2-3 4+
All 86.5% 5.0% 4.7% 3.8%Grade 7 84.8% 5.2% 6.0% 4.0%Grade 8 80.7% 5.5% 8.0% 5.8%Grade 9 87.6% 3.8% 4.6% 4.0%Grade 10 89.9% 3.1% 3.5% 3.5%Grade 11 87.7% 5.8% 4.0% 2.5%Grade 12 89.0% 6.7% 1.4% 2.9%
________________________________________________________________________________
Table I-4: Average age of first use of:
Grade 7 Grade 8 Grade 9 Grade 10 Grade 11 Grade 12
Inhalants 11.3 12.0 12.5 13.2 13.7 14.5________________________________________________________________________________
Table I-5: Since school began in the fall, on how many days (if any) have youattended class while high from inhalant use?
None 1-3 Days 4-9 Days 10+ Days
All 97% 2.5% 0.5% 0.2%Grade 7 94% 4.4% 0.8% 0.6%Grade 8 95% 3.9% 1.1% * %Grade 9 99% 1.1% 0.4% * %Grade 10 98% 1.4% 0.5% * %Grade 11 98% 2.3% * % * %Grade 12 98% 1.6% * % 0.5%
________________________________________________________________________________
Table I-6: School year use of inhalants by absences and conduct problems:
Average days absent due to illness or other reasons:
Inhalants Users: 5.6 days per studentInhalants Non-users: 4.2 days per student
Average days conduct problems reported:
Inhalants Users: 4.9 days per studentInhalants Non-users: 1.9 days per student
8/14/2019 COMAL COUNTY - New Braunfels ISD - 2005 Texas School Survey of Drug and Alcohol Use
http://slidepdf.com/reader/full/comal-county-new-braunfels-isd-2005-texas-school-survey-of-drug-and-alcohol 35/114
New BraunfelsSpring 2005
________________________________________________________________________________
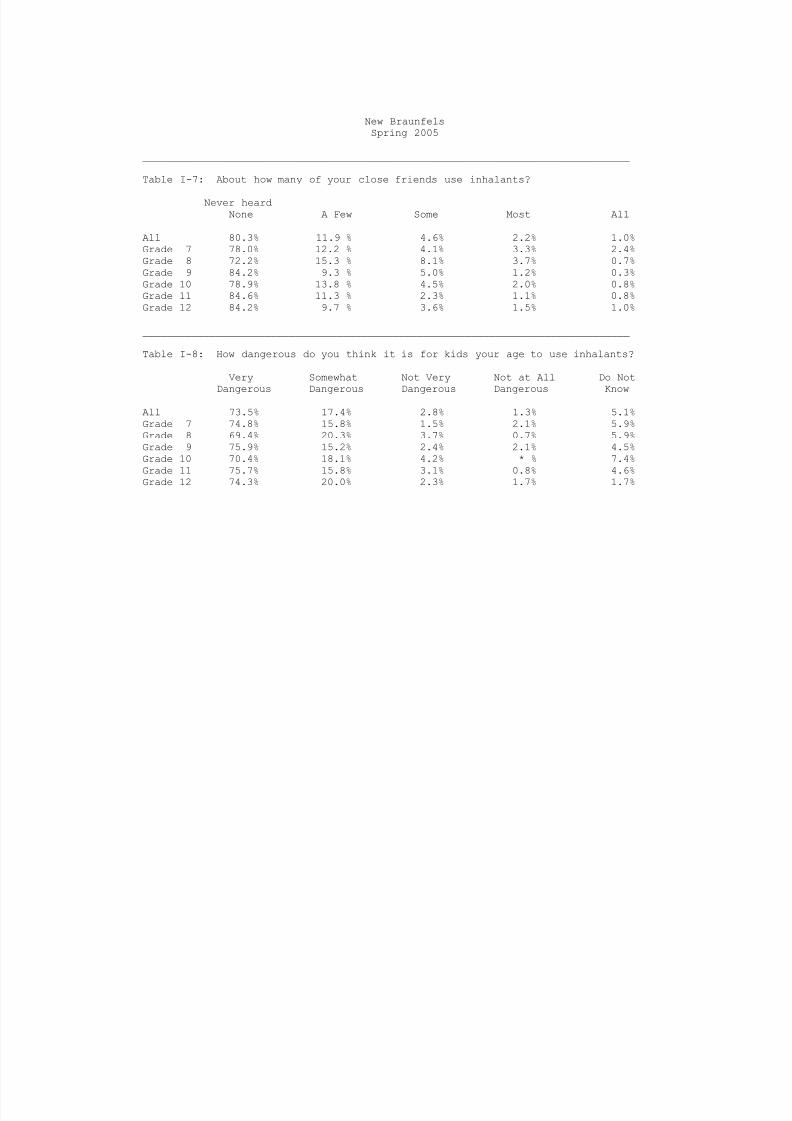
Table I-7: About how many of your close friends use inhalants?
Never heardNone A Few Some Most All
All 80.3% 11.9 % 4.6% 2.2% 1.0%Grade 7 78.0% 12.2 % 4.1% 3.3% 2.4%Grade 8 72.2% 15.3 % 8.1% 3.7% 0.7%Grade 9 84.2% 9.3 % 5.0% 1.2% 0.3%Grade 10 78.9% 13.8 % 4.5% 2.0% 0.8%Grade 11 84.6% 11.3 % 2.3% 1.1% 0.8%Grade 12 84.2% 9.7 % 3.6% 1.5% 1.0%
________________________________________________________________________________
Table I-8: How dangerous do you think it is for kids your age to use inhalants?
Very Somewhat Not Very Not at All Do Not
Dangerous Dangerous Dangerous Dangerous KnowAll 73.5% 17.4% 2.8% 1.3% 5.1%Grade 7 74.8% 15.8% 1.5% 2.1% 5.9%Grade 8 69.4% 20.3% 3.7% 0.7% 5.9%Grade 9 75.9% 15.2% 2.4% 2.1% 4.5%Grade 10 70.4% 18.1% 4.2% * % 7.4%Grade 11 75.7% 15.8% 3.1% 0.8% 4.6%Grade 12 74.3% 20.0% 2.3% 1.7% 1.7%
8/14/2019 COMAL COUNTY - New Braunfels ISD - 2005 Texas School Survey of Drug and Alcohol Use
http://slidepdf.com/reader/full/comal-county-new-braunfels-isd-2005-texas-school-survey-of-drug-and-alcohol 36/114
New BraunfelsSpring 2005
________________________________________________________________________________
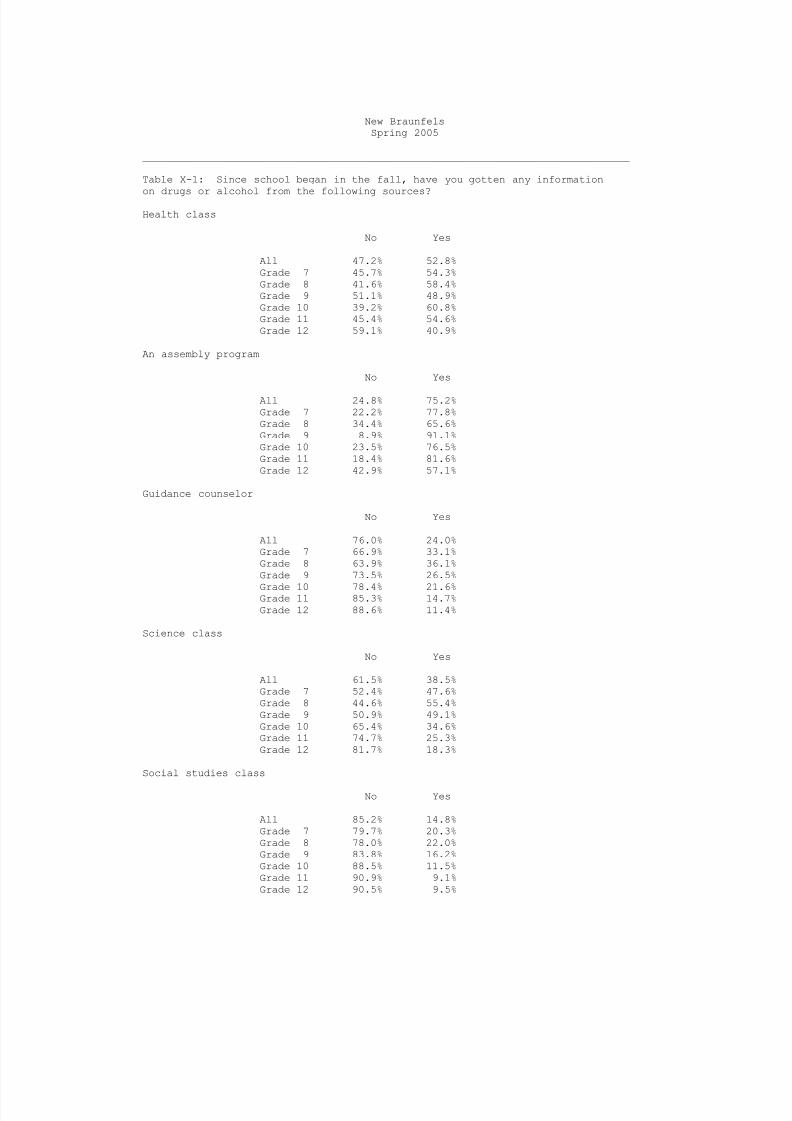
Table X-1: Since school began in the fall, have you gotten any information
on drugs or alcohol from the following sources?Health class
No Yes
All 47.2% 52.8%Grade 7 45.7% 54.3%Grade 8 41.6% 58.4%Grade 9 51.1% 48.9%Grade 10 39.2% 60.8%Grade 11 45.4% 54.6%Grade 12 59.1% 40.9%
An assembly program
No Yes
All 24.8% 75.2%Grade 7 22.2% 77.8%Grade 8 34.4% 65.6%Grade 9 8.9% 91.1%Grade 10 23.5% 76.5%Grade 11 18.4% 81.6%Grade 12 42.9% 57.1%
Guidance counselor
No Yes
All 76.0% 24.0%Grade 7 66.9% 33.1%Grade 8 63.9% 36.1%Grade 9 73.5% 26.5%
Grade 10 78.4% 21.6%Grade 11 85.3% 14.7%Grade 12 88.6% 11.4%
Science class
No Yes
All 61.5% 38.5%Grade 7 52.4% 47.6%Grade 8 44.6% 55.4%Grade 9 50.9% 49.1%Grade 10 65.4% 34.6%Grade 11 74.7% 25.3%Grade 12 81.7% 18.3%
Social studies class
No Yes
All 85.2% 14.8%Grade 7 79.7% 20.3%Grade 8 78.0% 22.0%Grade 9 83.8% 16.2%Grade 10 88.5% 11.5%Grade 11 90.9% 9.1%Grade 12 90.5% 9.5%
8/14/2019 COMAL COUNTY - New Braunfels ISD - 2005 Texas School Survey of Drug and Alcohol Use
http://slidepdf.com/reader/full/comal-county-new-braunfels-isd-2005-texas-school-survey-of-drug-and-alcohol 37/114
New BraunfelsSpring 2005
________________________________________________________________________________
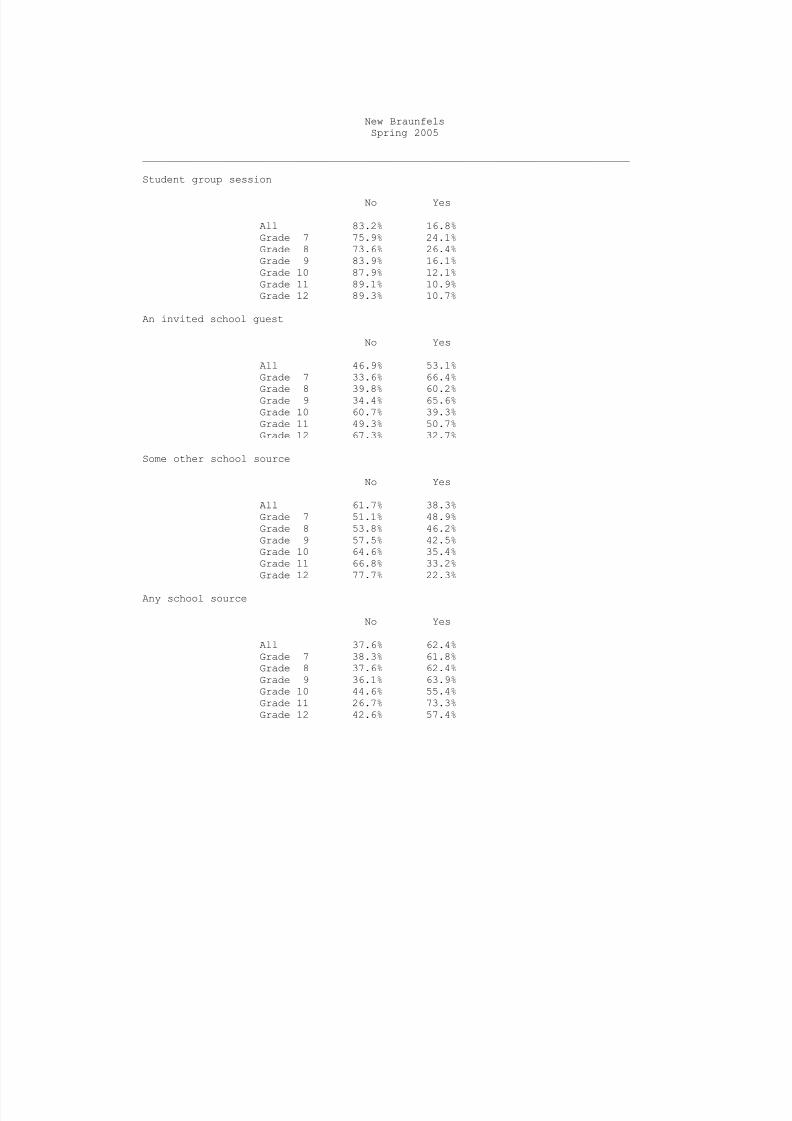
Student group session
No Yes
All 83.2% 16.8%Grade 7 75.9% 24.1%Grade 8 73.6% 26.4%Grade 9 83.9% 16.1%Grade 10 87.9% 12.1%Grade 11 89.1% 10.9%Grade 12 89.3% 10.7%
An invited school guest
No Yes
All 46.9% 53.1%Grade 7 33.6% 66.4%
Grade 8 39.8% 60.2%Grade 9 34.4% 65.6%Grade 10 60.7% 39.3%Grade 11 49.3% 50.7%Grade 12 67.3% 32.7%
Some other school source
No Yes
All 61.7% 38.3%Grade 7 51.1% 48.9%Grade 8 53.8% 46.2%Grade 9 57.5% 42.5%Grade 10 64.6% 35.4%Grade 11 66.8% 33.2%Grade 12 77.7% 22.3%
Any school source
No Yes
All 37.6% 62.4%Grade 7 38.3% 61.8%Grade 8 37.6% 62.4%Grade 9 36.1% 63.9%Grade 10 44.6% 55.4%Grade 11 26.7% 73.3%Grade 12 42.6% 57.4%
8/14/2019 COMAL COUNTY - New Braunfels ISD - 2005 Texas School Survey of Drug and Alcohol Use
http://slidepdf.com/reader/full/comal-county-new-braunfels-isd-2005-texas-school-survey-of-drug-and-alcohol 38/114
New BraunfelsSpring 2005
________________________________________________________________________________
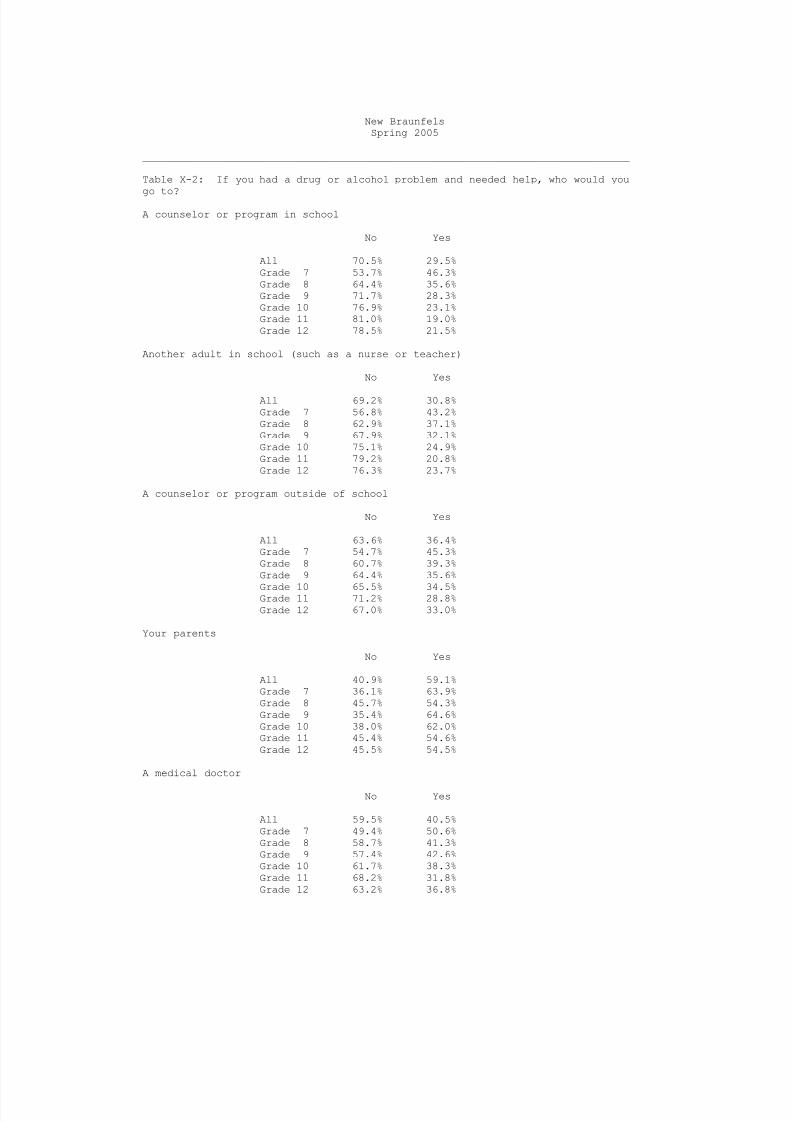
Table X-2: If you had a drug or alcohol problem and needed help, who would you
go to?A counselor or program in school
No Yes
All 70.5% 29.5%Grade 7 53.7% 46.3%Grade 8 64.4% 35.6%Grade 9 71.7% 28.3%Grade 10 76.9% 23.1%Grade 11 81.0% 19.0%Grade 12 78.5% 21.5%
Another adult in school (such as a nurse or teacher)
No Yes
All 69.2% 30.8%Grade 7 56.8% 43.2%Grade 8 62.9% 37.1%Grade 9 67.9% 32.1%Grade 10 75.1% 24.9%Grade 11 79.2% 20.8%Grade 12 76.3% 23.7%
A counselor or program outside of school
No Yes
All 63.6% 36.4%Grade 7 54.7% 45.3%Grade 8 60.7% 39.3%Grade 9 64.4% 35.6%
Grade 10 65.5% 34.5%Grade 11 71.2% 28.8%Grade 12 67.0% 33.0%
Your parents
No Yes
All 40.9% 59.1%Grade 7 36.1% 63.9%Grade 8 45.7% 54.3%Grade 9 35.4% 64.6%Grade 10 38.0% 62.0%Grade 11 45.4% 54.6%Grade 12 45.5% 54.5%
A medical doctor
No Yes
All 59.5% 40.5%Grade 7 49.4% 50.6%Grade 8 58.7% 41.3%Grade 9 57.4% 42.6%Grade 10 61.7% 38.3%Grade 11 68.2% 31.8%Grade 12 63.2% 36.8%
8/14/2019 COMAL COUNTY - New Braunfels ISD - 2005 Texas School Survey of Drug and Alcohol Use
http://slidepdf.com/reader/full/comal-county-new-braunfels-isd-2005-texas-school-survey-of-drug-and-alcohol 39/114
New BraunfelsSpring 2005
________________________________________________________________________________
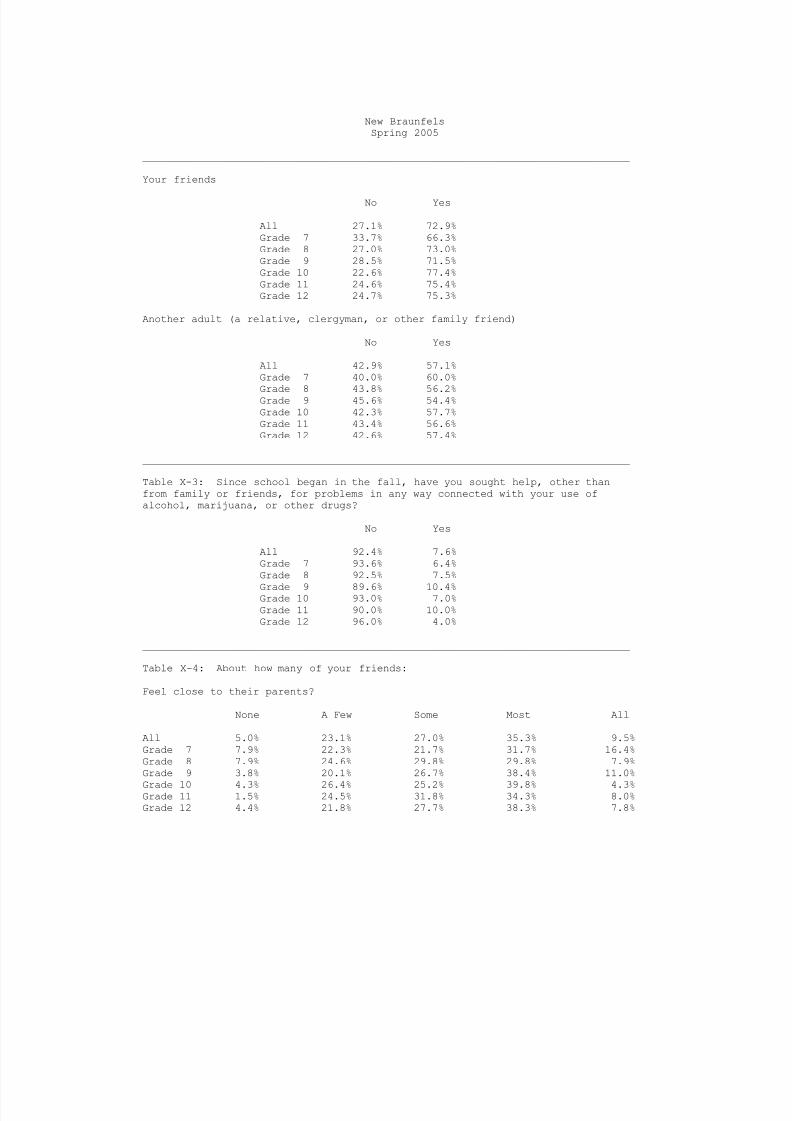
Your friends
No Yes
All 27.1% 72.9%Grade 7 33.7% 66.3%Grade 8 27.0% 73.0%Grade 9 28.5% 71.5%Grade 10 22.6% 77.4%Grade 11 24.6% 75.4%Grade 12 24.7% 75.3%
Another adult (a relative, clergyman, or other family friend)
No Yes
All 42.9% 57.1%Grade 7 40.0% 60.0%
Grade 8 43.8% 56.2%Grade 9 45.6% 54.4%Grade 10 42.3% 57.7%Grade 11 43.4% 56.6%Grade 12 42.6% 57.4%
________________________________________________________________________________
Table X-3: Since school began in the fall, have you sought help, other thanfrom family or friends, for problems in any way connected with your use ofalcohol, marijuana, or other drugs?
No Yes
All 92.4% 7.6%Grade 7 93.6% 6.4%Grade 8 92.5% 7.5%
Grade 9 89.6% 10.4%Grade 10 93.0% 7.0%Grade 11 90.0% 10.0%Grade 12 96.0% 4.0%
________________________________________________________________________________
Table X-4: About how many of your friends:
Feel close to their parents?
None A Few Some Most All
All 5.0% 23.1% 27.0% 35.3% 9.5%Grade 7 7.9% 22.3% 21.7% 31.7% 16.4%Grade 8 7.9% 24.6% 29.8% 29.8% 7.9%Grade 9 3.8% 20.1% 26.7% 38.4% 11.0%
Grade 10 4.3% 26.4% 25.2% 39.8% 4.3%Grade 11 1.5% 24.5% 31.8% 34.3% 8.0%Grade 12 4.4% 21.8% 27.7% 38.3% 7.8%
8/14/2019 COMAL COUNTY - New Braunfels ISD - 2005 Texas School Survey of Drug and Alcohol Use
http://slidepdf.com/reader/full/comal-county-new-braunfels-isd-2005-texas-school-survey-of-drug-and-alcohol 40/114
New BraunfelsSpring 2005
________________________________________________________________________________
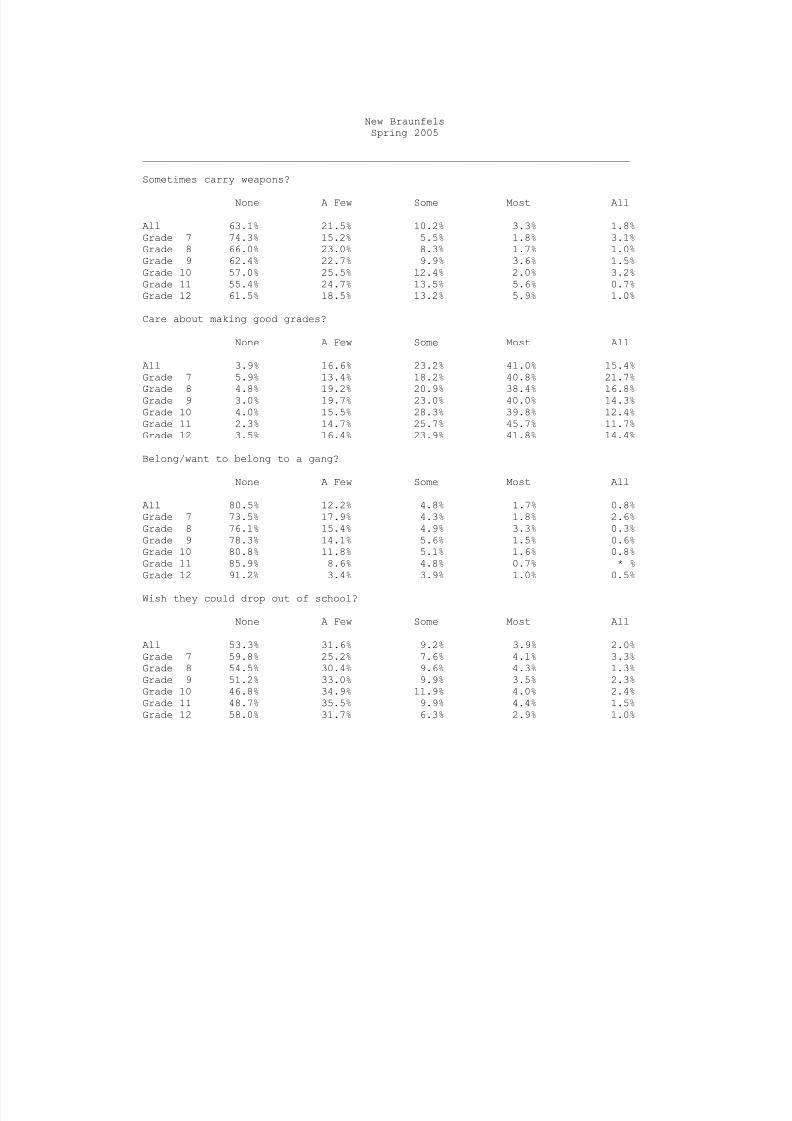
Sometimes carry weapons?
None A Few Some Most All
All 63.1% 21.5% 10.2% 3.3% 1.8%Grade 7 74.3% 15.2% 5.5% 1.8% 3.1%Grade 8 66.0% 23.0% 8.3% 1.7% 1.0%Grade 9 62.4% 22.7% 9.9% 3.6% 1.5%Grade 10 57.0% 25.5% 12.4% 2.0% 3.2%Grade 11 55.4% 24.7% 13.5% 5.6% 0.7%Grade 12 61.5% 18.5% 13.2% 5.9% 1.0%
Care about making good grades?
None A Few Some Most All
All 3.9% 16.6% 23.2% 41.0% 15.4%Grade 7 5.9% 13.4% 18.2% 40.8% 21.7%
Grade 8 4.8% 19.2% 20.9% 38.4% 16.8%Grade 9 3.0% 19.7% 23.0% 40.0% 14.3%Grade 10 4.0% 15.5% 28.3% 39.8% 12.4%Grade 11 2.3% 14.7% 25.7% 45.7% 11.7%Grade 12 3.5% 16.4% 23.9% 41.8% 14.4%
Belong/want to belong to a gang?
None A Few Some Most All
All 80.5% 12.2% 4.8% 1.7% 0.8%Grade 7 73.5% 17.9% 4.3% 1.8% 2.6%Grade 8 76.1% 15.4% 4.9% 3.3% 0.3%Grade 9 78.3% 14.1% 5.6% 1.5% 0.6%Grade 10 80.8% 11.8% 5.1% 1.6% 0.8%Grade 11 85.9% 8.6% 4.8% 0.7% * %Grade 12 91.2% 3.4% 3.9% 1.0% 0.5%
Wish they could drop out of school?
None A Few Some Most All
All 53.3% 31.6% 9.2% 3.9% 2.0%Grade 7 59.8% 25.2% 7.6% 4.1% 3.3%Grade 8 54.5% 30.4% 9.6% 4.3% 1.3%Grade 9 51.2% 33.0% 9.9% 3.5% 2.3%Grade 10 46.8% 34.9% 11.9% 4.0% 2.4%Grade 11 48.7% 35.5% 9.9% 4.4% 1.5%Grade 12 58.0% 31.7% 6.3% 2.9% 1.0%

8/14/2019 COMAL COUNTY - New Braunfels ISD - 2005 Texas School Survey of Drug and Alcohol Use
http://slidepdf.com/reader/full/comal-county-new-braunfels-isd-2005-texas-school-survey-of-drug-and-alcohol 41/114
8/14/2019 COMAL COUNTY - New Braunfels ISD - 2005 Texas School Survey of Drug and Alcohol Use
http://slidepdf.com/reader/full/comal-county-new-braunfels-isd-2005-texas-school-survey-of-drug-and-alcohol 42/114
New BraunfelsSpring 2005
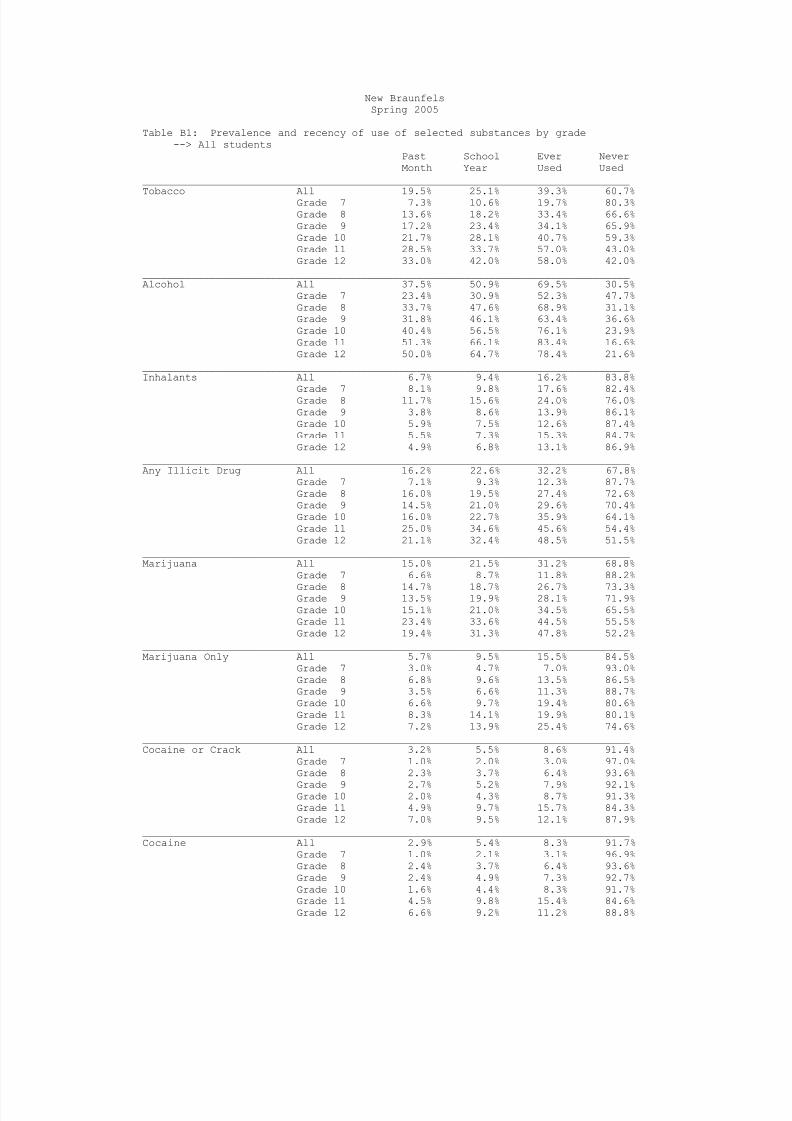
Table B1: Prevalence and recency of use of selected substances by grade--> All students
Past School Ever NeverMonth Year Used Used
________________________________________________________________________________
Tobacco All 19.5% 25.1% 39.3% 60.7%Grade 7 7.3% 10.6% 19.7% 80.3%Grade 8 13.6% 18.2% 33.4% 66.6%Grade 9 17.2% 23.4% 34.1% 65.9%Grade 10 21.7% 28.1% 40.7% 59.3%Grade 11 28.5% 33.7% 57.0% 43.0%Grade 12 33.0% 42.0% 58.0% 42.0%
________________________________________________________________________________Alcohol All 37.5% 50.9% 69.5% 30.5%
Grade 7 23.4% 30.9% 52.3% 47.7%Grade 8 33.7% 47.6% 68.9% 31.1%Grade 9 31.8% 46.1% 63.4% 36.6%Grade 10 40.4% 56.5% 76.1% 23.9%Grade 11 51.3% 66.1% 83.4% 16.6%Grade 12 50.0% 64.7% 78.4% 21.6%
________________________________________________________________________________Inhalants All 6.7% 9.4% 16.2% 83.8%
Grade 7 8.1% 9.8% 17.6% 82.4%Grade 8 11.7% 15.6% 24.0% 76.0%Grade 9 3.8% 8.6% 13.9% 86.1%Grade 10 5.9% 7.5% 12.6% 87.4%Grade 11 5.5% 7.3% 15.3% 84.7%Grade 12 4.9% 6.8% 13.1% 86.9%
________________________________________________________________________________Any Illicit Drug All 16.2% 22.6% 32.2% 67.8%
Grade 7 7.1% 9.3% 12.3% 87.7%Grade 8 16.0% 19.5% 27.4% 72.6%Grade 9 14.5% 21.0% 29.6% 70.4%Grade 10 16.0% 22.7% 35.9% 64.1%Grade 11 25.0% 34.6% 45.6% 54.4%Grade 12 21.1% 32.4% 48.5% 51.5%
________________________________________________________________________________Marijuana All 15.0% 21.5% 31.2% 68.8%
Grade 7 6.6% 8.7% 11.8% 88.2%
Grade 8 14.7% 18.7% 26.7% 73.3%Grade 9 13.5% 19.9% 28.1% 71.9%Grade 10 15.1% 21.0% 34.5% 65.5%Grade 11 23.4% 33.6% 44.5% 55.5%Grade 12 19.4% 31.3% 47.8% 52.2%
________________________________________________________________________________Marijuana Only All 5.7% 9.5% 15.5% 84.5%
Grade 7 3.0% 4.7% 7.0% 93.0%Grade 8 6.8% 9.6% 13.5% 86.5%Grade 9 3.5% 6.6% 11.3% 88.7%Grade 10 6.6% 9.7% 19.4% 80.6%Grade 11 8.3% 14.1% 19.9% 80.1%Grade 12 7.2% 13.9% 25.4% 74.6%
________________________________________________________________________________Cocaine or Crack All 3.2% 5.5% 8.6% 91.4%
Grade 7 1.0% 2.0% 3.0% 97.0%Grade 8 2.3% 3.7% 6.4% 93.6%
Grade 9 2.7% 5.2% 7.9% 92.1%Grade 10 2.0% 4.3% 8.7% 91.3%Grade 11 4.9% 9.7% 15.7% 84.3%Grade 12 7.0% 9.5% 12.1% 87.9%
________________________________________________________________________________Cocaine All 2.9% 5.4% 8.3% 91.7%
Grade 7 1.0% 2.1% 3.1% 96.9%Grade 8 2.4% 3.7% 6.4% 93.6%Grade 9 2.4% 4.9% 7.3% 92.7%Grade 10 1.6% 4.4% 8.3% 91.7%Grade 11 4.5% 9.8% 15.4% 84.6%Grade 12 6.6% 9.2% 11.2% 88.8%
8/14/2019 COMAL COUNTY - New Braunfels ISD - 2005 Texas School Survey of Drug and Alcohol Use
http://slidepdf.com/reader/full/comal-county-new-braunfels-isd-2005-texas-school-survey-of-drug-and-alcohol 43/114
New BraunfelsSpring 2005
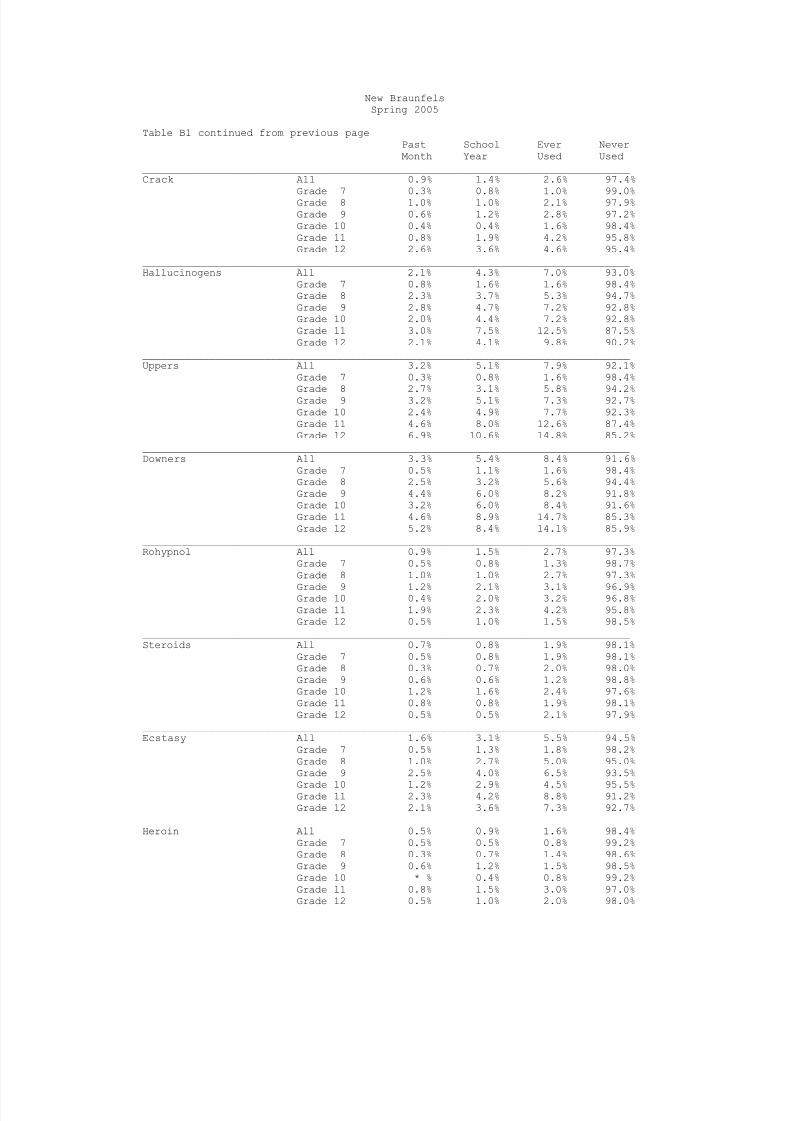
Table B1 continued from previous pagePast School Ever NeverMonth Year Used Used
________________________________________________________________________________Crack All 0.9% 1.4% 2.6% 97.4%
Grade 7 0.3% 0.8% 1.0% 99.0%Grade 8 1.0% 1.0% 2.1% 97.9%Grade 9 0.6% 1.2% 2.8% 97.2%Grade 10 0.4% 0.4% 1.6% 98.4%Grade 11 0.8% 1.9% 4.2% 95.8%Grade 12 2.6% 3.6% 4.6% 95.4%
________________________________________________________________________________Hallucinogens All 2.1% 4.3% 7.0% 93.0%
Grade 7 0.8% 1.6% 1.6% 98.4%Grade 8 2.3% 3.7% 5.3% 94.7%Grade 9 2.8% 4.7% 7.2% 92.8%Grade 10 2.0% 4.4% 7.2% 92.8%Grade 11 3.0% 7.5% 12.5% 87.5%Grade 12 2.1% 4.1% 9.8% 90.2%
________________________________________________________________________________Uppers All 3.2% 5.1% 7.9% 92.1%
Grade 7 0.3% 0.8% 1.6% 98.4%
Grade 8 2.7% 3.1% 5.8% 94.2%Grade 9 3.2% 5.1% 7.3% 92.7%Grade 10 2.4% 4.9% 7.7% 92.3%Grade 11 4.6% 8.0% 12.6% 87.4%Grade 12 6.9% 10.6% 14.8% 85.2%
________________________________________________________________________________Downers All 3.3% 5.4% 8.4% 91.6%
Grade 7 0.5% 1.1% 1.6% 98.4%Grade 8 2.5% 3.2% 5.6% 94.4%Grade 9 4.4% 6.0% 8.2% 91.8%Grade 10 3.2% 6.0% 8.4% 91.6%Grade 11 4.6% 8.9% 14.7% 85.3%Grade 12 5.2% 8.4% 14.1% 85.9%
________________________________________________________________________________Rohypnol All 0.9% 1.5% 2.7% 97.3%
Grade 7 0.5% 0.8% 1.3% 98.7%Grade 8 1.0% 1.0% 2.7% 97.3%
Grade 9 1.2% 2.1% 3.1% 96.9%Grade 10 0.4% 2.0% 3.2% 96.8%Grade 11 1.9% 2.3% 4.2% 95.8%Grade 12 0.5% 1.0% 1.5% 98.5%
________________________________________________________________________________Steroids All 0.7% 0.8% 1.9% 98.1%
Grade 7 0.5% 0.8% 1.9% 98.1%Grade 8 0.3% 0.7% 2.0% 98.0%Grade 9 0.6% 0.6% 1.2% 98.8%Grade 10 1.2% 1.6% 2.4% 97.6%Grade 11 0.8% 0.8% 1.9% 98.1%Grade 12 0.5% 0.5% 2.1% 97.9%
________________________________________________________________________________Ecstasy All 1.6% 3.1% 5.5% 94.5%
Grade 7 0.5% 1.3% 1.8% 98.2%Grade 8 1.0% 2.7% 5.0% 95.0%Grade 9 2.5% 4.0% 6.5% 93.5%
Grade 10 1.2% 2.9% 4.5% 95.5%Grade 11 2.3% 4.2% 8.8% 91.2%Grade 12 2.1% 3.6% 7.3% 92.7%
________________________________________________________________________________Heroin All 0.5% 0.9% 1.6% 98.4%
Grade 7 0.5% 0.5% 0.8% 99.2%Grade 8 0.3% 0.7% 1.4% 98.6%Grade 9 0.6% 1.2% 1.5% 98.5%Grade 10 * % 0.4% 0.8% 99.2%Grade 11 0.8% 1.5% 3.0% 97.0%Grade 12 0.5% 1.0% 2.0% 98.0%
8/14/2019 COMAL COUNTY - New Braunfels ISD - 2005 Texas School Survey of Drug and Alcohol Use
http://slidepdf.com/reader/full/comal-county-new-braunfels-isd-2005-texas-school-survey-of-drug-and-alcohol 44/114

8/14/2019 COMAL COUNTY - New Braunfels ISD - 2005 Texas School Survey of Drug and Alcohol Use
http://slidepdf.com/reader/full/comal-county-new-braunfels-isd-2005-texas-school-survey-of-drug-and-alcohol 45/114
New BraunfelsSpring 2005
Table B2 continued from previous pagePast School Ever NeverMonth Year Used Used
________________________________________________________________________________Crack All 0.9% 1.4% 2.5% 97.5%
Grade 7 0.5% 0.5% 1.0% 99.0%Grade 8 * % * % 1.4% 98.6%Grade 9 0.6% 1.8% 2.4% 97.6%Grade 10 0.8% 0.8% 1.7% 98.3%Grade 11 1.6% 1.6% 4.1% 95.9%Grade 12 2.1% 4.1% 5.2% 94.8%
________________________________________________________________________________Hallucinogens All 2.7% 5.1% 8.4% 91.6%
Grade 7 1.1% 1.6% 1.6% 98.4%Grade 8 2.1% 3.5% 5.6% 94.4%Grade 9 2.4% 4.2% 6.0% 94.0%Grade 10 2.6% 6.1% 9.6% 90.4%Grade 11 4.2% 8.3% 13.3% 86.7%Grade 12 4.3% 8.5% 18.1% 81.9%
________________________________________________________________________________Uppers All 2.4% 4.2% 7.0% 93.0%
Grade 7 * % 0.5% 1.1% 98.9%
Grade 8 1.4% 2.2% 5.0% 95.0%Grade 9 1.2% 1.2% 3.0% 97.0%Grade 10 1.7% 3.5% 5.2% 94.8%Grade 11 5.0% 10.8% 14.2% 85.8%Grade 12 6.5% 9.7% 17.2% 82.8%
________________________________________________________________________________Downers All 2.8% 4.5% 7.7% 92.3%
Grade 7 0.6% 0.6% 0.6% 99.4%Grade 8 0.7% 1.5% 4.5% 95.5%Grade 9 3.0% 3.0% 4.3% 95.7%Grade 10 2.6% 3.4% 5.1% 94.9%Grade 11 4.3% 11.1% 15.4% 84.6%Grade 12 6.3% 9.5% 20.0% 80.0%
________________________________________________________________________________Rohypnol All 1.0% 1.5% 2.4% 97.6%
Grade 7 0.5% 0.5% 0.5% 99.5%Grade 8 1.4% 1.4% 4.9% 95.1%
Grade 9 1.2% 1.8% 2.4% 97.6%Grade 10 * % 1.7% 1.7% 98.3%Grade 11 1.7% 2.5% 4.2% 95.8%Grade 12 1.0% 1.0% 1.0% 99.0%
________________________________________________________________________________Steroids All 0.9% 1.0% 2.5% 97.5%
Grade 7 0.5% 1.1% 2.2% 97.8%Grade 8 * % * % 1.4% 98.6%Grade 9 0.6% 0.6% 1.8% 98.2%Grade 10 2.5% 2.5% 4.2% 95.8%Grade 11 0.9% 0.9% 2.6% 97.4%Grade 12 1.1% 1.1% 3.2% 96.8%
________________________________________________________________________________Ecstasy All 1.3% 2.6% 4.6% 95.4%
Grade 7 1.1% 2.2% 2.7% 97.3%Grade 8 1.4% 2.1% 3.5% 96.5%Grade 9 0.6% 1.8% 3.0% 97.0%
Grade 10 0.9% 3.4% 4.3% 95.7%Grade 11 0.8% 1.7% 6.8% 93.2%Grade 12 3.2% 5.3% 8.4% 91.6%
________________________________________________________________________________Heroin All 0.6% 1.5% 2.2% 97.8%
Grade 7 1.1% 1.1% 1.1% 98.9%Grade 8 * % 0.7% 2.1% 97.9%Grade 9 0.6% 1.8% 2.4% 97.6%Grade 10 * % 0.9% 1.7% 98.3%Grade 11 0.8% 2.5% 3.3% 96.7%Grade 12 1.0% 2.0% 3.0% 97.0%

8/14/2019 COMAL COUNTY - New Braunfels ISD - 2005 Texas School Survey of Drug and Alcohol Use
http://slidepdf.com/reader/full/comal-county-new-braunfels-isd-2005-texas-school-survey-of-drug-and-alcohol 46/114

8/14/2019 COMAL COUNTY - New Braunfels ISD - 2005 Texas School Survey of Drug and Alcohol Use
http://slidepdf.com/reader/full/comal-county-new-braunfels-isd-2005-texas-school-survey-of-drug-and-alcohol 47/114
New BraunfelsSpring 2005
Table B3 continued from previous pagePast School Ever NeverMonth Year Used Used
________________________________________________________________________________Crack All 0.9% 1.4% 2.7% 97.3%
Grade 7 * % 1.0% 1.0% 99.0%Grade 8 2.0% 2.0% 2.7% 97.3%Grade 9 0.6% 0.6% 3.2% 96.8%Grade 10 * % * % 1.5% 98.5%Grade 11 * % 2.2% 4.3% 95.7%Grade 12 3.1% 3.1% 4.1% 95.9%
________________________________________________________________________________Hallucinogens All 1.7% 3.5% 5.7% 94.3%
Grade 7 0.5% 1.5% 1.5% 98.5%Grade 8 2.6% 3.9% 5.2% 94.8%Grade 9 3.2% 5.2% 8.4% 91.6%Grade 10 1.5% 3.0% 5.3% 94.7%Grade 11 2.1% 7.0% 11.9% 88.1%Grade 12 * % * % 2.0% 98.0%
________________________________________________________________________________Uppers All 3.9% 6.0% 8.8% 91.2%
Grade 7 0.5% 1.0% 2.0% 98.0%
Grade 8 4.0% 4.0% 6.0% 94.0%Grade 9 5.4% 9.4% 12.1% 87.9%Grade 10 3.1% 6.2% 10.1% 89.9%Grade 11 4.3% 5.7% 11.4% 88.6%Grade 12 7.3% 11.5% 12.5% 87.5%
________________________________________________________________________________Downers All 3.8% 6.2% 9.1% 90.9%
Grade 7 0.5% 1.5% 2.5% 97.5%Grade 8 4.0% 4.7% 6.7% 93.3%Grade 9 5.8% 9.1% 12.3% 87.7%Grade 10 3.8% 8.4% 11.5% 88.5%Grade 11 5.0% 7.1% 14.3% 85.7%Grade 12 4.2% 7.3% 8.3% 91.7%
________________________________________________________________________________Rohypnol All 0.9% 1.6% 2.9% 97.1%
Grade 7 0.5% 1.0% 2.0% 98.0%Grade 8 0.7% 0.7% 0.7% 99.3%
Grade 9 1.3% 2.5% 3.8% 96.2%Grade 10 0.8% 2.3% 4.7% 95.3%Grade 11 2.1% 2.1% 4.2% 95.8%Grade 12 * % 1.0% 2.0% 98.0%
________________________________________________________________________________Steroids All 0.4% 0.7% 1.4% 98.6%
Grade 7 0.5% 0.5% 1.6% 98.4%Grade 8 0.6% 1.3% 2.6% 97.4%Grade 9 0.6% 0.6% 0.6% 99.4%Grade 10 * % 0.8% 0.8% 99.2%Grade 11 0.7% 0.7% 1.4% 98.6%Grade 12 * % * % 1.0% 99.0%
________________________________________________________________________________Ecstasy All 1.9% 3.5% 6.4% 93.6%
Grade 7 * % 0.5% 1.0% 99.0%Grade 8 0.6% 3.2% 5.8% 94.2%Grade 9 4.5% 6.4% 10.3% 89.7%
Grade 10 1.6% 2.4% 4.8% 95.2%Grade 11 3.5% 6.4% 10.6% 89.4%Grade 12 1.0% 2.1% 6.2% 93.8%
________________________________________________________________________________Heroin All 0.3% 0.3% 0.9% 99.1%
Grade 7 * % * % 0.5% 99.5%Grade 8 0.7% 0.7% 0.7% 99.3%Grade 9 0.6% 0.6% 0.6% 99.4%Grade 10 * % * % * % 100.0%Grade 11 0.7% 0.7% 2.8% 97.2%Grade 12 * % * % 1.0% 99.0%
8/14/2019 COMAL COUNTY - New Braunfels ISD - 2005 Texas School Survey of Drug and Alcohol Use
http://slidepdf.com/reader/full/comal-county-new-braunfels-isd-2005-texas-school-survey-of-drug-and-alcohol 48/114
New BraunfelsSpring 2005
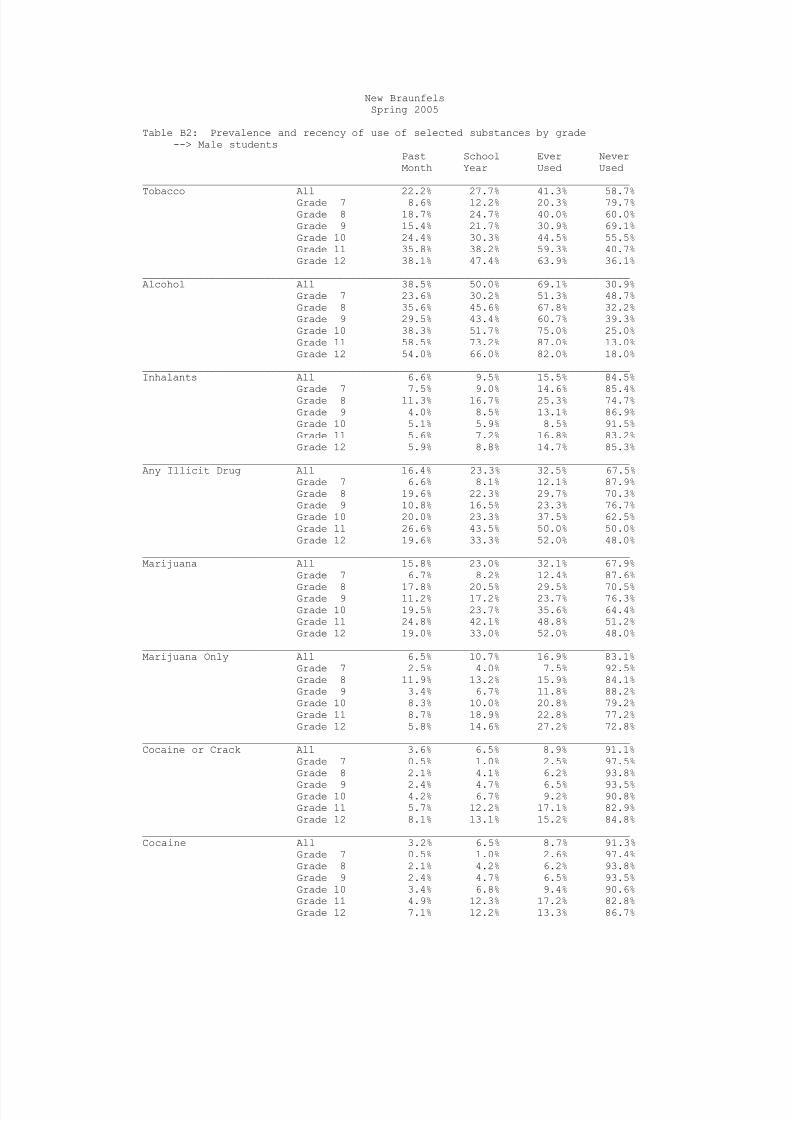
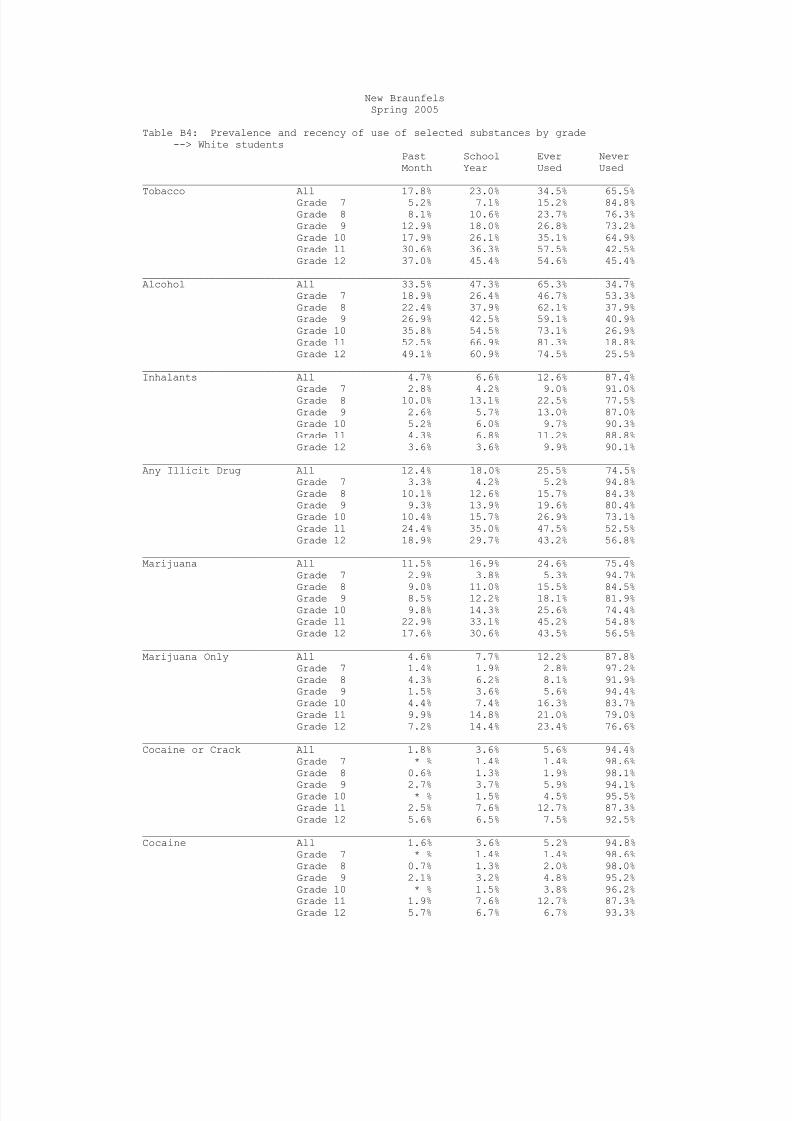
Table B4: Prevalence and recency of use of selected substances by grade--> White students
Past School Ever NeverMonth Year Used Used
________________________________________________________________________________
Tobacco All 17.8% 23.0% 34.5% 65.5%Grade 7 5.2% 7.1% 15.2% 84.8%Grade 8 8.1% 10.6% 23.7% 76.3%Grade 9 12.9% 18.0% 26.8% 73.2%Grade 10 17.9% 26.1% 35.1% 64.9%Grade 11 30.6% 36.3% 57.5% 42.5%Grade 12 37.0% 45.4% 54.6% 45.4%
________________________________________________________________________________Alcohol All 33.5% 47.3% 65.3% 34.7%
Grade 7 18.9% 26.4% 46.7% 53.3%Grade 8 22.4% 37.9% 62.1% 37.9%Grade 9 26.9% 42.5% 59.1% 40.9%Grade 10 35.8% 54.5% 73.1% 26.9%Grade 11 52.5% 66.9% 81.3% 18.8%Grade 12 49.1% 60.9% 74.5% 25.5%
________________________________________________________________________________Inhalants All 4.7% 6.6% 12.6% 87.4%
Grade 7 2.8% 4.2% 9.0% 91.0%Grade 8 10.0% 13.1% 22.5% 77.5%Grade 9 2.6% 5.7% 13.0% 87.0%Grade 10 5.2% 6.0% 9.7% 90.3%Grade 11 4.3% 6.8% 11.2% 88.8%Grade 12 3.6% 3.6% 9.9% 90.1%
________________________________________________________________________________Any Illicit Drug All 12.4% 18.0% 25.5% 74.5%
Grade 7 3.3% 4.2% 5.2% 94.8%Grade 8 10.1% 12.6% 15.7% 84.3%Grade 9 9.3% 13.9% 19.6% 80.4%Grade 10 10.4% 15.7% 26.9% 73.1%Grade 11 24.4% 35.0% 47.5% 52.5%Grade 12 18.9% 29.7% 43.2% 56.8%
________________________________________________________________________________Marijuana All 11.5% 16.9% 24.6% 75.4%
Grade 7 2.9% 3.8% 5.3% 94.7%
Grade 8 9.0% 11.0% 15.5% 84.5%Grade 9 8.5% 12.2% 18.1% 81.9%Grade 10 9.8% 14.3% 25.6% 74.4%Grade 11 22.9% 33.1% 45.2% 54.8%Grade 12 17.6% 30.6% 43.5% 56.5%
________________________________________________________________________________Marijuana Only All 4.6% 7.7% 12.2% 87.8%
Grade 7 1.4% 1.9% 2.8% 97.2%Grade 8 4.3% 6.2% 8.1% 91.9%Grade 9 1.5% 3.6% 5.6% 94.4%Grade 10 4.4% 7.4% 16.3% 83.7%Grade 11 9.9% 14.8% 21.0% 79.0%Grade 12 7.2% 14.4% 23.4% 76.6%
________________________________________________________________________________Cocaine or Crack All 1.8% 3.6% 5.6% 94.4%
Grade 7 * % 1.4% 1.4% 98.6%Grade 8 0.6% 1.3% 1.9% 98.1%
Grade 9 2.7% 3.7% 5.9% 94.1%Grade 10 * % 1.5% 4.5% 95.5%Grade 11 2.5% 7.6% 12.7% 87.3%Grade 12 5.6% 6.5% 7.5% 92.5%
________________________________________________________________________________Cocaine All 1.6% 3.6% 5.2% 94.8%
Grade 7 * % 1.4% 1.4% 98.6%Grade 8 0.7% 1.3% 2.0% 98.0%Grade 9 2.1% 3.2% 4.8% 95.2%Grade 10 * % 1.5% 3.8% 96.2%Grade 11 1.9% 7.6% 12.7% 87.3%Grade 12 5.7% 6.7% 6.7% 93.3%
8/14/2019 COMAL COUNTY - New Braunfels ISD - 2005 Texas School Survey of Drug and Alcohol Use
http://slidepdf.com/reader/full/comal-county-new-braunfels-isd-2005-texas-school-survey-of-drug-and-alcohol 49/114
New BraunfelsSpring 2005
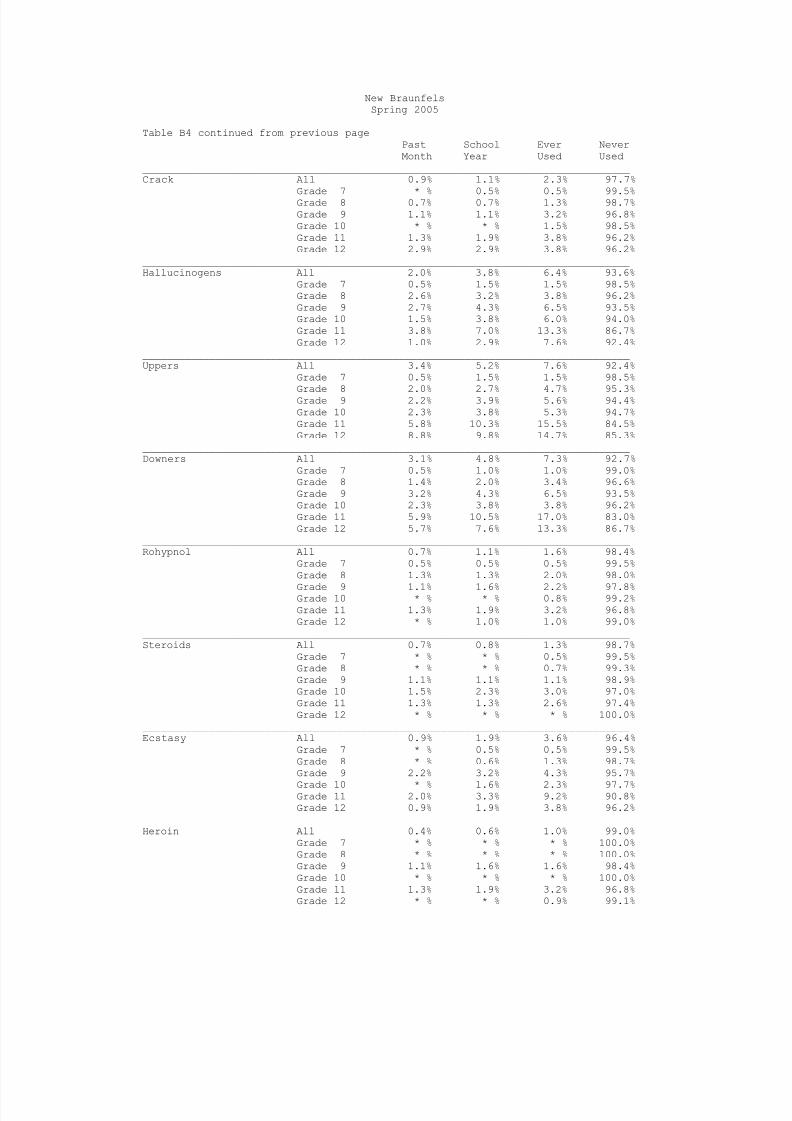
Table B4 continued from previous pagePast School Ever NeverMonth Year Used Used
________________________________________________________________________________Crack All 0.9% 1.1% 2.3% 97.7%
Grade 7 * % 0.5% 0.5% 99.5%Grade 8 0.7% 0.7% 1.3% 98.7%Grade 9 1.1% 1.1% 3.2% 96.8%Grade 10 * % * % 1.5% 98.5%Grade 11 1.3% 1.9% 3.8% 96.2%Grade 12 2.9% 2.9% 3.8% 96.2%
________________________________________________________________________________Hallucinogens All 2.0% 3.8% 6.4% 93.6%
Grade 7 0.5% 1.5% 1.5% 98.5%Grade 8 2.6% 3.2% 3.8% 96.2%Grade 9 2.7% 4.3% 6.5% 93.5%Grade 10 1.5% 3.8% 6.0% 94.0%Grade 11 3.8% 7.0% 13.3% 86.7%Grade 12 1.0% 2.9% 7.6% 92.4%
________________________________________________________________________________Uppers All 3.4% 5.2% 7.6% 92.4%
Grade 7 0.5% 1.5% 1.5% 98.5%
Grade 8 2.0% 2.7% 4.7% 95.3%Grade 9 2.2% 3.9% 5.6% 94.4%Grade 10 2.3% 3.8% 5.3% 94.7%Grade 11 5.8% 10.3% 15.5% 84.5%Grade 12 8.8% 9.8% 14.7% 85.3%
________________________________________________________________________________Downers All 3.1% 4.8% 7.3% 92.7%
Grade 7 0.5% 1.0% 1.0% 99.0%Grade 8 1.4% 2.0% 3.4% 96.6%Grade 9 3.2% 4.3% 6.5% 93.5%Grade 10 2.3% 3.8% 3.8% 96.2%Grade 11 5.9% 10.5% 17.0% 83.0%Grade 12 5.7% 7.6% 13.3% 86.7%
________________________________________________________________________________Rohypnol All 0.7% 1.1% 1.6% 98.4%
Grade 7 0.5% 0.5% 0.5% 99.5%Grade 8 1.3% 1.3% 2.0% 98.0%
Grade 9 1.1% 1.6% 2.2% 97.8%Grade 10 * % * % 0.8% 99.2%Grade 11 1.3% 1.9% 3.2% 96.8%Grade 12 * % 1.0% 1.0% 99.0%
________________________________________________________________________________Steroids All 0.7% 0.8% 1.3% 98.7%
Grade 7 * % * % 0.5% 99.5%Grade 8 * % * % 0.7% 99.3%Grade 9 1.1% 1.1% 1.1% 98.9%Grade 10 1.5% 2.3% 3.0% 97.0%Grade 11 1.3% 1.3% 2.6% 97.4%Grade 12 * % * % * % 100.0%
________________________________________________________________________________Ecstasy All 0.9% 1.9% 3.6% 96.4%
Grade 7 * % 0.5% 0.5% 99.5%Grade 8 * % 0.6% 1.3% 98.7%Grade 9 2.2% 3.2% 4.3% 95.7%
Grade 10 * % 1.6% 2.3% 97.7%Grade 11 2.0% 3.3% 9.2% 90.8%Grade 12 0.9% 1.9% 3.8% 96.2%
________________________________________________________________________________Heroin All 0.4% 0.6% 1.0% 99.0%
Grade 7 * % * % * % 100.0%Grade 8 * % * % * % 100.0%Grade 9 1.1% 1.6% 1.6% 98.4%Grade 10 * % * % * % 100.0%Grade 11 1.3% 1.9% 3.2% 96.8%Grade 12 * % * % 0.9% 99.1%
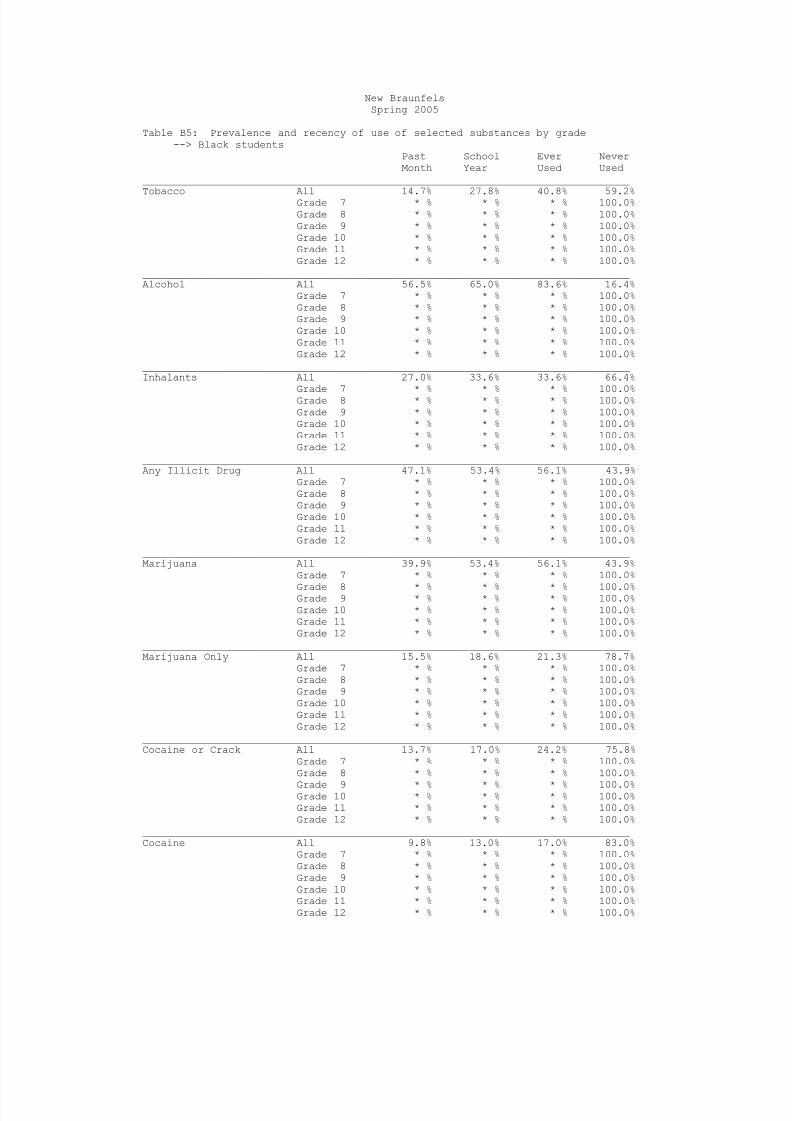
8/14/2019 COMAL COUNTY - New Braunfels ISD - 2005 Texas School Survey of Drug and Alcohol Use
http://slidepdf.com/reader/full/comal-county-new-braunfels-isd-2005-texas-school-survey-of-drug-and-alcohol 50/114
New BraunfelsSpring 2005
Table B5: Prevalence and recency of use of selected substances by grade--> Black students
Past School Ever NeverMonth Year Used Used
________________________________________________________________________________
Tobacco All 14.7% 27.8% 40.8% 59.2%Grade 7 * % * % * % 100.0%Grade 8 * % * % * % 100.0%Grade 9 * % * % * % 100.0%Grade 10 * % * % * % 100.0%Grade 11 * % * % * % 100.0%Grade 12 * % * % * % 100.0%
________________________________________________________________________________Alcohol All 56.5% 65.0% 83.6% 16.4%
Grade 7 * % * % * % 100.0%Grade 8 * % * % * % 100.0%Grade 9 * % * % * % 100.0%Grade 10 * % * % * % 100.0%Grade 11 * % * % * % 100.0%Grade 12 * % * % * % 100.0%
________________________________________________________________________________Inhalants All 27.0% 33.6% 33.6% 66.4%
Grade 7 * % * % * % 100.0%Grade 8 * % * % * % 100.0%Grade 9 * % * % * % 100.0%Grade 10 * % * % * % 100.0%Grade 11 * % * % * % 100.0%Grade 12 * % * % * % 100.0%
________________________________________________________________________________Any Illicit Drug All 47.1% 53.4% 56.1% 43.9%
Grade 7 * % * % * % 100.0%Grade 8 * % * % * % 100.0%Grade 9 * % * % * % 100.0%Grade 10 * % * % * % 100.0%Grade 11 * % * % * % 100.0%Grade 12 * % * % * % 100.0%
________________________________________________________________________________Marijuana All 39.9% 53.4% 56.1% 43.9%
Grade 7 * % * % * % 100.0%
Grade 8 * % * % * % 100.0%Grade 9 * % * % * % 100.0%Grade 10 * % * % * % 100.0%Grade 11 * % * % * % 100.0%Grade 12 * % * % * % 100.0%
________________________________________________________________________________Marijuana Only All 15.5% 18.6% 21.3% 78.7%
Grade 7 * % * % * % 100.0%Grade 8 * % * % * % 100.0%Grade 9 * % * % * % 100.0%Grade 10 * % * % * % 100.0%Grade 11 * % * % * % 100.0%Grade 12 * % * % * % 100.0%
________________________________________________________________________________Cocaine or Crack All 13.7% 17.0% 24.2% 75.8%
Grade 7 * % * % * % 100.0%Grade 8 * % * % * % 100.0%
Grade 9 * % * % * % 100.0%Grade 10 * % * % * % 100.0%Grade 11 * % * % * % 100.0%Grade 12 * % * % * % 100.0%
________________________________________________________________________________Cocaine All 9.8% 13.0% 17.0% 83.0%
Grade 7 * % * % * % 100.0%Grade 8 * % * % * % 100.0%Grade 9 * % * % * % 100.0%Grade 10 * % * % * % 100.0%Grade 11 * % * % * % 100.0%Grade 12 * % * % * % 100.0%

8/14/2019 COMAL COUNTY - New Braunfels ISD - 2005 Texas School Survey of Drug and Alcohol Use
http://slidepdf.com/reader/full/comal-county-new-braunfels-isd-2005-texas-school-survey-of-drug-and-alcohol 51/114
New BraunfelsSpring 2005
Table B5 continued from previous pagePast School Ever NeverMonth Year Used Used
________________________________________________________________________________Crack All 10.1% 14.2% 20.8% 79.2%
Grade 7 * % * % * % 100.0%Grade 8 * % * % * % 100.0%Grade 9 * % * % * % 100.0%Grade 10 * % * % * % 100.0%Grade 11 * % * % * % 100.0%Grade 12 * % * % * % 100.0%
________________________________________________________________________________Hallucinogens All 7.2% 10.7% 15.0% 85.0%
Grade 7 * % * % * % 100.0%Grade 8 * % * % * % 100.0%Grade 9 * % * % * % 100.0%Grade 10 * % * % * % 100.0%Grade 11 * % * % * % 100.0%Grade 12 * % * % * % 100.0%
________________________________________________________________________________Uppers All 10.3% 14.3% 21.5% 78.5%
Grade 7 * % * % * % 100.0%
Grade 8 * % * % * % 100.0%Grade 9 * % * % * % 100.0%Grade 10 * % * % * % 100.0%Grade 11 * % * % * % 100.0%Grade 12 * % * % * % 100.0%
________________________________________________________________________________Downers All 7.4% 10.8% 18.2% 81.8%
Grade 7 * % * % * % 100.0%Grade 8 * % * % * % 100.0%Grade 9 * % * % * % 100.0%Grade 10 * % * % * % 100.0%Grade 11 * % * % * % 100.0%Grade 12 * % * % * % 100.0%
________________________________________________________________________________Rohypnol All 4.0% 4.0% 7.2% 92.8%
Grade 7 * % * % * % 100.0%Grade 8 * % * % * % 100.0%
Grade 9 * % * % * % 100.0%Grade 10 * % * % * % 100.0%Grade 11 * % * % * % 100.0%Grade 12 * % * % * % 100.0%
________________________________________________________________________________Steroids All 4.0% 4.0% 4.0% 96.0%
Grade 7 * % * % * % 100.0%Grade 8 * % * % * % 100.0%Grade 9 * % * % * % 100.0%Grade 10 * % * % * % 100.0%Grade 11 * % * % * % 100.0%Grade 12 * % * % * % 100.0%
________________________________________________________________________________Ecstasy All 5.8% 20.4% 20.4% 79.6%
Grade 7 * % * % * % 100.0%Grade 8 * % * % * % 100.0%Grade 9 * % * % * % 100.0%
Grade 10 * % * % * % 100.0%Grade 11 * % * % * % 100.0%Grade 12 * % * % * % 100.0%
________________________________________________________________________________Heroin All 2.6% 6.6% 17.3% 82.7%
Grade 7 * % * % * % 100.0%Grade 8 * % * % * % 100.0%Grade 9 * % * % * % 100.0%Grade 10 * % * % * % 100.0%Grade 11 * % * % * % 100.0%Grade 12 * % * % * % 100.0%
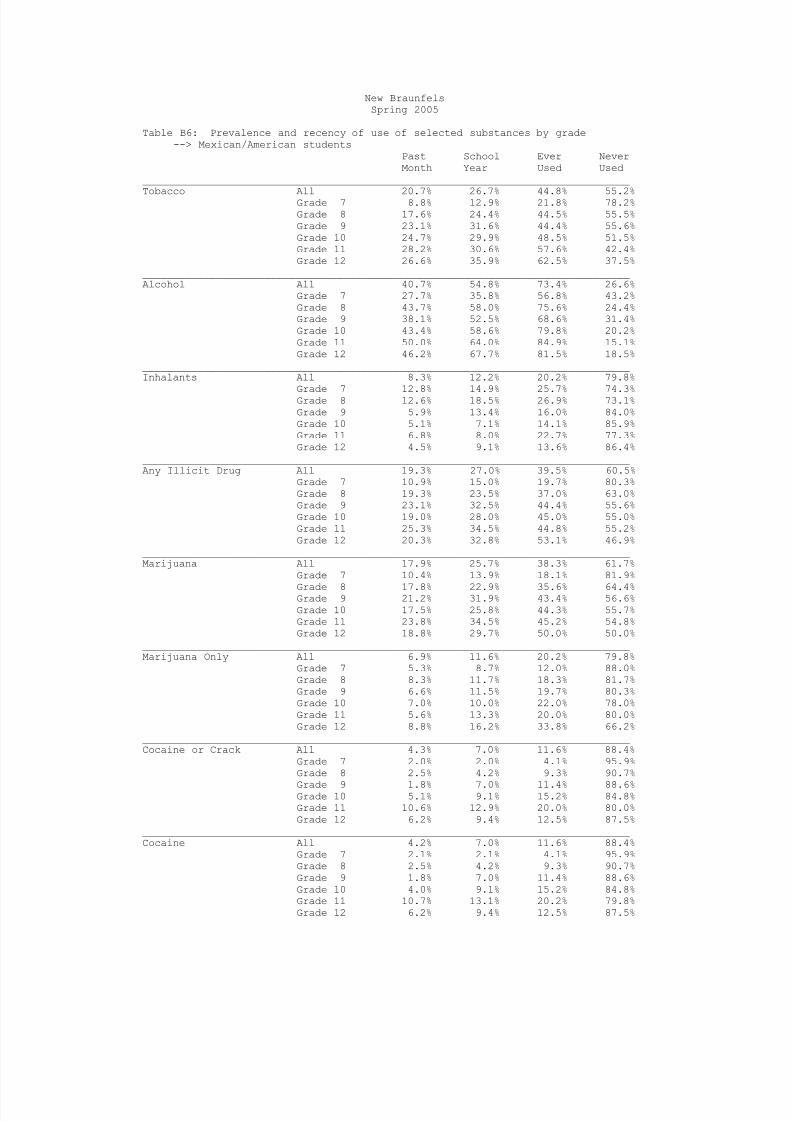
8/14/2019 COMAL COUNTY - New Braunfels ISD - 2005 Texas School Survey of Drug and Alcohol Use
http://slidepdf.com/reader/full/comal-county-new-braunfels-isd-2005-texas-school-survey-of-drug-and-alcohol 52/114
New BraunfelsSpring 2005
Table B6: Prevalence and recency of use of selected substances by grade--> Mexican/American students
Past School Ever NeverMonth Year Used Used
________________________________________________________________________________
Tobacco All 20.7% 26.7% 44.8% 55.2%Grade 7 8.8% 12.9% 21.8% 78.2%Grade 8 17.6% 24.4% 44.5% 55.5%Grade 9 23.1% 31.6% 44.4% 55.6%Grade 10 24.7% 29.9% 48.5% 51.5%Grade 11 28.2% 30.6% 57.6% 42.4%Grade 12 26.6% 35.9% 62.5% 37.5%
________________________________________________________________________________Alcohol All 40.7% 54.8% 73.4% 26.6%
Grade 7 27.7% 35.8% 56.8% 43.2%Grade 8 43.7% 58.0% 75.6% 24.4%Grade 9 38.1% 52.5% 68.6% 31.4%Grade 10 43.4% 58.6% 79.8% 20.2%Grade 11 50.0% 64.0% 84.9% 15.1%Grade 12 46.2% 67.7% 81.5% 18.5%
________________________________________________________________________________Inhalants All 8.3% 12.2% 20.2% 79.8%
Grade 7 12.8% 14.9% 25.7% 74.3%Grade 8 12.6% 18.5% 26.9% 73.1%Grade 9 5.9% 13.4% 16.0% 84.0%Grade 10 5.1% 7.1% 14.1% 85.9%Grade 11 6.8% 8.0% 22.7% 77.3%Grade 12 4.5% 9.1% 13.6% 86.4%
________________________________________________________________________________Any Illicit Drug All 19.3% 27.0% 39.5% 60.5%
Grade 7 10.9% 15.0% 19.7% 80.3%Grade 8 19.3% 23.5% 37.0% 63.0%Grade 9 23.1% 32.5% 44.4% 55.6%Grade 10 19.0% 28.0% 45.0% 55.0%Grade 11 25.3% 34.5% 44.8% 55.2%Grade 12 20.3% 32.8% 53.1% 46.9%
________________________________________________________________________________Marijuana All 17.9% 25.7% 38.3% 61.7%
Grade 7 10.4% 13.9% 18.1% 81.9%
Grade 8 17.8% 22.9% 35.6% 64.4%Grade 9 21.2% 31.9% 43.4% 56.6%Grade 10 17.5% 25.8% 44.3% 55.7%Grade 11 23.8% 34.5% 45.2% 54.8%Grade 12 18.8% 29.7% 50.0% 50.0%
________________________________________________________________________________Marijuana Only All 6.9% 11.6% 20.2% 79.8%
Grade 7 5.3% 8.7% 12.0% 88.0%Grade 8 8.3% 11.7% 18.3% 81.7%Grade 9 6.6% 11.5% 19.7% 80.3%Grade 10 7.0% 10.0% 22.0% 78.0%Grade 11 5.6% 13.3% 20.0% 80.0%Grade 12 8.8% 16.2% 33.8% 66.2%
________________________________________________________________________________Cocaine or Crack All 4.3% 7.0% 11.6% 88.4%
Grade 7 2.0% 2.0% 4.1% 95.9%Grade 8 2.5% 4.2% 9.3% 90.7%
Grade 9 1.8% 7.0% 11.4% 88.6%Grade 10 5.1% 9.1% 15.2% 84.8%Grade 11 10.6% 12.9% 20.0% 80.0%Grade 12 6.2% 9.4% 12.5% 87.5%
________________________________________________________________________________Cocaine All 4.2% 7.0% 11.6% 88.4%
Grade 7 2.1% 2.1% 4.1% 95.9%Grade 8 2.5% 4.2% 9.3% 90.7%Grade 9 1.8% 7.0% 11.4% 88.6%Grade 10 4.0% 9.1% 15.2% 84.8%Grade 11 10.7% 13.1% 20.2% 79.8%Grade 12 6.2% 9.4% 12.5% 87.5%
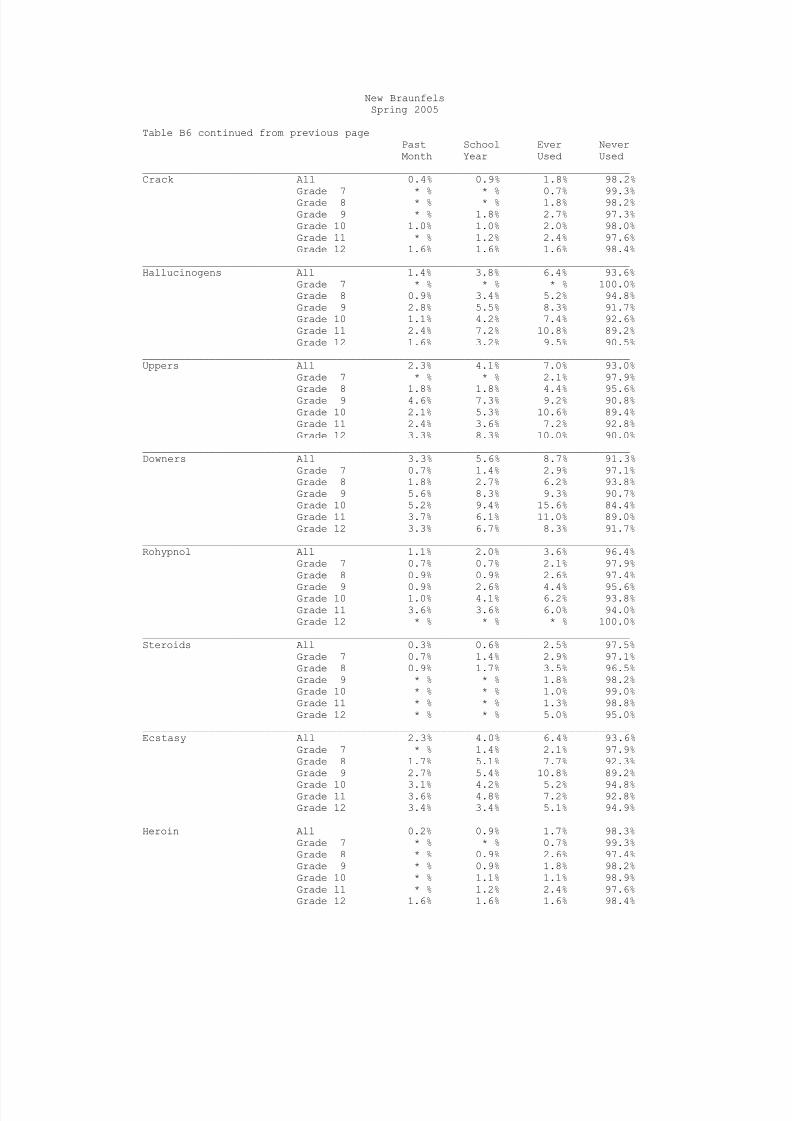
8/14/2019 COMAL COUNTY - New Braunfels ISD - 2005 Texas School Survey of Drug and Alcohol Use
http://slidepdf.com/reader/full/comal-county-new-braunfels-isd-2005-texas-school-survey-of-drug-and-alcohol 53/114
New BraunfelsSpring 2005
Table B6 continued from previous pagePast School Ever NeverMonth Year Used Used
________________________________________________________________________________Crack All 0.4% 0.9% 1.8% 98.2%
Grade 7 * % * % 0.7% 99.3%Grade 8 * % * % 1.8% 98.2%Grade 9 * % 1.8% 2.7% 97.3%Grade 10 1.0% 1.0% 2.0% 98.0%Grade 11 * % 1.2% 2.4% 97.6%Grade 12 1.6% 1.6% 1.6% 98.4%
________________________________________________________________________________Hallucinogens All 1.4% 3.8% 6.4% 93.6%
Grade 7 * % * % * % 100.0%Grade 8 0.9% 3.4% 5.2% 94.8%Grade 9 2.8% 5.5% 8.3% 91.7%Grade 10 1.1% 4.2% 7.4% 92.6%Grade 11 2.4% 7.2% 10.8% 89.2%Grade 12 1.6% 3.2% 9.5% 90.5%
________________________________________________________________________________Uppers All 2.3% 4.1% 7.0% 93.0%
Grade 7 * % * % 2.1% 97.9%
Grade 8 1.8% 1.8% 4.4% 95.6%Grade 9 4.6% 7.3% 9.2% 90.8%Grade 10 2.1% 5.3% 10.6% 89.4%Grade 11 2.4% 3.6% 7.2% 92.8%Grade 12 3.3% 8.3% 10.0% 90.0%
________________________________________________________________________________Downers All 3.3% 5.6% 8.7% 91.3%
Grade 7 0.7% 1.4% 2.9% 97.1%Grade 8 1.8% 2.7% 6.2% 93.8%Grade 9 5.6% 8.3% 9.3% 90.7%Grade 10 5.2% 9.4% 15.6% 84.4%Grade 11 3.7% 6.1% 11.0% 89.0%Grade 12 3.3% 6.7% 8.3% 91.7%
________________________________________________________________________________Rohypnol All 1.1% 2.0% 3.6% 96.4%
Grade 7 0.7% 0.7% 2.1% 97.9%Grade 8 0.9% 0.9% 2.6% 97.4%
Grade 9 0.9% 2.6% 4.4% 95.6%Grade 10 1.0% 4.1% 6.2% 93.8%Grade 11 3.6% 3.6% 6.0% 94.0%Grade 12 * % * % * % 100.0%
________________________________________________________________________________Steroids All 0.3% 0.6% 2.5% 97.5%
Grade 7 0.7% 1.4% 2.9% 97.1%Grade 8 0.9% 1.7% 3.5% 96.5%Grade 9 * % * % 1.8% 98.2%Grade 10 * % * % 1.0% 99.0%Grade 11 * % * % 1.3% 98.8%Grade 12 * % * % 5.0% 95.0%
________________________________________________________________________________Ecstasy All 2.3% 4.0% 6.4% 93.6%
Grade 7 * % 1.4% 2.1% 97.9%Grade 8 1.7% 5.1% 7.7% 92.3%Grade 9 2.7% 5.4% 10.8% 89.2%
Grade 10 3.1% 4.2% 5.2% 94.8%Grade 11 3.6% 4.8% 7.2% 92.8%Grade 12 3.4% 3.4% 5.1% 94.9%
________________________________________________________________________________Heroin All 0.2% 0.9% 1.7% 98.3%
Grade 7 * % * % 0.7% 99.3%Grade 8 * % 0.9% 2.6% 97.4%Grade 9 * % 0.9% 1.8% 98.2%Grade 10 * % 1.1% 1.1% 98.9%Grade 11 * % 1.2% 2.4% 97.6%Grade 12 1.6% 1.6% 1.6% 98.4%
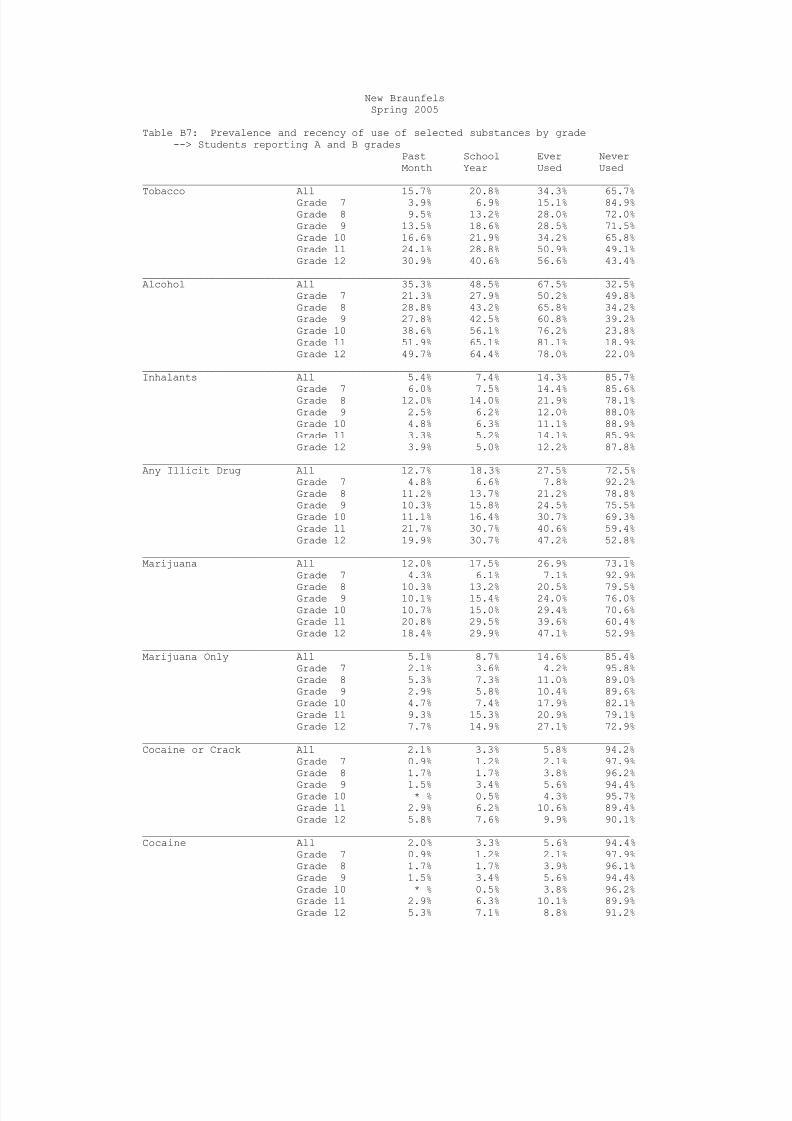
8/14/2019 COMAL COUNTY - New Braunfels ISD - 2005 Texas School Survey of Drug and Alcohol Use
http://slidepdf.com/reader/full/comal-county-new-braunfels-isd-2005-texas-school-survey-of-drug-and-alcohol 54/114
New BraunfelsSpring 2005
Table B7: Prevalence and recency of use of selected substances by grade--> Students reporting A and B grades
Past School Ever NeverMonth Year Used Used
________________________________________________________________________________
Tobacco All 15.7% 20.8% 34.3% 65.7%Grade 7 3.9% 6.9% 15.1% 84.9%Grade 8 9.5% 13.2% 28.0% 72.0%Grade 9 13.5% 18.6% 28.5% 71.5%Grade 10 16.6% 21.9% 34.2% 65.8%Grade 11 24.1% 28.8% 50.9% 49.1%Grade 12 30.9% 40.6% 56.6% 43.4%
________________________________________________________________________________Alcohol All 35.3% 48.5% 67.5% 32.5%
Grade 7 21.3% 27.9% 50.2% 49.8%Grade 8 28.8% 43.2% 65.8% 34.2%Grade 9 27.8% 42.5% 60.8% 39.2%Grade 10 38.6% 56.1% 76.2% 23.8%Grade 11 51.9% 65.1% 81.1% 18.9%Grade 12 49.7% 64.4% 78.0% 22.0%
________________________________________________________________________________Inhalants All 5.4% 7.4% 14.3% 85.7%
Grade 7 6.0% 7.5% 14.4% 85.6%Grade 8 12.0% 14.0% 21.9% 78.1%Grade 9 2.5% 6.2% 12.0% 88.0%Grade 10 4.8% 6.3% 11.1% 88.9%Grade 11 3.3% 5.2% 14.1% 85.9%Grade 12 3.9% 5.0% 12.2% 87.8%
________________________________________________________________________________Any Illicit Drug All 12.7% 18.3% 27.5% 72.5%
Grade 7 4.8% 6.6% 7.8% 92.2%Grade 8 11.2% 13.7% 21.2% 78.8%Grade 9 10.3% 15.8% 24.5% 75.5%Grade 10 11.1% 16.4% 30.7% 69.3%Grade 11 21.7% 30.7% 40.6% 59.4%Grade 12 19.9% 30.7% 47.2% 52.8%
________________________________________________________________________________Marijuana All 12.0% 17.5% 26.9% 73.1%
Grade 7 4.3% 6.1% 7.1% 92.9%
Grade 8 10.3% 13.2% 20.5% 79.5%Grade 9 10.1% 15.4% 24.0% 76.0%Grade 10 10.7% 15.0% 29.4% 70.6%Grade 11 20.8% 29.5% 39.6% 60.4%Grade 12 18.4% 29.9% 47.1% 52.9%
________________________________________________________________________________Marijuana Only All 5.1% 8.7% 14.6% 85.4%
Grade 7 2.1% 3.6% 4.2% 95.8%Grade 8 5.3% 7.3% 11.0% 89.0%Grade 9 2.9% 5.8% 10.4% 89.6%Grade 10 4.7% 7.4% 17.9% 82.1%Grade 11 9.3% 15.3% 20.9% 79.1%Grade 12 7.7% 14.9% 27.1% 72.9%
________________________________________________________________________________Cocaine or Crack All 2.1% 3.3% 5.8% 94.2%
Grade 7 0.9% 1.2% 2.1% 97.9%Grade 8 1.7% 1.7% 3.8% 96.2%
Grade 9 1.5% 3.4% 5.6% 94.4%Grade 10 * % 0.5% 4.3% 95.7%Grade 11 2.9% 6.2% 10.6% 89.4%Grade 12 5.8% 7.6% 9.9% 90.1%
________________________________________________________________________________Cocaine All 2.0% 3.3% 5.6% 94.4%
Grade 7 0.9% 1.2% 2.1% 97.9%Grade 8 1.7% 1.7% 3.9% 96.1%Grade 9 1.5% 3.4% 5.6% 94.4%Grade 10 * % 0.5% 3.8% 96.2%Grade 11 2.9% 6.3% 10.1% 89.9%Grade 12 5.3% 7.1% 8.8% 91.2%
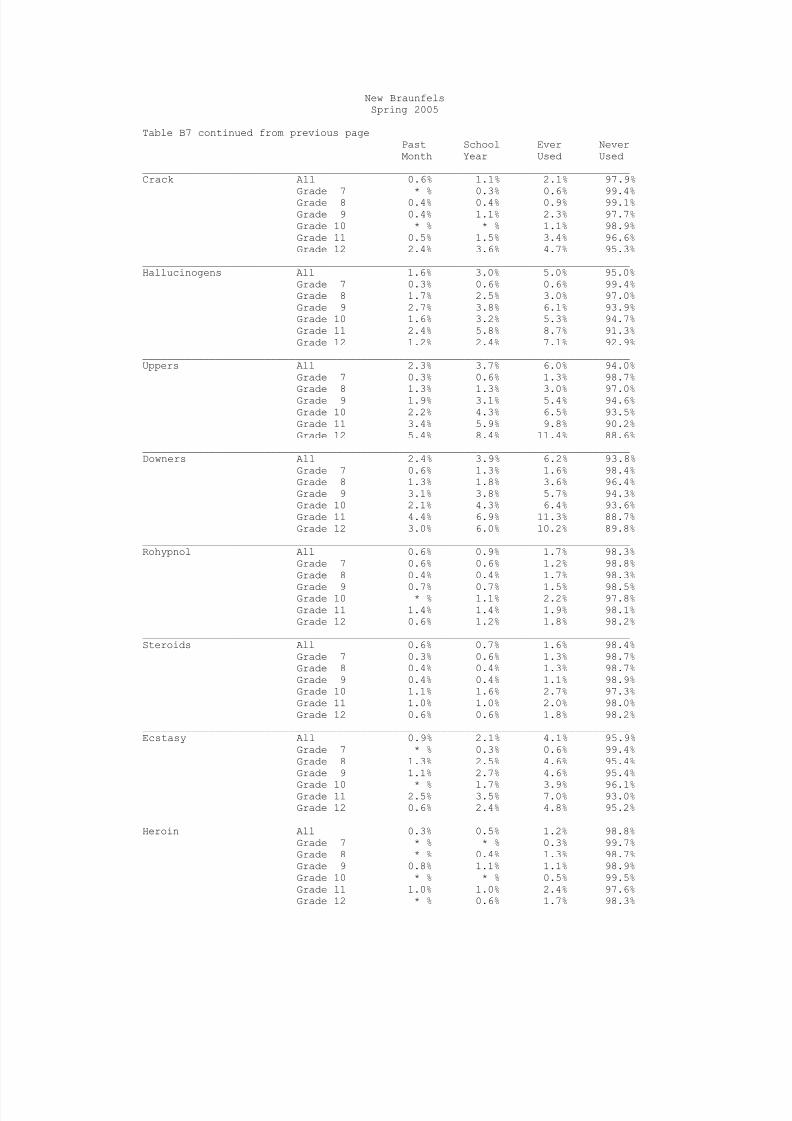
8/14/2019 COMAL COUNTY - New Braunfels ISD - 2005 Texas School Survey of Drug and Alcohol Use
http://slidepdf.com/reader/full/comal-county-new-braunfels-isd-2005-texas-school-survey-of-drug-and-alcohol 55/114
New BraunfelsSpring 2005
Table B7 continued from previous pagePast School Ever NeverMonth Year Used Used
________________________________________________________________________________Crack All 0.6% 1.1% 2.1% 97.9%
Grade 7 * % 0.3% 0.6% 99.4%Grade 8 0.4% 0.4% 0.9% 99.1%Grade 9 0.4% 1.1% 2.3% 97.7%Grade 10 * % * % 1.1% 98.9%Grade 11 0.5% 1.5% 3.4% 96.6%Grade 12 2.4% 3.6% 4.7% 95.3%
________________________________________________________________________________Hallucinogens All 1.6% 3.0% 5.0% 95.0%
Grade 7 0.3% 0.6% 0.6% 99.4%Grade 8 1.7% 2.5% 3.0% 97.0%Grade 9 2.7% 3.8% 6.1% 93.9%Grade 10 1.6% 3.2% 5.3% 94.7%Grade 11 2.4% 5.8% 8.7% 91.3%Grade 12 1.2% 2.4% 7.1% 92.9%
________________________________________________________________________________Uppers All 2.3% 3.7% 6.0% 94.0%
Grade 7 0.3% 0.6% 1.3% 98.7%
Grade 8 1.3% 1.3% 3.0% 97.0%Grade 9 1.9% 3.1% 5.4% 94.6%Grade 10 2.2% 4.3% 6.5% 93.5%Grade 11 3.4% 5.9% 9.8% 90.2%Grade 12 5.4% 8.4% 11.4% 88.6%
________________________________________________________________________________Downers All 2.4% 3.9% 6.2% 93.8%
Grade 7 0.6% 1.3% 1.6% 98.4%Grade 8 1.3% 1.8% 3.6% 96.4%Grade 9 3.1% 3.8% 5.7% 94.3%Grade 10 2.1% 4.3% 6.4% 93.6%Grade 11 4.4% 6.9% 11.3% 88.7%Grade 12 3.0% 6.0% 10.2% 89.8%
________________________________________________________________________________Rohypnol All 0.6% 0.9% 1.7% 98.3%
Grade 7 0.6% 0.6% 1.2% 98.8%Grade 8 0.4% 0.4% 1.7% 98.3%
Grade 9 0.7% 0.7% 1.5% 98.5%Grade 10 * % 1.1% 2.2% 97.8%Grade 11 1.4% 1.4% 1.9% 98.1%Grade 12 0.6% 1.2% 1.8% 98.2%
________________________________________________________________________________Steroids All 0.6% 0.7% 1.6% 98.4%
Grade 7 0.3% 0.6% 1.3% 98.7%Grade 8 0.4% 0.4% 1.3% 98.7%Grade 9 0.4% 0.4% 1.1% 98.9%Grade 10 1.1% 1.6% 2.7% 97.3%Grade 11 1.0% 1.0% 2.0% 98.0%Grade 12 0.6% 0.6% 1.8% 98.2%
________________________________________________________________________________Ecstasy All 0.9% 2.1% 4.1% 95.9%
Grade 7 * % 0.3% 0.6% 99.4%Grade 8 1.3% 2.5% 4.6% 95.4%Grade 9 1.1% 2.7% 4.6% 95.4%
Grade 10 * % 1.7% 3.9% 96.1%Grade 11 2.5% 3.5% 7.0% 93.0%Grade 12 0.6% 2.4% 4.8% 95.2%
________________________________________________________________________________Heroin All 0.3% 0.5% 1.2% 98.8%
Grade 7 * % * % 0.3% 99.7%Grade 8 * % 0.4% 1.3% 98.7%Grade 9 0.8% 1.1% 1.1% 98.9%Grade 10 * % * % 0.5% 99.5%Grade 11 1.0% 1.0% 2.4% 97.6%Grade 12 * % 0.6% 1.7% 98.3%
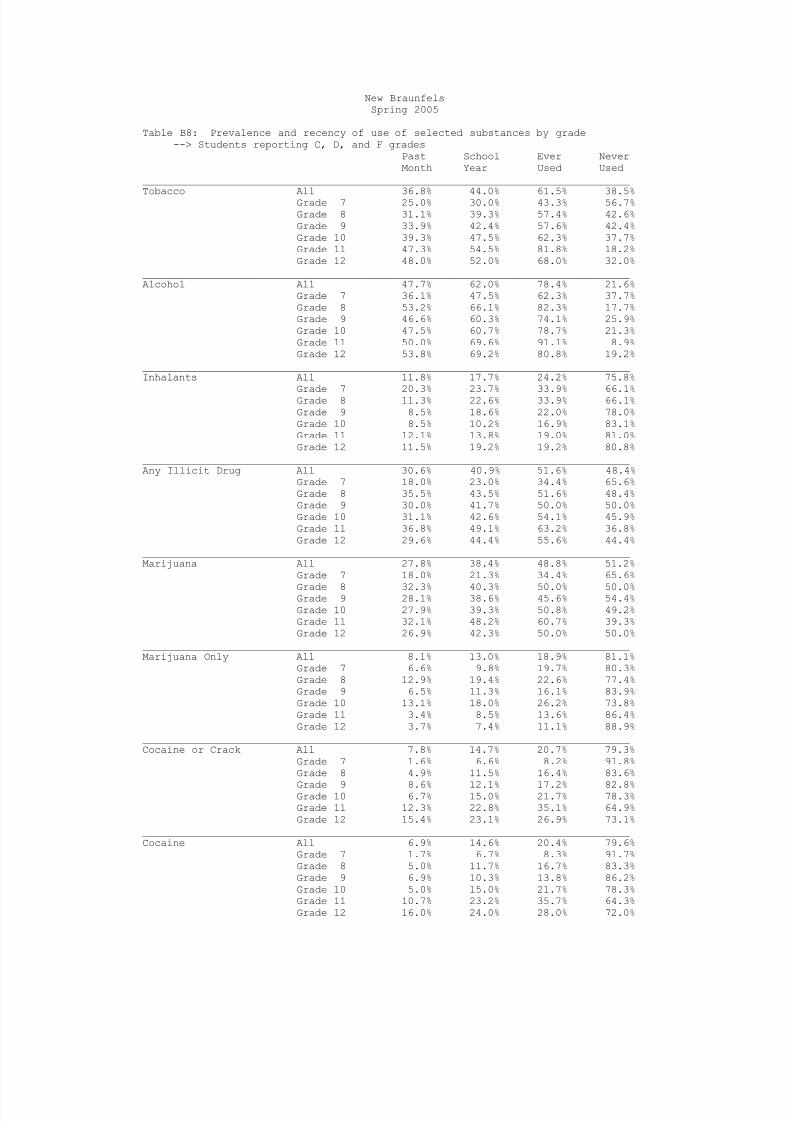
8/14/2019 COMAL COUNTY - New Braunfels ISD - 2005 Texas School Survey of Drug and Alcohol Use
http://slidepdf.com/reader/full/comal-county-new-braunfels-isd-2005-texas-school-survey-of-drug-and-alcohol 56/114
New BraunfelsSpring 2005
Table B8: Prevalence and recency of use of selected substances by grade--> Students reporting C, D, and F grades
Past School Ever NeverMonth Year Used Used
________________________________________________________________________________
Tobacco All 36.8% 44.0% 61.5% 38.5%Grade 7 25.0% 30.0% 43.3% 56.7%Grade 8 31.1% 39.3% 57.4% 42.6%Grade 9 33.9% 42.4% 57.6% 42.4%Grade 10 39.3% 47.5% 62.3% 37.7%Grade 11 47.3% 54.5% 81.8% 18.2%Grade 12 48.0% 52.0% 68.0% 32.0%
________________________________________________________________________________Alcohol All 47.7% 62.0% 78.4% 21.6%
Grade 7 36.1% 47.5% 62.3% 37.7%Grade 8 53.2% 66.1% 82.3% 17.7%Grade 9 46.6% 60.3% 74.1% 25.9%Grade 10 47.5% 60.7% 78.7% 21.3%Grade 11 50.0% 69.6% 91.1% 8.9%Grade 12 53.8% 69.2% 80.8% 19.2%
________________________________________________________________________________Inhalants All 11.8% 17.7% 24.2% 75.8%
Grade 7 20.3% 23.7% 33.9% 66.1%Grade 8 11.3% 22.6% 33.9% 66.1%Grade 9 8.5% 18.6% 22.0% 78.0%Grade 10 8.5% 10.2% 16.9% 83.1%Grade 11 12.1% 13.8% 19.0% 81.0%Grade 12 11.5% 19.2% 19.2% 80.8%
________________________________________________________________________________Any Illicit Drug All 30.6% 40.9% 51.6% 48.4%
Grade 7 18.0% 23.0% 34.4% 65.6%Grade 8 35.5% 43.5% 51.6% 48.4%Grade 9 30.0% 41.7% 50.0% 50.0%Grade 10 31.1% 42.6% 54.1% 45.9%Grade 11 36.8% 49.1% 63.2% 36.8%Grade 12 29.6% 44.4% 55.6% 44.4%
________________________________________________________________________________Marijuana All 27.8% 38.4% 48.8% 51.2%
Grade 7 18.0% 21.3% 34.4% 65.6%
Grade 8 32.3% 40.3% 50.0% 50.0%Grade 9 28.1% 38.6% 45.6% 54.4%Grade 10 27.9% 39.3% 50.8% 49.2%Grade 11 32.1% 48.2% 60.7% 39.3%Grade 12 26.9% 42.3% 50.0% 50.0%
________________________________________________________________________________Marijuana Only All 8.1% 13.0% 18.9% 81.1%
Grade 7 6.6% 9.8% 19.7% 80.3%Grade 8 12.9% 19.4% 22.6% 77.4%Grade 9 6.5% 11.3% 16.1% 83.9%Grade 10 13.1% 18.0% 26.2% 73.8%Grade 11 3.4% 8.5% 13.6% 86.4%Grade 12 3.7% 7.4% 11.1% 88.9%
________________________________________________________________________________Cocaine or Crack All 7.8% 14.7% 20.7% 79.3%
Grade 7 1.6% 6.6% 8.2% 91.8%Grade 8 4.9% 11.5% 16.4% 83.6%
Grade 9 8.6% 12.1% 17.2% 82.8%Grade 10 6.7% 15.0% 21.7% 78.3%Grade 11 12.3% 22.8% 35.1% 64.9%Grade 12 15.4% 23.1% 26.9% 73.1%
________________________________________________________________________________Cocaine All 6.9% 14.6% 20.4% 79.6%
Grade 7 1.7% 6.7% 8.3% 91.7%Grade 8 5.0% 11.7% 16.7% 83.3%Grade 9 6.9% 10.3% 13.8% 86.2%Grade 10 5.0% 15.0% 21.7% 78.3%Grade 11 10.7% 23.2% 35.7% 64.3%Grade 12 16.0% 24.0% 28.0% 72.0%
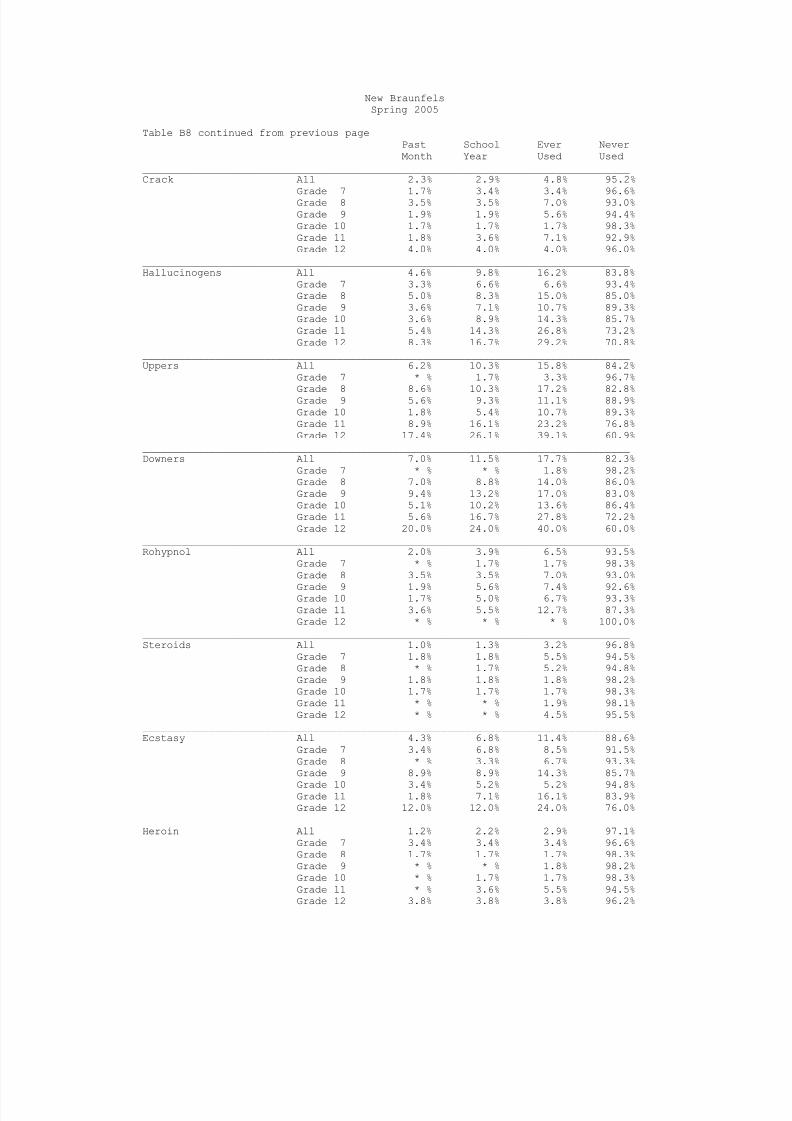
8/14/2019 COMAL COUNTY - New Braunfels ISD - 2005 Texas School Survey of Drug and Alcohol Use
http://slidepdf.com/reader/full/comal-county-new-braunfels-isd-2005-texas-school-survey-of-drug-and-alcohol 57/114
New BraunfelsSpring 2005
Table B8 continued from previous pagePast School Ever NeverMonth Year Used Used
________________________________________________________________________________Crack All 2.3% 2.9% 4.8% 95.2%
Grade 7 1.7% 3.4% 3.4% 96.6%Grade 8 3.5% 3.5% 7.0% 93.0%Grade 9 1.9% 1.9% 5.6% 94.4%Grade 10 1.7% 1.7% 1.7% 98.3%Grade 11 1.8% 3.6% 7.1% 92.9%Grade 12 4.0% 4.0% 4.0% 96.0%
________________________________________________________________________________Hallucinogens All 4.6% 9.8% 16.2% 83.8%
Grade 7 3.3% 6.6% 6.6% 93.4%Grade 8 5.0% 8.3% 15.0% 85.0%Grade 9 3.6% 7.1% 10.7% 89.3%Grade 10 3.6% 8.9% 14.3% 85.7%Grade 11 5.4% 14.3% 26.8% 73.2%Grade 12 8.3% 16.7% 29.2% 70.8%
________________________________________________________________________________Uppers All 6.2% 10.3% 15.8% 84.2%
Grade 7 * % 1.7% 3.3% 96.7%
Grade 8 8.6% 10.3% 17.2% 82.8%Grade 9 5.6% 9.3% 11.1% 88.9%Grade 10 1.8% 5.4% 10.7% 89.3%Grade 11 8.9% 16.1% 23.2% 76.8%Grade 12 17.4% 26.1% 39.1% 60.9%
________________________________________________________________________________Downers All 7.0% 11.5% 17.7% 82.3%
Grade 7 * % * % 1.8% 98.2%Grade 8 7.0% 8.8% 14.0% 86.0%Grade 9 9.4% 13.2% 17.0% 83.0%Grade 10 5.1% 10.2% 13.6% 86.4%Grade 11 5.6% 16.7% 27.8% 72.2%Grade 12 20.0% 24.0% 40.0% 60.0%
________________________________________________________________________________Rohypnol All 2.0% 3.9% 6.5% 93.5%
Grade 7 * % 1.7% 1.7% 98.3%Grade 8 3.5% 3.5% 7.0% 93.0%
Grade 9 1.9% 5.6% 7.4% 92.6%Grade 10 1.7% 5.0% 6.7% 93.3%Grade 11 3.6% 5.5% 12.7% 87.3%Grade 12 * % * % * % 100.0%
________________________________________________________________________________Steroids All 1.0% 1.3% 3.2% 96.8%
Grade 7 1.8% 1.8% 5.5% 94.5%Grade 8 * % 1.7% 5.2% 94.8%Grade 9 1.8% 1.8% 1.8% 98.2%Grade 10 1.7% 1.7% 1.7% 98.3%Grade 11 * % * % 1.9% 98.1%Grade 12 * % * % 4.5% 95.5%
________________________________________________________________________________Ecstasy All 4.3% 6.8% 11.4% 88.6%
Grade 7 3.4% 6.8% 8.5% 91.5%Grade 8 * % 3.3% 6.7% 93.3%Grade 9 8.9% 8.9% 14.3% 85.7%
Grade 10 3.4% 5.2% 5.2% 94.8%Grade 11 1.8% 7.1% 16.1% 83.9%Grade 12 12.0% 12.0% 24.0% 76.0%
________________________________________________________________________________Heroin All 1.2% 2.2% 2.9% 97.1%
Grade 7 3.4% 3.4% 3.4% 96.6%Grade 8 1.7% 1.7% 1.7% 98.3%Grade 9 * % * % 1.8% 98.2%Grade 10 * % 1.7% 1.7% 98.3%Grade 11 * % 3.6% 5.5% 94.5%Grade 12 3.8% 3.8% 3.8% 96.2%

8/14/2019 COMAL COUNTY - New Braunfels ISD - 2005 Texas School Survey of Drug and Alcohol Use
http://slidepdf.com/reader/full/comal-county-new-braunfels-isd-2005-texas-school-survey-of-drug-and-alcohol 58/114
New BraunfelsSpring 2005
Table B9: Prevalence and recency of use of selected substances by grade--> Students living with two parents
Past School Ever NeverMonth Year Used Used
________________________________________________________________________________
Tobacco All 16.3% 20.3% 33.2% 66.8%Grade 7 5.5% 7.4% 15.5% 84.5%Grade 8 8.9% 12.5% 28.6% 71.4%Grade 9 14.9% 18.5% 27.0% 73.0%Grade 10 17.3% 22.5% 34.1% 65.9%Grade 11 25.4% 30.2% 50.3% 49.7%Grade 12 31.7% 37.4% 53.7% 46.3%
________________________________________________________________________________Alcohol All 32.8% 45.8% 64.6% 35.4%
Grade 7 20.1% 27.1% 46.9% 53.1%Grade 8 29.2% 43.2% 65.1% 34.9%Grade 9 27.4% 40.8% 56.1% 43.9%Grade 10 34.3% 52.0% 73.1% 26.9%Grade 11 49.4% 65.3% 81.2% 18.8%Grade 12 43.2% 54.4% 72.8% 27.2%
________________________________________________________________________________Inhalants All 5.7% 8.0% 13.9% 86.1%
Grade 7 7.3% 8.8% 16.1% 83.9%Grade 8 9.4% 13.1% 22.0% 78.0%Grade 9 3.1% 7.6% 12.5% 87.5%Grade 10 5.7% 6.9% 9.8% 90.2%Grade 11 4.1% 5.9% 12.4% 87.6%Grade 12 4.0% 4.8% 9.5% 90.5%
________________________________________________________________________________Any Illicit Drug All 13.3% 18.9% 26.9% 73.1%
Grade 7 5.1% 7.7% 9.9% 90.1%Grade 8 8.9% 11.6% 20.0% 80.0%Grade 9 12.6% 17.1% 23.9% 76.1%Grade 10 15.4% 20.0% 30.9% 69.1%Grade 11 23.5% 34.1% 42.4% 57.6%Grade 12 17.6% 28.0% 42.4% 57.6%
________________________________________________________________________________Marijuana All 12.3% 17.6% 25.4% 74.6%
Grade 7 4.5% 6.7% 9.0% 91.0%
Grade 8 7.0% 10.3% 18.4% 81.6%Grade 9 11.6% 15.7% 21.3% 78.7%Grade 10 14.5% 17.9% 28.9% 71.1%Grade 11 22.6% 32.9% 42.1% 57.9%Grade 12 16.9% 27.4% 41.1% 58.9%
________________________________________________________________________________Marijuana Only All 5.0% 8.3% 13.2% 86.8%
Grade 7 1.8% 3.6% 5.1% 94.9%Grade 8 3.6% 5.7% 9.8% 90.2%Grade 9 3.9% 6.1% 8.7% 91.3%Grade 10 6.2% 7.9% 16.4% 83.6%Grade 11 8.8% 15.2% 20.5% 79.5%Grade 12 7.0% 14.1% 23.4% 76.6%
________________________________________________________________________________Cocaine or Crack All 2.7% 4.5% 7.0% 93.0%
Grade 7 0.7% 1.5% 2.6% 97.4%Grade 8 1.6% 2.7% 4.3% 95.7%
Grade 9 3.2% 4.6% 6.9% 93.1%Grade 10 2.3% 3.4% 6.3% 93.7%Grade 11 4.2% 9.6% 14.4% 85.6%Grade 12 4.9% 6.5% 9.8% 90.2%
________________________________________________________________________________Cocaine All 2.4% 4.3% 6.6% 93.4%
Grade 7 0.8% 1.5% 2.6% 97.4%Grade 8 1.6% 2.7% 4.3% 95.7%Grade 9 2.8% 4.2% 6.0% 94.0%Grade 10 1.7% 3.4% 6.3% 93.7%Grade 11 4.2% 9.6% 13.8% 86.2%Grade 12 4.2% 5.8% 8.3% 91.7%
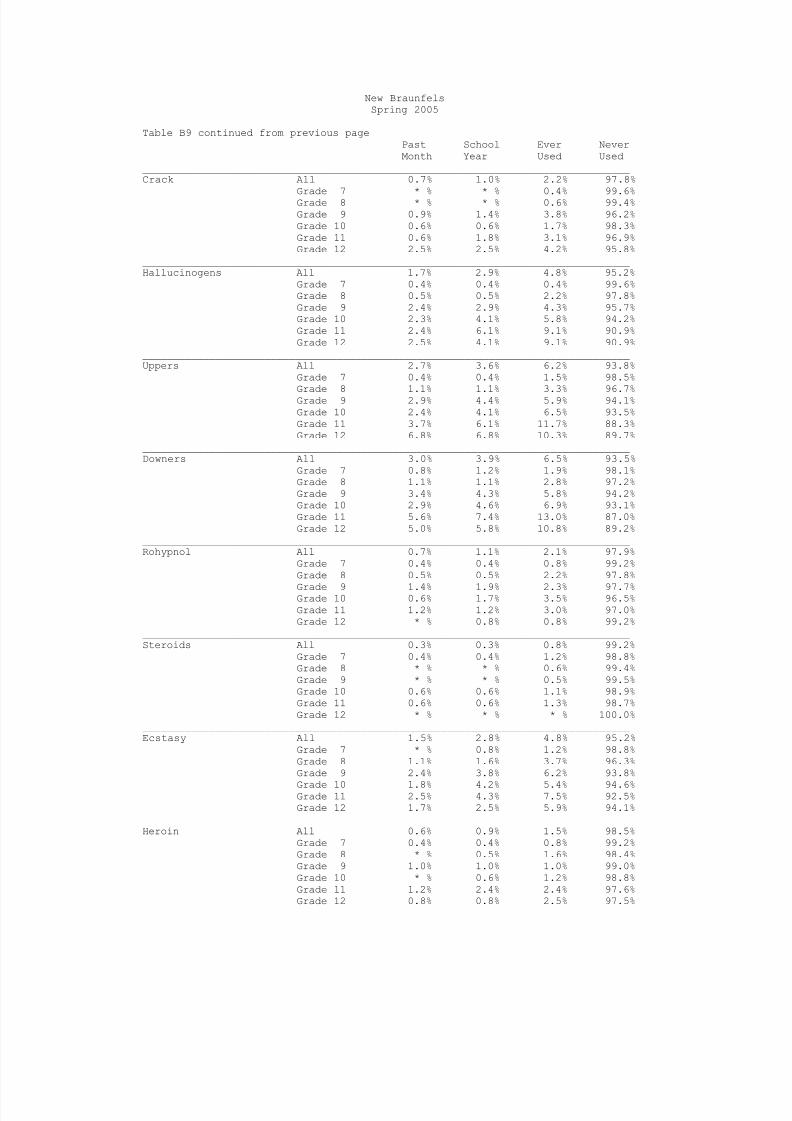
8/14/2019 COMAL COUNTY - New Braunfels ISD - 2005 Texas School Survey of Drug and Alcohol Use
http://slidepdf.com/reader/full/comal-county-new-braunfels-isd-2005-texas-school-survey-of-drug-and-alcohol 59/114
New BraunfelsSpring 2005
Table B9 continued from previous pagePast School Ever NeverMonth Year Used Used
________________________________________________________________________________Crack All 0.7% 1.0% 2.2% 97.8%
Grade 7 * % * % 0.4% 99.6%Grade 8 * % * % 0.6% 99.4%Grade 9 0.9% 1.4% 3.8% 96.2%Grade 10 0.6% 0.6% 1.7% 98.3%Grade 11 0.6% 1.8% 3.1% 96.9%Grade 12 2.5% 2.5% 4.2% 95.8%
________________________________________________________________________________Hallucinogens All 1.7% 2.9% 4.8% 95.2%
Grade 7 0.4% 0.4% 0.4% 99.6%Grade 8 0.5% 0.5% 2.2% 97.8%Grade 9 2.4% 2.9% 4.3% 95.7%Grade 10 2.3% 4.1% 5.8% 94.2%Grade 11 2.4% 6.1% 9.1% 90.9%Grade 12 2.5% 4.1% 9.1% 90.9%
________________________________________________________________________________Uppers All 2.7% 3.6% 6.2% 93.8%
Grade 7 0.4% 0.4% 1.5% 98.5%
Grade 8 1.1% 1.1% 3.3% 96.7%Grade 9 2.9% 4.4% 5.9% 94.1%Grade 10 2.4% 4.1% 6.5% 93.5%Grade 11 3.7% 6.1% 11.7% 88.3%Grade 12 6.8% 6.8% 10.3% 89.7%
________________________________________________________________________________Downers All 3.0% 3.9% 6.5% 93.5%
Grade 7 0.8% 1.2% 1.9% 98.1%Grade 8 1.1% 1.1% 2.8% 97.2%Grade 9 3.4% 4.3% 5.8% 94.2%Grade 10 2.9% 4.6% 6.9% 93.1%Grade 11 5.6% 7.4% 13.0% 87.0%Grade 12 5.0% 5.8% 10.8% 89.2%
________________________________________________________________________________Rohypnol All 0.7% 1.1% 2.1% 97.9%
Grade 7 0.4% 0.4% 0.8% 99.2%Grade 8 0.5% 0.5% 2.2% 97.8%
Grade 9 1.4% 1.9% 2.3% 97.7%Grade 10 0.6% 1.7% 3.5% 96.5%Grade 11 1.2% 1.2% 3.0% 97.0%Grade 12 * % 0.8% 0.8% 99.2%
________________________________________________________________________________Steroids All 0.3% 0.3% 0.8% 99.2%
Grade 7 0.4% 0.4% 1.2% 98.8%Grade 8 * % * % 0.6% 99.4%Grade 9 * % * % 0.5% 99.5%Grade 10 0.6% 0.6% 1.1% 98.9%Grade 11 0.6% 0.6% 1.3% 98.7%Grade 12 * % * % * % 100.0%
________________________________________________________________________________Ecstasy All 1.5% 2.8% 4.8% 95.2%
Grade 7 * % 0.8% 1.2% 98.8%Grade 8 1.1% 1.6% 3.7% 96.3%Grade 9 2.4% 3.8% 6.2% 93.8%
Grade 10 1.8% 4.2% 5.4% 94.6%Grade 11 2.5% 4.3% 7.5% 92.5%Grade 12 1.7% 2.5% 5.9% 94.1%
________________________________________________________________________________Heroin All 0.6% 0.9% 1.5% 98.5%
Grade 7 0.4% 0.4% 0.8% 99.2%Grade 8 * % 0.5% 1.6% 98.4%Grade 9 1.0% 1.0% 1.0% 99.0%Grade 10 * % 0.6% 1.2% 98.8%Grade 11 1.2% 2.4% 2.4% 97.6%Grade 12 0.8% 0.8% 2.5% 97.5%
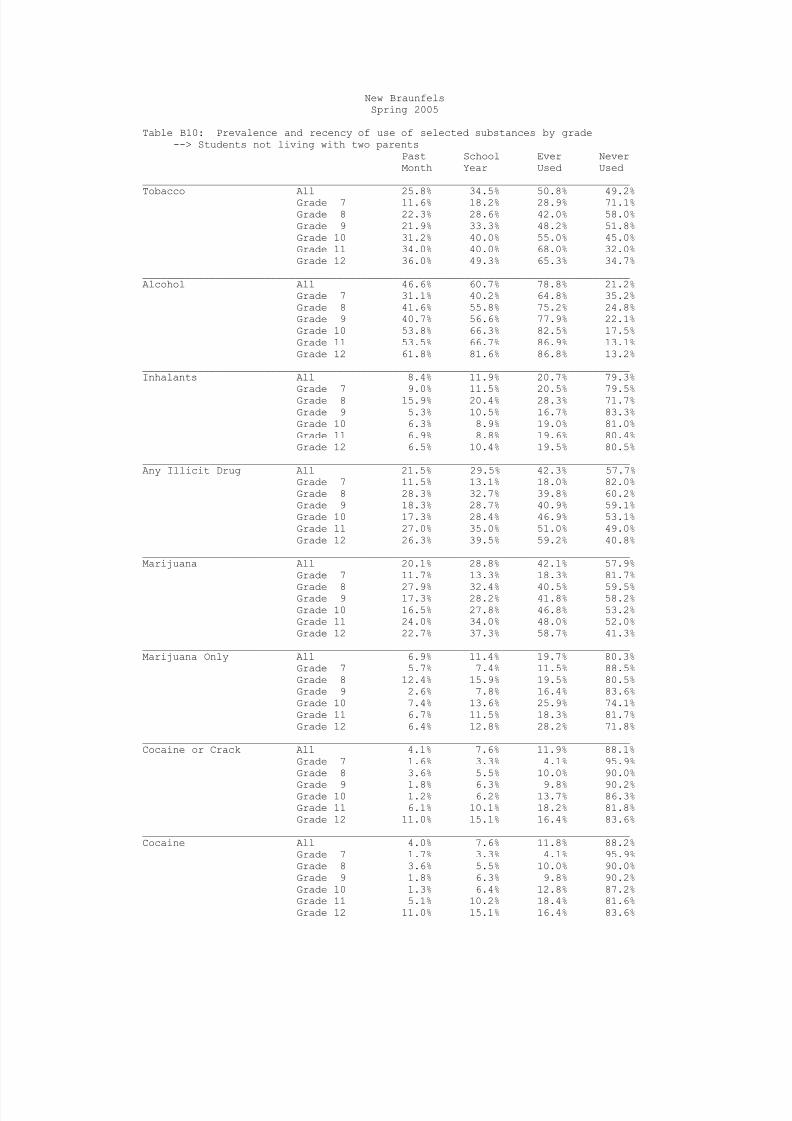
8/14/2019 COMAL COUNTY - New Braunfels ISD - 2005 Texas School Survey of Drug and Alcohol Use
http://slidepdf.com/reader/full/comal-county-new-braunfels-isd-2005-texas-school-survey-of-drug-and-alcohol 60/114
New BraunfelsSpring 2005
Table B10: Prevalence and recency of use of selected substances by grade--> Students not living with two parents
Past School Ever NeverMonth Year Used Used
________________________________________________________________________________
Tobacco All 25.8% 34.5% 50.8% 49.2%Grade 7 11.6% 18.2% 28.9% 71.1%Grade 8 22.3% 28.6% 42.0% 58.0%Grade 9 21.9% 33.3% 48.2% 51.8%Grade 10 31.2% 40.0% 55.0% 45.0%Grade 11 34.0% 40.0% 68.0% 32.0%Grade 12 36.0% 49.3% 65.3% 34.7%
________________________________________________________________________________Alcohol All 46.6% 60.7% 78.8% 21.2%
Grade 7 31.1% 40.2% 64.8% 35.2%Grade 8 41.6% 55.8% 75.2% 24.8%Grade 9 40.7% 56.6% 77.9% 22.1%Grade 10 53.8% 66.3% 82.5% 17.5%Grade 11 53.5% 66.7% 86.9% 13.1%Grade 12 61.8% 81.6% 86.8% 13.2%
________________________________________________________________________________Inhalants All 8.4% 11.9% 20.7% 79.3%
Grade 7 9.0% 11.5% 20.5% 79.5%Grade 8 15.9% 20.4% 28.3% 71.7%Grade 9 5.3% 10.5% 16.7% 83.3%Grade 10 6.3% 8.9% 19.0% 81.0%Grade 11 6.9% 8.8% 19.6% 80.4%Grade 12 6.5% 10.4% 19.5% 80.5%
________________________________________________________________________________Any Illicit Drug All 21.5% 29.5% 42.3% 57.7%
Grade 7 11.5% 13.1% 18.0% 82.0%Grade 8 28.3% 32.7% 39.8% 60.2%Grade 9 18.3% 28.7% 40.9% 59.1%Grade 10 17.3% 28.4% 46.9% 53.1%Grade 11 27.0% 35.0% 51.0% 49.0%Grade 12 26.3% 39.5% 59.2% 40.8%
________________________________________________________________________________Marijuana All 20.1% 28.8% 42.1% 57.9%
Grade 7 11.7% 13.3% 18.3% 81.7%
Grade 8 27.9% 32.4% 40.5% 59.5%Grade 9 17.3% 28.2% 41.8% 58.2%Grade 10 16.5% 27.8% 46.8% 53.2%Grade 11 24.0% 34.0% 48.0% 52.0%Grade 12 22.7% 37.3% 58.7% 41.3%
________________________________________________________________________________Marijuana Only All 6.9% 11.4% 19.7% 80.3%
Grade 7 5.7% 7.4% 11.5% 88.5%Grade 8 12.4% 15.9% 19.5% 80.5%Grade 9 2.6% 7.8% 16.4% 83.6%Grade 10 7.4% 13.6% 25.9% 74.1%Grade 11 6.7% 11.5% 18.3% 81.7%Grade 12 6.4% 12.8% 28.2% 71.8%
________________________________________________________________________________Cocaine or Crack All 4.1% 7.6% 11.9% 88.1%
Grade 7 1.6% 3.3% 4.1% 95.9%Grade 8 3.6% 5.5% 10.0% 90.0%
Grade 9 1.8% 6.3% 9.8% 90.2%Grade 10 1.2% 6.2% 13.7% 86.3%Grade 11 6.1% 10.1% 18.2% 81.8%Grade 12 11.0% 15.1% 16.4% 83.6%
________________________________________________________________________________Cocaine All 4.0% 7.6% 11.8% 88.2%
Grade 7 1.7% 3.3% 4.1% 95.9%Grade 8 3.6% 5.5% 10.0% 90.0%Grade 9 1.8% 6.3% 9.8% 90.2%Grade 10 1.3% 6.4% 12.8% 87.2%Grade 11 5.1% 10.2% 18.4% 81.6%Grade 12 11.0% 15.1% 16.4% 83.6%
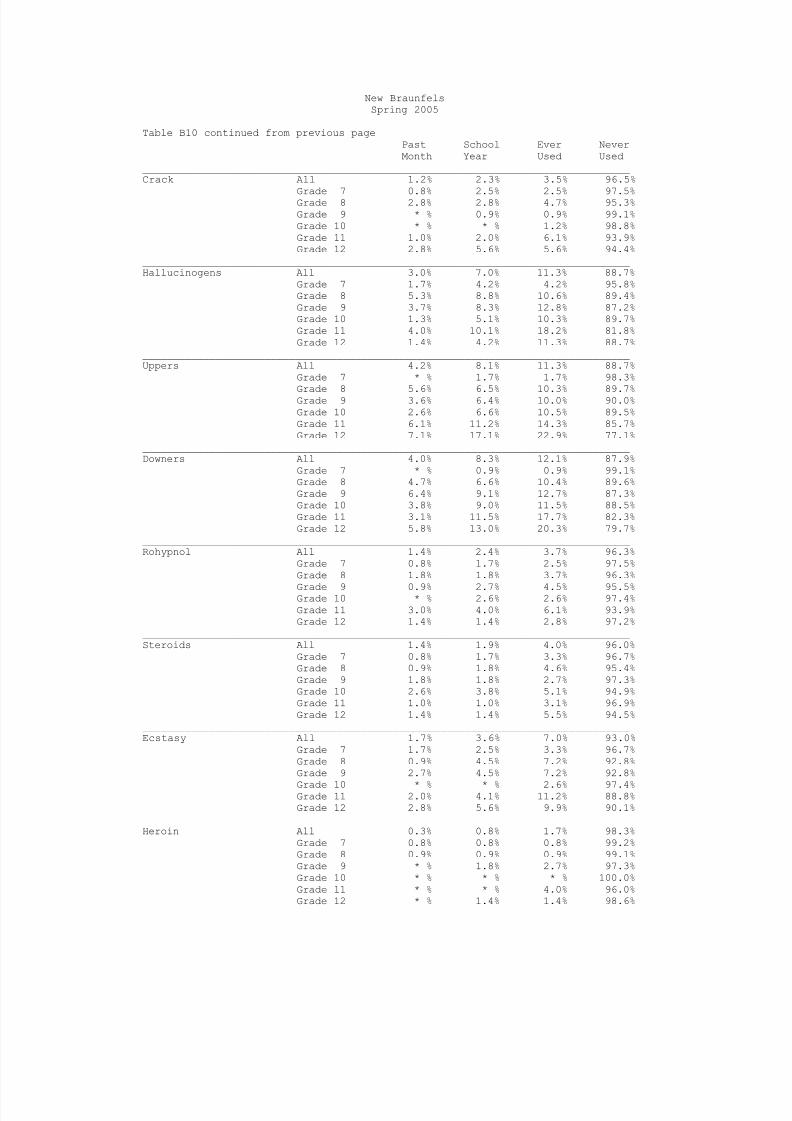
8/14/2019 COMAL COUNTY - New Braunfels ISD - 2005 Texas School Survey of Drug and Alcohol Use
http://slidepdf.com/reader/full/comal-county-new-braunfels-isd-2005-texas-school-survey-of-drug-and-alcohol 61/114
New BraunfelsSpring 2005
Table B10 continued from previous pagePast School Ever NeverMonth Year Used Used
________________________________________________________________________________Crack All 1.2% 2.3% 3.5% 96.5%
Grade 7 0.8% 2.5% 2.5% 97.5%Grade 8 2.8% 2.8% 4.7% 95.3%Grade 9 * % 0.9% 0.9% 99.1%Grade 10 * % * % 1.2% 98.8%Grade 11 1.0% 2.0% 6.1% 93.9%Grade 12 2.8% 5.6% 5.6% 94.4%
________________________________________________________________________________Hallucinogens All 3.0% 7.0% 11.3% 88.7%
Grade 7 1.7% 4.2% 4.2% 95.8%Grade 8 5.3% 8.8% 10.6% 89.4%Grade 9 3.7% 8.3% 12.8% 87.2%Grade 10 1.3% 5.1% 10.3% 89.7%Grade 11 4.0% 10.1% 18.2% 81.8%Grade 12 1.4% 4.2% 11.3% 88.7%
________________________________________________________________________________Uppers All 4.2% 8.1% 11.3% 88.7%
Grade 7 * % 1.7% 1.7% 98.3%
Grade 8 5.6% 6.5% 10.3% 89.7%Grade 9 3.6% 6.4% 10.0% 90.0%Grade 10 2.6% 6.6% 10.5% 89.5%Grade 11 6.1% 11.2% 14.3% 85.7%Grade 12 7.1% 17.1% 22.9% 77.1%
________________________________________________________________________________Downers All 4.0% 8.3% 12.1% 87.9%
Grade 7 * % 0.9% 0.9% 99.1%Grade 8 4.7% 6.6% 10.4% 89.6%Grade 9 6.4% 9.1% 12.7% 87.3%Grade 10 3.8% 9.0% 11.5% 88.5%Grade 11 3.1% 11.5% 17.7% 82.3%Grade 12 5.8% 13.0% 20.3% 79.7%
________________________________________________________________________________Rohypnol All 1.4% 2.4% 3.7% 96.3%
Grade 7 0.8% 1.7% 2.5% 97.5%Grade 8 1.8% 1.8% 3.7% 96.3%
Grade 9 0.9% 2.7% 4.5% 95.5%Grade 10 * % 2.6% 2.6% 97.4%Grade 11 3.0% 4.0% 6.1% 93.9%Grade 12 1.4% 1.4% 2.8% 97.2%
________________________________________________________________________________Steroids All 1.4% 1.9% 4.0% 96.0%
Grade 7 0.8% 1.7% 3.3% 96.7%Grade 8 0.9% 1.8% 4.6% 95.4%Grade 9 1.8% 1.8% 2.7% 97.3%Grade 10 2.6% 3.8% 5.1% 94.9%Grade 11 1.0% 1.0% 3.1% 96.9%Grade 12 1.4% 1.4% 5.5% 94.5%
________________________________________________________________________________Ecstasy All 1.7% 3.6% 7.0% 93.0%
Grade 7 1.7% 2.5% 3.3% 96.7%Grade 8 0.9% 4.5% 7.2% 92.8%Grade 9 2.7% 4.5% 7.2% 92.8%
Grade 10 * % * % 2.6% 97.4%Grade 11 2.0% 4.1% 11.2% 88.8%Grade 12 2.8% 5.6% 9.9% 90.1%
________________________________________________________________________________Heroin All 0.3% 0.8% 1.7% 98.3%
Grade 7 0.8% 0.8% 0.8% 99.2%Grade 8 0.9% 0.9% 0.9% 99.1%Grade 9 * % 1.8% 2.7% 97.3%Grade 10 * % * % * % 100.0%Grade 11 * % * % 4.0% 96.0%Grade 12 * % 1.4% 1.4% 98.6%
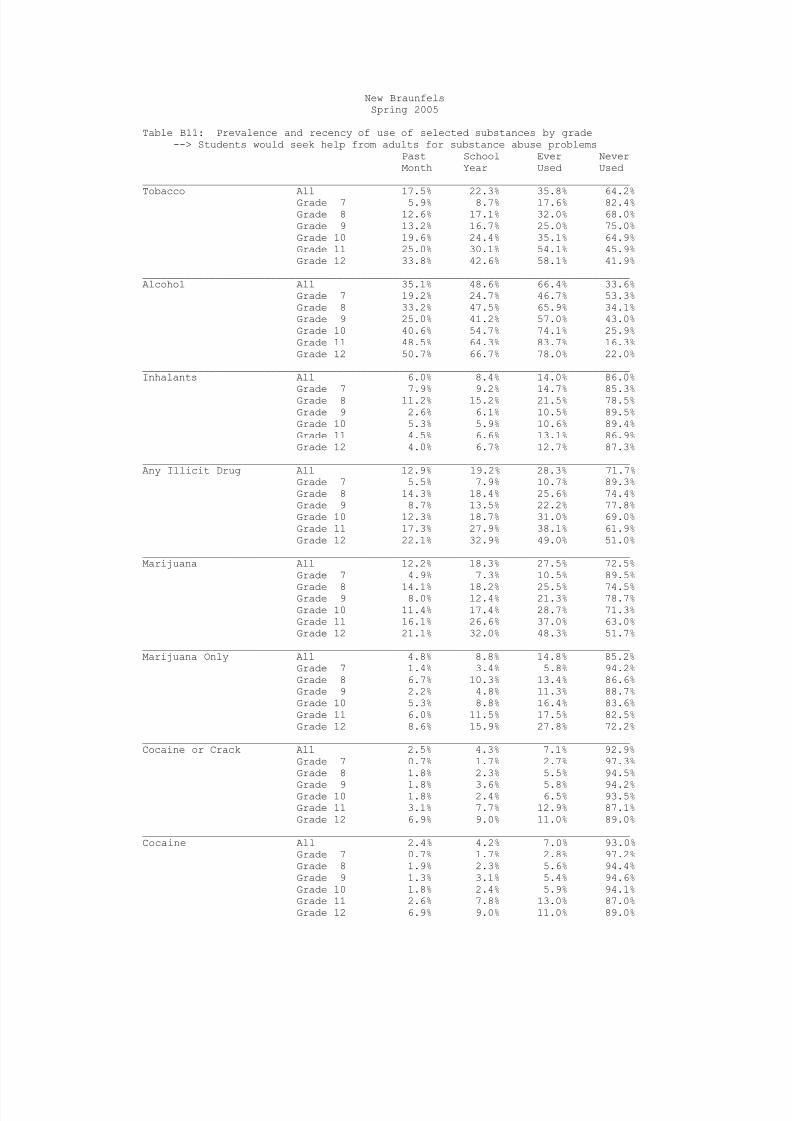
8/14/2019 COMAL COUNTY - New Braunfels ISD - 2005 Texas School Survey of Drug and Alcohol Use
http://slidepdf.com/reader/full/comal-county-new-braunfels-isd-2005-texas-school-survey-of-drug-and-alcohol 62/114
New BraunfelsSpring 2005
Table B11: Prevalence and recency of use of selected substances by grade--> Students would seek help from adults for substance abuse problems
Past School Ever NeverMonth Year Used Used
________________________________________________________________________________
Tobacco All 17.5% 22.3% 35.8% 64.2%Grade 7 5.9% 8.7% 17.6% 82.4%Grade 8 12.6% 17.1% 32.0% 68.0%Grade 9 13.2% 16.7% 25.0% 75.0%Grade 10 19.6% 24.4% 35.1% 64.9%Grade 11 25.0% 30.1% 54.1% 45.9%Grade 12 33.8% 42.6% 58.1% 41.9%
________________________________________________________________________________Alcohol All 35.1% 48.6% 66.4% 33.6%
Grade 7 19.2% 24.7% 46.7% 53.3%Grade 8 33.2% 47.5% 65.9% 34.1%Grade 9 25.0% 41.2% 57.0% 43.0%Grade 10 40.6% 54.7% 74.1% 25.9%Grade 11 48.5% 64.3% 83.7% 16.3%Grade 12 50.7% 66.7% 78.0% 22.0%
________________________________________________________________________________Inhalants All 6.0% 8.4% 14.0% 86.0%
Grade 7 7.9% 9.2% 14.7% 85.3%Grade 8 11.2% 15.2% 21.5% 78.5%Grade 9 2.6% 6.1% 10.5% 89.5%Grade 10 5.3% 5.9% 10.6% 89.4%Grade 11 4.5% 6.6% 13.1% 86.9%Grade 12 4.0% 6.7% 12.7% 87.3%
________________________________________________________________________________Any Illicit Drug All 12.9% 19.2% 28.3% 71.7%
Grade 7 5.5% 7.9% 10.7% 89.3%Grade 8 14.3% 18.4% 25.6% 74.4%Grade 9 8.7% 13.5% 22.2% 77.8%Grade 10 12.3% 18.7% 31.0% 69.0%Grade 11 17.3% 27.9% 38.1% 61.9%Grade 12 22.1% 32.9% 49.0% 51.0%
________________________________________________________________________________Marijuana All 12.2% 18.3% 27.5% 72.5%
Grade 7 4.9% 7.3% 10.5% 89.5%
Grade 8 14.1% 18.2% 25.5% 74.5%Grade 9 8.0% 12.4% 21.3% 78.7%Grade 10 11.4% 17.4% 28.7% 71.3%Grade 11 16.1% 26.6% 37.0% 63.0%Grade 12 21.1% 32.0% 48.3% 51.7%
________________________________________________________________________________Marijuana Only All 4.8% 8.8% 14.8% 85.2%
Grade 7 1.4% 3.4% 5.8% 94.2%Grade 8 6.7% 10.3% 13.4% 86.6%Grade 9 2.2% 4.8% 11.3% 88.7%Grade 10 5.3% 8.8% 16.4% 83.6%Grade 11 6.0% 11.5% 17.5% 82.5%Grade 12 8.6% 15.9% 27.8% 72.2%
________________________________________________________________________________Cocaine or Crack All 2.5% 4.3% 7.1% 92.9%
Grade 7 0.7% 1.7% 2.7% 97.3%Grade 8 1.8% 2.3% 5.5% 94.5%
Grade 9 1.8% 3.6% 5.8% 94.2%Grade 10 1.8% 2.4% 6.5% 93.5%Grade 11 3.1% 7.7% 12.9% 87.1%Grade 12 6.9% 9.0% 11.0% 89.0%
________________________________________________________________________________Cocaine All 2.4% 4.2% 7.0% 93.0%
Grade 7 0.7% 1.7% 2.8% 97.2%Grade 8 1.9% 2.3% 5.6% 94.4%Grade 9 1.3% 3.1% 5.4% 94.6%Grade 10 1.8% 2.4% 5.9% 94.1%Grade 11 2.6% 7.8% 13.0% 87.0%Grade 12 6.9% 9.0% 11.0% 89.0%
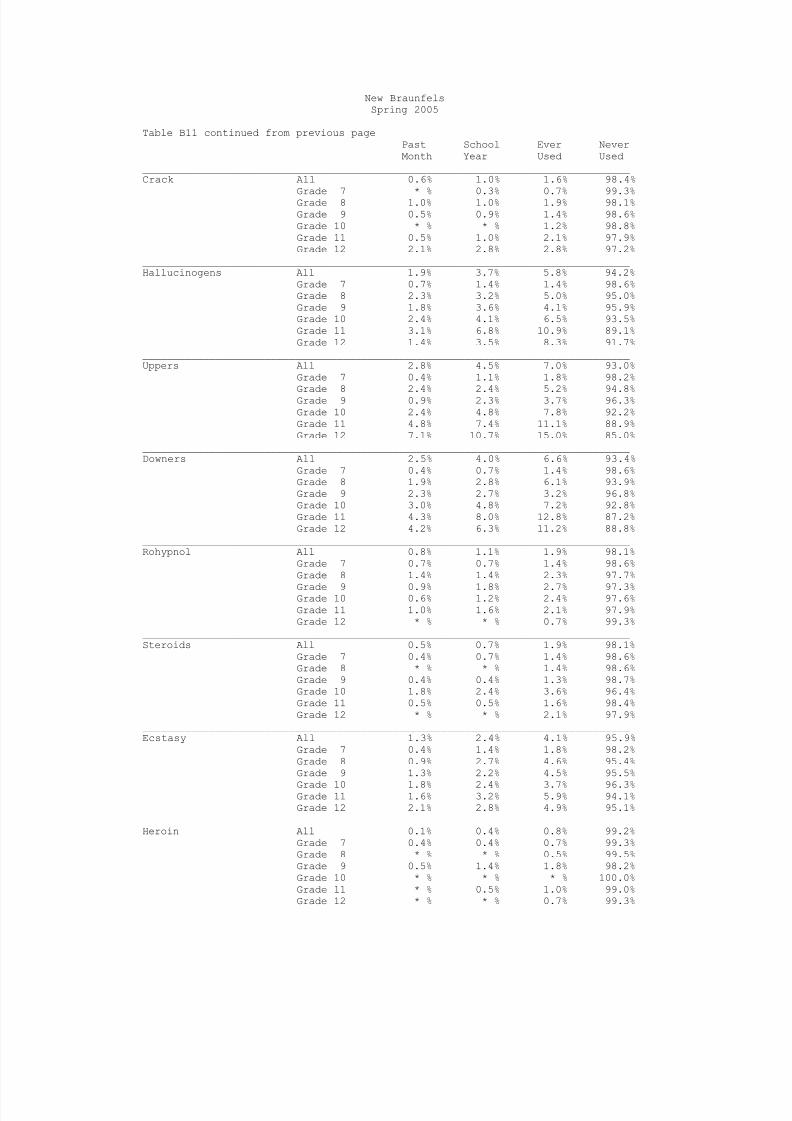
8/14/2019 COMAL COUNTY - New Braunfels ISD - 2005 Texas School Survey of Drug and Alcohol Use
http://slidepdf.com/reader/full/comal-county-new-braunfels-isd-2005-texas-school-survey-of-drug-and-alcohol 63/114

8/14/2019 COMAL COUNTY - New Braunfels ISD - 2005 Texas School Survey of Drug and Alcohol Use
http://slidepdf.com/reader/full/comal-county-new-braunfels-isd-2005-texas-school-survey-of-drug-and-alcohol 64/114
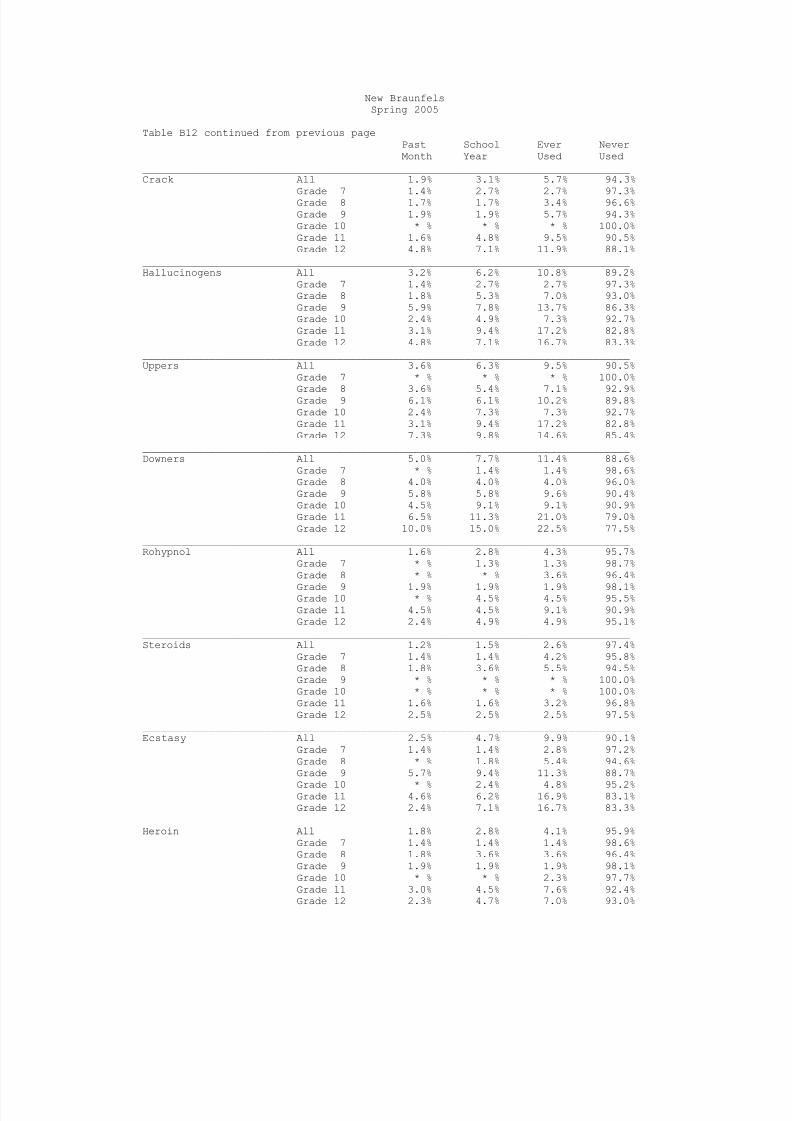
8/14/2019 COMAL COUNTY - New Braunfels ISD - 2005 Texas School Survey of Drug and Alcohol Use
http://slidepdf.com/reader/full/comal-county-new-braunfels-isd-2005-texas-school-survey-of-drug-and-alcohol 65/114
New BraunfelsSpring 2005
Table B12 continued from previous pagePast School Ever NeverMonth Year Used Used
________________________________________________________________________________Crack All 1.9% 3.1% 5.7% 94.3%
Grade 7 1.4% 2.7% 2.7% 97.3%Grade 8 1.7% 1.7% 3.4% 96.6%Grade 9 1.9% 1.9% 5.7% 94.3%Grade 10 * % * % * % 100.0%Grade 11 1.6% 4.8% 9.5% 90.5%Grade 12 4.8% 7.1% 11.9% 88.1%
________________________________________________________________________________Hallucinogens All 3.2% 6.2% 10.8% 89.2%
Grade 7 1.4% 2.7% 2.7% 97.3%Grade 8 1.8% 5.3% 7.0% 93.0%Grade 9 5.9% 7.8% 13.7% 86.3%Grade 10 2.4% 4.9% 7.3% 92.7%Grade 11 3.1% 9.4% 17.2% 82.8%Grade 12 4.8% 7.1% 16.7% 83.3%
________________________________________________________________________________Uppers All 3.6% 6.3% 9.5% 90.5%
Grade 7 * % * % * % 100.0%
Grade 8 3.6% 5.4% 7.1% 92.9%Grade 9 6.1% 6.1% 10.2% 89.8%Grade 10 2.4% 7.3% 7.3% 92.7%Grade 11 3.1% 9.4% 17.2% 82.8%Grade 12 7.3% 9.8% 14.6% 85.4%
________________________________________________________________________________Downers All 5.0% 7.7% 11.4% 88.6%
Grade 7 * % 1.4% 1.4% 98.6%Grade 8 4.0% 4.0% 4.0% 96.0%Grade 9 5.8% 5.8% 9.6% 90.4%Grade 10 4.5% 9.1% 9.1% 90.9%Grade 11 6.5% 11.3% 21.0% 79.0%Grade 12 10.0% 15.0% 22.5% 77.5%
________________________________________________________________________________Rohypnol All 1.6% 2.8% 4.3% 95.7%
Grade 7 * % 1.3% 1.3% 98.7%Grade 8 * % * % 3.6% 96.4%
Grade 9 1.9% 1.9% 1.9% 98.1%Grade 10 * % 4.5% 4.5% 95.5%Grade 11 4.5% 4.5% 9.1% 90.9%Grade 12 2.4% 4.9% 4.9% 95.1%
________________________________________________________________________________Steroids All 1.2% 1.5% 2.6% 97.4%
Grade 7 1.4% 1.4% 4.2% 95.8%Grade 8 1.8% 3.6% 5.5% 94.5%Grade 9 * % * % * % 100.0%Grade 10 * % * % * % 100.0%Grade 11 1.6% 1.6% 3.2% 96.8%Grade 12 2.5% 2.5% 2.5% 97.5%
________________________________________________________________________________Ecstasy All 2.5% 4.7% 9.9% 90.1%
Grade 7 1.4% 1.4% 2.8% 97.2%Grade 8 * % 1.8% 5.4% 94.6%Grade 9 5.7% 9.4% 11.3% 88.7%
Grade 10 * % 2.4% 4.8% 95.2%Grade 11 4.6% 6.2% 16.9% 83.1%Grade 12 2.4% 7.1% 16.7% 83.3%
________________________________________________________________________________Heroin All 1.8% 2.8% 4.1% 95.9%
Grade 7 1.4% 1.4% 1.4% 98.6%Grade 8 1.8% 3.6% 3.6% 96.4%Grade 9 1.9% 1.9% 1.9% 98.1%Grade 10 * % * % 2.3% 97.7%Grade 11 3.0% 4.5% 7.6% 92.4%Grade 12 2.3% 4.7% 7.0% 93.0%

8/14/2019 COMAL COUNTY - New Braunfels ISD - 2005 Texas School Survey of Drug and Alcohol Use
http://slidepdf.com/reader/full/comal-county-new-braunfels-isd-2005-texas-school-survey-of-drug-and-alcohol 66/114
New BraunfelsSpring 2005
Table B13: Prevalence and recency of use of selected substances by grade--> Students living in town three years or less
Past School Ever NeverMonth Year Used Used
________________________________________________________________________________
Tobacco All 17.8% 23.3% 39.0% 61.0%Grade 7 4.9% 6.6% 17.2% 82.8%Grade 8 14.9% 19.1% 35.1% 64.9%Grade 9 17.5% 22.7% 36.1% 63.9%Grade 10 17.2% 26.6% 43.8% 56.2%Grade 11 27.4% 34.2% 58.9% 41.1%Grade 12 43.3% 53.3% 66.7% 33.3%
________________________________________________________________________________Alcohol All 32.2% 43.7% 65.9% 34.1%
Grade 7 19.5% 23.6% 49.6% 50.4%Grade 8 29.5% 43.2% 69.5% 30.5%Grade 9 29.2% 37.5% 58.3% 41.7%Grade 10 29.2% 49.2% 73.8% 26.2%Grade 11 47.2% 65.3% 77.8% 22.2%Grade 12 56.3% 62.5% 81.3% 18.8%
________________________________________________________________________________Inhalants All 5.8% 9.5% 17.6% 82.4%
Grade 7 5.8% 9.2% 15.0% 85.0%Grade 8 6.4% 11.7% 23.4% 76.6%Grade 9 5.2% 12.4% 16.5% 83.5%Grade 10 4.8% 6.5% 12.9% 87.1%Grade 11 8.1% 8.1% 18.9% 81.1%Grade 12 3.1% 6.3% 18.8% 81.3%
________________________________________________________________________________Any Illicit Drug All 15.8% 20.9% 31.0% 69.0%
Grade 7 4.1% 6.5% 11.4% 88.6%Grade 8 13.8% 16.0% 23.4% 76.6%Grade 9 13.7% 21.1% 29.5% 70.5%Grade 10 15.4% 21.5% 33.8% 66.2%Grade 11 26.4% 36.1% 48.6% 51.4%Grade 12 36.4% 39.4% 63.6% 36.4%
________________________________________________________________________________Marijuana All 14.3% 20.3% 29.6% 70.4%
Grade 7 3.3% 5.0% 9.9% 90.1%
Grade 8 13.5% 16.9% 22.5% 77.5%Grade 9 13.0% 20.7% 27.2% 72.8%Grade 10 14.1% 20.3% 32.8% 67.2%Grade 11 22.9% 34.3% 47.1% 52.9%Grade 12 32.3% 41.9% 64.5% 35.5%
________________________________________________________________________________Marijuana Only All 5.7% 8.4% 14.2% 85.8%
Grade 7 0.8% 2.4% 4.9% 95.1%Grade 8 6.3% 8.4% 11.6% 88.4%Grade 9 4.0% 8.1% 14.1% 85.9%Grade 10 9.1% 12.1% 21.2% 78.8%Grade 11 10.5% 14.5% 19.7% 80.3%Grade 12 5.9% 5.9% 20.6% 79.4%
________________________________________________________________________________Cocaine or Crack All 3.8% 6.8% 8.8% 91.2%
Grade 7 2.4% 3.3% 4.1% 95.9%Grade 8 3.3% 4.4% 4.4% 95.6%
Grade 9 1.1% 3.3% 6.6% 93.4%Grade 10 * % 4.6% 7.7% 92.3%Grade 11 7.0% 12.7% 16.9% 83.1%Grade 12 16.7% 23.3% 23.3% 76.7%
________________________________________________________________________________Cocaine All 3.9% 6.8% 8.6% 91.4%
Grade 7 2.5% 3.3% 4.1% 95.9%Grade 8 3.4% 4.5% 4.5% 95.5%Grade 9 1.1% 3.3% 5.5% 94.5%Grade 10 * % 4.6% 7.7% 92.3%Grade 11 7.0% 12.7% 16.9% 83.1%Grade 12 17.2% 24.1% 24.1% 75.9%

8/14/2019 COMAL COUNTY - New Braunfels ISD - 2005 Texas School Survey of Drug and Alcohol Use
http://slidepdf.com/reader/full/comal-county-new-braunfels-isd-2005-texas-school-survey-of-drug-and-alcohol 67/114
New BraunfelsSpring 2005
Table B13 continued from previous pagePast School Ever NeverMonth Year Used Used
________________________________________________________________________________Crack All 1.4% 2.1% 2.8% 97.2%
Grade 7 0.8% 0.8% 0.8% 99.2%Grade 8 1.1% 1.1% 2.3% 97.7%Grade 9 1.1% 1.1% 2.2% 97.8%Grade 10 * % * % * % 100.0%Grade 11 1.4% 4.2% 5.6% 94.4%Grade 12 6.9% 10.3% 10.3% 89.7%
________________________________________________________________________________Hallucinogens All 1.1% 3.9% 5.3% 94.7%
Grade 7 0.8% 0.8% 0.8% 99.2%Grade 8 2.2% 3.3% 3.3% 96.7%Grade 9 1.1% 2.2% 2.2% 97.8%Grade 10 * % 4.6% 4.6% 95.4%Grade 11 * % 7.0% 12.7% 87.3%Grade 12 3.6% 10.7% 17.9% 82.1%
________________________________________________________________________________Uppers All 3.3% 5.0% 8.4% 91.6%
Grade 7 * % * % 0.8% 99.2%
Grade 8 1.1% 2.3% 5.7% 94.3%Grade 9 4.4% 5.6% 6.7% 93.3%Grade 10 1.6% 3.1% 4.7% 95.3%Grade 11 5.6% 9.9% 12.7% 87.3%Grade 12 14.8% 18.5% 40.7% 59.3%
________________________________________________________________________________Downers All 3.2% 5.1% 9.3% 90.7%
Grade 7 * % * % 0.9% 99.1%Grade 8 * % * % 2.4% 97.6%Grade 9 5.6% 7.8% 8.9% 91.1%Grade 10 3.1% 4.7% 6.2% 93.8%Grade 11 2.9% 8.7% 15.9% 84.1%Grade 12 14.3% 17.9% 42.9% 57.1%
________________________________________________________________________________Rohypnol All 1.1% 1.5% 2.4% 97.6%
Grade 7 * % * % 0.8% 99.2%Grade 8 3.4% 3.4% 4.5% 95.5%
Grade 9 1.1% 3.3% 3.3% 96.7%Grade 10 * % * % * % 100.0%Grade 11 1.4% 1.4% 2.8% 97.2%Grade 12 * % * % 3.6% 96.4%
________________________________________________________________________________Steroids All 0.4% 0.6% 2.0% 98.0%
Grade 7 0.9% 0.9% 0.9% 99.1%Grade 8 * % 1.1% 3.4% 96.6%Grade 9 1.1% 1.1% 2.2% 97.8%Grade 10 * % * % 3.1% 96.9%Grade 11 * % * % 1.5% 98.5%Grade 12 * % * % * % 100.0%
________________________________________________________________________________Ecstasy All 1.8% 3.0% 5.7% 94.3%
Grade 7 0.8% 0.8% 2.5% 97.5%Grade 8 2.2% 3.3% 5.6% 94.4%Grade 9 1.1% 2.2% 2.2% 97.8%
Grade 10 * % * % 1.6% 98.4%Grade 11 2.9% 5.8% 13.0% 87.0%Grade 12 7.1% 10.7% 17.9% 82.1%
________________________________________________________________________________Heroin All 0.8% 1.5% 2.5% 97.5%
Grade 7 1.7% 1.7% 2.5% 97.5%Grade 8 * % 1.1% 3.4% 96.6%Grade 9 1.1% 2.2% 2.2% 97.8%Grade 10 * % * % * % 100.0%Grade 11 1.4% 2.9% 5.7% 94.3%Grade 12 * % * % * % 100.0%
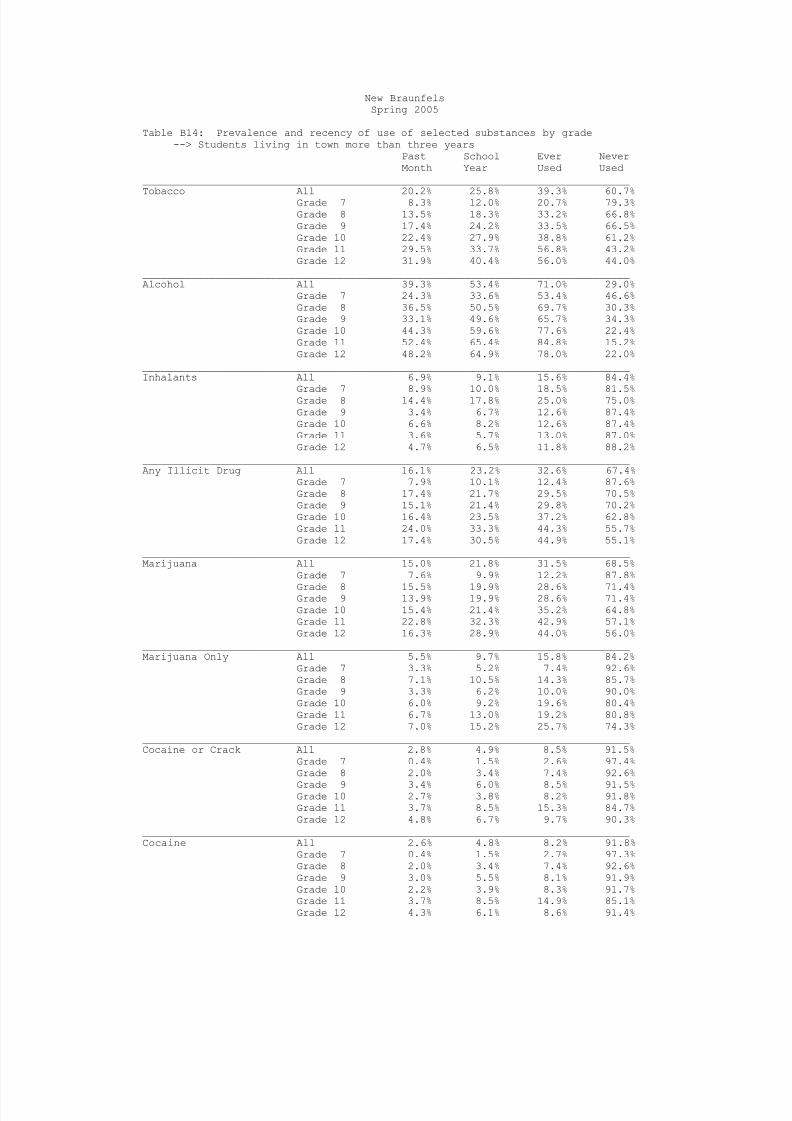
8/14/2019 COMAL COUNTY - New Braunfels ISD - 2005 Texas School Survey of Drug and Alcohol Use
http://slidepdf.com/reader/full/comal-county-new-braunfels-isd-2005-texas-school-survey-of-drug-and-alcohol 68/114

8/14/2019 COMAL COUNTY - New Braunfels ISD - 2005 Texas School Survey of Drug and Alcohol Use
http://slidepdf.com/reader/full/comal-county-new-braunfels-isd-2005-texas-school-survey-of-drug-and-alcohol 69/114
New BraunfelsSpring 2005
Table B14 continued from previous pagePast School Ever NeverMonth Year Used Used
________________________________________________________________________________Crack All 0.6% 1.1% 2.4% 97.6%
Grade 7 * % 0.8% 1.1% 98.9%Grade 8 1.0% 1.0% 2.0% 98.0%Grade 9 0.4% 1.3% 3.1% 96.9%Grade 10 0.6% 0.6% 1.1% 98.9%Grade 11 * % 0.5% 3.2% 96.8%Grade 12 1.9% 2.5% 3.7% 96.3%
________________________________________________________________________________Hallucinogens All 2.6% 4.4% 7.6% 92.4%
Grade 7 0.8% 1.9% 1.9% 98.1%Grade 8 2.4% 3.9% 6.3% 93.7%Grade 9 3.6% 5.8% 9.4% 90.6%Grade 10 2.8% 3.9% 7.9% 92.1%Grade 11 4.3% 8.0% 12.2% 87.8%Grade 12 1.9% 3.1% 8.6% 91.4%
________________________________________________________________________________Uppers All 3.0% 5.1% 7.7% 92.3%
Grade 7 0.4% 1.2% 1.9% 98.1%
Grade 8 3.5% 3.5% 5.9% 94.1%Grade 9 2.7% 5.0% 7.7% 92.3%Grade 10 2.3% 5.1% 8.5% 91.5%Grade 11 3.8% 7.0% 12.4% 87.6%Grade 12 5.7% 9.4% 10.7% 89.3%
________________________________________________________________________________Downers All 3.3% 5.4% 8.1% 91.9%
Grade 7 0.8% 1.6% 1.9% 98.1%Grade 8 3.5% 4.5% 7.0% 93.0%Grade 9 4.0% 5.3% 8.0% 92.0%Grade 10 2.8% 6.1% 8.8% 91.2%Grade 11 4.9% 8.7% 14.1% 85.9%Grade 12 3.8% 6.9% 9.4% 90.6%
________________________________________________________________________________Rohypnol All 0.9% 1.5% 2.6% 97.4%
Grade 7 0.8% 1.2% 1.6% 98.4%Grade 8 * % * % 2.0% 98.0%
Grade 9 1.3% 1.7% 3.0% 97.0%Grade 10 0.6% 2.8% 3.9% 96.1%Grade 11 2.1% 2.1% 4.3% 95.7%Grade 12 0.6% 1.2% 1.2% 98.8%
________________________________________________________________________________Steroids All 0.8% 0.9% 1.8% 98.2%
Grade 7 0.4% 0.8% 2.4% 97.6%Grade 8 0.5% 0.5% 1.5% 98.5%Grade 9 0.4% 0.4% 0.9% 99.1%Grade 10 1.7% 2.2% 2.2% 97.8%Grade 11 1.1% 1.1% 2.2% 97.8%Grade 12 0.6% 0.6% 1.9% 98.1%
________________________________________________________________________________Ecstasy All 1.5% 3.2% 5.4% 94.6%
Grade 7 0.4% 1.6% 1.6% 98.4%Grade 8 0.5% 2.4% 4.9% 95.1%Grade 9 3.1% 4.8% 8.4% 91.6%
Grade 10 1.7% 4.0% 5.1% 94.9%Grade 11 2.2% 3.8% 7.0% 93.0%Grade 12 1.3% 2.5% 5.6% 94.4%
________________________________________________________________________________Heroin All 0.3% 0.7% 1.2% 98.8%
Grade 7 * % * % * % 100.0%Grade 8 0.5% 0.5% 0.5% 99.5%Grade 9 0.4% 0.9% 1.3% 98.7%Grade 10 * % 0.6% 1.1% 98.9%Grade 11 0.5% 1.1% 2.1% 97.9%Grade 12 0.6% 1.2% 2.4% 97.6%
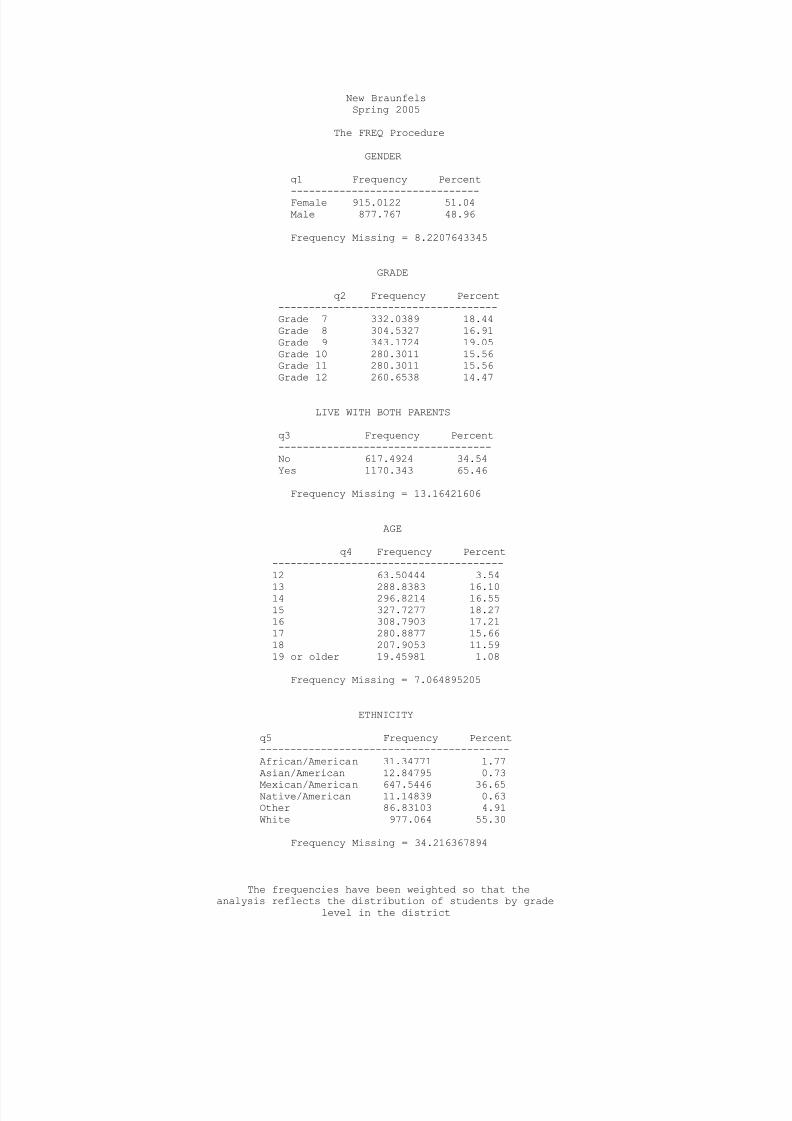
8/14/2019 COMAL COUNTY - New Braunfels ISD - 2005 Texas School Survey of Drug and Alcohol Use
http://slidepdf.com/reader/full/comal-county-new-braunfels-isd-2005-texas-school-survey-of-drug-and-alcohol 70/114
New BraunfelsSpring 2005
The FREQ Procedure
GENDER
q1 Frequency Percent
-------------------------------Female 915.0122 51.04Male 877.767 48.96
Frequency Missing = 8.2207643345
GRADE
q2 Frequency Percent------------------------------------Grade 7 332.0389 18.44Grade 8 304.5327 16.91Grade 9 343.1724 19.05Grade 10 280.3011 15.56Grade 11 280.3011 15.56Grade 12 260.6538 14.47
LIVE WITH BOTH PARENTS
q3 Frequency Percent-----------------------------------No 617.4924 34.54Yes 1170.343 65.46
Frequency Missing = 13.16421606
AGE
q4 Frequency Percent--------------------------------------12 63.50444 3.54
13 288.8383 16.1014 296.8214 16.5515 327.7277 18.2716 308.7903 17.2117 280.8877 15.6618 207.9053 11.5919 or older 19.45981 1.08
Frequency Missing = 7.064895205
ETHNICITY
q5 Frequency Percent-----------------------------------------African/American 31.34771 1.77Asian/American 12.84795 0.73
Mexican/American 647.5446 36.65Native/American 11.14839 0.63Other 86.83103 4.91White 977.064 55.30
Frequency Missing = 34.216367894
The frequencies have been weighted so that theanalysis reflects the distribution of students by grade
level in the district
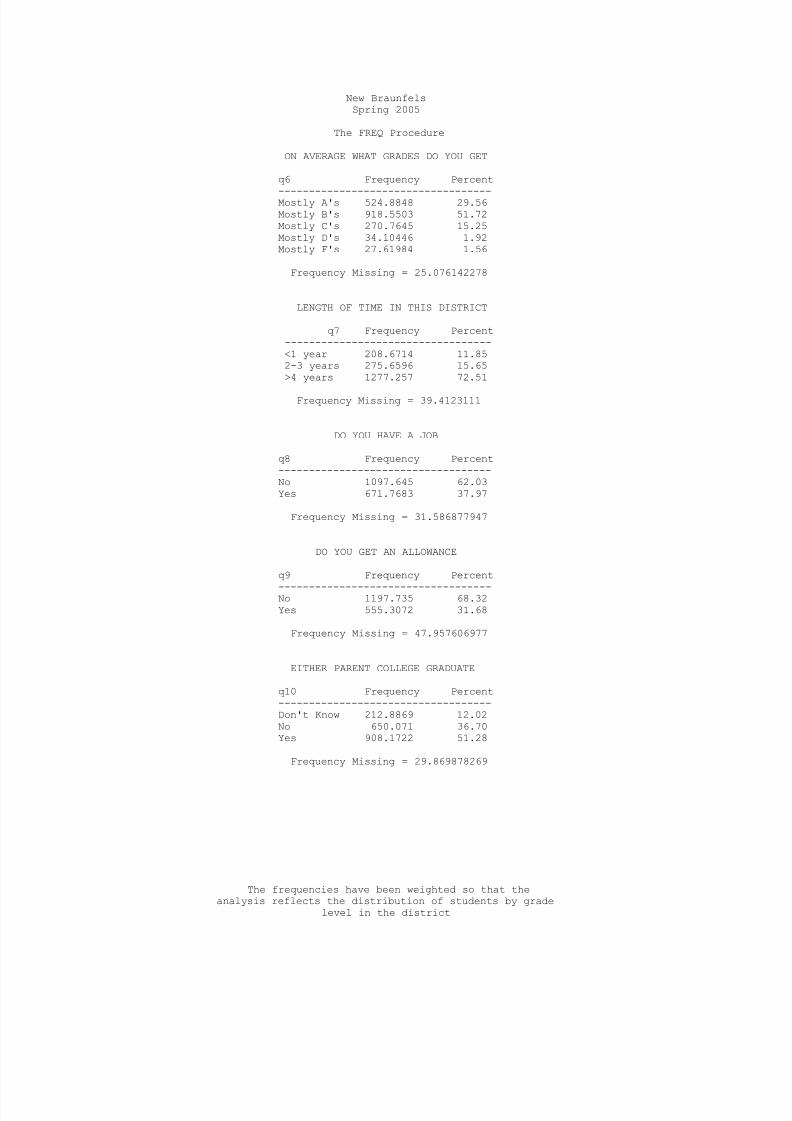
8/14/2019 COMAL COUNTY - New Braunfels ISD - 2005 Texas School Survey of Drug and Alcohol Use
http://slidepdf.com/reader/full/comal-county-new-braunfels-isd-2005-texas-school-survey-of-drug-and-alcohol 71/114
New BraunfelsSpring 2005
The FREQ Procedure
ON AVERAGE WHAT GRADES DO YOU GET
q6 Frequency Percent
-----------------------------------Mostly A's 524.8848 29.56Mostly B's 918.5503 51.72Mostly C's 270.7645 15.25Mostly D's 34.10446 1.92Mostly F's 27.61984 1.56
Frequency Missing = 25.076142278
LENGTH OF TIME IN THIS DISTRICT
q7 Frequency Percent----------------------------------<1 year 208.6714 11.852-3 years 275.6596 15.65>4 years 1277.257 72.51
Frequency Missing = 39.4123111
DO YOU HAVE A JOB
q8 Frequency Percent-----------------------------------No 1097.645 62.03Yes 671.7683 37.97
Frequency Missing = 31.586877947
DO YOU GET AN ALLOWANCE
q9 Frequency Percent
-----------------------------------No 1197.735 68.32Yes 555.3072 31.68
Frequency Missing = 47.957606977
EITHER PARENT COLLEGE GRADUATE
q10 Frequency Percent-----------------------------------Don't Know 212.8869 12.02No 650.071 36.70Yes 908.1722 51.28
Frequency Missing = 29.869878269
The frequencies have been weighted so that theanalysis reflects the distribution of students by grade
level in the district
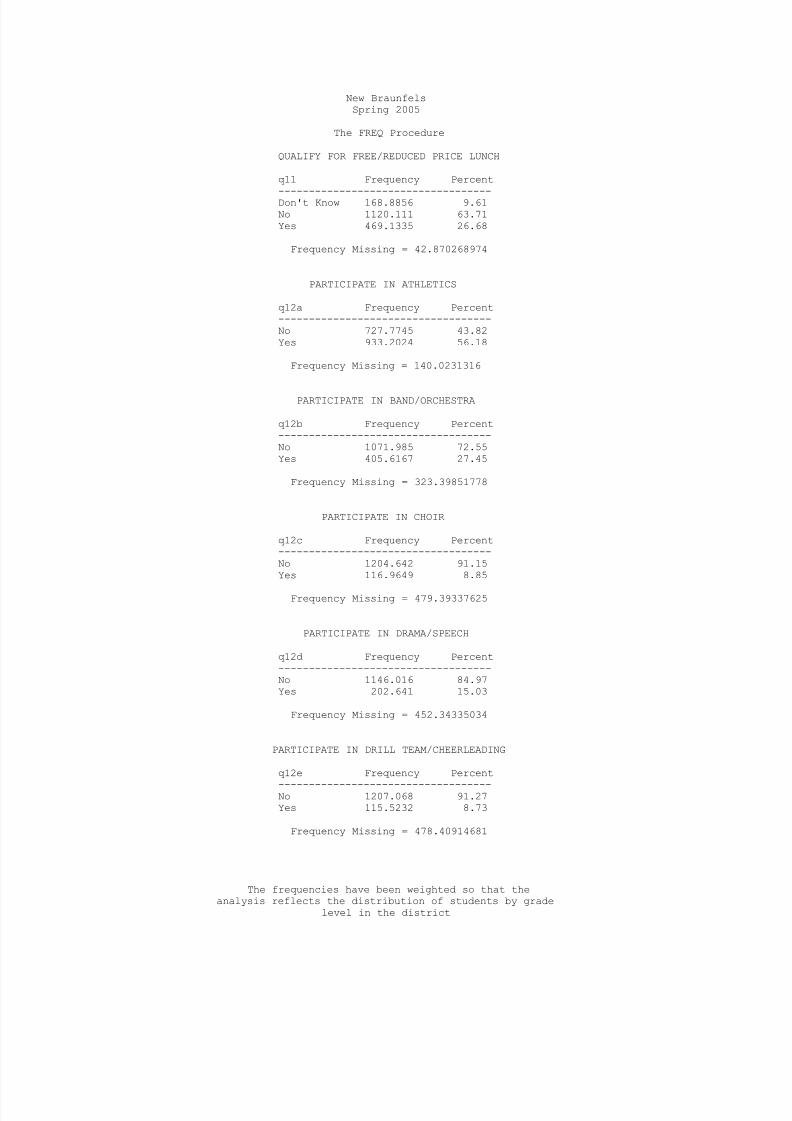
8/14/2019 COMAL COUNTY - New Braunfels ISD - 2005 Texas School Survey of Drug and Alcohol Use
http://slidepdf.com/reader/full/comal-county-new-braunfels-isd-2005-texas-school-survey-of-drug-and-alcohol 72/114
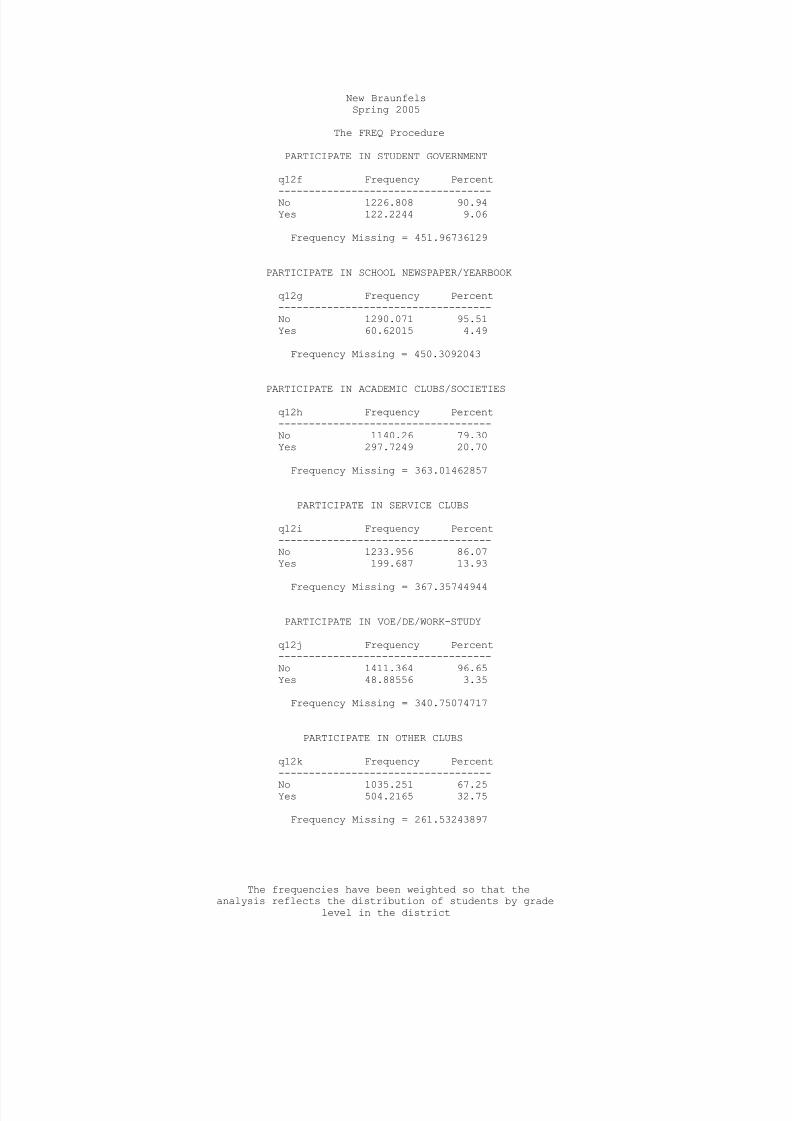
8/14/2019 COMAL COUNTY - New Braunfels ISD - 2005 Texas School Survey of Drug and Alcohol Use
http://slidepdf.com/reader/full/comal-county-new-braunfels-isd-2005-texas-school-survey-of-drug-and-alcohol 73/114
New BraunfelsSpring 2005
The FREQ Procedure
PARTICIPATE IN STUDENT GOVERNMENT
q12f Frequency Percent
-----------------------------------No 1226.808 90.94Yes 122.2244 9.06
Frequency Missing = 451.96736129
PARTICIPATE IN SCHOOL NEWSPAPER/YEARBOOK
q12g Frequency Percent-----------------------------------No 1290.071 95.51Yes 60.62015 4.49
Frequency Missing = 450.3092043
PARTICIPATE IN ACADEMIC CLUBS/SOCIETIES q12h Frequency Percent-----------------------------------No 1140.26 79.30Yes 297.7249 20.70
Frequency Missing = 363.01462857
PARTICIPATE IN SERVICE CLUBS
q12i Frequency Percent-----------------------------------No 1233.956 86.07Yes 199.687 13.93
Frequency Missing = 367.35744944
PARTICIPATE IN VOE/DE/WORK-STUDY
q12j Frequency Percent-----------------------------------No 1411.364 96.65Yes 48.88556 3.35
Frequency Missing = 340.75074717
PARTICIPATE IN OTHER CLUBS
q12k Frequency Percent-----------------------------------
No 1035.251 67.25Yes 504.2165 32.75
Frequency Missing = 261.53243897
The frequencies have been weighted so that theanalysis reflects the distribution of students by grade
level in the district
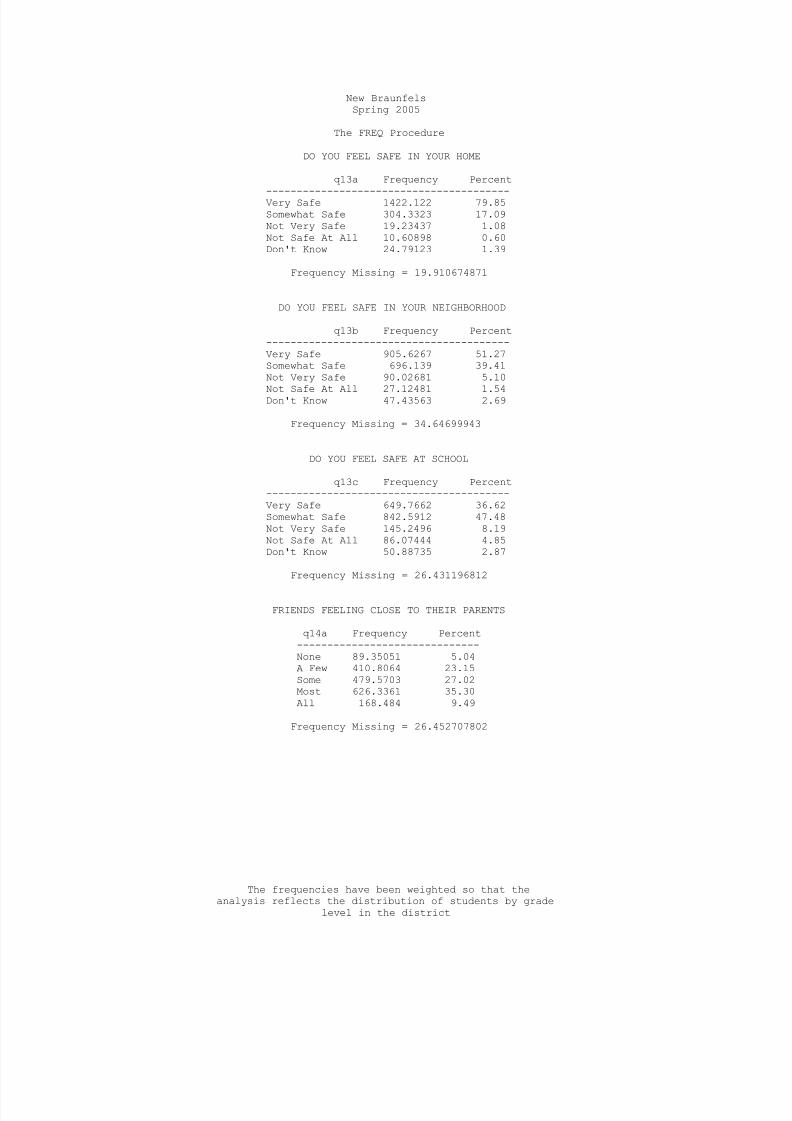
8/14/2019 COMAL COUNTY - New Braunfels ISD - 2005 Texas School Survey of Drug and Alcohol Use
http://slidepdf.com/reader/full/comal-county-new-braunfels-isd-2005-texas-school-survey-of-drug-and-alcohol 74/114
New BraunfelsSpring 2005
The FREQ Procedure
DO YOU FEEL SAFE IN YOUR HOME
q13a Frequency Percent
----------------------------------------Very Safe 1422.122 79.85Somewhat Safe 304.3323 17.09Not Very Safe 19.23437 1.08Not Safe At All 10.60898 0.60Don't Know 24.79123 1.39
Frequency Missing = 19.910674871
DO YOU FEEL SAFE IN YOUR NEIGHBORHOOD
q13b Frequency Percent----------------------------------------Very Safe 905.6267 51.27Somewhat Safe 696.139 39.41Not Very Safe 90.02681 5.10
Not Safe At All 27.12481 1.54Don't Know 47.43563 2.69
Frequency Missing = 34.64699943
DO YOU FEEL SAFE AT SCHOOL
q13c Frequency Percent----------------------------------------Very Safe 649.7662 36.62Somewhat Safe 842.5912 47.48Not Very Safe 145.2496 8.19Not Safe At All 86.07444 4.85Don't Know 50.88735 2.87
Frequency Missing = 26.431196812
FRIENDS FEELING CLOSE TO THEIR PARENTS
q14a Frequency Percent------------------------------None 89.35051 5.04A Few 410.8064 23.15Some 479.5703 27.02Most 626.3361 35.30All 168.484 9.49
Frequency Missing = 26.452707802
The frequencies have been weighted so that theanalysis reflects the distribution of students by grade
level in the district
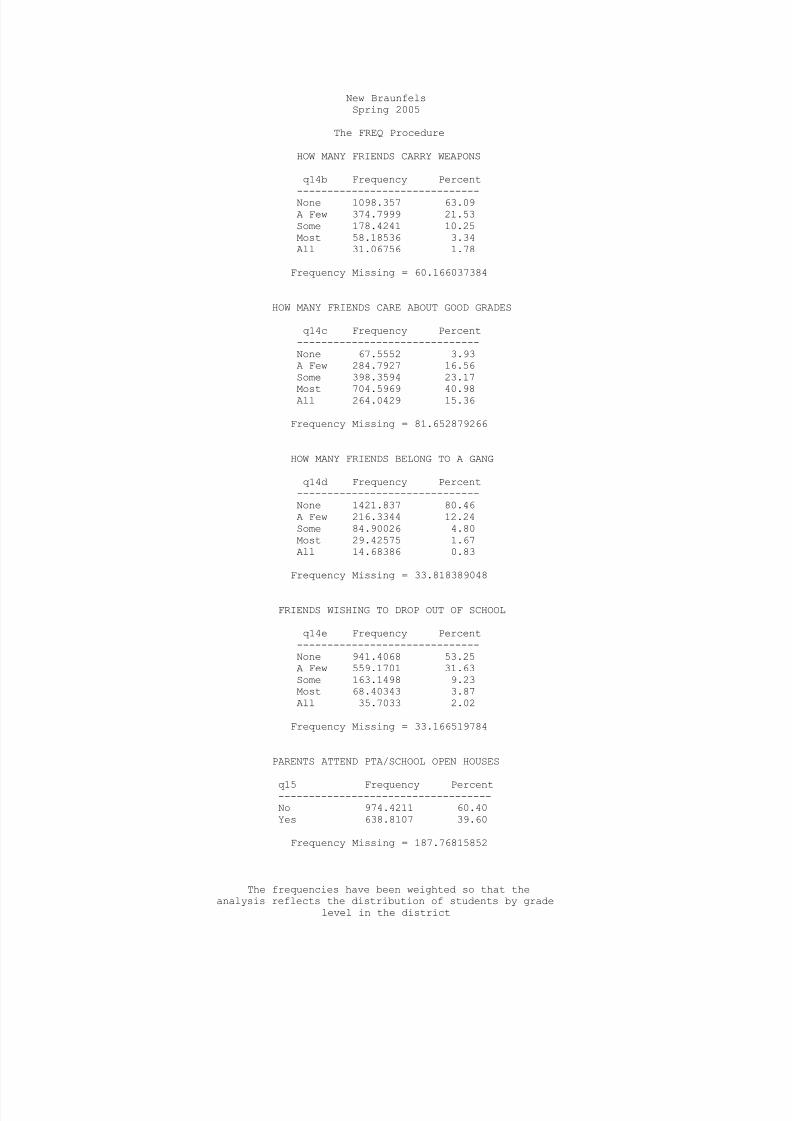
8/14/2019 COMAL COUNTY - New Braunfels ISD - 2005 Texas School Survey of Drug and Alcohol Use
http://slidepdf.com/reader/full/comal-county-new-braunfels-isd-2005-texas-school-survey-of-drug-and-alcohol 75/114
New BraunfelsSpring 2005
The FREQ Procedure
HOW MANY FRIENDS CARRY WEAPONS
q14b Frequency Percent
------------------------------None 1098.357 63.09A Few 374.7999 21.53Some 178.4241 10.25Most 58.18536 3.34All 31.06756 1.78
Frequency Missing = 60.166037384
HOW MANY FRIENDS CARE ABOUT GOOD GRADES
q14c Frequency Percent------------------------------None 67.5552 3.93A Few 284.7927 16.56Some 398.3594 23.17
Most 704.5969 40.98All 264.0429 15.36
Frequency Missing = 81.652879266
HOW MANY FRIENDS BELONG TO A GANG
q14d Frequency Percent------------------------------None 1421.837 80.46A Few 216.3344 12.24Some 84.90026 4.80Most 29.42575 1.67All 14.68386 0.83
Frequency Missing = 33.818389048
FRIENDS WISHING TO DROP OUT OF SCHOOL
q14e Frequency Percent------------------------------None 941.4068 53.25A Few 559.1701 31.63Some 163.1498 9.23Most 68.40343 3.87All 35.7033 2.02
Frequency Missing = 33.166519784
PARENTS ATTEND PTA/SCHOOL OPEN HOUSES
q15 Frequency Percent-----------------------------------No 974.4211 60.40Yes 638.8107 39.60
Frequency Missing = 187.76815852
The frequencies have been weighted so that theanalysis reflects the distribution of students by grade
level in the district

8/14/2019 COMAL COUNTY - New Braunfels ISD - 2005 Texas School Survey of Drug and Alcohol Use
http://slidepdf.com/reader/full/comal-county-new-braunfels-isd-2005-texas-school-survey-of-drug-and-alcohol 76/114

8/14/2019 COMAL COUNTY - New Braunfels ISD - 2005 Texas School Survey of Drug and Alcohol Use
http://slidepdf.com/reader/full/comal-county-new-braunfels-isd-2005-texas-school-survey-of-drug-and-alcohol 77/114
New BraunfelsSpring 2005
The FREQ Procedure
EVER INHALED GLUE FOR KICKS
q16f Frequency Percent
-------------------------------------------Never Heard/Used 1574.344 96.26In Your Lifetime 32.94147 2.01Since School Began 9.353343 0.57In the Past Month 18.88118 1.15
Frequency Missing = 165.48032903
EVER INHALED PAINT THINNERS FOR KICKS
q16g Frequency Percent-------------------------------------------Never Heard/Used 1563.036 95.70In Your Lifetime 32.08626 1.96Since School Began 15.33411 0.94In the Past Month 22.83173 1.40
Frequency Missing = 167.71197124
EVER INHALED NITROUS OXIDE FOR KICKS
q16h Frequency Percent-------------------------------------------Never Heard/Used 1567.76 95.21In Your Lifetime 34.71561 2.11Since School Began 15.21534 0.92In the Past Month 29.01412 1.76
Frequency Missing = 154.2952861
EVER INHALED OCTANE BOOSTER FOR KICKS
q16i Frequency Percent-------------------------------------------Never Heard/Used 1621.389 98.39In Your Lifetime 10.81156 0.66Since School Began 5.78408 0.35In the Past Month 9.95968 0.60
Frequency Missing = 153.05552366
EVER INHALED OTHER SPRAYS FOR KICKS
q16j Frequency Percent-------------------------------------------Never Heard/Used 1577.22 94.87In Your Lifetime 36.05934 2.17
Since School Began 16.16183 0.97In the Past Month 33.12987 1.99
Frequency Missing = 138.42901152
The frequencies have been weighted so that theanalysis reflects the distribution of students by grade
level in the district
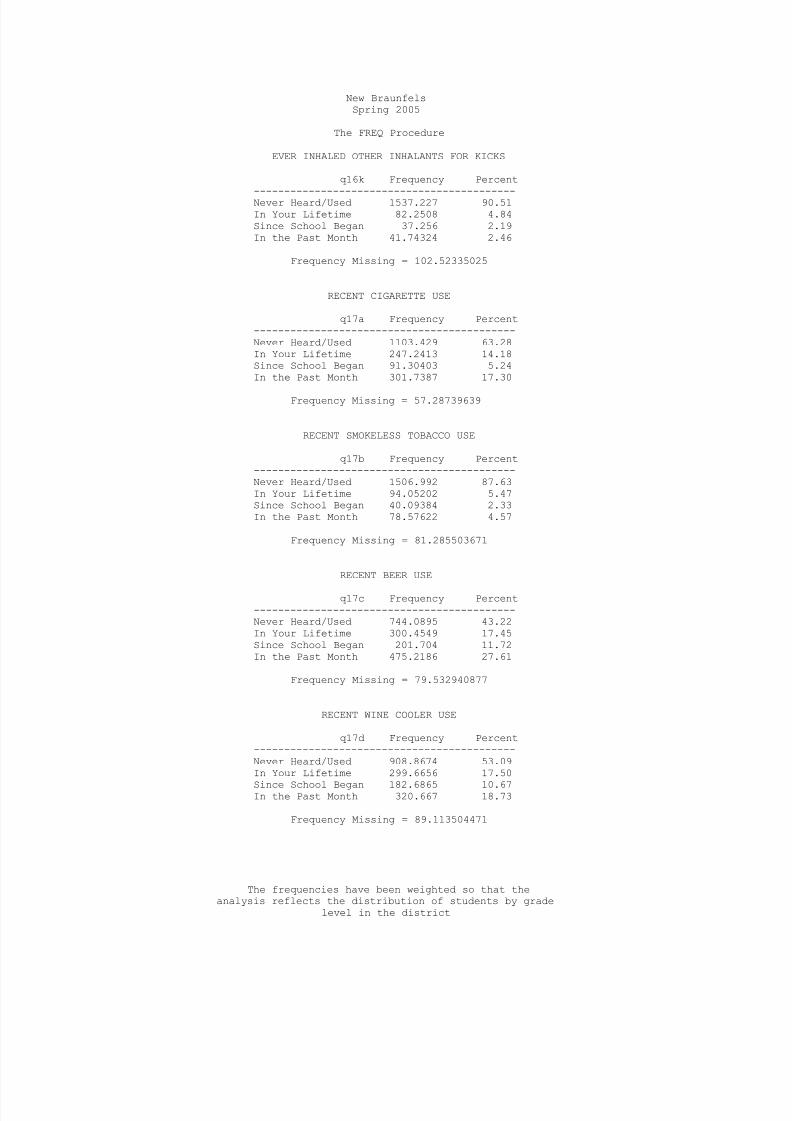
8/14/2019 COMAL COUNTY - New Braunfels ISD - 2005 Texas School Survey of Drug and Alcohol Use
http://slidepdf.com/reader/full/comal-county-new-braunfels-isd-2005-texas-school-survey-of-drug-and-alcohol 78/114
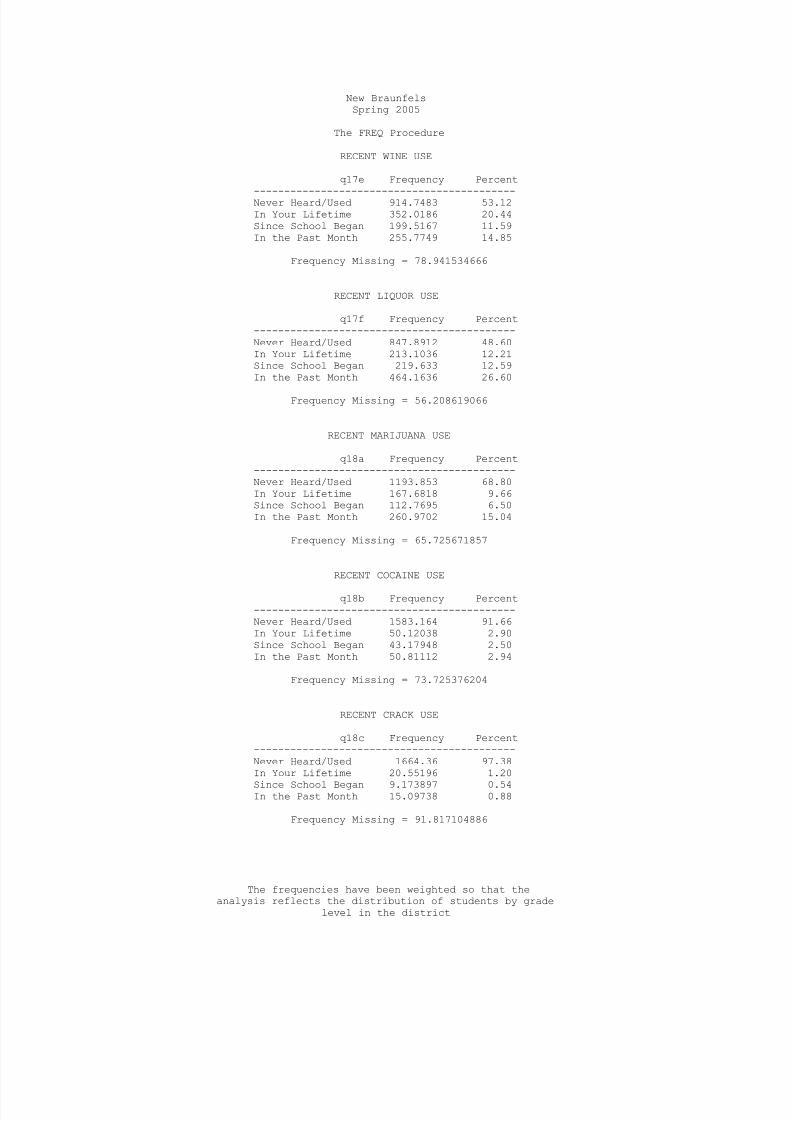
8/14/2019 COMAL COUNTY - New Braunfels ISD - 2005 Texas School Survey of Drug and Alcohol Use
http://slidepdf.com/reader/full/comal-county-new-braunfels-isd-2005-texas-school-survey-of-drug-and-alcohol 79/114
New BraunfelsSpring 2005
The FREQ Procedure
RECENT WINE USE
q17e Frequency Percent
-------------------------------------------Never Heard/Used 914.7483 53.12In Your Lifetime 352.0186 20.44Since School Began 199.5167 11.59In the Past Month 255.7749 14.85
Frequency Missing = 78.941534666
RECENT LIQUOR USE
q17f Frequency Percent-------------------------------------------Never Heard/Used 847.8912 48.60In Your Lifetime 213.1036 12.21Since School Began 219.633 12.59In the Past Month 464.1636 26.60
Frequency Missing = 56.208619066
RECENT MARIJUANA USE
q18a Frequency Percent-------------------------------------------Never Heard/Used 1193.853 68.80In Your Lifetime 167.6818 9.66Since School Began 112.7695 6.50In the Past Month 260.9702 15.04
Frequency Missing = 65.725671857
RECENT COCAINE USE
q18b Frequency Percent-------------------------------------------Never Heard/Used 1583.164 91.66In Your Lifetime 50.12038 2.90Since School Began 43.17948 2.50In the Past Month 50.81112 2.94
Frequency Missing = 73.725376204
RECENT CRACK USE
q18c Frequency Percent-------------------------------------------Never Heard/Used 1664.36 97.38In Your Lifetime 20.55196 1.20
Since School Began 9.173897 0.54In the Past Month 15.09738 0.88
Frequency Missing = 91.817104886
The frequencies have been weighted so that theanalysis reflects the distribution of students by grade
level in the district

8/14/2019 COMAL COUNTY - New Braunfels ISD - 2005 Texas School Survey of Drug and Alcohol Use
http://slidepdf.com/reader/full/comal-county-new-braunfels-isd-2005-texas-school-survey-of-drug-and-alcohol 80/114
New BraunfelsSpring 2005
The FREQ Procedure
RECENT HALLUCINOGEN USE
q18e Frequency Percent
-------------------------------------------Never Heard/Used 1592.087 92.99In Your Lifetime 47.30926 2.76Since School Began 36.0083 2.10In the Past Month 36.78729 2.15
Frequency Missing = 88.808298904
RECENT UPPER USE
q18f Frequency Percent-------------------------------------------Never Heard/Used 1550.983 92.08In Your Lifetime 46.99198 2.79Since School Began 32.94628 1.96In the Past Month 53.45657 3.17
Frequency Missing = 116.62217239
RECENT DOWNER USE
q18g Frequency Percent-------------------------------------------Never Heard/Used 1539.863 91.59In Your Lifetime 50.87343 3.03Since School Began 34.79679 2.07In the Past Month 55.7062 3.31
Frequency Missing = 119.7608755
RECENT ROHYPNOL USE
q18h Frequency Percent-------------------------------------------Never Heard/Used 1667.057 97.35In Your Lifetime 19.09775 1.12Since School Began 10.4104 0.61In the Past Month 15.95829 0.93
Frequency Missing = 88.476221461
RECENT STEROID USE
q18i Frequency Percent-------------------------------------------Never Heard/Used 1661.611 98.10In Your Lifetime 18.17093 1.07
Since School Began 2.895741 0.17In the Past Month 11.15335 0.66
Frequency Missing = 107.16898644
The frequencies have been weighted so that theanalysis reflects the distribution of students by grade
level in the district

8/14/2019 COMAL COUNTY - New Braunfels ISD - 2005 Texas School Survey of Drug and Alcohol Use
http://slidepdf.com/reader/full/comal-county-new-braunfels-isd-2005-texas-school-survey-of-drug-and-alcohol 81/114
New BraunfelsSpring 2005
The FREQ Procedure
RECENT ECSTASY USE
q18j Frequency Percent
-------------------------------------------Never Heard/Used 1604.275 94.46In Your Lifetime 41.66804 2.45Since School Began 25.49224 1.50In the Past Month 26.85184 1.58
Frequency Missing = 102.71303436
RECENT HEROIN USE
q18k Frequency Percent-------------------------------------------Never Heard/Used 1684.337 98.44In Your Lifetime 11.40874 0.67Since School Began 7.320281 0.43In the Past Month 7.894037 0.46
Frequency Missing = 90.039844716
TOBACCO USE IN PAST MONTH
q19a Frequency Percent-----------------------------------------Never Heard/Used 1375.93 79.781-2 times 149.4403 8.673-10 times 74.86144 4.3411+ times 124.3421 7.21
Frequency Missing = 76.426066225
ALCOHOL USE IN PAST MONTH
q19b Frequency Percent-----------------------------------------Never Heard/Used 979.7535 57.071-2 times 384.8052 22.413-10 times 244.0215 14.2111+ times 108.2293 6.30
Frequency Missing = 84.190537293
INHALANT USE IN PAST MONTH
q19c Frequency Percent-----------------------------------------Never Heard/Used 1606.702 94.831-2 times 64.00333 3.78
3-10 times 21.08446 1.2411+ times 2.490292 0.15
Frequency Missing = 106.72011401
The frequencies have been weighted so that theanalysis reflects the distribution of students by grade
level in the district
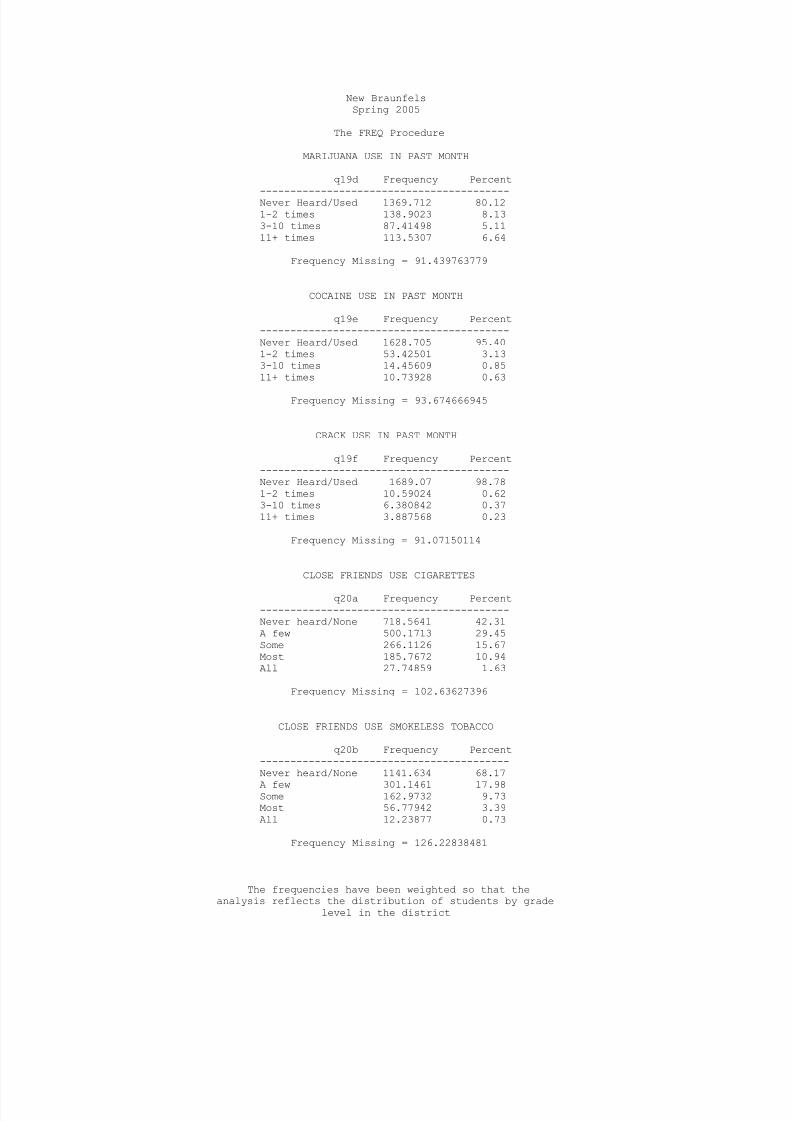
8/14/2019 COMAL COUNTY - New Braunfels ISD - 2005 Texas School Survey of Drug and Alcohol Use
http://slidepdf.com/reader/full/comal-county-new-braunfels-isd-2005-texas-school-survey-of-drug-and-alcohol 82/114
New BraunfelsSpring 2005
The FREQ Procedure
MARIJUANA USE IN PAST MONTH
q19d Frequency Percent
-----------------------------------------Never Heard/Used 1369.712 80.121-2 times 138.9023 8.133-10 times 87.41498 5.1111+ times 113.5307 6.64
Frequency Missing = 91.439763779
COCAINE USE IN PAST MONTH
q19e Frequency Percent-----------------------------------------Never Heard/Used 1628.705 95.401-2 times 53.42501 3.133-10 times 14.45609 0.8511+ times 10.73928 0.63
Frequency Missing = 93.674666945
CRACK USE IN PAST MONTH
q19f Frequency Percent-----------------------------------------Never Heard/Used 1689.07 98.781-2 times 10.59024 0.623-10 times 6.380842 0.3711+ times 3.887568 0.23
Frequency Missing = 91.07150114
CLOSE FRIENDS USE CIGARETTES
q20a Frequency Percent-----------------------------------------Never heard/None 718.5641 42.31A few 500.1713 29.45Some 266.1126 15.67Most 185.7672 10.94All 27.74859 1.63
Frequency Missing = 102.63627396
CLOSE FRIENDS USE SMOKELESS TOBACCO
q20b Frequency Percent-----------------------------------------Never heard/None 1141.634 68.17
A few 301.1461 17.98Some 162.9732 9.73Most 56.77942 3.39All 12.23877 0.73
Frequency Missing = 126.22838481
The frequencies have been weighted so that theanalysis reflects the distribution of students by grade
level in the district
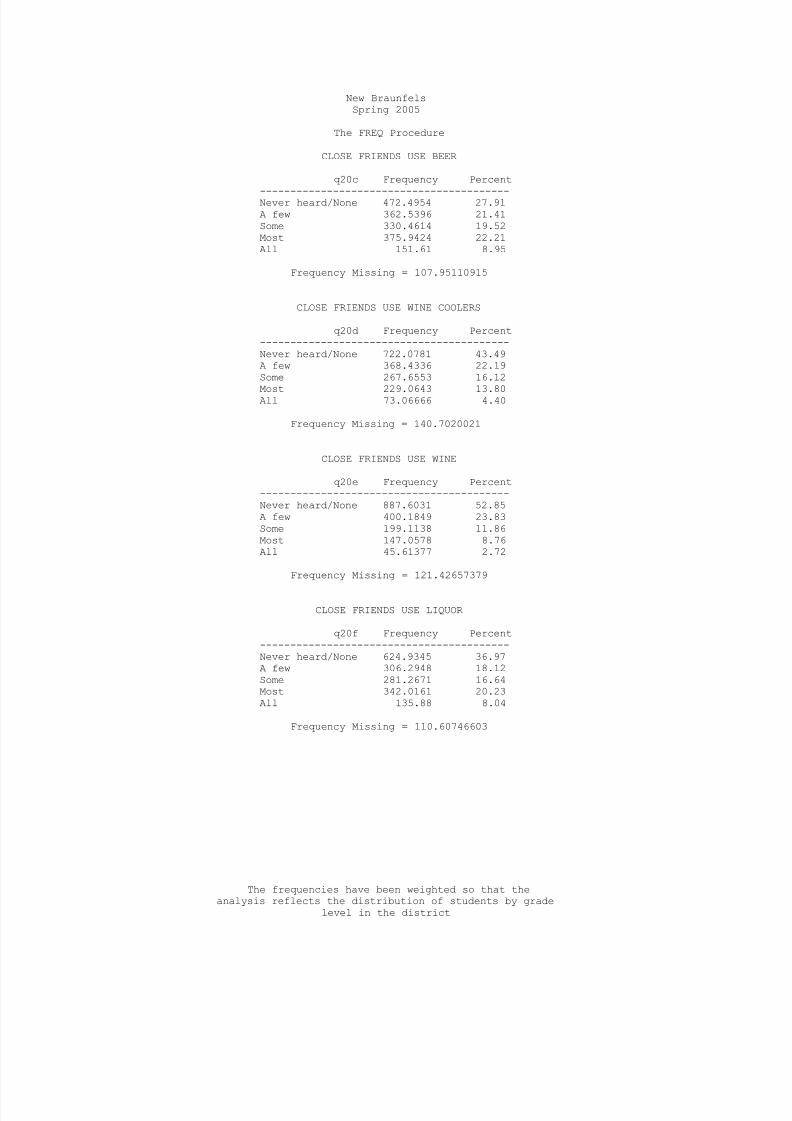
8/14/2019 COMAL COUNTY - New Braunfels ISD - 2005 Texas School Survey of Drug and Alcohol Use
http://slidepdf.com/reader/full/comal-county-new-braunfels-isd-2005-texas-school-survey-of-drug-and-alcohol 83/114
New BraunfelsSpring 2005
The FREQ Procedure
CLOSE FRIENDS USE BEER
q20c Frequency Percent
-----------------------------------------Never heard/None 472.4954 27.91A few 362.5396 21.41Some 330.4614 19.52Most 375.9424 22.21All 151.61 8.95
Frequency Missing = 107.95110915
CLOSE FRIENDS USE WINE COOLERS
q20d Frequency Percent-----------------------------------------Never heard/None 722.0781 43.49A few 368.4336 22.19Some 267.6553 16.12
Most 229.0643 13.80All 73.06666 4.40
Frequency Missing = 140.7020021
CLOSE FRIENDS USE WINE
q20e Frequency Percent-----------------------------------------Never heard/None 887.6031 52.85A few 400.1849 23.83Some 199.1138 11.86Most 147.0578 8.76All 45.61377 2.72
Frequency Missing = 121.42657379
CLOSE FRIENDS USE LIQUOR
q20f Frequency Percent-----------------------------------------Never heard/None 624.9345 36.97A few 306.2948 18.12Some 281.2671 16.64Most 342.0161 20.23All 135.88 8.04
Frequency Missing = 110.60746603
The frequencies have been weighted so that theanalysis reflects the distribution of students by grade
level in the district
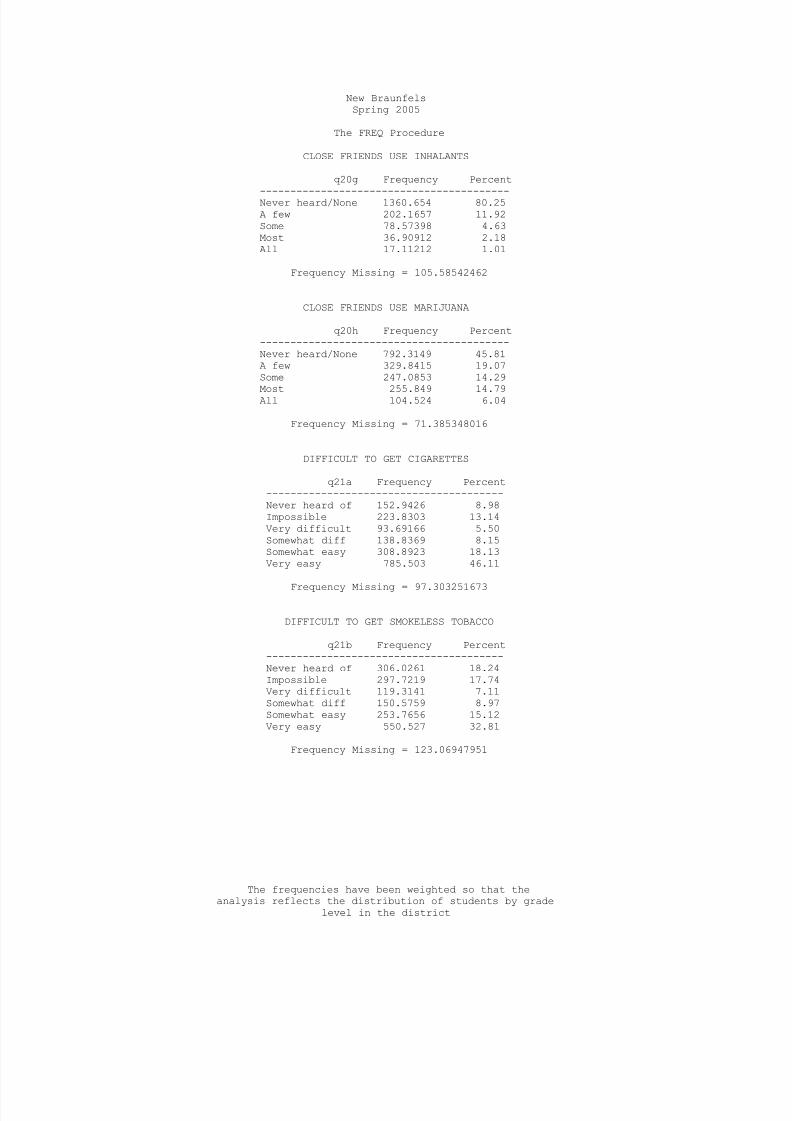
8/14/2019 COMAL COUNTY - New Braunfels ISD - 2005 Texas School Survey of Drug and Alcohol Use
http://slidepdf.com/reader/full/comal-county-new-braunfels-isd-2005-texas-school-survey-of-drug-and-alcohol 84/114
New BraunfelsSpring 2005
The FREQ Procedure
CLOSE FRIENDS USE INHALANTS
q20g Frequency Percent
-----------------------------------------Never heard/None 1360.654 80.25A few 202.1657 11.92Some 78.57398 4.63Most 36.90912 2.18All 17.11212 1.01
Frequency Missing = 105.58542462
CLOSE FRIENDS USE MARIJUANA
q20h Frequency Percent-----------------------------------------Never heard/None 792.3149 45.81A few 329.8415 19.07Some 247.0853 14.29
Most 255.849 14.79All 104.524 6.04
Frequency Missing = 71.385348016
DIFFICULT TO GET CIGARETTES
q21a Frequency Percent---------------------------------------Never heard of 152.9426 8.98Impossible 223.8303 13.14Very difficult 93.69166 5.50Somewhat diff 138.8369 8.15Somewhat easy 308.8923 18.13Very easy 785.503 46.11
Frequency Missing = 97.303251673
DIFFICULT TO GET SMOKELESS TOBACCO
q21b Frequency Percent---------------------------------------Never heard of 306.0261 18.24Impossible 297.7219 17.74Very difficult 119.3141 7.11Somewhat diff 150.5759 8.97Somewhat easy 253.7656 15.12Very easy 550.527 32.81
Frequency Missing = 123.06947951
The frequencies have been weighted so that theanalysis reflects the distribution of students by grade
level in the district

8/14/2019 COMAL COUNTY - New Braunfels ISD - 2005 Texas School Survey of Drug and Alcohol Use
http://slidepdf.com/reader/full/comal-county-new-braunfels-isd-2005-texas-school-survey-of-drug-and-alcohol 85/114
New BraunfelsSpring 2005
The FREQ Procedure
DIFFICULT TO GET BEER
q21c Frequency Percent
---------------------------------------Never heard of 124.6491 7.43Impossible 146.1655 8.71Very difficult 82.75202 4.93Somewhat diff 160.6852 9.58Somewhat easy 374.2887 22.32Very easy 788.6557 47.02
Frequency Missing = 123.80387928
DIFFICULT TO GET WINE COOLERS
q21d Frequency Percent---------------------------------------Never heard of 173.7871 10.43Impossible 210.8286 12.65
Very difficult 90.99552 5.46Somewhat diff 180.6647 10.84Somewhat easy 334.3003 20.07Very easy 675.4804 40.54
Frequency Missing = 134.94337096
DIFFICULT TO GET WINE
q21e Frequency Percent---------------------------------------Never heard of 153.0883 9.20Impossible 186.7317 11.22Very difficult 100.4976 6.04Somewhat diff 179.2438 10.77Somewhat easy 338.5259 20.35
Very easy 705.4602 42.41
Frequency Missing = 137.45259679
DIFFICULT TO GET LIQUOR
q21f Frequency Percent---------------------------------------Never heard of 143.2285 8.65Impossible 225.5426 13.62Very difficult 99.41526 6.00Somewhat diff 157.2892 9.50Somewhat easy 318.5035 19.23Very easy 712.5007 43.01
Frequency Missing = 144.52021955
The frequencies have been weighted so that theanalysis reflects the distribution of students by grade
level in the district
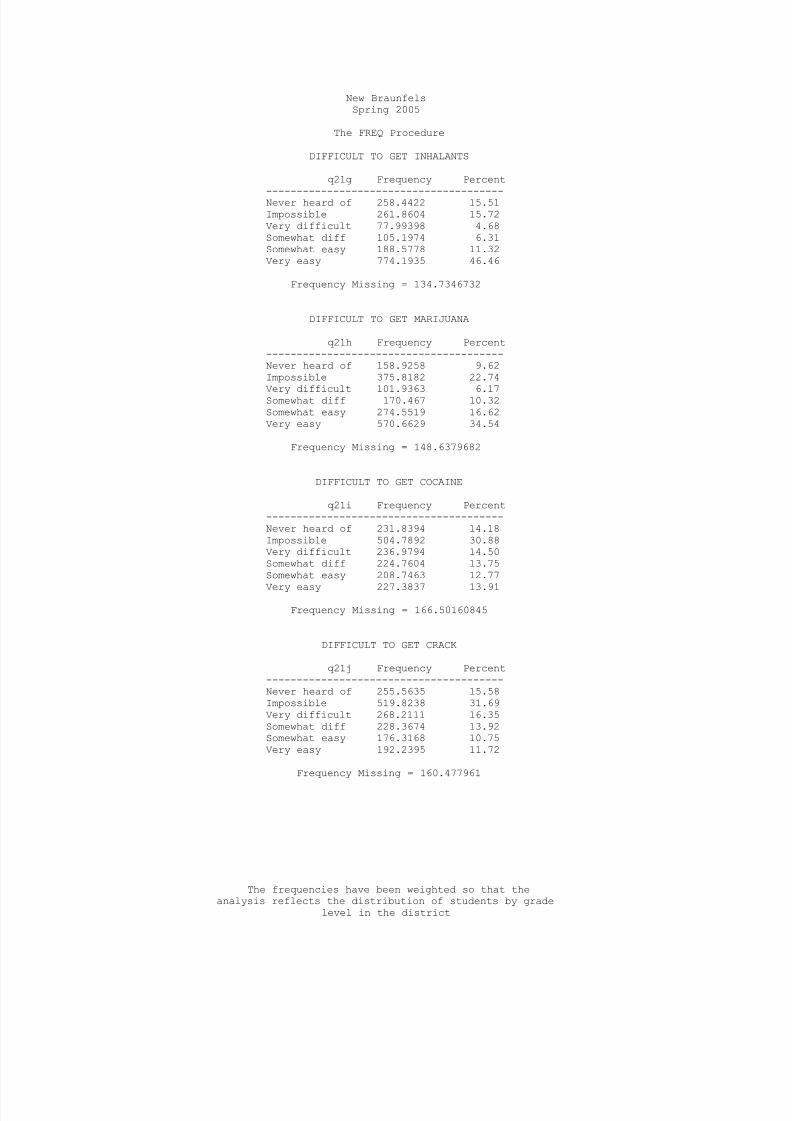
8/14/2019 COMAL COUNTY - New Braunfels ISD - 2005 Texas School Survey of Drug and Alcohol Use
http://slidepdf.com/reader/full/comal-county-new-braunfels-isd-2005-texas-school-survey-of-drug-and-alcohol 86/114
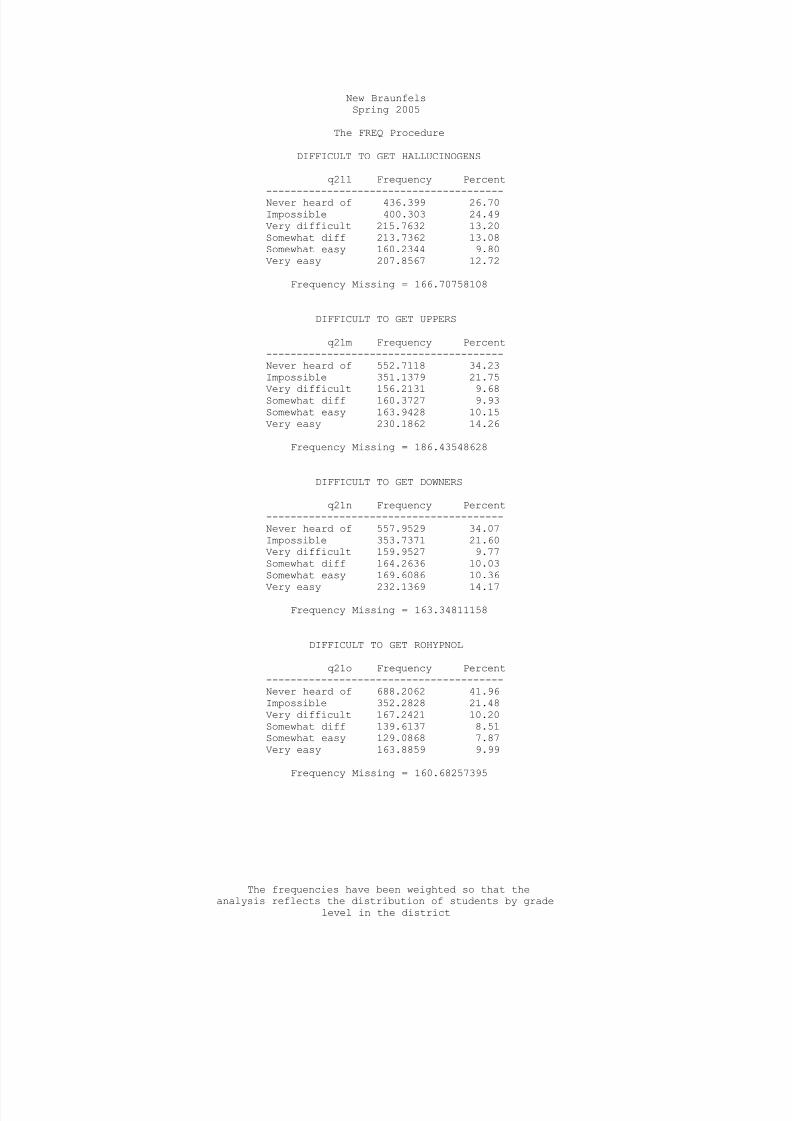
8/14/2019 COMAL COUNTY - New Braunfels ISD - 2005 Texas School Survey of Drug and Alcohol Use
http://slidepdf.com/reader/full/comal-county-new-braunfels-isd-2005-texas-school-survey-of-drug-and-alcohol 87/114
New BraunfelsSpring 2005
The FREQ Procedure
DIFFICULT TO GET HALLUCINOGENS
q21l Frequency Percent
---------------------------------------Never heard of 436.399 26.70Impossible 400.303 24.49Very difficult 215.7632 13.20Somewhat diff 213.7362 13.08Somewhat easy 160.2344 9.80Very easy 207.8567 12.72
Frequency Missing = 166.70758108
DIFFICULT TO GET UPPERS
q21m Frequency Percent---------------------------------------Never heard of 552.7118 34.23Impossible 351.1379 21.75
Very difficult 156.2131 9.68Somewhat diff 160.3727 9.93Somewhat easy 163.9428 10.15Very easy 230.1862 14.26
Frequency Missing = 186.43548628
DIFFICULT TO GET DOWNERS
q21n Frequency Percent---------------------------------------Never heard of 557.9529 34.07Impossible 353.7371 21.60Very difficult 159.9527 9.77Somewhat diff 164.2636 10.03Somewhat easy 169.6086 10.36
Very easy 232.1369 14.17
Frequency Missing = 163.34811158
DIFFICULT TO GET ROHYPNOL
q21o Frequency Percent---------------------------------------Never heard of 688.2062 41.96Impossible 352.2828 21.48Very difficult 167.2421 10.20Somewhat diff 139.6137 8.51Somewhat easy 129.0868 7.87Very easy 163.8859 9.99
Frequency Missing = 160.68257395
The frequencies have been weighted so that theanalysis reflects the distribution of students by grade
level in the district
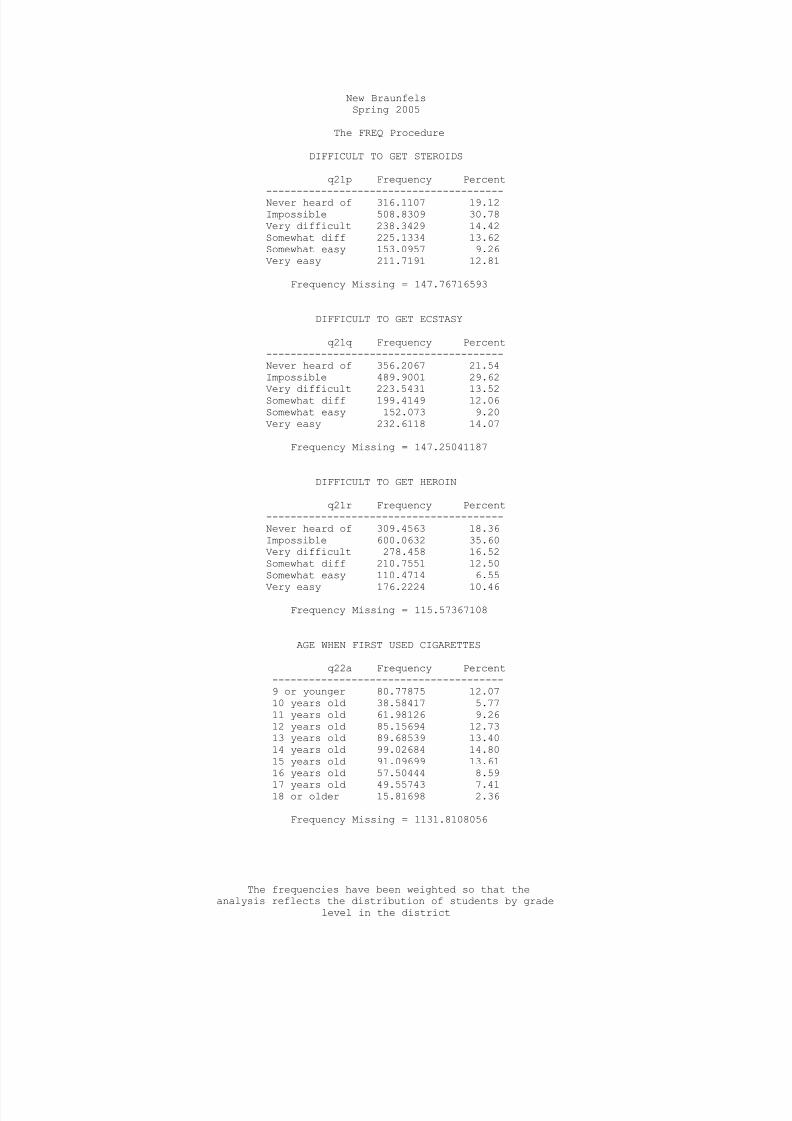
8/14/2019 COMAL COUNTY - New Braunfels ISD - 2005 Texas School Survey of Drug and Alcohol Use
http://slidepdf.com/reader/full/comal-county-new-braunfels-isd-2005-texas-school-survey-of-drug-and-alcohol 88/114
New BraunfelsSpring 2005
The FREQ Procedure
DIFFICULT TO GET STEROIDS
q21p Frequency Percent
---------------------------------------Never heard of 316.1107 19.12Impossible 508.8309 30.78Very difficult 238.3429 14.42Somewhat diff 225.1334 13.62Somewhat easy 153.0957 9.26Very easy 211.7191 12.81
Frequency Missing = 147.76716593
DIFFICULT TO GET ECSTASY
q21q Frequency Percent---------------------------------------Never heard of 356.2067 21.54Impossible 489.9001 29.62
Very difficult 223.5431 13.52Somewhat diff 199.4149 12.06Somewhat easy 152.073 9.20Very easy 232.6118 14.07
Frequency Missing = 147.25041187
DIFFICULT TO GET HEROIN
q21r Frequency Percent---------------------------------------Never heard of 309.4563 18.36Impossible 600.0632 35.60Very difficult 278.458 16.52Somewhat diff 210.7551 12.50Somewhat easy 110.4714 6.55
Very easy 176.2224 10.46
Frequency Missing = 115.57367108
AGE WHEN FIRST USED CIGARETTES
q22a Frequency Percent--------------------------------------9 or younger 80.77875 12.0710 years old 38.58417 5.7711 years old 61.98126 9.2612 years old 85.15694 12.7313 years old 89.68539 13.4014 years old 99.02684 14.8015 years old 91.09699 13.6116 years old 57.50444 8.59
17 years old 49.55743 7.4118 or older 15.81698 2.36
Frequency Missing = 1131.8108056
The frequencies have been weighted so that theanalysis reflects the distribution of students by grade
level in the district
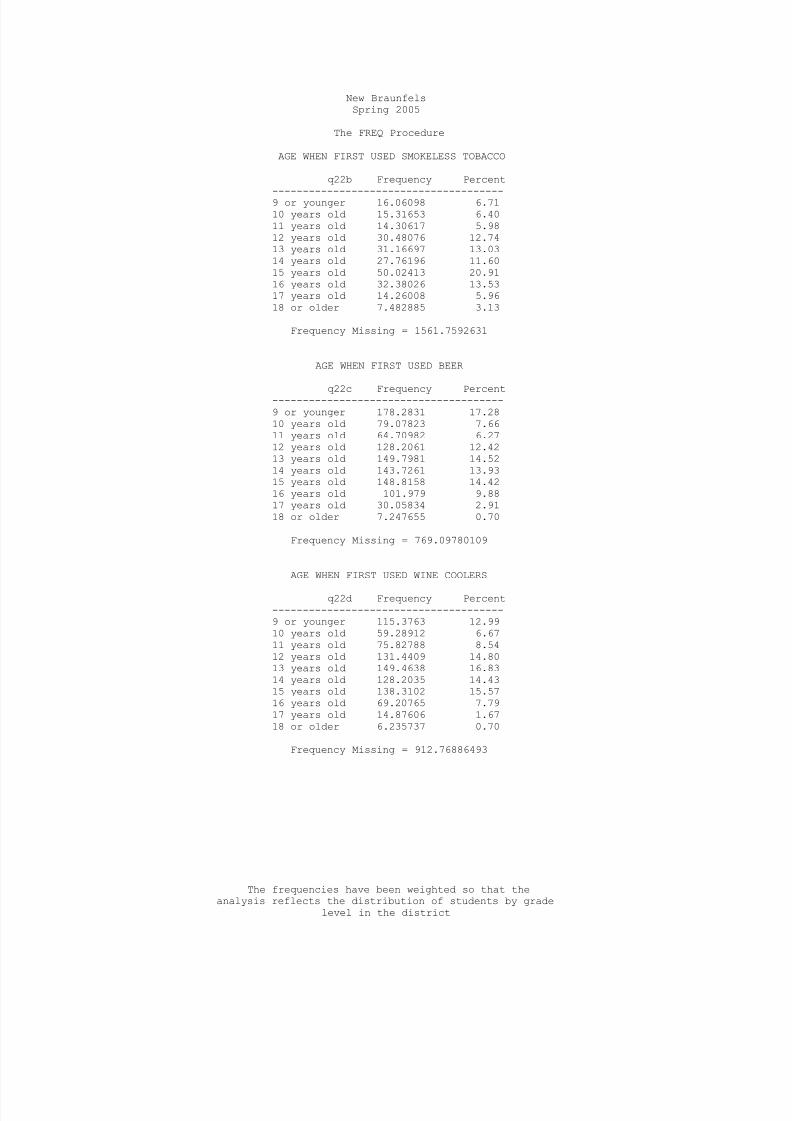
8/14/2019 COMAL COUNTY - New Braunfels ISD - 2005 Texas School Survey of Drug and Alcohol Use
http://slidepdf.com/reader/full/comal-county-new-braunfels-isd-2005-texas-school-survey-of-drug-and-alcohol 89/114
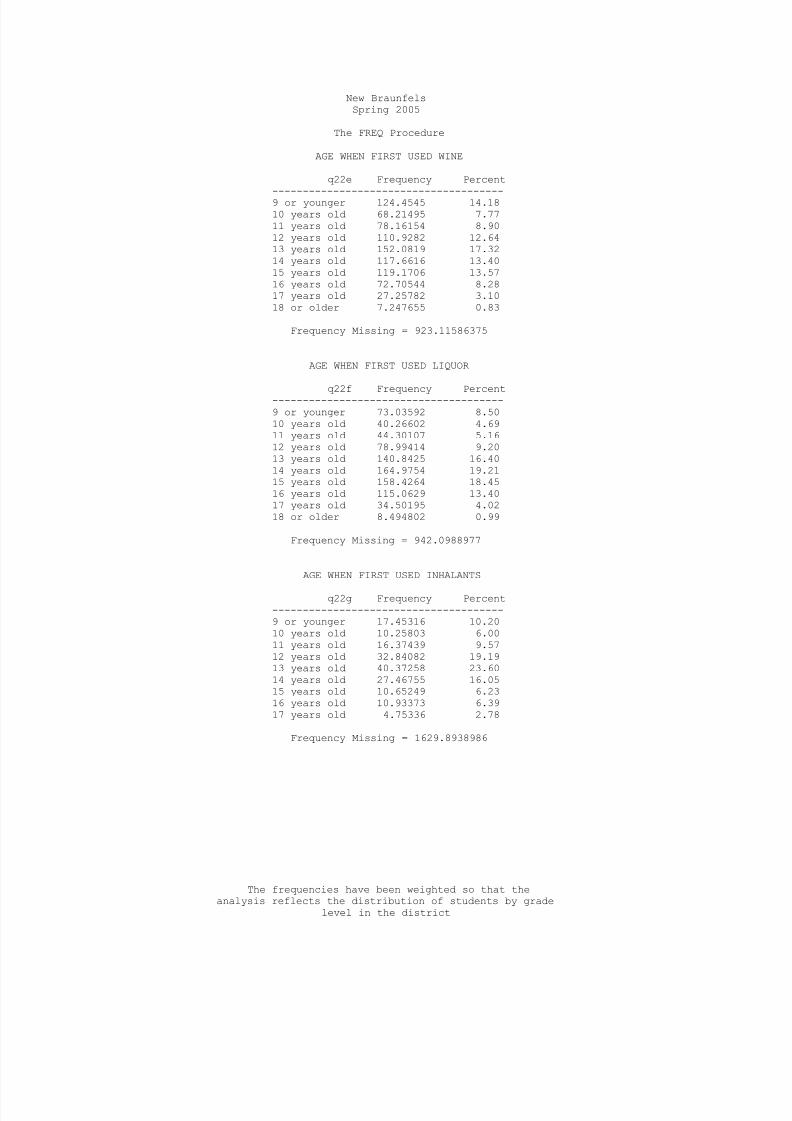
8/14/2019 COMAL COUNTY - New Braunfels ISD - 2005 Texas School Survey of Drug and Alcohol Use
http://slidepdf.com/reader/full/comal-county-new-braunfels-isd-2005-texas-school-survey-of-drug-and-alcohol 90/114
New BraunfelsSpring 2005
The FREQ Procedure
AGE WHEN FIRST USED WINE
q22e Frequency Percent
--------------------------------------9 or younger 124.4545 14.1810 years old 68.21495 7.7711 years old 78.16154 8.9012 years old 110.9282 12.6413 years old 152.0819 17.3214 years old 117.6616 13.4015 years old 119.1706 13.5716 years old 72.70544 8.2817 years old 27.25782 3.1018 or older 7.247655 0.83
Frequency Missing = 923.11586375
AGE WHEN FIRST USED LIQUOR
q22f Frequency Percent--------------------------------------9 or younger 73.03592 8.5010 years old 40.26602 4.6911 years old 44.30107 5.1612 years old 78.99414 9.2013 years old 140.8425 16.4014 years old 164.9754 19.2115 years old 158.4264 18.4516 years old 115.0629 13.4017 years old 34.50195 4.0218 or older 8.494802 0.99
Frequency Missing = 942.0988977
AGE WHEN FIRST USED INHALANTS
q22g Frequency Percent--------------------------------------9 or younger 17.45316 10.2010 years old 10.25803 6.0011 years old 16.37439 9.5712 years old 32.84082 19.1913 years old 40.37258 23.6014 years old 27.46755 16.0515 years old 10.65249 6.2316 years old 10.93373 6.3917 years old 4.75336 2.78
Frequency Missing = 1629.8938986
The frequencies have been weighted so that theanalysis reflects the distribution of students by grade
level in the district

8/14/2019 COMAL COUNTY - New Braunfels ISD - 2005 Texas School Survey of Drug and Alcohol Use
http://slidepdf.com/reader/full/comal-county-new-braunfels-isd-2005-texas-school-survey-of-drug-and-alcohol 91/114
New BraunfelsSpring 2005
The FREQ Procedure
AGE WHEN FIRST USED MARIJUANA
q22h Frequency Percent
--------------------------------------9 or younger 19.27102 3.6310 years old 22.3572 4.2111 years old 39.02919 7.3612 years old 61.24366 11.5413 years old 107.2511 20.2214 years old 98.96094 18.6515 years old 89.67216 16.9016 years old 72.63582 13.6917 years old 15.272 2.8818 or older 4.827881 0.91
Frequency Missing = 1270.4790118
AGE WHEN FIRST USED COCAINE
q22i Frequency Percent--------------------------------------9 or younger 2.077245 1.5110 years old 2.652022 1.9311 years old 2.813753 2.0512 years old 9.913671 7.2213 years old 19.8086 14.4314 years old 28.24518 20.5715 years old 25.294 18.4316 years old 32.21603 23.4717 years old 10.51864 7.6618 or older 3.741442 2.73
Frequency Missing = 1663.7194221
AGE WHEN FIRST USED CRACK
q22j Frequency Percent--------------------------------------10 years old 2.652022 6.7412 years old 2.065643 5.2513 years old 6.687677 16.9914 years old 7.307658 18.5615 years old 8.10959 20.6016 years old 8.801029 22.3618 or older 3.741442 9.50
Frequency Missing = 1761.6349383
The frequencies have been weighted so that theanalysis reflects the distribution of students by grade
level in the district

8/14/2019 COMAL COUNTY - New Braunfels ISD - 2005 Texas School Survey of Drug and Alcohol Use
http://slidepdf.com/reader/full/comal-county-new-braunfels-isd-2005-texas-school-survey-of-drug-and-alcohol 92/114
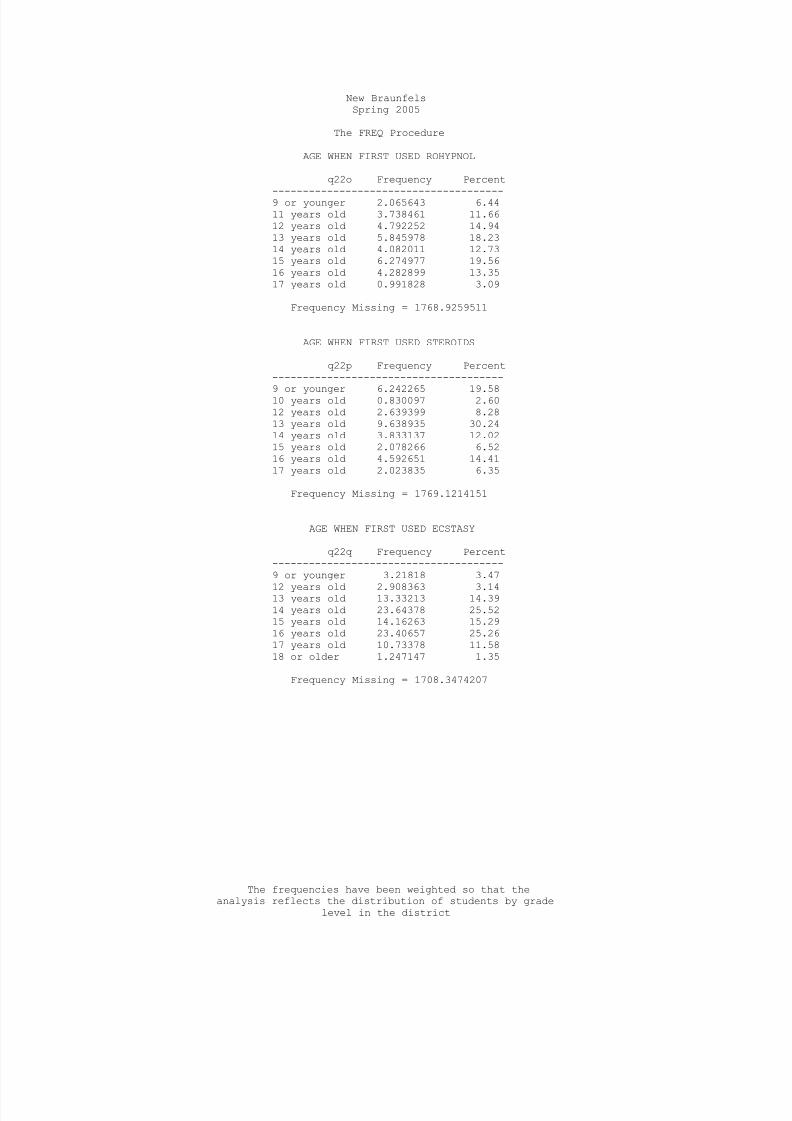
8/14/2019 COMAL COUNTY - New Braunfels ISD - 2005 Texas School Survey of Drug and Alcohol Use
http://slidepdf.com/reader/full/comal-county-new-braunfels-isd-2005-texas-school-survey-of-drug-and-alcohol 93/114
New BraunfelsSpring 2005
The FREQ Procedure
AGE WHEN FIRST USED ROHYPNOL
q22o Frequency Percent
--------------------------------------9 or younger 2.065643 6.4411 years old 3.738461 11.6612 years old 4.792252 14.9413 years old 5.845978 18.2314 years old 4.082011 12.7315 years old 6.274977 19.5616 years old 4.282899 13.3517 years old 0.991828 3.09
Frequency Missing = 1768.9259511
AGE WHEN FIRST USED STEROIDS
q22p Frequency Percent--------------------------------------
9 or younger 6.242265 19.5810 years old 0.830097 2.6012 years old 2.639399 8.2813 years old 9.638935 30.2414 years old 3.833137 12.0215 years old 2.078266 6.5216 years old 4.592651 14.4117 years old 2.023835 6.35
Frequency Missing = 1769.1214151
AGE WHEN FIRST USED ECSTASY
q22q Frequency Percent--------------------------------------9 or younger 3.21818 3.47
12 years old 2.908363 3.1413 years old 13.33213 14.3914 years old 23.64378 25.5215 years old 14.16263 15.2916 years old 23.40657 25.2617 years old 10.73378 11.5818 or older 1.247147 1.35
Frequency Missing = 1708.3474207
The frequencies have been weighted so that theanalysis reflects the distribution of students by grade
level in the district
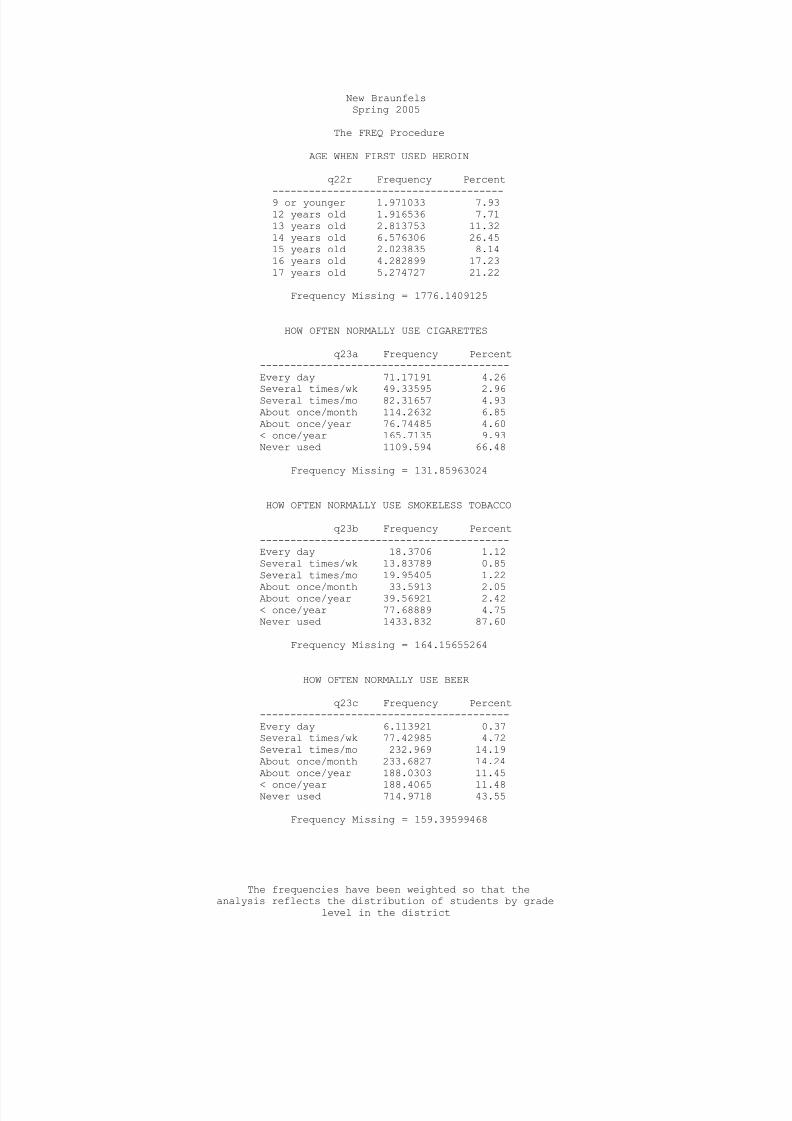
8/14/2019 COMAL COUNTY - New Braunfels ISD - 2005 Texas School Survey of Drug and Alcohol Use
http://slidepdf.com/reader/full/comal-county-new-braunfels-isd-2005-texas-school-survey-of-drug-and-alcohol 94/114
New BraunfelsSpring 2005
The FREQ Procedure
AGE WHEN FIRST USED HEROIN
q22r Frequency Percent
--------------------------------------9 or younger 1.971033 7.9312 years old 1.916536 7.7113 years old 2.813753 11.3214 years old 6.576306 26.4515 years old 2.023835 8.1416 years old 4.282899 17.2317 years old 5.274727 21.22
Frequency Missing = 1776.1409125
HOW OFTEN NORMALLY USE CIGARETTES
q23a Frequency Percent-----------------------------------------Every day 71.17191 4.26
Several times/wk 49.33595 2.96Several times/mo 82.31657 4.93About once/month 114.2632 6.85About once/year 76.74485 4.60< once/year 165.7135 9.93Never used 1109.594 66.48
Frequency Missing = 131.85963024
HOW OFTEN NORMALLY USE SMOKELESS TOBACCO
q23b Frequency Percent-----------------------------------------Every day 18.3706 1.12Several times/wk 13.83789 0.85Several times/mo 19.95405 1.22
About once/month 33.5913 2.05About once/year 39.56921 2.42< once/year 77.68889 4.75Never used 1433.832 87.60
Frequency Missing = 164.15655264
HOW OFTEN NORMALLY USE BEER
q23c Frequency Percent-----------------------------------------Every day 6.113921 0.37Several times/wk 77.42985 4.72Several times/mo 232.969 14.19About once/month 233.6827 14.24About once/year 188.0303 11.45
< once/year 188.4065 11.48Never used 714.9718 43.55
Frequency Missing = 159.39599468
The frequencies have been weighted so that theanalysis reflects the distribution of students by grade
level in the district
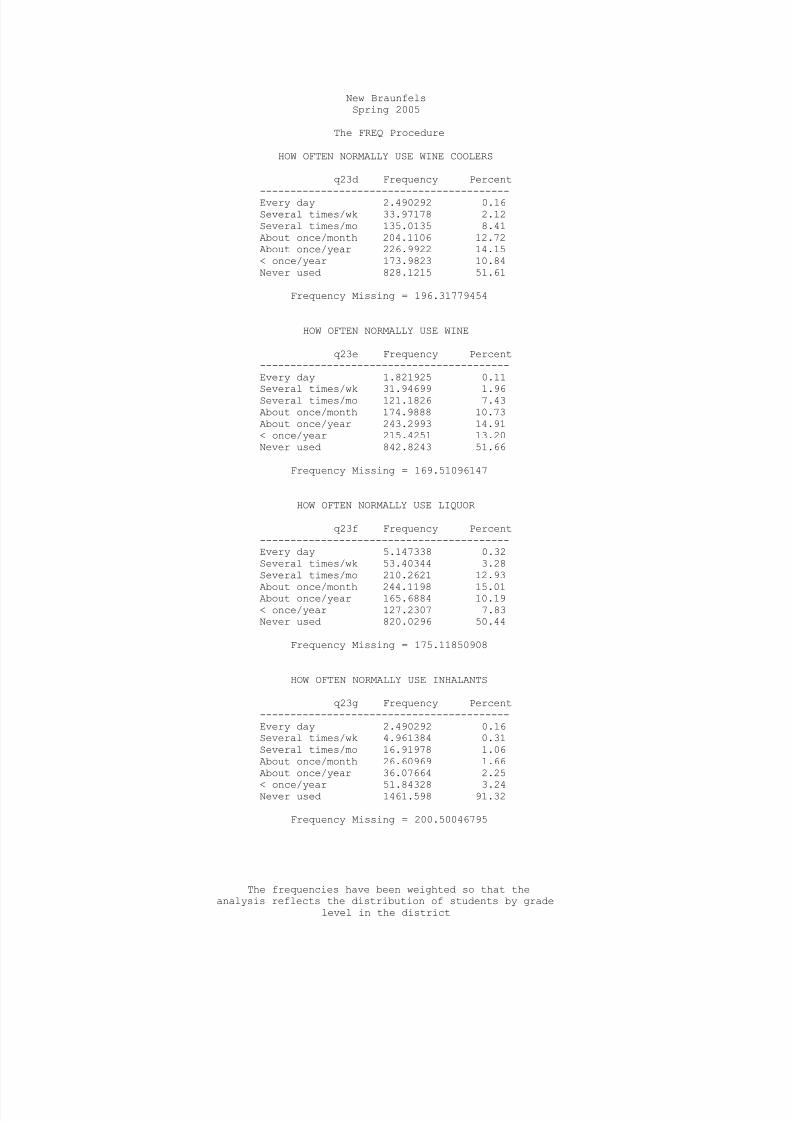
8/14/2019 COMAL COUNTY - New Braunfels ISD - 2005 Texas School Survey of Drug and Alcohol Use
http://slidepdf.com/reader/full/comal-county-new-braunfels-isd-2005-texas-school-survey-of-drug-and-alcohol 95/114
New BraunfelsSpring 2005
The FREQ Procedure
HOW OFTEN NORMALLY USE WINE COOLERS
q23d Frequency Percent
-----------------------------------------Every day 2.490292 0.16Several times/wk 33.97178 2.12Several times/mo 135.0135 8.41About once/month 204.1106 12.72About once/year 226.9922 14.15< once/year 173.9823 10.84Never used 828.1215 51.61
Frequency Missing = 196.31779454
HOW OFTEN NORMALLY USE WINE
q23e Frequency Percent-----------------------------------------Every day 1.821925 0.11
Several times/wk 31.94699 1.96Several times/mo 121.1826 7.43About once/month 174.9888 10.73About once/year 243.2993 14.91< once/year 215.4251 13.20Never used 842.8243 51.66
Frequency Missing = 169.51096147
HOW OFTEN NORMALLY USE LIQUOR
q23f Frequency Percent-----------------------------------------Every day 5.147338 0.32Several times/wk 53.40344 3.28Several times/mo 210.2621 12.93
About once/month 244.1198 15.01About once/year 165.6884 10.19< once/year 127.2307 7.83Never used 820.0296 50.44
Frequency Missing = 175.11850908
HOW OFTEN NORMALLY USE INHALANTS
q23g Frequency Percent-----------------------------------------Every day 2.490292 0.16Several times/wk 4.961384 0.31Several times/mo 16.91978 1.06About once/month 26.60969 1.66About once/year 36.07664 2.25
< once/year 51.84328 3.24Never used 1461.598 91.32
Frequency Missing = 200.50046795
The frequencies have been weighted so that theanalysis reflects the distribution of students by grade
level in the district
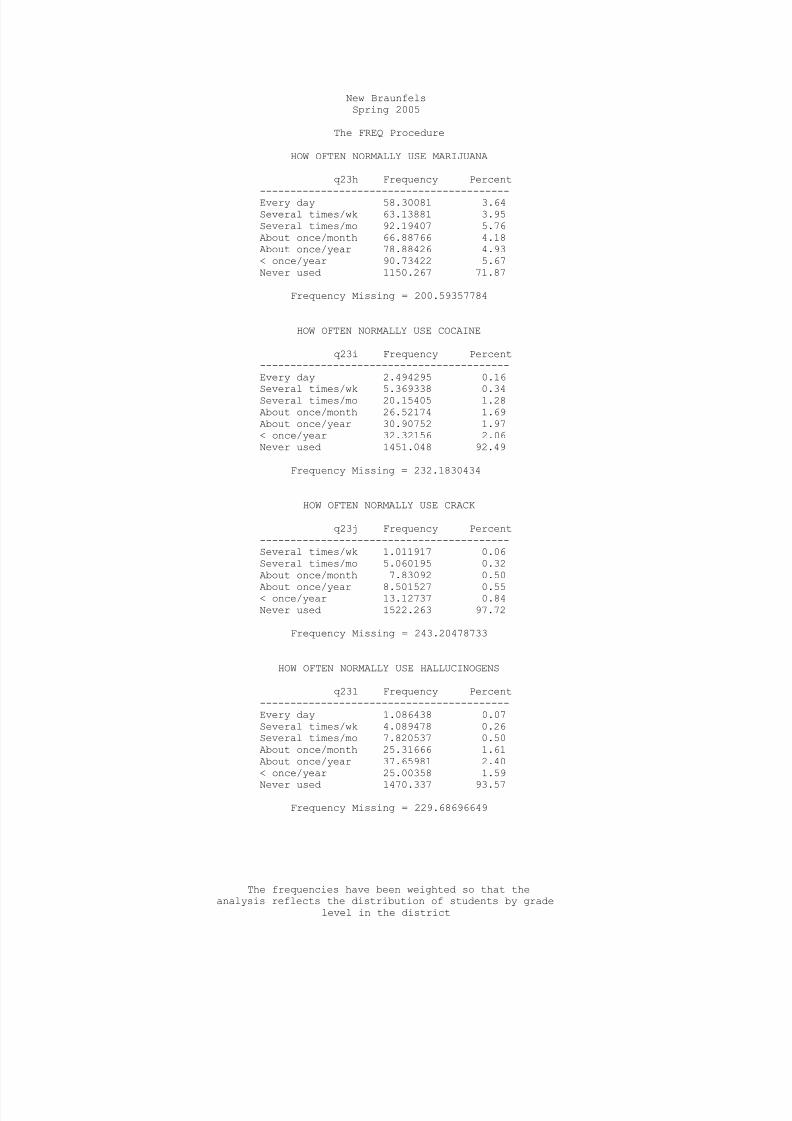
8/14/2019 COMAL COUNTY - New Braunfels ISD - 2005 Texas School Survey of Drug and Alcohol Use
http://slidepdf.com/reader/full/comal-county-new-braunfels-isd-2005-texas-school-survey-of-drug-and-alcohol 96/114
New BraunfelsSpring 2005
The FREQ Procedure
HOW OFTEN NORMALLY USE MARIJUANA
q23h Frequency Percent
-----------------------------------------Every day 58.30081 3.64Several times/wk 63.13881 3.95Several times/mo 92.19407 5.76About once/month 66.88766 4.18About once/year 78.88426 4.93< once/year 90.73422 5.67Never used 1150.267 71.87
Frequency Missing = 200.59357784
HOW OFTEN NORMALLY USE COCAINE
q23i Frequency Percent-----------------------------------------Every day 2.494295 0.16
Several times/wk 5.369338 0.34Several times/mo 20.15405 1.28About once/month 26.52174 1.69About once/year 30.90752 1.97< once/year 32.32156 2.06Never used 1451.048 92.49
Frequency Missing = 232.1830434
HOW OFTEN NORMALLY USE CRACK
q23j Frequency Percent-----------------------------------------Several times/wk 1.011917 0.06Several times/mo 5.060195 0.32About once/month 7.83092 0.50
About once/year 8.501527 0.55< once/year 13.12737 0.84Never used 1522.263 97.72
Frequency Missing = 243.20478733
HOW OFTEN NORMALLY USE HALLUCINOGENS
q23l Frequency Percent-----------------------------------------Every day 1.086438 0.07Several times/wk 4.089478 0.26Several times/mo 7.820537 0.50About once/month 25.31666 1.61About once/year 37.65981 2.40< once/year 25.00358 1.59
Never used 1470.337 93.57
Frequency Missing = 229.68696649
The frequencies have been weighted so that theanalysis reflects the distribution of students by grade
level in the district

8/14/2019 COMAL COUNTY - New Braunfels ISD - 2005 Texas School Survey of Drug and Alcohol Use
http://slidepdf.com/reader/full/comal-county-new-braunfels-isd-2005-texas-school-survey-of-drug-and-alcohol 97/114
New BraunfelsSpring 2005
The FREQ Procedure
HOW OFTEN NORMALLY USE UPPERS
q23m Frequency Percent
-----------------------------------------Every day 5.061216 0.32Several times/wk 2.003745 0.13Several times/mo 20.16606 1.29About once/month 47.91736 3.07About once/year 20.16926 1.29< once/year 31.7727 2.03Never used 1435.309 91.87
Frequency Missing = 238.60086363
HOW OFTEN NORMALLY USE DOWNERS
q23n Frequency Percent-----------------------------------------Every day 8.299485 0.53
Several times/wk 3.250892 0.21Several times/mo 20.74186 1.32About once/month 49.88676 3.18About once/year 20.46638 1.31< once/year 30.28062 1.93Never used 1433.996 91.52
Frequency Missing = 234.07830153
HOW OFTEN NORMALLY USE ROHYPNOL
q23o Frequency Percent-----------------------------------------Every day 2.065643 0.14Several times/wk 2.833842 0.19Several times/mo 1.011917 0.07
About once/month 10.7908 0.71About once/year 8.968874 0.59< once/year 5.175916 0.34Never used 1482.484 97.96
Frequency Missing = 287.66853127
HOW OFTEN NORMALLY USE STEROIDS
q23p Frequency Percent-----------------------------------------Every day 3.152082 0.21Several times/wk 2.928453 0.19Several times/mo 0.991828 0.06About once/month 5.71696 0.37About once/year 3.631227 0.24
< once/year 7.146949 0.47Never used 1506.035 98.46
Frequency Missing = 271.39710879
The frequencies have been weighted so that theanalysis reflects the distribution of students by grade
level in the district

8/14/2019 COMAL COUNTY - New Braunfels ISD - 2005 Texas School Survey of Drug and Alcohol Use
http://slidepdf.com/reader/full/comal-county-new-braunfels-isd-2005-texas-school-survey-of-drug-and-alcohol 98/114
New BraunfelsSpring 2005
The FREQ Procedure
HOW OFTEN NORMALLY USE ECSTASY
q23q Frequency Percent
-----------------------------------------Several times/wk 5.188539 0.34Several times/mo 5.891313 0.38About once/month 16.55777 1.08About once/year 24.79462 1.61< once/year 31.55763 2.05Never used 1452.796 94.53
Frequency Missing = 264.21383655
HOW OFTEN NORMALLY USE HEROIN
q23r Frequency Percent-----------------------------------------Every day 1.011917 0.07Several times/wk 2.928453 0.19
Several times/mo 4.24272 0.27About once/month 4.837587 0.31About once/year 7.300191 0.47< once/year 4.282899 0.28Never used 1528.936 98.42
Frequency Missing = 247.46026761
HOW MANY CIGARETTES IN PAST 30 DAYS
q24 Frequency Percent-----------------------------------------None 1427.783 82.46Less than 1 176.9045 10.22> 1 and < 10 81.52352 4.71> 10 and < 1pk 27.91236 1.61
> 1pk and < 2pks 13.72163 0.79More than 2pks 3.651317 0.21
Frequency Missing = 69.503629916
AMOUNT OF BEER AT ONE TIME
q25a Frequency Percent-----------------------------------------Never drink this 737.7782 43.3612+ drinks 74.49637 4.389-11 drinks 73.03272 4.295-8 drinks 150.9104 8.873-4 drinks 148.8439 8.752 drinks 138.4202 8.141 drink 140.9582 8.28
< 1 drink 236.9888 13.93
Frequency Missing = 99.571212559
The frequencies have been weighted so that theanalysis reflects the distribution of students by grade
level in the district
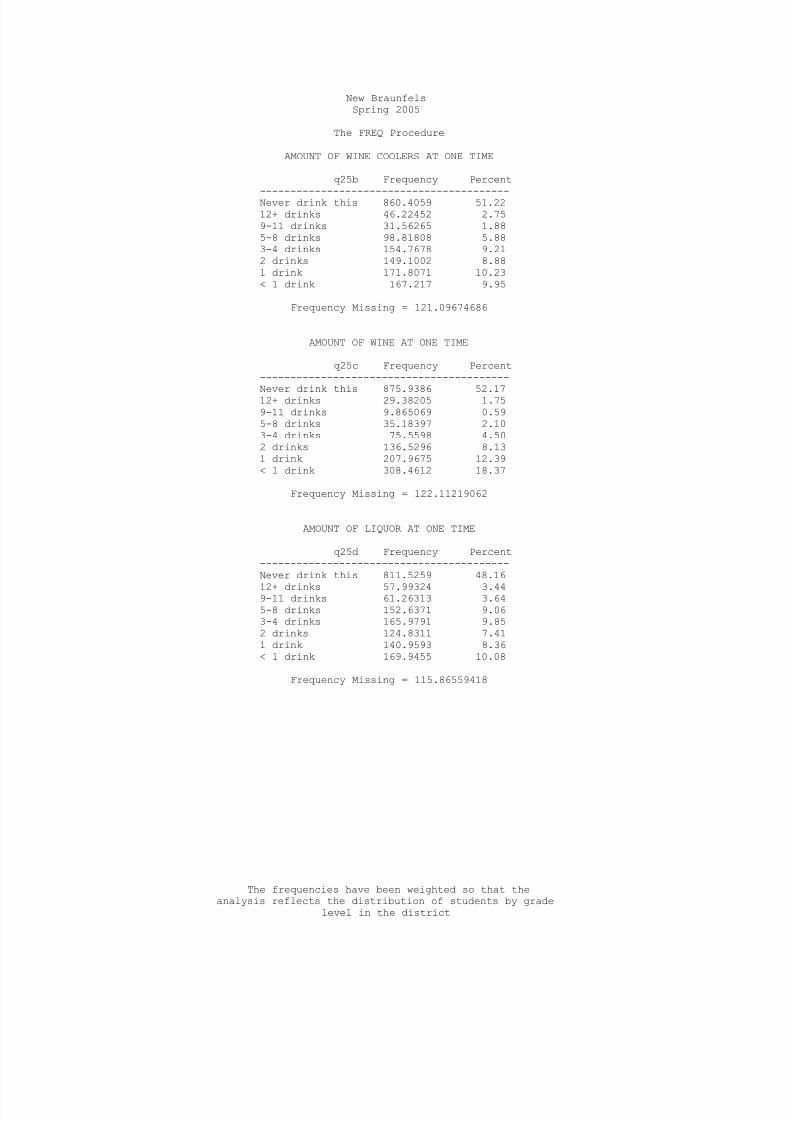
8/14/2019 COMAL COUNTY - New Braunfels ISD - 2005 Texas School Survey of Drug and Alcohol Use
http://slidepdf.com/reader/full/comal-county-new-braunfels-isd-2005-texas-school-survey-of-drug-and-alcohol 99/114
New BraunfelsSpring 2005
The FREQ Procedure
AMOUNT OF WINE COOLERS AT ONE TIME
q25b Frequency Percent
-----------------------------------------Never drink this 860.4059 51.2212+ drinks 46.22452 2.759-11 drinks 31.56265 1.885-8 drinks 98.81808 5.883-4 drinks 154.7678 9.212 drinks 149.1002 8.881 drink 171.8071 10.23< 1 drink 167.217 9.95
Frequency Missing = 121.09674686
AMOUNT OF WINE AT ONE TIME
q25c Frequency Percent-----------------------------------------
Never drink this 875.9386 52.1712+ drinks 29.38205 1.759-11 drinks 9.865069 0.595-8 drinks 35.18397 2.103-4 drinks 75.5598 4.502 drinks 136.5296 8.131 drink 207.9675 12.39< 1 drink 308.4612 18.37
Frequency Missing = 122.11219062
AMOUNT OF LIQUOR AT ONE TIME
q25d Frequency Percent-----------------------------------------Never drink this 811.5259 48.16
12+ drinks 57.99324 3.449-11 drinks 61.26313 3.645-8 drinks 152.6371 9.063-4 drinks 165.9791 9.852 drinks 124.8311 7.411 drink 140.9593 8.36< 1 drink 169.9455 10.08
Frequency Missing = 115.86559418
The frequencies have been weighted so that theanalysis reflects the distribution of students by grade
level in the district
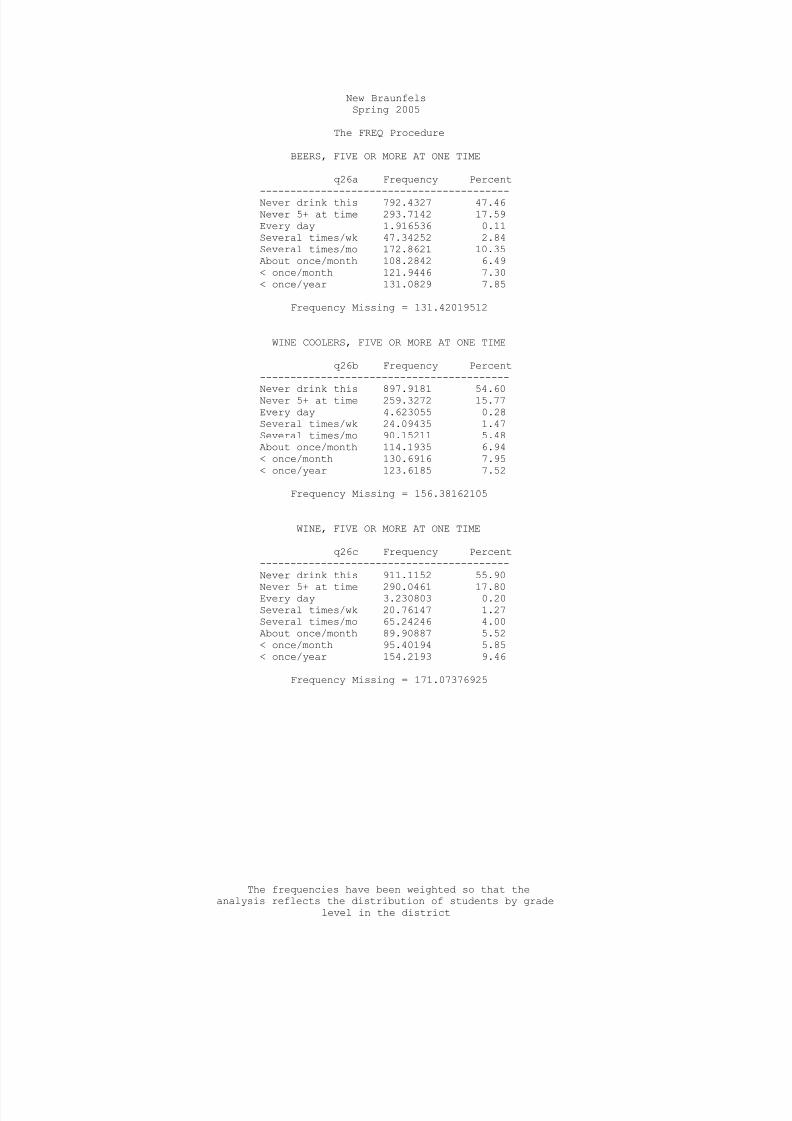
8/14/2019 COMAL COUNTY - New Braunfels ISD - 2005 Texas School Survey of Drug and Alcohol Use
http://slidepdf.com/reader/full/comal-county-new-braunfels-isd-2005-texas-school-survey-of-drug-and-alcohol 100/114
New BraunfelsSpring 2005
The FREQ Procedure
BEERS, FIVE OR MORE AT ONE TIME
q26a Frequency Percent
-----------------------------------------Never drink this 792.4327 47.46Never 5+ at time 293.7142 17.59Every day 1.916536 0.11Several times/wk 47.34252 2.84Several times/mo 172.8621 10.35About once/month 108.2842 6.49< once/month 121.9446 7.30< once/year 131.0829 7.85
Frequency Missing = 131.42019512
WINE COOLERS, FIVE OR MORE AT ONE TIME
q26b Frequency Percent-----------------------------------------
Never drink this 897.9181 54.60Never 5+ at time 259.3272 15.77Every day 4.623055 0.28Several times/wk 24.09435 1.47Several times/mo 90.15211 5.48About once/month 114.1935 6.94< once/month 130.6916 7.95< once/year 123.6185 7.52
Frequency Missing = 156.38162105
WINE, FIVE OR MORE AT ONE TIME
q26c Frequency Percent-----------------------------------------Never drink this 911.1152 55.90
Never 5+ at time 290.0461 17.80Every day 3.230803 0.20Several times/wk 20.76147 1.27Several times/mo 65.24246 4.00About once/month 89.90887 5.52< once/month 95.40194 5.85< once/year 154.2193 9.46
Frequency Missing = 171.07376925
The frequencies have been weighted so that theanalysis reflects the distribution of students by grade
level in the district

8/14/2019 COMAL COUNTY - New Braunfels ISD - 2005 Texas School Survey of Drug and Alcohol Use
http://slidepdf.com/reader/full/comal-county-new-braunfels-isd-2005-texas-school-survey-of-drug-and-alcohol 101/114
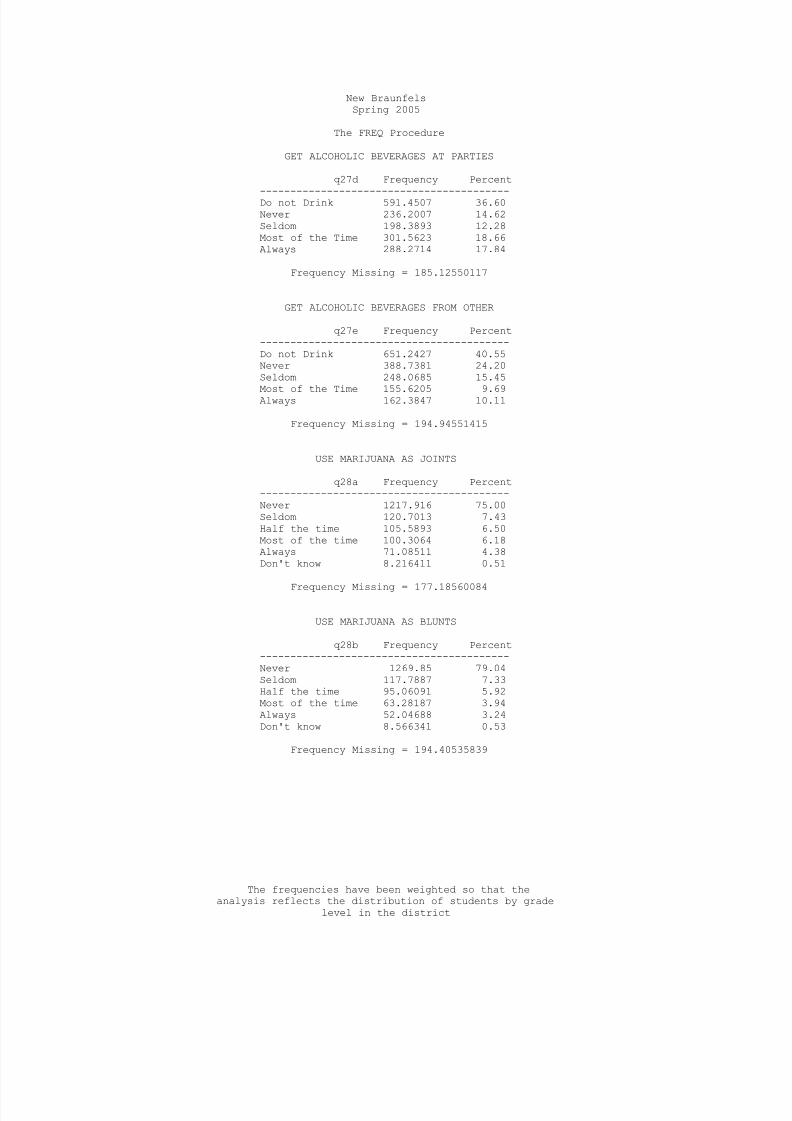
8/14/2019 COMAL COUNTY - New Braunfels ISD - 2005 Texas School Survey of Drug and Alcohol Use
http://slidepdf.com/reader/full/comal-county-new-braunfels-isd-2005-texas-school-survey-of-drug-and-alcohol 102/114
New BraunfelsSpring 2005
The FREQ Procedure
GET ALCOHOLIC BEVERAGES AT PARTIES
q27d Frequency Percent
-----------------------------------------Do not Drink 591.4507 36.60Never 236.2007 14.62Seldom 198.3893 12.28Most of the Time 301.5623 18.66Always 288.2714 17.84
Frequency Missing = 185.12550117
GET ALCOHOLIC BEVERAGES FROM OTHER
q27e Frequency Percent-----------------------------------------Do not Drink 651.2427 40.55Never 388.7381 24.20Seldom 248.0685 15.45
Most of the Time 155.6205 9.69Always 162.3847 10.11
Frequency Missing = 194.94551415
USE MARIJUANA AS JOINTS
q28a Frequency Percent-----------------------------------------Never 1217.916 75.00Seldom 120.7013 7.43Half the time 105.5893 6.50Most of the time 100.3064 6.18Always 71.08511 4.38Don't know 8.216411 0.51
Frequency Missing = 177.18560084
USE MARIJUANA AS BLUNTS
q28b Frequency Percent-----------------------------------------Never 1269.85 79.04Seldom 117.7887 7.33Half the time 95.06091 5.92Most of the time 63.28187 3.94Always 52.04688 3.24Don't know 8.566341 0.53
Frequency Missing = 194.40535839
The frequencies have been weighted so that theanalysis reflects the distribution of students by grade
level in the district
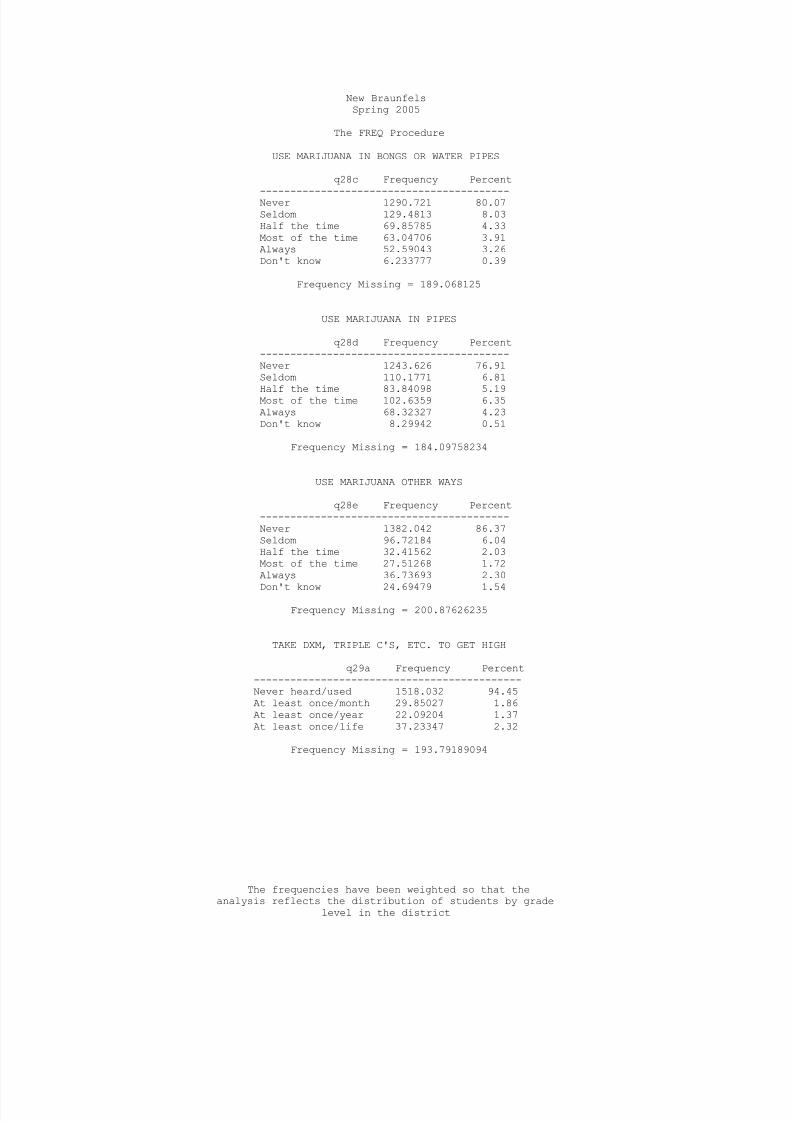
8/14/2019 COMAL COUNTY - New Braunfels ISD - 2005 Texas School Survey of Drug and Alcohol Use
http://slidepdf.com/reader/full/comal-county-new-braunfels-isd-2005-texas-school-survey-of-drug-and-alcohol 103/114
New BraunfelsSpring 2005
The FREQ Procedure
USE MARIJUANA IN BONGS OR WATER PIPES
q28c Frequency Percent
-----------------------------------------Never 1290.721 80.07Seldom 129.4813 8.03Half the time 69.85785 4.33Most of the time 63.04706 3.91Always 52.59043 3.26Don't know 6.233777 0.39
Frequency Missing = 189.068125
USE MARIJUANA IN PIPES
q28d Frequency Percent-----------------------------------------Never 1243.626 76.91Seldom 110.1771 6.81
Half the time 83.84098 5.19Most of the time 102.6359 6.35Always 68.32327 4.23Don't know 8.29942 0.51
Frequency Missing = 184.09758234
USE MARIJUANA OTHER WAYS
q28e Frequency Percent-----------------------------------------Never 1382.042 86.37Seldom 96.72184 6.04Half the time 32.41562 2.03Most of the time 27.51268 1.72Always 36.73693 2.30
Don't know 24.69479 1.54
Frequency Missing = 200.87626235
TAKE DXM, TRIPLE C'S, ETC. TO GET HIGH
q29a Frequency Percent--------------------------------------------Never heard/used 1518.032 94.45At least once/month 29.85027 1.86At least once/year 22.09204 1.37At least once/life 37.23347 2.32
Frequency Missing = 193.79189094
The frequencies have been weighted so that theanalysis reflects the distribution of students by grade
level in the district

8/14/2019 COMAL COUNTY - New Braunfels ISD - 2005 Texas School Survey of Drug and Alcohol Use
http://slidepdf.com/reader/full/comal-county-new-braunfels-isd-2005-texas-school-survey-of-drug-and-alcohol 104/114
New BraunfelsSpring 2005
The FREQ Procedure
TAKE CODEINE COUGH SYRUP TO GET HIGH
q29b Frequency Percent
--------------------------------------------Never heard/used 1460.273 90.59At least once/month 58.58721 3.63At least once/year 39.76862 2.47At least once/life 53.34799 3.31
Frequency Missing = 189.02311837
DANGEROUS FOR KIDS TO USE TOBACCO
q30a Frequency Percent-----------------------------------Very 697.3044 43.50Somewhat 481.1268 30.02Not very 269.6574 16.82Not at all 62.09275 3.87
Don't know 92.73266 5.79Frequency Missing = 198.08599754
DANGEROUS FOR KIDS TO USE ALCOHOL
q30b Frequency Percent-----------------------------------Very 708.1528 44.67Somewhat 517.6197 32.65Not very 235.8189 14.87Not at all 62.97619 3.97Don't know 60.80265 3.84
Frequency Missing = 215.62975801
DANGEROUS FOR KIDS TO USE INHALANTS
q30c Frequency Percent-----------------------------------Very 1139.571 73.47Somewhat 269.8318 17.40Not very 43.7472 2.82Not at all 19.48533 1.26Don't know 78.43045 5.06
Frequency Missing = 249.93421835
The frequencies have been weighted so that theanalysis reflects the distribution of students by grade
level in the district

8/14/2019 COMAL COUNTY - New Braunfels ISD - 2005 Texas School Survey of Drug and Alcohol Use
http://slidepdf.com/reader/full/comal-county-new-braunfels-isd-2005-texas-school-survey-of-drug-and-alcohol 105/114
New BraunfelsSpring 2005
The FREQ Procedure
DANGEROUS FOR KIDS TO USE MARIJUANA
q30d Frequency Percent
-----------------------------------Very 876.6711 56.50Somewhat 291.6468 18.79Not very 195.8635 12.62Not at all 122.1725 7.87Don't know 65.37338 4.21
Frequency Missing = 249.27277306
DANGEROUS FOR KIDS TO USE COCAINE
q30e Frequency Percent-----------------------------------Very 1274.104 83.00Somewhat 146.783 9.56Not very 26.6574 1.74
Not at all 16.59808 1.08Don't know 70.88247 4.62
Frequency Missing = 265.9751905
DANGEROUS FOR KIDS TO USE CRACK
q30f Frequency Percent-----------------------------------Very 1278.845 83.26Somewhat 133.4753 8.69Not very 25.64548 1.67Not at all 14.02818 0.91Don't know 83.92317 5.46
Frequency Missing = 265.08251591
DANGEROUS FOR KIDS TO USE ECSTASY
q30g Frequency Percent-----------------------------------Very 1264.41 82.11Somewhat 129.2277 8.39Not very 27.06406 1.76Not at all 18.4819 1.20Don't know 100.6723 6.54
Frequency Missing = 261.1443066
The frequencies have been weighted so that theanalysis reflects the distribution of students by grade
level in the district

8/14/2019 COMAL COUNTY - New Braunfels ISD - 2005 Texas School Survey of Drug and Alcohol Use
http://slidepdf.com/reader/full/comal-county-new-braunfels-isd-2005-texas-school-survey-of-drug-and-alcohol 106/114
New BraunfelsSpring 2005
The FREQ Procedure
DANGEROUS FOR KIDS TO USE STEROIDS
q30h Frequency Percent
-----------------------------------Very 1144.818 72.67Somewhat 234.4916 14.89Not very 67.65512 4.29Not at all 23.61662 1.50Don't know 104.7226 6.65
Frequency Missing = 225.69647445
DANGEROUS FOR KIDS TO USE HEROIN
q30i Frequency Percent-----------------------------------Very 1388.035 86.60Somewhat 83.35624 5.20Not very 16.20615 1.01
Not at all 17.08863 1.07Don't know 98.05912 6.12
Frequency Missing = 198.25477875
DAYS SKIPPED SINCE SEPTEMBER
q31a Frequency Percent---------------------------------None 1053.732 64.531-3 days 399.4958 24.464-9 days 134.1917 8.2210+ days 45.54732 2.79
Frequency Missing = 168.03342857
DAYS ILL SINCE SEPTEMBER
q31b Frequency Percent---------------------------------None 357.7955 21.761-3 days 885.7633 53.874-9 days 316.6086 19.2610+ days 84.07938 5.11
Frequency Missing = 156.75316392
OTHER DAYS MISSED SINCE SEPTEMBER
q31c Frequency Percent---------------------------------
None 554.6654 34.191-3 days 875.7285 53.984-9 days 141.0843 8.7010+ days 50.88415 3.14
Frequency Missing = 178.63765305
The frequencies have been weighted so that theanalysis reflects the distribution of students by grade
level in the district
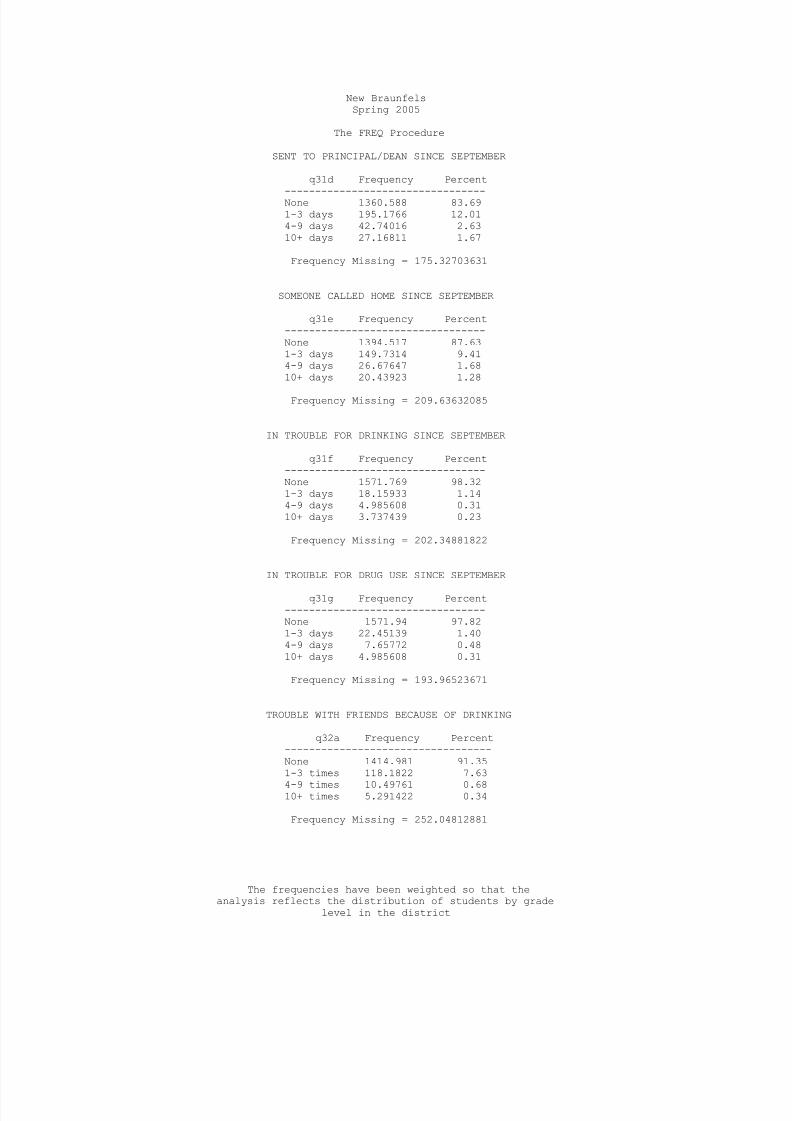
8/14/2019 COMAL COUNTY - New Braunfels ISD - 2005 Texas School Survey of Drug and Alcohol Use
http://slidepdf.com/reader/full/comal-county-new-braunfels-isd-2005-texas-school-survey-of-drug-and-alcohol 107/114
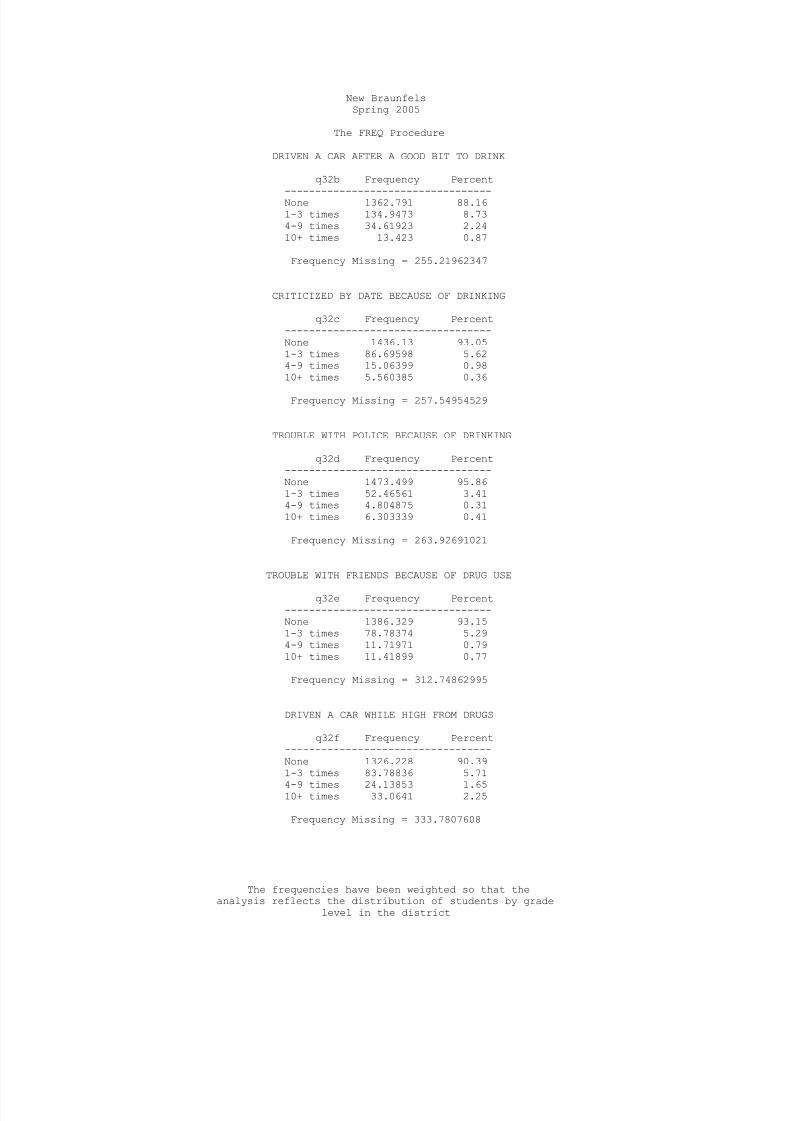
8/14/2019 COMAL COUNTY - New Braunfels ISD - 2005 Texas School Survey of Drug and Alcohol Use
http://slidepdf.com/reader/full/comal-county-new-braunfels-isd-2005-texas-school-survey-of-drug-and-alcohol 108/114
New BraunfelsSpring 2005
The FREQ Procedure
DRIVEN A CAR AFTER A GOOD BIT TO DRINK
q32b Frequency Percent
----------------------------------None 1362.791 88.161-3 times 134.9473 8.734-9 times 34.61923 2.2410+ times 13.423 0.87
Frequency Missing = 255.21962347
CRITICIZED BY DATE BECAUSE OF DRINKING
q32c Frequency Percent----------------------------------None 1436.13 93.051-3 times 86.69598 5.624-9 times 15.06399 0.9810+ times 5.560385 0.36
Frequency Missing = 257.54954529
TROUBLE WITH POLICE BECAUSE OF DRINKING
q32d Frequency Percent----------------------------------None 1473.499 95.861-3 times 52.46561 3.414-9 times 4.804875 0.3110+ times 6.303339 0.41
Frequency Missing = 263.92691021
TROUBLE WITH FRIENDS BECAUSE OF DRUG USE
q32e Frequency Percent----------------------------------None 1386.329 93.151-3 times 78.78374 5.294-9 times 11.71971 0.7910+ times 11.41899 0.77
Frequency Missing = 312.74862995
DRIVEN A CAR WHILE HIGH FROM DRUGS
q32f Frequency Percent----------------------------------None 1326.228 90.391-3 times 83.78836 5.71
4-9 times 24.13853 1.6510+ times 33.0641 2.25
Frequency Missing = 333.7807608
The frequencies have been weighted so that theanalysis reflects the distribution of students by grade
level in the district

8/14/2019 COMAL COUNTY - New Braunfels ISD - 2005 Texas School Survey of Drug and Alcohol Use
http://slidepdf.com/reader/full/comal-county-new-braunfels-isd-2005-texas-school-survey-of-drug-and-alcohol 109/114
New BraunfelsSpring 2005
The FREQ Procedure
CRITICIZED BY DATE BECAUSE OF DRUG USE
q32g Frequency Percent
----------------------------------None 1410.029 94.271-3 times 70.57928 4.724-9 times 4.1756 0.2810+ times 11.01354 0.74
Frequency Missing = 305.20208109
TROUBLE WITH POLICE BECAUSE OF DRUG USE
q32h Frequency Percent----------------------------------None 1488.145 96.431-3 times 36.95547 2.394-9 times 5.729583 0.3710+ times 12.4309 0.81
Frequency Missing = 257.73855367
CLASS DAYS DRUNK ON ALCOHOL SINCE SEPT
q33a Frequency Percent---------------------------------None 1451.71 90.861-3 days 111.3978 6.974-9 days 20.54979 1.2910+ days 14.06986 0.88
Frequency Missing = 203.2721212
CLASS DAYS HIGH ON MARIJUANA SINCE SEPT
q33b Frequency Percent---------------------------------None 1406.421 88.541-3 days 105.8498 6.664-9 days 27.08803 1.7110+ days 49.1113 3.09
Frequency Missing = 212.53037989
CLASS DAYS HIGH ON INHALANTS SINCE SEPT
q33c Frequency Percent---------------------------------None 1536.214 96.821-3 days 40.10055 2.53
4-9 days 7.506173 0.4710+ days 2.907342 0.18
Frequency Missing = 214.27201174
The frequencies have been weighted so that theanalysis reflects the distribution of students by grade
level in the district

8/14/2019 COMAL COUNTY - New Braunfels ISD - 2005 Texas School Survey of Drug and Alcohol Use
http://slidepdf.com/reader/full/comal-county-new-braunfels-isd-2005-texas-school-survey-of-drug-and-alcohol 110/114
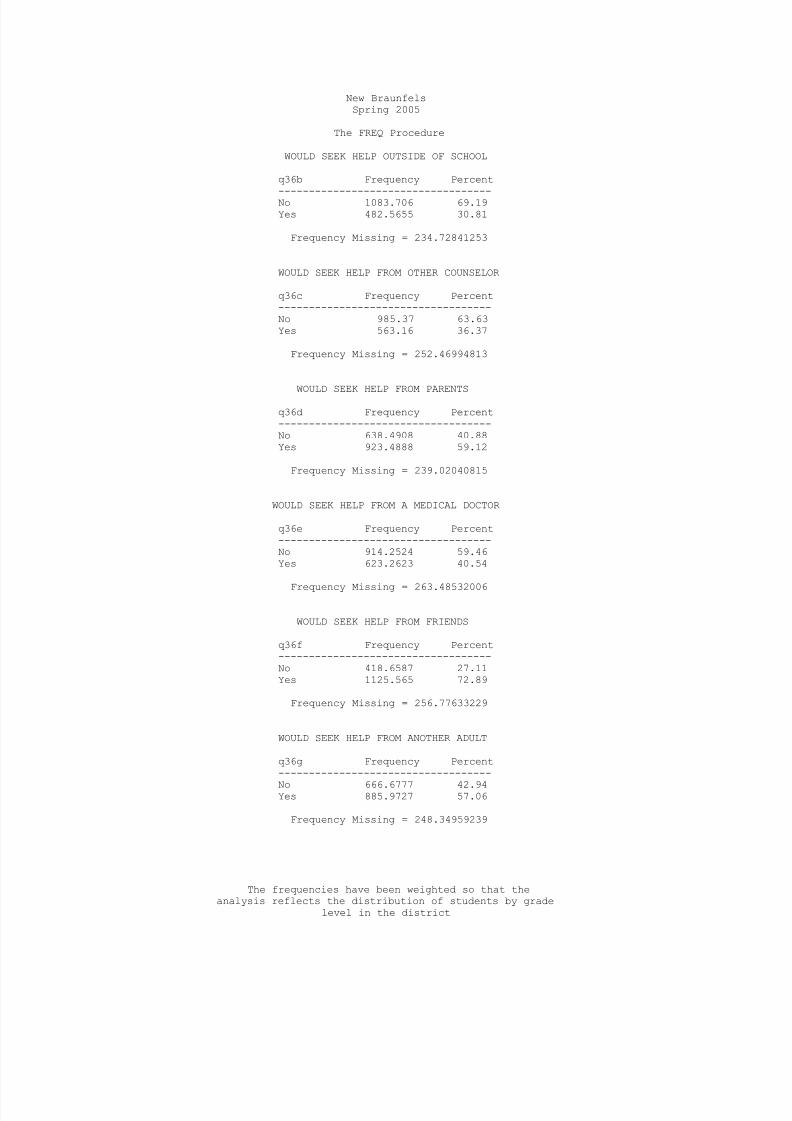
8/14/2019 COMAL COUNTY - New Braunfels ISD - 2005 Texas School Survey of Drug and Alcohol Use
http://slidepdf.com/reader/full/comal-county-new-braunfels-isd-2005-texas-school-survey-of-drug-and-alcohol 111/114
New BraunfelsSpring 2005
The FREQ Procedure
WOULD SEEK HELP OUTSIDE OF SCHOOL
q36b Frequency Percent
-----------------------------------No 1083.706 69.19Yes 482.5655 30.81
Frequency Missing = 234.72841253
WOULD SEEK HELP FROM OTHER COUNSELOR
q36c Frequency Percent-----------------------------------No 985.37 63.63Yes 563.16 36.37
Frequency Missing = 252.46994813
WOULD SEEK HELP FROM PARENTS q36d Frequency Percent-----------------------------------No 638.4908 40.88Yes 923.4888 59.12
Frequency Missing = 239.02040815
WOULD SEEK HELP FROM A MEDICAL DOCTOR
q36e Frequency Percent-----------------------------------No 914.2524 59.46Yes 623.2623 40.54
Frequency Missing = 263.48532006
WOULD SEEK HELP FROM FRIENDS
q36f Frequency Percent-----------------------------------No 418.6587 27.11Yes 1125.565 72.89
Frequency Missing = 256.77633229
WOULD SEEK HELP FROM ANOTHER ADULT
q36g Frequency Percent-----------------------------------
No 666.6777 42.94Yes 885.9727 57.06
Frequency Missing = 248.34959239
The frequencies have been weighted so that theanalysis reflects the distribution of students by grade
level in the district
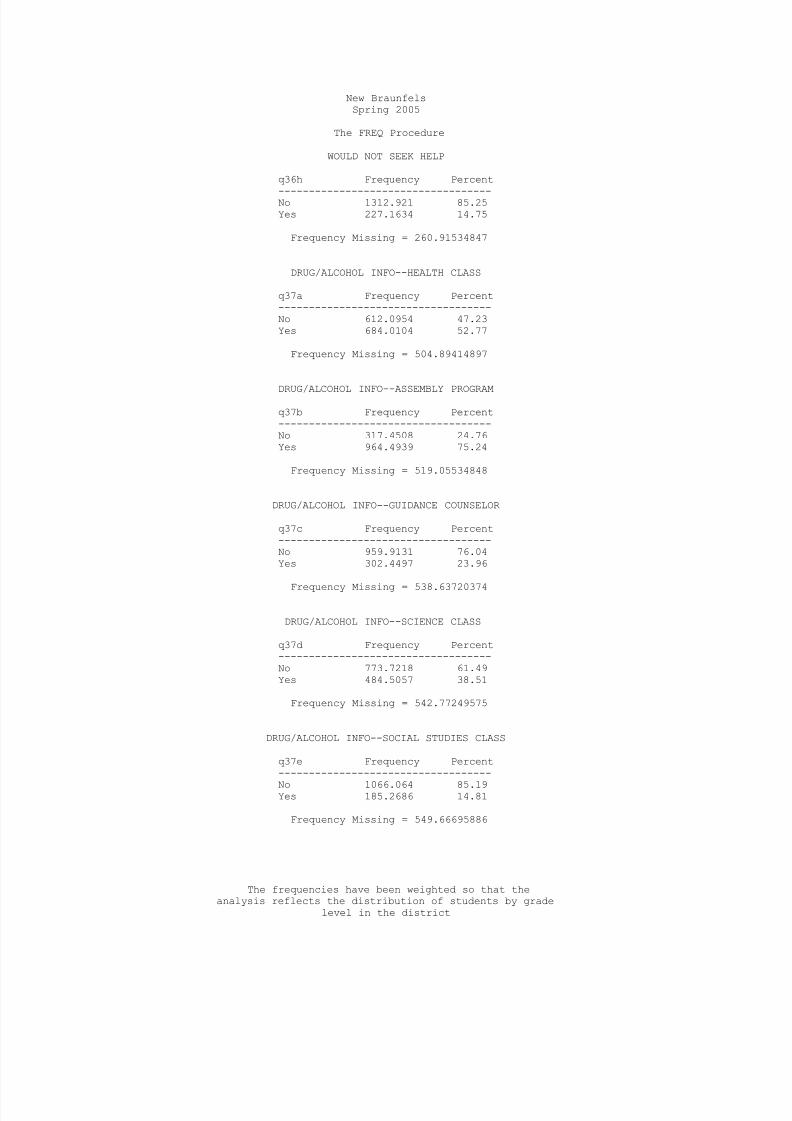
8/14/2019 COMAL COUNTY - New Braunfels ISD - 2005 Texas School Survey of Drug and Alcohol Use
http://slidepdf.com/reader/full/comal-county-new-braunfels-isd-2005-texas-school-survey-of-drug-and-alcohol 112/114
New BraunfelsSpring 2005
The FREQ Procedure
WOULD NOT SEEK HELP
q36h Frequency Percent
-----------------------------------No 1312.921 85.25Yes 227.1634 14.75
Frequency Missing = 260.91534847
DRUG/ALCOHOL INFO--HEALTH CLASS
q37a Frequency Percent-----------------------------------No 612.0954 47.23Yes 684.0104 52.77
Frequency Missing = 504.89414897
DRUG/ALCOHOL INFO--ASSEMBLY PROGRAM q37b Frequency Percent-----------------------------------No 317.4508 24.76Yes 964.4939 75.24
Frequency Missing = 519.05534848
DRUG/ALCOHOL INFO--GUIDANCE COUNSELOR
q37c Frequency Percent-----------------------------------No 959.9131 76.04Yes 302.4497 23.96
Frequency Missing = 538.63720374
DRUG/ALCOHOL INFO--SCIENCE CLASS
q37d Frequency Percent-----------------------------------No 773.7218 61.49Yes 484.5057 38.51
Frequency Missing = 542.77249575
DRUG/ALCOHOL INFO--SOCIAL STUDIES CLASS
q37e Frequency Percent-----------------------------------
No 1066.064 85.19Yes 185.2686 14.81
Frequency Missing = 549.66695886
The frequencies have been weighted so that theanalysis reflects the distribution of students by grade
level in the district

8/14/2019 COMAL COUNTY - New Braunfels ISD - 2005 Texas School Survey of Drug and Alcohol Use
http://slidepdf.com/reader/full/comal-county-new-braunfels-isd-2005-texas-school-survey-of-drug-and-alcohol 113/114
New BraunfelsSpring 2005
The FREQ Procedure
DRUG/ALCOHOL INFO--DRUG RAP SESSION
q37f Frequency Percent
-----------------------------------No 1055.059 83.15Yes 213.7785 16.85
Frequency Missing = 532.16269299
DRUG/ALCOHOL INFO--INVITED SCHOOL GUEST
q37g Frequency Percent-----------------------------------No 597.0362 46.94Yes 674.8682 53.06
Frequency Missing = 529.09558415
DRUG/ALCOHOL INFO--OTHER SCHOOL SOURCE q37h Frequency Percent-----------------------------------No 776.7922 61.72Yes 481.72 38.28
Frequency Missing = 542.48777992
PARENTS FEEL ABOUT KIDS SMOKING CIGARET
q38a Frequency Percent------------------------------------------Strong disapprove 1088.602 69.69Mild disapprove 197.5559 12.65Neither 124.8029 7.99
Mildly approve 25.03595 1.60Strongly approve 22.80674 1.46Don't know 103.2074 6.61
Frequency Missing = 238.98865146
PARENTS FEEL ABOUT KIDS DRINKING BEER
q38b Frequency Percent------------------------------------------Strong disapprove 887.0817 57.15Mild disapprove 276.602 17.82Neither 193.5672 12.47Mildly approve 66.10438 4.26Strongly approve 32.40509 2.09Don't know 96.3712 6.21
Frequency Missing = 248.86845158
The frequencies have been weighted so that theanalysis reflects the distribution of students by grade
level in the district
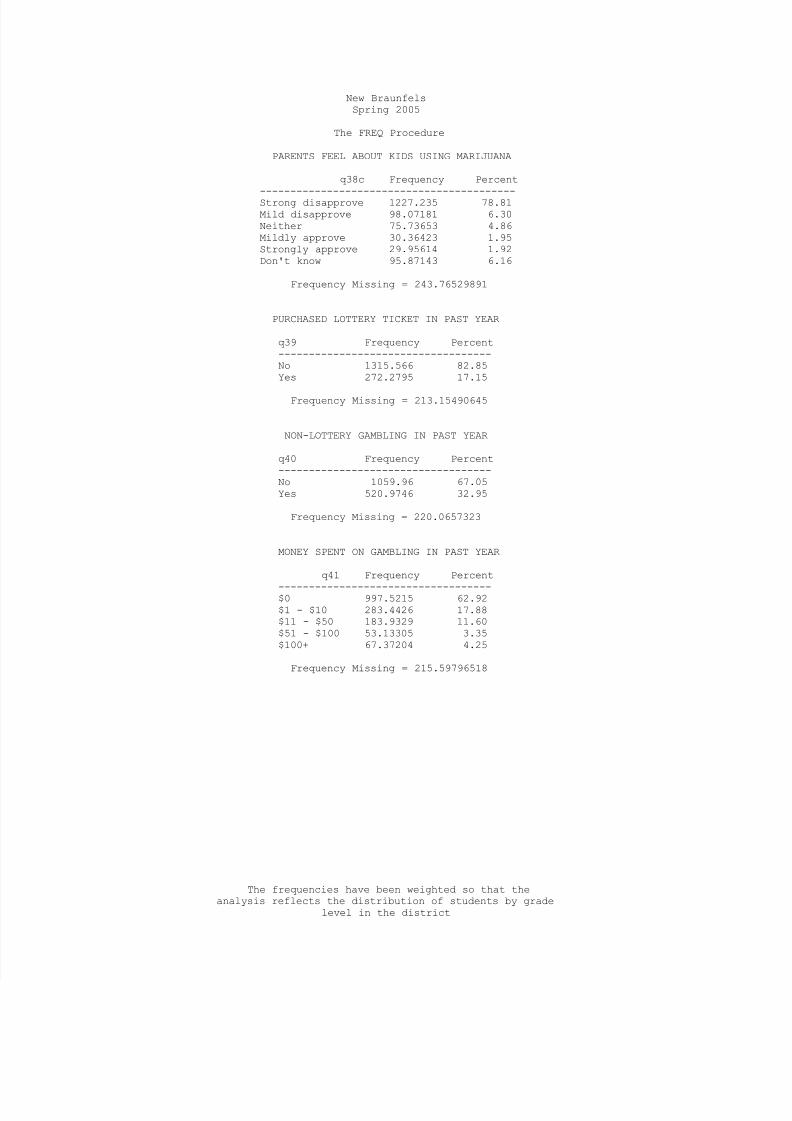
8/14/2019 COMAL COUNTY - New Braunfels ISD - 2005 Texas School Survey of Drug and Alcohol Use
http://slidepdf.com/reader/full/comal-county-new-braunfels-isd-2005-texas-school-survey-of-drug-and-alcohol 114/114
New BraunfelsSpring 2005
The FREQ Procedure
PARENTS FEEL ABOUT KIDS USING MARIJUANA
q38c Frequency Percent
------------------------------------------Strong disapprove 1227.235 78.81Mild disapprove 98.07181 6.30Neither 75.73653 4.86Mildly approve 30.36423 1.95Strongly approve 29.95614 1.92Don't know 95.87143 6.16
Frequency Missing = 243.76529891
PURCHASED LOTTERY TICKET IN PAST YEAR
q39 Frequency Percent-----------------------------------No 1315.566 82.85Yes 272.2795 17.15
Frequency Missing = 213.15490645
NON-LOTTERY GAMBLING IN PAST YEAR
q40 Frequency Percent-----------------------------------No 1059.96 67.05Yes 520.9746 32.95
Frequency Missing = 220.0657323
MONEY SPENT ON GAMBLING IN PAST YEAR
q41 Frequency Percent
-----------------------------------$0 997.5215 62.92$1 - $10 283.4426 17.88$11 - $50 183.9329 11.60$51 - $100 53.13305 3.35$100+ 67.37204 4.25