combined use of spaceborne optical and sar data incompatible
TRANSCRIPT

TS 1H - Developments in Scanner and Sensor Technologies
Charalabos Ioannidis and Dimitra Vassilaki
Combined use of spaceborne optical and SAR data – Incompatible data sources or a useful procedure?
Integrating Generations
FIG Working Week 2008
Stockholm, Sweden 14-19 June 2008
1/17
Combined use of Spaceborne Optical and SAR Data
– Incompatible Data Sources or a Useful Procedure?
Charalabos IOANNIDIS and Dimitra VASSILAKI, Greece
Key words: Photogrammetry, SAR, Optical satellite data, Data fusion, Orthoimage, Change
detection
SUMMARY
In the recent years there is an increasing interest for high resolution satellite data to be used in
a variety of applications, some of which referring to extracting geometric object information
and mapping. The spatial resolution of spaceborne optical data is by now less than 1m in
panchromatic image; rigorous orientation and georeferencing models have been developed,
giving products (orthoimages, DTMs) of accuracies better than 1 pixel of the data. At the
same time, the interest on Synthetic Aperture Radar (SAR) sensors and related processing
techniques was increased, too. SAR is considered to be unique among the remote sensing
systems, as it is all-weather, independent of time of day, and it is able to penetrate into the
objects. New SAR sensors have unprecedented resolution, equivalent to optical data, and they
introduce the concept of SAR sensors constellation. Only last year, six SAR systems were
launched. SAR and optical data have differences and similarities at the same time. In the past
they were considered exclusive, but today they are considered to complement rather than
compete with each other. This concept is illustrated with cooperation of optical and SAR
satellites, as well as with scientific studies
.
In this paper, the available optical and SAR spaceborne systems are presented, focusing on
their properties, the methods for processing them, the applications and the ways in which they
can be combined or integrated for high quality surveying of earth's surface. Optical and SAR
data can be used in sequence, in parallel and auxiliary. When processing data in sequence, the
output products of the one set are used as input data for processing the other data set, e.g., for
fully automated procedures without using external data etc. When processing data in parallel
both data sets are independently processed and then the extracted information superimposed
for presentation purposes. There are various possible uses, e.g., for coastal zone management
where different kind of information are required and some of them can only be extracted from
optical imagery while others can only be extracted from SAR data and others from both of
them. When processing data auxiliary, the products of the one set are treated as
complementary information for the products that comes out from the other set. Information
that is not possible to be extracted from the one data set or it is extracted incomplete is then
extracted/completed by the other set, e.g., improvement of DEM with optical and microwave
data fusion.

TS 1H - Developments in Scanner and Sensor Technologies
Charalabos Ioannidis and Dimitra Vassilaki
Combined use of spaceborne optical and SAR data – Incompatible data sources or a useful procedure?
Integrating Generations
FIG Working Week 2008
Stockholm, Sweden 14-19 June 2008
2/17
Combined use of Spaceborne Optical and SAR Data – Incompatible Data
Sources or a Useful Procedure?
Charalabos IOANNIDIS and Dimitra VASSILAKI, Greece
1. INTRODUCTION
The use of SAR data and optical satellite images for remote sensing applications already
counts a longer than three decades‟ history. In the first years the low resolution of images and
the limited processing capabilities combined with the need for implementation of rigorous
mathematical models had restricted the use and the application range of such data. However,
in the recent years the situation has changed and the interest for high resolution satellite data
to be used in a variety of applications has increased significantly. Applications requiring the
existence of high accuracy geometric products and mapping using photogrammetric
procedures (orthoimages or restitutions) have been added to the everyday use of spaceborne
data.
This has resulted to an increase of optical satellites providing a variety of choices, even for
very high resolution data, with Ground Sample Distance (GSD) less than 2.5m.
Simultaneously, new rigorous models were developed for image georeferencing which
increased even more the automation in processes and the accuracy of the final products.
However, weaknesses and needs still exist. High accuracy products are directly dependent on
the use of ground control points (GCPs); improvement of feature extraction procedures and
change detection results are also some of the needs.
Spaceborne radar systems which provide relatively high spatial resolution were not so rapidly
developed; their highest resolution reached 15m, making the application range limited.
Recently, this situation has changed; only during last year six SAR systems were launched,
equipped with sensors which provide images of a resolution of a few meters or even of 1m.
Consequently, a new range of applications was possible and photogrammetric techniques
were introduced in the processing of such data; radargrammetry modules are integrated into
Digital Photogrammetric Workstation software (e.g., ERDAS, ENVI, etc).
In this environment attempts for a combined use of optical and SAR data are of special
interest. The significant differences between the characteristics of those two data sources do
not encourage their combined use. However, in both cases the data can be images (either as
initial data or derived after a processing), which show the characteristics of objects
differently; so finally, their combined use may provide with more information and better
results in particular applications. Advantages of the combined use of radar and optical satellite
data have been emphasized in Bignami et al, 2004; Stramondo et al, 2006 and elsewhere,
while the results of some applications for change detection (Orsomando et al, 2007), features
extraction (Soergel et al, 2007; Tupin & Roux, 2003; Stilla et al, 2005), orthoimage
production (Cheng, 2007), coastal zone management (Raouf & Lichtenegger, 1997), etc have
been published.
TS 1H - Developments in Scanner and Sensor Technologies
Charalabos Ioannidis and Dimitra Vassilaki
Combined use of spaceborne optical and SAR data – Incompatible data sources or a useful procedure?
Integrating Generations
FIG Working Week 2008
Stockholm, Sweden 14-19 June 2008
3/17
In the following, a brief review of the high resolution satellite sensors is given focusing on the
methods for processing their data, with an emphasis on SAR, whose capabilities and
applications are less known. Integrated and combined uses of optical and SAR data are
presented, together with their capabilities and future perspectives.
2. HIGH RESOLUTION OPTICAL SATELLITES
Since 1999, when IKONOS was launched, the capabilities and range of applications of optical
satellite sensors data have changed. The satellite images become more and more useful for
photogrammetric purposes. The latest generations of high resolution optical satellite sensors
are pushbroom scanners and they have the ability to acquire stereo pair imagery along track
direction. Using array detectors, which are arranged in a focal plane along a line, they can
collect images with very high stability.
Governmental agencies of more than 10 countries and private companies worldwide have
placed in orbit, or are planning to do so, high resolution commercial satellites. Already in
FORMOSAT, ROCSat (Taiwan), IRS-P5 (India) with 2-2.5m resolution in panchromatic
band, and IKONOS, QuickBird II, EROS-B (Israel), CartoSat2 (India), Kompsat-2 (Korea)
with 0.6-1m GSD, WorldView-1 (launched in September 2007 - orbit altitude 496km, period
94.6min) with 50cm GSD at nadir and 59cm GSD at 25o off-nadir, suitable for precise
mapping, change detection and in-depth image analysis was added. It has 17.6km width swath
and expected accuracies of 4-6.5m without GCPs. (http://www.digitalglobe.com/about/
worldview1.html). Similar or even better results are expected from GeoEye-1, which has an
estimated launch date early second quarter 2008; its sensor has 0.41m (resampled to 0.5m)
image resolution in panchromatic and 1.65m in multispectral imagery, while the accuracies of
the products will be of the size of 3m, according to the estimations given by the company
which will operate it. (http://www.geoeye.com/products/imagery/geoeye1/ default.htm).
Most of these satellites provide the necessary parameters for photogrammetric processing,
like the interior orientation parameters of the camera, which is carried in the satellite system,
and orbital data. According to the application (accuracy specifications, existence of GCPs),
the provided metadata for the particular sensor and the processing software, the appropriate
mathematical model is selected:
- Simple sensor model. For satellite sensors with a narrow field of view, like IKONOS,
simple sensor models can be used, such as the 2D or 3D affine transformation, DLT
(Baltsavias et al, 2001; Yamakawa & Fraser, 2004). Their validity and performance is
expected to deteriorate with increasing area size, rotation of the satellite during imaging,
poor GCP distribution or mountainous terrain.
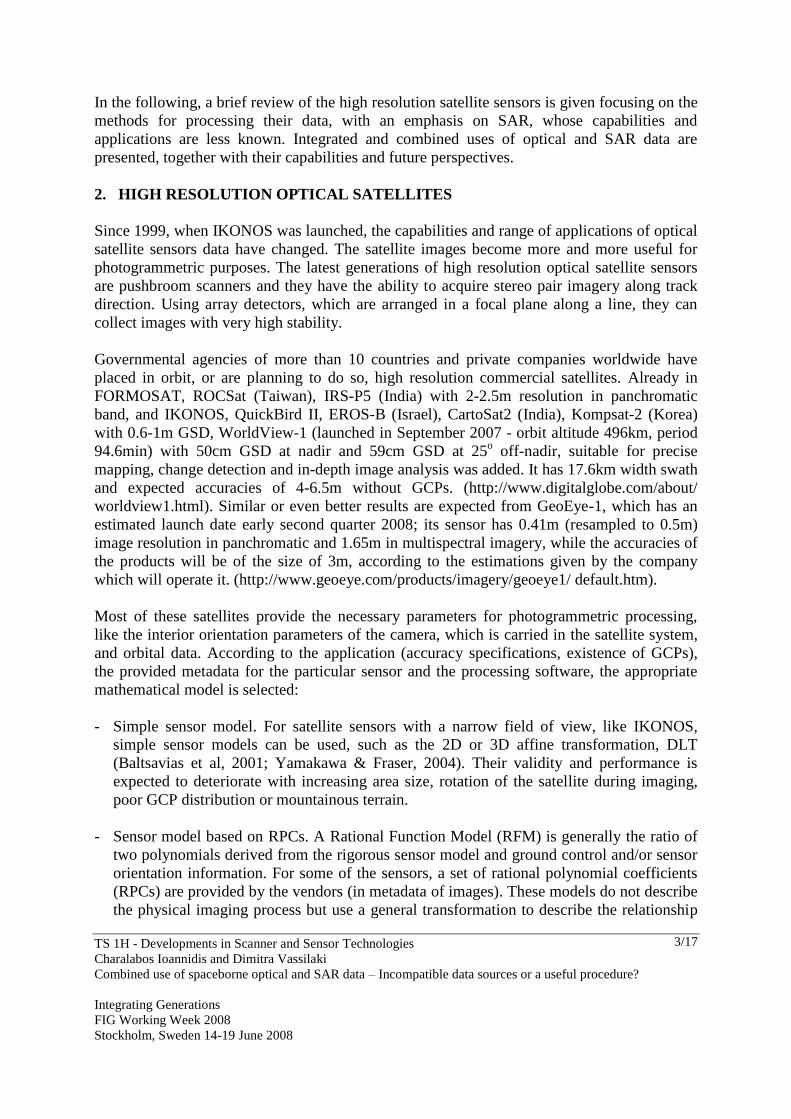
- Sensor model based on RPCs. A Rational Function Model (RFM) is generally the ratio of
two polynomials derived from the rigorous sensor model and ground control and/or sensor
orientation information. For some of the sensors, a set of rational polynomial coefficients
(RPCs) are provided by the vendors (in metadata of images). These models do not describe
the physical imaging process but use a general transformation to describe the relationship

TS 1H - Developments in Scanner and Sensor Technologies
Charalabos Ioannidis and Dimitra Vassilaki
Combined use of spaceborne optical and SAR data – Incompatible data sources or a useful procedure?
Integrating Generations
FIG Working Week 2008
Stockholm, Sweden 14-19 June 2008
4/17
between image and ground coordinates. It has been shown that no loss in accuracy is to be
expected when RPCs are used for georeferencing, as long as a few GCPs will be used for
the elimination of systematic errors (Fraser & Hanley, 2003). Two translations are
sufficient with IKONOS, while QuickBird exhibits more nonlinearities and requires a
higher order transformation.
- Rigorous sensor model. Many models that are closely related to the physical reality of the
imaging process (nearly parallel projection in along track and perspective projection across
track) have been developed for geometric correction and georeferencing of satellite
images. These models can achieve high accuracies, but their efficiency depends on sensor
type and they are mathematically complicated, while some of the involved parameters
(especially in the interior orientation) are highly correlated. Several models have been
proposed, trying to model the platform orbits and attitudes, using different corrections of
systematic errors and attempting to overcome the incompatibility of formats and
definitions of the metadata provided by the different sensors (Tao et al, 2000; Fritsch &
Stallmann, 2002; Dowman & Michalis, 2003; Baiocchi et al, 2004; Weser et al, 2007). In
all cases the mathematical model is the collinearity equations, including internal and
external orientation modeling, combined with orbit determination-propagation models. The
internal orientation parameters are focal length, principal point displacements, line
curvature, line rate, lens distortion etc; some or even all these parameters are not always
involved in the model.
Due to the above characteristics, the optical sensors imagery is no longer used only in
traditional remote sensing applications (e.g., classification) but in mapping as well, and also in
more specified applications, like building modeling (Baltsavias et al, 2001), change detection,
etc, with a further perspective. The high revisit frequency (of a few days for each satellite)
and the great number of high resolution optical satellites which are scheduled for the near
future (e.g., DigitalGlobe has scheduled to put in orbit three satellites in the coming months),
will allow recording and monitoring of phenomena and human activities (e.g., constructions)
which are developed rather quickly (change detection, urban damage mapping, forest fire
damage assessment, etc).
Under such circumstances, the need for automatic procedures and reliable results are
increased. For example, orthoimage is the most common mapping product derived from
optical satellite imagery. However the need for GSPs, in order to achieve high accuracies, and
the accompanying manual measurements of their image coordinates, increase the cost and
restrict the automation of the whole procedure. Only the combined use of directly
georeferenced data, derived from other sources, may lead to fully automated procedures,
which are necessary in same mapping or monitoring applications. Also, in applications like
feature extraction and change detection the characteristics of the optical data may be a burden,
since their efficiency and accuracy are limited by the optical resolution, or by the capability,
accuracy and reliability of image matching in automatic procedures. Their combination with
data derived from other sources may increase the rates of success.

TS 1H - Developments in Scanner and Sensor Technologies
Charalabos Ioannidis and Dimitra Vassilaki
Combined use of spaceborne optical and SAR data – Incompatible data sources or a useful procedure?
Integrating Generations
FIG Working Week 2008
Stockholm, Sweden 14-19 June 2008
5/17
After all, despite the increase of satellites in number, the purchase costs of imagery, especially
of the high resolution stereopairs, is still very high, e.g., compared with the cost of airborne
photos; and, unfortunately this is something that is not likely to change in the near future.
3. SYNTHETIC APERTURE RADAR (SAR)
3.1 Operational principles
SAR is an active microwave imaging sensor. It captures earth's images providing its own
microwave illumination and it offers the capability of day and night operation, regardless of
weather conditions. SAR is not dependent on the visible, optical, part of electromagnetic
spectrum. It can not measure true optical colors. Instead, it measures the strength and the time
delay of the returning signal. SAR sensors consist of two instruments, the radar and the
processor. The radar takes the measurements and the processor does the processing of the data
collected by the radar. These two instruments are often independent to each other. The radar is
mounted on a platform while the processor is somewhere on earth's surface.
The most prominent feature of SAR's radar is its oblong antenna, about 10 m in length and 2m
in width for spaceborne systems. The antenna is fixed on a platform and scans a swath
adjacent to platform's flight line, with side-looking geometry (Figure 3-1 left). The space-
borne platform moves with about 7 Km/sec and the antenna transmits about 1,500 pulses/sec
downwardly towards the area of interest (Figure 3-1 middle). The transmitted pulses reach
targets and they interact with them in several ways. Part of the transmitted energy is reflected
and returns to the antenna as a weaker radar echo (Figure 3-1 right). The amplitude and the
phase of the backscattered signals are then recorded.
Figure 3-1: Left: Imaging geometry of a SAR system. Middle: Pulse transmission. Right: Pulse
reflection (source: http://southport.jpl.nasa.gov)
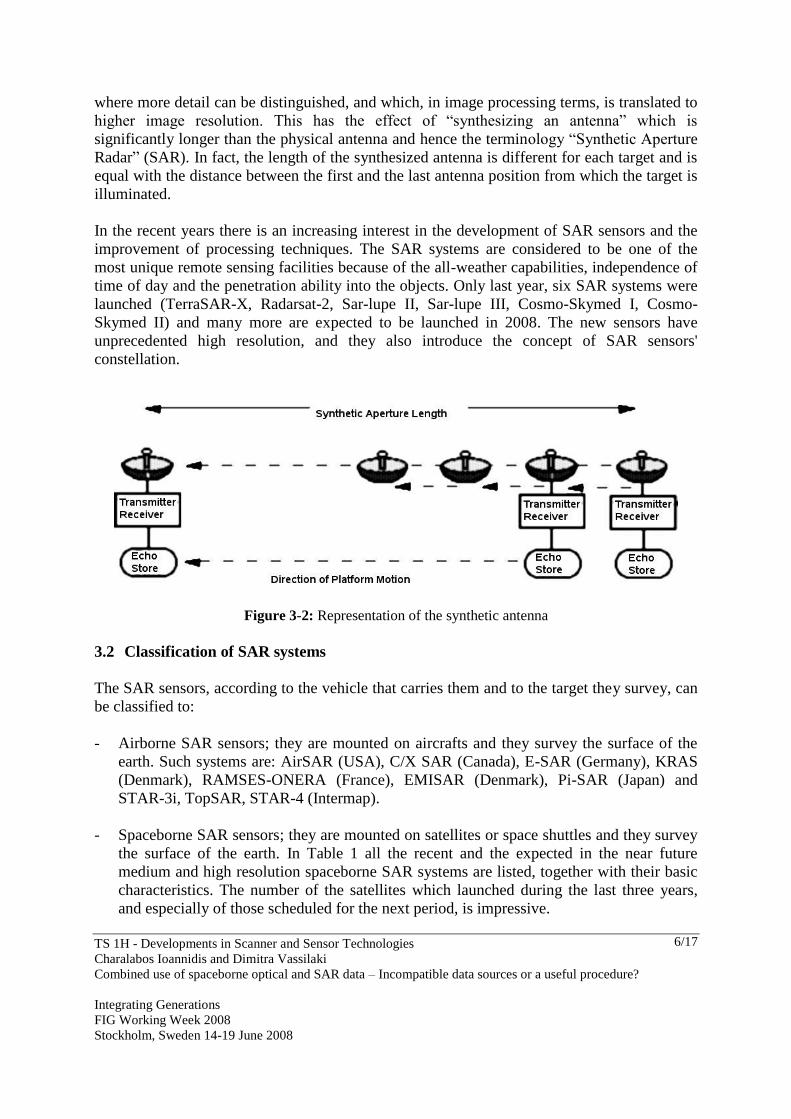
As the platform moves forward, the radar transmits and receives many pulses from the same
target which are combined into a stronger signal (Figure 3-2). Due to platform's movement a
phase variation occurs to target's backscattered signals, as the distance between the target and
the antenna varies. The differences in phases are corrected through signal processing and then
the backscattered signals are added. The addition is based on coherence, a property of waves
which enables them to be correlated. The added signals result in a much more focused image
TS 1H - Developments in Scanner and Sensor Technologies
Charalabos Ioannidis and Dimitra Vassilaki
Combined use of spaceborne optical and SAR data – Incompatible data sources or a useful procedure?
Integrating Generations
FIG Working Week 2008
Stockholm, Sweden 14-19 June 2008
6/17
where more detail can be distinguished, and which, in image processing terms, is translated to
higher image resolution. This has the effect of “synthesizing an antenna” which is
significantly longer than the physical antenna and hence the terminology “Synthetic Aperture
Radar” (SAR). In fact, the length of the synthesized antenna is different for each target and is
equal with the distance between the first and the last antenna position from which the target is
illuminated.
In the recent years there is an increasing interest in the development of SAR sensors and the
improvement of processing techniques. The SAR systems are considered to be one of the
most unique remote sensing facilities because of the all-weather capabilities, independence of
time of day and the penetration ability into the objects. Only last year, six SAR systems were
launched (TerraSAR-X, Radarsat-2, Sar-lupe II, Sar-lupe III, Cosmo-Skymed I, Cosmo-
Skymed II) and many more are expected to be launched in 2008. The new sensors have
unprecedented high resolution, and they also introduce the concept of SAR sensors'
constellation.
Figure 3-2: Representation of the synthetic antenna
3.2 Classification of SAR systems
The SAR sensors, according to the vehicle that carries them and to the target they survey, can
be classified to:
- Airborne SAR sensors; they are mounted on aircrafts and they survey the surface of the
earth. Such systems are: AirSAR (USA), C/X SAR (Canada), E-SAR (Germany), KRAS
(Denmark), RAMSES-ONERA (France), EMISAR (Denmark), Pi-SAR (Japan) and
STAR-3i, TopSAR, STAR-4 (Intermap).
- Spaceborne SAR sensors; they are mounted on satellites or space shuttles and they survey
the surface of the earth. In Table 1 all the recent and the expected in the near future
medium and high resolution spaceborne SAR systems are listed, together with their basic
characteristics. The number of the satellites which launched during the last three years,
and especially of those scheduled for the next period, is impressive.

TS 1H - Developments in Scanner and Sensor Technologies
Charalabos Ioannidis and Dimitra Vassilaki
Combined use of spaceborne optical and SAR data – Incompatible data sources or a useful procedure?
Integrating Generations
FIG Working Week 2008
Stockholm, Sweden 14-19 June 2008
7/17
- Planetary SAR sensors; they are mounted on space devices and they survey extraterrestrial
planetary objects. They have proved to be very efficient for planets or satellites with
opaque atmosphere, such as Venus and Titan (Figure 3-3). Such systems are: Magellan
(mission to Venus, 1990, NASA), Venera 15 and Venera 16 (mission to Venus, 1983-
1984, Russia), Cassini (mission to Saturn and its moons, 2004, NASA/ESA/ASI). Mars
Scout Radar, which is scheduled for 2009 launch, is expected to penetrate the notorious
dust storms of Mars (mission concept, NASA).
- UAV (Unmanned Aerial Vehicle) sensors; they are essentially airborne SAR systems
mounted on unpiloted aircrafts. UAVs are able to fly for tens of hours without human
pilot. Such systems are still experimental and include: YINSAR και microSAR (Brigham
Young University) and NASA UAVSAR.
Figure 3-3: Radar images of Titan's South Pole collected by Cassini's SAR on Dec. 20 2007
(source: http://saturn.jpl.nasa.gov)
The SAR spaceborne systems use wave lengths 30-15cm, 15-7.5cm, 7.5-3.75cm and 3.75-
2.40cm belonging to L, S, C and X bands respectively (Table 1). L-band SAR systems are not
hindered by atmospheric effects and are capable of “seeing” through heavy rain showers.
Their penetration capability with regard to vegetation canopies, glacier or sea ice, and soils is
considerable. S-band SAR systems are capable of “seeing” through tropical clouds and rain
showers with a minimum of attenuation. Their penetration capability with regard to vegetation
canopies or soils is very moderate and is restricted to the upper layers. C-band SAR is not
hindered by atmospheric effects and is capable of “seeing” through tropical clouds and rain
showers. Its penetration capability with regard to vegetation canopies or soils is limited and is

TS 1H - Developments in Scanner and Sensor Technologies
Charalabos Ioannidis and Dimitra Vassilaki
Combined use of spaceborne optical and SAR data – Incompatible data sources or a useful procedure?
Integrating Generations
FIG Working Week 2008
Stockholm, Sweden 14-19 June 2008
8/17
restricted to the top layers. Imaging radars equipped with X-band are usually not hindered by
atmospheric effects and are capable of “seeing” through clouds and light rain showers.
Attenuation problems can be encountered in heavy rain, particularly in tropical regions. The
penetration capability with regard to vegetation canopies or soils is very limited and is
generally restricted to the surface layer (Canada Centre for Remote Sensing,
http://www.ccrs.nrcan.gc.ca). Sensors of this category have the highest resolution and are of
great interest for applications including geometric object information.
SAR systems create anisotropic images. The Y dimension is the distance along the flight path,
and the X direction is the distance of the sensor and the target and it is perpendicular to the
flight path. SAR images have different resolutions in X and Y dimension named range
resolution and azimuth resolution respectively. The resolution of SAR systems can be
classified (Table 3-1) to Low (>15 m), Medium (2-15 m) and High (<1 m). SAR systems are
able of using different acquisition modes: Stripmap, ScanSAR, Spotlight. Differenating the
acquisition geometry, they can control the resolution and the swath dimensions.
3.3 Methods and tools for SAR data processing
The most well-known and applied methods for SAR data processing are: Interferometry,
Radargrammetry and Polarimetry. Recently, combined use of these methods has also been
proposed aiming to better exploitation of SAR data. Such combined methods are Stereo-
assisted Interferometric SAR (Schubert, 2004) and Polarimetric Interferometry.
In parallel to the improvement of the mathematical models of SAR data processing, a variety
of software has been developed. Some examples of those are
- commercial software tools: DIAPASON, Earthview, eCognition, ENVI, ERDAS, PCI
Geomatics, GAMMA, GEOimage, InfoPACK, POLSARPRO, PulSAR, SARscape
- free software tools: BEST, DORIS, EnviView, ERS SAR Toolbox, IDIOT, OTB, RAT,
UNESCO-Bilko.
3.3.1 Interferometry (InSAR / IfSAR)
SAR records the phase of the backscattered echoes as well as the amplitude. The phase is
utilized during the processing of two or more sets of SAR data with the Interferometry
method (Graham, 1974; Madsen & Zebker, 1998). Interferometry is a general purpose method
of superimposing (interfering/adding) two or more waves, in order to detect the differences
between them (Figure 3-4). Phase differences are presented in an image known as
interferogram. For space-borne applications the mostly used interferometry variations are the
dual-pass (or Repeat-pass) interferometry and the differential interferometry (DinSAR).

TS 1H - Developments in Scanner and Sensor Technologies
Charalabos Ioannidis and Dimitra Vassilaki
Combined use of spaceborne optical and SAR data – Incompatible data sources or a useful procedure?
Integrating Generations
FIG Working Week 2008
Stockholm, Sweden 14-19 June 2008
9/17
Table 3-1: Basic characteristics of spaceborne SAR sensors
SENSOR LAUNCH COUNTRY BAND RESOLUTION
L S C X LOW MEDIUM HIGH
SIR-A 1981 USA x 40 m
SIR-B 1984 USA x 20 m
LACROSSE
LACROSSE 1 1988 USA x ~1 m
LACROSSE 2 1991 USA x ~1 m
LACROSSE 3 1997 USA x ~1 m
LACROSSE 4 2000 USA x ~1 m
LACROSSE 5 2005 USA x ~1 m
ALMAZ-1 1991 Russia x 15 m
ERS-1 1991 ESA x 26 m
J-ERS-1 1992 Japan x 18 m
SIR-C/X-SAR 1994 USA Germany Italy x x x 15 m
ERS-2 1995 ESA x 26 m
RADARSAT-1 1995 Canada x 10 m
SRTM 2000 USA Germany Italy x x 30 m
ENVISAT 2002 ESA x 25 m
ALOS 2006 Japan x 10 m
TERRASAR-X 2007 Germany x 1 m
TANDEM-X 2008 Germany x 1 m
RADARSAT-2 2007 Canada x 3 m
COSMO-SKYMED
COSMO-1 & 2 2007 Italy x 1 m
COSMO-3 2008 Italy x 1 m
COSMO-4 to be announced Italy x 1 m
RISAT 2008 India x 3 m
TecSAR/TechSAR 2008 Israel x 1 m
SAR-LUPE
SAR-LUPE-1 2006 Germany x <1 m
SAR-LUPE-2 & 3 2007 Germany x <1 m
SAR-LUPE-4 & 5 2009 Germany x <1 m
HJ-1C (sarsat) 2008 China x
SAOCOM
SAOCOM 1A & 1B 2008 Argentina x 7 m
SAOCOM 2A & 2B to be announced Argentina to be announced
SENTINEL-1 2011 ESA x 5 m
SSR-2 (MAPSAR) 2011 Brazil Germany x 3 m
SURVEYOR SAR
SURVEYOR-1to 5 to be announced China x 10 m
TerraSAR-L to be announced ESA x 5 m

TS 1H - Developments in Scanner and Sensor Technologies
Charalabos Ioannidis and Dimitra Vassilaki
Combined use of spaceborne optical and SAR data – Incompatible data sources or a useful procedure?
Integrating Generations
FIG Working Week 2008
Stockholm, Sweden 14-19 June 2008
10/17
Figure 3-4: Operational principles of Interferometry (source: http://www.npagroup.com)
Dual-pass interferometry is the most popular technique for space-borne interferometric
applications (Goldstein, 1998; Li & Goldstein, 1990). It is carried out with one satellite
equipped with only one SAR antenna. Satellite passes twice from the same point and
measures the same area with a slightly different viewing geometry. It has to be mentioned that
there is also an interferometric mode known as single-pass interferometry. This technique is
carried out with one moving platform equipped with two SAR antennas, either perpendicular
or parallel to the direction of flight (across-track interferometry / along track interferometry).
The moving platform passes only once over the area of interest. One antenna works as a
transmitter and receiver (master) and the other one as a receiver only (slave). Single-pass
interferometry is adapted to airborne systems. SRTM was the first, and the only one till today,
single-pass spaceborne system. Nowadays satellite constellations is the new spaceborne SAR
concept, e.g., TerraSAR & TandemX, Cosmo-Skymed.
Differential SAR Interferometry (DinSAR) is a special case of interferometry mostly used for
change mapping such as earthquake monitoring, glacier velocity mapping, landslides and
glacier dynamics (Gabriel, 1989). It is able of measuring displacements with high accuracy
(sub-cm) using 3 data sets (3-pass or double-difference DInSAR) or 2 data sets and 1 DTM
(2-pass or DEM-elimination DinSAR). Two interferograms are produced: either from
combining 3 data sets or 2 data sets and 1 DTM. Those interferograms are then compared so
that differences can be mapped. Permanent Scattering (PI) is a relatively new procedure based
on utilization of stable natural reflectors (eg buildings) for measuring INSAR and DinSAR
applications offering higher accuracy and making more stable the procedure.
Interferometry is widely applied for topographic mapping (DTM generation), velocity
mapping (currents mapping, detection of moving targets) and change mapping (earthquake
monitoring, glacier velocity mapping, landslides, glacier dynamics).
3.3.2 Radargrammetry
Radargrammetry was originally defined as the “science of obtaining reliable measurements by
means of radar” (Levine, 1960). Later on, the definition was refined as “the technology of

TS 1H - Developments in Scanner and Sensor Technologies
Charalabos Ioannidis and Dimitra Vassilaki
Combined use of spaceborne optical and SAR data – Incompatible data sources or a useful procedure?
Integrating Generations
FIG Working Week 2008
Stockholm, Sweden 14-19 June 2008
11/17
extracting geometric object information from radar images” (Leberl, 1990). Radargrammetry
is essentially photogrammetry applied to radar images; it creates products such as maps,
DTMs and orthoimagery, using well-known photogrammetric tools such as orientation,
rectification, matching etc. The method is employed with single images, pairs of overlapping
images, blocks of images and multi-sensor, image and non-image, data sets. Although the
idea, the procedures and the resulting products lead directly to photogrammetry,
radargrammetry faces some issues arising from the microwave nature of radar images and the
side-looking geometry of SAR: foreshortening, layover, shadow, color. Due to these
phenomena two radar images of the same area may present many differences and variability
(Canada Centre for Remote Sensing). The combination of non-optical measurements and
side-geometry makes the microwave image difficult to assess by the human eye although
microwave imagery much resemble optical photos at first glance. Stereoscopic processing by
a human interpreter is still possible. For space-borne applications mostly used
radargrammetric modes are: Same side stereo and Opposite side stereo (Figure 3-5).
Figure 3-5: Left: Same-side stereo. Right: Opossite-side stereo
(source: http://www.ccrss.com)
3.3.3 Polarimetry
The radar antenna may be adjusted to transmit and receive waves of the same or different
polarity. The possible combinations are:
- HH: transmits and receives the waves of horizontal polarity
- VV: transmits and receives the waves of vertical polarity
- HV: transmits waves of horizontal polarity and receives waves of vertical polarity
- VH: transmits waves of vertical polarity and receives waves of horizontal polarity.
The polarity is a SAR parameter which can reveal substantial information about the material
of the target (ice, snow, vegetation etc.). When the transmitted wave, which has a certain
polarity, is backscattered by the target, its polarity may be differentiated according to the
TS 1H - Developments in Scanner and Sensor Technologies
Charalabos Ioannidis and Dimitra Vassilaki
Combined use of spaceborne optical and SAR data – Incompatible data sources or a useful procedure?
Integrating Generations
FIG Working Week 2008
Stockholm, Sweden 14-19 June 2008
12/17
material of the target. The evaluation of the polarity differentiation and the inferred
conclusions about the material of the target is the subject of Polarimetry. So, radar
polarimetry is concerned with control of the polarimetric properties of radar waves and the
extraction of target properties from the behavior of reflected waves from a target (Boerner et
al, 1998). Polarimetry has been used for thematic classification studies for applications such
as agriculture (crop type identification, land cover mapping), forestry (biomass estimation,
species identification), geology, hydrology (soil moisture, snow hydrology, flood detection),
ocean surveillance, coastal zone monitoring (shoreline extraction, oil spill detection).
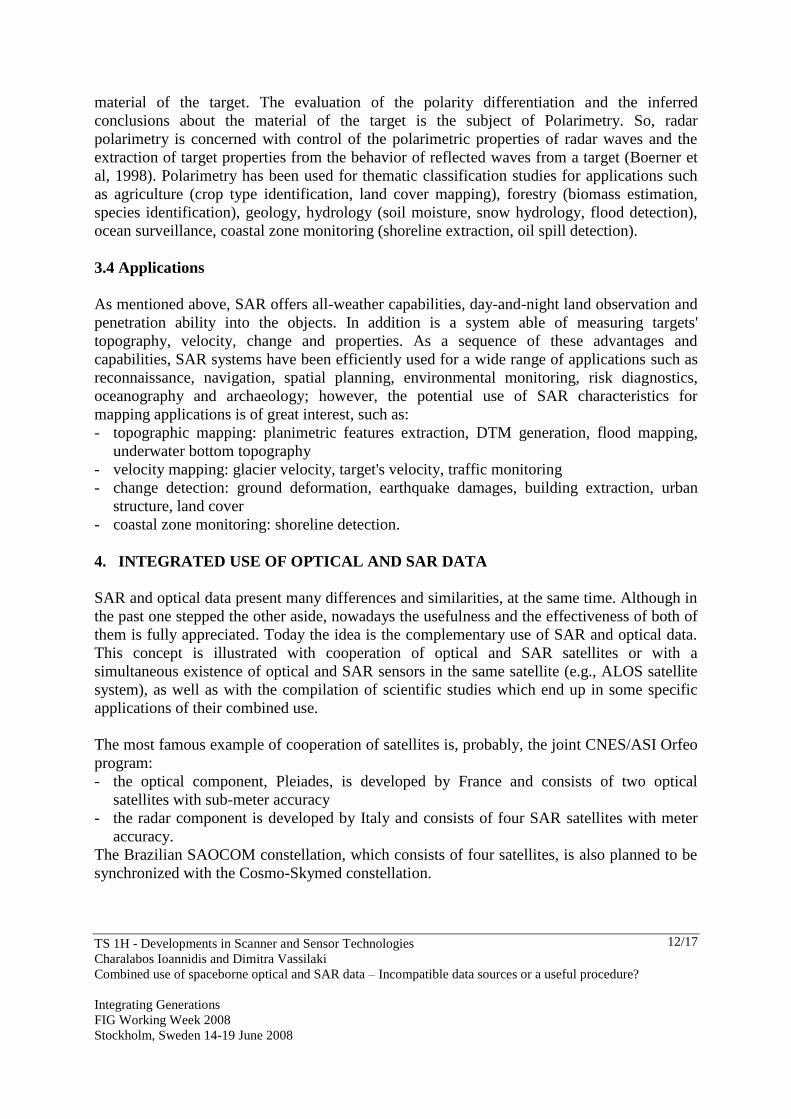
3.4 Applications
As mentioned above, SAR offers all-weather capabilities, day-and-night land observation and
penetration ability into the objects. In addition is a system able of measuring targets'
topography, velocity, change and properties. As a sequence of these advantages and
capabilities, SAR systems have been efficiently used for a wide range of applications such as
reconnaissance, navigation, spatial planning, environmental monitoring, risk diagnostics,
oceanography and archaeology; however, the potential use of SAR characteristics for
mapping applications is of great interest, such as:
- topographic mapping: planimetric features extraction, DTM generation, flood mapping,
underwater bottom topography
- velocity mapping: glacier velocity, target's velocity, traffic monitoring
- change detection: ground deformation, earthquake damages, building extraction, urban
structure, land cover
- coastal zone monitoring: shoreline detection.
4. INTEGRATED USE OF OPTICAL AND SAR DATA
SAR and optical data present many differences and similarities, at the same time. Although in
the past one stepped the other aside, nowadays the usefulness and the effectiveness of both of
them is fully appreciated. Today the idea is the complementary use of SAR and optical data.
This concept is illustrated with cooperation of optical and SAR satellites or with a
simultaneous existence of optical and SAR sensors in the same satellite (e.g., ALOS satellite
system), as well as with the compilation of scientific studies which end up in some specific
applications of their combined use.
The most famous example of cooperation of satellites is, probably, the joint CNES/ASI Orfeo
program:
- the optical component, Pleiades, is developed by France and consists of two optical
satellites with sub-meter accuracy
- the radar component is developed by Italy and consists of four SAR satellites with meter
accuracy.
The Brazilian SAOCOM constellation, which consists of four satellites, is also planned to be
synchronized with the Cosmo-Skymed constellation.

TS 1H - Developments in Scanner and Sensor Technologies
Charalabos Ioannidis and Dimitra Vassilaki
Combined use of spaceborne optical and SAR data – Incompatible data sources or a useful procedure?
Integrating Generations
FIG Working Week 2008
Stockholm, Sweden 14-19 June 2008
13/17
The road for these recently announced cooperation at level of sensors, has been opened with
scientific studies about the integrated use of optical and SAR data. It has been shown that not
only is possible to combine optical and radar products but is also efficient. Nowadays it is
examined what specific needs can be covered with a combined use of SAR and optical data.
The EuroSDR in conjunction with the IEEE GRSS data fusion technical committee (DFC)
and the ISPRS working group III/6 “Multi-Source Vision” organised a contest for airborne
SAR and optical data. One of the goals was to answer the question whether it would be
possible to obtain the same accuracy and quality when interpreting SAR instead of optical
image data. In general it was observed that large linear (roads, highways etc) and areal
features (buildings, forest areas etc) can be interpreted quite well in SAR images, while small
objects of the size of a few pixels can not interpreted satisfactorily by untrained interpreters.
The second phase of the contest is expected to give answers to the question of what can be
gained when SAR and optical images are used in conjunction (Bellman & Hellwich, 2006).
Integrated use of optical and SAR data can be carried out in sequence, in parallel and
auxiliary. When processing data in sequence, the output products of the one set are used as in-
put data for processing the other set of data, aiming to ameliorate the conditions of its
processing. In this case, information that is essential for the exploitation of the one set can be
acquired by the other. Information that may demand time-consuming or pricy procedures/data
or even information that is not possible to be acquired by optical data when processing them,
can be acquired by SAR data and conversely. A representative sample of processing optical
and microwave data in sequence, is the generation of optical orthoimagery with DEM
extracted by InSAR. DEM extraction from optical data pre-assumes the existence of
stereopairs, whose purchase is costly, while the production of high accuracy radar
orthoimages is restricted due to the need for identification of GCPs on the SAR image, which,
unlike optical images, it can be very difficult, particularly in mountainous areas due to
foreshortening and layover effects. Another case is the DinSAR (two-pass or DEM-
elimination DinSAR) with DEM generated from optical imagery.
When processing data in parallel, both data sets are independently processed and then
information that is extracted is superimposed for presentation purposes. In this case it is
predetermined what kind of information will be acquired by each set depending on the
specific needs of the study and the capabilities of each sensor. A characteristic example is the
coastal zone management (e.g., Raouf & Lichtenegger, 1997), where a variety of different
kind of information are required, that is, topographic and bathymetric maps, location and
monitoring of shoreline, oil slick detection, windfield measurements etc; some of them can
only be extracted from optical imagery while others can only be extracted from SAR data, and
others from both of them.
When processing data auxiliary, the products of the one set are treated as complementary
information for the products that comes out from the other set. Information that is not possible
to be extracted from the one data set or it is extracted incomplete is then extracted/completed
by the other set. Studies that have been done for the improvement of DEM with optical and
microwave data fusion have shown that fused DEMs shows remarkable improvement in the
accuracy measures and promising results in the enhancement of completeness (Crosetto,

TS 1H - Developments in Scanner and Sensor Technologies
Charalabos Ioannidis and Dimitra Vassilaki
Combined use of spaceborne optical and SAR data – Incompatible data sources or a useful procedure?
Integrating Generations
FIG Working Week 2008
Stockholm, Sweden 14-19 June 2008
14/17
1998; Honikel 1998; Karkee, 2006). Fusion techniques over SAR and optical data have also
been applied for the reconstruction of man made objects (optical image give information on
the scene organization in order to improve 3D SAR reconstruction), such as buildings (Tupin,
2006) and bridges (Soergel, 2006), with promising results.
Achieved results have shown that optical and SAR data can supplement each other in creating
high-quality mapping products. The integrated use of them is still under examination, but it is
nearly sure that we are about to see more combined techniques and applications in the near
future.
5. CONCLUSIONS
Both the exclusive use of spaceborne SAR data and their combined use with optical sensors
imagery, gain increasing interest for mapping and monitoring applications. The main reasons
to introduce SAR data in the fusion process with optical imagery are the ability of SAR data
to:
- acquire data on a systematic basis, independent of weather conditions and daylight
- be sensitive to roughness and di-electric properties of the targets
- detect slow movements and changes.
These characteristics can broaden the application range of satellite data or increase the rates of
success of some procedures (e.g., change detection, reconstruction of man-made objects) or
lead to the creation of fully-automated procedures. For example, it is possible to generate high
accuracy (within one pixel resolution of the data) orthoimages of SAR and optical data
without GCPs, where very significant cost and time savings can be achieved, but also fully-
automated batch processing for generating a large quantity of orthoimages and mosaics,
especially useful for applications that require rapid results, such as disaster monitoring.
The purchasing cost of both the optical and the SAR data remains high, especially when these
data are derived from high resolution sensors, so their combination increases the problem.
However, for applications in large areas this may be balanced, since cost for topographic
mapping or orthoimage production can be reduced significantly using satellite data. Also,
there are some applications where those data‟s fusion constitutes the best or even the only
technical solution.
Consequently, the extended research of the capabilities of an integrated use of spaceborne
optical and SAR data is of important significance for a large range of applications; especially
when the use of many new high resolution satellites equipped with optical, SAR or both of
these types of sensors, is planned for the near future.

TS 1H - Developments in Scanner and Sensor Technologies
Charalabos Ioannidis and Dimitra Vassilaki
Combined use of spaceborne optical and SAR data – Incompatible data sources or a useful procedure?
Integrating Generations
FIG Working Week 2008
Stockholm, Sweden 14-19 June 2008
15/17
REFERENCES
Baiocchi, V., Crespi, M., De Vendictis, L., Giannone, F., 2004. A new rigorous model for the
orthorectification of synchronous and asynchronous high resolution imagery. Proceedings
of the 24th
EARSeL Symposium, Dubrovnik, Croatia, pp. 461-468.
Baltsavias, E., Pateraki, M., Zhang, L., 2001. Radiometric and geometric evaluation of
IKONOS GEO images and their use for 3D building modeling. Proceedings of Joint
ISPRS Workshop on High resolution mapping from space 2001, Hannover, Germany,
unpagened CD.
Bellman, A., Hellwich, O., 2006. Sensor and Data Fusion Contest: Information for Mapping
from Airborne SAR and Optical Imagery (Phase 1), EuroSDR Projects, Official
Publication No. 50, Frankfurt, Germany.
Boerner, W.M., Mott, H., Luneburg, E., Livingstone, C., Brisco, B., Brown, R.J., Paterson,
J.S., 1998. Polarimetry in Radar Remote Sensing, Basic and Applied Concepts: in
Principles and Applications of Imaging Radar, Manual of Remote Sensing - Volume 2,
Chapter 5, Third Edition, ASPRS, Eds. F. Henderson, A. Lewis, pp. 270-358.
Bignami, C., Chini, M., Pierdicca, N., Stramondo S., 2004. Comparing and combining the
capability of detecting earthquake damages in urban areas using SAR and optical data.
Proceedings of IEEE/IGARSS 2004, Anchorage, USA, unpagened CD.
Cheng, P., 2007. Automated High-Accuracy Orthorectification and Mosaicking of PALSAR
Data without Ground Control Points, GEOInformatics, 6(10): 36-38.
Gabriel, A.K., Goldstein, R.M., 1988. Crossed Orbit Interferometry: Theory and Experimental
Results from SIR-B, International Journal of Remote Sensing, 9 (5):857-872.
Goldstein, R.M., Zebker, H.A., Werner, C.L., 1988. Satellite Radar Interferometry: Two
dimensional Phase Unwrapping, Radio Science, 23 (4):713-720.
Graham, L.C., 1974, Synthetic Interferometer Radar for Topographic Mapping, Proceedings
of the IEEE, 62(2): 763-768.
Crosetto, M., 1998. Interferometric SAR for DEM Generation: Validation of an Integrated
Procedure Based on Multisource Data. Doctorate thesis, Politecnico di Milano, Geodetic
and Surveying Sciences, Milano, Italy.
Dowman, I.J., Michalis, P. 2003. Generic rigorous model for along track stereo satellite
sensors. Proceedings of Joint ISPRS Workshop on High resolution mapping from space
2003, Hannover, Germany, unpagened CD.
Fraser, C., Hanley, H., 2003. Bias compensation in rational functions for IKONOS satellite
imagery. Photogrammetric Engineering and Remote Sensing, 69(1): 53-57.
Fritsch, D., Stallmann, D., 2002. Rigorous Photogrammetric Processing of High Resolution
Satellite Imagery. Proceedings of XIX ISPRS Congress, Amsterdam, The Netherlands,
IAPRS, vol. XXXIII, part B1, pp. 313-321.
Honikel, M., 1998. Improvement of InSAR DEM accuracy using data and sensor fusion,
International Geoscience and Remote Sensing Symposium (IGARSS) 5, pp. 2348-2350.
Karkee, M., Kusanagi, M., Steward, B.L., 2006. Fusion of Optical and InSAR DEMs:
Improving the quality of free data, ASAE Annual Meeting, Paper number: 061172.
Leberl, F. W., 1990. Radargrammetric Image Processing, Boston Mass, Artech House.
Leberl, F.W., 1998. Radargrammetry: in Principles and Applications of Imaging Radar,
Manual of Remote Sensing - Volume 2, Chapter 4, Third Edition, ASPRS, Eds. F.

TS 1H - Developments in Scanner and Sensor Technologies
Charalabos Ioannidis and Dimitra Vassilaki
Combined use of spaceborne optical and SAR data – Incompatible data sources or a useful procedure?
Integrating Generations
FIG Working Week 2008
Stockholm, Sweden 14-19 June 2008
16/17
Henderson, A. Lewis, pp. 183 – 269.
Levine, D., 1960. Radargrammetry, New York, McGraw-Hill.
Li, F., Goldstein, R.M., 1990. Studies on Multi-baseline Spaceborne Interferometric Synthetic
Aperture Radars, IEEE Trans. Geoscience and Remote Sensing, vol. 28 (1):88-97.
Madsen, S.N., Zebker, H.A., 1998. Imaging Radar Interferometry: in Principles and
Applications of Imaging Radar, Manual of Remote Sensing – Volume 2, Chapter 6, Third
Edition, ASPRS, Eds. F. Henderson, A. Lewis, pp. 359 – 406.
Orsomando, F., Lombardo, P., Zavagli, M., Costantini, M., 2007. SAR and Optical Data
Fusion for Change Detection, Urban Remote Sensing Joint Event, pp. 1 – 9.
Raouf, A., Lichtenegger, J., 1997. Integrated Use of SAR and Optical Data for Coastal Zone
Management, http://earth.esa.int/workshops/ers97/papers/lichtenegg.
Schubert, A., 2004. Stereo-Assisted Interferometric SAR, Zurich, University of Zurich.
Soergel, U., Thiele, A., Gross, H., Thoennessen, U., 2007. Extraction of bridge features from
high-resolution InSAR data and optical images, Urban Remote Sensing Joint Event 2007,
art. no. 4234481.
Stilla, U., Soergel, U., Thoennessen, U., Brenner, A., 2005. Potential and limits for
reconstruction of buildings from high resolution SAR data of urban areas. Proceedings of
28th General Assembly of International Union Radio Science (URSI), New Delhi, India,
http://www.stilla.de/usti_pub.html.
Stramondo, S., Bignami, C., Chini, M., Pierdicca, N., Tertulliani, A., 2006. Satellite radar and
optical remote sensing for earthquake damage detection: results from different case
studies, International Journal of Remote Sensing, 27(15): 4433-4447.
Tao, C.V., Hu, Y., Mercer, J.B., Schnick, S., Zhang, Y., 2000. Image rectification using a
Generic Sensor Model – Rational Function Model. Proceedings of ASPRS Annual
Convention, Washington D.C., USA, unpaginated CD.
Tupin, F., Roux, M., 2003. Detection of building outlines based on the fusion of SAR and
optical features. ISPRS Journal of Photogrammetry & Remote Sensing, 58 (2003): 71-82.
Tupin, F., 2006, Fusion of interferometric and optical data for 3D reconstruction, International
Geoscience and Remote Sensing Symposium (IGARSS), art. no. 4242077, pp. 3627-3630.
Weser, T., Rottensteiner, F., Willneff, J., Fraser, C., 2007. A generic pushbroom sensor model
for high-resolution satellite imagery applied to SPOT 5, QuickBird and ALOS data sets.
Proceedings of Joint ISPRS Workshop on High resolution mapping from space 2007,
Hanover, Germany, http://130.75.85.12/html/publikationen/2007/workshop/paper/
Weser_etal.pdf.
Yamakawa, T., Fraser, C.S., 2004. The Affine Projection Model for Sensor Orientation:
Experiences with High-Resolution Satellite Imagery. Proceedings of XXXV ISPRS
Congress, Istanbul, Turkey, IAPRS, vol. XXXV, part B1,
http://www.ISPRS.org_istanbul_comm1_papers_27.pdf.
Zebker, H. A., Goldstein, R. M., 1986, Topographic Mapping from Interferometric Synthetic
Aperture Radar Observations, Journal of Geophysical Reshearch, 91(B5): 4993-4999.

TS 1H - Developments in Scanner and Sensor Technologies
Charalabos Ioannidis and Dimitra Vassilaki
Combined use of spaceborne optical and SAR data – Incompatible data sources or a useful procedure?
Integrating Generations
FIG Working Week 2008
Stockholm, Sweden 14-19 June 2008
17/17
BIOGRAPHICAL NOTES
Charalambos Ioannidis
Assistant Professor at the Lab. of Photogrammetry, School of Rural and Surveying
Engineering, National Technical University of Athens (NTUA), Greece, teaching
Photogrammetry and Cadastre. Until 1996 he worked at private sector.
1992-96: Co-chairman of Commission VI -WG2-„Computer Assisted Teaching‟ in ISPRS.
1997-2001: Member of the Directing Council of Hellenic Mapping and Cadastral
Organization and Deputy Project Manager of the Hellenic Cadastre.
His research interests focus on Satellite Photogrammetry, aerial triangulations, orthoimages,
applications of digital Photogrammetry on the Cadastre and GIS, terrestrial Photogrammetry.
He has authored 80 papers in the above fields, and has given lectures in related seminars both
in Greece and abroad.
Dimitra Vassilaki
D. Vassilaki graduated from the School of Rural and Surveying Engineering, National
Technical University of Athens (NTUA), Greece, in 1998 and received the Msc degree in
2004 from the Hellenic Open University. She is an officially certified engineer, by the Greek
Ministry of Environment, Physical Planning and Public Works in the fields of surveying,
mapping, photogrammetry and cadastre. She is currently a PhD candidate at the School of
Surveying Engineering of NTUA. Her main research interests are photogrammetry and SAR
data processing.
CONTACTS
Prof. Charalabos Ioannidis
Assistant Professor
National Technical University of Athens
9, Iroon Polytechniou St.
Athens 15780,
GREECE
Tel. + 302107722686
Fax + 302107722677
Email: [email protected]
Dimitra Vassilaki
PhD student, Lab. of Photogrammetry
National Technical University of Athens
9, Iroon Polytechniou St.
Athens 15780,
GREECE
Tel. + 302107722653
Fax + 302107722677
Email: [email protected]