commercial property & casualty market outlook
TRANSCRIPT

2020-2021 Q4 Update
Insights From USI National Practice Leaders
Commercial
Property & Casualty Market Outlook

Executive Summary
Market Update and Rate Forecast
Property
Casualty
Executive & Professional Risk
International
Aviation
Environmental
Industry Update
03 04 06 09 17 27293133
TABLE OF CONTENTS

Industry Insights | USI 2020-2021 COMMERCIAL PROPERTY & CASUALTY MARKET OUTLOOK3
The year 2020 has been unprecedented in so many ways. Our collective world of risk management was directly impacted to the extent that this year has kept insureds and
insurers guessing about what’s coming next. The first half of the year ushered in significant COVID-19 coverage and claim challenges for our clients, and the resulting economic downturn forced many businesses to close and furlough or lay off millions of workers. As employers began to take steps to re-open and adjust to a “new normal,” social unrest boiled over across the country, followed by a record-breaking hurricane season and another year of massive wildfires across the West. When we released our Q2 Property & Casualty Market Outlook this summer, we were just beginning to see the early impact of COVID-19 on an already hardening insurance market: rate increases, capacity reductions, and tighter underwriter scrutiny. As the full extent of claims related to COVID-19 and other events remain to be seen, these market trends will continue through Q4 and likely well into 2021.
Market Challenges and Uncertainties Although the market has already firmed significantly this past year, continued uncertainty from potential COVID-19 related cases, higher than normal judgements, developing CAT losses, and additional factors have insurers raising rates, lowering capacity, limiting or transferring risk, and taking a harder look at risk profile. Even insureds with a lower risk profile are facing much closer underwriter scrutiny as well as higher rates and retention. We encourage insureds to start the renewal process early and use quality risk information to present their accounts in the best possible light.
� Property: Rates have increased in all segments of the property sector into Q4, but at slower rates compared to Q2.
� Casualty: Rate increases, capacity restrictions, and tighter underwriting standards are commonplace in the primary general/products liability and other casualty markets, and it is anticipated that COVID-19 will exacerbate the current market dynamics across all lines including Workers’ Compensation.
� Executive & Professional Risk: Premiums are up for public company directors and officers (D&O) insurance driven by uncertainties around COVID-19 and increased litigation frequency and settlement payments, though the market may stabilize somewhat in 2021. While premium increases in the private company and not-for-profit (NFP) D&O market have not been as severe, increases in retention and excess premium are likely. COVID-19 may also accelerate claims in the Employment Practices Liability (EPL) and Fiduciary Liability markets into 2021. Continued network intrusions and ransomware events are firming the Cyber risk marketplace.
� Umbrella/Excess: After experiencing significant hardening in the first half of 2020, the Umbrella/Excess lines have seen moderate premium increases.
As we move into the new year, we will remain close to industry and market developments so we can best guide and support our clients through these and future challenges. We will also continue to leverage our risk, insurance, and market expertise through our comprehensive STEER initiative (Steering Through Epidemic and Economic Recovery), of which USI’s Public Health Emergency site is a key component. Here, we regularly post comprehensive and timely communications, tools, and materials related to the COVID-19 pandemic to help inform and educate our clients and remind them that we are all in this together. Our goal with this report is to provide you with a better understanding of what is occurring in the market, why it is occurring, what to expect, and most importantly, what you can and should do to obtain the most cost-effective program available in the marketplace. Concurrently, we are offering you up-to-date, industry-appropriate, actionable, and financially impactful solutions to assist in navigating through the pandemic and its impact on your business. We wish you continued safety and good health.
Robert Meyers Senior Vice President, Property & Casualty Leader

Industry Insights | USI 2020-2021 COMMERCIAL PROPERTY & CASUALTY MARKET OUTLOOK 4
MARKET UPDATE AND YEAR-OVER-YEAR (YOY) RATE FORECAST
PRODUCT LINE Q2 2020 Q4 2020-2021PROPERTYProperty Non-Catastrophic w/Good Loss History Up 5% to 15% UP 5% to 10%*
CAT Property w/Minimal Loss History Up 20% to 40% + Up 10% to 25%+*
CAT or Non-CAT Property w/Poor Loss History Up 40%+ Up 25% to 30%+*
CASUALTYPrimary General/Product Liability Up 5% to 10% Up 10% to 20%
Primary Auto Liability w/Fleet Less Than 200 & Good Loss History Up 10% to 20% No change. ^
Primary Auto Liability w/Fleet Less Than 200 & Poor Loss History Up 20% to 30% + No change. ^
Primary Auto Liability w/Fleets in Excess of 200 Up 20% to 30% + Up 10% to 20% + * ^
Excess Auto Buffers Up 40% + No change.
Workers’ Compensation Guaranteed Cost Down 5% to up 5% Down 10% to up 10%**
Workers’ Compensation Loss Sensitive Flat to up 5% No change. **
Umbrella & Excess Liability (Middle Market) Up 10% to 50% Up 5% to 25%***
Umbrella & Excess Liability (Risk Management) Up 25% to 100% Up 25% to 75% +***
Medical Malpractice Up 10% to 25% Up 10% to 35%
EXECUTIVE & PROFESSIONAL RISK (EPS)Public Company Directors & Officers Up 25% to 75% Up 20% to 100%
Private Company and Not-For-Profit (NFP) Directors & Officers Up 10% to 50% Up 10% to 60%
Employment Practices Liability (EPL) Up 10% to 50% Up 15% to 60%
Fiduciary Up 10% to 25% Up 5% to 50%
Crime Up 10% to 25% Up 10% to 30%
Professional Liability/Errors & Omissions 15% to 50% Up 10% to 50%
Industry Insights | USI 2020-2021 COMMERCIAL PROPERTY & CASUALTY MARKET OUTLOOK 5
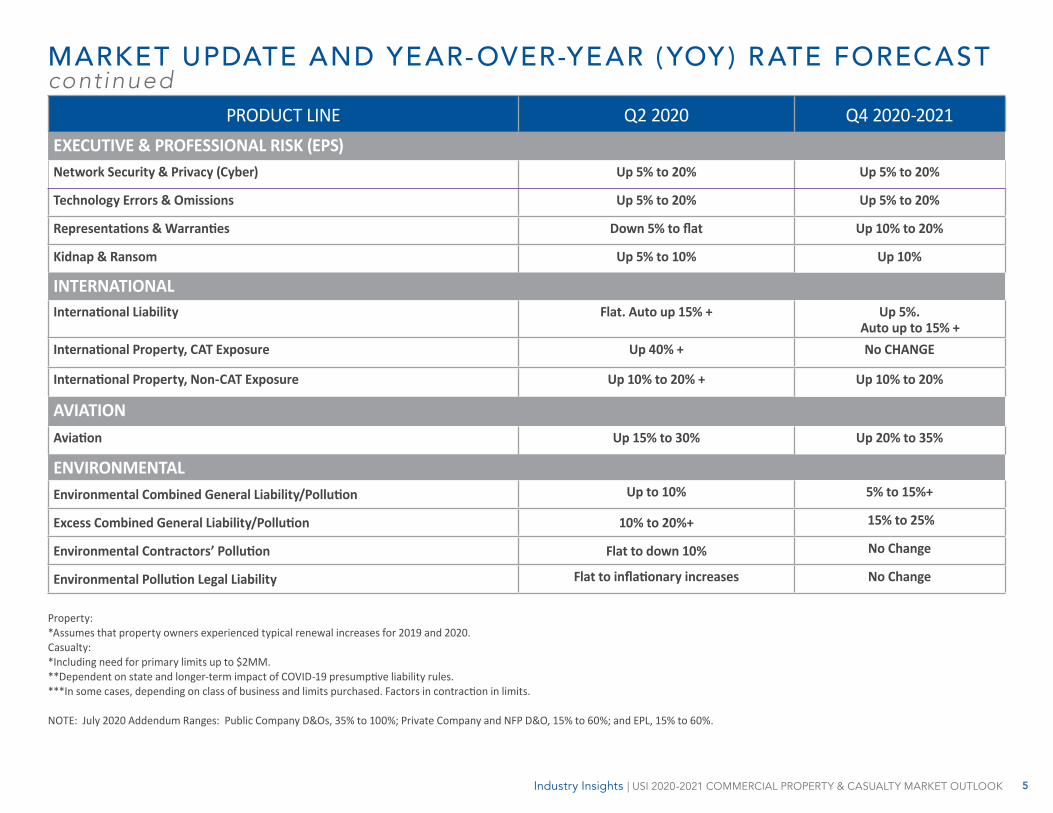
MARKET UPDATE AND YEAR-OVER-YEAR (YOY) RATE FORECAST continued
PRODUCT LINE Q2 2020 Q4 2020-2021EXECUTIVE & PROFESSIONAL RISK (EPS)Network Security & Privacy (Cyber) Up 5% to 20% Up 5% to 20%
Technology Errors & Omissions Up 5% to 20% Up 5% to 20%
Representations & Warranties Down 5% to flat Up 10% to 20%
Kidnap & Ransom Up 5% to 10% Up 10%
INTERNATIONALInternational Liability Flat. Auto up 15% + Up 5%.
Auto up to 15% +International Property, CAT Exposure Up 40% + No CHANGE
International Property, Non-CAT Exposure Up 10% to 20% + Up 10% to 20%
AVIATIONAviation Up 15% to 30% Up 20% to 35%
ENVIRONMENTALEnvironmental Combined General Liability/Pollution Up to 10% 5% to 15%+
Excess Combined General Liability/Pollution 10% to 20%+ 15% to 25%
Environmental Contractors’ Pollution Flat to down 10% No Change
Environmental Pollution Legal Liability Flat to inflationary increases No Change
Property: *Assumes that property owners experienced typical renewal increases for 2019 and 2020. Casualty: *Including need for primary limits up to $2MM. **Dependent on state and longer-term impact of COVID-19 presumptive liability rules. ***In some cases, depending on class of business and limits purchased. Factors in contraction in limits. NOTE: July 2020 Addendum Ranges: Public Company D&Os, 35% to 100%; Private Company and NFP D&O, 15% to 60%; and EPL, 15% to 60%.

Industry Insights | USI 2020-2021 COMMERCIAL PROPERTY & CASUALTY MARKET OUTLOOK 6
Property owners who have seen double-digit increases in 2019 and 2020 due to the continuing hard market may experience some welcome relief in 2021 as the rate curve begins to moderate. While this change will be welcome for many, it will certainly not minimize the level of scrutiny required in the underwriting process. To lessen this scrutiny, businesses should strive to present their account in the best possible light based on quality risk information. This will help buyers achieve the most favorable renewal outcome. It is also important to start the process as early as possible to avoid significant delays and corresponding frustration, as insurance carriers have been reporting an increasing number of submissions each month, often in the double-digits. Carriers can be discerning about the submissions they will and will not review because of the amount of work necessary to offer a timely quote. As the industry further embraces electronic submissions, responsible in large part to the ongoing COVID-19 pandemic and social distancing requirements, getting to the top of a carrier’s “virtual” stack will not only require a quality submission, but also an effective working relationship with one’s broker. An experienced broker can help guide/navigate the process, suggest ways to improve submission integrity, accelerate timelines, and advocate on the client’s behalf.
The deployment of selective capacity by carriers continues to restrict their offerings, especially as it relates to natural catastrophes and large Probable Maximum Loss (PML) estimates. Predominantly based on natural catastrophe modeling, carriers are carefully managing aggregate exposures for property clients exposed to hurricanes, wildfires, and tornado/hail events. Large PML exposures can result in similar capacity restrictions. This capacity management strategy has pushed many buyers into shared and layered property structures. These structures tend to be more expensive than the single carrier solutions that were common in the soft market.
COVID-19 Update Carriers are reporting substantial loss results from communicable disease coverage afforded under 2019-2020 property policies. This coverage was negotiated and provided as a sublimit for specific occupancies like hospitality and education. Event cancellation insurance carriers have also paid large losses related to shutdowns around the world, with many lawsuits still in the courts and impacting the carriers’ expenses. In an important change, many property policies issued after March 15, 2020, include an absolute Communicable Disease/Pandemic exclusion. Several parametric products have also
PROPERTY
*Assumes that property owners experienced typical renewal increases for 2019 and 2020.
Product Line Q2 2020 Q4 2020-2021 (YOY)
Property Non-Catastrophic w/Good Loss History UP 5% to 15% UP 5% to 10%*
CAT Property w/Minimal Loss History Up 20% to 40%+ Up 10% to 25%+*
CAT or Non-CAT Property w/Poor Loss History Up 40%+ Up 25% to 30%+*

Industry Insights | USI 2020-2021 COMMERCIAL PROPERTY & CASUALTY MARKET OUTLOOK 7
entered the market to protect property clients from future events, but these products are very expensive, with their costs typically based on 10% of the limit purchased. The financial impact developments and the USI plan of action for property insurance are as follows:
USI is working closely with clients impacted by COVID-19. We have developed specific STEER (Steer Through Epidemic & Economic Recovery) guidance that is posted regularly to our Public Health Emergency page.
Natural Catastrophe Trends Named Storm/Hurricane: This year has been the most active hurricane season on record, continuing a streak of above-average storm activity for five consecutive years. In August, Hurricane Laura, a Category 4 storm having 150-mph sustained winds, slammed into Lake Charles, LA, resulting in approximately $14B of damage. This activity has created tremendous pressure on capacity for property exposed to a named storm. Those who purchase large limits for this exposure will see carriers offering lower amounts of capacity per risk. Carriers are now in a position in which they can deploy capacity on a more selective basis, saving their capacity for more resilient risks. By understanding their limit needs and cost drivers (as based on modeling data), property owners can help to alleviate some of the upward rate and deductible trends.
Wildfire: For property owners with exposures in wildfire zones, the movement in the property market is now in full swing. In 2020, over 6MM acres of land and many commercial operations and buildings were impacted by the wildfires in California, Oregon, and Washington. These events follow higher than normal wildfire activity in the past three years. Beyond the current moratorium for providing property coverage in impacted areas, carriers are actively engaged in rate, retention, and limit analysis for wildfire zones. Modeling platforms are now used by carriers to manage aggregate exposures and pricing estimates based on the model’s loss estimates. For those who have exposures in these areas, it is critical to understand the modeled results to allow for risk-based decisions on limits, retentions, and overall premium impact. Tornado/Hail: Carriers have focused their attention to, and have restricted capacity deployment for, convective storm exposures. Risks located in “Tornado Alley” (generally considered to be the southern plains of the central U.S.) will see percentage deductibles ranging from 2% to 5% depending on roof size, roof age, and roof condition. As the preceding table indicates, property owners that experienced significant rate changes in 2019-2020 for this exposure will see some moderation of rates entering 2021. As carriers move to offering smaller capacity amounts, the cost to provide excess limits on a per-risk basis will be driven up based on limit needs. This move by carriers to re-underwrite their book of business requires brokers to bring an analytical approach to fully understand exposures and pricing parameters.
Challenged Occupancies: Beyond the natural catastrophe capacity limitations previously mentioned, there remains classes of business that are stressed because of shortfalls in capacity and unreasonable pricing levels. This is the result of large Probable Maximum Loss (PML) estimates on multiple fronts:
� Large loss potential because of product: food processing, pharmaceuticals.
� Large accumulation exposure: car/equipment dealers.
� Inadequacy of values: habitational.
Industry COVID-19 Revenue Impact
Driving Factor How Can USI Help
Hospitality 60-80% Travel Restrictions Premium Impact - Reduced Exposures
Habitational 5-40% Inability to Pay Rent Coverage/Limit Analysis
Commercial Retail
10-25% Tenant Bankruptcy Reduced Exposures
Industrial 0-5% Economic Downturn Business Income Analysis
Industry Insights | USI 2020-2021 COMMERCIAL PROPERTY & CASUALTY MARKET OUTLOOK 8
� Lack of fire protection: woodworking, recycling.
� Inadequacy of fire protection: plastics manufacturing, chemical blending.
Capacity for these high PML classes is currently offered in very small increments and requires underwriters to engage senior management in the decision-making process. The process of obtaining consistent terms and conditions is proving to be extremely time-consuming and requires deep broking skills to achieve the best results.
Property Market Upside The property market challenges detailed in this report are not without some silver lining. The current rate and deductible environments are appealing to many existing carriers who are now entertaining geographies and occupancies not seen before. In addition, new capacity has been created through sidelined capital entering the market in the form of underwriting facilities and programs. USI has been successful in drawing on facultative reinsurance capacity where unwanted or specific risks need to be placed separately. This has been especially true for our clients who require a shared and layered approach. London and Bermuda markets have also been attracted to the market-driven rates and retentions and are participating on many of the shared and layered structures placed by USI. Lastly, we have had success bringing in regional carriers who can provide Property, General Liability, and Umbrella coverage to an opportunity. This approach can positively impact property insurance pricing and other coverage lines.
How USI Can Help During this extraordinary time, when many business activities are virtual, it is essential for property owners to obtain targeted guidance and support from their property brokers. By leveraging our property experts, proprietary analytics, and years of industry expertise, USI can guide clients toward a favorable renewal outcome. Steps include:
� Determining the incumbent market’s renewal position 60 days prior to any renewal.
� Reviewing opportunities to impact premium related to the downturn caused by COVID-19.
� Providing quality risk control details that can help in loss estimates and capacity offerings.
� Conducting virtual meetings for site visits to show risk quality and virtual carrier meetings with key client team members.
� Reviewing values and ensuring that they represent the actual exposure.
� Exploring limit and retention strategies using modeling for natural catastrophe.
� Exploring the development and utilization of a property captive.
“To lessen scrutiny, businesses should present their account in the best possible light based on
quality risk information. This will help buyers achieve
the most favorable renewal outcome.“

Industry Insights | USI 2020-2021 COMMERCIAL PROPERTY & CASUALTY MARKET OUTLOOK 9
Product Line Q2 2020 Q4 2020-2021 (YOY)
Primary General/Product Liability Up 5% to 10% Up 10% to 20%
Primary Auto Liability w/Fleet Less Than 200 & Good Loss History Up 10% to 20% No change. ^
Primary Auto Liability w/Fleet Less Than 200 & Poor Loss History Up 20% to 30% + No change. ^
Primary Auto Liability w/Fleets in Excess of 200 Up 20% to 30% + Up 10% to 20% + * ^
Excess Auto Buffers Up 40% + No change.
Workers’ Compensation Guaranteed Cost Down 5% to up 5% Down 10% to up 10%**
Workers’ Compensation Loss Sensitive Flat to up 5% No change. **
Umbrella & Excess Liability (Middle Market) Up 10% to 50% Up 5% to 25%***
Umbrella & Excess Liability (Risk Management) Up 25% to 100% Up 25% to 75% +***
Medical Malpractice Up 10% to 25% Up 10% to 35%
* Including need for primary limits up to $2MM.
** Dependent on state and longer-term impact of COVID-19 presumptive liability rules.
*** In some cases, depending on class of business and limits purchased. Factors in contraction in limits.
^ Geographical radius of operations will impact pricing.
CASUALTY
The year 2021 will usher in the fourth year of a hard insurance market for commercial Automobile Liability lines and the third year of a hard market for General/Products Liability and Umbrella/Excess Liability. Despite industry surplus sitting in excess of $800B, the first two quarters of 2020 witnessed approximately a $25B decline in surplus, and this is expected to increase as COVID-19 related claims begin to manifest and catastrophic property and wildfire claims are tabulated. Although casualty loss activity decreased the past eight months as a result of the slowdown in commerce caused by the pandemic, total booked premiums also decreased, and coupled with the headwinds of an aggressive plaintiffs’ attorney bar, rising liability loss trends will negatively impact underwriting profitability. The impact of “social inflation,” which includes nuclear verdicts, increased use of expert witnesses by plaintiffs’ bar, higher settlements from liberal jury awards to plaintiffs and private equity-backed litigation financing are resulting in claims severity payouts that are multiples of what they were even five years ago, and is putting significant pressure on rate adequacy. These developments, coupled with the uncertainty that COVID-19 will have as respects the potential for a new wave of additional liability claims, civil unrest and the impact of natural catastrophes on property insurers, will result in the continuation of this hard market well into 2021.

Industry Insights | USI 2020-2021 COMMERCIAL PROPERTY & CASUALTY MARKET OUTLOOK 10
Customers in all industries are experiencing rate increases across commercial Automobile, commercial General/Products and Umbrella/Excess Liability lines as well as more restrictive coverage, terms and conditions.
� An increasing number of insurance companies have ceased writing coverage for certain industries and/or are reducing their overall capacity.
� When they do provide capacity, it is deployed more selectively.
� Reduced capacity results in less competition for business, and subsequently, the cost of insurance increases.
The underwriting community maintains that, despite many years of double-digit rate increases, rates and profit levels are still inadequate relative to the risks posed in today’s complex legal environment. Further, the reduction in economic activity caused by the pandemic has put additional pressure on an already low global interest rate environment and has created volatility in the equity markets. Lower yields and corresponding investment-income returns for insurers, from where they derive the majority of their income, will remain flat for a longer period of time. Although various consumer advocacy groups continue to contest the insurance industry’s justifications for the hardening market, the reality is that this is the most challenging and sustained hard insurance market since the mid-1980s. Compared to the multiple years of an extremely soft market where year-over-year rate decreases were common and competition and capacity were plentiful, most buyers of liability insurance are increasingly experiencing decreased competition, continued underwriting discipline, a shortage of available limits, and significant cost increases and coverage restrictions. While there are exceptions, most classes of business are being adversely affected irrespective of prior loss history, tenure or relationships with their insurance companies.
� Larger accounts are seeing the biggest increases, with habitational, transportation and retail risks being impacted particularly hard.
� Smaller-to middle-market insureds are also being impacted, but not nearly as much as larger insureds who purchase higher limits of liability.
� Sufficient capacity exists for most smaller-to middle-market insureds, and while they are experiencing pricing pressures, these pressures are not of the magnitude of larger accounts.
By contrast, Workers’ Compensation remains relatively competitive. Loss ratios remain mostly favorable and rate decreases have been recommended in many states. Shrinking employer payrolls and changes in worker classifications have and will impact direct
written premiums considerably throughout the remainder of the year and into 2021. Prior to the pandemic, the combined ratio for Workers’ Compensation had been trending upward over the past few years as premium levels continued declining, while claim costs increased moderately. The adoption of “presumptive liability” for COVID-19 claims and its expansion to include a broad array of workers in more and more states remains to be seen. The question of how many additional Workers’ Compensation claims will result, and how severe they will be, is unknown. Overall, it is likely these events will put additional pressure on rate adequacy in the coming months. The heightened volatility and economic fallout of the pandemic has impacted virtually every industry. The pace of reopening the economy has been met with repeated setbacks. As a result, many insureds are experiencing pressure on cashflow and liquidity, and higher insurance premiums are exacerbating the situation. Consequently, alternative program structures must be considered. Guaranteed Cost buyers need to consider assuming some loss themselves. The cost-benefit analysis of paid loss deductible programs, self-insurance, group captives, and other types of loss sensitive programs should be evaluated thoroughly. Insureds currently on a loss sensitive program must consider assuming more losses through higher retentions and vertical quota-sharing layers of a tower. They must also consider the financial flexibility and benefits of captive risk financing as a means to build surplus, which can be used to leverage and provide more stability over traditional lines placements in the future, and fund for uninsured or underinsured exposures. Collateral requirements in today’s tighter credit environment must be addressed as well.
Workers’ Compensation
The Market Today and Market Capacity Workers’ Compensation continues to remain a competitive line in most states, even when adjusted for the economic impact of COVID-19 and the subsequent reduction in payroll, premium and losses. The frequency of workplace injuries has decreased year-over-year due to previous investments made years ago in safer work environments. Telecommuting has become the new normal for many workers, and employees working from home are less prone to injuries than if they were working in an office or job site environment. The indemnity portion of a Workers’ Compensation loss has also been trending downward over the years. This is despite the fact that medical costs have increased in more states as expensive technological medical advances are more effectively rehabilitating people and getting them back to work faster, and/or prolonging their life expectancies. Yet, loss ratios remain mostly favorable and regulators believe that current proposed rates are adequate to fund expected losses. The majority of the National

Industry Insights | USI 2020-2021 COMMERCIAL PROPERTY & CASUALTY MARKET OUTLOOK 11
Council on Compensation Insurance (NCCI)-regulated states, as well as those states that set their own rating, have proposed rate reductions for 2021. Some of these states, including California (the state with the greatest number of workers and the highest Workers’ Compensation premium and losses of any U.S. state), have proposed a slight average rate increase of less than 3%. This accounts for potential increased loss activity as a result of presumptive liability for COVID-19 claims. Although this is an average increase, actual rate increases for higher risk classifications will be much higher than the average. Nevertheless, insurers will ultimately establish their rates to anticipate future developments in the Workers’ Compensation system – mainly by factoring in the cost of COVID-19 claims and existing rate guidance, which may not be sufficient. As of November 2020, nine states have amended their statutes to provide “presumptive liability,” which extends Workers’ Compensation benefits to a broader group of employees, including first responders, healthcare and social assistance workers, grocery/retail, teachers and many others who contracted the disease. Another 13 states have presumption bills under consideration. California has the most liberal presumptive liability law in the U.S., and a vast array of workers who contract the disease are presumed to have contracted it in the workplace if certain criteria are met. While many of the laws are rebuttable, the burden of proof is increasingly being pushed to the employer or insurer in some cases and not the employee, which may make overcoming the presumption difficult to prove. Although we are just beginning to understand the ultimate impact of COVID-19 on Workers’ Compensation and the infection rate in the workplace, the end result could be to transfer a significant amount of losses from medical and disability insurance to Workers’ Compensation, pending the positive impact of any vaccine. How much of this will be offset by lower claims activity as a result of stay-at-home orders is uncertain. The regulatory authorities and insurers understand the pricing pressures that the economic fallout has created and the need for balanced and fair rates; however, the long-term effect of additional compensable Workers’ Compensation disability and death benefit claims will ultimately reduce the pace of rate reductions and likely flatten or increase rates in many states. Workers’ Compensation rates will likely suffer even more volatility due to sharply lower payrolls and resultant reductions in written premiums in a record low-interest rate environment.
Other Issues to Monitor:
� Presumptive liability is also impacting the ability of insurers to actuarially determine an equitable aggregate stop loss level for those insureds currently on a loss sensitive program. Aggregate stop loss provisions intend to cap the amount of retained loss up to the pre-determined aggregate stop loss level. Insurers now face the potential for an uncertain number of workers who may file a COVID-19 claim. Initially, insureds in healthcare and other first responder industries were not being offered aggregate stop loss coverage, but this is now expanding out to other industries.
Industry Insights | USI 2020-2021 COMMERCIAL PROPERTY & CASUALTY MARKET OUTLOOK 12
� The NCCI and states that self-regulate have approved or filed rule changes that will exclude COVID-19-related claims from experience and merit rating calculations. An increasing number of insurers are requiring that they write Workers’ Compensation in addition to the liability lines. The ability to bifurcate primary programs is increasingly difficult.
Although California’s 2019 decision to classify independent contractors as employees took a backseat to the COVID-19 crisis, the recent passage of Proposition 22 in which gig workers will remain as independent contractors and not have their status changed to employees will further stabilize Workers’ Compensation in California and other states if it is more widely adopted. Prior to the proposition being passed, insurers were grappling with the potential of billions of additional Workers’ Compensation payroll and premium and, consequently, losses in the state, which will now remain self-insured or covered via an occupational accident policy. The Department of Labor has also proposed language that would make it easier to classify an independent contractor from an employee, but this proposal will not override the state laws. Through the third quarter of 2021, we expect Guaranteed Cost buyers to experience renewals either down 10% to up 5%. For loss sensitive programs, we expect buyers to experience flat to up 10%. These estimates will be impacted by prior loss experience, state of operations, and industry. Depending on the magnitude of COVID-19 claims that are deemed compensable, Workers’ Compensation rates may begin increasing in mid-2021.
How USI Can Help To help clients achieve the best results for their Workers’ Compensation renewals, USI also suggests they:
� Have a plan in place to prevent COVID-19 from spreading rapidly throughout the workplace and, if it does, have a containment plan ready.
� Monitor COVID-19-related Workers’ Compensation claims more closely and ensure that applicable local, state and federal health and safety guidelines are being followed in the workplace to strengthen any rebuttable positions.
� Anticipate that rates may level out or increase. Leverage proper loss and financial analytics to determine if a loss sensitive program structure makes sense, as well as the insureds’ capacity to assume risk at various retention levels.
� Ensure that payroll by classification codes is accurate, adjusted and monitored accordingly for repurposed employees, employees working remotely, and/or for employers whose operations have changed. Accordingly, maintain separate payroll records for the change in operations or the wages earned for an employee whose duties/roles have changed.
� Assess the ability to post collateral in today’s tighter credit market and evaluate applicable collateral alternatives and amounts posted relative to collateral requirements.
� Monitor the current and future utilization of independent contractors to determine the impact on the Workers’ Compensation program structure, costs, and losses should statutory law change to classify them as employees and not independent contractors.
Commercial Automobile, Primary General/Products and Umbrella/Excess Liability The Market Today and Market Capacity
Commercial Automobile Liability: The market for Automobile Liability continues to be challenging with no improvement since USI’s 2019 Q4 Market Outlook & Update was released. While Transportation risks have been more adversely impacted, there is regional disparity in the rate increases and capacity being deployed. More selective underwriting that includes evaluation and effectiveness of fleet safety programs, along with the use of available technology, will impact an underwriter’s pricing model or ability to provide capacity. Although the economic slowdown resulted in fewer vehicles on the road and subsequently a decline in accident frequency, catastrophic losses largely offset this reduction. Coupled with lower premiums, the combined loss ratio remains in excess of 105%. There continues to be an exodus of capacity from this coverage line, with some industry experts showing close to a 50% reduction in total limits. No new capital has shown interest in entering the market until loss trends level out and rates are deemed adequate. Data indicates the median costs of commercial automobile losses with fatalities over $1MM has risen steadily since 2014.

Industry Insights | USI 2020-2021 COMMERCIAL PROPERTY & CASUALTY MARKET OUTLOOK 13
While advances in technology and the growth of telematics (GPS and other technological loss prevention tools) in vehicles will continue to reduce accidents over time, these benefits are being offset by:
� Negative litigation trends resulting in higher claim severity.
� More vehicles on the road driven by fewer experienced drivers.
� A deteriorating public road infrastructure.
� The increasing rate of distracted driving.
� The increasing rate of medical inflation trends.
� The increased rate of high-speed accident survival, which corresponds with higher rehabilitation costs.
� Rising vehicle repair costs due to advances in technology and the higher cost of vehicles.
Most insureds with a commercial automobile exposure are experiencing cost increases regardless of vehicle class and driving radius, and this is trickling down to those insureds with fleet sizes below 100. Even insureds with clean prior loss records are experiencing significant rate increases. We are seeing greater rating discrepancies from a geographic perspective. Hired and Non-Owned exposure is increasingly being scrutinized and underwritten more carefully, with insureds being required to provide more detail on rental agreements, and insureds who drive their own cars on company business being charged a higher premium by insurers for these exposures. It is also becoming increasingly common for Umbrella insurers to demand primary attachment points of at least $2MM per accident for insureds with fleet sizes as low as 75 units in some cases, and require attachment points up to $5MM or higher for larger fleets. In turn, these added requirements are driving up the cost of the existing primary and buffer capacity.
Through the third quarter of 2021, we expect insureds with fleet sizes of 200 or less and with good loss experience to receive average rate increases of 10% to 20%, inclusive of the need for higher primary automobile limits of $2MM per accident. Insureds with fleet sizes of 200 or less with poor loss experience as well as insureds with fleet sizes in excess of 200 vehicles can expect average rate increases of 20% to 30%, and those insureds with fleets in excess of 200 can expect a 10% to 20% increase. As noted, these estimates will vary up or down based on the geographic radius of operations.
How USI Can Help USI’s risk advisors will take these vital steps when working with their Commercial Automobile Liability clients:
� Develop a quality underwriting submission that will best express the risk characteristics of the insured.
� Take inventory of all telematics tools and other safety initiatives the insured has invested in to reduce their risk exposure and improve driving behavior, including GPS and speed monitoring systems, interior and exterior cameras, and other technological loss prevention tools.
� Review applicable Compliance, Safety and Accountability (CSA) scores and take corrective actions. The CSA score, which is used to rate motor carriers in various categories such as unsafe driving, crash indicator, hours-of-service compliance, and driver fitness, is now the first underwriting factor used by insurers to assess a company’s risk profile and determine what it should pay for coverage.
� Determine early in the process the minimum underlying limits that the Umbrella markets are willing to attach above, and work with the primary insurers or buffer markets accordingly.
� Update driver lists and safety protocols, provide complete analytics on loss history and exposure, and provide a data-rich submission with clear underwriting goals from the client’s perspective.
� Review alternative program structures to ensure that the current one is the most optimal from a cashflow, retention level, cost, and collateral perspective. Consider assuming more risk through higher deductible levels, the introduction of corridor deductibles that would take on a measured amount of additional risk, self-insuring buffer layers, and/or having the insured or a captive take a vertical quota share percentage of the risk.
Primary General/Products Liability: During 2019, and to date in 2020, the industry has witnessed some of the most expensive General and Product Liability settlements on record, including many with corresponding punitive damages awards. The pace and magnitude of rate increases in the primary General and Products Liability market continues to escalate across most industries with few exceptions. Capacity constraints as a result of markets exiting this line are also contributing to rate pressure. Coverage is more

Industry Insights | USI 2020-2021 COMMERCIAL PROPERTY & CASUALTY MARKET OUTLOOK 14
restrictive, with many insurers now requiring communicable disease exclusions, among others. By extension, markets are increasingly unwilling to write primary liability lines on a standalone basis without Workers’ Compensation for many industries. This is making it difficult to separate program lines to achieve the most favorable renewal outcome. Similar to Automobile Liability, higher primary General/Products Liability limits of 2/4/4 are increasingly being required as the minimum underlying attachment point over which Umbrella markets are willing to attach. This is adding significant dollar amounts to the total cost of the primary layers or requiring some insureds to self-insure the layer above primary up to the Umbrella’s minimum attachment point. Premiums flowing into the Excess & Surplus (E&S) market increased close to 20%, year-to-date. Increased utilization of E&S markets is more common as the number of declinations rise quarter over quarter, and with the increasing exodus of capacity in the admitted market. Lastly, it is estimated that close to 10% of COVID-19 deaths are believed to be from infections brought home from the workplace by workers who contracted the disease on the job, infecting relatives or friends at home. Claims may also be alleged against organizations that failed to protect customers from exposure to the virus, especially retail and hospitality companies. Although it may be difficult to prove causality for these types of claims, the cost to defend such lawsuits, including wrongful death, will be high. Insurers will increasingly insist on endorsing clear and concise communicable disease exclusions or, at the very least, disease exclusions specifying the diseases to be excluded. Umbrella/Excess Liability: Umbrella & Excess Liability remains the most challenging casualty line to place, and it seems that each quarter it becomes increasingly more difficult to place business into the market. Umbrella/Excess insurers continue to cite the negative ramifications of “social inflation” as the main reason why Umbrella/Excess capacity and rates are being impacted more than any other liability coverage line, with few exceptions. Some insurers have mentioned that only a handful of large losses can wipe out the cumulative premiums for all accounts they underwrite, and this is not sustainable in the short or long run. Average blocks of capacity are now at $10MM per customer. Overall limits per customer are averaging no higher than $25MM, and limits are staggered throughout a tower. In certain industries and for clients with prior loss history, markets are deploying no more than $5MM in total maximum capacity. It currently requires 10-12 markets, in many cases, to complete a $100MM tower, whereas only a few years ago, it took only four-to-six markets. Insurers are also increasingly monitoring their aggregation of limits for clients in certain industries, so they are not overexposed to any one industry group. Available capacity is being reallocated higher up in towers, and markets are demanding higher rates for these layers on a price-per-million basis. Excess Liability markets higher up in the tower are now obtaining 50% to 75% of the rate in the layer beneath them. Many are reserving their rights to re-price the program should a market above them

Industry Insights | USI 2020-2021 COMMERCIAL PROPERTY & CASUALTY MARKET OUTLOOK 15
require pricing on a per-million basis (which is within a certain percentage of their pricing). Additionally, many excess markets now refuse to acknowledge the pricing models that have been developed below them and, instead, rate the pricing based on their own modeling of the risk. This distorts the pricing of a tower by potentially having a layer of insurance that is higher up in the tower cost more than layers of insurance further down in the tower, and closer to the risk.
Although industry surplus is at an all-time high, there appears to be no insurer(s) who are willing to jump into this market to begin competing more aggressively for premium dollars and, as noted earlier, the COVID-19 pandemic will only create more uncertainty and exacerbate market conditions. As a consequence, buyers of larger limits of liability are being forced to cut back on limits they purchase altogether, quota-share a portion of the tower to recapture premiums, and/or self-insure layers for which they formerly purchased coverage.
Small- to middle-market insureds who purchase $50MM or lower in limits are also facing pricing pressure, but not nearly as significant as larger accounts who purchase higher limits. With a few exceptions, these insureds are experiencing mid-single digit up to 25% increases on average. Another growing phenomenon for smaller- to middle-market insureds is that many Umbrella carriers are requiring that they participate on all or a
Lead Umbrella insurers are increasingly requiring underlying per-occurrence attachment points be raised to at least $2MM and higher, as well as higher aggregate limits in the primary layers of at least $4MM, which are now mandatory for many larger middle-market-to risk management clients.
We are also seeing the primary auto requirements of $2MM being pushed down to smaller insureds with fleet sizes as low as 100.
portion of the primary lines. This required linkage is adding yet another challenge to the marketing of accounts and the ability to switch insurance companies. Price increases continue to average double digits and some insureds are experiencing triple-digit increases year-over-year, despite attaching over higher primary Auto and General/Products Liability underlying attachment limits. The ability to completely fill out towers of $200MM and higher with sufficient capacity and uniform terms and conditions is very challenging and impossible for many clients who formerly purchased in excess of $500MM. Compared to prior years, a greater percentage of insureds voluntarily cut back in limits due to what they perceived to be excessive pricing. Many who formerly purchased in excess of $500MM in limits involuntarily cut back because finding the capacity to build the tower was impossible to achieve. The demand for rate increases is not expected to slow for the duration of 2020 and into 2021, although the magnitude of increases should become less severe beginning in mid-2021. It is likely that no industry will be spared, including clients with exceptional loss experience. Insurers will continue to demonstrate conservative underwriting practices and not deploy their surplus capital to write new or expanded business, with very few exceptions. Insurance companies appear to be in lockstep with each other and resolute in not trying to buck the current market trends. From a coverage perspective, we are seeing more restrictive terms, including insurers applying affirmative infectious/communicable disease exclusions, among other coverage limitations. Historically, the majority of policies were silent on infectious disease. While these exclusions can sometimes be removed for a price, the cost to do so can be excessive, and many insureds end up reluctantly accepting the exclusions.
� Through the third quarter of 2021, we expect General and Products Liability lines to average between 10% and 20% rate increase.
� Regarding Umbrella/Excess Liability, we anticipate rate increases between 5% and 25% for middle-market insureds.
� Larger insureds who purchase higher limits can expect rate increases ranging from 25% to 75%.

Industry Insights | USI 2020-2021 COMMERCIAL PROPERTY & CASUALTY MARKET OUTLOOK 16
How USI Can Help To offset the higher costs, many brokers and their insureds are looking at program structural changes, although many of these changes can result in higher retained losses, more restrictive coverage and more disruptive cashflow should losses occur. These major changes would include: having defense costs included in the limit of liability; aggregating all coverage lines including those that are traditionally not aggregated, such as Automobile Liability; amending aggregate drop-down provisions; having the insured or their captive take on a quota-share participation of the program tower; looking at structured approaches such as swing plans in which the ultimate cost is dependent upon losses; securing multi-year, single-limit policies; and changing the policy trigger from “Occurrence” to “Claims Made” or “Occurrence Reported.” A cost-benefit analysis needs to be completed to adequately determine if these changes should be implemented. USI suggests that clients take the following steps to secure a more favorable outcome:
� Prepare early for renewal, develop a plan of action, and dialogue with both incumbent and new markets at least 150 days in advance. Discussions should consider reductions in capacity, corresponding rates on a price-per-million-basis and any additional exclusionary wordings such as those pertaining to infectious disease or similar exclusions.
� Develop a quality underwriting submission and differentiate the quality of the risk from others, so it will stand out.
– Think critically about the risks that underwriters will be most concerned about and address them in the submission.
– Differentiate the nature of the risk, a step that is now more important than ever. Clients should clearly describe the qualities of their risk in their carrier submissions. Risk quality comes in several forms, including loss control/safety, contractual risk management, risk mitigation, capital expenditures, and willingness to engage risk control and overall risk management philosophy.
� Dialogue with incumbent and prospective markets to develop a relationship early in the process.
– Determine as early as possible the minimum underlying limits that the Umbrella markets are willing to attach over. Work with the primary insurers or buffer markets accordingly. Consider self-insuring above contractually required limits.
– Benchmark overall Umbrella/Excess limits purchased against peer groups to validate total limits purchased. Analyze severity trends inside and outside the insured’s industry to determine the appropriate number of total limits.
� Review coverage and the Terms & Conditions carefully to ensure that the policy intent and language is clear and that all exposures to loss have been addressed.
� Consider using alternative risk approaches such as a swing plan in which the ultimate premium is dependent upon losses in the swing layer.
� Consider structural changes including:
– Assuming a quota sharing layers of the tower, to better manage the cost and capacity constraints of the market.
– Including defense costs in the limit of liability in lieu of supplemental.
– Aggregating all coverage lines.
– Comparing and contrasting the cost-benefit of Claims Made versus Occurrence Reported triggers.

Industry Insights | USI 2020-2021 COMMERCIAL PROPERTY & CASUALTY MARKET OUTLOOK 17
Product Line Q2 2020 Q4 2020-2021 (YOY)
Public Company Directors & Officers Up 25% to 75% Up 20% to 100%
Private Company and Not-For-Profit (NFP) Directors & Officers Up 10% to 50% Up 10% to 60%
Employment Practices Liability (EPL) Up 10% to 50% Up 15% to 60%
Fiduciary Up 10% to 25% Up 5% to 50%
Crime Up 10% to 25% Up 10% to 30%
Professional Liability/Errors & Omissions 15% to 50% Up 10% to 50%
Network Security & Privacy (Cyber) Up 5% to 20% Up 5% to 20%
Technology Errors & Omissions Up 5% to 20% Up 5% to 20%
Representations & Warranties Down 5% to flat Up 10% to 20%
Kidnap & Ransom Up 5% to 10% Up 10%
NOTE: July 2020 Addendum Ranges = Public Company D&Os, 35% to 100%; Private Company and NFP D&O, 15% to 60%; and EPL, 15% to 60%.
EXECUTIVE & PROFESSIONAL RISK SOLUTIONS (EPS)

Industry Insights | USI 2020-2021 COMMERCIAL PROPERTY & CASUALTY MARKET OUTLOOK 18
Public Company Directors & Officers (D&O) The public company D&O marketplace will finish 2020 and begin the new year as the most challenging marketplace in recent memory. Risk differentiation in the marketplace is still feasible, but only the most desirable risk profiles, or those buyers who saw the most extreme increases a year ago, are achieving relatively stable renewals (20% to 35%). The remaining are generally seeing 35%+ premium increases, with some renewals approaching and occasionally exceeding 100% increases. The good news: a current influx of new excess capacity may indicate some market stabilization in 2021, but we are still anticipating that premiums will rise consistently.
Retentions and Coverage: Insurers are often forcing companies to higher retentions by either not offering the expiring retention as an option at renewal, or by incentivizing clients with relatively attractive premium discounts to take a higher retention. If buyers do maintain their existing retention at renewal, they may face a separate Mergers & Acquisition (M&A) retention that is higher than the standard retention. Other likely coverage reductions may include:
� More expensive Extended Reporting Period (ERP) terms.
� The reduction/elimination of shareholder derivative demand investigative costs coverage.
� The removal of reinstated limits from Side A DIC (Difference in Conditions) placements.
Looking forward, we see the following challenges and potential stabilizers:
Challenges Potential Stabilizers
Economic uncertainty as the financial impact of COVID-19 shutdowns continues. Added supply (capacity), especially from the U.S. wholesale marketplace and possibly Bermuda.
Resulting bankruptcies from a receding economy, particularly in the retail, entertainment/leisure, restaurant, booking/events, travel/airline and real estate sectors.
A recent California state court dismissal of a Section 11 (IPO) case for lack of jurisdiction due to the inclusion of Federal Forum Provisions (FFPs) in the issuing company’s articles of incorporation (Wong v. Restoration Robotics Inc., et al., 18CIV02609, Ca Sup. Ct. San Mateo County Sept. 1, 2020).
Another calendar year of 330+ (estimated) Securities Class Actions (SCAs).The consideration of alternative D&O structures, including the use of captive insurance company solutions.
The significant increase of Initial Public Offering (IPO) activity, including Special Purpose Acquisition Companies (SPACs), in 2020 may foreshadow more IPO securities litigation.
Reduced demand: companies reducing limits of liability purchased.
Sizable derivative claim settlements that can erode the profitability of Side A insurance.Successful return to economic normalcy with upcoming arrival of a COVID-19 vaccination program.
Increased regulation in a new administration. Limited volatility in the equities market.

Industry Insights | USI 2020-2021 COMMERCIAL PROPERTY & CASUALTY MARKET OUTLOOK 19
Current drivers of the market:
� Securities Class Action (SCA) Frequency: There were more than 400 securities class action claims in 2017, 2018, and 2019, many of which are unresolved. 2020 is on pace to have another 330+ SCAs.
� COVID-19 Impact: D&O insurers are concerned about SCA claims by investors alleging companies have misstated how COVID-19 has impacted their financial performance.
� Derivative Claims: As previously discussed, some sizable derivative claims settlements have adversely impacted D&O insurers’ bottom lines. Generally, derivative claim settlements are not indemnifiable losses and are therefore paid under the Side A portion of coverage, including dedicated Side A coverage.
� IPOs, Including Special Purpose Acquisition Corporations (SPACs): The number of IPOs, including SPACs in the U.S., has increased relative to 2019. Given that a limited number of D&O insurers will underwrite IPOs, including SPACs, IPO D&O premiums are much higher than standard public company D&O premiums. Retentions are also materially higher for IPOs, typically at $10MM and higher.
The Underwriting Process: D&O insurance buyers should expect continued underwriting scrutiny and a more rigorous renewal process. A buyer’s industry, claims history, regulatory exposure and stock price volatility will determine the amount of capacity that may be available. Companies with more concerning risk profiles – biotechnology, life sciences, general healthcare and technology industries, and those that have had significant D&O claims activity in the past five years – have a more limited group of interested insurers. This drives larger increases. Alternative Considerations: For D&O Coverage, the use of a captive insurer is a rarity. However, in a continued hard market, more companies may consider forming a captive or adding D&O coverage to an existing captive insurer. Overall: We anticipate continued upward pressure on premiums and retentions. Insurers also continue to manage limits of liability more conservatively (e.g., reducing limits from $15MM to $10MM, or from $10MM to $5MM). We also expect more underwriting scrutiny and possibly account-specific coverage restrictions. We will continue monitoring the impact of new capacity entering the public D&O marketplace in the hope of relative stabilization in 2021.
How USI Can Help USI can assist clients by:
� Communicating early and often, including with D&O insurers. Preparation is key.
� Preparing for COVID-19-related and ESG (Environmental, Social and Governance)-related questions ahead of time. Helpful resources may be located on USI’s Public Health Emergency page.
� Marketing D&O placements worldwide: U.S., Bermuda, and London marketplaces.
� Evaluating all options with your broker, including:
– Buying less D&O coverage. This might be a prudent strategy if an enterprise’s true risk exposure is understood. Use analytical tools to evaluate true exposure.
– Buying different D&O coverage. Buying more Side A DIC vs. Side ABC coverage can lessen the pricing impact and save money.
– Retaining more risk. Consider buying D&O coverage with a higher retention to help mitigate pricing increases. Or, consider accepting co-insurance for the Side B and Side C portions of D&O coverage if the premium offset is significant.
� Setting appropriate and realistic expectations with all client stakeholders.
� Presenting alternative structures if risk transfer costs continue to elevate.
Private Company/Not-for-Profit (NFP) Directors & Officers Coverage (D&O) While their premium and retention increases are not as severe as public company increases, Private Company/NFP D&O premiums and retentions continue to rise, closely resembling the increases detailed in USI’s 2020 Q2 Market Outlook report. Specifically, we are seeing:
� Primary Layers: Up 10% to 60%, depending on individual account drivers.
� Excess Layers: Up 10% to 40%, as Increased Limit Factor (ILFs) percentages also rise.
� Retentions: Up 25% to 100% or more (for example, a retention of $75,000 increasing to $150,000).

Industry Insights | USI 2020-2021 COMMERCIAL PROPERTY & CASUALTY MARKET OUTLOOK 20
Additionally, some coverage offerings are being pulled back in Q4 for accounts with particular risk drivers. These changes are most pronounced for companies that:
� Are burdened with debt/bankruptcy potential.
� Have significant COVID-19-related exposure, including exposure to potential government investigations, False Claims Act claims, and/or whistleblower claims.
� Have reported claims or suffered losses due to past claims.
� Are executing or contemplating Mergers & Acquisition (M&A) activity.
� Are “unicorns” (i.e., high valuation private companies without financial metric certainty).
The most financially troubled, claims-impacted and/or COVID-19-exposed firms may experience increases that exceed the high end of these ranges. Driver – Claims: The increasingly diverse number of claims (antitrust and unfair trade practices, tortuous interference, regulatory, i.e.) against private and Not-for-Profit (NFP) organizations’ D&Os, and the accelerating costs to defend them continue. Coverage Impact: The broad-based coverage that Private Company/NFP D&O policies have historically offered (full “entity” coverage, as an example) are also tightening. Coverage pullbacks are being undertaken by several conventional insurers, including eliminating pre-determined extended reporting periods (ERPs) and “additional Side A” limits for directors. Firms in industries with anti-trust exposures (healthcare, for example) may struggle to retain any anti-trust coverage extensions. Privacy/confidentiality-related exclusions may also be mandated by insurers at renewal. Governmental funding exclusions and higher-class action Self-Insured Retentions (SIRs) have also been seen. Importantly, in the wake of COVID-19 claims, insurers could look to expand the Bodily Injury or Property Damage (BIPD) exclusion on policies by:
� Changing the “for” preamble language to broad form “based upon, arising out of…” language, and/or
� Removing any emotional distress or mental anguish carve-backs to the BIPD exclusion.
In extreme cases, larger privately held companies may see more limited coverage offered for the organization/entity itself (a pullback from the full entity coverage historically offered).
Side A (covers individual insureds when not indemnified by company): Side A and Side A Difference in Conditions (DIC) premium increases for Private Company/NFP D&O organizations will depend on the likelihood of bankruptcy and other company-specific factors. Distressed firms may see large pricing increases (50%+) on Side A coverage. Increased Underwriting: Companies will face COVID-19-specific questions about the operational and financial impact of the crisis on their business. Questions about corporate governance in relation to COVID-19, cyber security, regulatory exposure and social justice are also likely. Limits/Capacity: Some insurers are reducing limits at renewal (for example: from $10MM to $5MM), as they seek to mitigate exposure.
How USI Can Help USI can assist clients by:
� Starting the placement process early and engaging more insurers when marketing.
� Assisting in identifying potential COVID-19 financial distress and/or social justice exposures and then working with clients and prospects to identify specific steps/practices to mitigate these risks and communicate them effectively to underwriters.
� Seeking favorable baseline D&O terms through USI’s “ExecuSafe” panel of insurers. These pre-arranged terms can make it more difficult for proposed insurers to restrict coverage for USI clients.
� Talking about Side A coverage specifically. Private companies and NFPs that do not currently buy dedicated Side A D&O insurance should consider doing so. Current insureds should reexamine their policies for limits adequacy.
Industry Insights | USI 2020-2021 COMMERCIAL PROPERTY & CASUALTY MARKET OUTLOOK 21
Employment Practices Liability (EPL) Overall: Increases in premium and retentions, and carrier trepidation to compete in the EPL marketplace amidst the dramatic COVID-19 economic impact, are expected well into 2021. Some insurers continue to pull back from writing any “new” EPL business (i.e., clients who have either not previously bought the coverage, or those who are potentially new insureds to the carrier). Further, California, Illinois and New York (among other states) remain more problematic for EPL insurers due to more employee-friendly regulatory and legislative activity. While we have not noted a significant rise in EPL claims year-to-date, EPL risks can lag and may not materialize until an extended recession materializes. Given the broad impact of COVID-19, including complex back-to-work challenges for employers, there is no industry or business size that is insulated from future EPL exposure. Additional waves of COVID-19 outbreaks are exacerbating already difficult circumstances. Businesses that will face the toughest treatment in the marketplace are those that cannot open to full capacity, those that are forced to re-close due to governmental restrictions, and those that are susceptible to closing permanently. Companies that survive and need to transition more workers back from a work-from-home (WFH) environment may encounter unpredictable employment-related risks. Premium and Retentions: Premium increases are across the board, ranging from up 15% to 60%, depending on risk-specific parameters. Retentions are under even more pressure than premiums, as retention increases of over 100% are commonly being seen (examples: increases from $50,000 to $150,000 or from $150,000 to $350,000). Factors impacting premium and retention changes include COVID-19 crisis actions (layoffs, furloughs, pay cuts), overall employee count, the number of unionized employees, the average compensation level of employees, recent EPL loss history, and employee location (state or states). California (CA) remains the riskiest jurisdiction according to EPL underwriters and claims by CA-based employees may face a higher retention. Companies are also facing higher retentions for claims brought by “highly compensated” employees and/or for claims brought as class (or mass) actions. For larger companies (typically 5,000+ employees) that may be able to consider the Bermuda marketplace for EPL coverage, retentions under $1MM are extremely rare. The London marketplace today is not a realistic alternative, as London insurers have become extremely restrictive in this area of risk.
Driver – Potential Claims: areas of concern for claims include:
� Claims by healthcare providers stating that their employers have retaliated against them for raising patient safety concerns involving the treatment and spread of COVID-19.
� Continued distribution claims based on disability, age, race, sex, and other protected classes.
� Whistleblower and retaliation claims arising out of alleged violations of federal laws.
� Potential claims stemming from employee social media use.
� Wage & Hour (W&H) claims as companies adjust their workforce classifications, including making distinctions between employees and independent contractors.
� Third-party claims brought by non-employees for harassment or discrimination.
There is a broad belief that once our economy reestablishes some level of normalcy with regulatory (Equal Employment Opportunity Commission (EEOC)) and court activity ramping back up, EPL claims activity will surge. Considering EPL claims can have this “long tail” and that Reductions in Force (RIFs) will likely continue into 2021, we expect the EPL market will continue to harden. Coverage: Allegations of violations of the Biometric Information Protection Act (BIPA), passed in Illinois in 2008, have increased, and some insurers have begun to ask more underwriting questions and/or have added exclusions. On a related topic, more EPL insurers are now looking to exclude all confidential information-related employment exposures from EPL policies, forcing coverage analysis to another line of coverage – Cyber Liability. In all cases where exclusionary language is unavoidable, buyers should ensure that their EPL policies include coverage for retaliatory allegations.
LGBTQ Supreme Court Decision: In June 2020, the U.S. Supreme Court ruled that the Civil Rights Act of 1964 protects gay, lesbian, and transgender
employees from discrimination based on sex. Underwriters see this decision leading to more
employment discrimination claims in 2021.
IMPORTANT

Industry Insights | USI 2020-2021 COMMERCIAL PROPERTY & CASUALTY MARKET OUTLOOK 22
How USI Can Help USI can assist clients by:
� Reviewing their EPL policies for “who is an insured” and for any exclusions to determine if the coverage is suitable for their needs, especially in a transition from a WFH environment to a “back-in-the-office” environment.
� Preparing them to respond to expanded underwriting questions.
� Evaluating whether specific coverages will be available (i.e., punitive damages and W&H coverage).
� Helping engage all available risk management services that are negotiated as part of standard EPL coverage.
� Reminding them to review and update all internal employment checklists and contracts, consult with counsel, and develop any needed internal process or checklist to ensure that their workers are properly classified as employees or independent contractors.
Fiduciary Liability Overall: The adverse macroeconomic pressures associated with the COVID-19 lockdowns, large settlements related to excessive-fee litigation and increasing regulatory and governance uncertainty, have led to premium increases. The range is wide: up 5% to 50%. Increases in retentions are also becoming more common. Some leading insurers are mandating across the board “class/mass action” retentions that are significantly higher than the standard fiduciary retention. The most significant premium and retention increases are likely to be experienced by those firms with:
� Excess fee litigation exposures or claims/losses.
� Employee Stock Ownership Plans (ESOPs) – as valuations may be outdated or severely impacted in a down economy.
� Proprietary funds in the retirement plans (Financial institutions), and/or
� High levels of company stock holdings in retirement plans.
Organizations that secured zero-dollar retentions in the past will likely find this unattainable as they are being replaced at renewal with $10,000 to $50,000 minimum retentions, depending on underwriting variables.

Industry Insights | USI 2020-2021 COMMERCIAL PROPERTY & CASUALTY MARKET OUTLOOK 23
Limits: Insurers continue to manage capacity (i.e., offering $5MM in limits instead of $10MM), which makes securing excess limits from additional insurers a necessity. Further, the pricing of excess fiduciary limits, which has been historically competitive, is firming as some typical excess fiduciary liability insurers are limiting new business considerations. Coverage: In addition to increased retentions, we are seeing multiple insurers looking to place “excessive fee litigation” exclusions across many classes of commercial businesses (these businesses are no longer solely educational and healthcare-related not-for-profits). This is problematic given the increased litigation exposure. We have also seen some proposed limitations in coverage related to government-funding exposures. Overall, we expect the market to continue firming through the first half of 2021 as other areas of risk uncertainty weigh on underwriters. For example, the continuation coverage requirements of COBRA (the Consolidated Omnibus Budget Reconciliation Act of 1985) are well-established but, in the face of more job terminations in an uncertain economy, employers will be more challenged in administering COBRA notifications. 2020 has seen a notable increase in class action litigation against employers seeking statutory and other penalties due to alleged violations of COBRA’s election notice requirements.
How USI Can Help USI can assist clients by:
� Preparing them for new or expanded underwriting questions about service provider selection and comparison processes (401(k) and other financial service providers).
� Sharing risk management support made available by fiduciary liability insurers.
� Working with them on appropriate governance controls, which can include the creation of Employee Retirement Income Security Act of 1974 (ERISA)/fiduciary advisory boards and regular updates to a plan sponsor’s boards of directors.
Crime/Fidelity Bonds Overall: With the continuing frequency and severity of “social engineering” (fraudulent inducement/business email compromise) amplified by a remote workforce during
COVID-19, we anticipate premium increases that are up 10% to 30%. Retentions/deductibles are expected to increase (up 25% to 50%), particularly for employee dishonesty, computer transfer fraud, and social engineering extensions. Focus on applications: Insurers will continue to scrutinize main form and supplemental application details to thoroughly underwrite internal control and verification procedures used by insureds in order to protect assets from theft and social engineering/accounts payable-type losses. Insurers will focus on accounts payable and verification of payment processes. Some insurers will incorporate exclusionary language in policies related to the failure to follow these controls. More stringent underwriting of social engineering limits and additional questions will continue, especially if answers given by insureds create underwriting concern. Employee Count: Given current and anticipated increases in Reductions in Force (RIFs), furloughs and work from home arrangements, underwriters will be closely monitoring an insured’s ability to maintain proper segregation of duties and effective checks and balances. Impending RIFs may make remaining employees fearful of potential job loss and more likely to consider acts of theft and fraud. Companies with a track record of having no losses and strong internal controls will receive the most favorable results. Limits: Some insurers may deploy limits more conservatively and insurers may cap limits offered to $5MM to $10MM, while capping aggregate exposure.
How USI Can Help USI can assist clients by:
� Preparing clients to share details sought by underwriters regarding transaction verification processes and procedures. Clients that highlight thoughtful risk practices for underwriters will help differentiate their risk profile.
� Differentiating clients by industry. In the COVID-19 environment, the risk controls implemented by companies that have staff working from home (professional services groups, as an example) differ from the specific controls maintained by employers whose staff works on location (such as construction companies).
� Addressing potential cross over with Cyber Insurance. USI can explain the differences and seek to manage the coverage applicability across both policies. In the event of a reduction in limits overall, or a reduction for Social Engineering coverage, USI can secure additional limits in the excess market.

Industry Insights | USI 2020-2021 COMMERCIAL PROPERTY & CASUALTY MARKET OUTLOOK 24
Professional Liability/Errors & Omissions (E&O) The Professional Liability/Errors & Omissions market, not inclusive of Medical Malpractice, has moved into a hardening market, with most sectors experiencing premium and/or retention increases. Additionally, the use of COVID-19 broad form exclusions is rising in the E&O space. Non-Financial Institutions: Law firms, mortgage processors, accountants, consultants, architects and engineers, and project-specific construction and trusts (and those performing any valuation-based service) will continue to see a decrease in the number of primary and excess markets available for their E&O coverage. This is leading to premium increases of 15% up to 50%, along with increased retentions (up 25% to 50% year-over-year). E&O insurers are also examining limits offered at renewal. For example, a carrier previously offering $15MM in limits may seek to reduce capacity to $10MM. Limit reduction trends seem to be gaining momentum and are becoming more commonplace for all industries. Added exclusions for regulatory exposures, deeper underwriting processes (particularly the management of subcontractor and third-party consulting arrangements) and reviews of “professional services” definitions are all becoming more common. Some insurers are removing the provisions related to “automatic additional insured when required by contract” and are asking more questions about managing the oversight of suppliers. Financial Institutions (FI): Investment advisors, broker-dealers, deposit-taking institutions and insurance companies continue to be scrutinized at renewal, with some insurers exiting the space and others establishing new minimum premiums and SIRs. Volatility of the financial markets, the fear of increased regulatory oversight and the post-COVID-19 insurance claims environment have all created uncertainties for FI E&O underwriters, which is driving up premiums and retentions. Due to COVID-19 impacts, there is an overall focus on how professional services firms are addressing deadlines and the continuity and quality of services performed. As a result, firms may face increased questions from underwriters related to announced Reductions in Force (RIFs), potential RIFs, and/or compensation cuts.
How USI Can Help USI can assist clients by:
� Providing insureds with sample underwriting questions and helping them understand why these questions are being asked and offering suggestions for appropriate responses.
� Tracking the most competitive insurers in the marketplace to better understand their underwriting appetites and their willingness to creatively address risks.
� Highlighting a client’s risk management differentiators and positioning their risks accordingly.
� Examining the scope of client professional services (as many firms are modifying and diversifying their offerings) and amend current coverages as needed.
Network Security/Privacy Liability (Cyber) As instances of network intrusions and ransomware events increase and escalate, cyber rates continue to show trends of hardening. This hardening is primarily being driven by historically soft excess rate factors, spiked levels of ransomware events, and diverse network intrusion attacks across multiple industry verticals – targeting not only environments rich with data, but also those that are reliant on network uptime. Insurers are challenged to balance increased extortion demand amounts against premium amounts collected. Insurers are also focused on contingent indirect losses associated with a cyber event and are also responding to the evolving face of regulatory changes, including the guidance by regulatory bodies. There has been a marked increase in Q3, expected to continue in Q4, around Self-Insured Retentions (SIRs) and premiums for those companies under $1B in revenue; the fact that the first potential “cyber death” occurred late Q3 2020 and middle-market companies have become Ransomware targets, makes these increases likely to continue. Within this evolving environment, we have seen the increase of SIRs and premiums for those companies under $1B in revenue. Additionally, insurers are more insistent about increased application materials designed to provide insurers with specific information about a company’s information security technical controls, policies, posture, and protocols. Equally, insurers are also focused on the supply chain of vendors that support the infrastructure and business functions

Industry Insights | USI 2020-2021 COMMERCIAL PROPERTY & CASUALTY MARKET OUTLOOK 25
of applicants. Insurers have begun to increase their utilization of third-party vendors to assess policyholders’ external networked environments, which will help to inform premiums and scope of coverage. Bad actors continue to become increasingly savvier and persistent, not only in attacking those industry verticals rich with confidential information, but also in attacking those companies that support them. This includes infrastructure and third-party vendors who serve as the foundation for these companies. Their reasoning is simple: Why attack a hospital when you can attack the vendors that support them? It is critical to note that businesses over $1B in revenue and those in “challenging classes,” such as retail, hospitality, healthcare and financial institutions, continue to receive increased pricing and SIRs, and require additional underwriting metrics. For these larger companies and challenged classes of business, increases in premium up to 20% and SIR increases up to 50% have been seen. We expect this trend to continue throughout 2020. Those accounts with $1B or more in revenue and claims paid can expect 20% to 35% baseline premium increases, higher SIRs, and requests for additional underwriting metrics. Ransomware and phishing attacks were on track to reach historical heights prior to the pandemic, and exposures have been increasing. Many non-essential companies have switched to a remote work environment that is likely to remain in place. While remote working environments are not new, the number of workers doing their work remotely has increased substantially. These workers are utilizing varied ways to connect, transact, and access company assets. Some will utilize company devices; others will use their own devices to connect. Both methods can result in additional exposures that insurers are carefully monitoring. Technology Errors & Omissions (E&O): The Technology E&O marketplace is at the center of a perfect storm. While capacity is plentiful (limits up to $800M are being advertised in the marketplace), premium rates—particularly excess rates—are firming rapidly as the market appears to be overcorrecting historically soft excess rates. Targeted claim campaigns against technology providers are increasing, resulting in disruption to a customer’s business. In general, insurers are seeking to manage the risk to their overall portfolio by increasing premiums. Programs with flat exposure variables are experiencing primary rate increases of 5% to 10% and excess rate increases of 20% to 40%. Insurers are also requesting additional information designed to provide a deeper understanding of a buyer’s professional liability/E&O risk.
How USI Can Help Through our vast network of regional, national, and international cyber solution specialists, proprietary tools, and expertise in privacy and network risk, USI is well-equipped to help clients understand their coverage options and pursue the appropriate solution.
Transaction Liability – Representations & Warranties Insurance (RWI) From 2017 to the first half of Q1 2020, the number of insurers and the amount of capacity available in the RWI space grew exponentially (from six or seven, to just over 20). RWI rates declined on average 10% or more each year, up to the latter half of 2019, where rates were still falling but not as steeply – flat to down 5%. In Q1 of 2020, rates were relatively flat and began to fall in the wake of the COVID-19 crisis and ensuing slowdown in M&A activity. The third quarter has brought big changes to the RWI landscape, including:
� Transaction Activity: Picked up significantly beginning in June and July, with most insurers citing submission levels at the same or higher levels than Q4 2019 and Q1 2020. Most insurers cited 70% to 80% drops in submission activity for the months of April, May, and June.
� Q4 Transactions: Given the volume of transactions that will be closed in the fourth quarter, some insurers are becoming more selective on smaller transactions (those less than $50MM in Enterprise Value (EV)) and are having their limited underwriting staffs focus on larger EV/higher premium transactions.
� COVID-19 Exclusions: Insurers are now easing back on mandated COVID-19 exclusions and are underwriting to the exposure more leniently, resulting in more limited or no COVID-19 exclusions on the policies.
� Claims: Several leading insurers have publicly cited recent and notable increased claim severity and are addressing it in their go-forward underwriting rates and in their capacity offered. Most insurers indicate that claim frequency remains around 20% (one claim for every five transactions written). Several prominent insurers note that the most severe claims tend to be caused by breaches of the financial statements , material contracts, and customer representations.
� Rates: Rates are now 10% to 20% above Q4 2019/Q1 2020 levels. As an example, an average $10MM policy that would have cost $265,000 to $290,000 between nine and 12 months ago, will now cost between $300,000 and $350,000.

Industry Insights | USI 2020-2021 COMMERCIAL PROPERTY & CASUALTY MARKET OUTLOOK 26
� Capacity: Insurers are trimming back their limits offered, typically keeping to $25MM participations or lower. Some of the larger insurers will still offer $50MM but will only do so on a ventilated basis, meaning that they may offer participation on a lower level of a program/tower and then participate at upper level excess layers.
� Underwriting Focus: Underwriters are tightening their underwriting focus, paying attention to:
– Earnings multiples paid for a target firm and the valuation process a buyer has conducted to arrive at a purchase price.
– Breadth of the representations and warranties that sellers are providing in purchase agreements.
– Representations and diligence relating to material customers and the soundness of those relationships and contracts moving forward.
We expect these trends to continue through Q4 2020 and into 2021. Rates will likely remain where they are now as the RWI insurers have all generally adopted the increased rate environment pricing. If claim frequency and severity continue, we expect to see rates trend upwards. We see little evidence that would lead us to expect any flattening or decreased rates in the next three months. We expect SIR levels to remain static through the next quarter. We will also be keeping an eye on the general dynamic in the M&A space. The market seems to be shifting from being a “seller’s market” to one having a more level playing field.
How USI Can Help
� USI can leverage our extensive experience and capability in Transaction Liability to help our clients work through standard acquisitions and more challenging transactions involving distressed assets and bankruptcy-related asset sales. Helpful resources can be found on USI’s Public Health Emergency page.
� Navigating the final underwriting phase can be challenging with underwriting questions sometimes leading to proposed exclusions. USI’s Representations & Warranties expertise regularly helps in mitigating or eliminating these exclusions.
� The USI team is experienced in working with first-time buyers and transactions ranging from smaller Enterprise Value to larger $1B+ EV transactions. We are well equipped to proactively help our clients work through the unique and often challenging procurement process for Representations & Warranties insurance.
When brought into the front end of deal negotiation, USI can demystify the Representations & Warranties procurement process and shed light on pricing, underwriting requirements, policy terms, timing, and other expectations – paving the way for a “no surprises” experience.

Industry Insights | USI 2020-2021 COMMERCIAL PROPERTY & CASUALTY MARKET OUTLOOK 27
Primary Foreign Casualty: Rates for Guaranteed Cost programs have stabilized and are remaining flat to 5% for low to moderate risk exposures with good loss history and complete renewal data. In addition, we have seen a lowering of limits (redeployment of capacity Primary Foreign Casualty: Rates for Guaranteed Cost programs have stabilized and are remaining flat to 5% for low to moderate risk exposures with good loss history and complete renewal data. In addition, we have seen a lowering of limits (redeployment of capacity on upper layers and lowering of limits in excess of $5MM). As related to Automobile, we continue to see rate increases of 15%+. Primary Foreign Property: For risks that have good loss experience, we are seeing 20%+ for non-catastrophic exposed risk and 40%+ on risks in exposed catastrophe zones. As related to Enhanced Underwriting, carriers are requiring location-specific engineering reports and detailed Construction, Occupancy, Protection and Exposure (COPE) information prior to offering quotations. Where previously markets would write 100% of a risk, we are currently seeing markets reducing capacity on high hazard exposure and/or large value locations. It should be noted, however, that Global/International Property Programs still represent the best value for clients in terms of premium and terms and conditions, as opposed to localized purchasing of property coverage. An important consideration is the loss of Interdependent Business Interruption (IBI) under a Global/International Property Program when a Global Property Program is bifurcated. The insured is left with a U.S. Domestic Property Policy and an International Master Difference-in-Conditions/Difference-in-Limits (DIC/DIL) Policy for the foreign exposures. Bifurcating the program will result in any IBI between the U.S. and foreign locations to be covered under a Contingent Business Interruption sublimit. This, in general, is significantly lower than the IBI under a Global Property Program’s IBI coverage limit.
INTERNATIONAL
Product Line Q2 2020 Q4 2020-2021 (YOY)
International Liability Flat. Auto up 15% + Up 5%. Auto up to 15% +
International Property, CAT Exposure Up 40% + NO CHANGE
International Property, Non-CAT Exposure Up 10% to 20% + Up 10% to 20%

Industry Insights | USI 2020-2021 COMMERCIAL PROPERTY & CASUALTY MARKET OUTLOOK 28
� Some insurance carriers have started implementing absolute exclusions for communicable diseases on General Liability policies for certain industry verticals, such as for healthcare, real estate, hospitality, non-profits, and non-governmental organizations. On these same industry verticals, carriers have also started implementing substantial Self-Insured Retentions for foreign Workers’ Compensation exposures as related to communicable diseases.
� In China, carriers are now reducing their originally offered sub-limits on endorsements, which provided affirmative coverage for Disease and/or Defective Sanitation.
� All countries are reviewing coverage for Workers’ Compensation/Employers’ Liability, given that employees are still in a “work from home” environment.
� Travel is still highly restricted. Estimating upcoming travel has become difficult for many clients. Foreign Package insurers are not willing to include an audit clause.
How USI Can Help
USI facilitates its global risk assessment process for companies with decentralized multinational insurance programs. By moving to a centralized Controlled Master Program, clients can achieve overall premium savings, have concurrency and consistency of coverage, eliminate coverage redundancy, and eliminate potential gaps in coverage. We will also help to:
� Guide clients toward establishing schedules and protocols for identifying and evaluating international exposures throughout the year.
� Guide clients toward developing and establishing processes to push standardized loss control and safety procedures across their organizations.
� Keep clients informed about changes in foreign local coverages, requirements, and laws related to insurance that could impact their ongoing operations.
� Track client International Total Cost of Risk (ITCOR), which allows them to manage their TCOR on a global and local basis by:
– Identifying opportunities for risk consolidation,
– Eliminating insurance purchasing that does not meet their Risk Management Philosophy, and
– Removing duplicate coverage.
“Insurance carriers are starting to include communicable disease exclusions in their property coverages.”
Impacts of COVID-19:
� Insurance carriers are starting to include communicable disease exclusions in their property coverages. These exclusions apply to local policies in addition to master property policies. On casualty lines, carriers are also applying these communicable disease exclusions on certain classes of business, including hospitality, higher education, and non-profit organizations.
� Due to global “lockdown initiatives,” we are experiencing delays in receiving carriers’ quotes and responses.
� The requirements of carrier inspections are impacting quotation delivery. We have seen instances where carriers want to inspect property locations, but because of “lockdown initiatives,” the engineers are not allowed on the premises.
� Carriers are also requiring documentation from insureds as to their COVID-19 mitigation strategy.
� In tariff-rated countries (countries where the government usually sets the property rates), we are seeing an enforcement of the vacancy clauses within commercial property policies.
� United Kingdom Employers’ Liability is triggered out of negligence, causing death, injury or disease arising out of the course of employment. If a claim is made pertaining to work-related disease arising from COVID-19, the policy will defend on behalf of the insured, and “if found legally liable,” should indemnify the insured. Therefore, the employee would first need to establish and prove a breach of duty on the part of the employer.
� A comparable position is being taken in other countries, where Workers’ Compensation (or similar coverage) is procured in the private insurance market. In countries where Workers’ Compensation is provided through a governmental Social Scheme, the Schemes continue to address sickness/death to COVID-19 as they would any other infectious disease.

Industry Insights | USI 2020-2021 COMMERCIAL PROPERTY & CASUALTY MARKET OUTLOOK 29
AVIATION
Product Line Q2 2020 Q4 2020-2021 (YOY)
Aviation Up 15% to 30% Up 20% to 35%
Rates Continue to Soar The global aviation insurance market has continued to harden throughout 2020, following many previous years of unprofitable underwriting results across all disciplines. We expect the entire market to continue contracting through Q4 2020 and into 2021, which will result in aviation insurance writers becoming more selective about the risks they assume. Compounding this situation is the ongoing COVID-19 pandemic and the negative impact it has had on earned premiums collected by aviation insurers. Combined, these issues have contributed to the further acceleration of hard market conditions. We have seen average increases across our aviation portfolio ranging from 20% to 30%, with some categories receiving even higher rate increases. We have also seen underwriters closely examine their policies and withdraw capacity for certain supplemental coverages. To better understand why this is happening, it is important to know that the aviation insurance market experienced an unprecedented and steady rate decline from 2006 to 2018. During this timeframe there was an overabundance of underwriting capacity and insurers were fiercely pursuing top line growth. In response, the insurance market decreased rates and maintained a very liberal position regarding pilot requirements and supplementary coverages. In 2018, the prolonged soft market conditions caught up to aviation
insurers and they struggled with significant claims activity and a premium base that was well below sustainable levels. In 2019, close to a dozen companies stopped underwriting aviation coverage around the globe due to heavy underwriting losses, which prompted the rapid change of market conditions. Last year was, in fact, the most difficult claims year for the global aviation insurance market since 2001, leaving insurers pressured to obtain underwriting results that would help restore their profitability. The year 2020 kicked off with some significant losses that have contributed to the increasing market conditions, including the January helicopter accident involving basketball legend Kobe Bryant, and the series of damaging tornadoes that struck regional airports in the Southeast United States. The weather events alone have resulted in an estimated $100MM in aircraft losses. The COVID-19 pandemic is also further eroding the aviation insurance industry’s premium base. Tens of thousands of aircraft around the world have been parked, and insureds have sought premium returns via lay-up clauses and ‘ground only’ coverage changes. Revenues are also significantly declining for all categories within the global aviation industry, with traffic levels down in most countries by 60% or more from 2019 levels. This has led aviation insurers to continue pushing for higher rates as a way to replace premium that is being lost due to COVID-19 credits and decreasing revenues.

Industry Insights | USI 2020-2021 COMMERCIAL PROPERTY & CASUALTY MARKET OUTLOOK 30
How USI Can Help
USI works closely with our aviation clients to develop a comprehensive risk management strategy tailored to their unique exposures and focused on mitigating their cost of risk. Processes include:
� Generating complete analytics to understand and quantify exposures.
� Reviewing program options and retention opportunities.
� Evaluating program limits and coverage needs.
� Developing an extensive, comprehensive underwriting submission and loss mitigation narrative highlighting training and safety protocols, risk control/claim management measures, and more (helps to demonstrate “best-in-class” status).
� Researching markets and identifying carriers with whom clients can build strong relationships.
This approach is especially valuable when purchasing or renewing coverage during challenging times like these, when companies may be pressured to accept the pricing, terms, and conditions imposed on them by restrictive carriers. To achieve a favorable coverage outcome, we suggest:
� Providing detailed information that will allow us to better understand your risk management situation and needs.
� Completing applications and questionnaires fully and completely.
� Highlighting your focus on safety and pilot training protocols, especially training that goes above and beyond Federal Aviation Administration (FAA) requirements.
� Being open to underwriter and loss control visits.
USI’s Aviation Practice Group has developed helpful STEER (Steer Through Epidemic & Economic Recovery) materials pertaining to COVID-19 and its impact on market conditions. These resources may be located on our Public Health Emergency page. Here is a closer look at some of the categories within aviation that are being affected by the current market challenges:
� Owner-Flown Aircraft
– Higher liability limits are scarce, and coverages are being reduced.
– Pilot training is being scrutinized more heavily and new training requirements are being required.
– Pilot age is being closely scrutinized and older pilots may have trouble finding coverage.
– Premium increases are in the high double digits: between 50% to 100%.
� Charter Operations
– Extensive loss history could mean difficulty in finding 100% placement. In many cases, a layered program is needed.
– Single Pilot Charter operations are under intense underwriting scrutiny and limits have been drastically reduced in this area.
– Large fleets with a history of attritional losses are facing 50% to 100% rate increases and the introduction of higher deductibles.
� Rotor Wing Aircraft
– This category has been especially hard hit, with rate increases of 50% to 150% and climbing, depending on loss history.
– Large commercial rotor-wing fleets require a vertical program structure with multiple insurers participating.
� Manufacturers’ Product Liability: Potential rate increases of 40%+, depending on the critical nature of the product and limit needed.
� Airport and Municipality Coverage: Potential rate increases of 20%+, with some supplementary coverages being reduced.
“The year 2020 kicked off with some significant losses that have contributed to
the increasing market conditions.”

Industry Insights | USI 2020-2021 COMMERCIAL PROPERTY & CASUALTY MARKET OUTLOOK 31
The upward trend of environmental claim severity and frequency continues in 2020. Currently dominating the headlines are the unprecedented COVID-19 claims that will further accelerate environmental claim activity, particularly for those insurers who had “viruses” within the definition of Pollution Conditions. In most if not all cases, environmental insurers are attempting to run from the pandemic, even in instances where they included specific virus coverage in policies without exclusions for communicable disease. Industry insiders are waiting to see how the liability and business interruption case law will develop. As of now, liability claim activity appears to be very low, and businesses are putting helpful protocols in place to protect themselves. They are also searching for Business Interruption coverage and liability coverage and/or solutions for viruses and are asking why these solutions are not widely available. We will continue to monitor this situation and are watching for any new coverages or solutions that may become available. Over the past decade, the environmental marketplace has expanded significantly to include over 50 insurers in the space. This has led to significant competition and more customized solutions, all with a much better risk-trade for buyers. In 2021, there is likely to be a hold on new entrants, given the pandemic, and we are already seeing that certain insurers have cut their capacity even though overall market capacity is approximately $700MM. Specific to COVID-19, we are seeing insurers reduce or eliminate virus coverage from their policies to the extent they were providing any virus coverage at all. The insurers have also developed varying exclusions, either broadly as respect to viruses, or specific to COVID-19. If any level of virus coverage is still being offered, it is usually with small sub-limits of $1MM or less and is specific to disinfection/cleanup, with no coverage for business interruption or toxic tort liability. If there are mid-term changes to a policy such as related to an acquisition, insurers may apply new rules or coverage restrictions (pertaining to viruses or COVID-19) at that time on the newly added entity or covered locations.
ENVIRONMENTAL
Product Line Q2 2020 Q4 2020-2021 (YOY)
Environmental Combined General Liability/Pollution Up to 10% 5% to 15%+
Excess Combined General Liability/Pollution 10% to 20%+ 15% to 25%
Environmental Contractors’ Pollution No Change No Change
Environmental Pollution Legal Liability Flat to inflationary increases.
No Change

Industry Insights | USI 2020-2021 COMMERCIAL PROPERTY & CASUALTY MARKET OUTLOOK 32
Overall Marketplace Trends
� Expansion of Coverage: more markets offering some broader coverage enhancements to capture greater market share, such as first-party Diminution in Value. For Defense Outside of Limit, either at a defined limit or in some cases on a Contractors’ Pollution Policy, insurers may provide unlimited defense coverage. A new Cost Cap Policy has been re-introduced for cleanup projects exceeding $5MM.
� Transactional Risks: 10-year term policies for historical pollution legal liability are still available from a short list of insurers.
� Higher Hazard Risks such as energy, mining, petrochemical, power and utility firms, and fuel hydrant systems (including airports), may find only short policy terms of one-to two-years.
How USI Can Help
� By providing updated COVID-19 pandemic information and materials (a.k.a. our STEER resources) on our Public Health Emergency page.
� By creating an environmental profile to identify exposures associated with operations, helping to quantify and qualify the impact on the organization to set risk management and insurance.
� By developing formal and customized risk maps to identify:
– The frequency and severity of fines and penalties for noncompliance,
– Spill events
– Known and unknown remediation
– Toxic Tort Liability
� With significant liabilities, by developing sophisticated risk model platforms using Monte Carlo analytics to look at a range of probabilities and to forecast potential liabilities over a long horizon.
Other Emerging Risks
The industry is also responding to these additional emerging risks:
� The man-made chemical PFOA/PFOS (also known as the “forever chemical”), has been linked to various environmental and health concerns in drinking water, prompting the Environmental Protection Agency (EPA) and various states to consider imposing stringent cleanup standards. Regulatory action is taking shape in California and New Jersey, and underwriters are carefully monitoring the situation and evaluating whether to apply policy exclusions.
� More companies are seeking product-pollution liability coverage as the result of additional toxic tort litigation around products that are toxic to humans or the environment. This is an area for growth in the marketplace either as a standalone solution or combined on a site policy or blended with a General Liability policy.
� Environmental insurers have closely been watching the uptick of climate change risk and ongoing litigation, with some exiting the market for industries that are primarily involved in coal, or whose revenue is primarily derived from coal. This will make finding environmental solutions for the coal industry even more challenging in an already limited marketplace.
Perhaps when the pandemic settles, environmental insurers will develop some viable new solutions and innovations in Mergers & Acquisitions, Cost Cap, Climate Change, and coverage for future pandemics.
The Market Today
� Highly competitive
� 50+ Insurers
Market Capacity
� Over $700MM. Stable, with some potential restriction in capacity per deal per insurer. In tougher risks, more excess insurers may be needed to achieve desired capacity.
Industry Insights | USI 2020-2021 COMMERCIAL PROPERTY & CASUALTY MARKET OUTLOOK 33
Manufacturing & Distribution The Manufacturing/Distribution market has and is performing in line with the projections noted throughout this report.
Cargo/Stock Throughput In response to significant CAT losses, adverse loss development and poor underwriting results, the Cargo market, specifically Stock Throughput (STP), went through a significant market correction over the last two years. This included a handful of syndicates exiting the marine market and others taking corrective action to restore the profitability of their books by implementing higher deductibles and rate increases, and by restricting certain classes of business and coverage terms. As both London and U.S. markets remain focused on improving underwriting results, we continue to see rising rates and restrictions around terms and limits for tougher classes of business, including soft commodities, temperature-sensitive product, and liquor distilleries. These industry sectors remain challenging in the current market, with insurers taking a closer look at how they deploy their capacity. However, for preferred classes of business, both London and U.S. Markets can still be competitive options. The market will continue to be affected by these and other damaging events that took place during 2020:
� Dell Wind Hail loss in Tennessee - $347MM loss – syndicate closed to writing STP as a result.
� Freight Forwarder for Amazon massive fire - $380MM Loss – 100% London on STP.
� Beirut Port Explosion – expected to be over $1B loss to London. Possible impact on U.S. markets.
� COVID-19 - $100 Billion+ in losses to the entire insurance industry.
� Riots - $1 Billion in losses to property industry, with some STP affect.
� Fires in California, significant losses across carriers.
� Record-breaking hurricane season - more named storms than any other season on record.
There is some reason for optimism as we have seen a touch of aggressiveness from some markets that were passive for most of the year and are now trying to hit projections. But most carriers have far exceeded their goals and are being very selective on how they deploy capacity, considering only the best risks for the remainder of 2020. We expect similar conditions for the first half of 2021, with January 1 treaty renewals likely to have an impact.
How USI Can Help In guiding clients toward achieving favorable coverage outcomes, USI recommends taking the following steps.
� Begin the renewal process at least 150-days prior to inception. Complete a loss analysis early to assess the impact of program structure, retention, and risk mitigation efforts. This establishes your “ask” of the market, allowing for early indications from incumbents and understanding of your options around limits, retentions, coverage, and price.
� Work with your broker to evaluate all market options in the U.S. and London. Focus on risk appetite and industry.
� Clearly identify and differentiate each risk to the marketplace, reinforcing risk quality and mitigation efforts; this is imperative.
INDUSTRY UPDATE

Industry Insights | USI 2020-2021 COMMERCIAL PROPERTY & CASUALTY MARKET OUTLOOK 34
“We continue to see rising rates and restrictions around terms and limits for tougher classes of business…however, for preferred classes, both London and
U.S. markets can still be competitive options.”
Industry Insights | USI 2020-2021 COMMERCIAL PROPERTY & CASUALTY MARKET OUTLOOK 35
How USI Can Help
To ensure the best coverage outcome, we regularly advise our property clients to:
� Review and consider retention strategies for premium impact.
� Develop and emphasize carrier relationships for property and excess casualty.
� Ensure that policy language appropriately addresses their operations.
� Explore single parent or group captive options for all lines of coverage.
� Ensure exposure data accurately reflects their operations as related to COVID-19.
� Explore options regarding coverage of future pandemics, as needed.
Real Estate Real Estate renewals should be in line with the projections for each line of coverage reflected in this report.
Property Real estate property owners and managers can impact renewal results by actively engaging and exchanging detailed risk information. If you are a real estate property owner or manager, the engagement aspect relates to “meeting” with viable carriers and telling your story. Communication from your team to carriers should include maintenance procedures, risk mitigation tactics, capital expenditure plans, and risk management strategies. Detailed information is needed and used for analytics and helps in determining pricing for modeled exposures. Locations exposed to natural catastrophe drive a significant percentage of the total property premium.
Umbrella Capacity shrinkage and price increases will continue to make the excess casualty market challenging well into 2021 and possibly beyond. Large jury verdicts based on social inflation and litigation funding continue to negatively impact the market. Building sizeable towers of capacity has proven to be difficult, often resulting in companies purchasing lower limits based on pricing parameters. Regardless of the limits purchased, renewal timing is also a major issue with last-minute renewals becoming more and more frequent. Leveraging long-term market relationships has proven to positively impact renewals. Overall, the same principle holds true – property owners should show the market why they are a quality risk based on loss history, risk control, and management philosophy.
“Real estate property owners and managers can impact renewal results by actively engaging and exchanging detailed risk information…“meet” with viable carriers and
tell your story.”

Industry Insights | USI 2020-2021 COMMERCIAL PROPERTY & CASUALTY MARKET OUTLOOK 36
Healthcare The availability of risk transfer capacity for healthcare clients is stable. However, most underwriters are more selective about accepting a “risk.” They are reducing their exposure to large losses due to social inflation by offering lower limits of liability. The pricing of risk transfer for healthcare clients continues to rise and has been trending in this direction for the last year. This trend will continue for the foreseeable future and throughout the response to the COVID-19 pandemic. Our expectation for rate increases during the remainder of this year range from 10% to 35% for Professional Liability renewals.
How USI Can Help USI supports our clients through the sales and/or renewal processes by taking these and other important steps:
� Advocates on behalf of the client that infectious disease exposure took place within the scope of employment or is presumed to have taken place within the scope of employment, so that Workers’ Compensation coverage will apply.
� Works with the client to ensure all Workers’ Compensation claims are reported as soon as practicable, and that nurse case management is utilized as quickly as possible to reduce indemnity and medical expense.
� Ensures that the Employer’s Liability limit is adequate for the exposure and any claims are assigned to an adjuster with Employer’s Liability experience.
“The pricing of risk transfer for healthcare clients continues to rise…and will continue for the foreseeable future and throughout the response to the COVID-19 pandemic.”

Industry Insights | USI 2020-2021 COMMERCIAL PROPERTY & CASUALTY MARKET OUTLOOK 37
� Surety: Sound underwriting, a mainstay of the surety underwriting community, continues to be employed as contractors move out of the pandemic and into a recovering economic environment. Particular attention is being placed on the financial health and wellness contractors, with an emphasis on cash flow, liquidity and working capital. Capacity, in general, is still abundant, and the marketplace still competitive for all types of contractors.
� Cyber: Increased reliance on technology for design, construction, safety and operations, along with an increased work from home environment is creating a breeding ground for cyber criminals. A robust cyber security assessment, mitigation, and management process will be necessary as we continue to maneuver this ever-changing landscape.
� Labor Shortage: Limited supply of skilled labor is still the number one challenge for 80% of construction companies surveyed by Associated General Contractors (AGC) and industry group FMI in their 2019 Update on the Evolving Engineering & Construction Risk Environment,* and this has been a consistent theme over the last several years with no real relief in the near term. Complications brought by COVID-19 as respect to staggering work forces and social distancing have created an additional need for oversight and focus on safety to ensure the health and wellness of employees. Solutions such as temporary labor or employment leasing firms are being utilized to fill the gap created by the skilled labor shortage. This is causing new risks to emerge as respect to accountability and responsibility, should a temporary or leased employee get injured on the job.
� Modular Construction: Pre-fabrication and offsite modular construction are increasing substantially due to compressed build schedules, drive for quality, and cost efficiencies. As COVID-19 continues, the added benefit is a “build environment” that allows for appropriate social distancing. Careful understanding of this production model is necessary as there could be challenges around worker classification, product vs. work, transit/supply chain, and there may also be surety implications.
� Professional Liability: Project delivery methods (e.g., design-build and public-private partnerships), continue to evolve with added risks associated with each method. There continues to be a close watch on judicial rulings that are eroding protections for design firms under state statutes to determine how the market will respond. Building Information Modeling (BIM) and other collaborative technologies like digital twinning are creating efficiencies in the “built environment,” but they are also creating uncertainty with respect to risk allocation or responsibility for a design firm. Although there have been some significant losses in the larger risk category, there is still capacity available for annual or project placements. Underwriters are using the same due diligence for both, and there may be some level of rate increase at renewal.
Construction We continue to see the market move from transitioning to firming across all major lines of business and are paying attention to the following:
� Builder’s Risk: There are still signs of a firming builder’s risk market across all project types with an emphasis on frame projects in all geographies. Fires and water damage are the two largest drivers of claims on wood-frame projects, and carriers are requiring visibility on fire mitigation and water mitigation plans when they deploy their capacity for a given project and/or builder. While capacity has remained consistent, pricing for frame continues to harden. There is still uncertainty around COVID-19 and delays on projects, and carriers are now adding infectious disease exclusions on new placements.
� General Liability: There is adequate capacity and competition in the primary General Liability construction market. There have been no major entrants or exits of markets willing to entertain either guaranteed cost or a deductible program. Certain sectors of construction like utility, underground and street and road contractors are seeing more pressure for rate increases than others. As noted in our Q2 report, frame construction, both commercial and residential, continues to shrink with most of the capacity coming from the excess and surplus lines marketplace. Wildfire has become one of the most challenging issues for carriers to underwrite, and domestic capacity for affirmative wildfire coverage is limited.
� Auto Liability and Physical Damage: Rate increases continue for this product line on accounts with larger fleets of vehicles. Similar to the last update report, increases are being seen anywhere from low single digit for high performing risks to 20-25% increases for risks where losses have occurred. Carriers are looking to see if telematics, other data driven software, and driving training protocols are implemented in order to help them contain price increases. Pressure to increase deductibles for both liability and physical damage remain, in order to keep pricing increases down.
� Umbrella/Excess: This is the single most impacted line of business for a construction account outside of frame builder’s risk. Social inflation, third-party litigation financing, nuclear judgements, and distracted driving have caused the Umbrella and Excess market’s results to deteriorate to a point where there is now limited appetite for large limits in the lead Umbrella space. Markets who used to be able to write $25MM in limits are only able to provide $10MM for the same level of pricing at the prior level. It is now taking several markets to complete a placement, where in the past it would take a few. Markets are also looking for higher attachment points, and pricing is no longer a reflection of the pricing of the primary but is instead based upon the market’s own view of the risk.

Industry Insights | USI 2020-2021 COMMERCIAL PROPERTY & CASUALTY MARKET OUTLOOK 38
How USI Can Help USI’s construction risk advisers encourage a disciplined, structured and organized risk management approach deeply rooted in a strong safety culture emphasizing financial health and wellness. During this transitioning economic time, construction businesses should look at their risk management strategies with a focus on maximizing cash flow and creating better opportunities to win projects and protect assets. In guiding clients toward achieving the most favorable outcomes, USI’s construction team recommends that they take the following steps:
Begin discussions early – well in advance of any renewal dates – and speak often with all project participants and insurance and surety carriers.
Conduct an internal analysis on risk tolerance and appetite, as based on the company’s data and analytics. This will help drive conversations with markets rather than waiting for them to drive conversations that may be based on their internal analytics.
Create a construction risk assessment plan based on operational characteristics. The plan should include current and future locations and types of projects. This will help to determine the most efficient risk management financing technique while also maintaining contract compliance.
Be mindful of capacity deployment in the carrier’s underwriting philosophy.
Create a proactive action plan based on the company’s future growth goals. Actively work with the USI construction team and carrier partners (surety and insurance) to forge long-term partnerships.
Work with USI’s construction team on finding creative ways to structure the most appropriate insurance program for the company; consider the variety of risk financing opportunities available.
Be open to non-traditional methods of insuring risk to help mitigate upward pricing pressures.
“We continue to see the market move from transitioning to firming across all major lines of business.”

Industry Insights | USI 2020-2021 COMMERCIAL PROPERTY & CASUALTY MARKET OUTLOOK 39
Public Entity The Public Entity market has and is performing in line with the projections noted throughout this report. Coronavirus/COVID-19 It is not possible to overstate the impact COVID-19 has had on every facet of the Public Entity business. Schools, park and recreation facilities, sports venues, transportation authorities, airports, healthcare facilities and senior centers provide lifelines to many individuals, resulting in significant disruption when they are forced to shut down or limit operations – and as related to police, fire, and emergency response operations, their work cannot be conducted from home, which creates additional challenges and employee risks. The pandemic has forced the industry to reevaluate and revise policies and procedures to accommodate such things as physical distancing, mask use and the use of waivers. Staff that is working remotely bring new exposures to public entities from both an ergonomic and technological perspective. This requires developing a communication plan for, and across, every department and reminds us of the importance of having a comprehensive and up-to-date business continuity plan. There are very few markets that have expressed interest in providing business interruption coverage for a COVID-19-related event in the public sector. We are seeing minimum premiums of $300,000 for a limit of $2MM of coverage. We are also seeing excess Workers’ Compensation markets that are unwilling to put an aggregate on COVID-19 claims activity, and a recent Senate bill passed in California (#SB 1159), moving the presumption of a COVID-19 claim beyond just first responders and healthcare workers. This expands the possible number of COVID-19 claims a Public Entity may otherwise have, raising the concern of underwriters and adding fuel to an already hard market.
Cyber Security One notable increase in exposure for Public Entities is in the Cyber Liability arena, given the increased number of employees working from home and from virtual classrooms in all forms of education. Employers should review their Cyber programs and insurance policies to ensure they are current and provide sufficient protection. They should also ensure that their policies will be responsive to business interruption in the event of a ransomware attack or the infiltration of their network through the systems of their remote workers.

Industry Insights | USI 2020-2021 COMMERCIAL PROPERTY & CASUALTY MARKET OUTLOOK 40
How USI Can Help
� USI’s Cyber Risk Management team can help businesses learn more about their cyber risk and how to mitigate them as the COVID-19 work-from-home environment continues. USI can perform a cyber policy review to make sure all current coverage updates are a part of a business’s program.
� USI’s Public Health Emergency site offers our STEER (Steer Through Epidemic & Economic Recovery) content to help keep businesses and organizations informed about the COVID-19 pandemic. This includes information pertaining to California Senate Bill #SB 1159.
� USI’s TerrorSafe Plus suite of products, administered by its U.S. Risk team, offers broad coverage options for Strike, Riot and Civil Commotion (SRCC) in addition to the existing benefits and features of its original TerrorSafe program. SRCC, which provides coverage against direct physical loss or physical damage caused to a property, is available as a stand-alone policy or by endorsement to USI’s Sabotage & Terrorism or Active Response policies.
USI can also help by:
� Using Catastrophic property modeling to help businesses identify the appropriate amount of wind, flood, and earthquake coverage. It is critical to ensure that your Construction Occupancy Protection Exposure (COPE) data is refreshed.
� Evaluating all market options in the U.S. and London, focusing on risk appetite and industry.
� Preparing a comprehensive market submission with the intention of highlighting a strong/improving safety culture and risk management approach.
� Developing analytics around various risk financing opportunities, which can lead to improved decision-making and better outcomes.
� Reminding clients to begin the renewal process 180- to 150-days prior to inception. This allows for early indications from incumbent markets to understand their options around limits, retentions, coverage, and price.
Continuation of the Hard Market The market hardened earlier this year and we have since seen the exit of some Public Entity insurers in Texas, Oklahoma and Kansas, for windstorm and hail events. This situation is putting pressure on the remaining insurance carriers and on reinsurers across the country, at a time when windstorms and hail, coastal flooding, riots and civil commotion, and attacks on law enforcement are on the rise. Risk pools are also being affected by changes in the reinsurance market and are seeing losses that are similar to those experienced by more traditional insurers. Other examples of the hardened market include:
� Property programs are experiencing rate increases, higher deductibles and limitations on flood, wind, hail and earthquake coverage.
� Available Umbrella capacity is dramatically decreasing across the board coupled with more restrictive terms particularly for transit authorities and buses.
� Schools are seeing restrictions in Traumatic Brain Injury (TBI) and Sexual Abuse and Molestation (SAM) coverage.
� Coverage for active assailants, which was readily available earlier this year, is now pulling back and prices are increasing.
In an emerging trend, we could see the creation of new risk pools in response to the hardening market to address shortfalls in capacity and pricing of traditional coverages like Property, Liability and Workers’ Compensation. It is not yet clear how these pools would be funded, as many of the available reinsurers are the very same ones already aligned with traditional insurance companies.
“It is not possible to overstate the impact COVID-19 has had on every facet
of the Public Entity business.”
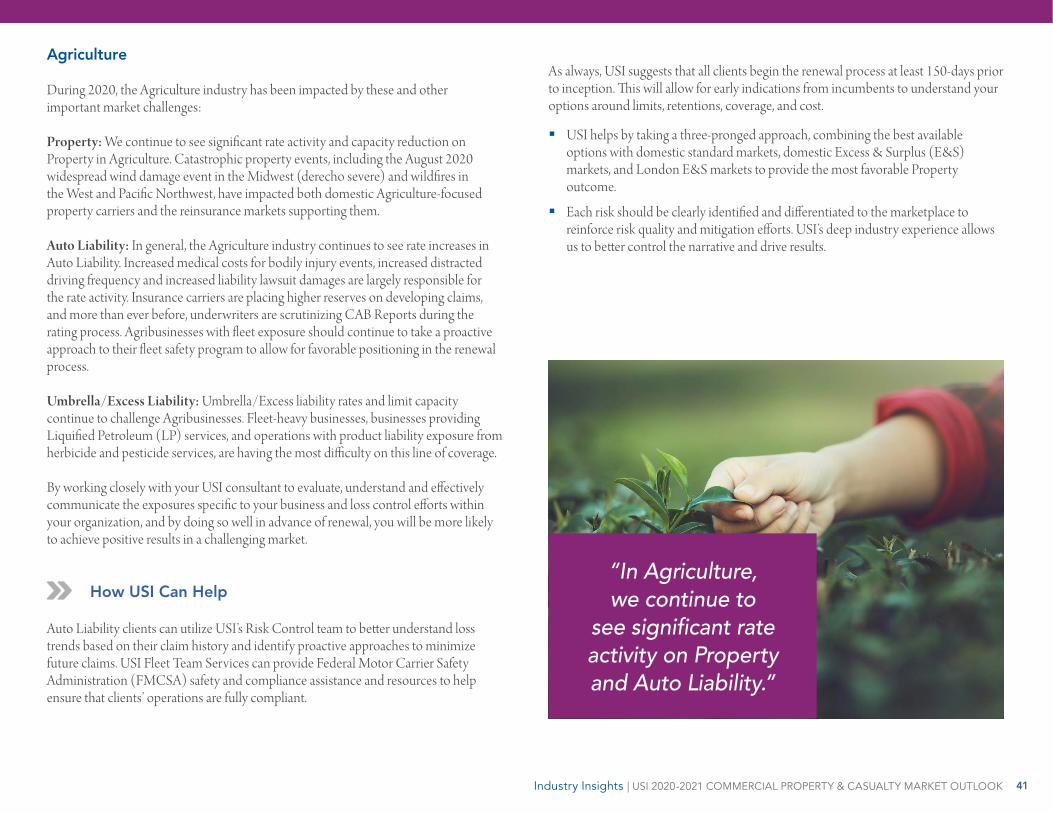
Industry Insights | USI 2020-2021 COMMERCIAL PROPERTY & CASUALTY MARKET OUTLOOK 41
As always, USI suggests that all clients begin the renewal process at least 150-days prior to inception. This will allow for early indications from incumbents to understand your options around limits, retentions, coverage, and cost.
� USI helps by taking a three-pronged approach, combining the best available options with domestic standard markets, domestic Excess & Surplus (E&S) markets, and London E&S markets to provide the most favorable Property outcome.
� Each risk should be clearly identified and differentiated to the marketplace to reinforce risk quality and mitigation efforts. USI’s deep industry experience allows us to better control the narrative and drive results.
Agriculture During 2020, the Agriculture industry has been impacted by these and other important market challenges: Property: We continue to see significant rate activity and capacity reduction on Property in Agriculture. Catastrophic property events, including the August 2020 widespread wind damage event in the Midwest (derecho severe) and wildfires in the West and Pacific Northwest, have impacted both domestic Agriculture-focused property carriers and the reinsurance markets supporting them. Auto Liability: In general, the Agriculture industry continues to see rate increases in Auto Liability. Increased medical costs for bodily injury events, increased distracted driving frequency and increased liability lawsuit damages are largely responsible for the rate activity. Insurance carriers are placing higher reserves on developing claims, and more than ever before, underwriters are scrutinizing CAB Reports during the rating process. Agribusinesses with fleet exposure should continue to take a proactive approach to their fleet safety program to allow for favorable positioning in the renewal process. Umbrella/Excess Liability: Umbrella/Excess liability rates and limit capacity continue to challenge Agribusinesses. Fleet-heavy businesses, businesses providing Liquified Petroleum (LP) services, and operations with product liability exposure from herbicide and pesticide services, are having the most difficulty on this line of coverage. By working closely with your USI consultant to evaluate, understand and effectively communicate the exposures specific to your business and loss control efforts within your organization, and by doing so well in advance of renewal, you will be more likely to achieve positive results in a challenging market.
How USI Can Help Auto Liability clients can utilize USI’s Risk Control team to better understand loss trends based on their claim history and identify proactive approaches to minimize future claims. USI Fleet Team Services can provide Federal Motor Carrier Safety Administration (FMCSA) safety and compliance assistance and resources to help ensure that clients’ operations are fully compliant.
“In Agriculture, we continue to
see significant rate activity on Property and Auto Liability.”

This material is for informational purposes and is not intended to be exhaustive nor should any discussions or opinions be construed as legal advice. Contact your broker for insurance advice, tax professional for tax advice, or legal counsel for legal advice regarding your particular situation. USI does not accept any responsibility for the content of the information provided or for consequences of any actions taken on the basis of the information provided.
© 2020 USI Insurance Services. All rights reserved.
How Can We Help? To help clients navigate these challenging times, USI has implemented a STEER (Steer Through Epidemic & Economic Recovery) Task Force. This cross-functional team is working to provide timely COVID-19 information, understand cross-industry and geography impact and evolving responses, and to develop and deliver tailored solutions to help clients steer through this epidemic challenge and economic recovery. For additional resources, tools, information and links, please visit our COVID-19 resource page: www.usi.com/public-health-emergencies.