company update zee entertainment - myirisbreport.myiris.com/es1/zeetelef_20111116.pdf · zee has...
TRANSCRIPT

Edelweiss Research is also available on www.edelresearch.com, Bloomberg EDEL <GO>, Thomson First Call, Reuters and Factset. Edelweiss Securities Limited
Zee Entertainment Enterprises’ (ZEE) flagship channel Zee TV’s ratings are likely to rise from the doldrums with Sony’s mega show Kaun Banega Crorepati (KBC) going off air this week. Also, on the anvil are two more shows (including Dance India Dance) in H2FY12 and increase in the number of original programming hours from 28 to ~32 by FY12 end. The company has already soft launched four HD channels, a positive from the ARPU perspective. Overall, we remain positive on ZEE’s subscription revenue from a long‐term perspective. Maintain ‘BUY’. KBC ending a positive; ratings likely to rise from hereon After garnering 228 GRPs and becoming a close No. 3 player in June 2011, viewership of ZEE’s flagship channel Zee TV has nosedived, languishing at a poor No.4 spot. This has been primarily due to tremendous success of Sony’s KBC, which has consistently garnered GRPs of ~40‐45. However, with the current week (Week 47) being KBC’s last on air, ZEE’s ratings are likely to have bottomed out in our view.
Two more shows on cards; sports losses to be sharply lower ZEE has already launched two new shows Star Ya Rockstar and Hitler Didi and will launch Afsar Bitiya and Dance India Dance (DID) in H2FY12. DID will be critical for Zee TV as it had garnered excellent GRPs (~25‐30) in the past. In our view, ZEE will have to change its cost‐focused strategy and maintain a healthy balance of movies and fiction shows. Sports EBITDA loss in H2FY12 is likely to be ~INR220mn versus a loss of INR792mn in H1FY12, which will cushion margin pressure.
Outlook and valuations: Improving; maintain ‘BUY’ We remain positive on ZEE from a long term perspective as we expect subscription revenue to get a boost from the digitization mandate and the distribution JV with Star. At CMP of INR114, the stock is trading at P/E of 17.8x and 14.9x on FY12E and FY13E, respectively. We maintain ‘BUY’ recommendation and ‘Sector Outperformer’ rating.
COMPANY UPDATE
ZEE ENTERTAINMENT Likely to recapture eyeballs
EDELWEISS 4D RATINGS
Absolute Rating BUY
Rating Relative to Sector Outperformer
Risk Rating Relative to Sector Medium
Sector Relative to Market Overweight
MARKET DATA (R: ZEE.BO, B: Z IN)
CMP : INR 114
Target Price : INR 150
52‐week range (INR) : 153 / 106
Share in issue (mn) : 978.1
M cap (INR bn/USD mn) : 111 / 2,191
Avg. Daily Vol.BSE/NSE(‘000) : 2,166.0
SHARE HOLDING PATTERN (%)
* Promoters pledged shares (% of share in issue)
: 10.3
PRICE PERFORMANCE (%)
Stock Nifty
EW Media Index
1 month 9.7 10.7 5.3
3 months (1.2) (0.9) (21.0)
12 months (14.3) (15.9) (35.7)
Abneesh Roy +91 22 6620 3141 [email protected]
India Equity Research| Media
November 16, 2011
Financials (INR mn)
Year to March FY10 FY11 FY12E FY13ENet revenue 21,998 30,136 31,628 35,929Rev. growth (%) 1.0 37.0 5.0 13.6EBITDA 6,135 8,266 8,144 9,773Net profit 5,881 5,913 6,197 7,391Shares outstanding (mn) 978 978 966 966Diluted EPS (INR) 6.2 6.2 6.4 7.6EPS growth (%) 46.7 (0.5) 3.7 19.3Diluted PE (x) 18.3 18.4 17.8 14.9EV/EBITDA (x) 16.8 12.1 11.6 9.3ROACE (%) 15.5 26.7 30.8 32.0
Promoters*43.3%
MFs, FIs & Banks13.2%
FIIs35.0%
Others8.5%

Media
2 Edelweiss Securities Limited
Curtains down on KBC may trigger uptick in Zee TV GRPs After garnering healthy 228 GRPs and closing the gap with Colors to just two points towards the end of June 2011, Zee TV’s GRPs have nosedived. From being a consistent player amongst the top 3 in the GEC genre, the channel has been pushed to the fourth spot in terms of TV ratings. The launch of Sony’s KBC on August 15, 2011, added salt to Zee TV’s injury and its ratings failed to recover. Having consistently garnered an average TRP of 4 and being amongst the top 3 shows in the GEC genre, KBC has had a successul run this year. Fig. 1: KBC has enjoyed enormous success yet again
Source: Edelweiss research
However, with the ongoing week (Week 47) being the show’s last on air, ZEE can expect some recovery in Zee TV’s ratings from the following week. To give some hope of a revival, Zee TV’s ratings have improves slightly in the past two weeks, which includes a 32 point surge in the last week (Week 46). Chart 1: Zee TV’s GRPs have nosedived since launch of KBC
Source: Company, Edelweiss research
0
80
160
240
320
400
Wk 34
Wk 35
Wk 36
Wk 37
Wk 38
Wk 39
Wk 40
Wk 41
Wk 42
Wk 43
Wk 44
Wk 45
Wk 46
(GRP
s)
Star Plus Colors Zee TV Sony
Year 2011

Zee Entertainment Enterprise
3 Edelweiss Securities Limited
Before the launch of KBC, Sony was a no. 4 player in the GEC space. However, with a slew of hit serials apart from KBC like CID, Crime Patrol and Bade Acche Lagte Hai, Sony has jumped to the no.2 slot, overtaking Colors and Zee TV. Post KBC, Sony is launching two new fiction shows – Parvarish and Dekha Ek Khwab to replace KBC’s time slot. Even though these two serials are unlikely to replicate the immense success of KBC, we need to keep a close tab on their performance.
Fig. 2: Parvarish Fig. 3: Dekha Ek Khwab
Source:Edelweiss research Chart 2: The race between Colors, Sony and Zee has spiced up in H2CY11
Source: Company, Edelweiss research
Focus on extending original programming hours ZEE has already launched two new shows Star Ya Rockstar and Hitler Didi on Zee TV. The company has still not frozen the launch dates of its upcoming show Afsar Bitiya. Dance India Dance will be launched either near Q3FY12 end or the beginning of Q4FY12. Currently, Zee TV showcases 28 hours of original programming and is trying to increase it to ~32‐33 hours/week by FY12 end. However, ZEE will invest in high cost reality shows only after careful evaluation. Management admitted in the Q2FY12 conference call that the company will continue to invest agressively in movies. Recently, media articles suggested that the
0
70
140
210
280
350
Wk 1 Wk 6 Wk 11 Wk 16 Wk 21 Wk 26 Wk 31 Wk 36 Wk 41 Wk 46
(GRP
s)
Colors Zee TV Sony
Year 2011
Sony's huge leap in rankings has been largely
aided by KBC

Media
4 Edelweiss Securities Limited
company had bought the movie rights of the Hrithik Roshan starrer under production Agneepath for a whopping ~INR410mn.
Fig. 4: Star Ya Rockstar Fig. 5: Hitler Didi
Source:Edelweiss research
Fig. 6: Dance India Dance Fig. 7: Afsar Bitiya
Source:Edelweiss research
HD channels to be officially launched soon Currently, ZEE is producing its entire content in HD. It has already announced the launch of four of its mainstream channels in HD viz., Zee TV, Zee Cinema, Ten Sports and Zee Studio. Currently, ZEE is in talks with cable operators and DTH companies for launch of the HD channels. In the past few months, STAR and Colors have launched channels in HD. Sony has also announced that it will be launching its HD channel soon. With rates of HD compatible television sets dipping considerably, we expect HD penetration to surge further. DTH companies like Dish TV are planning to raise funds to gear up for the compulsory digitization mandate and the increasing HD penetration. Thus, there lies a good opportunity to inrease subscription revenues through higher HD channels.
Sports business losses likely to be sharply lower in H2FY12 Although H1FY12 loss from sports stands at INR792mn (loss of INR226mn in Q2FY12 and INR566mn in Q1FY12), ZEE remains confident of meeting its FY12 guidance (loss of

Zee Entertainment Enterprise
5 Edelweiss Securities Limited
INR1,000mn) . We consider this to be a daunting task and expect a loss of ~INR1.1bn for FY12, especially in the context of a slowdown in ad spends. Chart 3: Ex‐sports EBITDA (approx)
Source: Company, Edelweiss research
Table 1: ZEE – Sports performance
Source: Company, Edelweiss research
Chart 4: ZEE – Sports performance
Source: Company, Edelweiss research
24.0
26.5
29.0
31.5
34.0
36.5
0
600
1,200
1,800
2,400
3,000
Q1FY10
Q2FY10
Q3FY10
Q4FY10
Q1FY11
Q2FY11
Q3FY11
Q4FY11
Q1 FY12
Q2FY12
(%)
(INR mn)
Sports Q1FY10 Q2FY10 Q3FY10 Q4FY10 FY10 Q1FY11 Q2FY11 Q3FY11 Q4FY11 FY11 Q1FY12 Q2FY12Sales 870 1,060 604 617 1,474 832 1,190 1,665 1,424 5,111 873 881 Cost 1,142 1,108 880 597 2,022 1,186 1,732 1,995 1,576 6,489 1,439 1,107 EBITDA (272) (48) (276) 20 (548) (354) (542) (330) (152) (2,078) (566) (226) EBITDA (%) (31.3) (4.5) (45.7) 3.2 (37.2) (42.5) (45.5) (19.8) (10.7) (41.0) (64.8) (26.0)
(1,200)
(600)
0
600
1,200
1,800
Q1FY10
Q2FY10
Q3FY10
Q4FY10
Q1FY11
Q2FY11
Q3FY11
Q4FY11
Q1 FY12
Q2FY12
(INR mn)
Sports Revenues Sports EBITDA

Media
6 Edelweiss Securities Limited
Rejig in Zee’s management After joining ZEE in March 2005, Joy Chakraborty, Executive Director, Revenue and Niche channels, ZEE resigned from the company in October 2011. Meanwhile, ZEE has announced that Rajesh Jejurikar, CEO of Mahindra & Mahindra’s Automotive division, will be joining the company as President. Zee can benefit from Mr. Jejurikar’s immense experience in marketing and brand building.
Outlook and valuations: Improving; maintain ‘BUY’ We remain positive on ZEE from a long term perspective as we expect subscription revenue to get a boost from the digitization mandate and the distribution JV with Star. In the past few months, the stock has de‐rated because of sharp fall in Zee TV’s viewership and slowdown in ad revenue. At CMP of INR114, the stock is trading at P/E of 17.8x and 14.9x on FY12E and FY13E, respectively. We maintain ‘BUY’ recommendation and ‘Sector Outperformer’ rating on the stock.
Chart 5: Zee’s PE band chart – Valuations near lower end
Source: Edelweiss research
0.0
55.0
110.0
165.0
220.0
275.0
Oct
-04
Apr-
05
Oct
-05
Apr-
06
Oct
-06
Apr-
07
Oct
-07
Apr-
08
Oct
-08
Apr-
09
Oct
-09
Apr-
10
Oct
-10
Apr-
11
Oct
-11
(IN
R)
5x
10x
15x
25x
30x
20x

Zee Entertainment Enterprise
7 Edelweiss Securities Limited
Company Description ZEE is one of the largest media companies in India. It owns and operates Zee TV and Zee Cinema, both leading channels in the Hindi GEC and movies segment respectively. Besides these two, the company has an attractive bouquet of several other channels including Ten Sports, Ten Cricket, Ten Action +, Zing, Zee Jagran, Zee Premier, Zee Classic, Zee Action, Zee Cafe, Zee Studios, and Zee Trendz.
Investment Theme With the nominal GDP growth expected to improve, the outlook on ad spends is expected to improve in H2FY12. Also, higher penetration of DTH and sunset clause augur well for faster growth in subscription revenues. With the ordinance of digitization and the Star‐Zee deal, subscription revenues could see a positive surprise. We believe ZEE is poised to benefit from this favorable environment over the longer term.
Key Risks • Increase in competition from Colors & Sony
• Sports losses could be volatile
• Slowdown in ad spends
• Subscription revenue deal may take time to materialize
8 Edelweiss Securities Limited
Media
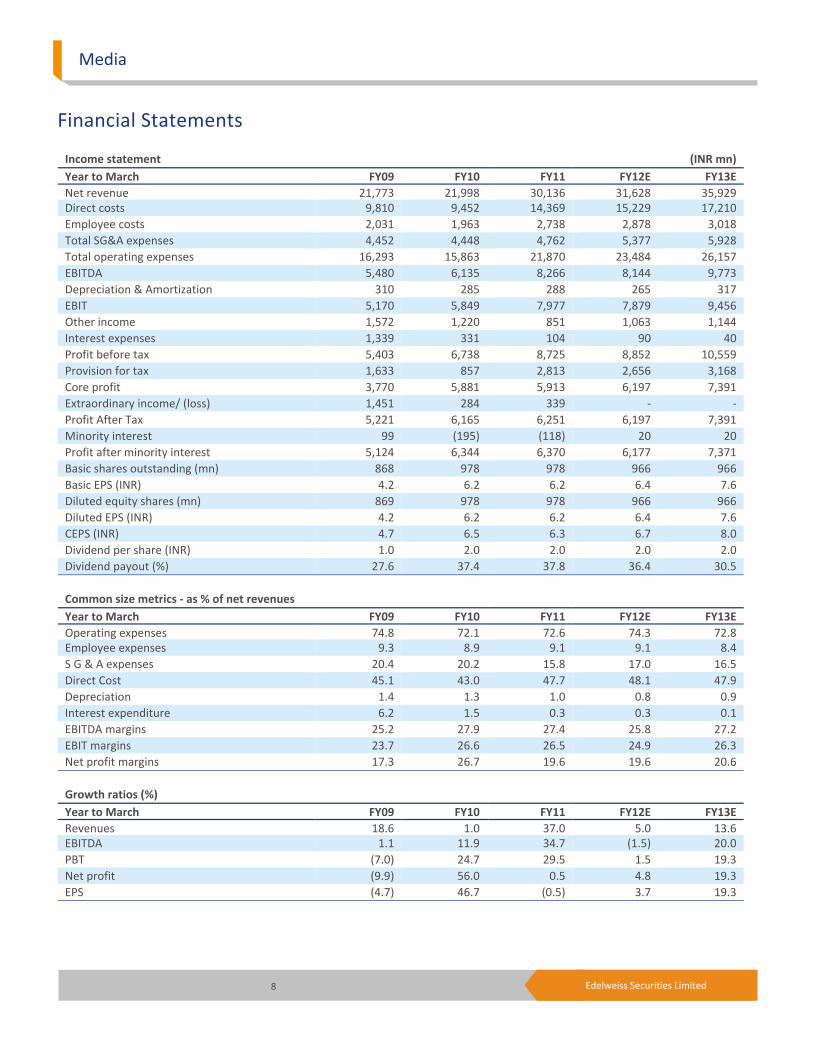
Financial Statements
Income statement (INR mn) Year to March FY09 FY10 FY11 FY12E FY13ENet revenue 21,773 21,998 30,136 31,628 35,929Direct costs 9,810 9,452 14,369 15,229 17,210 Employee costs 2,031 1,963 2,738 2,878 3,018 Total SG&A expenses 4,452 4,448 4,762 5,377 5,928 Total operating expenses 16,293 15,863 21,870 23,484 26,157 EBITDA 5,480 6,135 8,266 8,144 9,773 Depreciation & Amortization 310 285 288 265 317 EBIT 5,170 5,849 7,977 7,879 9,456 Other income 1,572 1,220 851 1,063 1,144 Interest expenses 1,339 331 104 90 40 Profit before tax 5,403 6,738 8,725 8,852 10,559 Provision for tax 1,633 857 2,813 2,656 3,168 Core profit 3,770 5,881 5,913 6,197 7,391 Extraordinary income/ (loss) 1,451 284 339 ‐ ‐ Profit After Tax 5,221 6,165 6,251 6,197 7,391 Minority interest 99 (195) (118) 20 20 Profit after minority interest 5,124 6,344 6,370 6,177 7,371 Basic shares outstanding (mn) 868 978 978 966 966 Basic EPS (INR) 4.2 6.2 6.2 6.4 7.6 Diluted equity shares (mn) 869 978 978 966 966 Diluted EPS (INR) 4.2 6.2 6.2 6.4 7.6 CEPS (INR) 4.7 6.5 6.3 6.7 8.0 Dividend per share (INR) 1.0 2.0 2.0 2.0 2.0 Dividend payout (%) 27.6 37.4 37.8 36.4 30.5
Common size metrics ‐ as % of net revenues Year to March FY09 FY10 FY11 FY12E FY13EOperating expenses 74.8 72.1 72.6 74.3 72.8Employee expenses 9.3 8.9 9.1 9.1 8.4 S G & A expenses 20.4 20.2 15.8 17.0 16.5 Direct Cost 45.1 43.0 47.7 48.1 47.9 Depreciation 1.4 1.3 1.0 0.8 0.9 Interest expenditure 6.2 1.5 0.3 0.3 0.1 EBITDA margins 25.2 27.9 27.4 25.8 27.2 EBIT margins 23.7 26.6 26.5 24.9 26.3 Net profit margins 17.3 26.7 19.6 19.6 20.6
Growth ratios (%) Year to March FY09 FY10 FY11 FY12E FY13ERevenues 18.6 1.0 37.0 5.0 13.6EBITDA 1.1 11.9 34.7 (1.5) 20.0 PBT (7.0) 24.7 29.5 1.5 19.3 Net profit (9.9) 56.0 0.5 4.8 19.3 EPS (4.7) 46.7 (0.5) 3.7 19.3

9 Edelweiss Securities Limited
Zee Entertainment Enterprise
Balance sheet (INR mn) As on 31st March FY09 FY10 FY11 FY12E FY13EEquity capital 434 489 978 966 966Reserves & surplus 33,561 37,811 29,970 33,900 39,026 Shareholders funds 33,995 38,300 30,948 34,866 39,992 Minority interest (BS) 948 (22) (119) (99) (79) Secured loans 5,261 591 17 18 17 Unsecured loans 495 604 ‐ ‐ ‐ Borrowings 5,757 1,195 17 18 17 Deferred tax liability (113) (133) (192) (192) (192) Sources of funds 40,587 39,339 30,654 34,594 39,738Gross block 3,692 3,581 3,502 4,102 4,902Depreciation 1,508 1,501 1,670 1,936 2,253 Net block 2,184 2,080 1,832 2,167 2,650 Capital work in progress 669 1,108 399 399 399 Intangible assets 15,239 16,399 6,232 6,232 6,232 Investments 1,271 3,203 6,964 7,200 8,000 Inventories 4,576 4,713 5,396 5,356 6,053 Sundry debtors 6,437 7,488 8,955 8,628 9,802 Cash and equivalents 1,926 5,864 3,858 7,871 10,595 Loans and advances 14,087 6,325 4,818 4,818 4,818 Total current assets 27,026 24,389 23,026 26,673 31,268 Sundry creditors and others 3,250 4,376 4,435 4,669 5,276 Others current liabilities 1,067 1,023 880 924 1,050 Provisions 1,486 2,441 2,486 2,486 2,486 Total current liabilities & provisions 5,803 7,840 7,801 8,078 8,811 Net current assets 21,223 16,549 15,225 18,595 22,457 Miscellaneous expenditure ‐ ‐ ‐ ‐ ‐ Uses of funds 40,587 39,339 30,654 34,594 39,738Book value per share (INR) 39.2 39.2 31.6 36.1 41.4
Free cash flow (INR mn) Year to March FY09 FY10 FY11 FY12E FY13ENet profit 5,124 6,344 6,370 6,177 7,371Depreciation 310 285 288 265 317 Deferred tax 108 26 (113) ‐ ‐ Others 1,054 (788) 1,522 973 1,104 Gross cash flow 6,596 5,868 8,066 7,415 8,792 Less: Changes in WC 5,594 (2,088) 1,592 (643) 1,137 Operating cash flow 1,002 7,956 6,475 8,059 7,655 Less: Capex 525 328 (788) 600 800 Free cash flow 477 7,628 7,262 7,459 6,855
Cash flow metrics Year to March FY09 FY10 FY11 FY12E FY13EOperating cash flow 1,002 7,956 6,475 8,059 7,655Investing cash flow (798) 3,332 (5,841) (1,899) (2,744) Financing cash flow 71 (7,515) (2,848) (2,147) (2,187) Net cash flow 274 3,773 (2,214) 4,013 2,724 Capex (525) (328) 788 (600) (800) Dividends paid (1,013) (2,272) (2,281) (2,246) (2,246)

10 Edelweiss Securities Limited
Media
Profitability & efficiency ratios Year to March FY09 FY10 FY11 FY12E FY13EROAE (%) 12.0 16.3 17.1 18.8 19.7ROACE (%) 14.7 15.5 26.7 30.8 32.0 Inventory day 131 179 128 129 121 Debtors days 103 116 100 101 94 Payable days 120 147 112 109 105 Current ratio 4.7 3.1 3.0 3.3 3.5 Debt/EBITDA 1.1 0.2 ‐ ‐ ‐ Debt/Equity 0.2 ‐ ‐ ‐ ‐ Adjusted debt/equity 0.4 0.3 0.3 ‐ ‐ Interest coverage 3.9 17.6 77.0 87.5 236.4
Operating ratios Year to March FY09 FY10 FY11 FY12E FY13ETotal asset turnover 0.6 0.6 0.9 1.0 1.0Fixed asset turnover 10.5 10.3 15.4 15.8 14.9 Equity turnover 0.7 0.6 0.9 1.0 1.0
Du pont analysis Year to March FY09 FY10 FY11 FY12E FY13ENP margin (%) 17.3 26.7 19.6 19.6 20.6Total assets turnover 0.6 0.6 0.9 1.0 1.0 Leverage multiplier 1.2 1.1 1.0 1.0 1.0 ROAE (%) 12.0 16.3 17.1 18.8 19.7
Valuation parameters Year to March FY09 FY10 FY11 FY12E FY13EDiluted EPS (INR) 4.2 6.2 6.2 6.4 7.6Y‐o‐Y growth (%) (4.7) 46.7 (0.5) 3.7 19.3 CEPS (INR) 4.7 6.5 6.3 6.7 8.0 Diluted PE (x) 26.9 18.3 18.4 17.8 14.9 Price/BV (x) 2.9 2.9 3.6 3.1 2.7 EV/Sales (x) 4.7 4.7 3.3 3.0 2.5 EV/EBITDA (x) 18.6 16.8 12.1 11.6 9.3 Dividend yield (%) 0.9 1.8 1.8 1.8 1.8 FCFPS (INR) 0.5 7.8 7.4 7.7 7.1 Y‐o‐Y growth in FCFPS (%) (83.0) 1,319.7 (4.8) 4.0 (8.1) FCFPE (x) 206.8 14.6 15.3 14.7 16.0

11 Edelweiss Securities Limited
Company Absolute
reco
Relative
reco
Relative
risk
Company Absolute
reco
Relative
reco
Relative
Risk
Dish TV India BUY SO M Jagran Prakashan BUY SP M
PVR BUY SP M Sun TV Network UNDER REVIEW UNDER
REVIEW
M
TV18 Broadcast BUY SU H Zee Entertainment Enterprise BUY SO M
RATING & INTERPRETATION
ABSOLUTE RATING
Ratings Expected absolute returns over 12 months
Buy More than 15%
Hold Between 15% and - 5%
Reduce Less than -5%
RELATIVE RETURNS RATING
Ratings Criteria
Sector Outperformer (SO) Stock return > 1.25 x Sector return
Sector Performer (SP) Stock return > 0.75 x Sector return
Stock return < 1.25 x Sector return
Sector Underperformer (SU) Stock return < 0.75 x Sector return
Sector return is market cap weighted average return for the coverage universe within the sector
RELATIVE RISK RATING
Ratings Criteria
Low (L) Bottom 1/3rd percentile in the sector
Medium (M) Middle 1/3rd percentile in the sector
High (H) Top 1/3rd percentile in the sector
Risk ratings are based on Edelweiss risk model
SECTOR RATING
Ratings Criteria
Overweight (OW) Sector return > 1.25 x Nifty return
Equalweight (EW) Sector return > 0.75 x Nifty return
Sector return < 1.25 x Nifty return
Underweight (UW) Sector return < 0.75 x Nifty return

12 Edelweiss Securities Limited
Media
Edelweiss Securities Limited, Edelweiss House, off C.S.T. Road, Kalina, Mumbai – 400 098. Board: (91‐22) 4009 4400, Email: [email protected]
Vikas Khemani Head Institutional Equities [email protected] +91 22 2286 4206
Nischal Maheshwari Head Research [email protected] +91 22 6623 3411
Coverage group(s) of stocks by primary analyst(s): Media Dish TV India, Jagran Prakashan, PVR, Sun TV Network, TV18 Broadcast, Zee Entertainment Enterprise
Distribution of Ratings / Market Cap
Edelweiss Research Coverage Universe
Rating Distribution* 119 47 15 184* 3 stocks under review
Market Cap (INR) 111 57 16
Date Company Title Price (INR) Recos
Access the entire repository of Edelweiss Research on www.edelresearch.com
Recent Research
16‐Nov‐11 Dish TV Pricing power to the fore; EdelFlash
68 Buy
15‐Nov‐11 Videocon d2h
Expanding bandwidth; Visit Note
14‐Nov‐11 Dish TV Raising funds to be future ready; EdelFlash
72 Buy
> 50bn Between 10bn and 50 bn < 10bn
Buy Hold Reduce Total
Rating Interpretation
Buy appreciate more than 15% over a 12‐month period
Hold appreciate up to 15% over a 12‐month period
Reduce depreciate more than 5% over a 12‐month period
Rating Expected to
This document has been prepared by Edelweiss Securities Limited (Edelweiss). Edelweiss, its holding company and associate companies are a full service, integrated investment banking, portfolio management and brokerage group. Our research analysts and sales persons provide important input into our investment banking activities. This document does not constitute an offer or solicitation for the purchase or sale of any financial instrument or as an official confirmation of any transaction. The information contained herein is from publicly available data or other sources believed to be reliable, but we do not represent that it is accurate or complete and it should not be relied on as such. Edelweiss or any of its affiliates/ group companies shall not be in any way responsible for any loss or damage that may arise to any person from any inadvertent error in the information contained in this report. This document is provided for assistance only and is not intended to be and must not alone be taken as the basis for an investment decision. The user assumes the entire risk of any use made of this information. Each recipient of this document should make such investigation as it deems necessary to arrive at an independent evaluation of an investment in the securities of companies referred to in this document (including the merits and risks involved), and should consult his own advisors to determine the merits and risks of such investment. The investment discussed or views expressed may not be suitable for all investors. We and our affiliates, group companies, officers, directors, and employees may: (a) from time to time, have long or short positions in, and buy or sell the securities thereof, of company (ies) mentioned herein or (b) be engaged in any other transaction involving such securities and earn brokerage or other compensation or act as advisor or lender/borrower to such company (ies) or have other potential conflict of interest with respect to any recommendation and related information and opinions. This information is strictly confidential and is being furnished to you solely for your information. This information should not be reproduced or redistributed or passed on directly or indirectly in any form to any other person or published, copied, in whole or in part, for any purpose. This report is not directed or intended for distribution to, or use by, any person or entity who is a citizen or resident of or located in any locality, state, country or other jurisdiction, where such distribution, publication, availability or use would be contrary to law, regulation or which would subject Edelweiss and affiliates/ group companies to any registration or licensing requirements within such jurisdiction. The distribution of this document in certain jurisdictions may be restricted by law, and persons in whose possession this document comes, should inform themselves about and observe, any such restrictions. The information given in this document is as of the date of this report and there can be no assurance that future results or events will be consistent with this information. This information is subject to change without any prior notice. Edelweiss reserves the right to make modifications and alterations to this statement as may be required from time to time. However, Edelweiss is under no obligation to update or keep the information current. Nevertheless, Edelweiss is committed to providing independent and transparent recommendation to its client and would be happy to provide any information in response to specific client queries. Neither Edelweiss nor any of its affiliates, group companies, directors, employees, agents or representatives shall be liable for any damages whether direct, indirect, special or consequential including lost revenue or lost profits that may arise from or in connection with the use of the information. Past performance is not necessarily a guide to future performance. The disclosures of interest statements incorporated in this document are provided solely to enhance the transparency and should not be treated as endorsement of the views expressed in the report. Edelweiss Securities Limited generally prohibits its analysts, persons reporting to analysts and their family members from maintaining a financial interest in the securities or derivatives of any companies that the analysts cover. The analyst for this report certifies that all of the views expressed in this report accurately reflect his or her personal views about the subject company or companies and its or their securities, and no part of his or her compensation was, is or will be, directly or indirectly related to specific recommendations or views expressed in this report. Analyst holding in the stock: no. For recipients in the United States: This report was prepared by Edelweiss Securities, which is not a FINRA member nor a broker‐dealer registered with the SEC. US persons receiving this research and wishing to effect any transactions in any security discussed in the report should contact an SEC‐registered broker‐dealer. In order to conduct business with Institutional Investors based in the U.S., Edelweiss Securities has entered into a chaperoning agreement with a U.S. registered broker‐dealer, Marco Polo Securities Inc. ("Marco Polo").
Copyright 2009 Edelweiss Research (Edelweiss Securities Ltd). All rights reserved