comparative study of pca-ann hybrid … · comparative study of pca-ann hybrid inferential systems...
TRANSCRIPT
COMPARATIVE STUDY OF PCA-ANN HYBRID INFERENTIALSYSTEMS IN NATURAL GAS PROCESSING UNITS
Leandro Luttiane da Silva Linhares, [email protected]ábio Meneghetti Ugulino de Araújo, [email protected] and Automation Engineering DepartmentFederal University of Rio Grande do Norte, Brazil
Abstract. The main product of the Natural Gas Processing Unit (NGPU) studied in this work is the liquefied petroleumgas (LPG). The LPG is ideally formed by propane and butane, however, in practice, this also has in its composition somecontaminants, such as pentane and ethane. The LPG quality control is done through its chemical composition, however,chemical compositions are traditionally known as variables of difficult measurement. The instruments used to measurethese variables, such as gas chromatographies, are expensive and have long intervals of measurement, what turns difficultthe development of more efficient control strategies. A way to reduce this problem is to use secondary process variablesto infer the chemical compositions in shorter time intervals. Systems that perform this task are know in the literatureas inferential sensors or inferential systems. This paper presents a comparative study of four hybrid inferential systems.These systems use the techniques of principal component analysis and artificial neural networks to estimate, in eachminute, the ethane and pentane molar fractions in LPG and the propane molar fraction in the residual gas. In this work,a part of a NGPU process formed by a deethanizer and a debutanizer column is simulated on HYSYSR© software.
Keywords: hybrid inferential system, principal component analysis, neural networks, natural gas processing.
1. INTRODUCTION
In natural gas processing units (NGPUs) the raw natural gas passes through an initial preprocessing stage, where thewater and oxidizing elements are removed. Then the gas is sent to distillation columns, where it is decomposed intovarious subproducts such as the residual gas, the natural gasoline (C5+) and the liquefied petroleum gas (LPG). Thecolumns demethanizer, deethanizer, depropanizer and debutanizer are examples of distillations columns that can be foundin NGPUs.
The NGPUs are complex processes and its configurations depend on the chemical characteristics of the natural gaswhich is being processed and on the production goals of the processing unit. The real NGPU adopted as the basis of thiswork consists of a column deethanizer in series with a debutanizer column. The main product of the process in study inthis work is the liquefied petroleum gas (LPG). The mentioned columns were computationally simulated in HYSYSR©, asoftware for chemical processes simulation.
The chemical compositions are rarely used directly as controlled variables in quality control strategies of the sub-products of a distillation column, because these variables are difficult to measure. The measurements of these importantindicators of process performance and product quality are often obtained through sample analysis in laboratories. Thismethodology results in large measurement delay, hindering that the necessary adjustments to maintain the behavior of theprocess according to the desired occur at the right time. Thus, one can arrive at a situation where the final product will beout of specification, causing an unwelcome economic loss.
There are also devices that can measure the composition analysis on the production line, such as gas chromatographies.However they are expensive to purchase and maintain, and present significant time intervals between the measurements.This last feature is the major restriction to implement more efficient control strategies in distillation columns processes.
According to Zamprognaet al.(2005), the inferential systems, also known as inferential sensors or soft sensors, are anattractive way to address the problem of measuring the primary variables of a process, particularly when physical sensorsto measure these variables are not available, or when the high costs and/or technical limitations of these devices preventits use in real time. In these systems, the primary variables of the process are estimated from secondary variables easy tomeasure, such as temperatures, pressures, levels, flows, among others.
In this work, it is presented an analysis of the use of artificial neural networks (ANN) in conjunction with principalcomponent analysis (PCA) to implement hybrid inferential systems. The neural networks are widely used to developthese systems. Its application to estimate chemical compositions has been reported in different kind of processes (Boet al., 2003; Chellaet al., 2006). Likewise, we can also find works in the scientific literature that present PCA beingapplied with artificial intelligence techniques to implement inferential sensors (Warneet al., 2004a,b; Linhareset al.,2008).
This paper presents a comparative study of four ways to combine PCA and ANN techniques. From the analysis ofdifferent configurations, important observations as advantages and disadvantages of each system can be made regardingthe combination of these techniques when used to implement inferential sensors. The structures analysed in this work arecalled PCA-ANN inferential systems.
ABCM Symposium Series in Mechatronics - Vol. 5 Copyright © 2012 by ABCM
Section II – Control Systems Page 447
The goal of the inferential systems analyzed in this paper is to estimate the molar fractions of contaminants ethane(C2) and pentane (C5) in LPG and the mole fraction of propane (C3) in the residual gas. The last one represents a lossindicator of the NGPU taken as basis to develop the simulated plant used in this work. The inference of these variables isperformed every minute by a multilayer perceptron (MLP) neural network. The PCA is applied to reduce the number ofinputs of the ANN without loss of information and performance, reducing the network complexity.
2. PROCESS SIMULATION
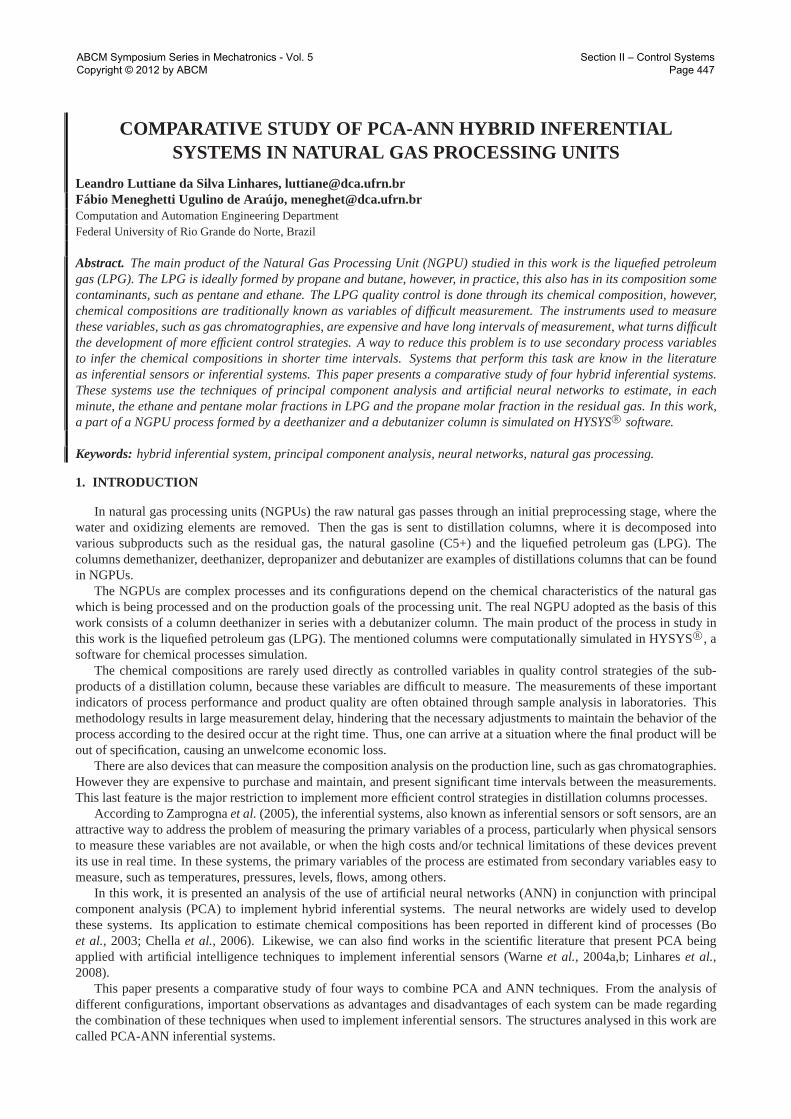
Some important stages of a NGPU were simulated using the HYSYSR© software to analyse the four PCA-ANN in-ferential systems proposed. The process simulation was implemented based on a real NGPU formed by a deethanizercolumn in series with a debutanizer column. After an initial removal process of water and oxidants from the natural gas itis forwarded to these fractional distillation columns where the main products of the process are extracted.
The deetanizer is the first column of the process simulation. It receives the preprocessed natural gas and by distillationgets on its top the residual gas, consisting mainly of methane and ethane. The main product of this column, the liquidnatural gas (LNG), feeds the next simulation stage: the debutanizer column. In this last step are extracted the naturalgasoline and LPG, respectively, the botton and top products of the debutanizer column.
Figure 1 ilustrates the schematic diagrams of the deethanizer and debutanizer columns as well the PID controllers andothers instruments on process simulation.
(a) Simulated deethanizer column.
Thermal oilThermal oil
input
GLPOutput-2
C5+ - Output-2
Gas - Output-2
(b) Simulated debutanizer column.
Figure 1. Schematic diagram of the process simulation in HYSYSR©.
The LPG is the most important economic product of the NGPU taken as basis of the process simulation, being com-pounded ideally by propane and butane. However, in practice, the producted LPG has some contaminats in its compositionas ethane and pentane. These contaminants must be controlled to maintain the final LPG composition according to qualityspecification laws and to ensure higher production profits. In this work the inferential systems in study estimate the ethaneand pentane molar fractions in LPG as well the estimated propane molar fraction in residual gas. The reduction of C3 lossin residual gas results in a C3 concentration increasing in LNG. As consequence of it the debutanizer column will presentas its final product a LPG richer in C3.
3. INFERENTIAL NEURAL MODEL
An inferential system has to adequately represent the dynamic relationships between secondary variables used by thesystem and the primary variables adopted to be estimated. To achieve this goal, it is necessary that the system describes adynamic model that represents these relationships with a satisfactory level of accuracy.
In this way, performing inference using ANN can be seen as an identification problem, since the neural networkapplied have to be able to effectively represent the dynamics between the secondary and primary variables of the processunder study. One of the main advantages of using neural structures for identification and/or for inference is its ability torepresent even the nonlinear dynamics based only on experimental measured data.
The identification procedure requires an initial model structure selection to be used. In the family of neural net-works multilayer perceptron (MLP), the identification models most used are NNFIR, NNARX, NNARMAX, NNOE andNNSSIF, all of them are based on its respective traditional linear model structures. More details about these models canbe found in Nørgaardet al. (2001).
ABCM Symposium Series in Mechatronics - Vol. 5 Copyright © 2012 by ABCM
Section II – Control Systems Page 448
A
N
N
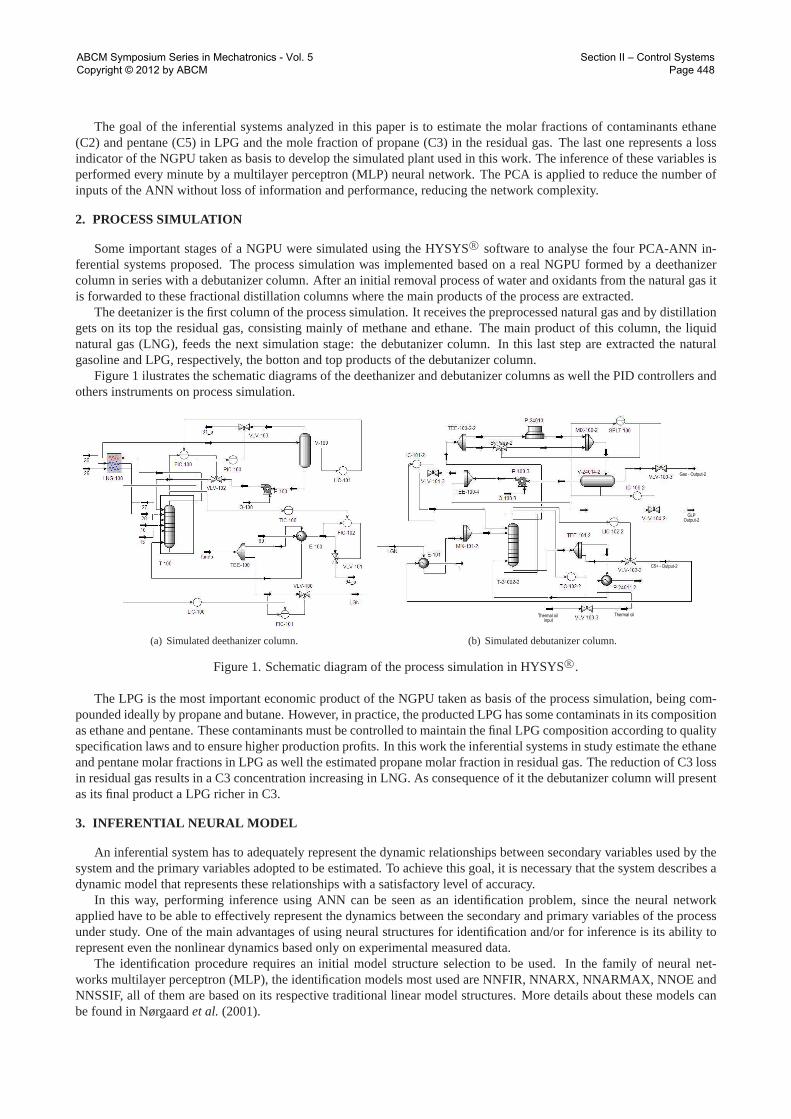
Figure 2. NNARX model structure.
The model used as the basis for the inferential systems proposed in this work is the model NNARX (Neural Net-work AutoRegressive with eXogenous inputs). Figure 2 shows, in general, this structure, where ANN is the multilayerperceptron,n andm are, respectively, the regressors applied to the inputu and outputy andd the transport delay.
4. PRINCIPAL COMPONENT ANALYSIS
According to Salahshooret al. (2009), PCA is a useful statistical technique that has found application in differentfields to find latent patterns in high dimensional data. It is a way of identifying patterns in data, and expressing the data insuch a way as to highlight their similarities and differences.
The PCA aims to map a system made up ofp correlated variables into uncorrelated linear combinationsk (k < p),called principal components. Jolliffe (2002) affirms that the PCA main idea is to reduce the dimensionality of a data setformed by correlated variables, keeping as much as possible of the variance of the original data set.
Thek principal components that represent the original data set system can be obtained using the covariance or corre-lation matrixes. The decision on which matrix to use is usually made according to the discrepancy caused by the differentmeasurement units of the original variables (Mingoti, 2005).
Considering the use of the correlation matrix, the PCA calculations can be summarized by the following steps(Salahshooret al., 2009):
• Step 1: Get the experimental dataX = (X1 X2 . . . Xp)′.
• Step 2: Normalize the random variablesX1, X2, . . ., Xp to zero mean and unit variance.
• Step 3: Calculate the correlation matrixS.
• Step 4: Calculate the eigenvectorse1, e2, . . . , ep and the respective eigenvaluesλ1, λ2, . . . , λp of the correlationmatrix. The coefficients of the j-th main component are the elements of the eigenvectorej as demonstrated in Eq. 1,while the eigenvalueλj represents the variance of this component.
• Step 5: Sort and choose the appropriate principal components, forming a feature vector. In general, once eigenvec-tors are found from the correlation matrix, the next step is to sort them from highest to lowest eigenvalues. Thisgives the components in order of significance. Now, it is possible to ignore the components of lesser significance.
• Step 6:Derive the new data set. This is the final step in PCA transformation. Once the significant components thatare going to be kept in the data are selected and hence the feature vector is formed, it is simply needed to take thetranspose of the vector and multiply it by the original data set.
Thek linear combinations (principal components) chosen to represent the original data setX are directly related tothe total variance of the system, being chosen according to the eigenvaluesλ1, λ2, . . . , λp. Sincee1, e2, . . . , ep are thenormalized eigenvectors, thej-th principal component (PC) is defined by:
Yj = ej1 X1 + ej2 X2 + . . . + ejp Xp (1)
The PCs are sorted in descending order according to their variances, or sorted from highest to lowest eigenvalues.Jolliffe (2002) says that many of the selection rules used to find the numberk of principal components are not strictlyaccurate. A widely used criterion is to select a number of componentsk which together represent a percentageγ of thetotal variance of the problem. Thus, it seeks the smallest integer value ofk such that satisfies:
k∑
i=1
λi
p∑
j=1
λj
≥ γ (2)
According to Jolliffe (2002),γ corresponds to a cutoff point and is usually selected from a region between70% and95%, depending on the application characteristics and requirements.
ABCM Symposium Series in Mechatronics - Vol. 5 Copyright © 2012 by ABCM
Section II – Control Systems Page 449
5. PCA-ANN HYBRID INFERENTIAL SYSTEMS
The quality control in chemical industries requires the implementation of monitoring networks using high cost onlinemeasurement devices and, when possible, appropriated models that produce real time estimates of unmeasured variableson the basis of measurement data available (Fortunaet al., 2007). The inferential systems fall in these latter case.
The inferential systems analyzed in this paper combine the ANN and PCA features. These systems differs in the waythese techniques are applied to the available process data. The goal of the proposed inferential sensors is to estimate inevery minute the ethane and pentane molar fractions in LPG, as well as the propane molar fraction in residual gas. In thisway, these information about chemical compositions are considered to our study the primary process variables (VP).
A common practice is to use temperatures of the distillation columns trays to estimate the chemical composition of itsmain products. However, due to a lack of temperature sensors on the trays of the columns in the process taken as the basisof this work, all PID process variables that somehow affect the primary variables dynamics were chosen as secondaryvariables of all proposed inferential systems. These secondary variables (VS) adopted are listed in Table 1 along withtheir respective PID controller and in which column they are obtained.
Table 1. Chosen secondary variables.
j Secondary variable (VSj) Column PID Controller
1 Top pressure Deethanizer PIC-1002 Reflux flow Deethanizer FIC-1003 Tray 40 temperature Deethanizer TIC-1004 Output flow Deethanizer FIC-1015 Tray 16 temperature Debutanizer TIC-102-26 Tray 28 liquid volume Debutanizer LIC-102-27 Reflux flow Debutanizer FIC-101-28 Condensated level Debutanizer LIC-100-2
The number of selected secondary variables and the presence of some of their past values in the identification modelNNARX turns the neural network inputs number of the PCA-ANN structures relatively high. To reduce this number thestatistical tool principal component analysis is applied. The goal is to reduce the complexity of the inferential systems,without impair the quality of the estimates of the primary variables.
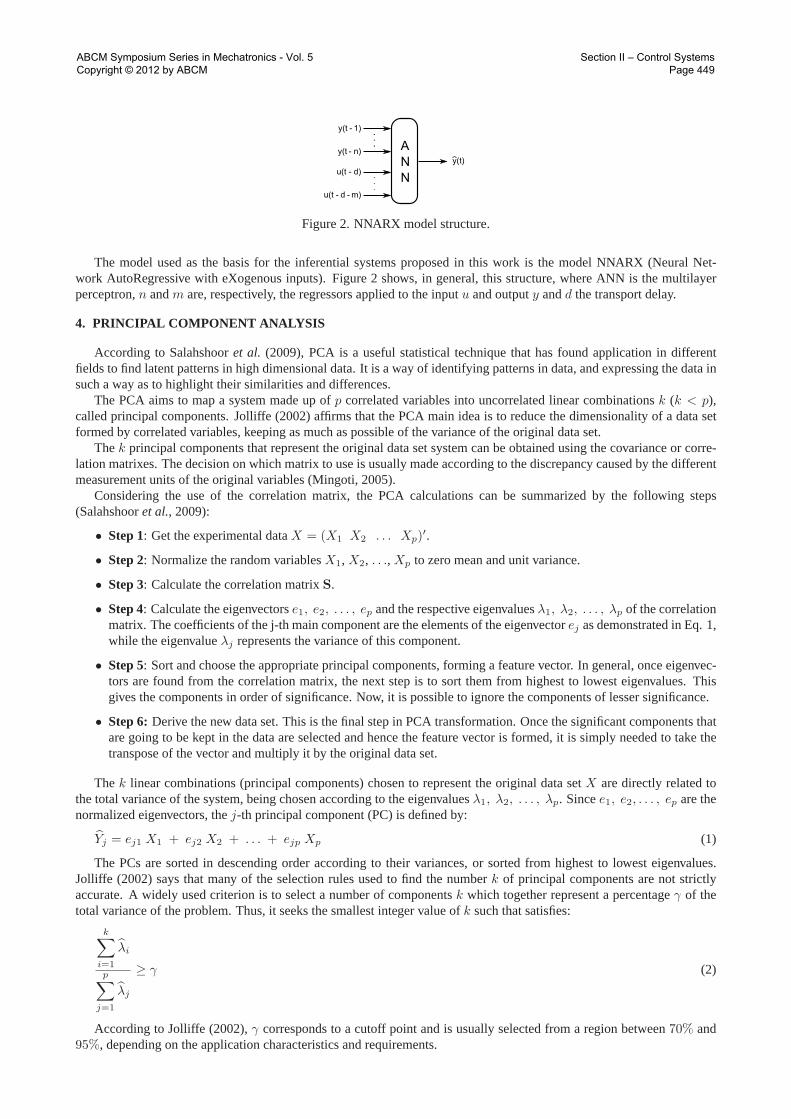
Figure 3 shows the schematics diagrams of the four inferential systems analysed in this work. In shade, it is possibleto note the part of the systems configuration that resembles the NNARX identification model. Didactically, we can divideeach system in a PCA module and an ANN module.
VS1(k-1)
.
.
.
.
.
.
.
.
.
.
.
.
.
.
.
.
.
.
PCA
ANN
1
VS1(k-n)
VSm(k-1)
VSm(k-n)
VP1(k-1)
VP1(k-n)
VPm(k-1)
VPm(k-n)
VP1(k)...
VPj(k)
.
.
.
Y1(k)
Y2(k)
Yp(k)
NNARX
(a) Hybrid structure PCA-ANN 1.
.
.
.
.
.
.
.
.
.
PCA
.
.
.
VS1(k-1)
VS1(k-n)
VSm(k-n)
VSm(k-1)
VP1(k-1)
VP1(k-n)
VP j(k-1)
VP j(k-n)
Y1(k)
Y2(k)
Yp(k)
Yp+1(k)
Yp+2(k)
Yp+q(k)
ANN
2
.
.
.
VP1(k)
VPj(k)
.
.
.
.
.
.
.
.
.
PCA
.
.
.
NNARX
(b) Hybrid structure PCA-ANN 2.
.
.
.
.
.
.
.
.
.
PCA A��
3
.
.
.
VS1(k-1)
VS1(k-n)
VSm(k-1)
VSm(k-n)
.
.
.
.
.
.
.
.
.
VP1(k-1)
VP1(k-n)
VPj(k-1)
VPj(k-n)
.
.
.
VP1(k)
VP j(k)
Y1(k)
Y2(k)
Yp(k)
NNARX
(c) Hybrid structure PCA-ANN 3.
A
N
N
4
PCA
VS1(k-1)
.
.
.
VS2(k-1)
VSm(k-1)
VPj(k-n)
VP1(k-1)
.
.
.
.
.
.
.
.
.
VP1(k-n)
VPj(k-1)
.
.
.
VP1(k)
VPj(k)
NNARX
.
.
.
.
.
.
.
.
.
Y1(k-1)
Y1(k-n)
Yp(k-1)
Yp(k-n)
(d) Hybrid structure PCA-ANN 4.
Figure3. Schematic diagrams of the PCA-ANN hybrid inferential systems.
ABCM Symposium Series in Mechatronics - Vol. 5 Copyright © 2012 by ABCM
Section II – Control Systems Page 450
The inferential system PCA-ANN 1 is composed of a PCA module that has as its inputs past values of primary andsecondary variables. Thus, the goal is to minimize the complexity of the ANN module. Depending on the quality of theinference performed, this configuration allows the system to be used or tested with high order models, since the ANNmodule input is formed only by thek principal components selected.
In the inferential system PCA-ANN 2, as well as in the previous structure, the goal is to achieche a high reduction of theANN module complexity. However, with this structure it’s possible to perform an analysis of the PCA module associativecapacity. As illustrated in Figure 3, the inferential system PCA-ANN 2 is composed by two distinct PCA modules. ThePCA module at the top of the diagram is responsible for filtering the information of the secondary variables, while themodule at the bottom filters the primary variables information.
The inferential structure PCA-ANN 3 was designed with the aim of analysing the importance of the primary variablespast values information for the ANN module. Thus, this inferential system is formed by a single PCA module that has inits inputs secondary variables past values. Compared with the previous structure, the PCA module responsible for filteringinformation related to the primary variables was removed. The past values of these variables are used directly as inputs ofthe neural network, turning the ANN module complexity larger than in the first two structures.
The ANN module of the inferential system PCA-ANN 4 is the one that most closely matches the NNARX model.The cited module receives as inputs the past values of the principal components extracted from secondary variables andthe past values of the primary variables. The PCA module of this inferential structure only reduces the information ofthe current secondary variables values, not more their past values. The NNARX model used in this system, in theory,causes a better assimilation of the dynamics between the primary and secondary variables from the network, reducing theestimation error. On the other hand, the complexity of the ANN module will significantly increase in relation to the otherstructures analysed in this comparative study.
6. SIMULATION RESULTS
Firstly, it’s important to choose and define some criteria to evaluate the proposed hybrid inferential systems. Thecomparison of these structures will be held regarding the PCA module complexity reduction ability, the neural networkstructure and the reliability of the primary variables inference. These criteria will be analysed, respectively, according tothe following: reduction rate(Rr), number of neural network synaptic connections (Nsc) and mean squared error (MSE).There is a relationship betweenRr andNsc, since the greater the reduction of the ANN inputs provided by the PCAmodule, the lower the number of ANN synaptic connections.
The reduction rate is used as a way to compare the efficiency of the PCA modules regarding their reduction ability.According to the previously presented inferential structures it’s possible to define the reduction rate from the model orderand the number of inputs and outputs (principal components) of PCA modules as:
Rr = 1−k
n(Vs + Vp)(3)
In Eq. 3,k is the number of principal components,n the model order andVs andVp are the numbers of secondary andprimary variables, respectively, that made up the PCA module input.
The first practical step to develop the proposed inferential systems is to collect experimental samples of the simulatedprocess. The goal is to use the data set obtained to select the principal components and identify the dynamical relationshipsbetween primary and secondary variables.
The experimental data were collected by applying PRS (Pseudo Random Signal) signals on the set points of the PIDcontrollers related to the selected secondary variables (see Tab. 1). With this procedure, it was possible to provide changesin the process variables (PVs) of these controllers and, consequently, in the mole fractions of propane in the residual gas,and of ethane and pentane in LPG. Applying this methodology a set of 3,000 training samples and five other small sets of400 validation samples were obtained.
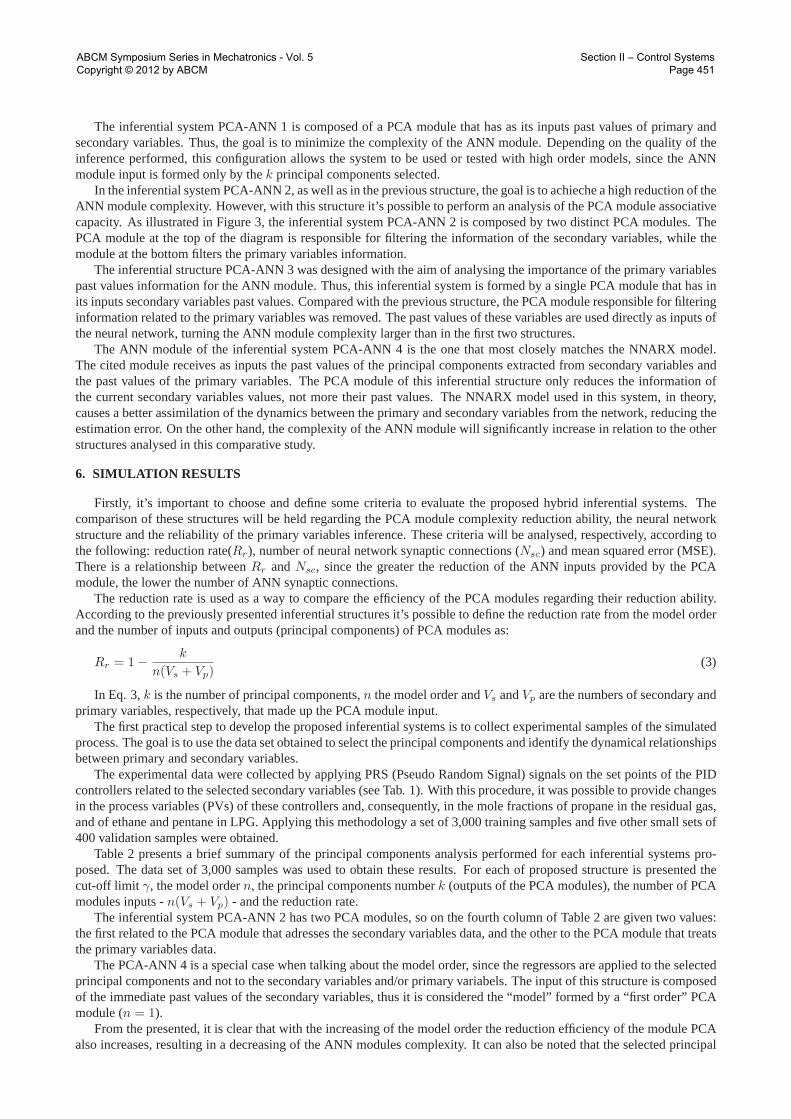
Table 2 presents a brief summary of the principal components analysis performed for each inferential systems pro-posed. The data set of 3,000 samples was used to obtain these results. For each of proposed structure is presented thecut-off limit γ, the model ordern, the principal components numberk (outputs of the PCA modules), the number of PCAmodules inputs -n(Vs + Vp) - and the reduction rate.
The inferential system PCA-ANN 2 has two PCA modules, so on the fourth column of Table 2 are given two values:the first related to the PCA module that adresses the secondary variables data, and the other to the PCA module that treatsthe primary variables data.
The PCA-ANN 4 is a special case when talking about the model order, since the regressors are applied to the selectedprincipal components and not to the secondary variables and/or primary variabels. The input of this structure is composedof the immediate past values of the secondary variables, thus it is considered the “model” formed by a “first order” PCAmodule (n= 1).
From the presented, it is clear that with the increasing of the model order the reduction efficiency of the module PCAalso increases, resulting in a decreasing of the ANN modules complexity. It can also be noted that the selected principal
ABCM Symposium Series in Mechatronics - Vol. 5 Copyright © 2012 by ABCM
Section II – Control Systems Page 451
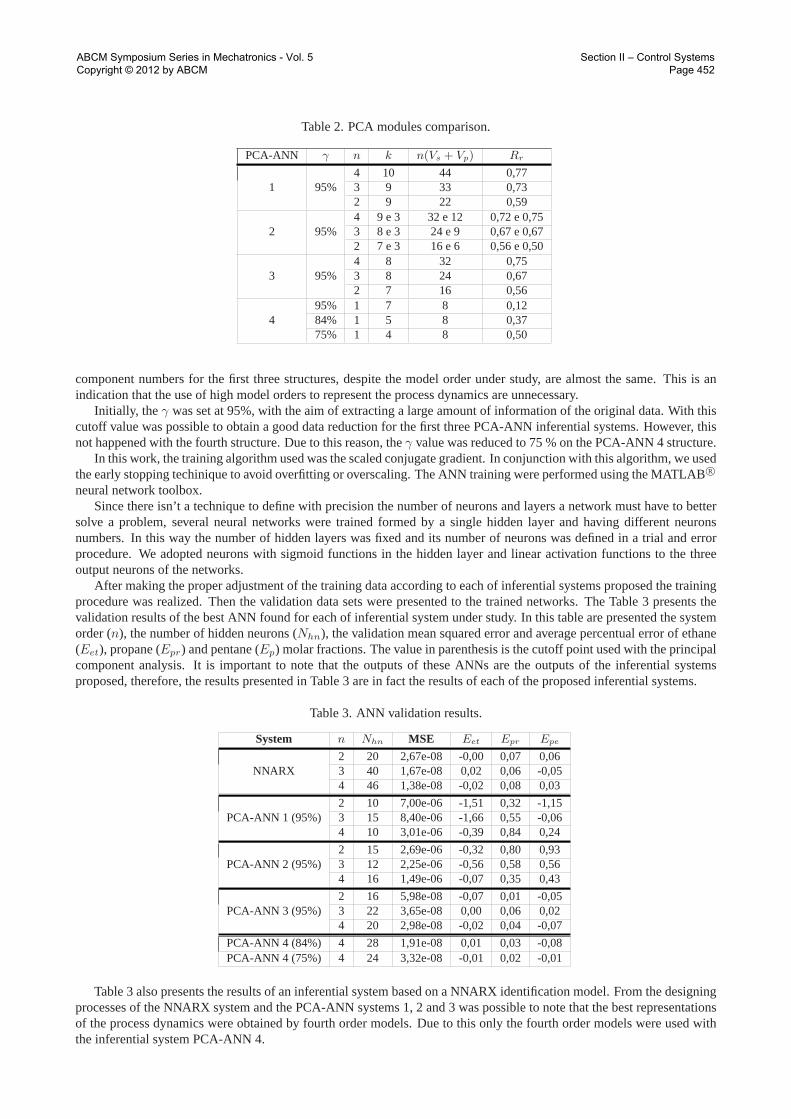
Table 2. PCA modules comparison.
PCA-ANN γ n k n(Vs + Vp) Rr
1 95%4 10 44 0,773 9 33 0,732 9 22 0,59
2 95%4 9 e 3 32 e 12 0,72 e 0,753 8 e 3 24 e 9 0,67 e 0,672 7 e 3 16 e 6 0,56 e 0,50
3 95%4 8 32 0,753 8 24 0,672 7 16 0,56
495% 1 7 8 0,1284% 1 5 8 0,3775% 1 4 8 0,50
component numbers for the first three structures, despite the model order under study, are almost the same. This is anindication that the use of high model orders to represent the process dynamics are unnecessary.
Initially, the γ was set at 95%, with the aim of extracting a large amount of information of the original data. With thiscutoff value was possible to obtain a good data reduction for the first three PCA-ANN inferential systems. However, thisnot happened with the fourth structure. Due to this reason, theγ value was reduced to 75 % on the PCA-ANN 4 structure.
In this work, the training algorithm used was the scaled conjugate gradient. In conjunction with this algorithm, we usedthe early stopping techinique to avoid overfitting or overscaling. The ANN training were performed using the MATLABR©
neural network toolbox.Since there isn’t a technique to define with precision the number of neurons and layers a network must have to better
solve a problem, several neural networks were trained formed by a single hidden layer and having different neuronsnumbers. In this way the number of hidden layers was fixed and its number of neurons was defined in a trial and errorprocedure. We adopted neurons with sigmoid functions in the hidden layer and linear activation functions to the threeoutput neurons of the networks.
After making the proper adjustment of the training data according to each of inferential systems proposed the trainingprocedure was realized. Then the validation data sets were presented to the trained networks. The Table 3 presents thevalidation results of the best ANN found for each of inferential system under study. In this table are presented the systemorder (n), the number of hidden neurons (Nhn), the validation mean squared error and average percentual error of ethane(Eet), propane (Epr) and pentane (Ep) molar fractions. The value in parenthesis is the cutoff point used with the principalcomponent analysis. It is important to note that the outputs of these ANNs are the outputs of the inferential systemsproposed, therefore, the results presented in Table 3 are in fact the results of each of the proposed inferential systems.
Table 3. ANN validation results.
System n Nhn MSE Eet Epr Epe
NNARX2 20 2,67e-08 -0,00 0,07 0,063 40 1,67e-08 0,02 0,06 -0,054 46 1,38e-08 -0,02 0,08 0,03
PCA-ANN 1 (95%)2 10 7,00e-06 -1,51 0,32 -1,153 15 8,40e-06 -1,66 0,55 -0,064 10 3,01e-06 -0,39 0,84 0,24
PCA-ANN 2 (95%)2 15 2,69e-06 -0,32 0,80 0,933 12 2,25e-06 -0,56 0,58 0,564 16 1,49e-06 -0,07 0,35 0,43
PCA-ANN 3 (95%)2 16 5,98e-08 -0,07 0,01 -0,053 22 3,65e-08 0,00 0,06 0,024 20 2,98e-08 -0,02 0,04 -0,07
PCA-ANN 4 (84%) 4 28 1,91e-08 0,01 0,03 -0,08PCA-ANN 4 (75%) 4 24 3,32e-08 -0,01 0,02 -0,01
Table 3 also presents the results of an inferential system based on a NNARX identification model. From the designingprocesses of the NNARX system and the PCA-ANN systems 1, 2 and 3 was possible to note that the best representationsof the process dynamics were obtained by fourth order models. Due to this only the fourth order models were used withthe inferential system PCA-ANN 4.
ABCM Symposium Series in Mechatronics - Vol. 5 Copyright © 2012 by ABCM
Section II – Control Systems Page 452
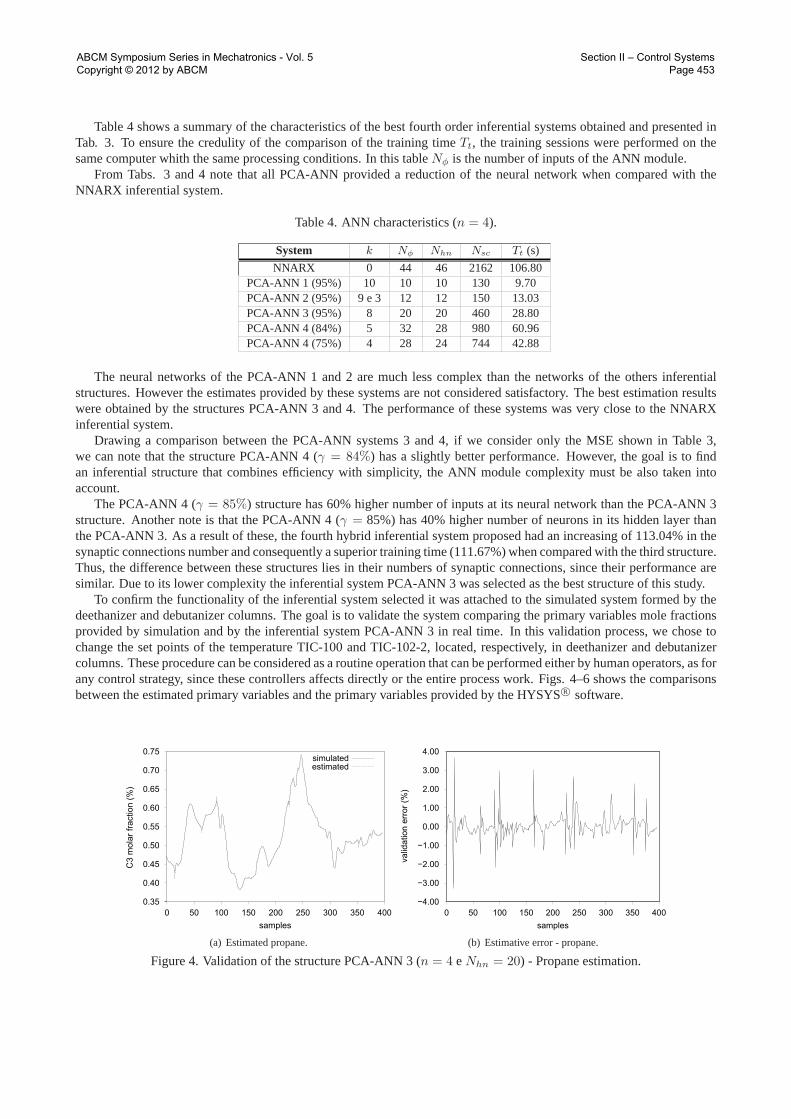
Table 4 shows a summary of the characteristics of the best fourth order inferential systems obtained and presented inTab. 3. To ensure the credulity of the comparison of the training timeTt, the training sessions were performed on thesame computer whith the same processing conditions. In this tableNφ is the number of inputs of the ANN module.
From Tabs. 3 and 4 note that all PCA-ANN provided a reduction of the neural network when compared with theNNARX inferential system.
Table 4. ANN characteristics (n= 4).
System k Nφ Nhn Nsc Tt (s)
NNARX 0 44 46 2162 106.80PCA-ANN 1 (95%) 10 10 10 130 9.70PCA-ANN 2 (95%) 9 e 3 12 12 150 13.03PCA-ANN 3 (95%) 8 20 20 460 28.80PCA-ANN 4 (84%) 5 32 28 980 60.96PCA-ANN 4 (75%) 4 28 24 744 42.88
The neural networks of the PCA-ANN 1 and 2 are much less complex than the networks of the others inferentialstructures. However the estimates provided by these systems are not considered satisfactory. The best estimation resultswere obtained by the structures PCA-ANN 3 and 4. The performance of these systems was very close to the NNARXinferential system.
Drawing a comparison between the PCA-ANN systems 3 and 4, if we consider only the MSE shown in Table 3,we can note that the structure PCA-ANN 4 (γ= 84%) has a slightly better performance. However, the goal is to findan inferential structure that combines efficiency with simplicity, the ANN module complexity must be also taken intoaccount.
The PCA-ANN 4 (γ= 85%) structure has 60% higher number of inputs at its neural network than the PCA-ANN 3structure. Another note is that the PCA-ANN 4 (γ= 85%) has 40% higher number of neurons in its hidden layer thanthe PCA-ANN 3. As a result of these, the fourth hybrid inferential system proposed had an increasing of 113.04% in thesynaptic connections number and consequently a superior training time (111.67%) when compared with the third structure.Thus, the difference between these structures lies in their numbers of synaptic connections, since their performance aresimilar. Due to its lower complexity the inferential system PCA-ANN 3 was selected as the best structure of this study.
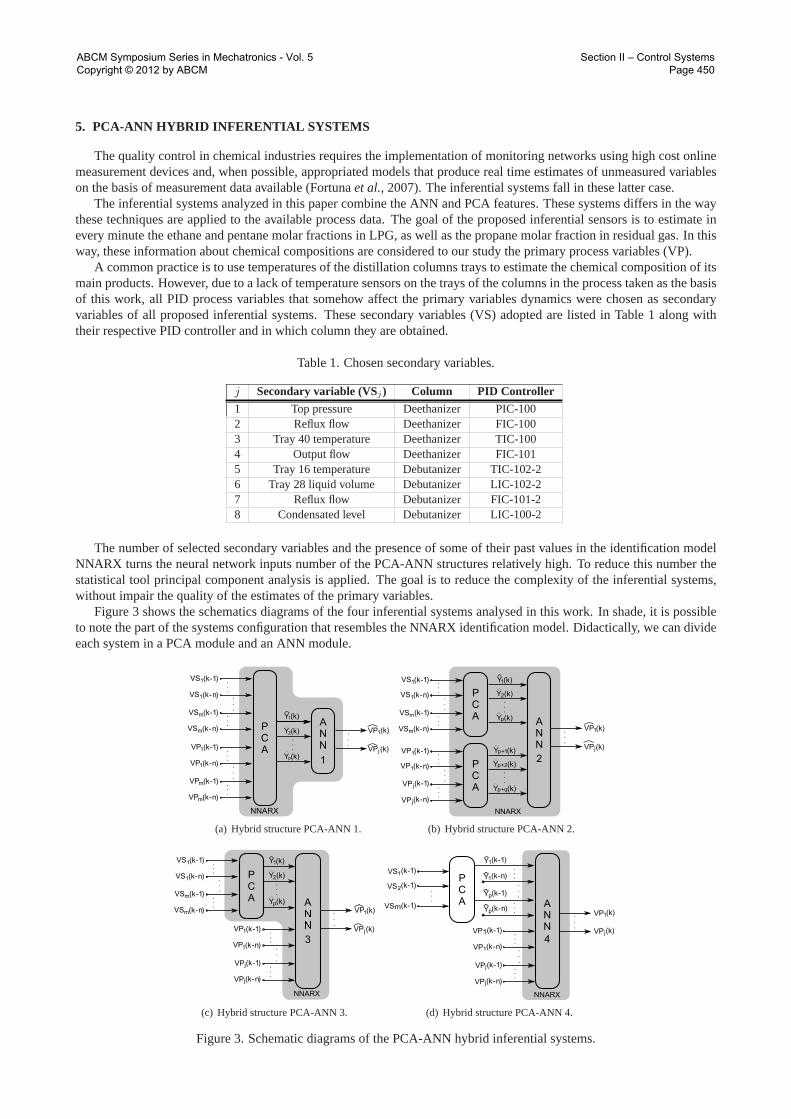
To confirm the functionality of the inferential system selected it was attached to the simulated system formed by thedeethanizer and debutanizer columns. The goal is to validate the system comparing the primary variables mole fractionsprovided by simulation and by the inferential system PCA-ANN 3 in real time. In this validation process, we chose tochange the set points of the temperature TIC-100 and TIC-102-2, located, respectively, in deethanizer and debutanizercolumns. These procedure can be considered as a routine operation that can be performed either by human operators, as forany control strategy, since these controllers affects directly or the entire process work. Figs. 4–6 shows the comparisonsbetween the estimated primary variables and the primary variables provided by the HYSYSR© software.
0.35
0.40
0.45
0.50
0.55
0.60
0.65
0.70
0.75
0 50 100 150 200 250 300 350 400
C3
mo
lar
fra
ctio
n (
%)
samples
simulatedestimated
(a) Estimated propane.
−4.00
−3.00
−2.00
−1.00
0.00
1.00
2.00
3.00
4.00
0 50 100 150 200 250 300 350 400
va
lida
tio
n e
rro
r (%
)
samples
(b) Estimative error - propane.
Figure 4. Validation of the structure PCA-ANN 3 (n= 4 eNhn = 20) - Propane estimation.
ABCM Symposium Series in Mechatronics - Vol. 5 Copyright © 2012 by ABCM
Section II – Control Systems Page 453
14.00
16.00
18.00
20.00
22.00
24.00
26.00
28.00
30.00
32.00
0 50 100 150 200 250 300 350 400
C2
mo
lar
fra
ctio
n (
%)
samples
simulatedestimated
(a) Estimated ethane.
−1.50
−1.00
−0.50
0.00
0.50
1.00
1.50
2.00
2.50
0 50 100 150 200 250 300 350 400
va
lida
tio
n e
rro
r (%
)
samples
(b) EStimative error - ethane.
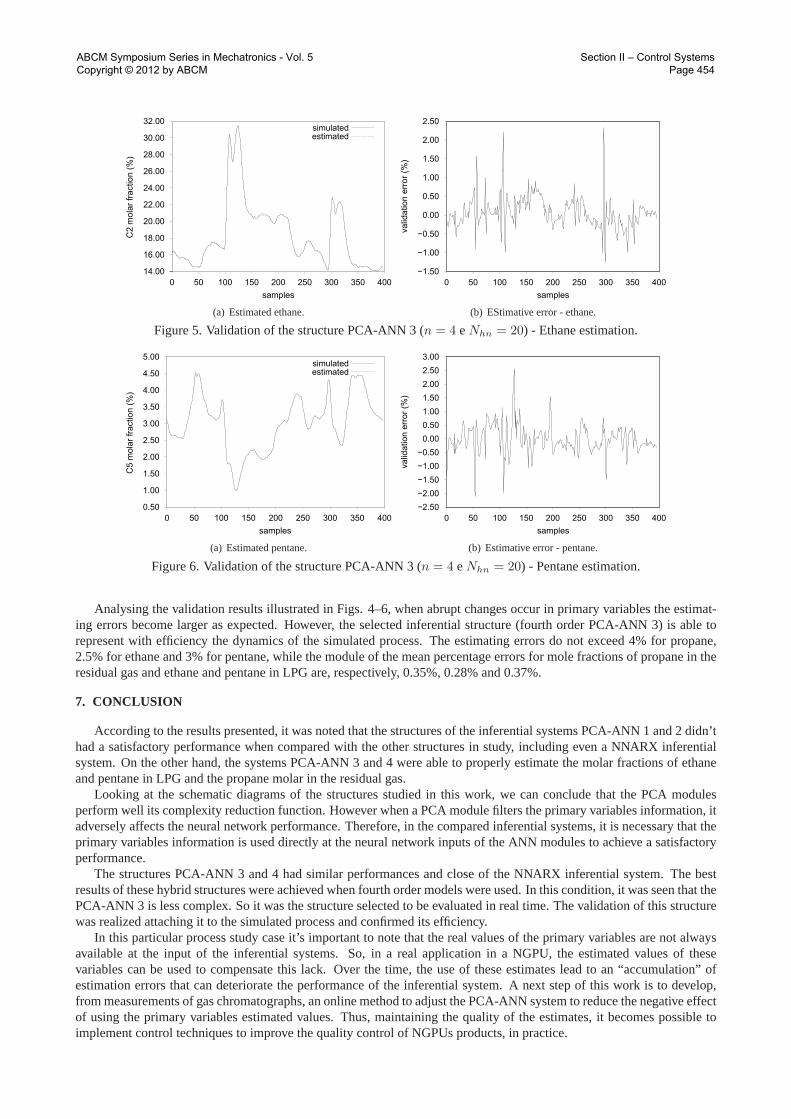
Figure 5. Validation of the structure PCA-ANN 3 (n= 4 eNhn = 20) - Ethane estimation.
0.50
1.00
1.50
2.00
2.50
3.00
3.50
4.00
4.50
5.00
0 50 100 150 200 250 300 350 400
C5
mo
lar
fra
ctio
n (
%)
samples
simulatedestimated
(a) Estimated pentane.
−2.50
−2.00
−1.50
−1.00
−0.50
0.00
0.50
1.00
1.50
2.00
2.50
3.00
0 50 100 150 200 250 300 350 400
va
lida
tio
n e
rro
r (%
)
samples
(b) Estimative error - pentane.
Figure 6. Validation of the structure PCA-ANN 3 (n= 4 eNhn = 20) - Pentane estimation.
Analysing the validation results illustrated in Figs. 4–6, when abrupt changes occur in primary variables the estimat-ing errors become larger as expected. However, the selected inferential structure (fourth order PCA-ANN 3) is able torepresent with efficiency the dynamics of the simulated process. The estimating errors do not exceed 4% for propane,2.5% for ethane and 3% for pentane, while the module of the mean percentage errors for mole fractions of propane in theresidual gas and ethane and pentane in LPG are, respectively, 0.35%, 0.28% and 0.37%.
7. CONCLUSION
According to the results presented, it was noted that the structures of the inferential systems PCA-ANN 1 and 2 didn’thad a satisfactory performance when compared with the other structures in study, including even a NNARX inferentialsystem. On the other hand, the systems PCA-ANN 3 and 4 were able to properly estimate the molar fractions of ethaneand pentane in LPG and the propane molar in the residual gas.
Looking at the schematic diagrams of the structures studied in this work, we can conclude that the PCA modulesperform well its complexity reduction function. However when a PCA module filters the primary variables information, itadversely affects the neural network performance. Therefore, in the compared inferential systems, it is necessary that theprimary variables information is used directly at the neural network inputs of the ANN modules to achieve a satisfactoryperformance.
The structures PCA-ANN 3 and 4 had similar performances and close of the NNARX inferential system. The bestresults of these hybrid structures were achieved when fourth order models were used. In this condition, it was seen that thePCA-ANN 3 is less complex. So it was the structure selected to be evaluated in real time. The validation of this structurewas realized attaching it to the simulated process and confirmed its efficiency.
In this particular process study case it’s important to note that the real values of the primary variables are not alwaysavailable at the input of the inferential systems. So, in a real application in a NGPU, the estimated values of thesevariables can be used to compensate this lack. Over the time, the use of these estimates lead to an “accumulation” ofestimation errors that can deteriorate the performance of the inferential system. A next step of this work is to develop,from measurements of gas chromatographs, an online method to adjust the PCA-ANN system to reduce the negative effectof using the primary variables estimated values. Thus, maintaining the quality of the estimates, it becomes possible toimplement control techniques to improve the quality control of NGPUs products, in practice.
ABCM Symposium Series in Mechatronics - Vol. 5 Copyright © 2012 by ABCM
Section II – Control Systems Page 454

8. ACKNOWLEDGEMENTS
The authors would like to thank the Coordination for the Improvement of Higher Level Personnel (CAPES) by thefinancial support.
9. REFERENCES
Bo, C., Li, J., Sun, C. and Wang, Y., 2003. “The application of neural network soft sensor technology to an advancedcontrol system of distillation operation”. InProceedings of the International Joint Conference on Neural Networks.Portland, Oregon, USA, Vol. 2, pp. 1054–1058.
Chella, A., Ciarlini, P. and Maniscalco, U., 2006. “Neural networks as soft sensors: a comparison in a real worldapplication”. InProceedings of the International Joint Conference on Neural Networks. Vancouver, Canada, pp.2662–2668.
Fortuna, L., Graziani, S., Rizzo, A. and Xibilia, M.G., 2007.Soft sensors for monitoring and control of industrialprocesses. Springer Verlag, London.
Jolliffe, I.T., 2002.Principal Component Analysis. Springer-Verlag, New York, USA, 2nd edition.Linhares, L.L.S., Reboucas, D.L., Araujo, F.U.M. and Maitelli, A.L., 2008. “Sistema de inferência baseado em redes
neurais artificiais aplicado em plantas de processamento de gás natural”. InXVII Congresso Brasileiro de Automática.Juiz de Fora, MG, Brazil.
Mingoti, S.A., 2005.Análise de dados através de métodos de estatística multivariada: uma abordagem aplicada. UFMG,Belo Horizonte, Brasil.
Nørgaard, M., Ravn, O., Poulsen, N.K. and Hansen, L.K., 2001.Neural networks for modelling and control of dynamicsystems. Springer-Verlag London Limited, London, England.
Salahshoor, K., Kordestani, M. and Khoshro, M.S., 2009. “Design of online soft sensors based on combined adaptive pcaand rbf neural networks”. InIEEE Symposium on Computational Intelligence in Control and Automation. pp. 89–95.
Warne, K., Prasad, G., Siddique, N.H. and Maguire, L.P., 2004a. “Development of a hybrid pca-anfis measurementsystem for monitoring product quality in the coating industry”. InIEEE International Conference on Systems, Manand Cybernetics. The Hague, Netherlands, Vol. 4, pp. 3519–3524.
Warne, K., Prasad, G., Siddique, N.H. and Maguire, L.P., 2004b. “Statistical and computational techniques for inferentialmodel development: a comparative evaluation and a novel proposition for fusion”.Engineering Applications ofArtificial Intelligence, Vol. 17, No. 8, pp. 871–885.
Zamprogna, E., Barolo, M. and Seborg, D., 2005. “Optimal selection of soft sensor inputs for batch distillation columnsusing principal component analysis”.Journal of Process Control, Vol. 15, No. 1, pp. 39–52.
10. RESPONSIBILITY NOTICE
The authors are the only responsible for the printed material included in this paper.
ABCM Symposium Series in Mechatronics - Vol. 5 Copyright © 2012 by ABCM
Section II – Control Systems Page 455