comparing the impact of augmented reality and 3d … · comparing the impact of augmented reality...
TRANSCRIPT
Comparing the Impact of Augmented Reality and 3D models as Visual Representations
in eBook
by
Kalyan Kumar Juluru
A Thesis Presented in Partial Fulfillment
of the Requirements for the Degree
Master of Science
Approved June 2017 by the
Graduate Supervisory Committee:
Robert K. Atkinson, Co-Chair
Yinong Chen, Co-Chair
Erin Walker
ARIZONA STATE UNIVERSITY
August 2017
i
ABSTRACT
Electronic books or eBooks have the potential to revolutionize the way humans
read and learn. eBooks offer many advantages such as simplicity, ease of use, eco-
friendliness, and portability. The advancement of technology has introduced many forms
of multimedia objects into eBooks, which may help people learn from them. To help the
readers understand and comprehend a concept that is put forward by the author of an
eBook, there is ongoing research involving the use of augmented reality (AR) in education.
This study explores how AR and three-dimensional interactive models are integrated into
eBooks to help the readers comprehend the content quickly and swiftly. It compares the
reading activities of people when they experience these two visual representations within
an eBook.
This study required participants to interact with some instructional material
presented on an eBook and complete a learning measure. While interacting with the eBook,
participants were equipped with a set of physiological devices, namely an ABM EEG
headset and eye tracker during the experiment to collect biometric data that could be used
to objectively measure their user experience. Fifty college students participated in this
study. The data collected from each of the participants was used to analyze the reading
activities of people by performing an Independent Samples t-test.

ii
DEDICATION
This is dedicated to my family and all my teachers who played a vital role in my life to
build my character and thoughts that are essential to who I am today.
My mother Anuradha Somisetty
My father Shiva Kumar Juluru
My sister Mamatha Juluru
iii
ACKNOWLEDGMENTS
First, I would like to thank my thesis advisor Dr. Robert Atkinson, a professor at
the School of Computing, Informatics and Decisions Engineering at Arizona State
University. He always guided me in the right direction and helped me plan accordingly to
complete my thesis in time.
I would also like to thank Dr. Erin Walker and Dr. Yinong Chen, professors at the
School of Computing, Informatics, and Decisions Engineering at Arizona State University,
for their valuable suggestions in formulating the idea of my thesis and being a part of my
research.
After my professors, I would like to thank my laboratory mate Helen Chavez. She
helped me right from the beginning by conducting informatory sessions to help me acquire
the required knowledge about the necessary equipment and was always willing to help
clarify my doubts.
Finally, I would like to thank my parents and friends who have consistently helped,
supported and motivated me throughout my thesis journey. Without all the above people
in my life, it would not have been possible to reach this milestone.
iv
TABLE OF CONTENTS
Page
LIST OF TABLES ............................................................................................................... v
LIST OF FIGURES .............................................................................................................vi
CHAPTER
1 LITERATURE REVIEW AND OVERVIEW ................. ...................................... 1
2 METHOD .................... ......................................................................................... 11
Participants And Design ....................................................................... 11
Learning Environments ......................................................................... 11
Instruments And Apparatus .................................................................. 15
Scoring .................................................................................................. 19
Procedure .............................................................................................. 20
3 RESULTS ................... ......................................................................................... 22
Comparison Between Groups ............................................................... 23
Comparison Within Groups .................................................................. 30
4 DISCUSSIONS AND CONCLUSION ................... ............................................. 36
REFERENCES....... .......................................................................................................... 40
APPENDIX
A DEMOGRAPHIC QUESTIONNAIRE .............................................................. 44
B POST- TEST QUESTIONNAIRE ...................................................................... 47
C USER EXPERIENCE QUESTIONNAIRE ........................................................ 53
D CTCI COMPLETION REPORT ........................................................................ 57

v
LIST OF TABLES
Table Page
1. Comparison Between Stimuli ........................................................................... 15
vi
LIST OF FIGURES
Figure Page
1. Image and Location Based AR ........................................................................... 2
2. ARBook Using Marker Based AR ....................................................................... 3
3. Sample Exercise Solved Using DeidricAR ......................................................... 4
4. Final Solution For The Problem Stated In Figure 3 ............................................ 6
5. A Tutor Assisting His Student Using Construct3d .............................................. 7
6. AR-EBook ........................................................................................................ 12
7. AR-Scene.......................................................................................................... 13
8. Three-Dimensional Model Visual ...................................................................... 14
9. ABM X-10 EEG Headset .................................................................................. 16
10. Tobii Pro Glasses 2 .......................................................................................... 18
11. Independent Samples t-test For ABM Sensor Data ............................................ 25
12. Independent Samples t-test For Learning ........................................................... 26
13. Independent Samples t-test For Visual Attention ............................................... 28
14. Independent Samples t-test For User Experience Ratings .................................. 29
15. Independent Samples t-test For Relative Time Spent on Visuals ....................... 30
16. T-test on ABM Sensor data for Control group ................................................... 32
17. T-test on ABM Sensor data for Treatment Group .............................................. 34
18. Heatmap For Treatment Group .......................................................................... 34
19. Heatmap For Control group ............................................................................... 35
20. Gartner Hype Cycle ........................................................................................... 38
1
CHAPTER 1
LITERATURE REVIEW
The term Augmented Reality is thought to be termed by Tom Caudell
("Infographic: The History of Augmented Reality - Augment News", 2017). Augmented
Reality (AR) is where a set of technologies are responsible for displaying and presenting
three-dimensional objects, generated by a computer, in the real world where users can
interact with them in real time. People see both real and virtual objects, which could either
be stationary or interactive, in real time. The history of AR goes back to as early as the
invention of computers but the development of devices like head mounted displays came
into play in only 1960s when Ivan Sutherland first developed it ("Augmented reality",
2017). In 1975 Myron Krueger took it to the next step by creating an AR lab where
projectors were combined with video cameras to omit an onscreen silhouette to create an
interactive environment surrounding the users. Later, AR systems like Virtual Fixtures
were developed to help the military so that they can control machinery from remote space
("Infographic: The History of Augmented Reality - Augment News", 2017).
AR can be perceived in a variety of ways. Initially people used specific labels or
markers like quick response codes to fix the position of the three-dimensional model in real
world space. Whenever the marker or label is displayed in front of the camera, the AR
application processes the image to generate the 3d model and place them in the real world.
When the marker is rotated, or moved, the models also move along with the marker.
Nowadays markerless AR, which uses GPS to identify the location of the user and is used
2
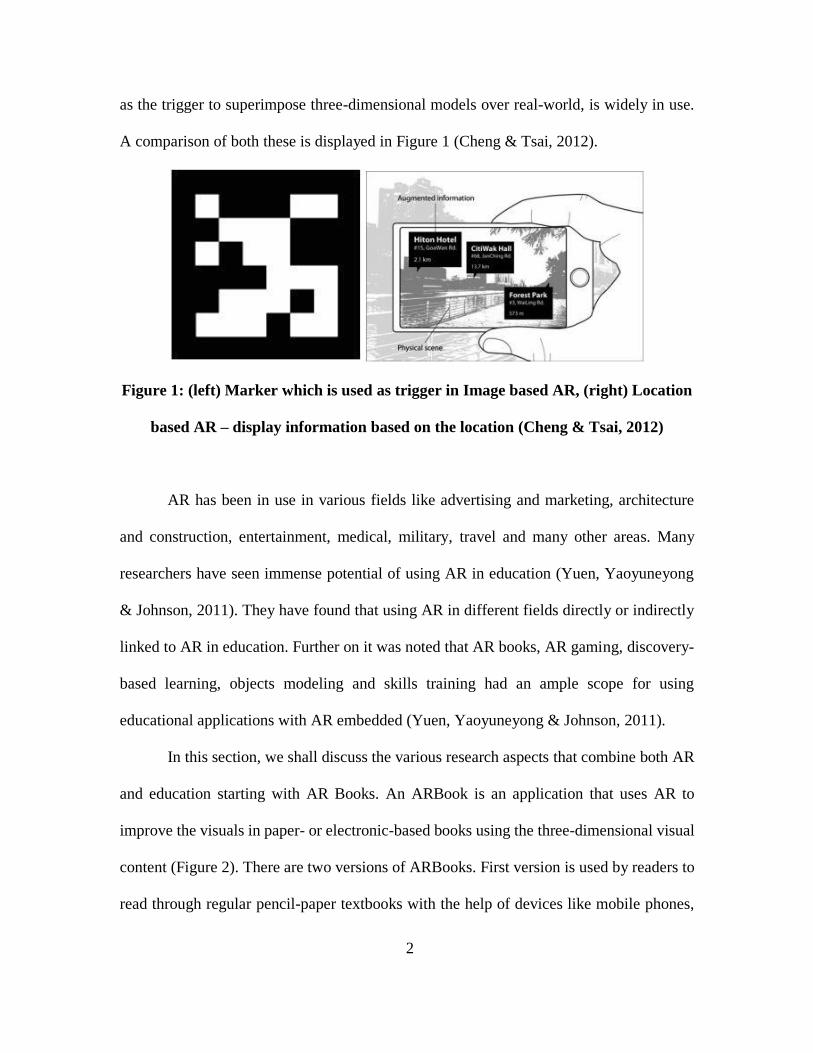
as the trigger to superimpose three-dimensional models over real-world, is widely in use.
A comparison of both these is displayed in Figure 1 (Cheng & Tsai, 2012).
Figure 1: (left) Marker which is used as trigger in Image based AR, (right) Location
based AR – display information based on the location (Cheng & Tsai, 2012)
AR has been in use in various fields like advertising and marketing, architecture
and construction, entertainment, medical, military, travel and many other areas. Many
researchers have seen immense potential of using AR in education (Yuen, Yaoyuneyong
& Johnson, 2011). They have found that using AR in different fields directly or indirectly
linked to AR in education. Further on it was noted that AR books, AR gaming, discovery-
based learning, objects modeling and skills training had an ample scope for using
educational applications with AR embedded (Yuen, Yaoyuneyong & Johnson, 2011).
In this section, we shall discuss the various research aspects that combine both AR
and education starting with AR Books. An ARBook is an application that uses AR to
improve the visuals in paper- or electronic-based books using the three-dimensional visual
content (Figure 2). There are two versions of ARBooks. First version is used by readers to
read through regular pencil-paper textbooks with the help of devices like mobile phones,

3
AR glasses, and other wearable devices. The second version is used to deliver a book using
a computing device. These devices help users to visualize the multimedia attributes as
three-dimensional objects, soundtracks or as videos, which augments the traditional real
world textbook, as users go through the book using these devices. The pages in the book
are used as triggers for the AR scene to load. The device with which the reader reads the
book handles this transition. Figure 2 consists of the sample screenshots.
Figure 2: ARBook using marker based AR (Cho, Jung, Lee, Lim & Yang, 2011)
As textbooks have many pages, the system proposed uses markerless tracking
methods for key point extraction, matching and tracking. The three-dimensional models
are primarily designed to help the reader to understand the material better. This method
used in developing the application was developed using a markerless, robust visual tracking
method. This approach can recognize page movements and page turns for key point
extraction at 25fps and can track the pages at 60fps over 200 pages for displaying the three-
dimensional models. This application can even run on a single core CPU which runs at 1.2
4
GHz which has a low camera resolution of 640 by 480. The developers claim that their
method runs robustly on various environments with a small defect that is to not detect curl
pages (Cho, Jung, Lee, Lim & Yang, 2011).
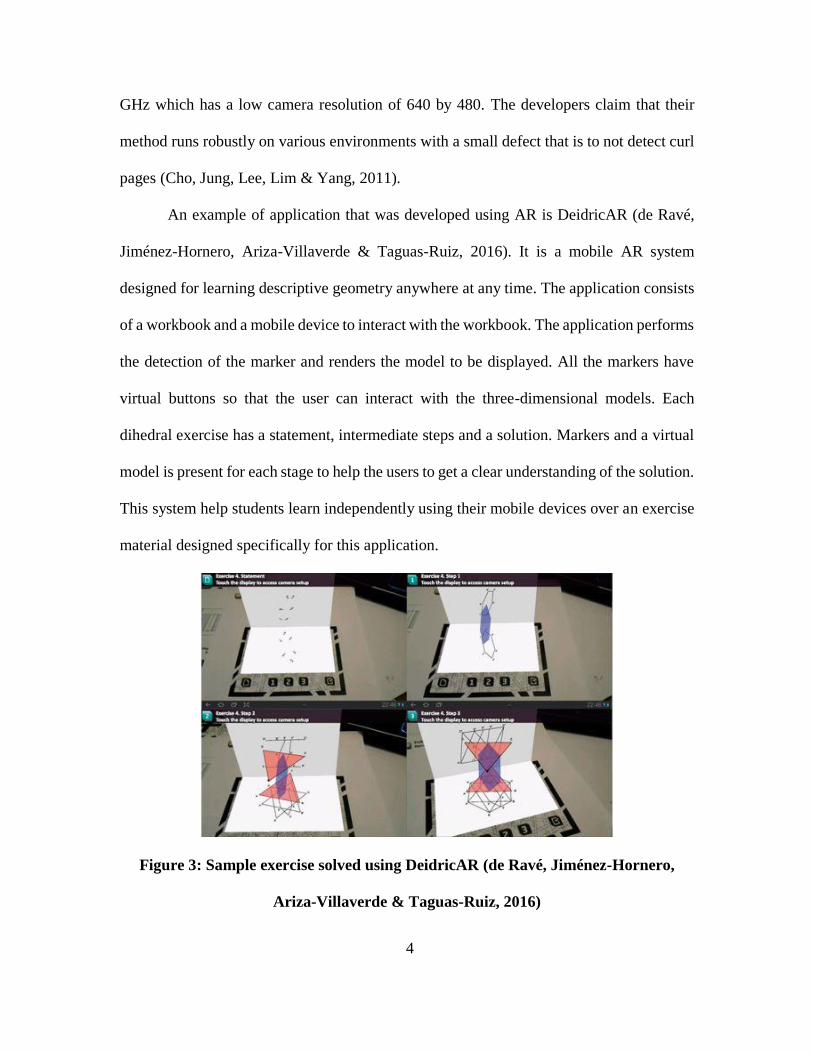
An example of application that was developed using AR is DeidricAR (de Ravé,
Jiménez-Hornero, Ariza-Villaverde & Taguas-Ruiz, 2016). It is a mobile AR system
designed for learning descriptive geometry anywhere at any time. The application consists
of a workbook and a mobile device to interact with the workbook. The application performs
the detection of the marker and renders the model to be displayed. All the markers have
virtual buttons so that the user can interact with the three-dimensional models. Each
dihedral exercise has a statement, intermediate steps and a solution. Markers and a virtual
model is present for each stage to help the users to get a clear understanding of the solution.
This system help students learn independently using their mobile devices over an exercise
material designed specifically for this application.
Figure 3: Sample exercise solved using DeidricAR (de Ravé, Jiménez-Hornero,
Ariza-Villaverde & Taguas-Ruiz, 2016)
5
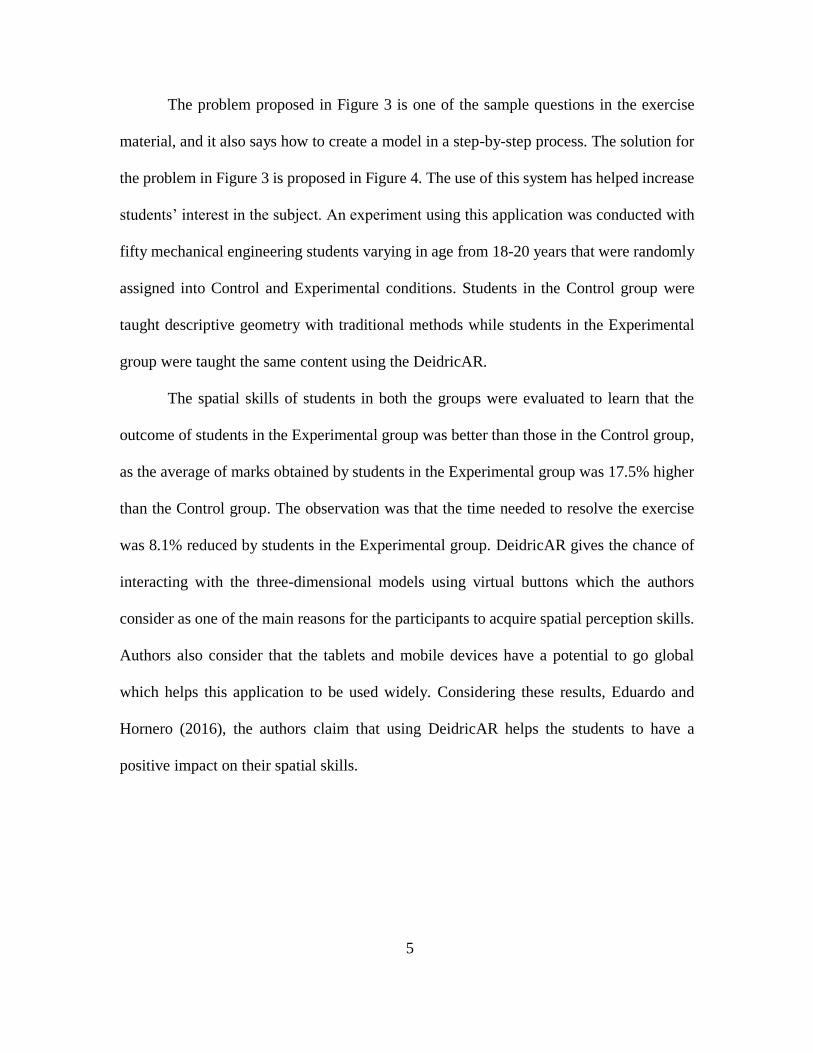
The problem proposed in Figure 3 is one of the sample questions in the exercise
material, and it also says how to create a model in a step-by-step process. The solution for
the problem in Figure 3 is proposed in Figure 4. The use of this system has helped increase
students’ interest in the subject. An experiment using this application was conducted with
fifty mechanical engineering students varying in age from 18-20 years that were randomly
assigned into Control and Experimental conditions. Students in the Control group were
taught descriptive geometry with traditional methods while students in the Experimental
group were taught the same content using the DeidricAR.
The spatial skills of students in both the groups were evaluated to learn that the
outcome of students in the Experimental group was better than those in the Control group,
as the average of marks obtained by students in the Experimental group was 17.5% higher
than the Control group. The observation was that the time needed to resolve the exercise
was 8.1% reduced by students in the Experimental group. DeidricAR gives the chance of
interacting with the three-dimensional models using virtual buttons which the authors
consider as one of the main reasons for the participants to acquire spatial perception skills.
Authors also consider that the tablets and mobile devices have a potential to go global
which helps this application to be used widely. Considering these results, Eduardo and
Hornero (2016), the authors claim that using DeidricAR helps the students to have a
positive impact on their spatial skills.
6
Figure 4: Final Solution for the problem stated in Figure 3 (de Ravé, Jiménez-
Hornero, Ariza-Villaverde & Taguas-Ruiz, 2016)
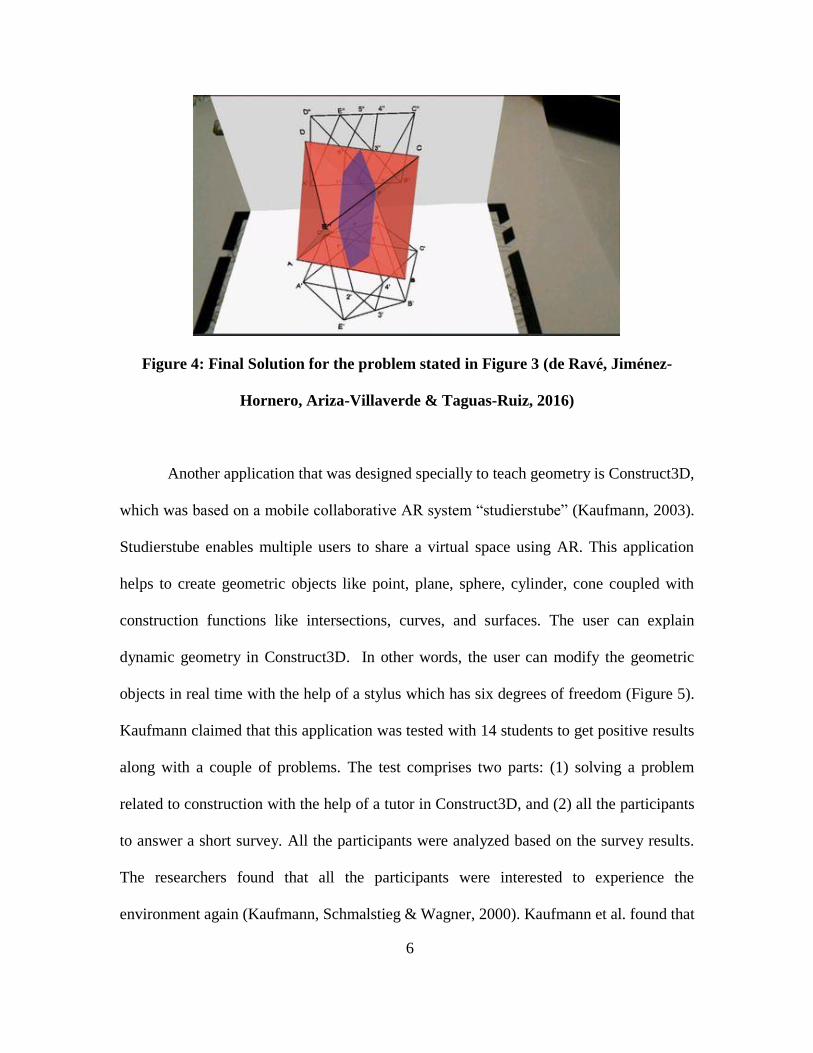
Another application that was designed specially to teach geometry is Construct3D,
which was based on a mobile collaborative AR system “studierstube” (Kaufmann, 2003).
Studierstube enables multiple users to share a virtual space using AR. This application
helps to create geometric objects like point, plane, sphere, cylinder, cone coupled with
construction functions like intersections, curves, and surfaces. The user can explain
dynamic geometry in Construct3D. In other words, the user can modify the geometric
objects in real time with the help of a stylus which has six degrees of freedom (Figure 5).
Kaufmann claimed that this application was tested with 14 students to get positive results
along with a couple of problems. The test comprises two parts: (1) solving a problem
related to construction with the help of a tutor in Construct3D, and (2) all the participants
to answer a short survey. All the participants were analyzed based on the survey results.
The researchers found that all the participants were interested to experience the
environment again (Kaufmann, Schmalstieg & Wagner, 2000). Kaufmann et al. found that
7
interacting with three-dimensional objects increased the understanding and learning curve
of the student because of working with this application.
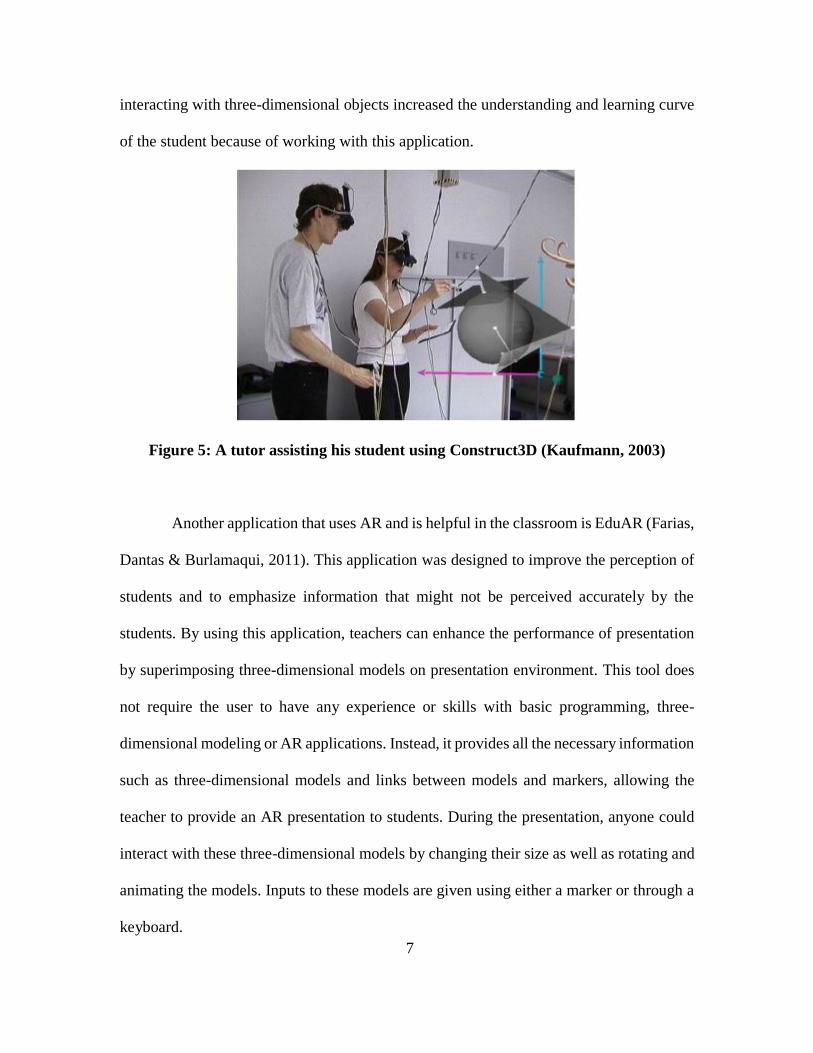
Figure 5: A tutor assisting his student using Construct3D (Kaufmann, 2003)
Another application that uses AR and is helpful in the classroom is EduAR (Farias,
Dantas & Burlamaqui, 2011). This application was designed to improve the perception of
students and to emphasize information that might not be perceived accurately by the
students. By using this application, teachers can enhance the performance of presentation
by superimposing three-dimensional models on presentation environment. This tool does
not require the user to have any experience or skills with basic programming, three-
dimensional modeling or AR applications. Instead, it provides all the necessary information
such as three-dimensional models and links between models and markers, allowing the
teacher to provide an AR presentation to students. During the presentation, anyone could
interact with these three-dimensional models by changing their size as well as rotating and
animating the models. Inputs to these models are given using either a marker or through a
keyboard.
8
Farias, Dantas and Burlamaqui (2011) conducted a study to evaluate the
application. A group of twenty people with no prior knowledge about EducAR were used
to test it. Twenty participants were taken for the experiment and were given the same set
of instructions. A laboratory without EducAR was the venue for the experiment. The
experiment needed twenty computers which did not have EducAR installed and ten
computers with Linux(Ubuntu) installed in it, and ten computers with Windows Vista
installed in it. The goal of the experiment was to find the percentage of people that could
follow a set of software installation instructions with and without help. The instruction set
had 11 instructions and the authors claim that everyone without help achieved one to four
instructions. Sixty percent of people reached step five without help. Twenty percent of
individuals could not reach step six because of no JAVA runtime installed previously.
Seventy percent reached step seven, and ninety percent reached step eight. Also, everyone
reached steps nine and ten (Farias, Dantas & Burlamaqui, 2011). The authors just chose
the ability to complete the set of instructions as a variable to measure.
There are several examples of tools and studies to evaluate conducted by scientists
in the field of education. The main goal of these experiments was to incorporate AR into
an educational task to help students understand and learn better. While there is a modest
amount of research involving AR in eBooks, this research is primarily helpful for those
readers who could wear a device around their ocular region or can afford a computer. But
these devices are costly and not every person can afford them. The present study is
motivated by the idea of exploring how AR can be used in conjunction with eBooks but
with minimal cost to the readers. For instance, we recently experienced a phenomenon
where a gaming application named PokemonGo acquired immense public attention and
9
interest. In this application, AR was used to display the pokemons in real world. The
application was free and could be played virtually on any smartphone might account for
why this application enjoyed widespread acceptance. This aligns with this study’s goal to
build an education-friendly AR application that helps students to learn better while not
imposing any additional hardware requirement. This thesis explores how AR in eBooks
may help students learn better.
Research using immersive environments in education is increasing rapidly
(Kaufmann, 2003) and this study marks another step towards the goal of using AR in
education. Increased student participation in class, making the students excited to learn
new concepts, helping them retain more information, making them visualize while
learning, increased usage of visual and audio sensors are certain noticeable advantages of
incorporating AR in education ("8 Benefits of using augmented reality in education",
2017). Owing to these advantages AR is chosen for usage in this study.
The present study was designed to compare how students learn from two types of
visual representations in eBooks: AR (where the participant must place the device over a
marker to see the model) and three-dimensional (where the participant views the model as
he clicks on the image). Fifty students were randomly assigned in equal numbers to one of
two conditions. They were asked to study an eBook embedded with either AR or three-
dimensional visual representations. While studying, the participants wore sensors like an
ABM X10 EEG headset and Tobii Glasses Pro2. The ABM Headset collected information
related to the workload, distraction, drowsiness and engagement levels which the brain of
the participant is experiencing. The Tobii Glasses captured the fixation points at which the
participant gazes to know more about the visual attention of the participant. Once the
10
participants completed the eBook, they were given a Post-Test and User Experience
Questionnaire to test the knowledge retained by each participant and their feedback
towards each environment.
Reading patterns from both the groups was used to tell which stimulus has an
impact on the participants. The experimental procedure began with a Demographic
Questionnaire, followed by stimulus and concluding with a Post-Test and a User
Experience Questionnaire is chosen. A series of individual sample t-tests was used to
analyze differences between Control and Treatment groups on the study’s dependent
measures. The Demographic Questionnaire was used to gather information about the
participants. Post-Test was used to determine how much information the participants had
inferred during the experiment. Variables like learning, visual attention, engagement,
distraction, and workload were collected to determine if there were differences between
the two conditions. The Treatment group was provided an eBook with AR models while
the Control group was given an eBook with three-dimensional models.
11
CHAPTER 2
METHOD
Participants and Design
Fifty students participated in this study including 38 males and 12 females. All the
participants were English-speaking students. The age of the participants was between
eighteen and twenty-five. The 50 participants were equally distributed between Treatment
and Control groups (n = 25). Around 94% participants were enrolled full time at ASU with
44% having a Master’s degree, 20% having a bachelor’s degree and 36% completed high
school. Two-thirds (68%) of the participants had not used an AR-based application before.
When the participants were asked about their familiarity with dinosaurs on a scale of one
to five, around 6% have rated 1, 42% have rated 2, 38% rated 3, 14% have rated 4 (one
being low and five being high amount of knowledge).
This study involved one independent variable with two levels. The participants
were randomly assigned to AR visuals (Treatment group) and three-dimensional visuals
(Control group) with equal numbers in each condition (n = 25).
Learning Environments
For this project, Unity was used to create an eBook that could deliver both AR
visuals and standard three-dimensional visuals. Unity is a game engine used to build games,
but with the wide popularity it has and its ability to develop games with ease, there are
modern software development kits like Vuforia which help the Unity developers to create
new applications with AR built into the application. An AR-eBook is not much different
12
from regular eBooks, which are in the market currently. An AR-eBook has AR infused into
a regular eBook. The user switches to an AR scene where the reader interacts with all the
models related to the context. This transition to the new scene might help the readers get
to know more about the topic and help them understand and comprehend the details better,
which is the hypothesis that is under verification in this study.
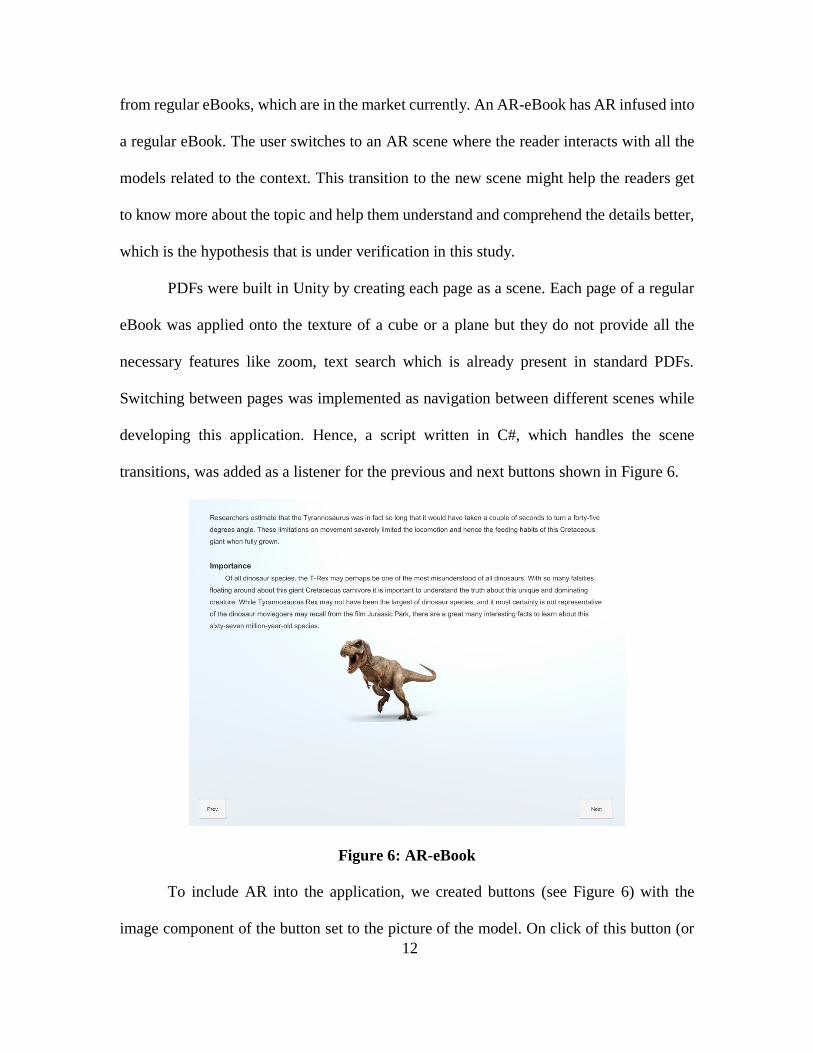
PDFs were built in Unity by creating each page as a scene. Each page of a regular
eBook was applied onto the texture of a cube or a plane but they do not provide all the
necessary features like zoom, text search which is already present in standard PDFs.
Switching between pages was implemented as navigation between different scenes while
developing this application. Hence, a script written in C#, which handles the scene
transitions, was added as a listener for the previous and next buttons shown in Figure 6.
Figure 6: AR-eBook
To include AR into the application, we created buttons (see Figure 6) with the
image component of the button set to the picture of the model. On click of this button (or
13
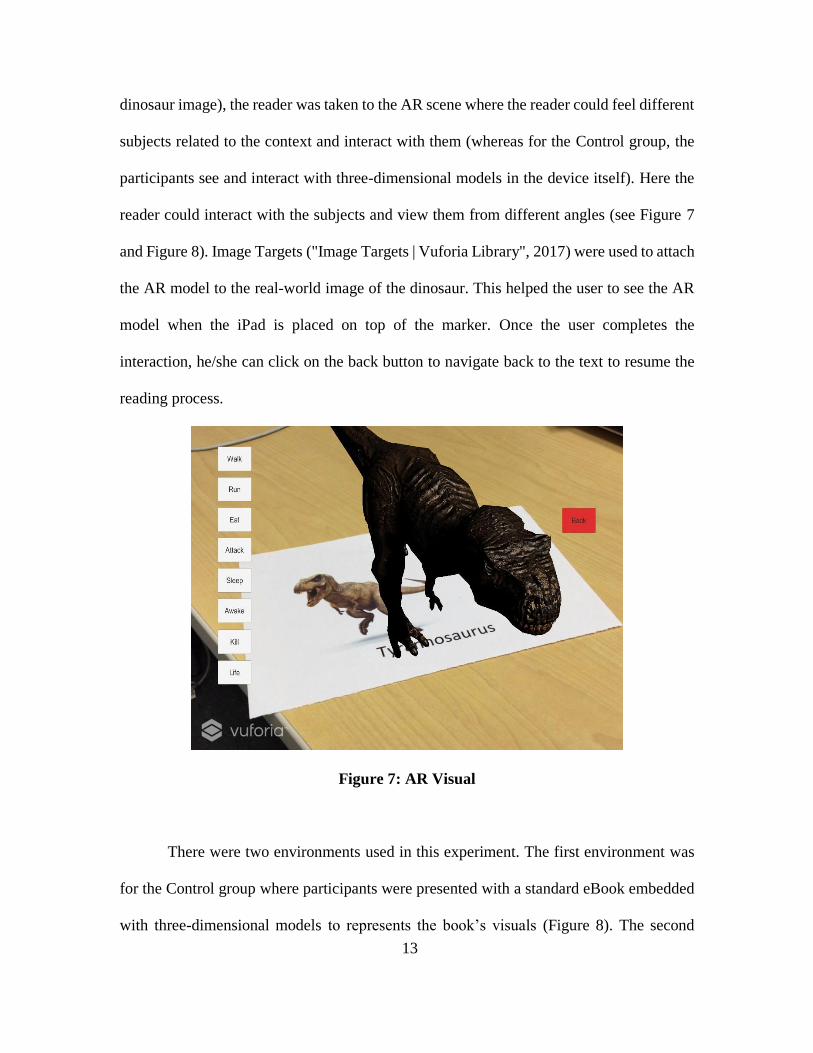
dinosaur image), the reader was taken to the AR scene where the reader could feel different
subjects related to the context and interact with them (whereas for the Control group, the
participants see and interact with three-dimensional models in the device itself). Here the
reader could interact with the subjects and view them from different angles (see Figure 7
and Figure 8). Image Targets ("Image Targets | Vuforia Library", 2017) were used to attach
the AR model to the real-world image of the dinosaur. This helped the user to see the AR
model when the iPad is placed on top of the marker. Once the user completes the
interaction, he/she can click on the back button to navigate back to the text to resume the
reading process.
Figure 7: AR Visual
There were two environments used in this experiment. The first environment was
for the Control group where participants were presented with a standard eBook embedded
with three-dimensional models to represents the book’s visuals (Figure 8). The second
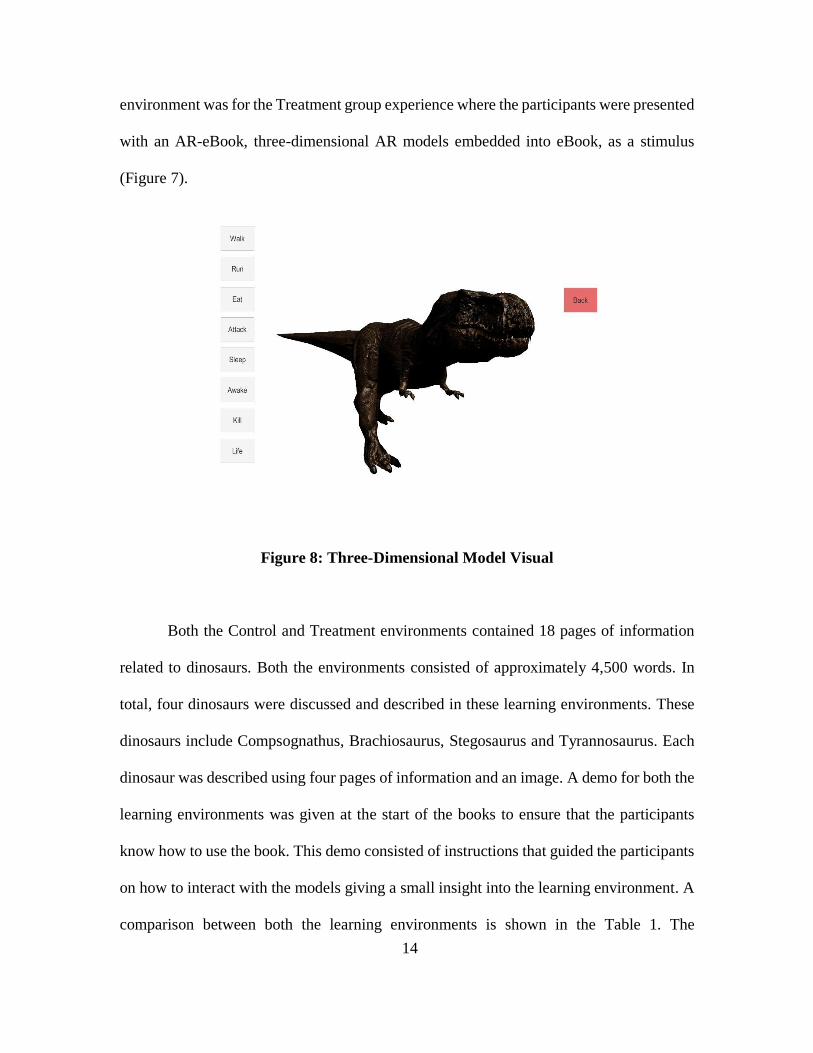
14
environment was for the Treatment group experience where the participants were presented
with an AR-eBook, three-dimensional AR models embedded into eBook, as a stimulus
(Figure 7).
Figure 8: Three-Dimensional Model Visual
Both the Control and Treatment environments contained 18 pages of information
related to dinosaurs. Both the environments consisted of approximately 4,500 words. In
total, four dinosaurs were discussed and described in these learning environments. These
dinosaurs include Compsognathus, Brachiosaurus, Stegosaurus and Tyrannosaurus. Each
dinosaur was described using four pages of information and an image. A demo for both the
learning environments was given at the start of the books to ensure that the participants
know how to use the book. This demo consisted of instructions that guided the participants
on how to interact with the models giving a small insight into the learning environment. A
comparison between both the learning environments is shown in the Table 1. The
15
information required to describe the dinosaurs was collected from several websites
("Brachiosaurus", 2017; "Compsognathus", 2017; "Compsognathus | Extinct Animals",
2017; "Jurassic World", 2017; News & DinoPit, 2017; "Stegosaurus", 2017; "Tiger PNG
images", 2017; "Tyrannosaurus", 2017; "Tyrannosaurus rex", 2017).
Stimulus for Treatment
Group
Stimulus for Control group
Number of pages in eBook 16 16
Number of dinosaurs
described
4 4
Images per dinosaur 1 1
Models embedded AR Three-dimensional
Table 1: Comparison between stimuli
Instruments and Apparatus
During the experiment, the participants were subject to the capture of a few values.
This study focused on comparing the reading patterns of people when they read and interact
with two types of visual representations presented in an eBook. The study also aimed to
find if AR-eBooks were helpful for readers to understand and comprehend information
easily by using AR in eBooks. To shed light on this issue, this study captured variables like
cognitive load, distraction, drowsiness, engagement, and visual attention. The reading
patterns were analyzed to infer the impact that different types of three-dimensional models
have on readers.
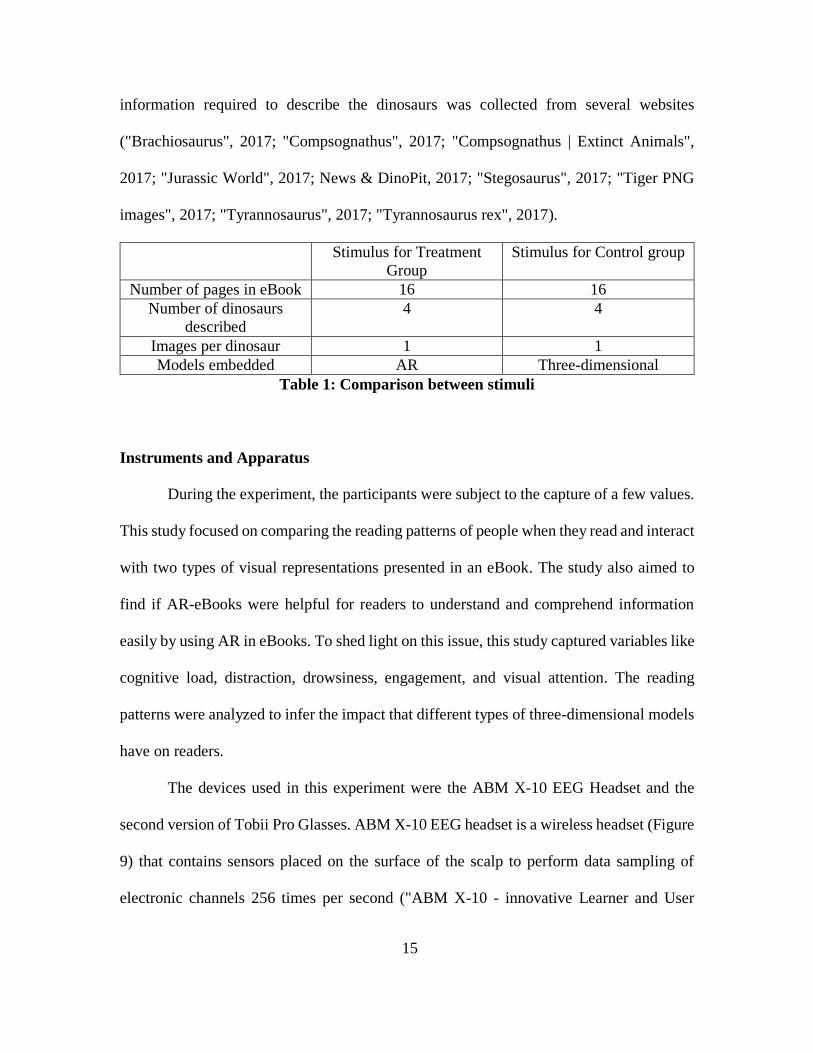
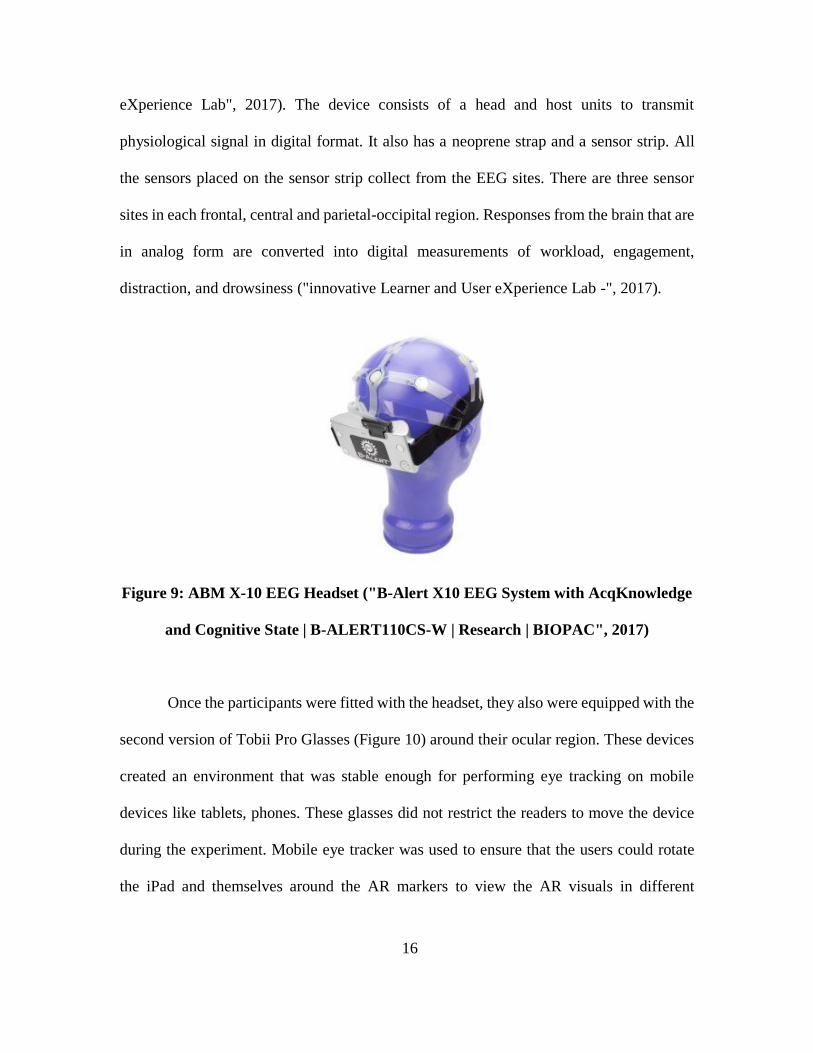
The devices used in this experiment were the ABM X-10 EEG Headset and the
second version of Tobii Pro Glasses. ABM X-10 EEG headset is a wireless headset (Figure
9) that contains sensors placed on the surface of the scalp to perform data sampling of
electronic channels 256 times per second ("ABM X-10 - innovative Learner and User
16
eXperience Lab", 2017). The device consists of a head and host units to transmit
physiological signal in digital format. It also has a neoprene strap and a sensor strip. All
the sensors placed on the sensor strip collect from the EEG sites. There are three sensor
sites in each frontal, central and parietal-occipital region. Responses from the brain that are
in analog form are converted into digital measurements of workload, engagement,
distraction, and drowsiness ("innovative Learner and User eXperience Lab -", 2017).
Figure 9: ABM X-10 EEG Headset ("B-Alert X10 EEG System with AcqKnowledge
and Cognitive State | B-ALERT110CS-W | Research | BIOPAC", 2017)
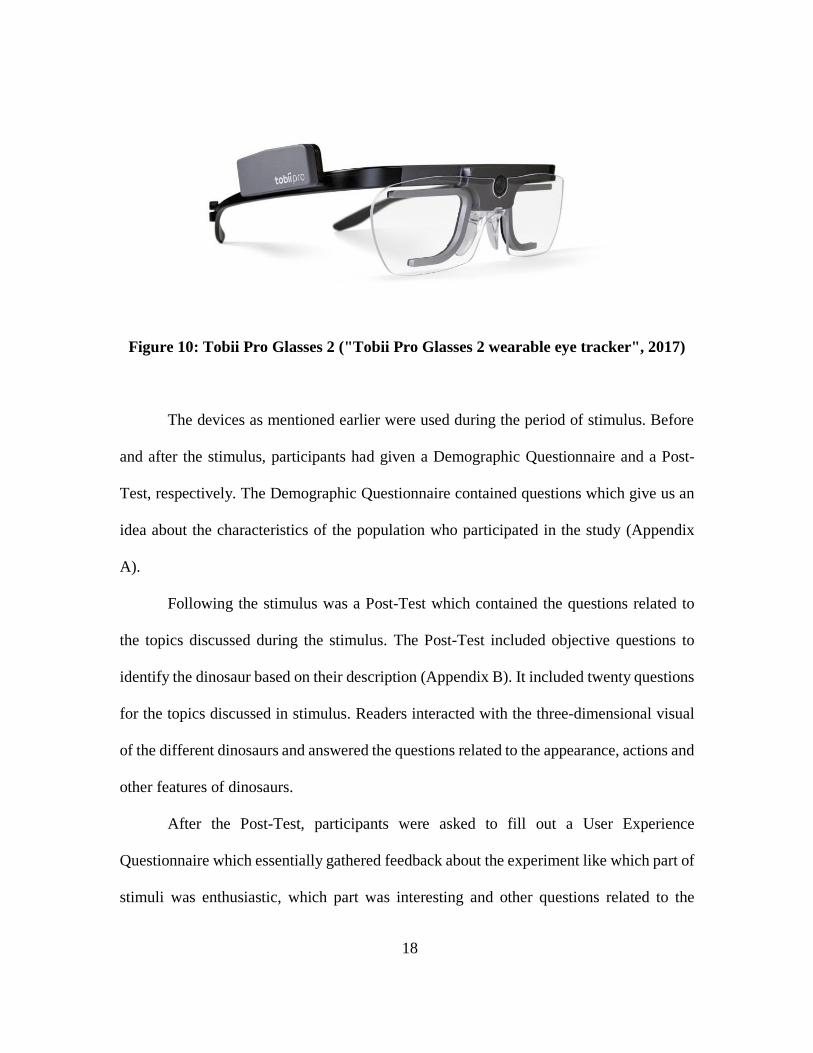
Once the participants were fitted with the headset, they also were equipped with the
second version of Tobii Pro Glasses (Figure 10) around their ocular region. These devices
created an environment that was stable enough for performing eye tracking on mobile
devices like tablets, phones. These glasses did not restrict the readers to move the device
during the experiment. Mobile eye tracker was used to ensure that the users could rotate
the iPad and themselves around the AR markers to view the AR visuals in different

17
directions. The mobile eye trackers also helped the users to move at their free will without
any restriction.
There were two infrared cameras to capture the eye movement, record gaze points
and get to know how long the reader gazes at a location. The iMotions software to which
the device was connected could also create heat maps that contain information about the
focus levels and focus areas of the reader. These glasses measured the variables like Time
to First Fixation (TTFF), fixation count, total time spent in an area of interest which are
required for the study to know more about which part of the content is pleasing for the
readers.
Both the learning environments were developed for iPad. iPads were chosen for
this study as they are less expensive compared to most laptop or desktop computers
(Johnson, 2017) and they are ideally situated to include the AR technology to educate the
users. Many schools and educators believed that iPads and tablets play a vital role in the
education sector. Using iPads helps the students to save paper, carry less physical load,
learn through multimedia objects and receive a personalized learning (Networks, 2017).
These advantages strengthened the idea to use iPads for research in education as well as in
this study.
18
Figure 10: Tobii Pro Glasses 2 ("Tobii Pro Glasses 2 wearable eye tracker", 2017)
The devices as mentioned earlier were used during the period of stimulus. Before
and after the stimulus, participants had given a Demographic Questionnaire and a Post-
Test, respectively. The Demographic Questionnaire contained questions which give us an
idea about the characteristics of the population who participated in the study (Appendix
A).
Following the stimulus was a Post-Test which contained the questions related to
the topics discussed during the stimulus. The Post-Test included objective questions to
identify the dinosaur based on their description (Appendix B). It included twenty questions
for the topics discussed in stimulus. Readers interacted with the three-dimensional visual
of the different dinosaurs and answered the questions related to the appearance, actions and
other features of dinosaurs.
After the Post-Test, participants were asked to fill out a User Experience
Questionnaire which essentially gathered feedback about the experiment like which part of
stimuli was enthusiastic, which part was interesting and other questions related to the
19
experiment. This survey consisted of ten questions, and it took no more than five minutes.
Appendix C contains the questionnaire.
Scoring
There were three questionnaires in this experiment. Participants answered the
Demographic Questionnaire before starting the experiment to help the researcher gain
knowledge about the population participating in the study. The Demographic
Questionnaire took no more than ten minutes to complete. Samples questions for the
Demographic questionnaire are available in Appendix A.
Participants answered two more questionnaires after the completion of the
experiment. First one is called Post-Test that, as previously noted, tested the knowledge
gained and comprehended by participants during the stimulus. Post-Test took no more than
fifteen minutes to complete. This test had 20 questions on the topics discussed during
stimulus with each question carrying one mark. The marks scored by each participant in
Post-Test is used for analyzing the learning variable. You can see sample questions for the
Demographic Questionnaire in Appendix A.
After the Post-Test, subjects were asked to answer User Experience Questionnaire
which consists of ten questions with each question having options “Strongly Disagree,”
“Disagree,” “Neutral,” “Agree,” “Strongly Agree.” The weight of these choices varies from
“Strongly Disagree” carrying one point to “Strongly Agree” taking five points. These
questions asked the subjects how they were feeling about the experiment and application.
Sample questions for User Experience Questionnaire are available in Appendix A.
20
The EEG headset continuously collected information about cognitive load,
attention levels, drowsiness levels and the amount of time the reader was engaged in the
stimuli. The values for distraction, engagement, drowsiness and workload variables vary
between zero and one. The eye tracking glasses measure the variables like Time to First
Fixation (TTFF), fixation count, total time spent in an area of interest which are required
for the study to know more about which part of the content attracted the visual attention of
the readers. Focus areas are conveyed through heat maps with colors varying from light
green (slightly viewed area) to red (highly viewed area).
Procedure
The process of the experiment was as follows. The experiment started with the
participants being informed about the aim and process of experiment and they were asked
to answer a Demographic Questionnaire initially to know more about the participants in
the study. The stimulus contained four topics on dinosaurs for readers.
Once the Demographic Questionnaire was completed, then readers were given the
stimuli. All the readers were made to wear ABM X-10 EEG headset and the eye tracking
device. Following the stimulus was a Post-Test which decides how much information a
participant had gained and comprehended.
This was the process followed by every reader. The estimated time for the
Demographic Questionnaire was around ten minutes, followed by 30 minutes of interaction
with the stimulus then 15 minutes to complete the posttest. This entire process was
conducted for both groups. As previously mentioned, one group was named as Control
group with the stimulus as regular eBooks with three-dimensional visual representations
21
and the second group was named as Treatment group with the stimulus as the AR-eBooks.
Each group contained twenty-five participants.
Both the groups were treated with the appropriate stimulus. Results included all the
variables like learning, how much the subject was engaged, the distraction levels of the
subject, how much cognitive load the subject was experiencing and eye movements were
captured. The variables from both the groups were compared and analyzed using
Independent Samples t-test to understand more about the reading patterns in people. This
was done to which learning environment helped the readers to infer and comprehend
knowledge most effectively.
22
CHAPTER 3
RESULTS
The results obtained from both Control and Treatment groups were analyzed using
Independent Samples t-test. An Independent Samples t-test is a statistical test which gives
a good measure of how two independent groups differ by comparing their means. This t-
test from the t-test family is used to compare the Treatment and Control groups in different
aspects. The information is collected from the participants using a brain monitoring
headset, an eye tracker and questionnaires. Both the Treatment and Control groups are
analyzed and compared using variables like visual attention, amount of learning and
different emotions sensed by brain while reading the eBook.
Every second data was sampled multiple times by the physiological devices.
Though the participants have been wearing these devices throughout the experiment, only
the data collected when the participants read the eBook and interacted with the models was
taken into consideration. An average of the data when the participant interacted with the
model and read the eBook was calculated separately to analyze the readings sensed by the
ABM headset.
Markers were applied to the data obtained from an ABM headset to extract the data
when participants interacted with the visuals and when they read the text. Once applied,
the data was exported to excel sheets and filtered using the markers for the appropriate
information. In case of Tobii Glasses, area of interest was defined as the screen of iPad to
analyze the eye movements. Data related to dependent measures like TTFF, fixations count
and the total time spent when the participants interacted with the models were captured
23
using the area of interests. Data related to visual attention, engagement, distraction,
drowsiness and workload were extracted from the information collected using brain
monitoring headset and the eye tracker. Data related to the participants’ interest, biography
and the amount of knowledge they gained was obtained from the user experience,
demographic and Post-Test questionnaires respectively.
A total of 50 students participated in the study that includes 38 males and 12
females. These participants are equally distributed between Treatment and Control groups.
All the participants fall between 20 and 25 years of age. Around 94% of participants are
enrolled full time at ASU with 44% having a Master’s degree, 20% having a bachelor’s
degree and 36% completed high school. Two-thirds (68%) of all the participants noted that
they had not used an AR based application previously. When these students were asked
about their familiarity with dinosaurs on a scale of one (lowest) to five (highest), about 6%
rated 1, 42% have rated 2, 38% rated 3, 14% have rated 4.
Information collected from all these participants was used to analyze the differences
in the ways college going students interact with eBooks containing AR and 3D models. Let
us discuss about how the data is analyzed in terms of all the dependent variables.
Comparison between Groups
Treatment and Control groups were compared based on the values obtained for
workload, distraction, drowsiness, engagement, fixations, marks, total time, user
experience, time taken for the first fixation to occur and the relative time spent on visuals.
An Independent Samples t-test was performed on the data for each variable.
24
ABM Sensor Data
An average for the data related to each of the variables mentioned above was
calculated. This computation was performed for each participant from both the groups. As
one can see in the Figure 11, an Independent Samples t-test was performed on the data
related to high and low engagement, distraction, workload and drowsy. For each
participant, an average of the ABM data was computed for each variable to create a list of
means for both Control and Treatment groups. The t-test was then performed on this list to
get the above result.
The Control group (n = 25) was associated with a high engagement value M = 0.46
(SD = 0.23), distraction value M = 0.5 (SD = 0.82), drowsiness value M = 0.17(SD = 0.22)
and workload value M = 0.71 (SD = 0.1). By comparison, the Treatment group (n = 25)
was associated with a numerically larger high engagement value M = 0.5 (SD = 0.19),
larger distraction value M = 0.6 (SD = 0.1), larger drowsiness value M = 0.04 (SD = 0.06)
and larger workload value M = 0.72 (SD = 0.13). To check the hypothesis that Control and
Treatment groups were associated with statistically significantly different high
engagement, distraction, drowsiness and workload values, an Independent Samples t-test
was performed.
25
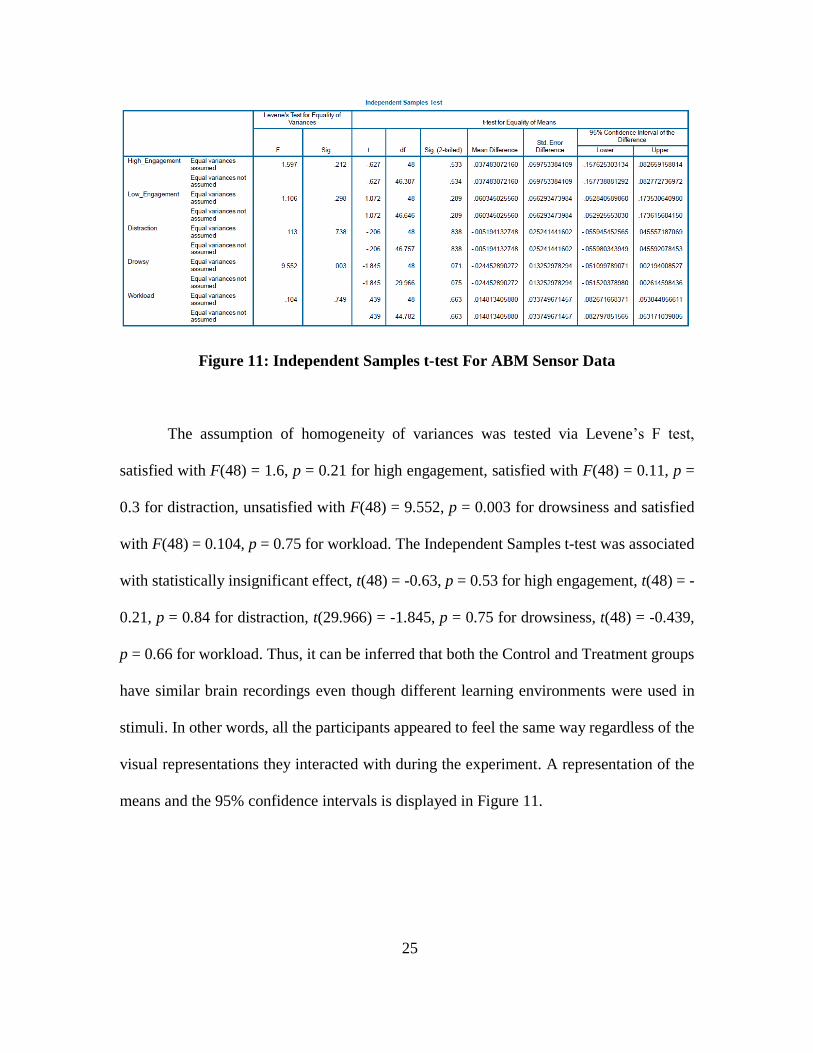
Figure 11: Independent Samples t-test For ABM Sensor Data
The assumption of homogeneity of variances was tested via Levene’s F test,
satisfied with F(48) = 1.6, p = 0.21 for high engagement, satisfied with F(48) = 0.11, p =
0.3 for distraction, unsatisfied with F(48) = 9.552, p = 0.003 for drowsiness and satisfied
with F(48) = 0.104, p = 0.75 for workload. The Independent Samples t-test was associated
with statistically insignificant effect, t(48) = -0.63, p = 0.53 for high engagement, t(48) = -
0.21, p = 0.84 for distraction, t(29.966) = -1.845, p = 0.75 for drowsiness, t(48) = -0.439,
p = 0.66 for workload. Thus, it can be inferred that both the Control and Treatment groups
have similar brain recordings even though different learning environments were used in
stimuli. In other words, all the participants appeared to feel the same way regardless of the
visual representations they interacted with during the experiment. A representation of the
means and the 95% confidence intervals is displayed in Figure 11.
26
Learning
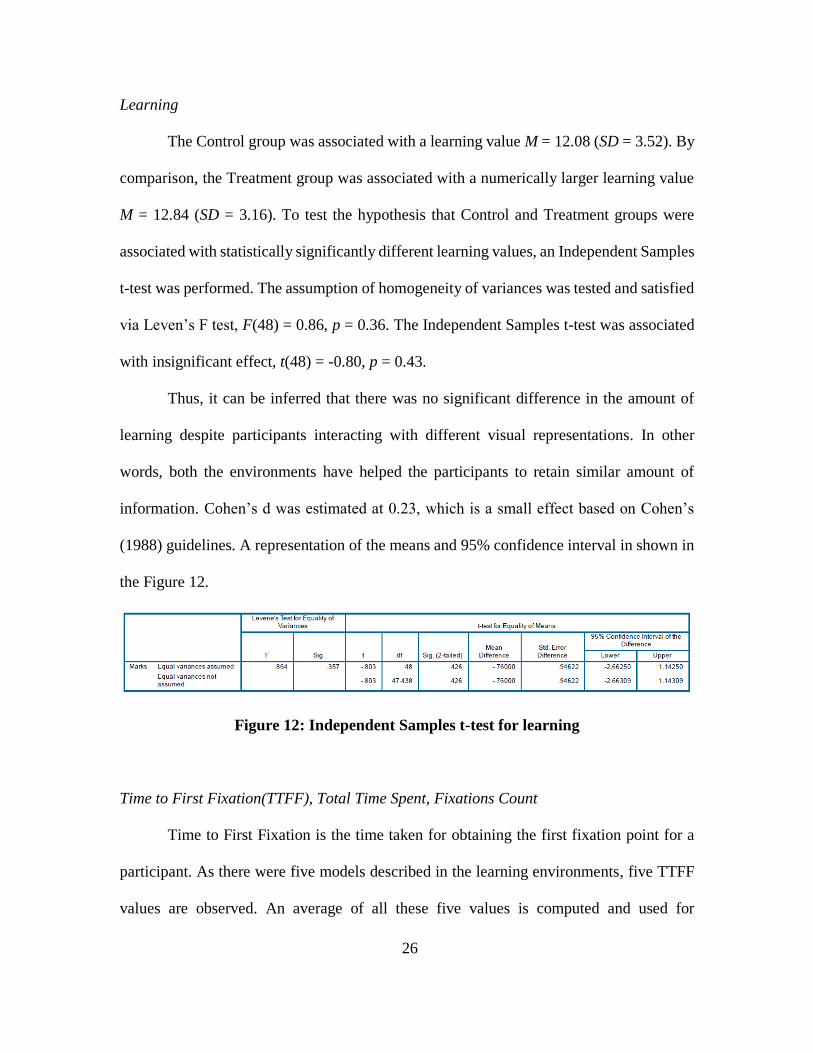
The Control group was associated with a learning value M = 12.08 (SD = 3.52). By
comparison, the Treatment group was associated with a numerically larger learning value
M = 12.84 (SD = 3.16). To test the hypothesis that Control and Treatment groups were
associated with statistically significantly different learning values, an Independent Samples
t-test was performed. The assumption of homogeneity of variances was tested and satisfied
via Leven’s F test, F(48) = 0.86, p = 0.36. The Independent Samples t-test was associated
with insignificant effect, t(48) = -0.80, p = 0.43.
Thus, it can be inferred that there was no significant difference in the amount of
learning despite participants interacting with different visual representations. In other
words, both the environments have helped the participants to retain similar amount of
information. Cohen’s d was estimated at 0.23, which is a small effect based on Cohen’s
(1988) guidelines. A representation of the means and 95% confidence interval in shown in
the Figure 12.
Figure 12: Independent Samples t-test for learning
Time to First Fixation(TTFF), Total Time Spent, Fixations Count
Time to First Fixation is the time taken for obtaining the first fixation point for a
participant. As there were five models described in the learning environments, five TTFF
values are observed. An average of all these five values is computed and used for
27
comparison. Total Time Spent was the amount of time spent by each participant interacting
with the visuals and fixations count is the number of fixation point obtained for each
participant during the interaction with visuals. A fixation point is obtained when a
considerable number of gaze points are obtained around an object or in an area. Fixation
point is a measure of visual attention. Both the Control and Treatment groups were
compared used these variables.
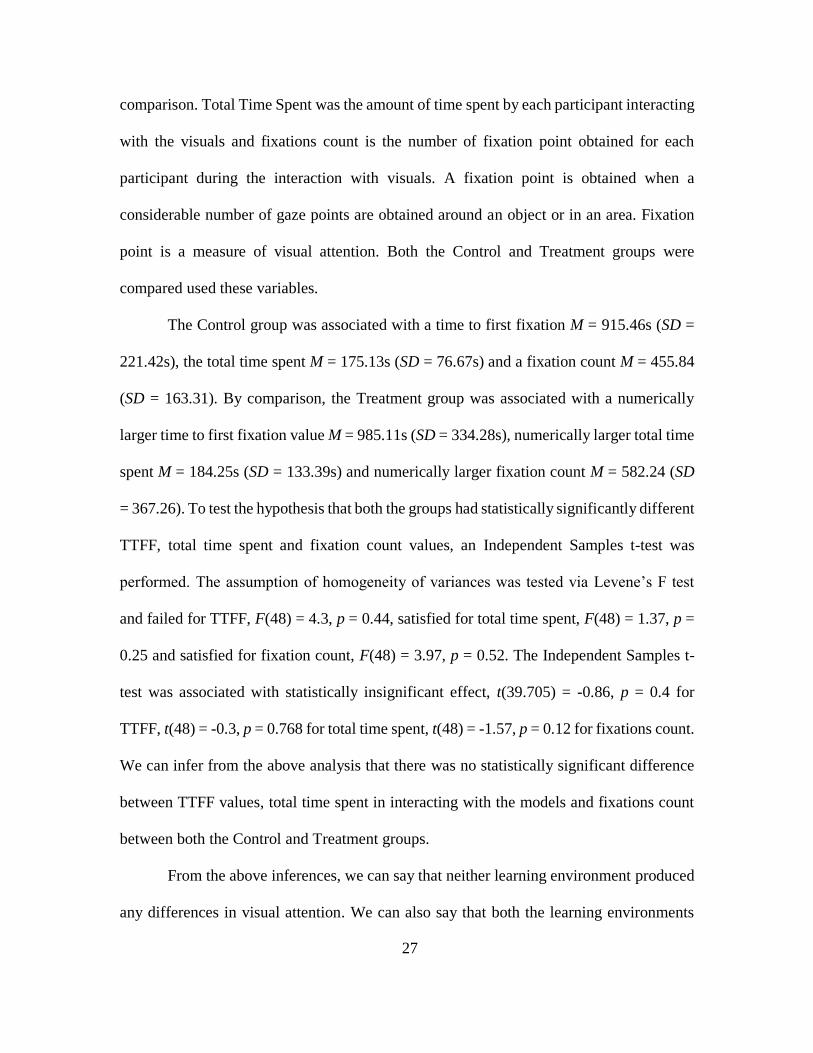
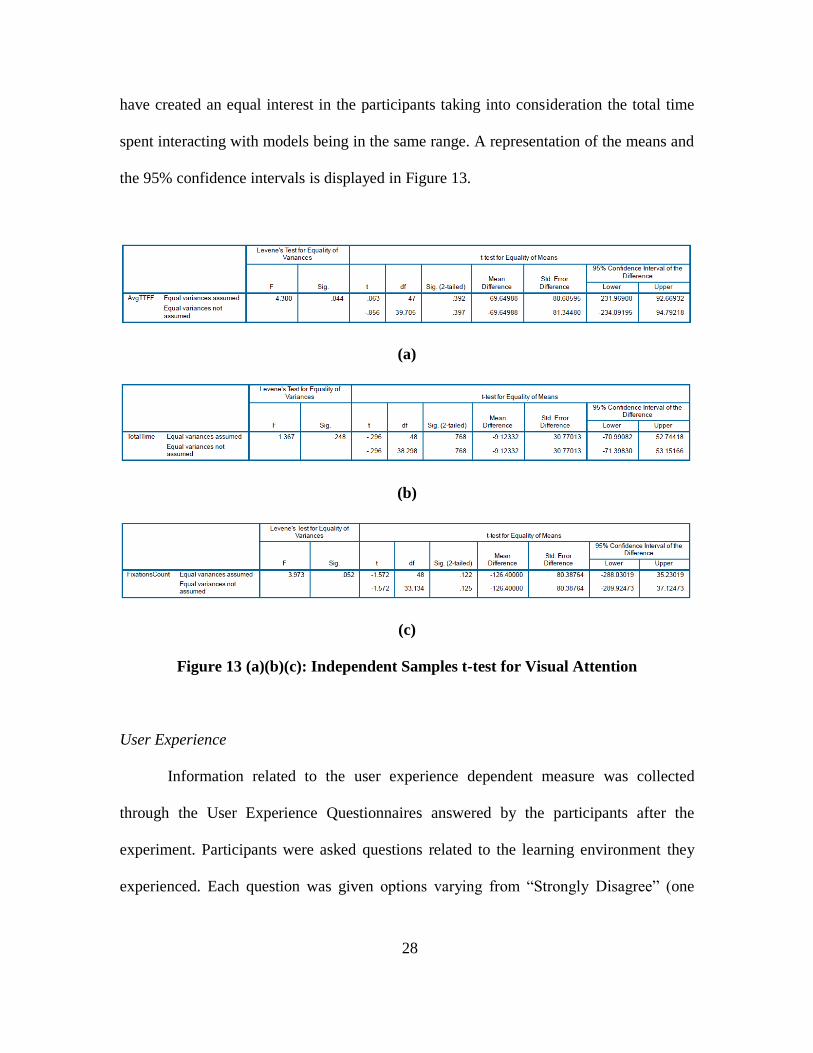
The Control group was associated with a time to first fixation M = 915.46s (SD =
221.42s), the total time spent M = 175.13s (SD = 76.67s) and a fixation count M = 455.84
(SD = 163.31). By comparison, the Treatment group was associated with a numerically
larger time to first fixation value M = 985.11s (SD = 334.28s), numerically larger total time
spent M = 184.25s (SD = 133.39s) and numerically larger fixation count M = 582.24 (SD
= 367.26). To test the hypothesis that both the groups had statistically significantly different
TTFF, total time spent and fixation count values, an Independent Samples t-test was
performed. The assumption of homogeneity of variances was tested via Levene’s F test
and failed for TTFF, F(48) = 4.3, p = 0.44, satisfied for total time spent, F(48) = 1.37, p =
0.25 and satisfied for fixation count, F(48) = 3.97, p = 0.52. The Independent Samples t-
test was associated with statistically insignificant effect, t(39.705) = -0.86, p = 0.4 for
TTFF, t(48) = -0.3, p = 0.768 for total time spent, t(48) = -1.57, p = 0.12 for fixations count.
We can infer from the above analysis that there was no statistically significant difference
between TTFF values, total time spent in interacting with the models and fixations count
between both the Control and Treatment groups.
From the above inferences, we can say that neither learning environment produced
any differences in visual attention. We can also say that both the learning environments
28
have created an equal interest in the participants taking into consideration the total time
spent interacting with models being in the same range. A representation of the means and
the 95% confidence intervals is displayed in Figure 13.
(a)
(b)
(c)
Figure 13 (a)(b)(c): Independent Samples t-test for Visual Attention
User Experience
Information related to the user experience dependent measure was collected
through the User Experience Questionnaires answered by the participants after the
experiment. Participants were asked questions related to the learning environment they
experienced. Each question was given options varying from “Strongly Disagree” (one

29
point) to “Strongly Agree” (five point). An average computed for all the questions
answered by each participant is used as the basis for this comparison.
The Control group was associated with a user experience rating M = 3.93 (SD =
0.59). By comparison, the Treatment group was associated with a numerically larger user
experience rating M = 4.01 (SD = 0.36). To confirm the hypothesis that participants from
Treatment group were associated with statistically significantly different user experience
ratings, an Independent Samples t-test was performed. The assumption of homogeneity of
variances was tested and satisfied via Leven’s F test, F(48) = 3.29, p = 0.08. The
Independent Samples t-test was associated with insignificant effect, t(48)= -0.62, p = 0.54.
Thus, it can be inferred that there was statistically no significant difference in the
user experience ratings because Control and Treatment participants. In other words,
participants from both the groups have same level of interest towards both the learning
environments. A representation of the means and 95% confidence interval in shown in the
Figure 14.
Figure 14: Independent Samples t-test for User Experience ratings
Relative Time Spent on Visuals
Each participant had spent a fraction of the experiment duration interacting with
visuals. Both the Control and Treatment groups were compared using this information to
know if there is any difference in the reading patterns.

30
The Control group was associated with a relative time spent M = 16.9s (SD = 5.08s).
By comparison, the Treatment group was associated with a numerically larger user
experience rating M = 17.49s (SD = 6.74s). To confirm the hypothesis that participants
from Treatment group were associated with statistically significantly different user
experience ratings, an Independent Samples t-test was performed. The assumption of
homogeneity of variances was tested and satisfied via Leven’s F test, F(48) = 3.18s, p =
0.08. The Independent Samples t-test was associated with insignificant effect, t(48)= -0.35,
p = 0.73.
From the above comparison, it can be inferred that all the participants from both
the groups spent relatively same amount of time on visuals. A representation of the means
and 95% confidence interval in shown in the Figure 15.
Figure 15: Independent Samples t-test for Relative Time Spent on Visuals
Comparison within Groups
The data from both the Control and Treatment groups is used to create an analysis
comparing the data obtained while reading and while interacting with the models. As
performed earlier for the above dependent measures, an Independent Samples t-test was
performed for comparison.
31
Reading v/s 3D Models
Data was initially segregated into two segments. One segment represents the
interaction of participants with the three-dimensional visuals and another segment
represents the values obtained when the participants read the text. An average of the data
related to engagement, distraction, drowsy and workload is computed for both the segments
for each participant which was used for the comparison.
The Control group while reading(N=25) was associated with a high engagement
value M = 0.47 (SD = 0.22), distraction value M = 0.53 (SD = 0.73), drowsy value M =
0.15 (SD = 0.22) and workload value M = 0.68 (SD = 0.11). By comparison, the Control
group’s interaction with the 3D models(N=25) was associated with a numerically smaller
high engagement value M = 0.46 (SD = 0.23), smaller distraction value M = 0.5 (SD =
0.82), larger drowsiness value M = 0.17 (SD = 0.22) and larger workload value M = 0.71
(SD = 0.1). To check the hypothesis that Control group participants, while reading and
interacting with the models, were associated with statistically significant differently high
engagement, distraction, drowsiness and workload values, an Independent Samples t-test
was performed. The assumption of homogeneity of variances was tested via Leven’s F test,
satisfied with F(48) = 0.09, p = 0.760 for high engagement, satisfied with F(48) = 0.14, p
= 0.71 for distraction, satisfied with F(48) = 0.008, p = 0.93 for drowsiness and satisfied
with F(48) = 0.07, p = 0.79 for workload. The Independent Samples t-test was associated
with statistically insignificant effects, t(48) = 0.126, p = 0.9 for high engagement, t(48) =
0.17, p = 0.87 for distraction, t(48) = -0.39, p = 0.7 for drowsiness, t(48) = -0.76, p = 0.45
for workload.
32
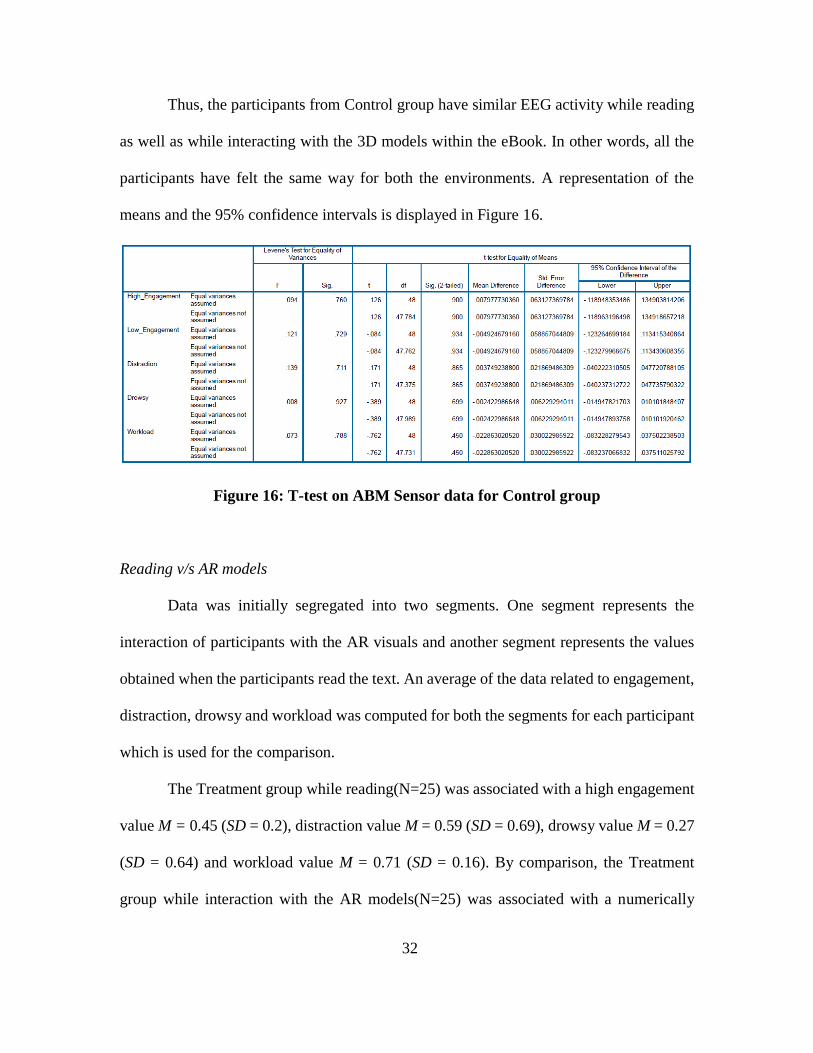
Thus, the participants from Control group have similar EEG activity while reading
as well as while interacting with the 3D models within the eBook. In other words, all the
participants have felt the same way for both the environments. A representation of the
means and the 95% confidence intervals is displayed in Figure 16.
Figure 16: T-test on ABM Sensor data for Control group
Reading v/s AR models
Data was initially segregated into two segments. One segment represents the
interaction of participants with the AR visuals and another segment represents the values
obtained when the participants read the text. An average of the data related to engagement,
distraction, drowsy and workload was computed for both the segments for each participant
which is used for the comparison.
The Treatment group while reading(N=25) was associated with a high engagement
value M = 0.45 (SD = 0.2), distraction value M = 0.59 (SD = 0.69), drowsy value M = 0.27
(SD = 0.64) and workload value M = 0.71 (SD = 0.16). By comparison, the Treatment
group while interaction with the AR models(N=25) was associated with a numerically
33
larger high engagement value M = 0.5 (SD = 0.19), smaller distraction value M = 0.55 (SD
= 0.96), larger drowsy value M = 0.42 (SD = 0.62) and larger workload value M = 0.72 (SD
= 0.13). To check the hypothesis that Treatment group participants, while reading and
interacting with the AR models, were associated with statistically significant differently
high engagement, distraction, drowsiness and workload values, an Independent Samples t-
test was performed. The assumption of homogeneity of variances was tested via Leven’s F
test, satisfied with F(48) = 0.23, p = 0.64 for high engagement, satisfied with F(48) = 0.18,
p = 0.67 for distraction, satisfied with F(48) = 0.62, p = 0.44 for drowsiness and satisfied
with F(48) = 0.26, p = 0.61 for workload. The Independent Samples t-test was associated
with statistically insignificant effect, t(48) = -0.88, p = 0.38 for high engagement, t(48) =
0.16, p = 0.87 for distraction, t(48) = -0.828, p = 0.41 for drowsiness, t(48) = -0.34, p =
0.74 for workload.
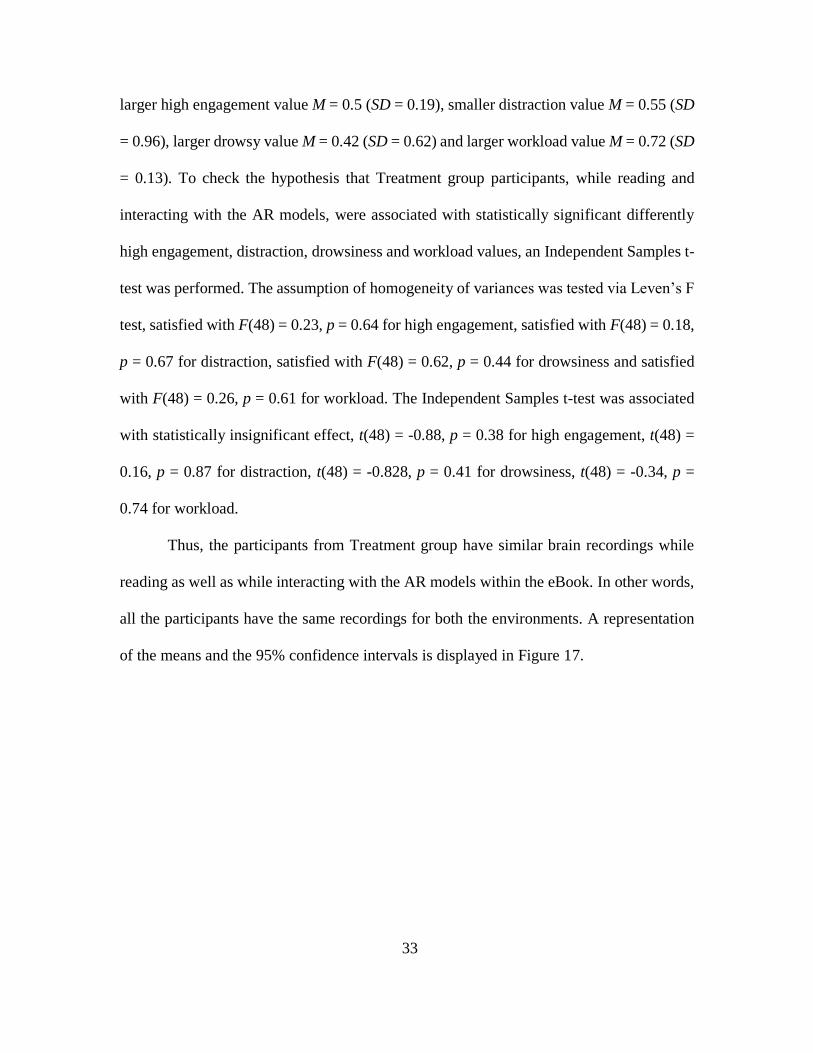
Thus, the participants from Treatment group have similar brain recordings while
reading as well as while interacting with the AR models within the eBook. In other words,
all the participants have the same recordings for both the environments. A representation
of the means and the 95% confidence intervals is displayed in Figure 17.
34
Figure 17: T-test on ABM Sensor data for Treatment Group
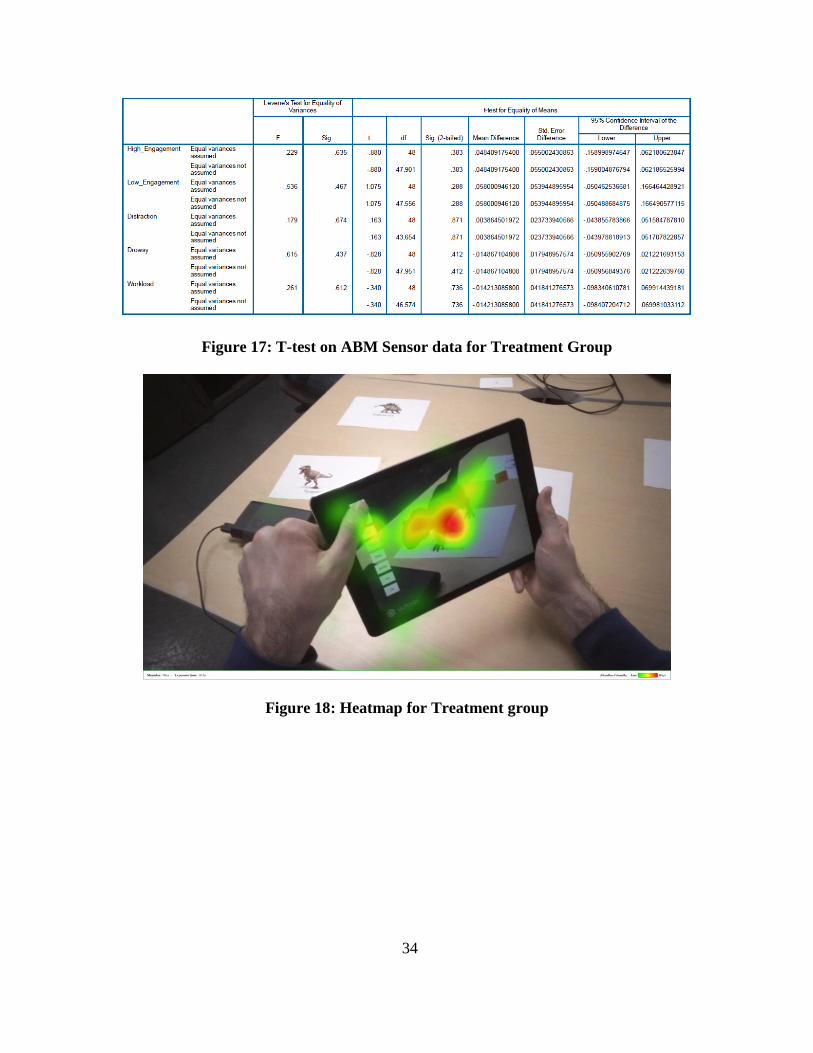
Figure 18: Heatmap for Treatment group

35
Figure 19: Heatmap for Control group
Figure 18 is a heatmap generated from the eye tracking data of three participants of
Treatment group. Figure 19 is a heatmap generated from the eye tracking data of three
participants of Treatment group. These heatmaps provide an idea about the areas where the
participants are looking. The areas are highlighted from light green to red which indicates
the participants’ interest varying from low to high respectively. It can be inferred that the
participants are more interested in looking at the body of the dinosaur.

36
CHAPTER 4
DISCUSSIONS AND CONCLUSION
A concerted effort to understand the reading patterns of people using different types
of interactive models within eBooks and to help them reduce their effort while reading
eBooks has been carried out in this thesis throughout the above-stated experiments. One
eBook embedded with AR visuals and another eBook embedded with three-dimensional
visuals were given as the stimulus to Treatment and Control groups respectively. The
applications were developed in Unity using Vuforia SDK for devices like iPad. The data
for the dependent measures like workload, learning, marks, distraction, drowsiness,
engagement, time for first fixation, fixation count, total time spent were used to compare
both the Control and Treatment groups.
The visual and brain sensor data were collected using Tobii Glasses Pro 2 and B-
Alert ABM X10 devices respectively. The learning and interest was measured using the
feedback given by the participants through questionnaires. An Independent Samples t-test
was performed on the data obtained from both the groups to compare them. The conclusion
that people received both the learning environments equally (eBooks with AR models and
three-dimensional models embedded) can be observed from the above experiments.
There are several limitations observed in this study. One of them is Cohen’s d
effect size estimate, calculated for the learning variable, was found to be small (0.22). An
effect size of 0.22 means the mean of the Treatment group is at 58th percentile of the Control
group. In other words, a small effect size value implies that the change is happening but to
observe it one needs to perform a study with a larger sample ("Effect sizes", 2017). A
37
Cohen’s d effect size of 0.8 is large which means the mean of Treatment group is at the
79th percentile of the Control group. In other words, the change can be observed with a
naked eye ("Effect Size (ES) - Effect Size Calculators (Lee Becker) | University of
Colorado Colorado Springs", 2017). To find the required sample size which gives a large
Cohen’s d estimate (0.8), a power analysis was conducted. By giving power, alpha, and
effect size for the power analysis, it was found that the study should require 35 participants
for each group to obtain a large Cohen’s d estimate. So, this inference is an important point
to remember to carry out this research in the future.
Users cannot load new models of their choice from the eBook simultaneously while
using it. We can enable the users to search online and load any interactive model of their
choice from within the eBook. This dynamic loading of models helps the users to test their
past knowledge and explore new domains. This study targeted only college students. So,
as an additional step, one could extend this study by including children in the experiments.
As of today, the existing marker based AR embedded into eBooks did not create
any significant difference in the way people comprehend and gain information compared
to either the three-dimensional models embedded into eBooks or the regular eBooks.
However, the future improvements in AR towards markerless AR, are guaranteed to bring
a noticeable difference in the way education is taught in classrooms. Marker based AR,
that were used in this study, limited the interactivity with objects and is restricted to the
border of the markers. To use these markers, they must be printed in advance and should
be preserved. Unlike the marker based AR, markerless AR uses any part of the real
environment surrounding the user as a target for object tracking and placement of virtual
objects which gives more sense of immergence to the users ("Markerless Augmented
38
Reality - ARLab Blog", 2017). With these advancements, we see today in AR, the future
markerless AR technology can perceive, track real objects and extract information from
the user surroundings to use the information later. This future AR technology, with a
plausible disadvantage of becoming complex, can be used in eBooks and this study can be
performed again for improved results.
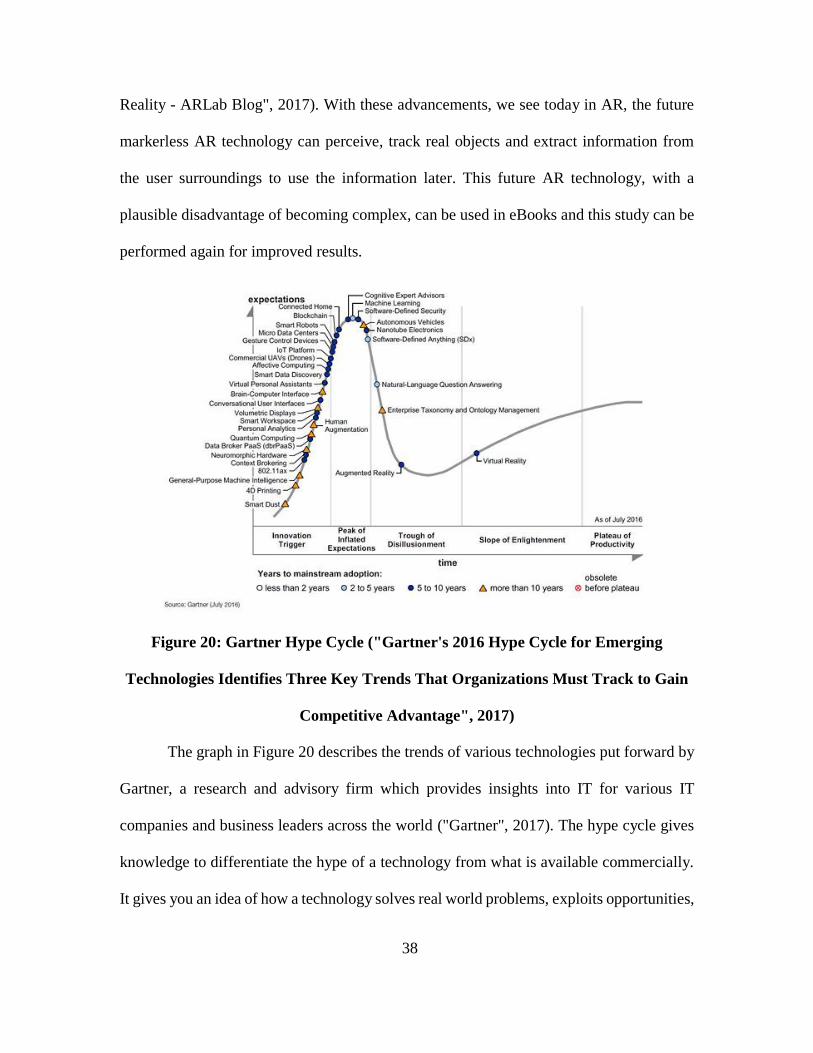
Figure 20: Gartner Hype Cycle ("Gartner's 2016 Hype Cycle for Emerging
Technologies Identifies Three Key Trends That Organizations Must Track to Gain
Competitive Advantage", 2017)
The graph in Figure 20 describes the trends of various technologies put forward by
Gartner, a research and advisory firm which provides insights into IT for various IT
companies and business leaders across the world ("Gartner", 2017). The hype cycle gives
knowledge to differentiate the hype of a technology from what is available commercially.
It gives you an idea of how a technology solves real world problems, exploits opportunities,
39
evolves and adopts over time. Each hype cycle has five stages for a technology’s life cycle.
First, when a potential breakthrough occurs, the technology garners all the media attention
and publicity it can in the initial phase. Usually in this phase, there are no products made
for usage and commercial purpose. This phase is called the Innovation Trigger. Second,
the publicity reaches the peak by various success stories but they are often followed by the
failures. Now comes the trough of disillusionment, where the interest in the technology
fades away and companies invest only if the product is improved to satisfy the customers.
This is the phase in which AR is currently in per the Hype Cycle. In the next phase, people
start to realize the potential of the technology and products will be introduced slowly. After
releasing several products which satisfy various needs of the customers, they become a
mainstream adoption which is around five to ten years per the Hype Cycle ("Hype Cycle
Research Methodology | Gartner Inc.", 2017).
Companies that pioneer in information technology like Apple, Google, Facebook,
and others are investing an enormous amount of money for acquisitions and research in
AR and VR. Google, Apple, and Facebook have already released their versions of AR
development platforms. These platforms perform enhanced object recognition, depth
detection, and detect location to perceive the environment surrounding the user so that they
can give an immersed experience for the people using it. AR is already making its way into
many fields like retail, education, transport, gaming and several others. People are starting
to realize the potential of AR and many areas are in line for the field to take over. It would
not be too much longer before AR seeps into the day to day life of the common man.
40
REFERENCES
Cheng, K., & Tsai, C. (2012). Affordances of Augmented Reality in Science Learning:
Suggestions for Future Research. Journal Of Science Education And Technology,
22(4), 449-462. http://dx.doi.org/10.1007/s10956-012-9405-9
Yuen, S., Yaoyuneyong, G., & Johnson, E. (2011). Augmented Reality: An Overview
and Five Directions for AR in Education. Journal Of Educational Technology
Development And Exchange, 4(1). http://dx.doi.org/10.18785/jetde.0401.10
Cho, K., Jung, J., Lee, S., Lim, S., & Yang, H. (2011). Real-time recognition and tracking
for augmented reality books. Computer Animation And Virtual Worlds, 22(6),
529-541. http://dx.doi.org/10.1002/cav.431
de Ravé, E., Jiménez-Hornero, F., Ariza-Villaverde, A., & Taguas-Ruiz, J. (2016).
DiedricAR: a mobile augmented reality system designed for the ubiquitous
descriptive geometry learning. Multimedia Tools And Applications, 75(16), 9641-
9663. http://dx.doi.org/10.1007/s11042-016-3384-4
Kaufmann, H. (2003). Collaborative augmented reality in education. Institute of Software
Technology and Interactive Systems, Vienna University of Technology.
Farias, L., Dantas, R., & Burlamaqui, A. (2011, September). Educ-AR: A tool for assist
the creation of augmented reality content for education. In Virtual Environments
Human-Computer Interfaces and Measurement Systems (VECIMS), 2011 IEEE
International Conference on (pp. 1-5). IEEE.
ABM X-10 - innovative Learner and User eXperience Lab. (2017). innovative Learner
and User eXperience Lab. Retrieved 13 June 2017, from
http://ilux.lab.asu.edu/abm-x-10/
innovative Learner and User eXperience Lab -. (2017). innovative Learner and User
eXperience Lab. Retrieved 13 June 2017, from http://ilux.lab.asu.edu/
B-Alert X10 EEG System with AcqKnowledge and Cognitive State | B-ALERT110CS-W |
Research | BIOPAC. (2017). BIOPAC Systems, Inc.. Retrieved 13 June 2017,
from https://www.biopac.com/product/b-alert-wireless-eeg-with-acqknowledge
plus-cognitive-state-software/
Tobii Pro Glasses 2 wearable eye tracker. (2017). Tobiipro.com. Retrieved 13 June 2017,
from https://www.tobiipro.com/product-listing/tobii-pro-glasses-2/
41
Markerless Augmented Reality - ARLab Blog. (2017). Arlab.com. Retrieved 18 June
2017, from http://www.arlab.com/blog/markerless-augmented-reality/
Gartner's 2016 Hype Cycle for Emerging Technologies Identifies Three Key Trends That
Organizations Must Track to Gain Competitive Advantage. (2017). Gartner.com.
Retrieved 18 June 2017, from http://www.gartner.com/newsroom/id/3412017
Gartner. (2017). En.wikipedia.org. Retrieved 18 June 2017, from
https://en.wikipedia.org/wiki/Gartner
Hype Cycle Research Methodology | Gartner Inc.. (2017). Gartner.com. Retrieved 19
June 2017, from
http://www.gartner.com/technology/research/methodologies/hype-cycle.jsp
Infographic: The History of Augmented Reality - Augment News. (2017). Augment News.
Retrieved 19 June 2017, from http://www.augment.com/blog/infographic-lengthy
history-augmented-reality/
Effect Size (ES) - Effect Size Calculators (Lee Becker) | University of Colorado Colorado
Springs. (2017). Uccs.edu. Retrieved 19 June 2017, from
http://www.uccs.edu/lbecker/effect-size.html
Effect sizes. (2017). Staff.bath.ac.uk. Retrieved 19 June 2017, from
http://staff.bath.ac.uk/pssiw/stats2/page2/page14/page14.html
Image Targets | Vuforia Library. (2017). Library.vuforia.com. Retrieved 24 July 2017,
from https://library.vuforia.com/articles/Training/Image-Target-Guide
Augmented reality. (2017). En.wikipedia.org. Retrieved 24 July 2017, from
https://en.wikipedia.org/wiki/Augmented_reality
Kaufmann, H., Schmalstieg, D., & Wagner, M. (2000). Construct3D: a virtual reality
application for mathematics and geometry education. Education and information
technologies, 5(4), 263-276.
Networks, S. (2017). 10 Big Pros of iPads as Technology in the Classroom.
Securedgenetworks.com. Retrieved 7 July 2017, from
http://www.securedgenetworks.com/blog/10-Big-Pros-of-iPads-as-Technology
in-the-Classroom
Johnson, B. (2017). Teaching and Learning: Using iPads in the Classroom. Edutopia.
Retrieved 7 July 2017, from https://www.edutopia.org/blog/ipad-teaching
learning-apps-ben-johnson
42
8 Benefits of using augmented reality in education. (2017). Retrieved 8 July 2017, from
https://www.onlinecultus.com/8-benefits-using-augmented-reality-education/
Brachiosaurus. (2017). Jurassic Park wiki. Retrieved 10 July 2017, from
http://jurassicpark.wikia.com/wiki/Brachiosaurus
Brachiosaurus. (2017). Cs.mcgill.ca. Retrieved 10 July 2017, from
https://www.cs.mcgill.ca/~rwest/link-suggestion/wpcd_2008
09_augmented/wp/b/Brachiosaurus.htm
Brachiosaurus. (2017). En.wikipedia.org. Retrieved 10 July 2017, from
https://en.wikipedia.org/wiki/Brachiosaurus
Brachiosaurus. (2017). Zoo Tycoon Wiki. Retrieved 10 July 2017, from
http://zootycoon.wikia.com/wiki/Brachiosaurus
Compsognathus. (2017). Cs.mcgill.ca. Retrieved 10 July 2017, from
https://www.cs.mcgill.ca/~rwest/link-suggestion/wpcd_2008
09_augmented/wp/c/Compsognathus.htm
Compsognathus. (2017). En.wikipedia.org. Retrieved 10 July 2017, from
https://en.wikipedia.org/wiki/Compsognathus
Compsognathus. (2017). Jurassic Park wiki. Retrieved 10 July 2017, from
http://jurassicpark.wikia.com/wiki/Compsognathus
Jurassic World. (2017). Jurassic World. Retrieved 10 July 2017, from
http://islanublar.jurassicworld.com/dinosaurs/tyrannosaurus-rex/
News, D., & DinoPit, C. (2017). Brachiosaurus - DinoPit. DinoPit. Retrieved 10 July
2017, from http://www.dinopit.com/dinosaurs/brachiosaurus/
News, D., & DinoPit, C. (2017). Compsognathus Habitat: A Jurassic Archipelago -
Dinopit.com. DinoPit. Retrieved 10 July 2017, from
http://www.dinopit.com/dinosaurs/compsognathus/
News, D., & DinoPit, C. (2017). Stegosaurus - DinoPit. DinoPit. Retrieved 10 July 2017,
from http://www.dinopit.com/Stegosaurus/
News, D., & DinoPit, C. (2017). Tyrannosaurus Rex - DinoPit. DinoPit. Retrieved 10
July 2017, from http://www.dinopit.com/tyrannosaurus-rex/
Stegosaurus. (2017). En.wikipedia.org. Retrieved 10 July 2017, from
https://en.wikipedia.org/wiki/Stegosaurus

43
Stegosaurus. (2017). Cs.mcgill.ca. Retrieved 10 July 2017, from
https://www.cs.mcgill.ca/~rwest/link-suggestion/wpcd_2008
09_augmented/wp/s/Stegosaurus.htm
Stegosaurus. (2017). Jurassic Park wiki. Retrieved 10 July 2017, from
http://jurassicpark.wikia.com/wiki/Stegosaurus
Stegosaurus. (2017). Dinosaur Wiki. Retrieved 10 July 2017, from
http://dino.wikia.com/wiki/Stegosaurus
Tiger PNG images. (2017). Pngimg.com. Retrieved 10 July 2017, from
http://pngimg.com/img/animals/tiger
Tyrannosaurus. (2017). En.wikipedia.org. Retrieved 10 July 2017, from
https://en.wikipedia.org/wiki/Tyrannosaurus
Tyrannosaurus. (2017). Cs.mcgill.ca. Retrieved 10 July 2017, from
https://www.cs.mcgill.ca/~rwest/link-suggestion/wpcd_2008
09_augmented/wp/t/Tyrannosaurus.htm
Tyrannosaurus rex. (2017). Jurassic Park wiki. Retrieved 10 July 2017, from
http://jurassicpark.wikia.com/wiki/Tyrannosaurus
Compsognathus | Extinct Animals. (2017). Extinctanimals.org. Retrieved 17 July 2017,
from http://www.extinctanimals.org/compsognathus.htm

44
APPENDIX A
DEMOGRAPHIC QUESTIONNAITRE
45
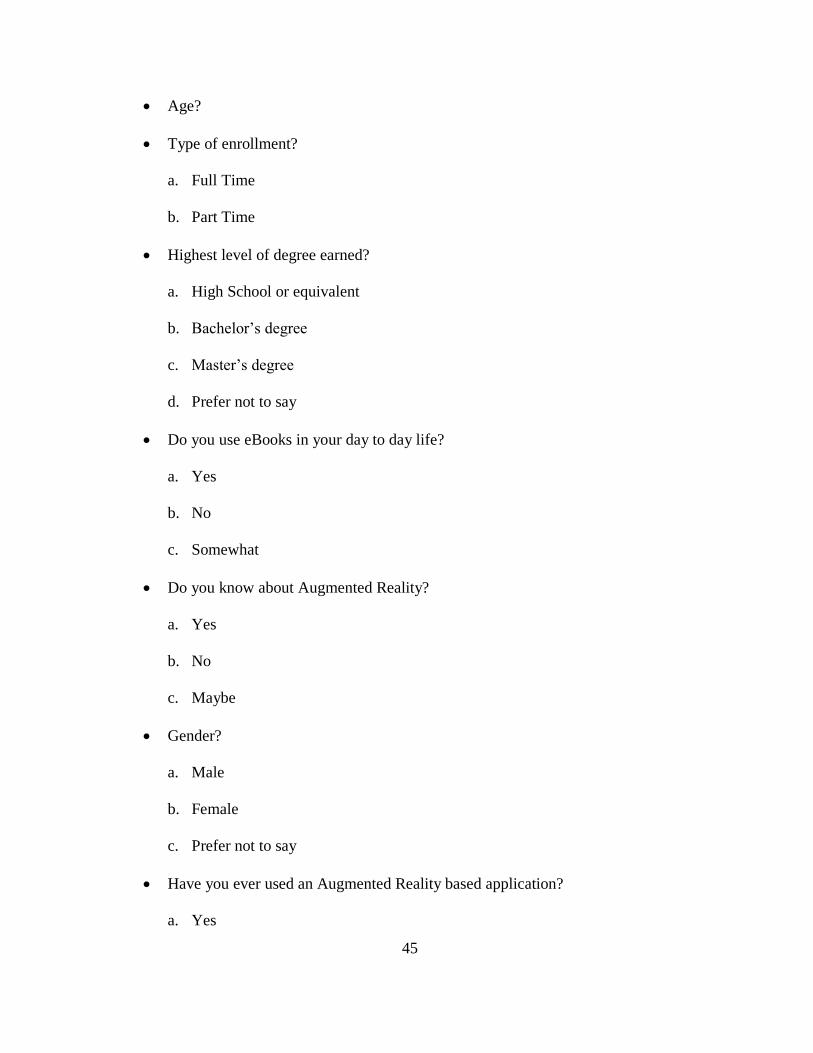
• Age?
• Type of enrollment?
a. Full Time
b. Part Time
• Highest level of degree earned?
a. High School or equivalent
b. Bachelor’s degree
c. Master’s degree
d. Prefer not to say
• Do you use eBooks in your day to day life?
a. Yes
b. No
c. Somewhat
• Do you know about Augmented Reality?
a. Yes
b. No
c. Maybe
• Gender?
a. Male
b. Female
c. Prefer not to say
• Have you ever used an Augmented Reality based application?
a. Yes

46
b. No
• On a scale of 1-5, how familiar are you with dinosaurs?

47
APPENDIX B
POST-TEST QUESTIONNAIRE

48
• Which of the following dinosaurs is the smallest?
a. Compsognathus
b. Brachiosaurus
c. Stegosaurus
d. Tyrannosaurus
• Select the correct order (from smallest to largest) from the following options based
on their sizes.
a. Tyrannosaurus < Brachiosaurus < Compsognathus < Stegosaurus
b. Stegosaurus < Compsognathus < Brachiosaurus < Tyrannosaurus
c. Compsognathus < Stegosaurus < Tyrannosaurs < Brachiosaurus
d. Brachiosaurus < Compsognathus < Stegosaurus < Tyrannosaurus
• Which of the following dinosaurs walk on their toes?
a. Compsognathus
b. Brachiosaurus
c. Tyrannosaurus
d. Stegosaurus
• How does Compsognathus travel?
a. Using its hind limbs
b. Using both hind and fore limbs
• Select all of the dinosaurs below that are quadrupedal.
a. Brachiosaurus
b. Compsognathus
c. Tyrannosaurus
49
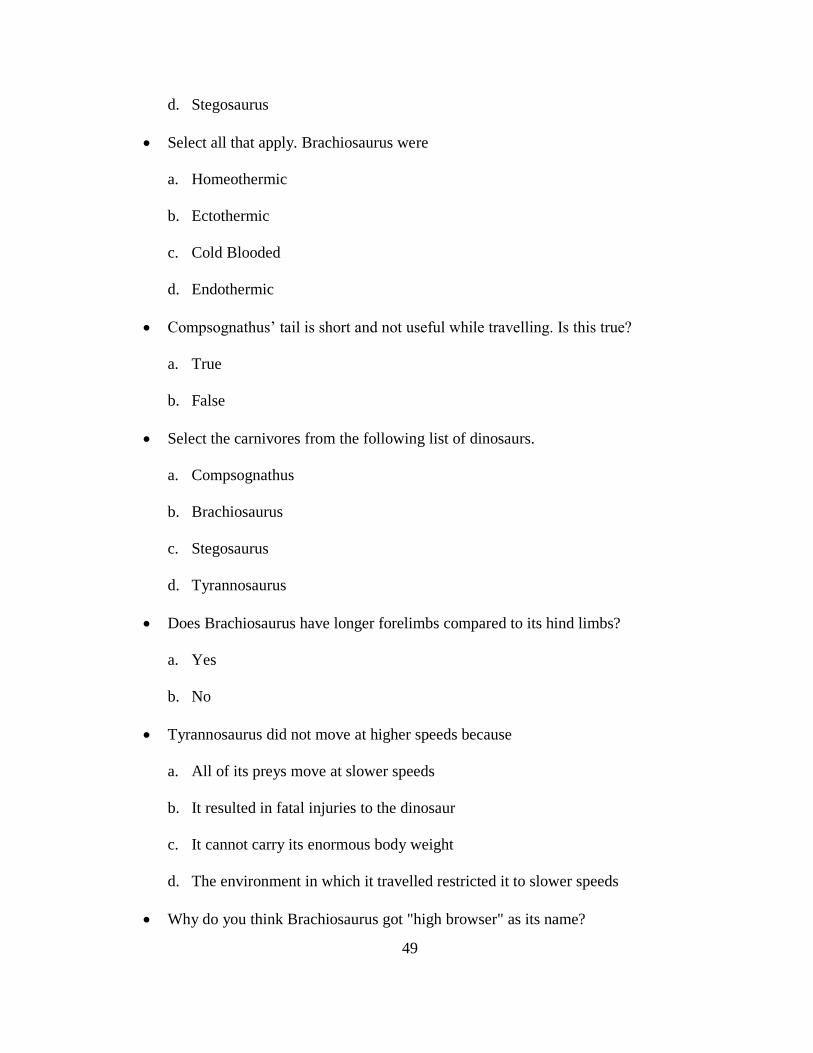
d. Stegosaurus
• Select all that apply. Brachiosaurus were
a. Homeothermic
b. Ectothermic
c. Cold Blooded
d. Endothermic
• Compsognathus’ tail is short and not useful while travelling. Is this true?
a. True
b. False
• Select the carnivores from the following list of dinosaurs.
a. Compsognathus
b. Brachiosaurus
c. Stegosaurus
d. Tyrannosaurus
• Does Brachiosaurus have longer forelimbs compared to its hind limbs?
a. Yes
b. No
• Tyrannosaurus did not move at higher speeds because
a. All of its preys move at slower speeds
b. It resulted in fatal injuries to the dinosaur
c. It cannot carry its enormous body weight
d. The environment in which it travelled restricted it to slower speeds
• Why do you think Brachiosaurus got "high browser" as its name?
50
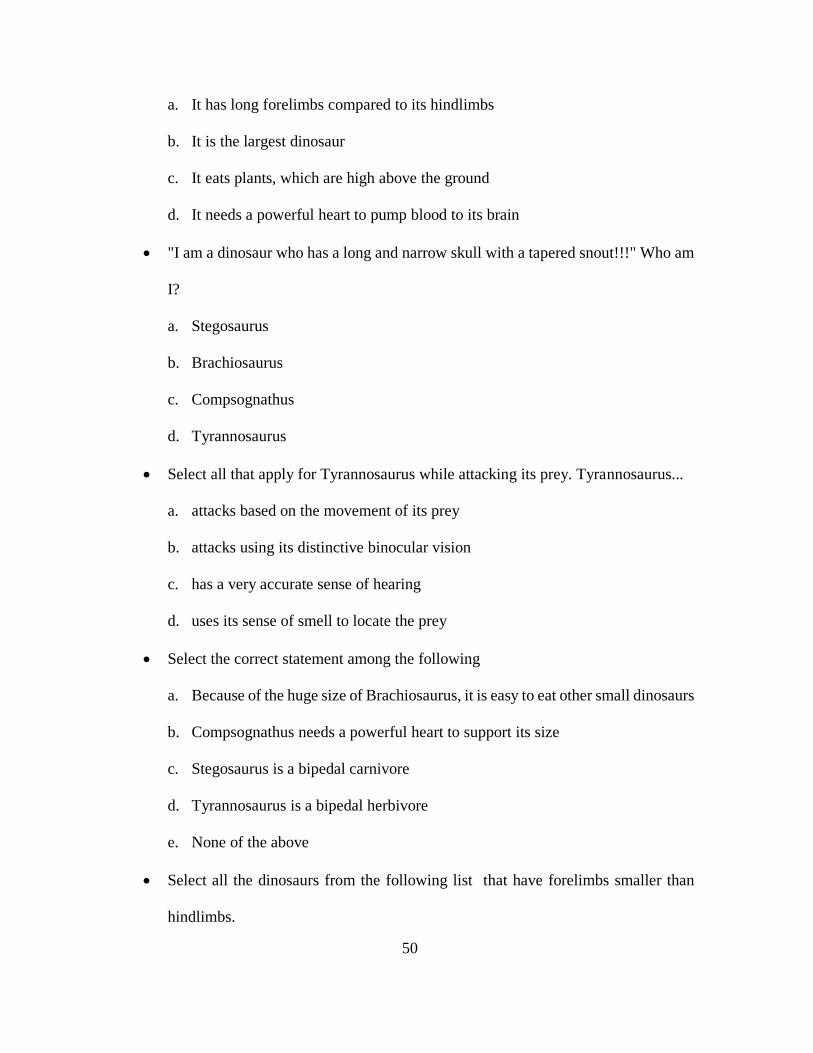
a. It has long forelimbs compared to its hindlimbs
b. It is the largest dinosaur
c. It eats plants, which are high above the ground
d. It needs a powerful heart to pump blood to its brain
• "I am a dinosaur who has a long and narrow skull with a tapered snout!!!" Who am
I?
a. Stegosaurus
b. Brachiosaurus
c. Compsognathus
d. Tyrannosaurus
• Select all that apply for Tyrannosaurus while attacking its prey. Tyrannosaurus...
a. attacks based on the movement of its prey
b. attacks using its distinctive binocular vision
c. has a very accurate sense of hearing
d. uses its sense of smell to locate the prey
• Select the correct statement among the following
a. Because of the huge size of Brachiosaurus, it is easy to eat other small dinosaurs
b. Compsognathus needs a powerful heart to support its size
c. Stegosaurus is a bipedal carnivore
d. Tyrannosaurus is a bipedal herbivore
e. None of the above
• Select all the dinosaurs from the following list that have forelimbs smaller than
hindlimbs.
51
a. Compsognathus
b. Brachiosaurus
c. Stegosaurus
d. Tyrannosaurus
• Which of the following dinosaurs traveled in groups?
a. Compsognathus
b. Stegosaurus
c. Tyrannosaurus
d. Brachiosaurus
• Stegosaurus had spikes to attack their enemies. Is this true?
a. Yes
b. No
• Which of the following is an armored dinosaur?
a. Compsognathus
b. Brachiosaurus
c. Tyrannosaurus
d. Stegosaurus
• How does backwardly curved teeth help Tyrannosaurus?
a. Helps to scare the enemies with its beast look
b. Helps reduce the likelihood of damage or loss of tooth while feeding the prey
c. Helps roar as big as possible, which is used as a signal to its allies
d. Helps to swallow its target as a whole
52
• "I am a dinosaur who is so long that I need couple of seconds to turn at a forty-five-
degree angle." Who am I?
a. Brachiosaurus
b. Stegosaurus
c. Tyrannosaurus
d. Compsognathus

53
APPENDIX C
USER EXPERIENCE QUESTIONNAIRE
54
• "I will use this type of learning environment in the future."
a. Strongly disagree
b. Disagree
c. Neutral
d. Agree
e. Strongly Agree
• "I was able to learn efficiently in this type of learning environment."
a. Strongly disagree
b. Disagree
c. Neutral
d. Agree
e. Strongly Agree
• "The topics presented in the eBook were difficult to learn."
a. Strongly disagree
b. Disagree
c. Neutral
d. Agree
e. Strongly Agree
• "The length of experiment was appropriate."
a. Strongly disagree
b. Disagree
c. Neutral
d. Agree
55
e. Strongly Agree
• "I will refer this learning environment to your friend."
a. Strongly disagree
b. Disagree
c. Neutral
d. Agree
e. Strongly Agree
• "This was a very effective learning environment."
a. Strongly disagree
b. Disagree
c. Neutral
d. Agree
e. Strongly Agree
• "I feel that the interactive visual you were presented in this eBook will help people
to learn better"
a. Strongly disagree
b. Disagree
c. Neutral
d. Agree
e. Strongly Agree
• "The user interface of the application is aesthetically pleasing."
a. Strongly disagree
b. Disagree
56
c. Neutral
d. Agree
e. Strongly disagree
• "I think the questions asked in the Post-Test are related to the content discussed in
the stimuli."
a. Strongly disagree
b. Disagree
c. Neutral
d. Agree
e. Strongly Agree

57
APPENDIX D
CTCI COMPLETION REPORT

58

59