comparison of aerial and ground surveying of subsidence
TRANSCRIPT

Comparison of Aerial and Ground Surveying of Subsidence Over an Active Longwall
By John C. liaScola
UNITED STATES DEPARTMENT OF THE INTERIOR

Report of Investigations 9214
Comparison of Aerial and Ground Surveying of Subsidence Over an Active Longwall
By John C. LaScola
UNITED STATES DEPARTMENT OF THE INTERIOR Donald Paul Hodel, Secretary
BUREAU OF MINES T S Ary, Director

Library of Congress Cataloging in Publication Data:
LaScola, John C. Comparison of aerial and ground sUlVeying of subsidence over an active longwall.
(Report of investigations; 9214)
Bibliography: p. 12.
Supt. of Docs. no.: I 28.23:9214.
1. Mine subsidences-Pennsylvania-Waynesburg Region-Measurement. 2. Longwall mining-Pennsylvania-Waynesburg Region-Safety measures. I. Title. II. Series: Report of Investigations (United States. Bureau of Mines); 9214.
TN23.U43 [TN319] 622 s [622'.334] 88-600281

CONTENTS Page
Abstract. . . . . . . . . . . . . . . . . . . . . . . . . . . . . . . . . . . . . . . . . . . . . . . . . . . . . . . . . . . . . . . . . . . . . . . . . . . 1 Introduction . . . . . . . . . . . . . . . . . . . . . . . . . . . . . . . . . . . . . . . . . . . . . . . . . . . . . . . . . . . . . . . . . . . . . . . . 2 Ackno:vledgm~nts . : . . . . . . . . . . . . . . . . . . . . . . . . . . . . . . . . . . . . . . . . . . . . . . . . . . . . . . . . . . . . . . . . . . 2 Surveymg consIderations . . . . . . . . . . . . . . . . . . . . . . . . . . . . . . . . . . . . . . . . . . . . . . . . . . . . . . . . . . . . . . . 2 Subsidence study site ................................................................. 4 St~tistic.al analysis . . . . . . . . . . . . . . . . . . . . . . . . . . . . . . . . . . . . . . . . . . . . . . . . . . . . . . . . . . . . . . . . . . . . 6 DIsCUSSIon ......................................................................... 11 References . . . . . . . . . . . . . . . . . . . . . . . . . . . . . . . . . . . . . . . . . . . . . . . . . . . . . . . . . . . . . . . . . . . . . . . . . 12
ILLUSTRATIONS
1. Index map . . . . . . . . . . . . . . . . . . . . . . . . . . . . . . . . . . . . . . . . . . . . . . . . . . . . . . . . . . . . . . . .. . . . . . . . 3 2. Site plan ........................................................................ 5 3. Study area . ; . . . . . . . . . . . . . . . . . . . . . . . . . . . . . . . . . . . . . . . . . . . . . . . . . . . . . . . . . . . . . . . . . . . . . 6 4. Boxplots of difference in monument position for matched pairs of surveys ........................ 8 5. Boxplots of absolute value of difference in monument position for matched pairs of surveys . . . . . . . . . . . 8 6. Relative frequency histogram of difference in monument position for 372 matched pairs of monuments .. 9 7. Relative frequency histogram of absolute value of difference in monument position for 372 matched pairs
of monuments ................................................................... 9 8. Cumulative relative frequency graph of absolute value of difference in position for 372 matched
pairs of monuments .............................................................. 10 9. Final subsidence measured by ground photogrammetric surveys and predicted values optimized for
maximum subsidence .....................................•....................... 11
TABLES
1. Statistics on the difference in monument position for matched pairs of surveys . . . . . . . . . . . . . . . . . . . . . 7 2. Statistics on the absolute value of the difference in monument position for matched pairs of surveys . . . . . 9

ft
h
ill
UNIT OF MEASURE ABBREVIATIONS USED IN THIS REPORT
foot
hour
inch
m
mm
pet
meter
millimeter
percent
..
COMPARISON OF AERIAL AND GROUND SURVEYING OF SUBSIDENCE OVER AN ACTIVE LONGWALL
By John C. laScola 1
ABSTRACT
The Bureau of Mines repeatedly surveyed a grid of monuments over an active longwall mine panel in southwestern Pennsylvania during a 1-year period. Both conventional ground surveying techniques and photogrammetry were used. The objective of this investigation was to compare elevation measurements of subsidence obtained from aerial and ground survey methods under dynamic ground conditions. The results of a statistical analysis of the survey data show that the mean of the differences between 372 matched pairs of elevation measurements was 0.20 ft (61 mm) with a 95-pct-confidence interval of 0.05 ft (15 mm). The mean of the absolute values of the differences was 0.38 ft (116 mm) with a 95-pct-confidence interval of 0.04 ft (12 mm). Ninety-five percent of the absolute values of the differences were less than 1.11 ft (338 mm).
scientist, Pittsburgh Research Center, U.S, Bureau of Mines, Pittsburgh, PA.

2
INTRODUCTION
Subsidence is the distortion of the ground surface that occurs when underlying material is removed. Strictiy speaking, subsidence is the change in elevation of any surface point, but in a more general sense, subsidence refers to any caving, sinking down of a part of the Earth's crust, or lowering of the strata due to underground excavations. This includes the horizontal or lateral movements that normally accompany the vertical movement. From a mining standpoint, the size and shape of a subsidence area depend on variables such as the type and method of mining, thickness of material removed, width of the opening, depth, overburden lithology, and the occurrence of other mines in adjacent strata. In addition, subsidence may affect surface structures and ground water in complex ways (7, 10-11).2
The Bureau of Mines is studying ground subsidence induced by longwall mining as part of its overall subsidence research program (9). The intention is to improve existing technology for predicting and controlling mine subsidence. Typically, a grid of survey monuments is established on the ground surface above a longwall panel before mining begins. The original three-dimensional spatial position of each monument is determined and then monitored throughout mining (4). The pattern of monuments is usually in the form of a base line directly above and parallel to the centerline of the longwall panel, with one or more cross profiles perpendicular to the base line an~ direction of mining. Position data gathered from the grid characterize the rate and form of movement resulting from mining and quantify the final disposition of the ground surface. This kind of information forms the basis
of empirical models, which in turn are used to predict future subsidence over projected longwall panels (1).
Collecting large amounts of data at each study site, using conventional ground surveying techniques, is time intensive, tedious, and expensive. Hierarchical structured software was designed to improve the computerized handling of the survey data (6), but the main cost is still associated with the on-site survey. In an effort to examine alternative means of collecting subsidence data, the Bureau established a static grid over a stable surface at the Pittsburgh (PA) Research Center and compared five different surveying technologies (5). The measurements from three of those technologies, classical ground surveying using electronic distance meter, theodolite, and level; automatic recording infrared laser tachymeter; and aerial photogrammetry, were statistically analyzed. Based on the averages of the absolute values of the differences in readings, the three-dimensional displacements were similar in magnitude and less than 0.25 ft (76 mm).
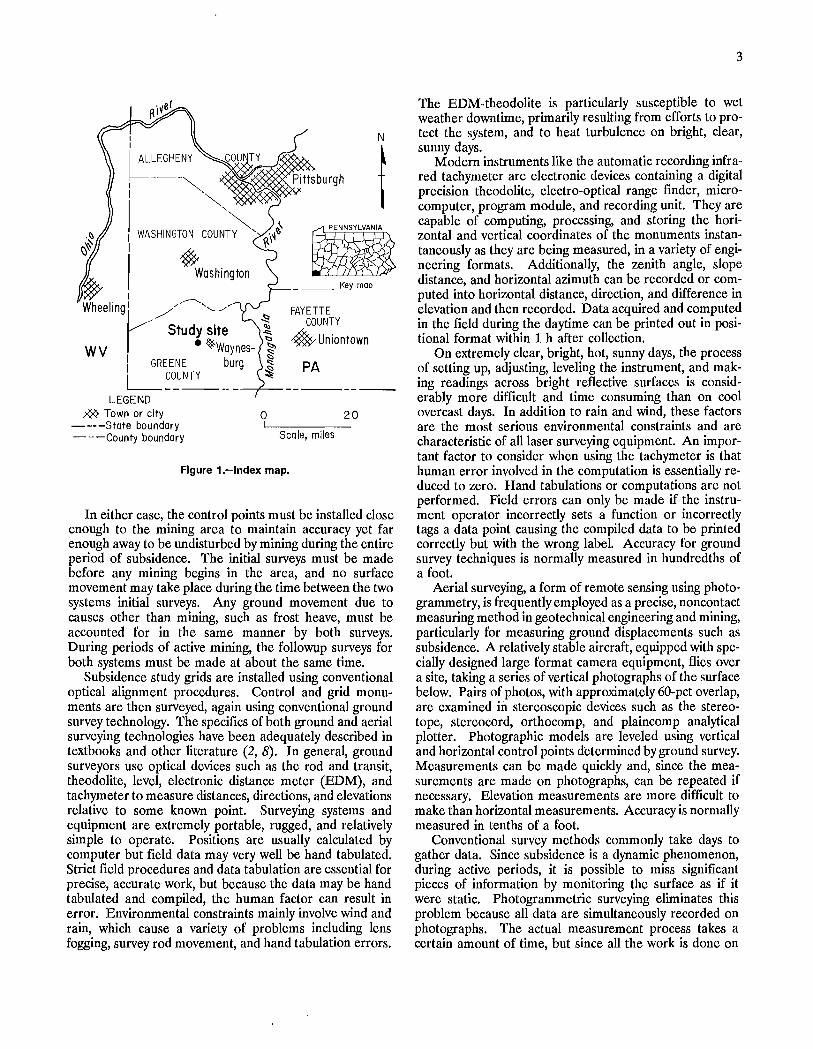
The objective of this investigation was to compare elevation measurements of subsidence obtained from aerial and ground survey methods under the dynamic ground conditions of active mining. The usual and customary transit and rod ground surveys at a longwall mine subsidence study site near Waynesburg, in Greene County, southwestern Pennsylvania (fig. 1) were augmented with aerial photogrammetric surveys. The analysis presented in this report mainly addresses the question of how much alleged positions of survey monuments differed between two surveying systems, and to a lesser degree, how much the ground moved because of subsidence.
ACKNOWLEDGMENTS
The author wishes to acknowledge the technical assistance provided by Robert M. Keddal, president (deceased), R. M. Keddal and Associates, Inc., Library, PA, and Henry
Moomau, president, Potomac Engineering and Surveying, Oakland, MD.
SURVEYING CONSIDERATIONS
Two distinct questions can be asked about a monument that has been surveyed for subsidence:
1. Where is it (position)? 2. How much has it moved since the last survey (dif
ference in position)?
Position data for two different surveys of the same area are directly comparable only if both surveys are based on
2Italic numbers in parentheses refer to items in the list of references at the end of this report.
the same coordinate referencing system. Both surveys must also contain common control points that are described by the identical coordinate values. The control points should be based on the U.S. Public Land Survey, tied to a State coordinate system, or described in terms of latitude and longitude. If the surveys use different references, or if either or both of the surveys use relative positioning systems, their positional data may not be directly comparable. However, if each survey is conducted consistently and certain basic procedures are followed carefully, then the difference in position data is comparable.
I I
~~EGHE_: I "
"" ! WASHINGTON COUN~~' I ~
~ I Washington
W I ~ Wheelingrl ~/" "'--./'
Study site W V • ~Waynes-
N
t • _~ __ Key map
FAYETTE COUNTY
4Uniontown
I GREENE burg PA ~~~U~ ___ --,<'--- _______ _
LEGEND M Town or city
- ---State boundary - - -County boundary
o 20 I I I
Scale, miles
Figure i.-Index map.
In either case, the control points must be installed close enough to the mining area to maintain accuracy yet far enough away to be undisturbed by mining during the entire period of subsidence. The initial surveys must be made before any mining begins in the area, and no surface movement may take place during the time between the two systems initial surveys. Any ground movement due to causes other than mining, such as frost heave, must be accounted for in the same manner by both surveys. During periods of active mining, the followup surveys for both systems must be made at about the same time.
Subsidence study grids are installed using conventional optical alignment procedures. Control and grid monuments are then surveyed, again using conventional ground survey technology. The specifics of both ground and aerial surveying technologies have been adequately described in textbooks and other literature (2, 8). In general, ground surveyors use optical devices such as the rod and transit, theodolite, level, electronic distance meter (EDM), and tachymeter to measure distances, directions, and elevations relative to some known point. Surveying systems and equipment are extremely portable, rugged, and relatively simple to operate. Positions are usually calculated by computer but field data may very well be hand tabulated. Strict field procedures and data tabulation are essential for precise, accurate work, but because the data may be hand tabulated and compiled, the human factor can result in error. Environmental constraints mainly involve wind and rain, which cause a variety of problems including lens fogging, survey rod movement, and hand tabulation errors.
3
The EDM-theodolite is particularly susceptible to wet weather downtime, primarily resulting from efforts to protect the system, and to heat turbulence on bright, clear, sunny days.
Modern instruments like the automatic recording infrared tachymeter are electronic devices containing a digital precision theodolite, electro-optical range finder, microcomputer, program module, and recording unit. They are capable of computing, processing, and storing the horizontal and vertical coordinates of the monuments instantaneously as they are being measured, in a variety of engineering formats. Additionally, the zenith angle, slope distance, and horizontal azimuth can be recorded or computed into horizontal distance, direction, and difference in elevation and then recorded. Data acquired and computed in the field during the daytime can be printed out in positional format within 1 h after collection.
On extremely clear, bright, hot, sunny days, the process of setting up, adjusting, leveling the instrument, and making readings across bright reflective surfaces is considerably more difficult and time consuming than on cool overcast days. In addition to rain and wind, these factors are the most serious environmental constraints and are characteristic of all laser surveying equipment. An important factor to consider when using the tachymeter is that human error involved in the computation is essentially reduced to zero. Hand tabulations or computations are not performed. Field errors can only be made if the instrument operator incorrectly sets a function or incorrectly tags a data point causing the compiled data to be printed correctly but with the wrong label. Accuracy for ground survey techniques is normally measured in hundredths of a foot.
Aerial surveying, a form of remote sensing using photogrammetry, is frequently employed as a precise, noncontact measuring method in geotechnical engineering and mining, particularly for measuring ground displacements such as subsidence. A relatively stable aircraft, equipped with specially designed large format camera equipment, flies over a site, taking a series of vertical photographs of the surface below. Pairs of photos, with approximately 60-pct overlap, are examined in stereoscopic devices such as the stereotope, stereo cord, orthocomp, and plaincomp analytical plotter. Photographic models are leveled using vertical and horizontal control points determined by ground survey. Measurements can be made quickly and, since the measurements are made on photographs, can be repeated if necessary. Elevation measurements are more difficult to make than horizontal measurements. Accuracy is normally measured in tenths of a foot.
Conventional survey methods commonly take days to gather data. Since subsidence is a dynamic phenomenon, during active periods, it is possible to miss significant pieces of information by monitoring the surface as if it were static. Photogrammetric surveying eliminates this problem because all data are simultaneously recorded on photographs. The actual measurement process takes a certain amount of time, but since all the work is done on
4
photographs, the surface conditions are frozen in time and monument positions are computed for the instant of the photograph. Photogrammetry makes surveying possible, without significant additional cost, in areas that are relatively inaccessible to ground crews because of terrain conditions or lack of permission from property owners. However, a ground survey might still be required to establish control points outside the subsidence area if no existing control data are available.
Photographs provide great detail of the visible surface area. This offers two valuable options: the interpreter may use any visible, discrete natural object at a monitoring point whether originally planned or not; and the interpreter may utilize the techniques of remote sensing to determine the effects of subsidence on vegetation or other facets of the surface environment. This is possible because once the photographs exist, they can be reevaluated, remeasured, and checked for new information.
Positional coordinates can be read off stereophotographs using a space coordinate system and the coordinate lines can be intersected either mechanically or mathematically. Although mechanical intersection is performed in conventional stereoplot mapping, mathematical intersection or analytical aerotriangulation and/or stereo compilation can be performed. The analytical technique permits data refmement and statistical adjustment for extremely accurate photograph point identification. Additionally, the procedure permits error correction in camera calibration,
ftlm emulsion deformation, camera platen flatness, tangentiallens distortion, atmospheric refraction, and Earth curvature.
The primary environmental constraint in photogrammetric surveying is the ground visibility requirement. Obviously a point must be seen in the photograph if it is to be surveyed and its position computed. Photogrammetry is contraindicated in areas of heavy ground vegetation during the growing season, in heavily wooded areas at all times, and under snow in the winter. Surveys should generally be conducted in early spring and late fall when ground cover is at a minimum. Normal subsidence monitoring, however, continues through all seasons. This necessitates clearing away any ground cover that might obscure a target from the air. In addition, photographs must be taken in a clear atmosphere and with a proper sun angle for exposure. The problem of target visibility is probably the limiting factor when deciding whether or not photogrammetry can be used.
Another less obvious constraint concerns flight elevation and the location of control points. To maximize accuracy, aircraft must fly low enough to resolve ground targets yet high enough to get the entire study area on one photograph or as few photographs as possible. Control points must be as close to the subsidence area as possible to be included in the photograph yet, if too close, may be affected by subsidence, thereby distorting the frame of reference.
SUBSIDENCE STUDY SITE
The longwall mine subsidence study site consisted of a grid pattern of monuments established over the first four of five adjacent longwall panels (fig. 2). The lengths of the four panels were 4,700, 5,670, 5,740, and 5,170 ft (1,430, 1,730, 1,750, and 1,580 m), respectively. Panels 1, 2, and 4 were 635 ft (194 m) wide; panel 3 was 630 ft (192 m) wide. Monuments forming parallel base lines directly above the center lines of the first three panels were crossed by three continuous perpendicular proftle lines (profiles A, B, and C) that extended to the far edge of the fourth panel. This allowed cross-sectional analysis both parallel and perpendicular to the direction of mining. In addition to the main grid, a number of small, unrelated patterns were installed for short-term monitoring of local movements. The entire main grid was surveyed before, during, and after mining using conventional ground methods. Only a portion of second panel was surveyed by aerial photogrammetry. The approximate overburden or depth from surface to coal in this area ranged from 600 to 900 ft (200 to 300 m).
The monuments consisted of 2-ft (0.6-m) sections of No.5 reinforcement bars driven into the ground to refusal. Spacing between monuments was 50 ft (15.2 m) on portions of both base line 3 and profile B, and 25 ft (7.6 m) everywhere else. Reflective 13-in-diam (330 mm)
disposable aluminum pans were installed over the centers of 42 selected monuments in order to make the positions of thel/2-in-diam (13 mm) rebar monuments visible from the air (fig. 3). Ground surveyor access to the monuments were ensured by cutting 2-in (50-mm) holes in the centers of the pans. Aerial surveyors measured only the position of the reflective targets because of flight elevation and resolution considerations. Eleven of those targets were installed along an 800-ft (24O-m) section of base line 2. Adjacent 1,5OO-ft (460-m) portions of profiles A and B had 16 and 15 targets, respectively, equally distributed to either side of base line 2. In addition, four control points were established and targeted, one near the extreme end targets of each profile. Spacing between targets was originally planned to be 100 ft (30 m) but actually ranged from 25 ft (7.6 m) to 125 ft (38 m) in order to avoid tree cover and roadways.
Base lines 1 and 3 and proflle C were not surveyed by aerial photogrammetry; however, the ground survey data from the entire site was used as an information base to determine the general reasonableness of the data from the selected area. Only the elevation data collected for the 42 monuments equipped with ret1ective targets were used for analysis in this report.

5
) (a
,\~~~~ Direction of minin{
____ /loO/Surface contours .J~~~::::> Stream
-----Longwall panel outline Monument grid
P-A Profile 8-1---8ase line
o 1,000 I I I
Scale, ft
Figure 2.-Site plan.
During a i-year period, 12 aerial photogrammetric surveys were conducted on panel 2 corresponding to 34 conventional ground surveys covering the same area but over a longer period of time. Each of the aerial surveys was matched to a ground survey that reportedly occurred on the same day or, at most, within two mine workdays. This difference in time is negligible for static conditions but can cause major discrepancies when comparing position measurements made during periods of active subsidence. Closer agreement in time was difficult to achieve because
of scheduling and weather conditions. In addition, while photographs instantly record the visual aspects for later position calculation, conventional methods may take 2 or 3 days to survey the same area.
Aerial surveys began 1.5 months and 630 ft (190 m) before the longwall face reached the ftrst monument on the base line. The panel was completed 6 months and 2,960 ft (900 m) after the longwall face progressed past the last monument. The final aerial survey occurred 3 months after the panel was completed.

6
Direction of mining ... ------------------
Profile Profile C I
Base line 1
t· .' ~ r Panel 1 I I )j I.'~. 0 ? 0 J' . ji·\ ce,,-" ',,:.-, " ".--,,0",,"", ;,' ',',," "'-"-''-''',-i "ili·:!:;:,i ''''-='' ''-''''-:~''''' '4"" ~",h"''' i'D"" ... "'""(£;'S""'--"""'-"'''' ",,,",'k ;,\i,;]
. ,
(f?;,t.:/I;-:!!~{7T-~'!0;:?~'( ;.~: :r::(.-:;';/~~ .. ;.;":,.~.;~:;,:' .;-.:.,: :,,';-.;"10.",-:;: .. ;:;,: !-?'i7;-'07.;:r;.;~; \0:'i' .. :'T{., ""::..:':':''',:;:/1 ~':f'~0 <;: .,«;, j\;'.-.::.,.,:.',: ~:.'/:Z.F{J /:... " •• , f 1"::': Panel 2 . '·~:;.:/'
\t~.:· ------ -j' - -_0--0---+' _ Bas~ line 2 --- '::f:~ I"~. "·1 f' ~. (,' . ~;,1 o ,1 ~k :."" : ... \'.' ' ... " ~- . " 'i' '" "" .. -., .. c. :1' '!"'" .'" '.~ ,:";.;.} ',. (.:~. '., •. '" , ... , .' .. J".~ "." ,; .... " : ,t·' •.. ': ,.~ .'.C·· ','1 0, :', ., +-,. ~ '-".' 'i:~~~\ ~,~,::.:,:,,)~.,""~'~"""~~':':;;]<.:.b-:'~".Jl. •.• ,' •. , :.:..!:-"" ."-.'.~'~\.:.::::: •. ~":..:? "':::':.D~'·::'::::".:.!::;:·T··~'.:::·,....:::-:w.'·.:.1:"·'-'·il'.!::.:.."::.::!.""" "...:!.':.··-',.····,,;,,:,;:.,E,~"4
, '
. ~ I w:·,0;~··''?7j~''''('';''!,;::?,'':::;:.,..Pc,~:';;~.:~:::-;;.'~;;' ·:.r:.~:·' ... :)··:.;,'.·)!:7-:';-~';::;z,':"·~~.;i.T,h!.::-·::ivy::.s·~';-;:::;.(r:;;'·~,:·!:.;;:;;·;,:~;<,~··"~\:i.:.;:::·y,"-T-::":":<":'::~:~1
f~~ Panel 3 0 oi- -t' ... ~:( \~:1, Base line 3 ~I .1l.. ;"1 rl" - - - ,',
f/ LEGEND i 0 400 :'~j o Control points I I I o Monuments Scale, f t
Figure 3.-Study area.
STATISTICAL ANALYSIS
The question of accuracy of survey method was not within the scope of this investigation and therefore will not be addressed, Only the difference in monument position, as determined by the two surveying methods, can be examined. In order to measure accuracy, many separate studies should be conducted at a number of different sites by a number of different surveyors. Each site should be extremely stable with no ground movement of any type. The topography of the sites should be different from one another and, as a group, contain all of the problem conditions normally met in real world situations.
The elevation data for 12 matched pairs of surveys consisting of 42 monuments each seemingly should have produced 504 pairs of measurements. However, because
of customary ground surveying procedures used for subsidence research and data loss because of weather conditions, compilation errors, and visibility, only 372 measurements could be compared. In order to save time and money, ground surveyors do not normally monitor the position of monuments that are outside the area affected by the advancing longwall face, The exceptions to the rule are the initial and final surveys and the monitoring of control points.
Two aspects of the data were analyzed; the difference between the elevations in the form of the aerial value minus the ground value, and the absolute value of those differences. This approach was used because the algebraic sign of the difference in position is not nearly as important

as the magnitude of the value. Consider that when averaging, large positive differences are offset by equally large negative differences. The average difference approaches zero and the real variation in monument position is masked. For comparison purposes, graphs and tables of statistics are given for both type of analyses.
Tables 1 and 2 present 16 statistics for each of 14 analyses. The graphs in figures 4 and 5 display distributions of the data in the form of boxplots depicting five of those statistics. Each boxplot shows the maximum, median, and minimum values as horizontal lines connected by a vertical line. The median value is the middle value such that half of the data is less and half the data is greater. The 95-pctconfidence interval of the mean is represented by the top and bottom of a rectangular box superimposed on the vertical line. Conceptually, if a very large number of confidence intervals were constructed in a similar manner, 95 pct of those intervals would be expected to encompass the true population mean. In effect, each boxplot is equivalent to a frequency distribution curve viewed from above.
7
Figures 4 and 5 and tables 1 and 2 present the same statistics in two different ways. The first 12 items in each represent the 12 matched pairs of surveys. The next item represents the 12 means of the matched pairs of surveys. The final item represents the 372 matched pairs of monument measurements considering each pair of measurements to be independent. The position of each monument in each survey is measured as though it were a new object since, under the dynamic conditions of subsidence, the ground, and therefore each monument, may have moved since the last survey. The graphs in figures 6 and 7 are relative frequency histograms showing grouped distributions for those 372 pairs. The graph in figure 8 is a cumulative relative frequency curve of the absolute values only of the difference in position for the 372 matched pairs of monuments. Graphs similar to those found in figures 6 through 8 could have been presented for each of the 12 matched sets of surveys but would not have added much to the understanding of the data.
TABLE 1. - Statistics on the difference In monument posltlon for matched pairs of surveys measured, feet
Statistlo Survey Survey Survey Survey Survey Survey Survey 1 2 3 4 5 6 7
Count (N) .••....•• 41 23 39 35 42 24 42 Sum ............. 4.23 6.35 7.32 9.67 -3.32 3.56 ·20.59 Mean ... , ........ .103 .276 .188 .276 -.079 .148 -.490 SEM .....•....... .034 .041 .026 .044 .033 .046 .108 Median ......... , .100 .280 .180 .280 -.050 .125 -.220 Varlanoe •...•••.•. .048 .039 .026 .067 .045 .051 .487 SD ...••......... .218 .198 .161 .258 .212 .225 .698 Maximum .......•. .56 .70 .49 .88 .34 .60 .25 Minimum ....•.••. -.41 -.05 -.12 -,26 -.49 -.25 -2.38 Range ••• I ••••••• .97 .75 .61 1.14 .83 .85 2.63 Skewness ......... -.260 .257 .096 .198 -.085 .361 -1.567 Kurtosis ..••.•.... -.048 -.660 -.862 .650 -.778 -.364 1.559 t: 95-pot CI .. , .... 2.022 2.074 2.025 2.033 2.020 2.069 2.020 95-pct CI ' ........ .069 .086 .052 .089 .066 .095 .217 Mean:
Upper limit .172 .362 .240 .365 -.013 .243 -.273 Lower limit ..... .034 .191 .136 .188 -.145 .053 -.708
Survey Survey Survey Survey Survey Mean of All 8 9 10 11 12 surveys surveys
Count (N) .•....... 31 24 9 21 41 12 372 Sum •............ 7.84 4.88 6.24 10.65 36.84 2.98 73.67 Mean ............ .253 .203 .693 .507 .899 .248 .198 SEM ....•....••.. .110 .064 .079 .054 .041 .102 .026 Median .......... .130 .255 .700 .450 .860 .228 .190 Variance ........•. .374 .099 .057 .062 .070 .125 .257 SO .............. .612 .314 .238 .249 .265 .354 .507 Maximum ....•••.. 2.32 .58 1.04 1.17 1.57 .90 2.32 Minimum ..••••••• -.31 -.94 .27 .10 .48 -.49 -2.38 Range ......... , . 2.63 1.52 .77 1.07 1.09 1.39 4,70 Skewness .•..•.... 2.104 -2.176 -.276 .792 .597 -.150 -,830 Kurtosis ..•....... 4.481 6,947 -.177 1.251 -.091 1.302 6.131 t: 95-pct Ci 6 •••••• 2.043 2.069 2.307 2.086 2.022 2.202 1.967 95-pct CI ... ~ ..... .225 .133 .183 .113 .084 .225 .052 Mean:
Upper limit ••• ! • .477 .336 ,876 .620 .982 .473 .250 Lower limit ..... .028 .071 ,510 .394 .815 .023 .146
CI Confidence interval. N Number. SO Standard deviation. SEM Standard error of the mean. t Standard Hest, degree of freedom '" N - 1.

8
_ 2.0 '+-
uS 1.5 u z 1.0 LLI ffi .5
t 0 Ci
- .5 Z °-1.0 I-~-1.5
0.-2 .0
+ -f~i-+-+-~
aXimum Upper 95-pct
confidence interva I edian
Lower 95-pct-'" confidence interval
Minimum -2.5~~--~~~~--~~--~--~~--~~~~--~~--~
2 3 4 5 6 7 8 9 10 , 1 12 Mean All
-'+-.. LLI U Z LLI 0:: LLI LL LL -0
Z
° I-Ci5
° C-
2.5
2.0
1.5
1.0
.5
O
DATA SETS Figure 4.-Boxplots of difference In monument position for matched pairs of surveys.
KEY -Maximum
Upper 95-pctconfidence interval
Median
Lower 95-pctconfidence interval
........ Minimum
t. __ f __ t._~ ___ .j..~1 ~I 1 1'---.... ---1
2 3 4 5 6 7 8 9 10 II I 2 Mean All
DATA SETS
Figure 5.-Boxplots of absolute value of difference In monument poSition for matched pairs of surveys.

TABLE 2. - Statistics on the absolute value of the difference In monument position for matched pairs of surveys measured, feet
Statistic Survey Survey Survey Survey Survey Survey Survey 1 2 3 4 5 6 7
Count (N) ......... 41 23 39 35 42 24 42 Sum ............. 8.11 6.45 7.84 11.05 7.60 5.00 22.61 Mean ............ .198 .280 .201 .316 .181 .208 .538 SEM ............. .021 .040 .023 .035 .021 .034 .102 Median ... , ...... .190 .280 .180 .280 .160 .145 .230 Variance .......... .018 .037 .020 .043 .018 .028 .436 SO .............. .136 .191 .143 .206 .133 .168 .660 Maximum ......... .56 .70 .49 .88 .49 .60 2.38 Minimum ......... .00 .01 .00 .01 .00 .01 .00 Range .. , .... "" .56 .69 .49 .87 .49 .59 2.38 Skewness ......... .735 .374 .401 1.099 .545 1.044 1.753 Kurtosis .......... .325 -.692 -.923 1.661 -.401 .411 1.978 t: 95-pct CI ....... 2.022 2.074 2.025 2.033 2.020 2.069 2.020 95-pct CI ......... .043 .083 .046 .071 .041 .071 .206 Mean:
Upper limit .241 .363 .247 .387 .222 .279 .744 Lower limit ..... .155 .198 .155 .245 .139 .137 .332
Survey Survey Survey Survey Survey Mean of All 8 9 10 11 12 surveys surveys
Count (N) ......... 31 24 9 21 41 12 372 Sum ............. 12.14 7.34 6.24 10.65 36.84 4.72 141.87 Mean ............ .392 .306 .693 .507 .899 .393 .381 SEM ............. .095 .043 .079 .054 .041 .065 .020 Median ., ....... , .180 .265 .700 .450 .860 .311 .260 Variance .......... .282 .044 .057 .062 .070 .051 .150 SO .............. .531 .211 .238 .249 .265 .226 .388 Maximum ......... 2.32 .94 1.04 1.17 1.57 .90 2.38 Minimum ......... .01 .00 .27 .10 .48 .18 .00 Range ........... 2.31 .94 .77 1.07 1.09 .72 2.38 Skewness ......... 2.611 1.082 -.276 .792 .597 1.211 2.272 Kurtosis ., ........ 6.548 2.227 -.177 1.251 -.091 .839 6.766 t: 95-pct CI ....... 2.043 2.069 2.307 2.086 2.022 2.202 1.967 95-pct CI .. " ..... .195 .089 .183 .113 .084 .143 .040 Mean:
Upper limit ..... .586 .395 .876 .620 .982 .537 .421 Lower limit ..... .197 .217 .510 .394 .815 .250 .342
CI Confidence interval. N Number. SO Standard deviation. SEM Standard error of the mean. t Standard t-test, degree of freedom = N - 1.
14'--'1--'1---'-1-'1---'-1-'-1-'1---'-1-'1--~ 20 I I I I
121- -
10 I- -+-u a.
)-!' 8 I- -U Z W ::J
61-a -w e:
41- -
2-
IlJ- ~1 -
o,..,.,rl-, I -f1 n I ,.., -2.5 -2.0 -1.5 -1.0 -0.5 0 0.5 1.0 1.5 2.0 2.5
POSITION DIFFERENCE, ft
Figure 6.-Relatlve frequency histogram of difference In monument position for 372 matched pairs of monuments.
l-
r-
+- 15 f- -u a.
)-!' U
- - -Z 10 w l-
I-
~
[3 0::
f- -LL 5
-lhll ~ ~ ...fI -/I
0.5 1.0 1.5 2.0 o 2.5
POSITION DIFFERENCE, ft
Figure 7.-Relative frequency histogram of absolute value of difference In monument position for 372 matched pairs of monuments.
9

i!
Ii.:.' "
Ii:
I
i.!" ,
I
I'
10
_ 100~-'--~-'--~--'-=C==~~==~~===F~ u a.
>-" 80 U z W ::l 63 60 0:: LL
W 40 > ~ ..J ::l :;: [3
2.4
Figure a.-Cumulative relative frequency graph of absolute value of difference In position for 372 matched pairs of monuments.
A casual glance at the count of data used from each of the 12 surveys shows unequal sample sizes. Counts range from as few as 9 in survey 10 to the full 42 in surveys 5 and 7. To compensate for this disparity, more attention must be paid to the area estimate of the mean than to the more common point estimate of the mean. The boxplots in figures 4 and 5 are designed to help focus attention on the 95-pct-confidence interval of the mean while giving a feeling for the actual distribution of the data. The ideal condition would be for the median to fall at the center of Lhe interval of the mean, the mean should be as close to zero as possible, and the minimum-maximum points should be as close together as possible, producing the smallest possible range.
Survey 1 is the initial survey describing the original position of the ground before any subsidence takes place. All other surveys are compared to this survey to detect ground movement. As such, it should represent the surveyor's best work. In this study, only survey 5 has both a smaller interval of the mean and a smaller range. It should be noted that the photogrammetrist could not see 1 of the 42 targets in the initial survey but, since the target was on profile B in an area not affected by the advancing longwall face until much later in the study, a measurement made any time before the face neared the profile, could have been used as the initial position.
The range of differences becomes very large in surveys 7 and 8. Fourteen percent of the photogrammetric measurements in survey 7 were more than 1 ft (0.3 m) lower than the ground survey measurements. Ten percent of the photogrammetric measurements in survey 8 were more than 1 ft (0.3 m) higher than the ground survey measurements. However, 50 pct of the absolute value measurements are less than 0.23 ft (70 mm) and 0.18 ft (55 mm) for surveys 7 and 8, respectively. This compares well with the other surveys.
In general, the second set of six surveys have poorer agreement than the first set of six surveys. No simple explanation is available. The greatest subsidence is expected
to occur when the face moves under a surface point (4). Profile B was undermined between surveys 7 and 8. Conversely, there is no similar spread in data when profile A was undermined between surveys 4 and 5. A hayfield containing monuments was plowed and planted during the second half of the study. In particular, one of the aerial control points was plowed under before the final survey and could not be located by either Bureau personnel or the ground survey crew. In addition, grazing cows destroyed another control point target within a half hour of the last flight. Fortunately, the aerial model could still be leveled using the two remaining control points and regular monuments near the missing controls.
The 13th set of statistics is based on the point means of the 12 pairs of surveys. The 95-pct-confidence limits of the means are 0.02 to 0.47 ft (6-143 mm) for the difference values and 0.25 to 0.54 ft (76-165 mm) for the absolute value of the difference values. These values bracket the expected mean of future measurements.
The 14th set of data shows the largest range because it contains the maximum of the maximum and minimum of the minimum values from the 12 survey pairs. The relative frequency bar graphs in figures 6 and 7 show that the data are concentrated near zero and the absolute values of the differences are highly skewed towards the high values. This indicates that wild values can be expected but that they probably can be spotted and eliminated by tracking them down individually.
The cumulative relative frequency graph in figure 8 shows that 50 pct (median value) of the absolute values of the difference are less than or equal to 0.26 ft (79 mm), 95 pct are less than 1.11 ft (338 mm), and only 37 pct are less than 0.20 ft (61 mm). The mean of the differences between 372 matched pairs of elevation measurements under dynamic conditions was 0.20 ft (61 mm) with a 95-pctconfidence interval of 0.05 ft (15 mm). The mean of the absolute values of the differences, however, was 0.38 ft (116 mm) with a 95-pct-confidence interval of 0.04 ft (12 mm). These statistics are approximately twice the values obtained from this study at the static grid over the stable surface mentioned in the introduction (5). The mean of the absolute values of the differences for the 127 matched pairs of elevation measurements in that study was 0.20 ft (62 mm) with a 95-pct-confidence interval of 0.03 ft (9 mm).
The preceding analysis addresses the question of where a point is according to two different methods of surveying. The graph in figure 9 attempts to answer the question of how much the ground moved (subsided) as a result of mining. Shown is the final subsidence along profile A measured by survey and predicted by the Bureau's model (1). The survey values represent the difference between the initial measurements made before mining began and the final measurements made after the ground appeared to stabilize. Specifically, the positional data for profile A acquired in survey 1 were subtracted from the data in survey 12.

o
tJ -I z w o [3 -2
ill -3
• • • •
• •• •
• •
• •
KEY Predictions
••• ••
--- ---5.26 ft of cool extracted
--6.14 ft of coal extracted
~L-L-~~~~-L-L-L-L~~~~L-~~~~ -900 -600 -300 0 300 900
DISTANCE FROM CENTERLINE, ft
Figure 9_-Flnal subsidence measured by ground and photogram metric surveys and predicted values optimized for maximum subsidence.
The total error for any point is the sum of the errors for two surveys. The predicted values account for the overburden at each monument and were optimized by adjusting the estimate of coal extracted to produce curves that would approximately pass through the three points from each survey nearest the centerline of the panel. No attempt was made to correct the data using contemporary subsidence theory but a simple analysis can be made. Note that while the mine reported a 6-ft (2-m) nominal thickness of coal removed, it took an estimate of 6.14 ft (1.87 m) to fit a prediction curve to the ground survey data and 5.26 ft (1.60 m) to fit the photogrammetric data. The nominal thickness would have produced a curve somewhat between the two.
A casual glance at figure 9 indicates that the photogrammetric values seem to have more fluctuation
11
than the ground values and may be too high. Recall that the average photogrammetric measurement was 0.15 to 0.25 ft (45 to 76 mm) higher than the average ground measurement. The outermost points on the profile are too far away from the edge of the panel to have been affected to the extent shown on the left side of the profile. Neither heave nor subsidence greater than a few hundredths of a foot was anticipated.
It should be noted that the leftmost point of profile A is only 200 ft (61 m) short of the base line of panel 1 and the ground survey initialization in that area took place about a month earlier than the photogrammetl'ic initialization. Perhaps some subsidence due to panel 1 took place after the ground survey initialization of panel 2 but before the photogrammetric initialization. In that case, the final subsidence measured by ground survey in that area would include all movement that could be detected by photogrammetry plus movement due to a small portion of the subsidence from panel 1. If this in fact did happen, it would only have a minimal effect on the difference in position analysis for the first survey, a much smaller effect on the analyses of the combined data, and no effect on any of the other survey analyses. The additional subsidence indicated by ground survey compared to the predicted values is probably because of the chain pillar effect recently described by Jeran and Adamek (3).
The graph in figure 9 is only one of many subsidence profile curves produced in this study. Subsidence theory indicates that points along a profile should form a smooth curve of predictable shape. In general, the ground surveying data in this study produced smoother curves than the aerial surveying data. In other words, aerial surveying data along most of the profile curves showed more fluctuation than their paired data sets from ground surveying.
DISCUSSION
The measurements obtained from each of the two sUt'veying methods were assumed to be equally valid in all cases. The statistics in this study, therefore, do not address the question of accuracy but are nevertheless interesting in light of the ambiguous but commonly heard elevation accuracy claim of 0.2 ft (60 mm) for photogrammetry. The difference in position measurements between photogrammetric and conventional ground surveying methods ranged from a minimum of -2.38 ft (-725 mm) to a maximum of 2.32 ft (707 mm). While outside the scope of this study, a close analysis of these extreme values using subsidence theory and common sense would probably show that these values were actually erroneous readings of one sort or another involving one or both of the surveying methods.
It is definitely worthwhile to include photogrammetry in the study of a subsidence site. The total condition of the ground surface is instantly recorded and can be analyzed
and reanalyzed at any time in the future to check a suspected measurement or to evaluate features that were not previously considered important. Photogrammetry is recommended in inaccessible areas and when properly mixed with conventional ground surveys. Before and after photographs are highly recommended. These photographs can easily delineate the total subsidence area, pointing out buildings and other structures that mayor may not have been influenced by mining. Surveys after the fact are not sufficient to establish the cause of structure damage.
Photogrammetry cannot, in general, be recommended as the only surveying method used at a study site. The fluctuation in photogrammetric data between adjacent points along a subsidence profile curve tend to be large. Curve smoothing techniques can be used to adjust the data to agree with expectations of current subsidence theory but the data might then be considered too biased for use in building newer and better empirical models for

, \1
"
I', I:
I'
12
predicting future subsidence. However, the subsidence proftle curves shown in figure 9 lead to some interesting speculation. It is entirely possible that in the future much reliance will be placed on predictive models substantiated by photogrammetry.
The results and conclusions of this report should be interpreted in light of the prerequisites and requirements for research oriented surveying. Applications to surveying for other purposes depends on the total set of individual needs and circumstances. However, the results of the
statistical analysis shows that, under the dynamic conditions of an active longwall, the mean of the differences between 372 matched pairs of elevation measurements from photogrammetric and conventional ground surveys was 0.20 ft (61 mm) with a 95-pct-confidence interval of 0.05 ft (15 mm), the mean of the absolute values of the differences was 0.38 ft (116 mm) with a 95-pct-confidence interval of 0.04 ft (12 mm), and 95 pct of the absolute values of the differences were less than 1.11 ft (338 m).
REFERENCES
1. Adamek, V., and P. W. Jeran. Precalculation of Subsidence Over Longwall Panels in the Northern Appalachian Coal Region. Paper in Mine Subsidence Control. Proceedings: ,Bureau of Mines Technology Transfer Seminar, Pittsburgh, PA, September 19, 1985, compo by Staff, Bureau of Mines. BuMines IC 9042, 1985, pp. 34-56.
2. Avery, T. E. Interpretation of Aerial Photographs. Burgess Publ. Co., 3d ed., 1977, 392 pp.
3. Jeran, P. W., and V. Adamek. Subsidence Over Chain Pillars. Paper in Eastern Coal Mine Geomechanies. Proeeedings: Bureau of Mines Technology Transfer Seminar, Pittsburgh, PA, November 19, 1986, compo by Staff, Bureau of Mines. BuMines IC 9137, 1986, pp. 65-71.
4. Jeran, P. W., and T. M. Barton. Comparison of Two Different Longwall Panels. Paper in Mine Subsidence Control. Proceedings: Bureau of Mines Technology Transfer Seminar, Pittsburgh, PA, September 19, 1985, compo by Staff, Bureau of Mines. BuMines IC 9042, 1985, pp. 25-33.
5. Krantz, G. W., and J. C. LaScola. Longwall Mine Subsidence Sllrveying-An Engineering Technology Comparison. Paper in Mine Subsidence Control. Proceedings: Bureau of Mines Technology Transfer Seminar, Pittsburgh, PA, September 19, 1985, compo by Staff, Bureau of Mines. BuMines IC 9042, 1985, pp. 2-12.
6. LaScola, J. C., and D. M. Hyman. Imposing Hierarchical Data Structures on Commercial Software for Mining Applications. Ch. 7
~ U.S. GOVERNMENT PRINTING OFFICE: 611-012/00,029
of SME-AIME Proceedings of the Second Conference on the Use of Computers in the Coal Indllstry, Tuscaloosa, AL, Apri115-17, 1985, ed. by 1:. Novak, R. L. Sanford, and Y. J. Wang. Soc. Min. Eng. AIME, 1985, pp. 49-55.
7. Moebs, N. N., and T. M. Barton. Short-Term Effects on Longwall Mining on Shallow Water Sources. Paper in Mine Subsidence Control. Proceedings: Bureau of Mines Technology Transfer Seminar, Pittsburgh, PA, September 19, 1985, compo by Staff, Bureau of Mines. BuMines IC 9042, 1985, pp. 13-24.
8. Staley, W. W. Introduction to Mine Surveying. Stanford Unlv. Press, 2d ed., 1964, 303 pp.
9. Trevits, M. A., R. L. King, and B. V, Johnson. Overview of the Bureau of Mines Subsidence Research Program. Paper in Proceedings of 88th Annual General Meeting of the Canadian Institute of Mining and Metallurgy, Montreal, Canada, May 11·15, 1986, Paper 86, 1986, 14 pp.
10. Walker, J. S., J. B. Green, and M. A. Trevits. A Case Study of Water Level Fluctuations Over a Series of LongwaU Panels in the Nor. thern Appalachian Coal Region. Paper in Proceed! 2d Workshop on Surface Subsidence Due to Underground Mining, town, WV, June 9·11,1986, ed. byS. S. Pengo WV Unlv., pp. 264-269.
11. Walker, J. S., and J. C. LaScola. Foundation Response to Subsidence-Induced Ground Movements: A Case Study. BuMines RI 9224, 1989 (In Press).
INT.-BU.OF MINES,PGH.,PA. 28833