comparison of downwind sailing performance predicted from ... · comparison of downwind sailing...
TRANSCRIPT

HISWA International Symposium 2014
Ian Campbell, Emeritus Fellow, Wolfson Unit MTIA
1
COMPARISON OF DOWNWIND SAILING PERFORMANCE PREDICTED FROM WIND
TUNNEL TESTS WITH FULL-SCALE TRIALS FROM AMERICA’S CUP CLASS YACHTS
I M C Campbell, Wolfson Unit MTIA, UK
SUMMARY
This paper compares of wind tunnel sail data with full-scale performance, using trials data gained during the 32nd America’s
Cup event. VPP calculations were made using sail coefficients obtained from the wind tunnel and sailing speeds and angles
were compared with measurements of the ACC yachts’ performance. Causes for the differences that were found are discussed
and relate to both the modeling and difficulties with trials measurements.
Data is also presented showing the differences between different sail shapes and sizes, which is a matter of interest to designers
when developing sails. The differences found between wind tunnel results and sailing trials are discussed.
1. INTRODUCTION
The 32nd held in Valencia in 2007 was an extraordinary event in that teams could build two America’s Cup Class (ACC)
Yachts without constraints on development time from the Cup Protocol. Although this class has been superseded by multihulls
much of the data obtained remains unpublished although it is valid for other monohull yachts and for validation of experimental
and numerical modeling methods.
By kind permission from Luna Rossa Challenge some of the wind tunnel downwind sail data was published at the INNOVSail
2013 conference, Campbell (2013), for the purpose of comparing tests from different wind tunnels to help validate the use of
wind tunnels for testing of sails.
The aim of this paper is to extend the work to the comparison of wind tunnel sail data with full-scale performance, using trials
data gained during the 32nd America’s Cup event. This data was measured and analysed by the performance team at the time of
the event but has been re-examined for this paper for comparison with VPP calculations made using the wind tunnel data.
Two questions can be posed:
Do wind tunnel tests produce sail forces representative of full-scale sailing?
And can wind tunnel tests distinguish the performance differences between different sail designs?
Other direct methods have been used to address the scaling question, e.g. by measuring sail forces on a boat, Masuyama, (2013);
or comparing sail shapes, Mausolf et al. (2011); or comparing pressures, Motta et al. (2013). By comparison performance
measurement is an indirect method since sail forces are compared with speed predictions based on hydrodynamic forces.
Nevertheless hydrodynamic forces can be predicted with reasonable accuracy and all the methods are subject to the problems of
wind measurements in the real environment.
Comparison between sails is of particular interest to designers and sailors, since competition provides the incentive to find a
faster sail. Numerical modeling for performance e.g. using RANSE CFD, as distinct from just inflating mould shapes to predict
flying shapes using panel codes, is now available to sail designers, Wright (2010). Whilst CFD modeling of the flow may differ
from that in the wind tunnel there remains the common issue that the flying shape is under the sailors’ control and the sail forces
vary with the flying shape. The flying shape is adjusted in the wind tunnel to optimise sail forces but although Luna Rossa
Challenge used the Sail Vision on-board system shape matching of downwind sails proved difficult.
2. LUNA ROSSA CHALLENGE FOR 32ND
AMERICAS CUP
The challenge was launched through the Yacht Club Italiano, the oldest sailing club in the Mediterranean, established in 1879 in
Genoa, Italy. The two partners in Luna Rossa Challenge 2007 were the Prada Group and the Telecom Italia Group.
In February 2004, the Luna Rossa team was the first to set up its base in Valencia, where it started training in May with ITA 74,
the yacht which had raced in the semi-finals of the Louis Vuitton Cup for the 31st America’s Cup in New Zealand, and ITA 80, a
similar design.

HISWA International Symposium 2014
Ian Campbell, Emeritus Fellow, Wolfson Unit MTIA
2
The team Luna Rossa Challenge 2007 (sailing team, design team, shore team, weather team, performance team, boat builders,
sail loft, logistics, administration and management) included about 110 people from 18 different countries. At the time this
organization was larger than the School of Engineering Sciences at the University of Southampton where the author worked.
However the competition was immense with 11 challengers, having varying resources, seeking to race the Cup Defender
Alinghi and with racing in different “Acts”, in house 2-boat tuning and informal match racing.
The Cup Protocol permitted each team to build two new America’s Cup Class yachts and the Luna Rossa Challenge launched
ITA 86 in 2006 and ITA 94 in 2007, with Miuccia Prada being godmother. Considerable research and development went into
the design of these yachts and the author was involved in the experimental work in the towing tank, the wind tunnel and on the
water.
Sadly for Luna Rossa Challenge they were beaten in the Finals of the Louis Vuitton Cup by Emirates Team New Zealand, who
then lost in the races for the America’s Cup to the Defender Alinghi. The subsequent 33rd and 34th America’s Cups were raced
by fewer challengers in multihulls so the pinnacle of development of the match racing displacement monohull remains the
defender Alinghi’s SUI 100 from 2007.
Figure 1 Luna Rossa racing Emirates Team New Zealand

HISWA International Symposium 2014
Ian Campbell, Emeritus Fellow, Wolfson Unit MTIA
3
3. WIND TUNNEL TESTS
The new wind tunnel (galleria del vento) became available at the Politecnico di Milano in 2004 and Luna Rossa Challenge
conducted 12 weeks of upwind and downwind sail testing during the 3-year campaign for the 32nd America’s Cup. The data in
this paper comes from the 8th session conducted in February 2006 and represents the development phase for the downwind sails
but not their final configuration used in the Louis Vuitton Cup. A total of 175 measurement runs were taken on 10 different
asymmetric downwind sails during this session.
3.1 Wind tunnel
The Politecnico di Milano wind tunnel had a closed circuit, with a bank of fourteen fans driving the air through the final bend
into the large 14m x 4m low speed section. The tunnel floor was smooth, with a 35m long section, which allowed the boundary
layer to grow to a thickness of approximately 300mm. There were consistent lateral and vertical variations in flow speed across
the location of the model. These were associated with the flow pattern from the individual fans and amounted to an rms
variation in pitot pressure of approximately 5%. The tunnel had a high speed section on the return circuit below the low speed
section with a contraction ratio of approximately 3:1, which helped produce a relatively uniform speed in this smaller section.
So to avoid the problems with the flow variations and effects from the presence of the model the mean flow speed was taken
from measurements in the high speed section. Campbell (2013).
The tests were conducted with a twisted flow device, Zasso et al. (2005), using a true wind gradient measured in Valencia for
the prevailing sea breezes. The gradient was curve fitted by a power law of between 1/20 and 1/30, which was considerably
lower than the conventional 1/7 or 1/10 curves. The twist between the centre of effort and mast head was approximately 3
degrees and between the centre of effort and the boom approximately 5 degrees. The apparent wind angles in the wind tunnel
tests were referenced to the centre of effort not the mast head.
3.2 Model parameters
The model particulars were:
Scale 1:12.5
Reference length 1500mm model scale, 18.75m full-scale
Reference mast height above DWL 2698mm model scale, 33.725m full-scale
Reference distance of dynamometer centre from tunnel floor 40mm model scale – for centre of effort height
calculations, which have not been corrected for this distance, so needs to be added in any VPP calculations.
Test wind speeds associated with nominal dynamic pressures of q = 2.91Pa, approximately 2.2 m/s, which was similar to full-
scale apparent wind speeds. This speed was selected to give representative flying shapes using the scaling criteria of the ratio of
wind pressure to sail cloth weight.
The model was mounted over a 6-component strain gauged balance with a small gap between its topsides and the floor of the
tunnel. The floor was a large turntable that could be rotated to present the model at different apparent angles to the wind.
The model was fitted with remotely operable sail winches with cables led to the control room where the data acquisition system
was also sited. The winches allowed adjustments to be made to; gennaker/spinnaker pole height and angle, gennaker sheet,
main sheet and main vang, as can be seen in Figure 2. Other adjustments were made manually before the start of a test
sequence.
3.3 Test sails
The sails were designed by Luna Rossa’s sail team using North Sails’ Flow-Membrane software. The model downwind sails
were built by Guido Cavalazzi, one of the designers who enjoyed building sails, from the panels derived from the design mould
shapes in similar manner to their full-scale construction. The model mainsails were built over a mould in a similar way to their
full-scale construction with North Sails’ 3DL method.
The sails referred to in this paper are listed in Table 1. The downwind sail type used for racing varied according to the true wind
speed, mainly due to the different apparent wind angles associated with optimum downwind speed, as discussed later in this
paper. The asymmetric gennakers have the prefix A in their code and the symmetrical spinnaker has the prefix S. Different
methods of gybing applied to the asymmetrics and spinnaker, with operational advantages in different wind conditions that
affected sail selection when racing.

HISWA International Symposium 2014
Ian Campbell, Emeritus Fellow, Wolfson Unit MTIA
4
Each new sail design was allocated a sequential letter and the sails referred to in this paper represent the best designs at the time
of the tests together with the design of the original gennaker A3v5 and spinnaker S1. It should be noted that the America’s Cup
Class rule was revised to version 5 for the 32nd Cup, with an increase in the downwind sail area so new sail designs were
developed at the start of the campaign.
Table 1 Sail dimensions
Model Full-scale
Wind Sail Code SLU SLE SF Head Area Area
condition type m m m m m2 m
2
Light asymmetric A1-D 34.50 31.66 18.50 0.05 3.03 473
Medium asymmetric A2-F 35.00 31.80 18.42 0.05 3.46 541
Strong asymmetric A3-I 34.40 30.04 19.15 0.05 3.40 531
Strong Original A3v5 3.45 539
Strong Spinnaker S1 3.46 541
Light mainsail M1B 1.36 212.5
Medium mainsail M2A 1.36 212.5

HISWA International Symposium 2014
Ian Campbell, Emeritus Fellow, Wolfson Unit MTIA
5
Figure 2 Images of the A2 gennaker under test at different apparent wind angles

HISWA International Symposium 2014
Ian Campbell, Emeritus Fellow, Wolfson Unit MTIA
6
3.4 Test method
The data was measured from the SF dynamometer using the Wolfson Unit Lasso system, which gave a real time display of the
sail forces and was used as an aid to trimming the sails to produce the maximum driving force. The data files were analysed
subsequently using the Wolfson Unit’s WindCorrect program according to the process described in 3.6.
Each sail was tested over an appropriate range of apparent wind angles and the driving forces can be compared in Figure 3.
Target driving forces had been obtained from previous test sessions so the sails were adjusted using the remote winches until
forces were close to the target. This process could take approximately 5 to 10 minutes and data was then acquired over a period
of approximately 1 minute to produce the average sail forces, moments and wind speed. Adjustments were then made in
attempts to improve the driving force using the remote controls and real time force display, with acquisitions for mean values at
promising settings. This process was repeated a few times within a 10 to 15 minute period before the wind was turned off to
check for any zero drift in the dynamometer. Sail trimmers from the team were involved in some of the test sessions to share
knowledge about sail settings.
Optimum sail settings of the A2 gennaker are shown in Figure 2, which can be compared with the boat racing in Figure 1, and it
can be seen that the spinnaker pole was brought progressively aft as the apparent wind angle increased, bringing more of the
gennaker in-line with the bow of the boat. However it can be seen from the fixed overhead camera image that the sail geometry
remained similar relative to the apparent wind, with the boat appearing rotated under the sails.
At most angles the drive force could be increased without increasing the heeling moment and it can be seen that in many
instances the maximum drive force was achieved at lower values than the maximum heeling moment. Thus the sail trim for
maximum drive would produce the best boat speed.
If there were significant increases in heeling moment and heel force this might affect boat speed, due to related hydrodynamic
changes in heel and induce drag, but this is only a potential issue with data from tests at 45 degrees apparent wind angle and can
be resolved by VPP calculations through the optimisation of speed using the flat function, which reduces the maximum lift and
drag with associated changes in driving and heeling forces.
The hydrodynamic characteristics of ACC yacht hulls were for their resistance to be lower at 20 degrees heel than when upright,
due to their bow and stern overhangs increasing waterline length when heeled. As can be seen from Figure 14 the yachts tended
to sail downwind slightly heeled so the wind tunnel model was tested at 5 degrees heel to represent any flow effect over the sails
although at this angle the hull resistance was similar to when upright.
3.5 Windage tests
The windage of the hull and rig was measured without sails and the data was fitted to the VPP windage model, which resulted in
drag areas of Ax = 9.5m2 and Ay = 50m2. These data were subtracted from the measurements to derive the sail coefficients, so
the VPP calculation included separately the windage and the sail coefficients.
The windage was added back for comparison of the VPP fit with the corrected driving forces and heel moments. The windage
has a comparatively small effect on downwind performance since at an apparent wind angle of 90 degrees the hull generates
very little lift to augment the driving force and the drag only affects the heel, which is small.
3.6 Sail coefficients
The measured sail forces and moments were corrected to sail coefficients and centre of effort locations by:
Correcting for wind off end zeros, following each set of runs.
Transforming the force data into the wind axes in the heeled plane using the IMS velocity vector method, which was a
relatively small change for the 5 degree heel used for the downwind tests.
Subtracting the windage values, which are given in 3.5.
Calculating lift and drag coefficients based on the total sail area and dynamic pressure from the reference pitot.
Correcting the coefficients for wall boundary effects and wake blockage effects, taking due account of the induced drag
due to lift in determining the separated flow for the wake blockage correction.
Recalculating the force and moment coefficients in the upright condition at the nominal apparent wind angle and
comparing the results from the VPP fit.

HISWA International Symposium 2014
Ian Campbell, Emeritus Fellow, Wolfson Unit MTIA
7
The notation on the figures gives for each series the heel angle and apparent wind angle in the horizontal plane, as set on the
turntable, i.e. not corrected to the heel plane.
3.7 Sail data
Test results for the basic sail force measurements on the downwind asymmetric gennakers are shown in Figure 3. There is a
group of results for each sail that represents different attempts to optimise the trim for maximum drive force and it can be seen
that these span approximately 5% at each apparent wind angle, which represents the scope available to the skill of good sail
trimmers.
Lift and drag sail coefficients are related to the driving forces and heeling moments and these are shown in Figure 4 and Figure
5. Spline curves were fitted to these coefficients for VPP calculations and the associated VPP curve fit is shown in Figure 3. It
can be seen that this fit is matched below the maximum values of driving force from each group of measurements, which was
chosen to predict speeds when sailing with off-optimum sail trim.
-5 0 5 10 15 200.4
0.5
0.6
0.7
0.8
0.9
1.0
1.1
1.2
1. M1B+ A1D-Ba45
1. M1B+ A1D-Ba60
4. M1B+ A2F-Ba60
4. M1B+ A2F-Ba75
4. M1B+ A2F-Ba90
8. M1B+ A3I-Ba60
8. M1B+ A3I-Ba75
8. M1B+ A3I-Ba90
8. M1B+ A3I-Ba105
8. M1B+ A3I-Ba120
VPP fit for 1. M1B+ A1D
VPP fit for 4. M1B+ A2F
VPP fit for 8. M1B+ A3I
W OLFS ON U N ITFOR M A RIN E TECH N OLOGY A N D IN D U S TRIA L A EROD Y N A M ICS
Variation of corrected driving force with heeling momentfrom tests at 5 degrees heel angleMain M1B with A1, A2 and A3 sails
FIGURE 2
Heel moment at unit wind pressure - kN.m
Drivin
g f
orc
e a
t u
nit w
ind
pre
ssu
re -
kN
Figure 3 Variation of driving force with heel moment
The data in Figure 3 represents the better sails tested at that time, i.e. A1D, A2F and A3I. The A1-D sail had slightly lower
area than the other two asymmetric sails and produced lower forces.
It can be seen from Figure 4 that the lift coefficients were relatively similar for all the sail types between apparent wind angles
of 75 to 120 degrees but the A1 sail produced higher lift coefficients at angles of 45 and 60 degrees. The America’s Cup Class
benefitted in downwind sailing from the allowance of a pole as distinct from a bowsprit used in many sports boat classes. This
enabled the gennaker sail luff to be orientated to an optimum angle to the wind at each apparent wind angle with the mainsail

HISWA International Symposium 2014
Ian Campbell, Emeritus Fellow, Wolfson Unit MTIA
8
accordingly adjusted. The sail geometry therefore remained similar relative to the wind, whilst being different relative to the
boat, which accords with the relatively small variation of lift coefficient with apparent wind angle.
The drag coefficients, shown in Figure 5, tended to increase with apparent wind angle and were lower with the A2 gennaker
compared to the A3. The relative location of the mainsail to the gennaker changed with apparent wind angle, being most closely
coupled with the A1 gennaker at an apparent wind angle of 45 degrees. This geometric difference could relate to the higher lift
coefficients produced by the A1 gennaker and the higher drag coefficients produced by the A3 gennaker but the drag also
contributed to the driving force at apparent wind angles of greater than 90 degrees so it is possible that the sails were trimmed to
produce more drag at these angles.
40 60 80 100 120 1401.0
1.2
1.4
1.6
1.8
1. M1B+ A1D-Ba45
1. M1B+ A1D-Ba60
4. M1B+ A2F-Ba60
4. M1B+ A2F-Ba75
4. M1B+ A2F-Ba90
8. M1B+ A3I-Ba60
8. M1B+ A3I-Ba75
8. M1B+ A3I-Ba90
8. M1B+ A3I-Ba105
8. M1B+ A3I-Ba120
VPP fit for 1. M1B+ A1D
VPP fit for 4. M1B+ A2F
VPP fit for 8. M1B+ A3I
W OLFS ON U N ITFOR M A RIN E TECH N OLOGY A N D IN D U S TRIA L A EROD Y N A M ICS
Variation of lift coefficient with apparent wind angle in heeled planefrom tests at 5 degrees heel angleMainsail M1B with all A-sails tested
FIGURE 3
Apparent wind angle - ßa (deg)in heeled plane
Lift
co
eff
icie
nt
- C
l
Figure 4 Variation of lift coefficient with apparent wind angle
40 60 80 100 120 1400.4
0.6
0.8
1.0
1.2
1. M1B+ A1D-Ba45
1. M1B+ A1D-Ba60
4. M1B+ A2F-Ba60
4. M1B+ A2F-Ba75
4. M1B+ A2F-Ba90
8. M1B+ A3I-Ba60
8. M1B+ A3I-Ba75
8. M1B+ A3I-Ba90
8. M1B+ A3I-Ba105
8. M1B+ A3I-Ba120
VPP fit for 1. M1B+ A1D
VPP fit for 4. M1B+ A2F
VPP fit for 8. M1B+ A3I
W OLFS ON U N ITFOR M A RIN E TECH N OLOGY A N D IN D U S TRIA L A EROD Y N A M ICS
Variation of drag coefficient with apparent wind angle in heeled planefrom tests at 5 degrees heel angleMainsail M1B with all A-sails tested
FIGURE 4
Apparent wind angle - ßa (deg)in heeled plane
Dra
g c
oe
ffic
ien
t -
Cd
Figure 5 Variation of drag coefficient with apparent wind angle

HISWA International Symposium 2014
Ian Campbell, Emeritus Fellow, Wolfson Unit MTIA
9
The VPP fits were adjusted to lower values of lift outside the test data ranges to promote the VPP to iterate to values within the
test range.
The centre of effort heights associated with the heeling moments are shown in Figure 6. These have been plotted on a different
axis to the lift and drag coefficients to show the influence of heel force. The heeling moment is low at low values of heel force
so has little influence on the hull hydrodynamics and sailing performance. The centre of effort height has been obtained from
the transverse force to match how the VPP calculates heel equilibrium; however the longitudinal driving forces and pitch
moments are considerably higher for downwind sailing at apparent wind angles of 90 degrees and would provide an alternative
centre of effort height since the reason for the lower centre of effort height at low heel force is unclear.
0.0 0.4 0.8 1.2 1.630
35
40
45
50
55
60
1. M1B+ A1D-Ba45
1. M1B+ A1D-Ba60
4. M1B+ A2F-Ba60
4. M1B+ A2F-Ba75
4. M1B+ A2F-Ba90
8. M1B+ A3I-Ba60
8. M1B+ A3I-Ba75
8. M1B+ A3I-Ba90
8. M1B+ A3I-Ba105
8. M1B+ A3I-Ba120
W OLFS ON U N ITFOR M A RIN E TECH N OLOGY A N D IN D U S TRIA L A EROD Y N A M ICS
FIGURE 6
Variation of centre of effort height with heel force coefficient in heeled planefrom tests at 5 degrees heel angleMain M1B with all A-sails
Heel force coefficient - Ch
Ce
h (
%o
f m
ast
he
igh
t a
bo
ve
WL
)
Figure 6 Variation of centre of effort height with heel force coefficient
The wind tunnel was used to compare different sail designs and a large number of shapes were tested, as indicated by the sail
code letters. It is therefore of interest to compare sails with significantly different shapes to determine the level of
discrimination that can be provided in wind tunnel tests and examples are shown in Figure 7.
The 2006 design of the A3-I gennaker produced approximately 5% more driving force at apparent wind angles of 105 and 120
degrees than the original A3v5 gennaker design from 2005 and similar driving force but at a lower heeling moment at an
apparent wind angle of 90 degrees. These are clear differences despite the 5% variations in driving force found during the sail
tuning process. The differences found between other sail shapes were, however, smaller but although the designs had different
mould shapes their flying shapes were adjusted to produce the best sail forces and may have been similar.
It is also clear that the asymmetric gennakers produced significantly higher driving forces than the symmetrical spinnaker, of up
to 15% at the larger apparent wind angles of 120 and 135 degrees.

HISWA International Symposium 2014
Ian Campbell, Emeritus Fellow, Wolfson Unit MTIA
10
-5 0 5 10 15 200.4
0.5
0.6
0.7
0.8
0.9
1.0
1.1
1.2
8. M1B+ A3I-Ba60
8. M1B+ A3I-Ba75
8. M1B+ A3I-Ba90
8. M1B+ A3I-Ba105
8. M1B+ A3I-Ba120
VPP fit for 8. M1B+ A3I
M2A+A3v5Ba75
M2A+A3v5Ba90
M2A+A3v5Ba105
M2A+A3v5Ba120
M2A+S1v5Ba90
M2A+S1v5Ba105
M2A+S1v5Ba120
M2A+S1v5Ba135
W OLFS ON U N ITFOR M A RIN E TECH N OLOGY A N D IN D U S TRIA L A EROD Y N A M ICS
Variation of corrected driving force with heeling momentfrom tests at 5 degrees heel angleMain M1B with A1, A2 and A3 sails
FIGURE 2
Heel moment at unit wind pressure - kN.m
Drivin
g f
orc
e a
t u
nit w
ind
pre
ssu
re -
kN
Figure 7 Variation of driving force with heel moment for Spinnaker and Gennakers
4. VPP CALCULATIONS
VPP calculations were performed using the WinDesign WD4 software package developed by Yacht Research International and
the Wolfson Unit MTIA, Oliver and Robinson (2008). This program had the facility to input experimental hydrodynamic data
for the hull and aerodynamic data for the sails.
The hydrodynamic data for the hull was obtained from tank tests on a 1:3 scale model. This data currently remains confidential
to the Luna Rossa Challenge however other generic data on America’s Cup Class yachts has been published, e.g. Viola et al.
(2012) The hydrodynamic characteristics for downwind performance prediction are, however, relatively simple compared to
upwind predictions because downwind heel angles are small so heel and induced drag components are also small compared to
the upright resistance characteristics of the hull, which dominate the speed calculations.
The VPP essentially iterates to a force balance between the hull drag and the sail driving force at wind speeds and angles that
also match the wind vector triangle shown in Figure 8 using the geometric Equation 1. The VPP calculations take account of
the variation of driving force with apparent wind angle shown in Figure 3. The result for downwind sailing always occurs with
the maximum sail force coefficient and, unlike in upwind sailing performance prediction, the flattening and reefing functions are
not required so the optimization element of the VPP calculations is also not required.

HISWA International Symposium 2014
Ian Campbell, Emeritus Fellow, Wolfson Unit MTIA
11
150°120°60°
Vaw=0.58Vtw
Vaw
Vs=1.15Vtw
Vtw
Vs=0.58Vtw
twawaw
Figure 8 Wind vector triangle for downwind sailing
Equation 1 relating true and apparent wind speeds and angles
The aerodynamic characteristics for the sails were obtained from the wind tunnel tests and the inputs required for the VPP were
straightforward, being the variation with apparent wind angle of lift and drag coefficients, as shown in Figure 4 and Figure 5 and
centre of effort height, shown in Figure 6. The variation of drag with lift was obtained in the VPP calculations from an input of
the effective rig height and an associated variation of centre of effort height with lift was also an input. However because the
heel angles associated with downwind sailing were small and also the apparent wind angles were large reducing drag had little
effect on driving force and the maximum lift produced the fastest speeds. Therefore the effective rig height and variation in
centre of effort height did not affect the performance predictions.
A set of lift and drag coefficients were provided as inputs to the VPP for each downwind sail in combination with the mainsail.
That is separate coefficients were not produced for asymmetric gennaker and mainsail as is the case when the VPP calculates
sail forces from sail dimensions using generic data held within the program. The range of true wind speeds and angles
associated with each sail was specified, which ensured that the VPP calculations were based on the same sail selection that was
used by the sailors on the boats.
As described in paragraph 3.7 the sail coefficients were set slightly lower than the maximum values obtained from the wind
tunnel tests. This was to allow for the sail trimming on the boats to be below optimum since the sailors did not have the benefit
of sail force measurements that were available in the wind tunnel. However, to investigate sensitivity, VPP calculations were
also performed with a 5% increase in lift coefficient and an associated increase in induced drag. These results are also shown in
the performance comparisons given in Section 6 of this paper.
The VPP output is normally given as the speed polars, Figure 9, showing the variation of boat speed with true wind angle for
Figure 3 increments of true wind speed. The polars provide a good visual indication of the true wind angles for optimum speed
made good downwind and these are marked by square symbols in Figure 9.

HISWA International Symposium 2014
Ian Campbell, Emeritus Fellow, Wolfson Unit MTIA
12
TH48 G2M1 +1deg 0
10/09/14 12:59:24 Wind values at masthead height.C:\Documents and Settings\imc\My Documents\Luna Rossa\Bovisa WT\X8 Feb06\VPP\TH48 G2M1 +1deg 0.98Cl Ceh RAW_3.vpp
10 20 30 40 5060
70
80
90
100
110
120
130
140
150
160
170
2
4
6
8
10
12
14
16
18
4 6 8 10 12 14 16
2
4
6
820
20
Figure 9 VPP polar speeds downwind
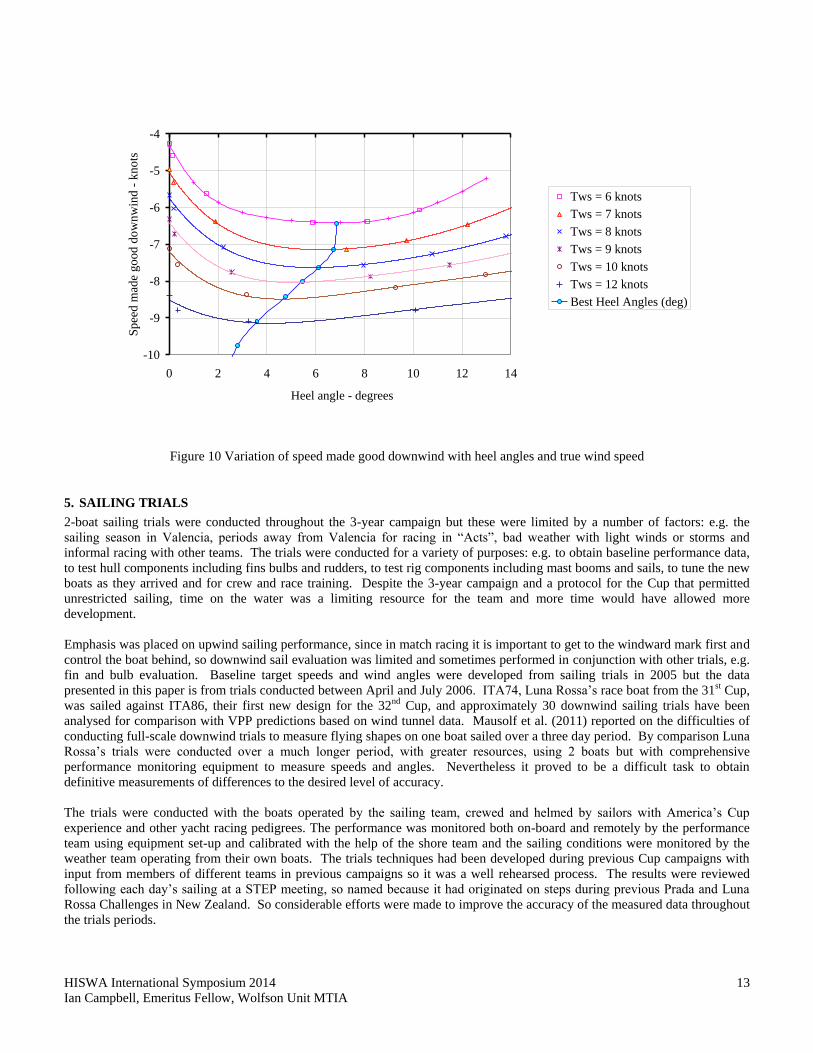
There are, however, other parameters in the VPP output including apparent wind speeds and angles and heel angle, which is
important for upwind sailing but is also an indicator of apparent wind angle for sailing downwind. In Figure 10 the speed made
good downwind is shown plotted against heel angle for fixed true wind speeds to show both the optimum heel angle and the loss
in speed when not at optimum heel. It can be seen that the optimum heel tends to reduce with increasing wind speed but the
speed loss is great at heel angles less than optimum than at greater heel angles.
HISWA International Symposium 2014
Ian Campbell, Emeritus Fellow, Wolfson Unit MTIA
13
-10
-9
-8
-7
-6
-5
-4
0 2 4 6 8 10 12 14
Heel angle - degrees
Sp
eed m
ade
go
od
do
wn
win
d -
kn
ots
Tws = 6 knots
Tws = 7 knots
Tws = 8 knots
Tws = 9 knots
Tws = 10 knots
Tws = 12 knots
Best Heel Angles (deg)
Figure 10 Variation of speed made good downwind with heel angles and true wind speed
5. SAILING TRIALS
2-boat sailing trials were conducted throughout the 3-year campaign but these were limited by a number of factors: e.g. the
sailing season in Valencia, periods away from Valencia for racing in “Acts”, bad weather with light winds or storms and
informal racing with other teams. The trials were conducted for a variety of purposes: e.g. to obtain baseline performance data,
to test hull components including fins bulbs and rudders, to test rig components including mast booms and sails, to tune the new
boats as they arrived and for crew and race training. Despite the 3-year campaign and a protocol for the Cup that permitted
unrestricted sailing, time on the water was a limiting resource for the team and more time would have allowed more
development.
Emphasis was placed on upwind sailing performance, since in match racing it is important to get to the windward mark first and
control the boat behind, so downwind sail evaluation was limited and sometimes performed in conjunction with other trials, e.g.
fin and bulb evaluation. Baseline target speeds and wind angles were developed from sailing trials in 2005 but the data
presented in this paper is from trials conducted between April and July 2006. ITA74, Luna Rossa’s race boat from the 31st Cup,
was sailed against ITA86, their first new design for the 32nd Cup, and approximately 30 downwind sailing trials have been
analysed for comparison with VPP predictions based on wind tunnel data. Mausolf et al. (2011) reported on the difficulties of
conducting full-scale downwind trials to measure flying shapes on one boat sailed over a three day period. By comparison Luna
Rossa’s trials were conducted over a much longer period, with greater resources, using 2 boats but with comprehensive
performance monitoring equipment to measure speeds and angles. Nevertheless it proved to be a difficult task to obtain
definitive measurements of differences to the desired level of accuracy.
The trials were conducted with the boats operated by the sailing team, crewed and helmed by sailors with America’s Cup
experience and other yacht racing pedigrees. The performance was monitored both on-board and remotely by the performance
team using equipment set-up and calibrated with the help of the shore team and the sailing conditions were monitored by the
weather team operating from their own boats. The trials techniques had been developed during previous Cup campaigns with
input from members of different teams in previous campaigns so it was a well rehearsed process. The results were reviewed
following each day’s sailing at a STEP meeting, so named because it had originated on steps during previous Prada and Luna
Rossa Challenges in New Zealand. So considerable efforts were made to improve the accuracy of the measured data throughout
the trials periods.

HISWA International Symposium 2014
Ian Campbell, Emeritus Fellow, Wolfson Unit MTIA
14
The trials process involved setting the two boats off on parallel courses for a 6 to 8 minute period, with the crews concentrating
to obtain the best relative performance from each of the boats. Measurements of speeds, angles and distances were averaged
over this period. The two boats would then swop sides and the trials repeated then, when time and position on the course
permitted, the boats would gybe and the trials repeated with the wind on their opposite side giving four separate measurements
of sailing performance for each configuration of the boat.
Corrections were applied to the trials measurements to improve their consistency. Wind measurements from the mast head
instruments presented particular difficulties for downwind sailing due to; the proximity of the masthead gennaker, the boat’s
motions, twist in the apparent wind gradient and the low apparent wind speed of approximately half the true wind speed.
Normal upwash corrections applied when sailing upwind with the fractional genoas were inaccurate for downwind sailing with
masthead gennakers so tests were conducted on the wind tunnel model by observing angles on the masthead wand from an
overhead camera to obtain corrections for downwind sailing. However, the masthead wand could be observed oscillating
through large angles when the boats were sailing downwind.
Correlations were made between the wind measurements upwind and down, from port and starboard gybes and from weather
boats stationed on the course. The relationship between the true and apparent wind speeds and angles must conform to the wind
triangle, Figure 8, and this improved during the trials period but discrepancies remained of up to 0.5 knots and 5 degrees. In
addition the twist in the wind gradient varied and was noticeable to the navigators on the boats so particular corrections were
applied. These issues complicate the correlation between the measurements and VPP calculations.
6. PERFORMANCE COMPARISONS
Comparisons between results from the VPP calculations and measurements from the sailing trials are shown in Figure 11 to
Figure 14. The true and apparent wind angles are shown in Figure 11 and a number of points can be noted:
The distribution of measurements represents the wind speeds during the 4-month period of the trials, with preponderance in the
10 to 15 knot range, the sea breeze conditions. Only a few trials were conducted in lighter wind conditions, with little interest in
wind strengths below 7 knots as it was the minimum for starting Cup races. There were a significant number of trials in stronger
winds of 17 to 22 knots where the spinnaker would be used.
The apparent wind angle increased with true wind speed from less than 60 degrees in light winds to greater than 120 degrees in
strong winds whilst the boats were being sailed downwind on courses aimed best speed made good downwind. There were
significant variations of 5 to 10 degrees in the apparent wind angle in the true wind range of 12 to 15 knots, which was
indicative of the boats being sailed differently from trial to trial. There was also variation in the higher wind speeds but at
greater apparent wind angles of the order of 120 degrees.
Apparent wind angles from VPP calculations are shown for both the optimum speed made good downwind and at the trend
through the measured true wind angles. The VPP optimum gives a good fit up to a true wind speed of 15 knots although it is
associated with lower true wind angles than the trend. Increasing the sail coefficients made little difference to the VPP optimum
true and apparent wind angles so it would appear that the differences with the measurements were either due to the trials
measurements or the sailing style.
The optimum downwind angles from VPP calculations in a true wind speed of 20 knots, Figure 9, were considerably smaller
than those sailed during the trials. This was known at the time of the races but the boats continued to race at the higher angles,
i.e. sailing angled closer to the leeward mark. This may have been due to operational or structural reasons, e.g. match racing
tactics, sail handling issues when gybing or to lower the apparent wind speed to avoid blowing out the sail. Alternatively there
may have been an issue with the VPP but without further races with ACC Yachts in 20 knots of wind the issue remains
unresolved.

HISWA International Symposium 2014
Ian Campbell, Emeritus Fellow, Wolfson Unit MTIA
15
40
60
80
100
120
140
160
180
5 10 15 20 25
True wind speed - knots
Tru
e o
r ap
pa
ren
t w
ind
an
gle
s -
deg
rees
ITA86 Stb
ITA74 Stb
ITA86 Port
ITA74 Port
ITA86 Stb Ba
ITA74 Stb Ba
ITA86 Port Ba
ITA74 Port Ba
Bt trend
VPP optimum Bt
VPP Ba at trend Bt
VPP optimum Ba
VPP optimum Ba +5% Cl
VPP optimum Bt +5% Cl
Figure 11 Variation of true and apparent wind angles with true wind speed
The differences between predicted and measured boat speeds are shown in Figure 12, where the baseline was taken as a curve fit
through the measured boat speeds. There is less variation in the speed than in the angles, which may be because boat speed
measurements are more straightforward than wind measurements.
Comparisons with VPP calculations showed the measurements lying between the predictions at the trend through measured true
wind angles and at optimum true wind angles. The predicted optimum in 20 knots true wind speed was a high boat speed,
which is associated with the smaller apparent wind angle, shown in Figure 11 and higher apparent wind speed, shown in Figure
13. Increasing the sail coefficients improved the correlation between the VPP optimum and measured boat speeds in the true
wind range of 10 to 14 knots.
Of particular note are the low boat speeds in light winds compared to the predictions and the reason for this is unclear. It is
unlikely that the hydrodynamic drag was incorrect since it is dominated by friction drag at these lower boat speeds, which can
be reliably predicted. There was generally good correlation of speeds and angles at 10 knots true wind so it is unlikely that the
sail coefficients were incorrect to the extent required to give the discrepancy in the lighter winds, although it is possible that the
sails did not fly properly in the light winds due to the motions imposed by the wave action on the boat.

HISWA International Symposium 2014
Ian Campbell, Emeritus Fellow, Wolfson Unit MTIA
16
-1.0
-0.8
-0.6
-0.4
-0.2
0.0
0.2
0.4
0.6
0.8
1.0
5 10 15 20 25
True wind speed - knots
Bo
at
spee
d d
iffe
ren
ce V
s -
kn
ots
to f
it t
hro
ug
h b
oa
t d
ata ITA86 Stb gybe
ITA74 Stb gybe
ITA86 Port gybe
ITA74 Port gybe
VPP at trend Bt
VPP optimum
VPP optimum +5% Cl
-ve values lower
than data fit
Figure 12 Variation of boat speed differences with true wind speed
Comparisons of the differences between predicted and measured apparent wind speeds are given in Figure 13, where the
baseline was taken as the VPP optimum values so there is no curve shown for the optimum as in the previous Figure 11and
Figure 12, and it can be seen that there is considerable variation in the measurements at particular true wind speeds.
-3
-2
-1
0
1
2
3
5 10 15 20 25
True wind speed - knots
Ap
pa
ren
t w
ind
sp
eed
dif
fere
nce
- k
no
ts
to V
PP
op
tim
um
va
lues
ITA86 Stb gybe
ITA74 Stb gybe
ITA86 Port gybe
ITA74 Port gybe
VPP at trend Bt
VPP at trend +5% Cl
+ve values higher
than VPP calcs
Figure 13 Variation of apparent wind speed difference with true wind speed

HISWA International Symposium 2014
Ian Campbell, Emeritus Fellow, Wolfson Unit MTIA
17
The apparent wind speeds were best matched by the optimum VPP calculations up to a true wind speed of 15 knots. As
discussed previously the optimum VPP calculation at 20 knots occurred at lower angles and higher speeds than the
measurements so the apparent wind speeds obtained from the trend through the measured true wind angle is a better match to
the trials measurements for true wind speeds around 20 knots. Increasing the sail coefficients made a relatively small difference
to the apparent wind speed although it should be noted that the scale of this figure is much coarser than for the boat speed shown
in Figure 12.
The final comparison, given in Figure 14, is of heel angles and it can be seen that the measurements were generally higher than
the predictions. Consideration of these measurements can be made together with the VPP output shown in Figure 10 and the
wind tunnel data shown in Figure 3. Zero heel moment from the wind tunnel tests occurred at an apparent wind angle of
approximately 120 degrees and this is consistent with the measurements shown in Figure 11 in around 20 knots true wind
speed.
The higher heel angles in the true wind speed range of 10 to 15 knots are indicative of the boat sailing at a smaller apparent
wind angle than optimum, which would also be associated with a smaller true wind angle and this does not appear to be the case
from the data shown in Figure 11.
Increasing the sail coefficients in the VPP resulted in a relatively small change to the predicted optimum heel angles.
As in the previous plots the high VPP optimum heel in a true wind speed of 20 knots represents sailing at higher boat speeds and
smaller apparent wind angles.
-5
0
5
10
15
5 10 15 20 25
True wind speed - knots
Hee
l an
gle
- d
egre
es ITA86 Stb gybe
ITA74 Stb gybe
ITA86 Port gybe
ITA74 Port gybe
VPP optimum
VPP at trend Bt
VPP potimum +5% Cl
Figure 14 Variation of heel angle with true wind speed
The data in the preceding figures is of measurements of absolute performance from both the boats sailing in the trials. However
the important measurements at the time of the challenge were their relative speeds, as shown in Figure 15, because these were
used to tune the boats and set up their configuration, including rig, sails and appendages.
Improvements were sought in downwind speed made good of 1m/minute, since this would give an advantage of approximately a
boat length on a downwind leg, which could be sufficient to gain an overlap in a match race and take control of the race.

HISWA International Symposium 2014
Ian Campbell, Emeritus Fellow, Wolfson Unit MTIA
18
1 m/minute speed difference equated to approximately 2% increase in driving force or reduction in drag but it can be seen in
Figure 15 that the speed differences varied by up to 10 m/minute or 20% difference in force. This is considerably greater than
the 5% difference due to sail trim found in the wind tunnel, as can be seen in Figure 3. The relative speed differences could be
measured with greater accuracy than the absolute speeds and angles shown in the preceding figures so it is therefore clear that
significant variations could be attributed to the wind environment and the sailing operation. These are essential ingredients of
yacht racing but unfortunately they cloud the analysis of yacht performance.
It should also be noted that each downwind trial was conducted for a different purpose and that the crews’ observations, which
are not included in this paper, formed an important part of the trials evaluation.
-15
-10
-5
0
5
10
15
5 10 15 20 25
True wind speed - knots
Sp
eed
ma
de
go
od
dif
fere
nce
- m
/min
ITA86 to ITA74 Stb gybe
ITA86 to ITA74 Port gybe
Figure 15 Variation of difference in speed made good with true wind speed
7. CONCLUSIONS
The aim of this paper was to investigate whether wind tunnel tests on downwind sails provide a reliable measure of their full
scale sailing performance and it has been shown that there is reasonable agreement between VPP calculations and trials
measurements provided performance is compared at related sailing angles and not just the optimum predicted by the VPP.
There remains some uncertainty about the accuracy of the trials results that makes it difficult to assess the source of any errors
that may exist within the wind tunnel results.
It is clear that adjustments to the sail settings alters their flying shapes, which changes the sail forces by the order of 5% near to
the maximum driving force. Wind tunnel tests have provided a reliable method to measure these sail forces with good
repeatability.
The forces for a particular sail combination show a reasonably smooth variation with apparent wind angle and with relatively
small changes in the lift coefficient, which is consistent with the flying shapes of the sails as viewed in the wind axes.
Significantly different downwind sail shapes produce different forces, e.g. forces from gennakers can be distinguished from
those from spinnakers. The effect of smaller shape changes are more difficult to distinguish once the sheeting has been adjusted
to optimise their flying shape.
When comparing VPP calculations with sailing trials data the output needs to be interrogated to match measured sailing angles
and it is not sufficient to compare speeds from the VPP optimum downwind points. It is also necessary to compare all the
output results, including true and apparent wind speeds and angles and heel angle, not just boat speed and wind speed and to
ensure that the trials measurements conform to the wind vector triangle.

HISWA International Symposium 2014
Ian Campbell, Emeritus Fellow, Wolfson Unit MTIA
19
Trials measurements are difficult even with the best equipment and systems. Variations remained within trials data gathered
carefully over a prolonged period even where corrections were applied.
Increasing the value of the sail force coefficients in the VPP increased the predicted boat speed but did not significantly improve
the correlation with true and apparent wind angles from the trials. It is unlikely that the source of differences in wind tunnel
measurements since the apparent wind angle is set in the tunnel without reference to wind instruments mounted on the model.
Relative differences in downwind sailing speeds from the 2-boat trials, which could be measured with greater accuracy than
absolute performance, showed much greater variation than could be attributed to the sail force variations measured in the wind
tunnel.
In stronger wind conditions of around 20 knots the ACC boats were sailed at much wider true an apparent wind angles than the
optimum from VPP calculations, possibly for operational or tactical match racing reasons and possibly for structural reasons and
in lighter winds of around 7 knots the measured boat speeds were considerable lower than predicted.
8. REFERENCES
Campbell, I.M.C., The Performance of Offwind Sails Obtained from Wind Tunnel Tests. R.I.N.A. International Conference on
the Modern Yacht..1998
Oliver, J.C. and Robinson, J., Development of a VPP Based Rating for J-CLASS Yachts”, 20th International HISWA
Symposium on “Yacht Design and Yacht Construction”, Amsterdam, November, 2008
Wright, S., Claughton, A., Paton, J., Lewis, R., Off-Wind Sail Performance Prediction and Optimisation. 2nd International
Conference on Innovation in High Performance Sailing Yachts (INNOV’SAIL), Lorient, France. 2010
Campbell, I.M.C., A Comparison of Downwind Sail Coefficients From Tests in Different Wind Tunnels. 3rd International
Conference on Innovation in High Performance Sailing Yachts (INNOV’SAIL), Lorient, France. 2013
Zasso, A., Fossati, F., Viola, I.M., Twisted Flow Wind Tunnel Design for Testing Yacht Sails. 4th European and African
Conference on Wind Engineering (EACWE4), Prague, Czech Republic. 2005
Mausolf, J., Deparday, J., Graf, K., Renzsch, H., and Böhm, C., Photogrammetry Based Flying Shape Investigation of
Downwind Sails in the Wind Tunnel and at Full-Scale on a Sailing Yacht, 20th Chesapeake Sailing Yacht Symposium,
Annapolis, Maryland, USA. 2011
Claughton, A., Fossati, F., Battistin, D., Muggiasca, S., Changes and development to sail aerodynamics in the
ORC International Handicap Rule, 20th International Symposium on “Yacht Design and Yacht Construction”, Amsterdam,
2008
Motta, D., Flay, R.G.J., Richards, P., Le Pelley, D., An Experimental Investigation of Asymmetric Spinnaker Aerodynamics
Using Pressure and Sail Shape Measurements, 3rd edition of the conference INNOV’SAIL, Lorient France, 2013
Y. Masuyama, The Work Achieved with the Sail Dynamometer Boat “Fujin”, and the Role of Full Scale Tests as the Bridge
between Model Tests, 3rd edition of the conference INNOV’SAIL, Lorient France, 2013
Viola, I. M., Flay, R. G. M., Ponzini, R., On the CFD Modelling Uncertainty of ACC Yachts, 4th High Performance Yacht
Design Conference, Auckland, NZ, 2012

HISWA International Symposium 2014
Ian Campbell, Emeritus Fellow, Wolfson Unit MTIA
20
9. ACKNOWLEDGEMENTS
It has only been possible to publish the previously confidential results due to the kind permission of Sig Patrizio Bertelli,
although Luna Rossa Challenge retain their Intellectual Property Rights to the data in accordance with their agreement with the
Wolfson Unit MTIA.
The work was originally performed for the Luna Rossa Challenge with the aim of winning the prestigious America’s Cup and
many of its team members played their part in enabling the work described in this paper to be conducted.
Thanks are particularly extended to the North Sails’ designers; Grant Spanhake, Henrik Søderlund and Guido Cavalazzi, for
designing and manufacturing the model sails and their assistance in the wind tunnel.
The wind tunnel tests were also conducted with the helpful assistance from staff at the Politecnico di Milano under the guidance
of Fabio Fossati.
My work was contracted through the Wolfson Unit MTIA with thanks to my colleagues for their contribution in the
development of the systems used for the tests.