complexity reduction in automotive design and development
TRANSCRIPT
Complexity Reduction in Automotive Design and
Development
Ronald J. Ziegler
B.S. Mechanical EngineeringUniversity of Michigan (1988)
Masters of Business AdministrationUniversity of Michigan (1995)
SUBMITTED TO THE SYSTEM DESIGN AND MANAGEMENT PROGRAM IN PARTIALFULFILLMENT OF THE REQUIREMENTS FOR THE DEGREE OF
MASTER OF SCIENCE IN ENGINEERING AND MANAGEMENTAT THE
MASSACHUSE'ITS INSTITUTE OF TECHNOLOGY
January 2005
2005 Ronald J. ZieglerAll rights reserved.
The author hereby grants to MIT permission to reproduce and to distribute publicly paper
and electronic copies of this thesis document in whole or in part.
Signature of Author........ ............... .... ............................................................ . .L Ronald J. Ziegler
System Design and Management ProgramJanuary 2005
Certified by ........................
MASSACHUSTS INSTITUTEOF TECHNOLOGY
FEB 1E2005
LIBRARIES
Daniel WhitneyCenter for Technology, Policy and Development
Thesis Supervisor

Complexity Reduction in Automotive Design and Development
This page intentionally left blank.
2 .-liialli l l

(omplexity Reduction in Automotive Design and Development
Abstract
Automobiles are complex products. High product complexity drives highlevels of design and process complexity and complicatedness. This thesisattempts to reduce complicatedness in the automotive vehicle design anddevelopment process utilizing systems engineering tools including the designstructure matrix (DSM) and axiomatic design concepts. The title of the thesisis a misnomer; complexity in automotive design and development is not "goingaway", but through the use of system engineering tools it is believed that thecomplicatedness of automotive design can be reduced and the consequences ofdecisions can be better understood at earlier stages in product development. Aholistic view of the complexity and complicatedness challenge is considered, inorder to identify high leverage points and generic insights that can be carriedforward to future product development efforts. The goal is to translategeneralized learning and systems thinking to the application of systems toolsand processes that enable an understanding of complexity, in order to designbetter operating policies that guide positive change in systems.
The analysis starts with considerations across the automotive enterprise, thenthe focus sharpens to the early stages of the product development process.Then a more detailed level of abstraction is considered when the automotivechassis tuning process and the interactions between the vehicle dynamics andnoise and vibration (NVH) attributes are considered. The automotive rearsuspension design is used to illustrate the concepts at the detailed level ofabstraction. A rear suspension system case study is included, as it met anumber of the challenges inherent in large-scale systems; it provides theelements of a technical challenge and the integration of business andengineering issues, while encompassing detailed and broad issues that acrossdifferent parts of the organization.
The analysis demonstrates that the complicatedness of systems can be reducedand complexity can be managed through the use of the design structure matrixand axiomatic design concepts. Recommendations are made to fosterimproved decision-making that will result in improved automobiles and includethe following: start simply with the application of these concepts on the criticalfew interactions that drive system performance, manage information explicitly,account and provision for risks in the development process, and reducecomplexity and complicatedness through reuse.
3

Complexity Reduction in Automotive Design and Development
This page intentionally left blank.
4

(onplexitv Reduction in Automotive.c Design and )evelopment
Acknowledgements
I would like to thank Ford Motor Company management for their supportthroughout the System Design and Management Program. I would also like tothank my student cohort, professors, and SDM administration - theirdedication, enthusiasm and contributions made the journey a pleasure. Thankyou Dan Whitney for your guidance and feedback during the development ofthis thesis. Finally, I would like to extend a special thanks to my family andfriends for their support, encouragement, patience, and understanding over thelast two years.
This effort is dedicated to my parents, who have exhibited great courage in theface of significant challenges over the past year. Finally, to my future wifeJenny - you have made the last year the best of my life.
Ronald Ziegler
January 2005
(omplexity Reduction in .Automotive Design and Development
This page intentionally left blank.
6

Comipexity, Reduction in Automotive Design and Development
Table of Contents
Complexity Reduction in Automotive Design and Development 1
Abstract 3Acknowledgements 5Table of Contents 7List of Figures 13
Chapter 1. Introduction and Problem Statement 17Automobile Complexity and Complicatedness 17Scope 17Approach 18Case Study: Rear Suspension System 18Problem Statement 24Thesis Structure 26
Chapter 2. The Automobile Industry and Complexity 27Automotive Industry 27
Dominant Design 27Process Innovation 28Cost and Timing 29
Automotive Market 31Competition 31Customers 31
Automotive Complexity 31More Parts 32More Interdependencies 33Human Limitations 33Dynamic Complexity 34
Development Process at Ford Motor Company 37Product Development System 37Organization 38Noise/Vibration/Harshness and Vehicle Dynamics 39
Impact of Decisions 40Approach to Decisions 42
Balanced Scorecard 42Tradeoffs 43
Summary 44

Complexity Reduction in Automotive Design and Development
This page intentionally left blank
8

Complexity Reduction in Automotive Design and .Development
Chapter 3. Literature Review: Automotive Suspensions, Attributes,Cascades, Design Structure Matrix and Axiomatic Design 47
Automotive Suspensions 47Function and Terminology 47Suspension Design 48Vehicle Dynamics Compliance Strategy 48Suspension Bushing Design 48Three-Link Solid Axle Suspension 51Independent Short-Long Arm (SLA) Suspension 51
NVH and Vehicle Dynamics Attributes 52NVH Attribute 52NVH Cascade of Functional Requirements to DesignParameters 53Vehicle Dynamics Attribute 55Vehicle Dynamics Cascade of Functional Requirements toDesign Parameters 56
Related Research 57Design Structure Matrix 57Axiomatic Design and Suspensions 58
Summary 59
Chapter 4. Approach and Methods: The Design Structure MatrixAnd Axiomatic Design 61
Design Structure Matrix 61Description 61Design Structure Matrix Uses 63Design Structure Matrix Construction 63
Axiomatic Design 64Independence Axiom 67Information Axiom 69
Summary 69
Chapter 5. Simplifying Complex Interactions Using DesignStructure Matrices 71
The Design Structure Matrix 71Enterprise Design Structure Matrix 72
Method: Enterprise DSM 72Findings: Enterprise DSM 74Insights: Enterprise DSM 78
9

(omplexity Reduction in Automotive Design and Development
This page intentionally left blank
1 0

Cornplexity Reduction in Automotive Design and Development
Conclusions: Enterprise DSM 81Pre-Program Design Structure Matrix 83
Method: Pre-Program DSM 83Findings: Pre-Program DSM 85Insights: Pre-Program DSM 89Conclusions: Pre-Program DSM 90
Vehicle Chassis Tuning Task-Based Design Structure Matrix 92Method: Task-Based Chassis Tuning DSM 92Findings: Task-Based Chassis Tuning DSM 93Tuning DSM Insights: NVH and Vehicle DynamicsInteractions 96
Summary 97
Chapter 6. Simplifying Design Interactions Using AxiomaticDesign Concepts 99
The Challenge 99Method 100Three-link Solid Axle Design 100
Independence Axiom 100Information Axiom 101
Independent Rear Suspension Design 102Independence Axiom 102Information Axiom 102
Suspension Mount Design 103First Level Decomposition 103Second Level Decomposition 104
Conclusions: Axiomatic Design 106
Chapter 7. Conclusions, Recommendations, and OpportunitiesFor Further Study 107
Conclusions and Recommendations 107Opportunities for Future Study 110
Appendix A. A Simple System Dynamic Model of theAutomotive Market: Ford Taurus 113Endnotes / Reference List 117
11

(omplexiy Reduction in Automotive Design and Development
This page intentionally left blank.
12
Compiexiy Reducttoin in Automotive )esign and .Dcvelopment
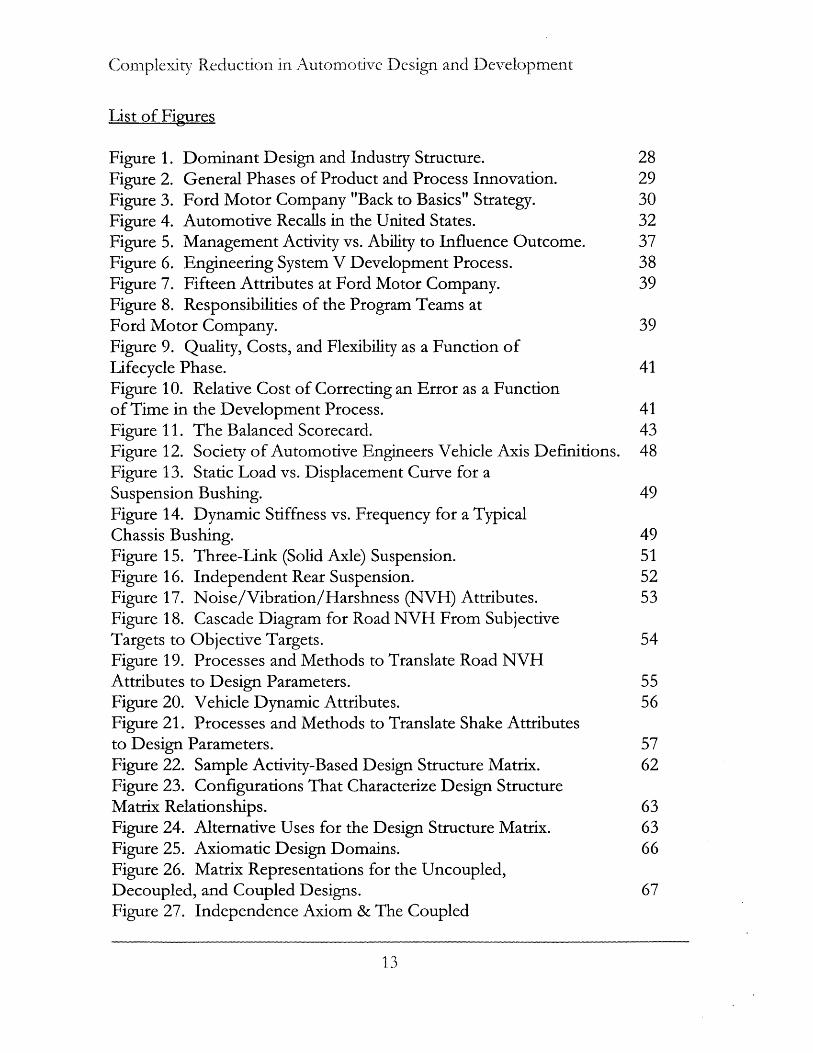
List of Figures
Figure 1. Dominant Design and Industry Structure. 28Figure 2. General Phases of Product and Process Innovation. 29Figure 3. Ford Motor Company "Back to Basics" Strategy. 30Figure 4. Automotive Recalls in the United States. 32Figure 5. Management Activity vs. Ability to Influence Outcome. 37Figure 6. Engineering System V Development Process. 38Figure 7. Fifteen Attributes at Ford Motor Company. 39Figure 8. Responsibilities of the Program Teams atFord Motor Company. 39Figure 9. Quality, Costs, and Flexibility as a Function ofLifecycle Phase. 41Figure 10. Relative Cost of Correcting an Error as a Functionof Time in the Development Process. 41Figure 11. The Balanced Scorecard. 43Figure 12. Society of Automotive Engineers Vehicle Axis Definitions. 48Figure 13. Static Load vs. Displacement Curve for aSuspension Bushing. 49Figure 14. Dynamic Stiffness vs. Frequency for a TypicalChassis Bushing. 49Figure 15. Three-Link (Solid Axle) Suspension. 51Figure 16. Independent Rear Suspension. 52Figure 17. Noise/Vibration/Harshness (NVH) Attributes. 53Figure 18. Cascade Diagram for Road NVH From SubjectiveTargets to Objective Targets. 54Figure 19. Processes and Methods to Translate Road NVHAttributes to Design Parameters. 55Figure 20. Vehicle Dynamic Attributes. 56Figure 21. Processes and Methods to Translate Shake Attributesto Design Parameters. 57Figure 22. Sample Activity-Based Design Structure Matrix. 62Figure 23. Configurations That Characterize Design StructureMatrix Relationships. 63Figure 24. Alternative Uses for the Design Structure Matrix. 63Figure 25. Axiomatic Design Domains. 66Figure 26. Matrix Representations for the Uncoupled,Decoupled, and Coupled Designs. 67Figure 27. Independence Axiom & The Coupled
13

Complexity Reduction in Automotive Design and Development
This page intentionally left blank
14

Complexity Reduction in Automotive Design and Development
Water Faucet Design. 68Figure 28. Independence Axiom and The Uncoupled Faucet Design. 68Figure 29. Design Structure Matrices: Three Levels of Abstraction. 72Figure 30. Enterprise Design Structure Matrix. 74Figure 31. Pre-Program <PA> DSM Task List Development. 84Figure 32. Pre-Program Approval Design Structure Matrix. 85Figure 33. Task-Based Chassis Tuning Design Structure Matrix. 94Figure 34. Axiomatic Design Matrix for a Three-linkSolid Axle Design. 101Figure 35. Axiomatic Design Matrix for an Independent Suspension. 102Figure 36. Independent Rear Suspension SubframeMount (DP3.1) Design Matrix: Mount Performance. 104Figure 37. Independent Rear Suspension SubframeMount (DP3.1.N) Design Matrix: Mount Properties. 105Figure 38. System Dynamics Model for The Ford Taurus. 114Figure 39. Significant Market Reinforcing and Balancing Loopsfor the Ford Motor Company Taurus. 115
15

Complexity Reducton in Automotive Design and IDcvelopm ent
This page intentionally left blank.
16

Chapter 1. Introduction and Problem Statement
Automobile Complexity and Complicatedness
Automobile product complexity drives high levels of design and process
complexity and complicatedness. Complexity leads to challenges within and
between technical, organizational/ human, and process domains. Merriam
Webster delineates the difference between complex and complicated as follows:
complexity "suggests the unavoidable result of a necessary combining," while
complicated "applies to what offers great difficulty in understanding, solving, or
explaining." Complexity involves systems, while complicatedness involves the
human condition. This thesis attempts to reduce complicatedness in the
automotive vehicle design and development process utilizing systems
engineering tools including the design structure matrix (DSM) and axiomatic
design concepts. Through the use of system engineering tools it is believed
that the complicatedness of automotive design can be reduced and
consequences of decisions can be better understood at earlier stages in product
development. The scope of the thesis, thesis problem statement, and
framework used to address the challenge of automotive design and
development are summarized in this chapter. Finally, the layout of the
remainder of the paper is described.
Scope
A holistic view of the complexity and complicatedness challenge is considered,
in an effort to identify high leverage points and generic insights that can be
carried forward to future vehicle programs. The goal is to move from
generalized learning and systems thinking to the application of systems tools
and processes that enable an understanding of complexity and the design better
operating policies to guide change in systems. The analysis starts with
17
(Chapter 1. Introduction and Problem Statement
considerations across the automotive enterprise, then the focus sharpens to the
early stages of the product development process. Then a more detailed level of
abstraction is considered when the automotive chassis tuning process and the
interactions between the vehicle dynamics and noise and vibration (NVH)
attributes are considered. The automotive rear suspension design is used to
illustrate the concepts at the detailed level of abstraction.
Approach
Complexity and complicatedness are interdisciplinary challenges. For this
reason, issues in the organizational/human, process, and technical domains are
considered. The organizational/human domain deals with the human behavior
in complex systems, where the relationships are governed by human capabilities
and relationships. The process domain deals with the decomposition and
execution of tasks, where the relationships are governed by information flows,
timing, and methods. The technical domain deals with the functional aspects
of automotive design, where the relationships are governed by physics.
Case Study: Rear Suspension System
The following case study introduces the decision-making challenges involved in
the selection of the proper rear suspension system architecture for an
automobile. The case study was selected as it met a number of the challenges
inherent in large-scale systems; it provides the elements of a technical challenge
and the integration of business and engineering issues, while encompassing
detailed and broad issues that across different parts of the organization. The
case study was selected for its relevance and appropriateness in demonstrating
the concepts presented herein and is not intended to be a judgment of the
18

Chapter 1. Introduction and Prolemn Statement
decisions and performance of the team involved in the case. The case study
provides an example of the human, process, and technical challenges involved
in automotive complexity and complicatedness.
The Issue
A vehicle program was not meeting aggressive cost targets at the Program
Approval, <PA> gateway. In order to proceed through the gateway and
continue with the program, the team was presented with a number of difficult
choices. The program assumptions were reviewed in order to identify cost-
saving opportunities. One of the cost-saving opportunities under consideration
was the rear suspension system. The team was asked to reconsider the rear
suspension architecture selection and consider an alternate, low-cost design.
During the early pre- <PA> stages of the program the independent rear
suspension (IRS) architecture type was selected due to the many functional
benefits it provided over the outgoing solid axle-type rear suspension system in
the prior vehicle model. Prototype vehicles were made with the IRS and initial
chassis tuning and development was completed in order to demonstrate that
functional target ranges could be achieved. Initial cost estimates for an
alternate 3-link type solid axle system indicated sufficient cost savings to allow
the program to meet cost targets.
The Decision
Chief Engineers and Engineering directors from Vehicle Engineering, Chassis
Engineering, Finance and Vice Presidents of the company were involved in the
suspension architecture decision. The leadership team was initially split with
respect to the rear architecture change proposal. Vehicle program management
19

(.hapter 1. Introduction and Problem Statement
and the chassis organization desired the more sophisticated IRS, while finance
built the case for and supported the solid axle architecture. The Vice
Presidents eventually made the call for the solid axle architecture based on the
information available at the time. The decision was made. Management
released a one-page document to the team stating the necessity for tough
decisions; to achieve the target return on investment and continue segment
domination, significant cost and weight reduction was required. In addition,
there was a strong desire to hold the Job <1> production timing. Additional
resources were allocated to hold the timing. Shortly after the decision, the
program Chief Engineer and Chassis Chief Engineer were reassigned. While
this thesis does not presume a cause and effect relationship between the rear
architecture decision and the reassignments, one could infer that the chassis
architecture change was a factor in the organizational changes.
The Task
The team was tasked to develop the new rear architecture in just over four
weeks - a monumental mandate given that a new architecture development can
typically take months to complete. The task was led by the Package
Engineering group, where the focus was making the new system fit while
minimizing the change required to other systems such as the body structure.
There was very little input from the functional attributes at this stage, due in
part to unfamiliarity with the new system and lack of presence in the decision-
making process. Neither formal functional targets nor target cascades were
used. There was also a strong push to reuse components of a solid axle system
from an existing company vehicle line. While the new concept "boxed", i.e.
brought financial performance back to target, challenges loomed.
20

(ihapter 1. Introduction and Problem Statement
Unanticipated Factors
As the system evolved, it became clear that a number of the parts could not be
reused as originally planned. Additionally, other systems in the vehicle were
impacted and would require more changes than originally thought. These
factors drove increases in the cost of the new, solid axle system. Risk was high,
as the impact on the functional attributes was not understood due to the lack of
involvement of the proper technical subject matter experts in the decision and
the lack of prototypes needed to demonstrate the new system performance. In
particular, the robustness to Noise/Vibration/ Harshness (NVH) attributes
such as axle and road noise was not quantified. Additionally, the tunable
parameters that influence vehicle steering/handling and NVH, such as rubber
bushing mount stiffness, were not established.
The OrganiZation
The Vehicle Engineering organization was responsible for delivering overall
vehicle performance. The team was organized with the engineers reporting to
their functional and attribute managers. The functional and attribute managers
controlled the headcount and budget. The engineers did not have a direct
reporting relationship with the Vehicle Engineering Manager. This
arrangement did not foster tradeoffs between the attributes, as attribute
managers were tasked to deliver their attributes, and not overall vehicle
performance. Accountability and responsibility for individual attribute
performance were aligned, but at the cost of compromising the tradeoff
mechanisms between attributes due to the lack of organizational power and
resources afforded to the Vehicle Engineering Manager. Once the vehicle
21
Chapter 1. Introduction and Problem Statement
architecture is selected, the parameters that are available to optimize are limited
and involve multiple stakeholders. In this case the two architectures under
consideration affect the level of interaction between vehicle dynamic and NVH
attributes in significantly different ways. A description of the attributes and
parameters involved and the differences in the interactions for the two
suspension types will be considered in later chapters.
Prototype Development
Prototype vehicles were received extremely late relative to the typical product
development cycle, and were in short supply. A schedule was developed to
share the vehicles. Testing was scheduled and conducted around the clock;
engineers were asked to work at all hours of the day. The early prototypes
highlighted significant technical challenges in terms of vehicle dynamics and
noise and vibration attributes. Axle noise levels were extremely high, and the
solid axle system did not provide the level of handling control and ride comfort
that is apparent in IRS systems. The NVH and Vehicle Dynamics teams
worked independently to achieve their attribute performance. The NVH focus
was on the development of the appropriate countermeasures to mitigate axle
noise. The Vehicle Dynamic focus was on tuning the chassis in order to
improve steering and handling without trading off ride comfort. One of the
NVH countermeasures to improve vehicle robustness to axle noise was the use
of softer rubber isolators in the rear suspension system. This countermeasure
was not adopted due to the adverse effects on the vehicle dynamics including
steering and handling performance.
22
(hapter 1. Introduction and Problem Statement
Team Dynamic
Much of the management effort was focused on the axle performance, with the
belief that if the axle source vibration levels could be reduced, fewer actions
would have to be adopted at the vehicle level. A team was stationed at the axle
supplier's site to work to reduce the vibration levels of the axle and variation in
axle vibration performance. Frustrations arose as the team struggled with the
significant technical challenge. The axle team believed significant
improvements could me made at the vehicle level to reduce their challenge,
while the vehicle team was frustrated with the level of variation in axle
vibration and the lack of ability to mitigate the vibration at the source. This led
to resentment between the two teams. At the center of the teams' frustrations
and the root-cause for many of the issues was the great challenge of placing a
solid-axle type system in a uni-body type vehicle. The solid axle architecture is
not typically used in vehicles with a uni-body construction (i.e. no frame), but
rather in truck applications, where there is a frame that provides another level
of isolation from the chassis via body mounts.
The Result
Each team developed and implemented changes and refinements to the 3-link
solid axle chassis system that resulted in significant improvements in both
NVH and vehicle dynamic attribute performance. The subsequent release of
the vehicle to the media provided positive reviews for the vehicle dynamic
performance. A number of countermeasures were added to improve NVH
performance. This led to significant additions to the cost and weight of the
system late in the program development. The cost of these late changes was
23

(hapter 1. Introduction and Problem Statement
not anticipated, nor factored into the initial rear chassis architecture decision.
The ultimate question of whether the proper decision was made remains to be
seen and will be based on sales performance, quality performance, and a
complete post-release cost analysis.
Relevance to the Thesis
The case study illustrates the challenges in automotive design and development
and highlights the significance of having a fundamental understanding of
systems and interactions within systems early in the product development
process. The thesis offers the design structure matrix and axiomatic design
concepts as systems engineering tools that can be used to prevent such
problems in the future. Methods such as the design structure matrix and
axiomatic design concepts allow the engineer and manager to ability to identify
interactions and tradeoffs early in the product development process and make
more informed decisions. This case highlights a component/hardware -
centric approach as apposed to a functionally cascaded-systems approach to
automotive design. This has significance in the way decisions get made and in
the way the teams are organized.
Problem Statement
OraniZational/Human Challenge
Complexity is apparent at many levels of abstraction in the automotive
industry. The thesis considers the organizational and individual challenges at
both the enterprise level and at the specific design decision level. At the higher
levels of decision-making, challenges including selecting the proper vehicle
attribute balance and final design from among many alternatives. Decisions
24

Chapter 1. Introduction and Problen Statement
must be made in an environment where knowledge of the impact of such
decisions is not always completely understood.
Complex decisions also exist at the lower levels of abstraction. The case of the
rear chassis design as it relates to noise and vibration and vehicle dynamics is
considered. At the lowest level of abstraction, task complexity is high for both
the vehicle dynamics and NVH engineer. It is typical for engineers working on
each attribute to stay in the chosen functional area for most of their careers,
with few engineers making the transition between the two attributes. This
results in a limited base of engineers knowledgeable in both attributes. The
vehicle dynamics engineer selects design parameters that have a significant
effect on NVH performance, while the NVH engineer sets targets that impact
the vehicle dynamics performance. This challenge highlights the benefits of
developing managers with knowledge of both attributes in greater depth. In
this way, a balance between breadth (Managers) and depth (Engineers) of
knowledge is achieved in the organization. This is not unlike Toyota, where
managers are trained to understand multiple systems in great depth, while
keeping engineers in one functional area or two.
Process Challenge
The process to convert an idea to an automobile presents many challenges.
How an automotive manufacturer structures and executes internal processes
can have significant effects on differentiation and success in the marketplace.
The process challenge is considered at the Enterprise level in the analysis. At
the lower level, the process challenges relating to the current design and
development process for a chassis design is considered.
Chapter 1. Introduction and Problemn Statement
Technical Challenge
Complexity in the technical domain is considered in the analysis of the
decisions involved in the automobile chassis design and development. A
framework for managing the complex system interactions is presented using
Axiomatic Design concepts in the assessment of a chassis system architecture.
Thesis Structure
The remainder of the thesis is organized as follows: Chapter 2 provides a
characterization of the automotive industry and highlights a number of the
external and internal challenges of automobile design and development.
Chapter 3 introduces terminology related to automobiles and attributes and
highlights relevant literature influential in thesis development. Chapter 4
provides a review of the methods used in the thesis, including a description of
the Design Structure Matrix (DSM) and Axiomatic Design concepts. Chapter 5
provides a summary and analysis of how complexity can be communicated and
managed using the DSMs at the Enterprise, Pre-Program, and chassis-tuning
levels of abstraction. Chapter 6 demonstrates how design can be improved
through the application of axiomatic design concepts. Finally, chapter 7
summarizes conclusions and recommendations from the analyses and
highlights opportunities for further study.
26

(hapter 2. The Automobile Industry and Complexity
Introduction
This chapter characterizes the nature of the automobile industry and highlights
a number of the challenges involved in automotive design and development at
Ford Motor Company. First, aspects of the industry are considered, and then
the complexity of automotive design is discussed. A separate section is
devoted to an analysis of dynamic complexity and how it manifests in the auto
industry. Then Ford's development process is reviewed. A discussion of the
significance of decisions that are made in the early stages of development and
the impact of late design changes is then presented. Finally, a discussion of the
approaches used to support decision-making at Ford is reviewed.
Automotive Industry
Dominant Design
The automotive industry is a mature industry. Ford Motor Company has been
producing automobiles for more than 100 years. Utterback makes the
connection between technological change and industry structure.' He
illustrates that once the dominant design is established, the number of
competing firms declines, and process innovation replaces technology
innovation as the key differentiator among firms. In the case of the
automobile, the adoption of the internal combustion engine and the coach
style, all-steel closed body architecture in the 1920's established the dominant
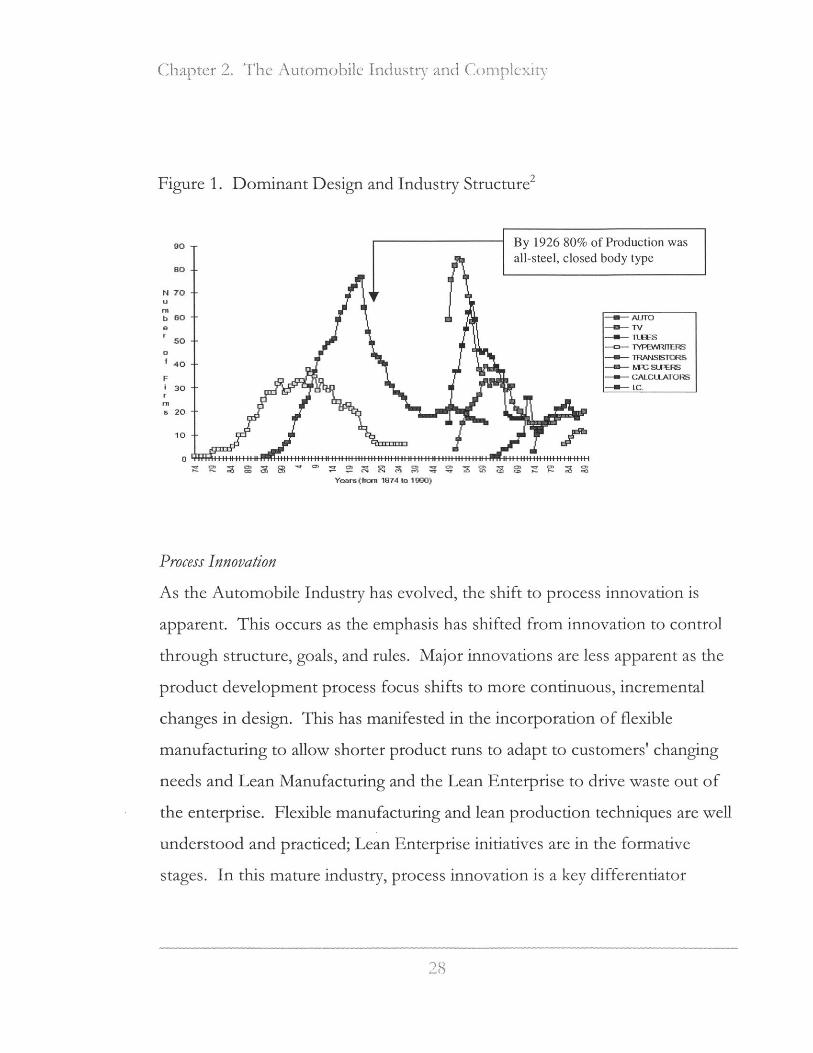
design. Figure 1 summarizes the number of firms in various industries as a
function of time to reinforce the connection between the establishment of the
dominant design and industry structure. Evidence supports this model,
whether one considers the dominant designs of the QWERTY keyboard in the
typewriter industry or the integrated circuit in the calculator market.
(hapter 2. 1he. Automobil Industry and. Conmiplexity
Figure 1. Dominant Design and Industry Structure2
90 By 1926 80% of Production wasall-steel, closed body type
80
N 70
b 0 -- M- AUTOe-u- Tvr -in---tn-50 LF
-c- -- rTEvwTm s-i-TRANSISTCR8
40 -- IC SUPER
F GALCUATORSi 30 ------ LC,
6 20
10
Years (fhrn 1874 to 1WO)
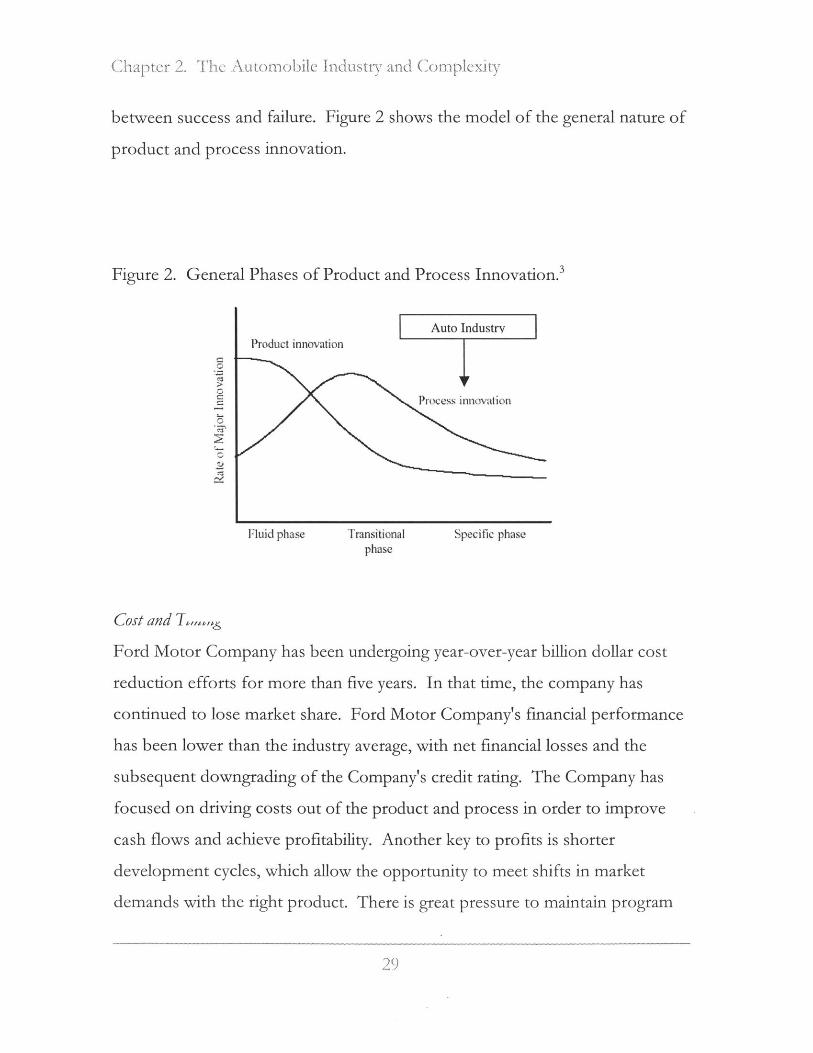
Process Innovation
As the Automobile Industry has evolved, the shift to process innovation is
apparent. This occurs as the emphasis has shifted from innovation to control
through structure, goals, and rules. Major innovations are less apparent as the
product development process focus shifts to more continuous, incremental
changes in design. This has manifested in the incorporation of flexible
manufacturing to allow shorter product runs to adapt to customers' changing
needs and Lean Manufacturing and the Lean Enterprise to drive waste out of
the enterprise. Flexible manufacturing and lean production techniques are well
understood and practiced; Lean Enterprise initiatives are in the formative
stages. In this mature industry, process innovation is a key differentiator
28
Chapter 2. The Auetoonbile I n dustrV and Complexity
between success and failure. Figure 2 shows the model of the general nature of
product and process innovation.
Figure 2. General Phases of Product and Process Innovation. 3
Auto IndustryProduct innovationAuoIdsr
Process innovation
Fluid phase Transitional Specific phasephase
Cost and T
Ford Motor Company has been undergoing year-over-year billion dollar cost
reduction efforts for more than five years. In that time, the company has
continued to lose market share. Ford Motor Company's financial performance
has been lower than the industry average, with net financial losses and the
subsequent downgrading of the Company's credit rating. The Company has
focused on driving costs out of the product and process in order to improve
cash flows and achieve profitability. Another key to profits is shorter
development cycles, which allow the opportunity to meet shifts in market
demands with the right product. There is great pressure to maintain program

Chapter 2. 'Th Automoi Indusry and( Coimplcxity
timing and production schedules. Delays to program timing can result in
opportunity costs of lost sales. There is also a high level of media attention on
program launches; delays can result in negative media coverage. The strategic
importance of timing is clearly illustrated in the Ford Motor Company business
model. The goal is to "go simple, go common, go fast. Take decisions and
execute, execute, execute!" The emphasis is to improve quality while
simplifying processes to go fast. With the emphasis on speed the importance
of making the right decisions becomes more significant in order to minimize
rework, late changes, quality issues, and unnecessary costs and delays. Figure 3
below illustrates the "Back to the Basics" strategy.
Figure 3. Ford Motor Company "Back to Basics" Strategy.
Delivering a Strong Businessby Building on the Basics
~n
Chapter 2. The Automobile industry and Complexity
Automotive Market
Competition
Automotive competition is increasing in all markets. The Sport Utility segment
alone has grown from three entrants to more than sixty (60) (source:
Automotive News). There is also an increasing number of manufacturers that
are competing across national boundaries. This competition for market share
is fierce. In the U.S. market, light vehicle sales have dropped 1% from 2002 to
2003 (Source: Automotive News). This shrinking market results in a fierce
battle for the same customers in order for companies to achieve growth targets.
This competition has led to the need for manufacturers to price competitively
based on the market and not product costs, which has resulted in smaller profit
margins.
Customers
Another shift in the market is that customers are more knowledgeable and
discerning. The Internet allows customers fingertip access to information
critical to their decision-making. Vehicle specifications, model comparisons,
safety performance, and on-line forums provide a wealth of information. Fifty-
seven percent of automotive consumers used the Internet to research a vehicle
purchase in 2002, while 17 percent of all new car decisions were influenced by
Internet research (Source: Jupiter Research Corporation).
Automobile Complexity
Vehicle recalls are projected to be higher in the United States in 2004 than in
any prior year. Figure 4 Provides a summary of recalls in the United States.
31

(hapter 2. The Automobile Industr and Comnplexity
Analysts believe the record number of recalls stems in part from the increasing
complexity of cars and trucks.
Figure 4. Automotive Recalls in the United States.
More Parts
Automobiles are complex products, typically consisting of more than four
thousand parts. A number of market forces are driving the increase in product
complexity. In the last two decades manufacturers have seen an increasing
customer demand for features. High-priced options (e.g. automatic
transmissions and power windows) are now standard equipment on most
vehicles sold in the U.S. Even "Surprise and Delight" items such as backup
warning sensors and remote keyless entry are now basic customer wants in
many automotive segments. National and International safety standards are
increasing in number and technical complexity (e.g. seatbelts vs. airbags). Fuel
Year # Recalls # Vehicles1993 221 8,408,9501994 247 6,202,8831995 265 18,121,5651996 304 17,826,3921997 265 14,712,6581998 365 17,146,8781999 396 19,376,2912000 541 24,646,7432001 454 13,626,2632002 434 18,435,5862003 528 19,098,101
2004 (as of Sept. 30) 462 14,353,883
Source: National Highway Traffic SafetyAdministration. Note the latest 2004 vehicletotals do not include recalls announcedbetween early October and late November:
Chapter 2. The Automobile industry and Complexity
efficiency requirements are also driving complexity into automobiles, as designs
must continue to be refined in order to reduce weight and frictional losses in
order to improve efficiency. Environmental concerns including emissions and
recyclablility are driving further complexity and change.
More Interdependencies
In addition to the increase in features and safety, emission, and fuel economy
requirements, complexity has increased due to implementation of more
sophisticated systems that interact in unique ways. An example is Volvo's
Dynamic Stability and Traction Control (DSTC), which intervenes and corrects
any tendency for the vehicle to skid. Sensors monitor the rotational speed of
all four wheels, the driver's steering wheel input and the course of the car. A
control unit processes critical signals. If a deviation from the norm such as the
start of a rear-wheel skid is detected, the system activates the brakes as required
to put the car back on course. The system also interacts with the Powertrain by
reducing engine power if necessary. 4
Human Limitations
The high level of product complexity has driven high levels of process
complexity in the automotive industry. This high complexity drives an increase
in complicatedness. Human cognitive ability limitations and human biases limit
the individual's capacity to manage complexity and affect system design and
performance. Probability biases,' limits of short-term memory, and limits on
concentration and focus 6 drive the need for reducing product and process
complexity. Studies have characterized the limits in human cognitive ability.
33

Chapter 2. The Automobile Industry and Complexity
Miller's Law states that average human minds can deal with seven plus minus
two things without the aid of external tools.7
Dynamic Complexity
Natural and human systems possess high dynamic complexity. The following
highlights some of the features of systems that result in the rise of dynamic
complexity as illustrated by Sterman', along with examples of how each can
manifest in the auto industry. Dynamic complexity arises because systems are:
- Dynamic: Systems that appear to be constant are changing over time when
considering an extended time horizon. An example of this in the auto
industry is team composition on a vehicle program.
* Tighty Coupled: Elements of a system interact strongly with one-another and
with the natural world. The vehicle package (where things go) introduces
many dependencies as components vie for a particular piece of vehicle
space.
* Governed by Feedback: Decisions alter the state of the world, causing changes
in nature and triggering others to act, giving rise to a new situation, which
then influences the next decision. This mechanism is apparent in the
technical domain when considering the tuning of vehicle components
(selection of suspension parameters) for vehicle dynamic attributes such as
ride, handling and steering.
- Non-linear. Effect is rarely proportional to cause. Nonlinearity can arise due
to basic physics, or as multiple factors interact in decision-making. This is
apparent in the development of a vehicle for reduced noise, vibration and
harshness (NVH). The sound at a passengers ear is the complex sum of
34

(hapter 2. The Automobile Industry and Complexity
many vibration sources; reducing once source input does not have an equal
effect on the overall sound level, due to the physical properties that govern
the addition of sound sources.
* History-Dependent: Taking one action precludes taking others. Many actions
are irreversible. This affect is apparent during the vehicle development
process; once certain fundamental architectural decisions are made, there is
no opportunity to change the path and maintain program timing.
- Se/f-OTganizjng The dynamics of systems arise spontaneously from their
internal structure. A small perturbation can be amplified and modified by
the feedback structure, generating patterns in space and time and creating
path dependence. An example of this in the auto industry is the addition of
a "surprise and delight" feature into the automotive market. Customers'
responses to the feature influence the competitive response and diffusion of
the feature into the broader market.
- Adaptive: Capabilities and decision rules change over time in complex
systems. Evolution leads to selection and proliferation of some things while
others become extinct. Adaptation also occurs as people learn from
experience. In product development at Ford Motor Company, there is an
effort to transfer lessons-learned from one program to the next, which
influences product and process design.
* Counterintuiive- Cause and effect are distant in time and space in complex
systems, while at the same time there is a tendency to look for causes near
the events sought to be explained. Attention is drawn to the symptoms of
difficulty rather than the underlying cause. High leverage policies are not
always obvious. This often manifests in the auto industry when considering
the vehicle launch phase. At the launch phase of the program, the specific
(hapter 2. The Automobile Industry and Comnplexity
problem is addressed effectively using standard problem-solving methods,
but the root-cause of the existence of the problem is not addressed (e.g. lack
of upfront knowledge and resources, lack of understanding of system
interactions and emergent system properties).
- Poliy Resistant The complexity of systems overwhelms the ability to
understand them. In many cases seemingly obvious solutions to problems
fail or actually worsen a situation. The addition of new people to work on
an issue with an existing team provides an example. In many cases the new
people require training and information from the current team members,
which can delay overall progress.
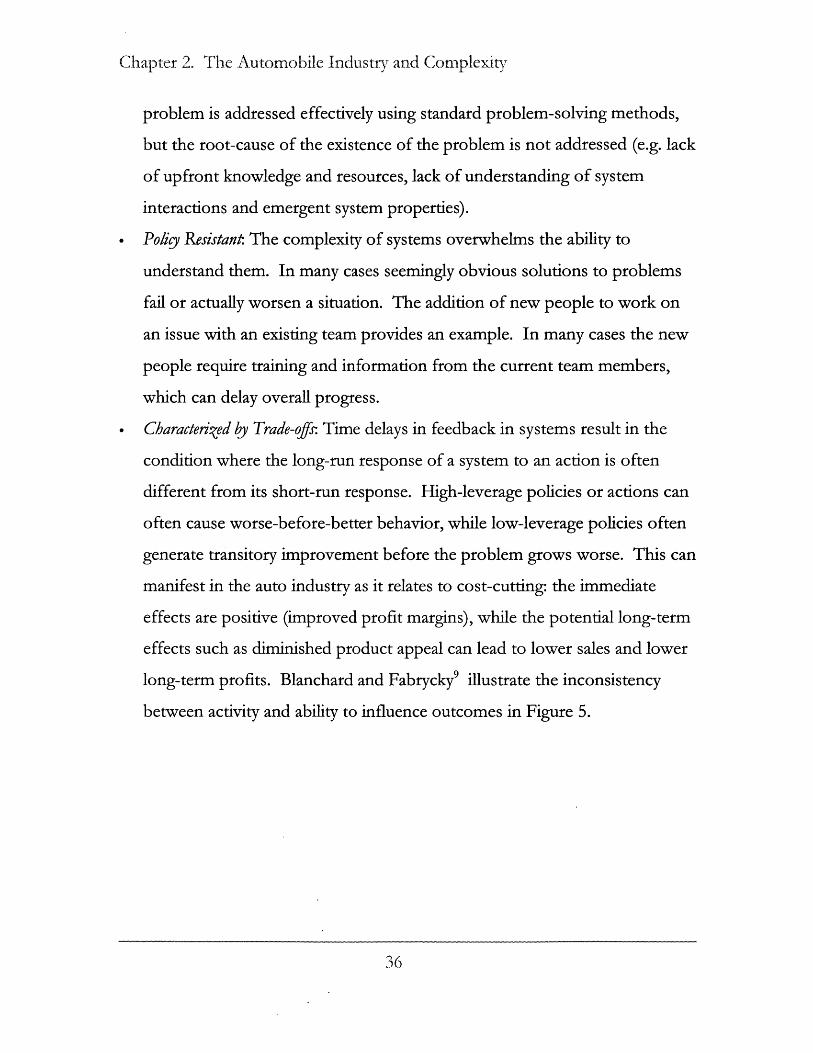
* Characterized by Trade-offs Time delays in feedback in systems result in the
condition where the long-run response of a system to an action is often
different from its short-run response. High-leverage policies or actions can
often cause worse-before-better behavior, while low-leverage policies often
generate transitory improvement before the problem grows worse. This can
manifest in the auto industry as it relates to cost-cutting- the immediate
effects are positive (improved profit margins), while the potential long-term
effects such as diminished product appeal can lead to lower sales and lower
long-term profits. Blanchard and Fabrycky illustrate the inconsistency
between activity and ability to influence outcomes in Figure 5.
36
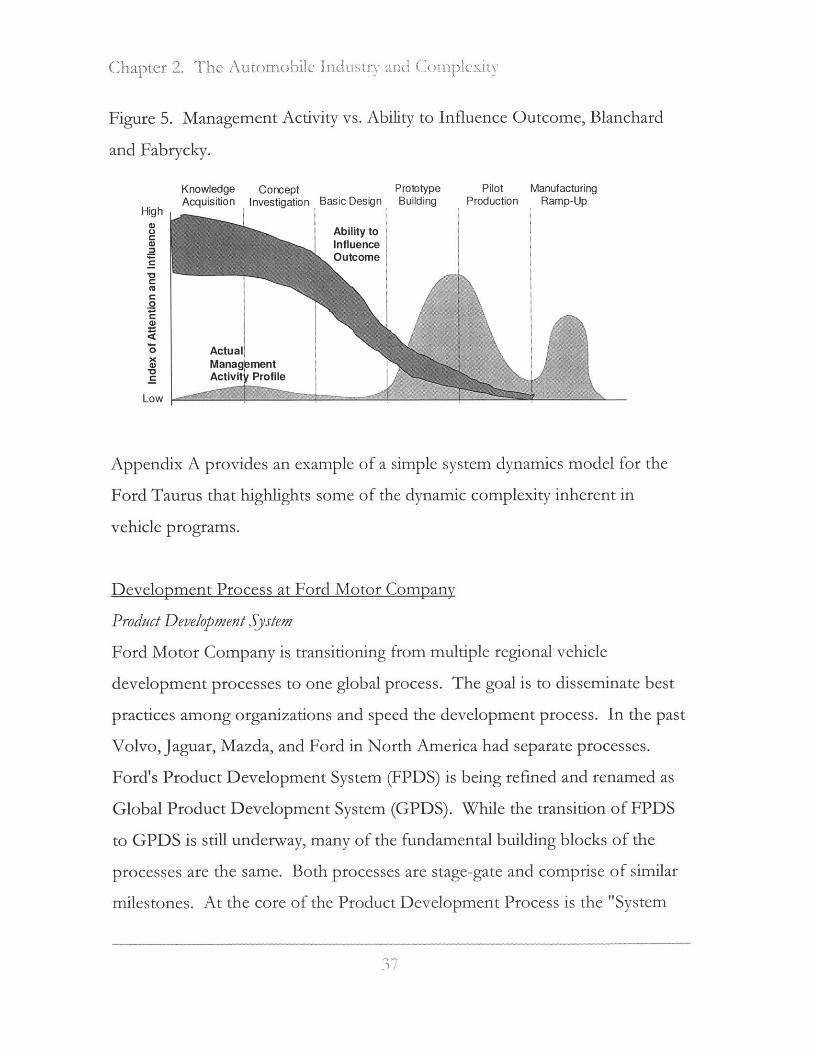
Figure 5. Management Activity vs. Ability to Influence Outcome, Blanchard
and Fabrycky.
Knowledge Concept Prototype Pilot ManufacturingAcquisition Investigation Basic Design Building Production Ramp-Up
High
Ability t01 Influence
a Outcome0
o ActualX0 Management
Activ it Profile
Low
Appendix A provides an example of a simple system dynamics model for the
Ford Taurus that highlights some of the dynamic complexity inherent in
vehicle programs.
Development Process at Ford Motor Company
Product Development System
Ford Motor Company is transitioning from multiple regional vehicle
development processes to one global process. The goal is to disseminate best
practices among organizations and speed the development process. In the past
Volvo, Jaguar, Mazda, and Ford in North America had separate processes.
Ford's Product Development System (FPDS) is being refined and renamed as
Global Product Development System (GPDS). While the transition of FPDS
to GPDS is still underway, many of the fundamental building blocks of the
processes are the same. Both processes are stage-gate and comprise of similar
milestones. At the core of the Product Development Process is the "System
Chiapter 2. The Automnobile In1dU1Str1-y 'afhnd .111 Cm eIty

Chbapter 2. The Autc~on~ic l.e industr and Complxity
V", which is a model for the approach to manage the target setting, cascading
or decomposition, integration or synthesis, and verification of engineering
requirements. Figure 6 provides an illustration of the "System V." This
process illustrates some of the major iterative loops in the design and
development process at the vehicle, system, and component levels. This
process emphasizes a top-down approach to the vehicle definition as
manifested in targets and requirements.
Figure 6. Engineering System V Development Process.
Define Verify & Launch
Requr Vericaon VehicleSolutions
R Wquremet VerificatPon, System Verifcation
;0 Solutionsz-
Component
Design
Organi.Zation
The increase in product and process complexity driven by the market has led to
an increasing need to decompose complex systems into manageable pieces.
This is accomplished at Ford Motor Company by partitioning the vehicle
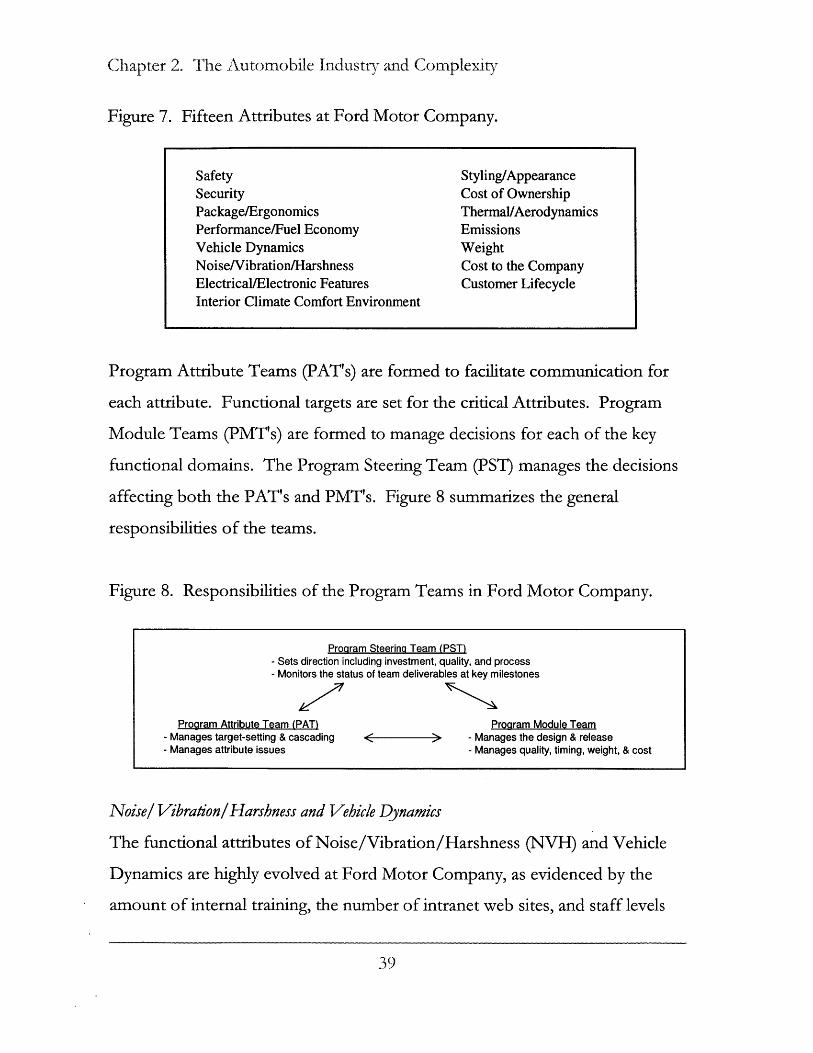
across product attribute and functional domains. Fifteen attributes define the
product. Attributes include Safety, Vehicle Dynamics, Vehicle Package, and
Noise/Vibration/Harshness (NVH). Figure 7 summarizes the attributes and
functions.
38
Chapter 2. The Automobile Industry and Complexity
Figure 7. Fifteen Attributes at Ford Motor Company.
SafetySecurityPackage/ErgonomicsPerformance/Fuel EconomyVehicle DynamicsNoise/Vibration/HarshnessElectrical/Electronic FeaturesInterior Climate Comfort Environment
Styling/AppearanceCost of OwnershipThermal/AerodynamicsEmissionsWeightCost to the CompanyCustomer Lifecycle
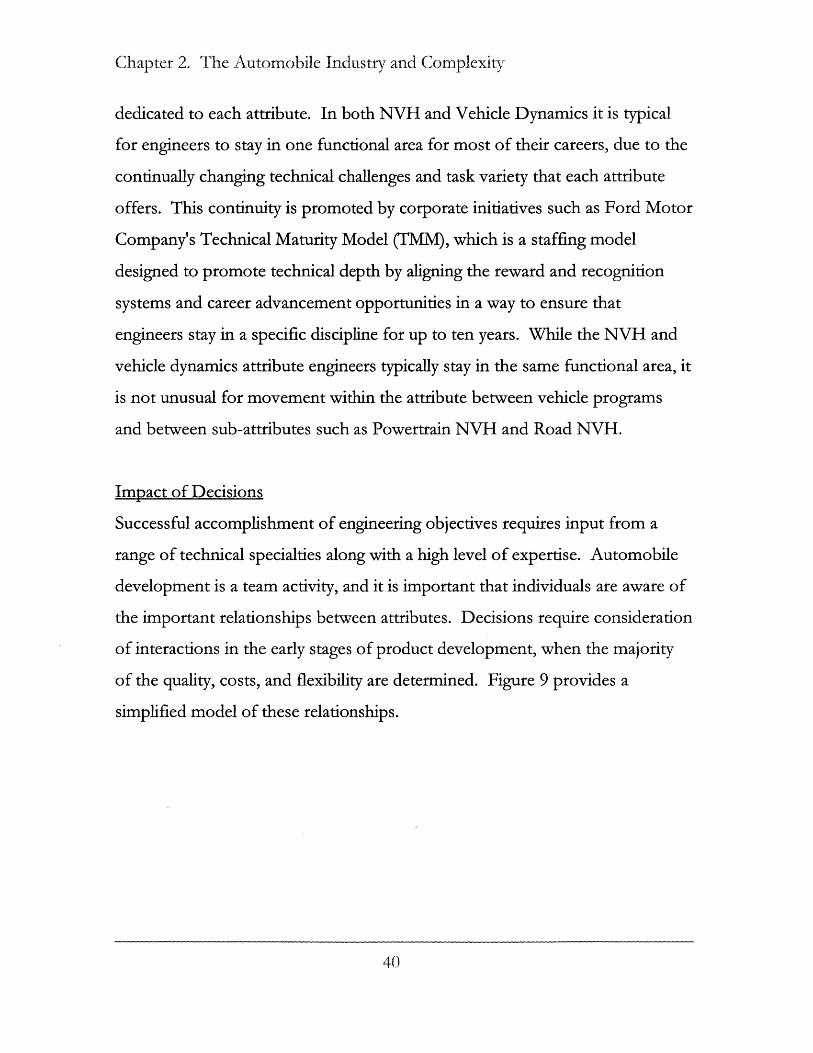
Program Attribute Teams (PAT's) are formed to facilitate communication for
each attribute. Functional targets are set for the critical Attributes. Program
Module Teams (PMT's) are formed to manage decisions for each of the key
functional domains. The Program Steering Team (PST) manages the decisions
affecting both the PAT's and PMT's. Figure 8 summarizes the general
responsibilities of the teams.
Figure 8. Responsibilities of the Program Teams in Ford Motor Company.
Program Steering Team (PST)- Sets direction including investment, quality, and process- Monitors the status of team deliverables at key milestones
Proaram Attribute Team (PAT) Program Module Team- Manages target-setting & cascading < - Manages the design & release- Manages attribute issues - Manages quality, timing, weight, & cost
Noise! Vibration/Harshness and Vehicle Dynamics
The functional attributes of Noise/Vibration/Harshness (NVH) and Vehicle
Dynamics are highly evolved at Ford Motor Company, as evidenced by the
amount of internal training, the number of intranet web sites, and staff levels
39
Chapter 2. The Automobile Industry and Complexity
dedicated to each attribute. In both NVH and Vehicle Dynamics it is typical
for engineers to stay in one functional area for most of their careers, due to the
continually changing technical challenges and task variety that each attribute
offers. This continuity is promoted by corporate initiatives such as Ford Motor
Company's Technical Maturity Model (IMM), which is a staffing model
designed to promote technical depth by aligning the reward and recognition
systems and career advancement opportunities in a way to ensure that
engineers stay in a specific discipline for up to ten years. While the NVH and
vehicle dynamics attribute engineers typically stay in the same functional area, it
is not unusual for movement within the attribute between vehicle programs
and between sub-attributes such as Powertrain NVH and Road NVH.
Impact of Decisions
Successful accomplishment of engineering objectives requires input from a
range of technical specialties along with a high level of expertise. Automobile
development is a team activity, and it is important that individuals are aware of
the important relationships between attributes. Decisions require consideration
of interactions in the early stages of product development, when the majority
of the quality, costs, and flexibility are determined. Figure 9 provides a
simplified model of these relationships.
40

ihapter 2. Th Automobslts a IFl ltry asd aCompxutno
Figure 9. Quality, Costs, and Flexibility as a Function of Lifecycle Phase.
Quacost
Desi
0 14
Lec a 7Lifecycle phase 2
lity determined &s committed
gn flexibility
Source:Russell B.Ford andPhilip Barkan
It is more difficult and costly to make changes in the later stages of vehicle
development, due to the escalating financial commitments and accumulated
output that requires rework. Figure 10 summarizes the typical relative cost of
correcting an error in design.
Figure 10. Relative Cost of Correcting an Error as a Function of Time in the
Development Process (Blanchard and Fabrycky).
1000
C00
0 10
0)
o 10
40-1000times
30-70
10
-6tirnes
times
eiC~0 e .4
ource B&F
41
0
4-
4-)
100
75"
50
25
04
04E7
ale
L
15-40;t iles
-
S

Chapter 2. The Automobile Industry and. Co mplexity
Similar relationships exist in automobile development. These relationships
drive the need to understand functional relationships at the earliest stages,
where the impact of changes is minimized.
Approach to Decisions
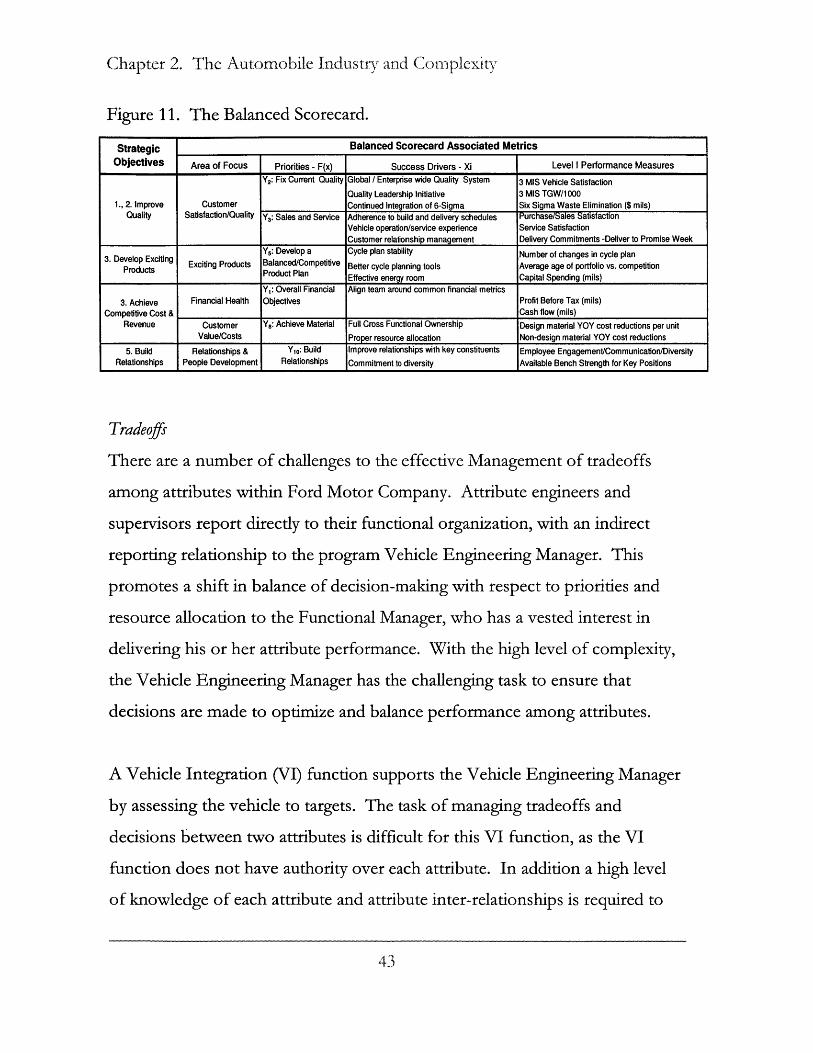
Balanced Scorecard
Ford uses the Balanced Scorecard (see Figure 11) to "operationalize" the
mission and strategy into a comprehensive set of performance measures that
provides the framework for a strategic measurement and management system.
This tool is intended to drive alignment and matching among different
elements of the product creation process at the highest levels of the
organization. The five priorities listed in Figure 3 are the main elements of the
first column of the Balanced Scorecard, which includes Financial Health. The
second column defines the "Back-to-Basic" (or Revitalization) priorities in Six
Sigma terms. The third column reflects the key success drivers that directly
impact the priority of f(x)s in 6 Sigma terms. The fourth column defines the
Performance Measures for the priorities. Each of these measures has a
corresponding target or metric, which is tracked by senior leadership. The
table has been modified to maintain confidentiality.
42
(hapter 2. The Automobile Industry and Complexity
Figure 11. The Balanced Scorecard.
Strategic Balanced Scorecard Associated Metrics
Objectives Area of Focus Priorities - F(x) Success Drivers - Xi Level I Performance Measures
Y2: Fix Current Quality Global / Enterprise wide Quality System 3 MIS Vehicle SatisfactionQuality Leadership Initiative 3 MIS TGW/1 000
1., 2. Improve Customer Continued Integration of 6-Sigma Six Sigma Waste Elimination ($ mils)Quality Satisfaction/Quality Y3: Sales and Service Adherence to build and delivery schedules Purchase/Sales Satisfaction
Vehicle operation/service experience Service SatisfactionCustomer relationship management Delivery Commitments -Deliver to Promise Week
Y5: Develop a Cycle plan stability Number of changes in cycle plan3. Develop Exciting Exciting Products Balanced/Competitive Better cycle planning tools Average age of portfolio vs. competitionProducts Product Plan Effective energy room Capital Spending (mils)Y,: Overall Financial Align team around common financial metrics
3. Achieve Financial Health Objectives Profit Before Tax (mils)Competitive Cost & Cash flow (mils)
Revenue Customer Ys: Achieve Material Full Cross Functional Ownership Design material YOY cost reductions per unitValue/Costs Proper resource allocation Non-design material YOY cost reductions
5. Build Relationships & Y10: Build Improve relationships with key constituents Employee Engagement/Communication/DiversityRelationships People Development Relationships Commitment to diversity Available Bench Strength for Key Positions
Tradeoffs
There are a number of challenges to the effective Management of tradeoffs
among attributes within Ford Motor Company. Attribute engineers and
supervisors report directly to their functional organization, with an indirect
reporting relationship to the program Vehicle Engineering Manager. This
promotes a shift in balance of decision-making with respect to priorities and
resource allocation to the Functional Manager, who has a vested interest in
delivering his or her attribute performance. With the high level of complexity,
the Vehicle Engineering Manager has the challenging task to ensure that
decisions are made to optimize and balance performance among attributes.
A Vehicle Integration (VI) function supports the Vehicle Engineering Manager
by assessing the vehicle to targets. The task of managing tradeoffs and
decisions between two attributes is difficult for this VI function, as the VI
function does not have authority over each attribute. In addition a high level
of knowledge of each attribute and attribute inter-relationships is required to
43

Chapter 2. The Automobile Industry and Complexity
make such tradeoff decisions. The VI function is left to monitor requirements
and design verification and validation efforts, arrange program documentation
and vehicle assessments at critical gateways, and plan and manage prototype
vehicles.
A key decision support system that is utilized at the time of tradeoffs is the
Product Attribute Leadership Strategy (PALS) document. The PALS
document provides high-level positioning of key attributes in a vehicle segment
context. For instance, a program strategy may be targeted for "Leadership"
within a vehicle segment for vehicle dynamics and "Among the Leaders" for
noise and vibration. This is the key document that attribute engineers use to
set corresponding vehicle level subjective and objective targets.
A second challenge for Program Management and the Vehicle Engineering
Manager is to make the best decisions between cost, weight, timing, quality, and
function. While cost, weight, and timing can be quantified early in a program,
the quality impact and functional or performance impact of decisions are more
difficult to quantify. Low relative vehicle quality and functional performance
can lead to lower customer satisfaction which can result in lower future sales.
Cause and effect are distant in time, making it easier to attend to the near-term
issues (e.g. cost and weight target deficiencies) rather than address the issues
that manifest in the long run.
Summary
This chapter characterized the structure of the auto industry and highlighted
key challenges that drive automotive complexity. A general description of the
44
Chapter 2. The Automobile Industry and Complexity
vehicle development process and organization at Ford Motor Company was
then reviewed. Finally, the importance of decisions and a number of the tools
used to support decision-making at Ford were discussed.
45

Chapter 2. The Automobile Industry and Complexity
This page intentionally left blank.
46

Chapter 3. Literature Review: Automotive Suspensions, Attributes, Cascades,Design Structure Matrix, Axiomatic Design
Introduction
This chapter presents key concepts related to automotive design and
development for the systems analyzed in later chapters and highlights literature
influential in thesis development. First, automotive suspension function and
terminology is discussed. Then a description of Vehicle Dynamics and NVH
attributes is presented. Then the methods used to cascade attributes to design
parameters are described. Finally, research papers related to the tools and case
study under investigation are noted. A detailed description of the methods
used in the thesis follows in Chapter 4.
Automotive Suspensions 0
The following describes automotive suspension function and terminology,
providing background for non-automotive readers. Chassis bushing design
parameters are then presented. Finally, two suspensions analyzed in a later
chapter are then described. This information is relevant in the analysis of the
technical challenge of rear suspension design as it affects vehicle dynamics and
NVH, which is considered in more detail in Chapter 6.
Function and Terminology
The primary functions of an automotive suspension system are to provide
vertical compliance to ensure that the wheels follow the uneven road to isolate
the chassis, body, and passengers from the road, and to maintain the wheels in
the proper steer and camber attitudes while reacting to control forces produced
by the tires. Figure 12 shows the Society of Automotive Engineers (SAE)
Vehicle Axis System.
47

Chapter 3. 1I-terature Revi ew: AutoMiotive Suspensions, Atributcs, (ascades,I)esign Structure Matrix, Axiomatic Design
Figure 12. Society of Automotive Engineers Vehicle Axis Definitions.
NIPitch WYa x
r oitudina
Lateral ISVertical
Suspension Designi
Vehicle Dynamics Compliance Strategy
In general, suspension geometry and compliance affect the transient handling
of a vehicle. One of the goals of suspension design is to minimize the
suspension geometry change during wheel impact to road perturbations and
during braking. Typical design strategy for vehicle dynamics chassis design
calls for an increase in suspension lateral stiffness to minimize deviation from
specified kinematic function that leads to undesirable vehicle motion during
impact, braking, and cornering loads.
Suspension Bushing Design
Bushings are the central components at the interface between NVH and
vehicle dynamics. NVH engineers desire soft bushings that provide better
isolation, while vehicle dynamics engineers typically desire stiffer bushings to
reduce chassis compliance and to improve vehicle response and steering feel.
For a chassis system, the bushing design requires optimization for NVH,
vehicle dynamics, safety and durability. Vehicle dynamics desires bushings that
48
Chapter 3. Literature Review: Automotive Suspensions, Attributes, Cascades,Design Structure Matrix, Axiomatic Design
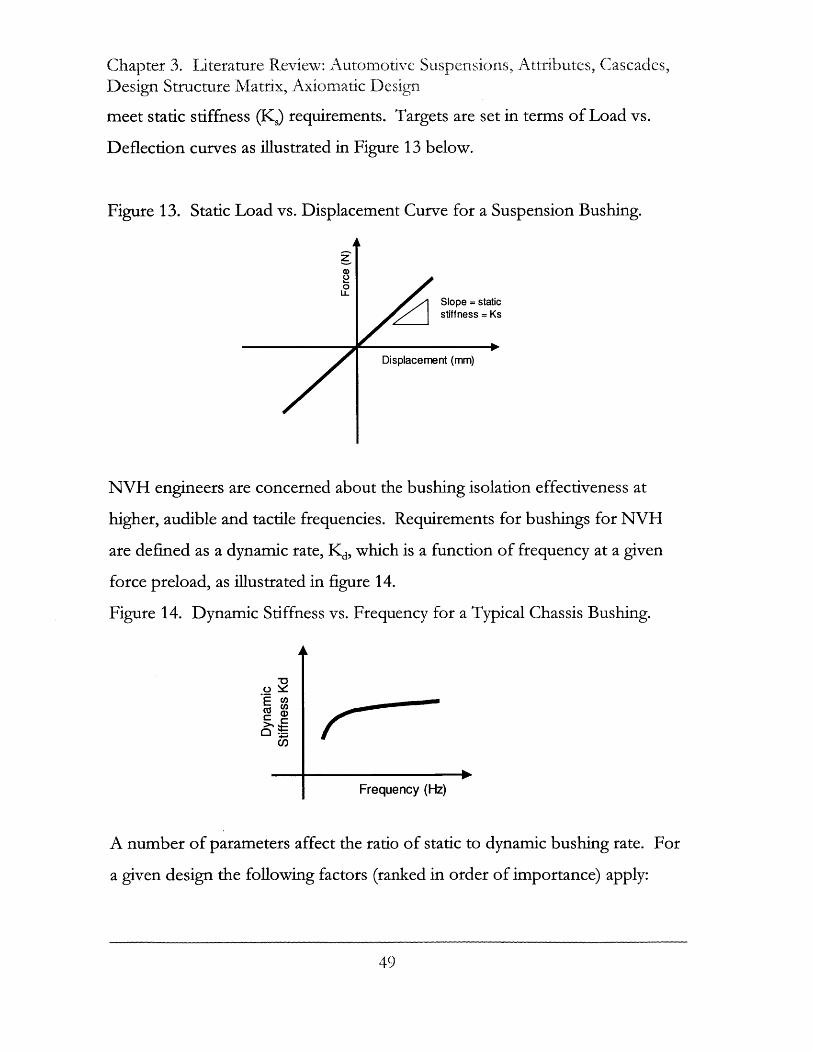
meet static stiffness (K) requirements. Targets are set in terms of Load vs.
Deflection curves as illustrated in Figure 13 below.
Figure 13. Static Load vs. Displacement Curve for a Suspension Bushing.
Slope = staticstiffness = Ks
Displacement (mm)
NVH engineers are concerned about the bushing isolation effectiveness at
higher, audible and tactile frequencies. Requirements for bushings for NVH
are defined as a dynamic rate, Kd, which is a function of frequency at a given
force preload, as illustrated in figure 14.
Figure 14. Dynamic Stiffness vs. Frequency for a Typical Chassis Bushing.
E
C-Frequency (Hz)
A number of parameters affect the ratio of static to dynamic bushing rate. For
a given design the following factors (ranked in order of importance) apply:
49

Chapter 3. iLiterature Review: Automotve Suspensions, Attributes, Cascades,Design Structure Matrix, Axiomatic Design
1) Compound Formulation - An elastomer specifically formulated for low
damping properties is important, as it specifically targets minimizing Kd/Ks.
2) Rubber Volume/Durometer at Chosen Design Size - These parameters are
coupled. Certain compounds offer improved flex life and offer maximum
tuning flexibility. When compound type/durometer are selected and a primary
rate target is identified, the rubber volume necessary to produce the part is
identified.
3) Design Type - Mold-bonded and swaged bushings offer both excellent
durability paired with favorable rate ratios. Some common rate modifiers are
detailed below:
* Rate Plates - A rate plate's primary application is to allow for high radial
rates with acceptable torsional angle capacities. Kd/Ks is typically
comparable to a bushing without rate plates. The main effect occurs only in
the shear rate(s) of the bushing.
- Voids - Voids serve to change the rate ratio(s) in a bushing. They can also
change the response of a bushing to a specific load application (e.g. - a
sharp turn up in rate after X mm of travel). A void placed in a primary load
direction can offer soft vehicle on-center rates paired with more robust
durability than an extremely soft solid bushing.
For a given static stiffness, an outside diameter increase will increase
compound stiffness, having a net negative effect on decreasing the ratio of
Kd/Ks. If matched with a corresponding inner sleeve ID increase, the Kd/Ks

Chapter 3. 1 .itCrature Revi'ew: Auitoiotive Suspe nsions, Attributes, Cascades,
.Design Structure Matrix, AxiomatIc Desig
may increase only slightly, but the mass of the bushing and its load carrying
capacity may trend toward over-designed.
Three-Link Solid Axle Suspension
Solid axles are designed such that the wheels are mounted at both ends of a
rigid beam, so that movement at one wheel is transmitted to the opposite
wheel, causing them to move together. Figure 15 below shows a typical three
link solid axle.
Figure 15. Three-Link (Solid Axle) Suspension.
Independent Short-long Arm (SLA) Suspension
Independent suspensions allow each wheel to move vertically without affecting
the opposite wheel. Figure 16 shows a typical independent rear suspension.
5i

(hapter 3. 1Literature Reviex: Automotive Suspensions,. Attribues, Cascades,Design Structure Natrix, Axiomatic Desgn
Figure 16. Independent Rear Suspension.
NVH and Vehicle Dynamics Attributes
This section provides a more detailed description of the NVH and Vehicle
Dynamics attributes, along with attribute cascades relevant to the analyses
presented in future chapters.
NT7H Attribute
The high-level attributes that define automotive NVH are listed in figure 17.
There is a corresponding subjective and objective requirement or set of
requirements for each attribute. Engineers in the NVH organizations are

Chapter 3. literature Review: Automotive Suspensions, Attributes, Cascades,Design Structure Matrix, Axiomatic Design
assigned to a specific program team. Within each program team engineers are
assigned to work on one or more NVH attributes throughout the program
development process.
Figure 17. Noise/Vibration/Harshness (NVH) Attributes.
Powertrain NVH Road, Wind, and Squeak & Rattle NVHIdle NVH Coarse Road NVHAcceleration NVH Rough Road NVHDeceleration NVH Impact (Over Obstacles) NVHCruise - Smooth Road NVH Smooth Road - Wind Noise
Automatic Shift NVH Squeak & RattleTip-in/Tip-out NVH Vehicle Interior Noise IsolationTake-off/Driveaway NVHEngine Start-Up/Shut-Off NVHSmooth Road (Medium Speed) NVH
Electrical/Mechanical and Sound Quality NVHInterior / Exterior Closures Sound Quality & VibrationInterior / Exterior Electromechanical Adjustment Devices Sound Quality & VibrationPrimary Control Mechanisms and System Operation Sound Quality & VibrationSecondary Control Mechanisms & System Operation Sound Quality & Vibration- Sound
NV7H Cascade of Functional Requirements to Design Parameters
A cascading process is used to ensure that the necessary parameters are
incorporated in the design to achieve vehicle level targets. Cascades also enable
different areas to work separately on major systems such as the body,
powertrain and suspension and provide a basis for cross-attribute trade-offs.
Cascades are also used to show technical capability and identify performance
gaps and organizational ownership.
Noise and Vibration engineers cascade vehicle level targets to subsystems and
components utilizing a number of tools and processes. First subjective targets
C53

(hapter 3. Literature Review: Automotive Suspensions, Attributes, Cascades,Design Structure Matrix, Axiomatic Design
are cascaded to objective targets for critical attributes. Figure 18 provides a
sample cascade for Road NVH.
Figure 18. Cascade Diagram for Road NVH From Subjective Targets to
Objective Targets.
Front Seat Sound(subj)
Subj/Obj.Correlation
Loudness - dB(A) Loudness - Sones
Customer-PerceivedRoad NVH
Steering WheelVibration (subj)
Subj/Obj.Correlation
Steering WheelVibration - Velocity
Seat Vibration (subj)
Subj/Obj.Correlation
Seat Track Vibration - Seat Track Vibration -Velocity Vertical Acceleration
Figure 19 provides further cascading from objective system-level performance
to subsystem and component performance in terms of design parameters. At
this level, design engineers utilize a number of analytical and experimental tools
to develop optimal designs considering functional performance, cost, and
weight.
54

Chapter 3. Literature Review: Automotive Suspensions, Attributes, Cascades,Design Structure Matrix, Axiomatic I)esign
Figure 19. Processes and Methods to Translate Road NVH Attributes to
Design Parameters.
Customer-PerceivedRoad NVH
Objective Targets
Root SumSquareAdditionCrl,
AirbouRe Noise Structure-boureContribution Noise Contribution
Multiplication h Multiplication
Tie adatd oie Body Acoustic Chassis/Suspension Body Acoustic /Vib.Attenuation t orct to Body Sensitivity
Subj/Obj.Correlation
Road Profile Tire/Road Force[ Transfer Function
This section demonstrated how NVH attributes are cascaded from functional
attributes to actionable design parameters for the example of Road NVH.
Similar cascades exist for the balance of NVH attributes.
Vehicle Dynamics Attribute
The high-level attributes that define Vehicle Dynamics are listed in Figure 20.
Much like NVH, there is a corresponding subjective or objective requirement
or set of requirements for each attribute. Engineers in the Vehicle Dynamics
organizations are assigned to a specific program team. Within each program
55)

Chapter 3. Literature Review: Automotive Suspensions, Attributes, Cascades,Design Structure Matrix, Axiomatic Design
team engineers are assigned to work on one or more vehicle dynamic attributes
throughout the program development process.
Figure 20. Vehicle Dynamic Attributes.
Ride SteeringPrimary Ride - Small & Large Amplitude Inputs Parking/ManeuveringPrimary Ride Control Straight Ahead ControllabilityPrimary Ride Comfort Cornering ControllabilitySecondary Ride -Flat & Rough Roads Steering Disturb/Error StatesImpacts - Small, Moderate & Large Inputs
HandlingCornering StabilityTransitional StabilityStraight Ahead Stability
Vehicle Dynamics Cascade of Functional Requirements to Desgn Parameters
The methods that vehicle dynamics engineers utilize to translate functional
attribute performance to design parameters include computer simulation and
on-road vehicle experimentation. The on-road vehicle experimentation will be
considered in greater detail in a later chapter when the vehicle dynamics tuning
process is analyzed. The vehicle dynamics engineer ensures attribute
performance is met through proper selection of chassis systems and
components. Potential vehicle error states that may be perceived by the
customer due to component and build variation are also considered in the
development process. Ride and Handling Health Charts are used to cascade
attribute requirements to design parameters. The health chart mission is to
deliver a set of requirements that provide fewer warranty and customer
56
Chapter 3. 1Literature Review: Automotive Suspensions, Attributes, Cascades,Design Structure Matrix, Axiomatic Design
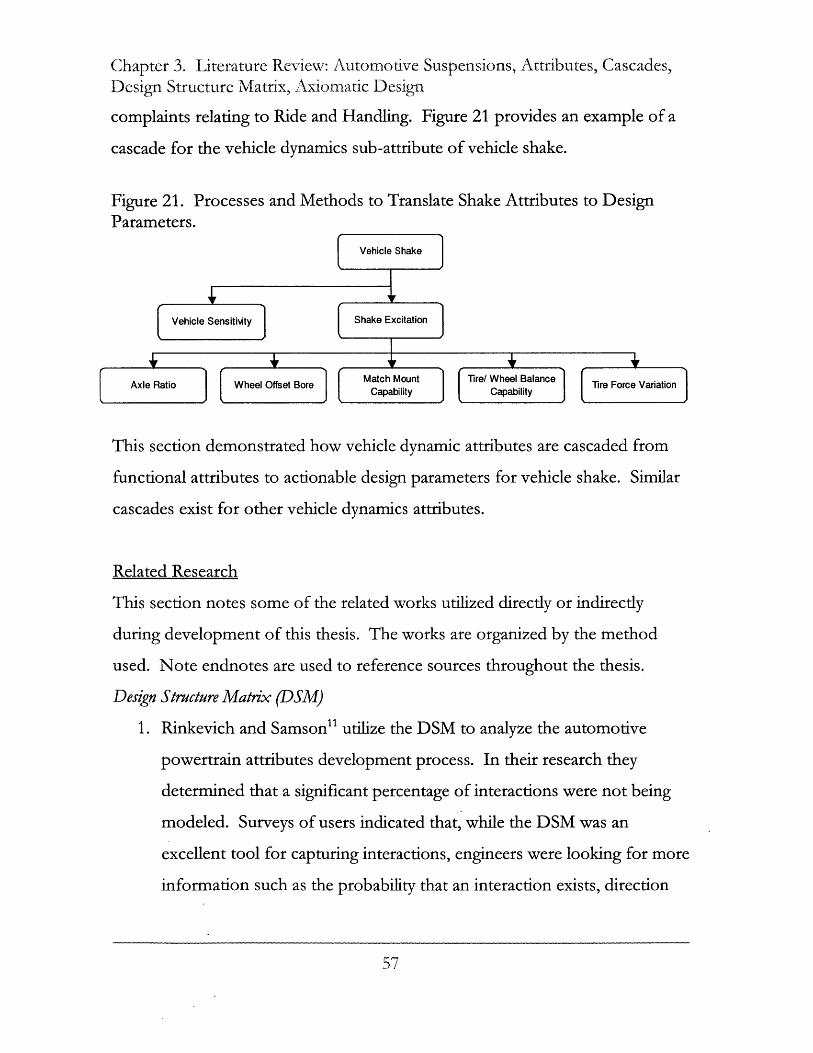
complaints relating to Ride and Handling. Figure 21 provides an example of a
cascade for the vehicle dynamics sub-attribute of vehicle shake.
Figure 21. Processes and Methods to Translate Shake Attributes to DesignParameters.
Vehicle Shake
LVehicle Sensi tiAty Shake Excitation]
Axle Ratio Wheel Offset Bore Match Mount Tire/ Whe Blanc Tire Force Variation
This section demonstrated how vehicle dynamic attributes are cascaded from
functional attributes to actionable design parameters for vehicle shake. Similar
cascades exist for other vehicle dynamics attributes.
Related Research
This section notes some of the related works utilized directly or indirectly
during development of this thesis. The works are organized by the method
used. Note endnotes are used to reference sources throughout the thesis.
Design Structure Matrix (DSM)
1. Rinkevich and Samson" utilize the DSM to analyze the automotive
powertrain attributes development process. In their research they
determined that a significant percentage of interactions were not being
modeled. Surveys of users indicated that, while the DSM was an
excellent tool for capturing interactions, engineers were looking for more
information such as the probability that an interaction exists, direction
57

Chapter 3. Literature Review: Automotive Suspensions, .Attributes, Cascades,Design Structure Matrix, Axiomatic Design
and level of interaction, and simple methods for understanding the
interactions.
2. Dong (formerly Hommes) and Whitney12 present a technique to obtain a
DSM from a design matrix, in an attempt to enable the use of DSM as
an analysis tool early in the design process, when critical design decisions
are made.
3. Dong 3 contributes tips to the process for developing a DSM to augment
the methods and approach described in Chapter 4 and based on the
work of S. Eppinger.
4. Yassine, Whitney, Lavine, and Zambito suggest that the greatest benefit
of a DSM model may come from "rewiring" or redefining relationships
among elements and/or inserting new elements, instead of the
traditional re-sequencing and partitioning tasks.
5. Daleiden investigates automotive flexibility as it relates to chassis design
and organizational complexity and introduces heuristics for evaluating
flexibility potential.15
Axiomatic Design and Suspensions
1. Suh and Deo presented an axiomatic design solution to remove the
coupling in the steering and suspension systems by making the wheel
alignment parameters independent of suspension travel.16
2. Guo and Xu analyze suspension design using axiomatic design
principles considering the suspension lift and collapse.
58

(hapter 3. Literature Review: Automotive Suspensions, Attributes, Cascades,Dcsign Structure Matrix, Axiomatic Design
Summary
This chapter provided a discussion of key concepts related to automotive
design and development for the systems analyzed in greater detail in later
chapters. The next chapter provides a detailed description of the methods used
in subsequent chapters.
59

Chapter 3. Literature Review: Automotive Suspensions, Attributes, Cascades,tcsign Structure Matrix, Axiomatic Design
This page intentionally left blank.
60

Chapter 4. Approach and Methods: The Design Structure Matrix andAxiomatic Design
Approach
The approach for the thesis is multifaceted and includes a case study, analysis
of three levels of Design Structure Matrices and an Axiomatic Design Analysis.
This chapter describes the methodology for each of these methods.
Case Study
The method of information gathering in the development of the thesis
included informal interviews with a number of stakeholders involved in the
design and development of a rear suspension system. The case study of a rear
suspension system was selected as it met a number of the challenges inherent in
large-scale systems. The case study provides the elements of a technical
challenge and the integration of business and engineering issues, while
encompassing detailed and broad issues that across different parts of the
organization. Three engineers, three Supervisors, and three Managers were
interviewed for this phase of the study. A discussion of the case study is
included in chapters 5 and 6.
Design Structure Matrix1 8
Description
The Design Structure Matrix (DSM) can be used as a system analysis and
project management tool. The DSM is a matrix representation of a complex
system that identifies interactions between system elements. The Matrix
contains a list of all of the relevant subsystems/activities and their
dependencies. The DSM can provide insights into how to manage a complex
system or project. The DSM highlights information needs and requirements,
task sequencing, and iterations. Relationships are tabulated in a matrix format.
Relationships under the diagonal represent the forward flow of information,
61

Chapter 4. Approach and Mthibods: TVh Desigi Structure Mattrix andAxiomatic Design
while dependencies above the diagonal represent feedback flow. Figure 22
shows a sample Design Structure Matrix.
Figure 22. Sample Activity-Based Design Structure Matrix (Source: Ulrich and
Eppinger, 1999).
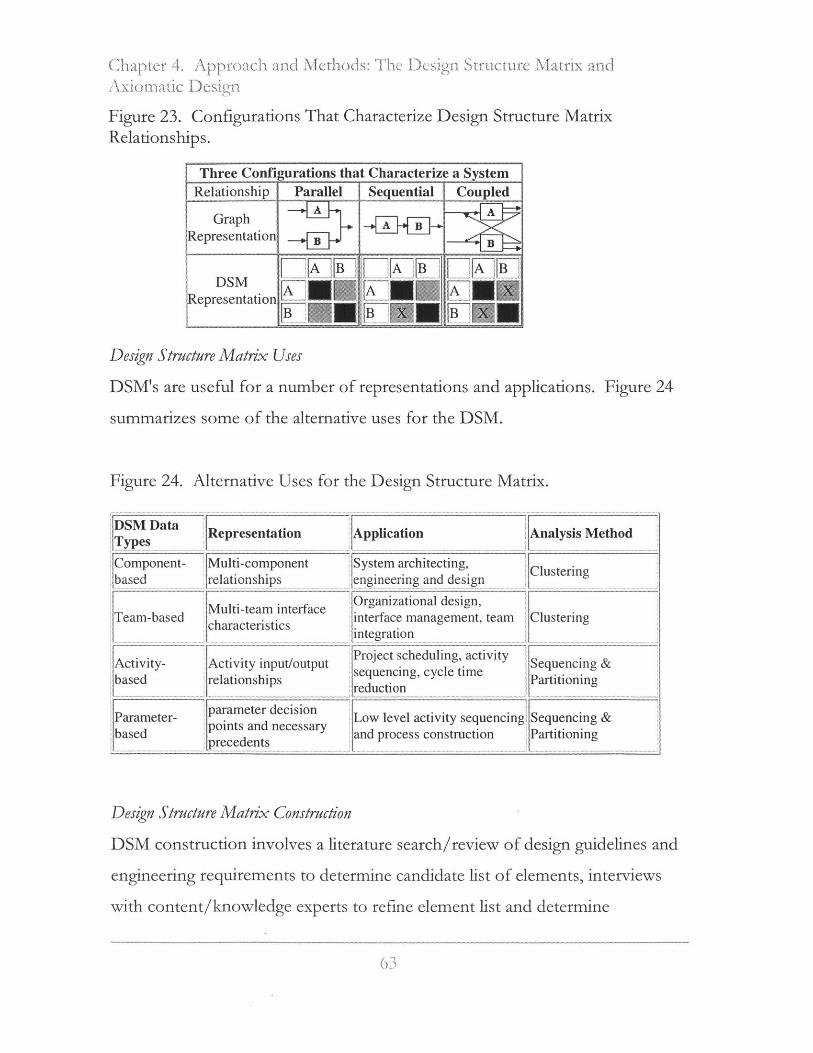
Relationships in the DSM can be characterized in three ways: parallel,
sequential, and coupled. Figure 23 summarizes the graphical and DSM
representations for these characterizations.
6 2
Chapter 4. Approach and Nethods: ihe Icsig i Structure Matrix aridAxiomatic Designi
Figure 23. Configurations That Characterize Design Structure MatrixRelationships.
Three Configurations that Characterize a SystemRelationship Parallel Sequential Coupled
GraphRepresentation, B
DSMepa _in AA F ARepresentation!
BE BINB
Design Structure Matrix Uses
DSM's are useful for a number of representations and applications.
summarizes some of the alternative uses for the DSM.
Figure 24.
Figure 24
Alternative Uses for the Design Structure Matrix.
Design Structure Matrix Construction
DSM construction involves a literature search/review of design guidelines and
engineering requirements to determine candidate list of elements, interviews
with content/knowledge experts to refine element list and determine
63
DSM DataRepresentation .Application Analysis Method
Types
Component- Multi-component System architecting, Clusteringbased relationships engieering and design C
Organizational design,Team-based I interface management, team Clustering
characteristics
Activity- Activity input/output Project scheduling, activity Sequencing &based relationships sequencg, cycle timeartitioning
reduction
Parameter- aaon Low level activity sequencing Sequencing &based and process construction Partitioning
1ase precedents
Chapter 4. Approach and Methods: The Design Structure Matrix andAxiomatic Design
interactions among elements, and representation of the resulting relationships
in a matrix format. Once the DSM is constructed, the results can be reviewed
and manipulated in order to improve the process. This reordering can result in
fewer and/or shorter iterative loops, reducing the potential for rework and
project delays. Among the tools of manipulation are partitioning, which is the
reordering of rows and columns to eliminate or reduce the number of feedback
relationships above the diagonal. For complex systems, the objective is to
move feedbacks as close to the diagonal as possible, to minimize the number of
elements involved in the iteration cycle. Tearing is the process of choosing the
feedbacks that, if removed, will convert the matrix to a lower triangular matrix.
Tearing reduces the set of assumptions that are needed to start the design
process when coupled tasks are encountered. Banding is the identification of
rows that constitute the critical path of the system or project. When two paths
(rows) do not depend on each other, they can be banded and executed
concurrently. Eppinger, Whitney, and Yassine provide additional insights into
the DSM uses and advanced methods of analysis and simulation using the
DSM.
Axiomatic Design19
Design typically follows the process of understanding customer needs, defining
the problem that must be solved, selecting a solution from possible alternatives,
analyzing and optimizing the selected solution, and verification and validation
of the resulting design. Axiomatic design is intended to reduce product
development risk, reduce cost, and speed time to market by:
* Formalizing the design process
* Communicating the design to stakeholders at earliest possible time
64
Chapter 4. Approach and Methods: The Design Structure Matrix andAxiomatic Design
- Improving quality of the design by analyzing and optimizing architecture
- Documenting and communicating the logical "how and why" of the design,
not just "what"
* Identifying design issues early to reduce rework and design-build-test-
redesign cycles
* Provide management with the dependency structure of the design,
facilitating scheduling and organizational alignment.
Axiomatic design is a structured, evaluative method of design created to
improve design activities by establishing criteria for which potential designs
may be evaluated and by developing tools for implementing these criteria.
Concepts of the Axiomatic Design process include the identification of
domains, establishment of hierarchies within the domains, and "zigzagging"
between domains to iterate on the design concepts while adhering to design
axioms. Axiomatic design considers the existence of four domains in the
design world: customer, functional, physical, and process. Customer attributes
{CA's}, functional requirements {FR's}, design parameters {DP's} an process
variables {PV's} are the characteristic vectors in each of these domains. Figure
25 summarizes these domains and vectors.
65

(hapter 4. AUppr ch .n Methods: The Designi Structure Ma;trix .indAxiom~iatic D~estgn
Figure 25. Axiomatic Design Domains.
mapping mapping mapping
{DP} {PVs}
Customer Functional Physical Processdomain domain domain domain
The process is based on the decomposition of a system into Functional
Requirements (FRs) and the introduction of appropriate system design
parameters that provide the physical solution selected to satisfy the functional
requirements. The Design Matrix (DM) is used to note the relationship
between design parameters and functional requirements as follows:
FRi _A 0 DPi
FR2 A12 A22_ DP2
Where All denotes the effect of DP1 on FR1, A21 denotes the effect of DP1 on
FR2, etc.
The choice of design parameters and ultimately the physical embodiment of the
design are guided by two design axioms:
- Axiom 1: Independence Axiom. Maintain the independence of all
functional requirements.

Chap ter 4. Approach and i.Methods: T1he Design Structure Matrix anAxiomatic Design
Axiom 2: Information Axiom: Minimize the information content of the
design.
These axioms provide a basis for judging whether or not a design is "good."
Each FR at each level of decomposition should have a corresponding DP
intended to satisfy that FR.
Independence Axiom
Designs that do not satisfy the Independence Axiom are called coupled.
Designs that satisfy the independence axiom are uncoupled or decoupled. The
design parameters are totally independent for uncoupled designs. Decoupled
designs have the situation where at least one Design parameter affects two or
more functional requirements. The matrices in figure 26 summarize the
relationships for the uncoupled, decoupled, and coupled designs.
Figure 26. Matrix Representations for the Uncoupled, Decoupled, and
Coupled Designs.
DP1 DP2 DP3 DP4 IDP1I DP2 DP3 DP4 DP1 DP2 DP3 DP4FR1MX 0 0 0FR2 0 0 0FR3 0 0 _ 0
FR1 X 0 0 0FR2 X 0 0FR3 X X 0
FR1 X 0 X XFR2 X M 0 0FR3 X X __ X
FR4 0 0 0 FR4 X X 0 FR4 X X 0
Uncoupled Design (preferred) Decoupled Design (good) Coupled Design (Undesirable)
N. Suh provides an everyday example of the Independence Axiom as illustrated
when considering water faucet designs. The two functional requirements for
the faucet are to control the temperature and control the flow rate. In the first
67

(hapter 4. Approach antid Metiods: The C g Srr ucture Matrix andAxiom,atic Desig n
design, Figure 27, the two design parameters are the hot and cold water
handles. This design is coupled because a design parameter (hot or cold
handle) cannot be adjusted without affecting both design functions
(temperature and flow).
Figure 27. Independence Axiom & The Coupled Water Faucet Design.
(1)S>
C> -
- 0I0
7- C\J
0 0X0X
Hot water Cold water
jH C
FR1 Adjust FlowFR2 Adjust Temp
The faucet in figure 28 provides an example of a design that satisfies the
Independence Axiom. The two design parameters, up/down and left/right
motion are totally independent from the design functions. This design is said
to be uncoupled.
Figure 28. Independence Axiom and The Uncoupled Faucet Design.
FR1 Adjust FlowFR2 Adjust Temp
C:
0:00
D
U)Hot water Cold water
F-I
C\J
a 00Fi Fo
685

Chapter 4. Approach and Methods: The Design Structure Matrix andAxiomatic Design
Information Axiom
The Information Axiom promotes the concept that when two or more
alternative designs satisfy the Independence Axiom, the best design is the one
with the least information. The "information" in this case is a measure of the
freedom of choice and uncertainty. A mathematical construct for the
Information Axiom is as follows: The probability of fulfilling a FR by a design
alternative is pi. According to probability calculus, the probability that all of the
FRs are satisfied at the same time is
Pi * P2 * . p...* p 0 < p<1, i1., n
Maximizing the probability that a design function is fulfilled is accomplished by
minimizing
E 10g2 (1 /Pi)
The logarithmic function is used because the information content requirements
will be additive when there are many functional requirements that must be
satisfied at the same time.
Summary
This chapter reviewed two systems engineering tools utilized in future chapters:
the Design Structure Matrix (DSM) and Axiomatic Design Concepts. The
Design Structure Matrix can be used as a system analysis and project
management tool, while Axiomatic Design is a structured, evaluative approach
to design. The next two chapters will apply these two tools to the automotive
development and design processes.
69
Chapter 4. Approach and Methods: The Design Structure Matrix andAxiomatic Design
This page intentionally left blank.
70

Chapter 5. Simplifying Conmplex interactions Using Design Structure Matrices
Design Structure Matrices
A key step in the development of the Design Structure Matrix (DSM) is the
selection of the proper scope. Eppinger, Whitney, and Yassine 2 state that
selection of too high a level of system abstraction might oversimplify the
design process and tend to ignore important sub-system interactions, while
selection of a system abstraction at a lower level may lead to diminished
intuitiveness of the DSM as the identification of important sub-system
interfaces becomes more difficult. They suggest that these difficulties can be
overcome by building a hierarchy of DSMs at different levels of abstraction.
The idea is to cascade the DSMs to increasing levels of detail until such time as
certain desired interactions are apparent at the lowest level. This chapter
provides a summary of a series of three Design Structure Matrices (DSMs) that
provide insights from three levels of abstraction. The first DSM was
completed by a team of students including the author as part of the Integrating
the Lean Enterprise Course at MIT. 21 The second DSM was developed by a
team as part of the course in System Design and Management at MIT. The
author generated the third DSM after review of process and design guideline
documentation and consultation with engineers involved in chassis system
development at Ford Motor Company. The three DSMs and three levels of
abstraction are summarized as follows:
1. An activity-based DSM across the Enterprise for a vehicle program.
2. An activity-based DSM within a vehicle program prior to program
approval.
3. A task-based DSM for a vehicle chassis tuning effort.
Figure 29 provides a graphical representation of the DSMs.
71

Chapter 5. Simplifying Complex Interactions Using Design Structure Matrices
Figure 29. Design Structure Matrices: Three Levels of Abstraction.
1. Enterprise DSM (1 Vehicle Program)
Customer Recycle/Requirements Cycle Plans Pre- <KO> Job#1 Mfg. Dealer Service Reuse
3. Chassis TuningTask-Based DSM
2. Pre Program Approval <PA> DSM
Enterprise Design Structure Matrix (DSM)
This section describes the method, results, and insights gained from the
analysis of the enterprise using the Design Structure Matrix.
Method: Enterprise DSM
The first DSM was developed for a vehicle program across the automotive
enterprise. The team developed the Enterprise DSM after completing the
process of Enterprise Value Stream Mapping. The Enterprise Value Stream
Mapping and Analysis (EVSMA) comprised of eight steps:
1. EVSMA Kickoff: Provides motivation, roles & responsibilities, and
training.
2. Stakeholder Value Exchange: Identifies stakeholders and their
contributions to the enterprise, along with the relative importance.
3. Strategic Objectives: Identifies the strategic objectives of the
organization.
4. Enterprise Processes: Defines the boundaries and processes being
analyzed.
72

Chapter 5. Simplifying Complex Interactions Using Design Structure Matrices
5. Enterprise Interaction: Assesses flow by investigating interactions
among processes & stakeholders.
6. Enterprise Waste: This section identifies the enterprise level waste in the
current state in terms of production, information, and enterprise waste.
Examples include waiting, transportation, inventory, processing, rework,
and defects.
7. Future State: This step creates the vision or desired state for the Lean
Enterprise.
8. Improvement Plan: This outlines the steps required to close the gap
between the current and desired states.
The scope of the Enterprise DSM includes relationships beyond the Product
Development Process. The relationships among the 29 tasks identified are
shown in Figure 30. Significant interactions were represented in the DSM by
type of interaction with "i" representing information exchange, "im"
representing material movement and "r" representing resource flow, which
includes money and people flow.

Chay.pter .im.plifying Complex interact s Um Vsing Design Structure MatriScs
Figure 30. Enterprise Design Structure Matrix.
12
3
Customer Needs Identification
Corporate Needs
Government Needs
4 Concept
5 R&D
6 Strategic Commodity Teams
7 Program Kickoff
8 Budget Allocation
9 Finance
10 Human Resources
11 Target Development
12 Suppliers
13 Purchasing
14 Resource Allocation
15 Design Activity
16 Quality
17 Information Technology
18 Design Verification
19 Manufacturing
20 Prototype Builds
21 Customer Feedback
22 Supply Chain
23 Transport
24 Dealers
25 Individual Customers
26 Fleet Sales
27 Leases
28 Service
29 Sales
EnterpriseNeeds
1 3 4 5 6 7 8 9 10 11 12 13 14 15 16 17 18 19 20 21 22 23 24 25 26 27 28 29
, , IProposal Evaluation
I I I R Resource DeploymentI I I R R R
i RR
R R
I t '' R R M M
R I I R R R R R
R R
I I
R
TargetDevelopment,Cascading &Verification
M
M M
M MM
Manufacturing and Distribution
Findings: Enterprise DSM
The team identified five task groupings or interaction blocks, named in this
analysis as follows:
1. Enterprise Needs.
2. Proposal Evaluation.
3. Resource Deployment.
4. Target Development, Cascading & Verification.
74
R
I R II I 1$I M
I') M M M M
M ;0 ]MI
1 211
M M M
M M 2,4 1 1 1
1 M 25I M
I M
t- 2 I I II I
I I
M'I
I i| 1
i iI I
M 28
M 29

(hapter 5. Simplifying Complex Interactions Using Design Structure Matrices
5. Manufacturing and Distribution.
The following describes each iterative block along with insights gained from
review of the high-level system analysis.
Enterprise Needs Block
The first set of coupled tasks encompasses key needs of the enterprise.
Customer, corporate and regulatory needs are considered during multiple
iterations by planning and marketing. This process typically takes six months
to converge on a proposal for a new or freshened vehicle. This block is
vulnerable to rework due to changes in market conditions, corporate financial
state changes such as cash flow constraints, and government legislation actions.
Proposal Evaluation Block
The second process block is comprised of steps to evaluate the potential of
successfully meeting the Enterprise Needs criteria. The team identified a
number of considerations that are addressed in this phase of the program:
- Is the technology proposed "Implementation Ready" (IR) or will it be IR by
the target development stage?
- Can the proposal meet safety and emission requirements?
- Will the concept meet high-level vehicle packaging and quality
requirements?
- Can the requirements meet the platform, system and component strategies
for commonality and reuse developed by the Strategic Commodity Teams?
IC)

Chapter 5. Simplifying Complex Interactions Using Design Structure Matrices
This assessment takes approximately six months. A Pre-Program team
summarizes the assessment, including the financial analysis. The data and
recommendations are reviewed in a series of meetings to achieve approval for
program kick-off <KO>. If <KO> is not granted, the process is re-started at
the Enterprise Needs Block. At this stage of the process major funds are not
committed and minimal engineering resources are used. The most critical
aspect of this block is the effective alignment of product assumptions with
anticipated market needs. There are a number of examples in the auto industry
of products that meet regulatory and quality requirements but do not interest
the customer. The result is lower-than-projected sales volumes, reduced
profits, and unacceptable returns on investment. One of the more difficult
tasks is to project accurate sales volumes. There must be discipline to resist the
temptation to inflate sales projections in order to improve financial projections.
Sales volume over-projections can lead to excess capacity and the commitment
of scarce resources to efforts that do not contribute to corporate profits.
There are a number of mechanisms built into the process to promote a
disciplined adherence to program gateway deliverables. The first is the
establishment and explicit identification of inviolable deliverables at each
gateway. Inviolable deliverables are deliverables that can not be traded off or
compromised. Written quantification of completion of inviolable deliverables
must exist. The second mechanism to promote adherence to program
disciplines at major gateways is less explicit and amounts to consensus building.
Senior management seeks commitments from major constituencies and
stakeholders with respect to their ability to deliver to the program objectives.
A high level of career risk and reward is placed on the Program management at
76

Chapter 5. Simplifying Complex Interactions Using )esign Structure Matrices
this time. History has shown that when chief program engineers do not deliver
a product that meets performance requirements for critical metrics careers are
adversely affected. On the other hand, if the team delivers to the program
objectives the chief program engineer typically is rewarded with promotional
opportunities.
Resource Deployment Block
Once a program is approved, the third coupled group of tasks initiates resource
deployment. Decision support systems are used to establish the engineering
and prototype resource budgets and detailed financial assumptions at this stage.
The first process uses the program information including the magnitude and
scope of change to forecast engineering and prototype requirements. The
second process involves the collection and analysis of detailed information in
order to refine financial assumptions. Once agreed, the funding and engineers
are deployed to work on the program. Issues with the staffing, prototypes, or
cost projections are addressed in the plan before it is submitted for re-approval.
This process block is subject to change and rework due to corporate initiatives
external to the program. Organizational headcount reduction tasks and
prototype cost reduction efforts that are prescribed to programs independent
of program resource requirement needs analyses are examples of such
externalities.
Target Development, Cascading & Verification Block
The next process block involves target development, cascading and
verification. This cluster of tasks encompasses the Ford Product Development
System (FPDS) process. A new program process can take up to 52 months to
Chapter 5. Simplifying Complex Interactions Using Design Structure Matrices
complete, depending on the program scale. Iteration occurs at this time due to
the constant flow of new information, material and resources from design
activities. Changes can occur as a result of prototype builds/drives,
unanticipated test results and manufacturing readiness assessments. If issues
are not resolved within the target development and cascading block, it is typical
for the process to loop back to the resource deployment block. There is also
the potential to loop as far back as the Enterprise Needs Block, where there is a
risk of canceling the program.
Manufacturing and Distribution Block
The fifth major grouping of interactions takes place in the manufacturing and
distribution stages, mainly by way of material and information flow. This
group of tasks includes the program launch phase of the process.
Communication and urgency levels increase as pre-production vehicles go
through the assembly process. Changes are discouraged at this stage of the
process. Decisions have to be made expediently in order to minimize the
potential of delaying the start of production. Unintended interactions in the
complex systems or unanticipated effects of component variation are
discovered at this stage. Rework can result in costly delays in vehicle shipment
and sale. Release of vehicles with suspect quality can result in high initial
warranty costs and potential recalls.
Insights: Enterprise DSM
The Enterprise is shown to be a useful tool to highlight critical interactions and
to facilitate dialog among constituencies. The DSM representation at the
Enterprise level also provides a way to highlight risks and communicate
78

Chapter 5. Simplifying Complex Interactions Using Design Structure Matrices
lessons-learned through utilization of examples and case studies. While there
can be debate about the strength and nature of the interactions highlighted in
the Enterprise DSM due to over-simplification at the high level of abstraction,
the analysis does yield useful insights. This section summarizes a number of
the insights that emerge from analysis of the Enterprise DSM.
At the enterprise level, iterative loops are long. Long product development
cycles increase the difficulty of aligning product attributes and customer wants
and increase the level of rework due to changing customer needs (Task 1).
Examples of the lack of alignment of customer wants and product assumptions
are apparent throughout automotive history, with examples that include the
Edsel in 1957 and the Pontiac Aztec in 2000. Both products did not meet the
customer need for preferred styling, resulting in poor sales, which led to unmet
corporate needs (profits). In circumstances where products do not satisfy
customer wants, product updates must be incorporated sooner than originally
planned. This can manifest in major styling and product "freshenings" in one
or two years after product release, or in the ultimate cancellation of the product
and elimination of use of the brand nameplate in the marketplace. This also
generates significant waste, as the investment in brand equity is lost.
Government Needs (Task 3) can introduce another significant iterative loop in
the Enterprise DSM. Major automotive systems such as the body structure
must be designed upfront to meet Government safety regulations that may
emerge throughout the platform lifecycle, which can be more than ten years. If
future Government requirements are not anticipated upfront, the platform
reuse and extension opportunities are limited.
79

Chapter 5. Simplifying Complex Interactions Usingl Design Structure Matrices
Another example of the high level interactions involved at the enterprise level
relates to purchasing and supplier selection (Tasks 12 and 13). Global
monetary fluctuations can lead to adverse effects on the costs and financial
performance of the program. Recognition of this interaction can lead to
improvements in the sourcing strategy in order to improve robustness to
variation in global monetary fluctuations and supplier business practices.
Design Verification (Task 18) presents interactions that, if not managed, can
result in significant program rework and added costs. If the design does not
meet performance requirements, redesign or changes to program assumptions
is necessary. The impact of an unmet functional requirement can manifest in
the deletion of a planned vehicle option in the event that the unmet
requirement involves a non-critical subsystem or feature. Another impact of
unmet requirements is late changes to the program, which increase the risk that
quality issues will reach the customer.
The level of fleet and lease sales (Tasks 26 and 27) can have a financial impact
on the vehicle program. Increased levels of fleet sales can lead to lower vehicle
residual values. The residual value is the amount that a customer can purchase
the vehicle for at the end of a lease. Lower residual values result in the need
for the company to set higher monthly lease payments in order to meet
sufficient overall profits on the lease transaction. High volumes of off-lease
and fleet vehicles in the market lead to lower resale values. The resale value is
one of the factors considered in vehicle purchase and is an influential element
in consumer buying guide recommendations in such publications as Consumer
80

Chapter 5. Simplifying Complex Interactions Using Design Structure Matrices
Reports. Appendix A provides a simple model of a number of the system
dynamics of program decisions.
Conclusions: Enterprise DSM
The Enterprise that delivers an automobile is highly complex. Involved are
many relationships and interactions among people handling the millions of
tasks required to translate an idea into a tangible product in the marketplace.
Success in the automotive industry can result only as automotive companies
continue to acknowledge and develop the mechanisms, tools, processes, and
people capable of embracing and managing this complexity. The relationships
in the highly abstract, simplified Enterprise DSM presented can be debated.
The Enterprise level DSM is not intended to be a prescriptive tool for the auto
industry, but rather a descriptive tool to allow individuals with a wide range of
experience and backgrounds the ability to communicate with one another.
Information Management
Information flows permeate every level of the organization, as exhibited in the
Enterprise DSM. This highlights the need for and significance of a sound
corporate strategy to facilitate information flow. Ford Motor Company has
invested significantly in information systems at many levels and within many
domains. A recent interoffice news profile of Dr. Richard Riff, the Ford
Technical Fellow in computer-aided engineering includes a story about a very
old-fashioned technologist -- the village cobbler of centuries ago highlights the
challenge.
81

Chapter 5. Simplifying Complex Interactions Using ) Design Structure Matrices
"The cobbler knew how much his customers could afford to pay and what kind
of shoes they needed. He sketched the shoes, then made them and sold them.
When a shoe was damaged, he fixed it. And when the villagers found their
shoes wearing out, they brought them back to the cobbler, who reused the
leather in new shoes. The cobbler had mastered every stage in his product's life
cycle -- market research, design, manufacturing, pricing, sales, service and
recycling. The flow of information was flawless because the phases of the life
cycle were contained inside a single brain. The life cycle of a Ford automobile,
Riff points out, contains precisely the same phases. But information about the
phases is split into a million fragments and spread around the entire world,
among countless brains and computers. The task ahead, Riff says, is to
reconstitute the mind of the cobbler -- to bring all the information back
together in a seamless system.""
Ford Motor Company's strategic information management approach is referred
to as C3P, an acronym of acronyms that stands for computer-aided design
(CAD), computer-aided manufacturing (CAM), computer-aided engineering
(CAE), and Product Lifecycle Management (PLM). This strategic initiative is
critical in the increasingly complex global automotive market.
82

Chapter 5. Simplifying Complex Interactions Using Design Structure Matrices
Pre-Program Design Structure Matrix
The enterprise level Design Structure Matrix identified insights at the highest
level, simplifying the interactions in order to gain a perspective of the overall
automotive enterprise function. Insights from the Enterprise DSM highlighted
the importance of making the proper decisions in the early program stages in
order to minimize large iterative rework loops later in the product development
and production process stages. In this section the focus is sharpened in order
to understand the interactions involved in the critical pre-program process in
more detail.
Method: Pre-Program Approval <PA> DSM
The objectives of the development and analysis of the DSM at the Pre-program
level were to determine the critical iterative loops, key interfaces, and
opportunities for process simplification through task re-sequencing and matrix
partitioning. The approach involved the collection and review of FPDS
process documentation, review of program-specific data (history) for two
programs, and stakeholder interviews. The FPDS task list from program kick-
off, <KO> to Program Approval, <PA> consisted of more than 800 items.
These items are associated with the left side of the "V" on the "system V"
model. The tasks were reviewed, filtered, and synthesized in order to reduce
the number of tasks to a manageable level prior to DSM construction. Non-
critical, low-level, and non-program functional tasks were removed and parallel,
similar tasks were consolidated. Figure 31 outlines the Pre-program DSM task
list development.
83
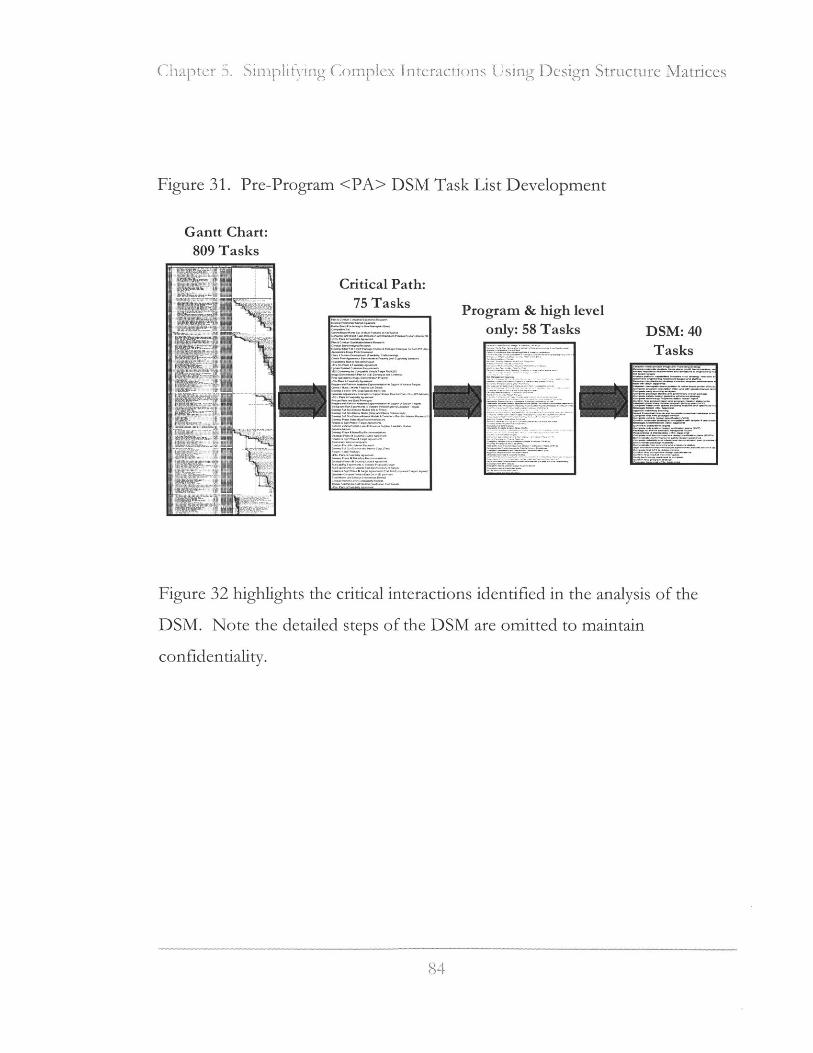
Chapt'r i Simpl.Iyingr Cmpl Intrract(ois Using Dcsign Structure Matrices
Figure 31. Pre-Program <PA> DSM Task List Development
Gantt Chart:
809 Tasks
Critical Path:
75 Tasks
Emmac~iewm~ IProgram & high level
only: 58 Tasks
I*
Figure 32 highlights the critical interactions identified in the analysis of the
DSM. Note the detailed steps of the DSM are omitted to maintain
confidentiality.
U- 1, 1 DSM: 40Tasks
2

Chapter 5. Simplifving Conplex Intenactions Using Design Structure Matrices
Figure 32. Pre-Program Approval Design Structure Matrix.
Set Strategy
r1 2 3 4 5 6 7 8A 10 11 12 13 14 15 16 17 18 19 20 21 22 23 24 25 26 27 28 29 30 31 32 33 34 35 36 37 38 39 40Establish initial product image and marketing strategyDevelop corp. strategy (cycle plans, profit, benchmarkin,Identify regulatory requirements and engineering deviatiSet target rangesAnalyze platform capabilities (modal strategy, new techrDetermine engineering headcount, budget and staffingDevelop manufacturing strategy including supplier park/Kick-off <KO> ApprovalEstablish nameplate brand position & refine brand profilComplete program description letter and updated targetComplete early sourcing work planComplete package studies and preliminary overall pack;Complete safety design guideline adherence strategyComplete technology "implementation ready" reportConfirm final product vision and program mission statenEstablish preliminary vehicle program (timing) plan (VPIComplete initial order guides including features and optiStrategic Intent <Sl> ApprovalApprove make/buy sourcingSelect powertrain line-up and complete powertrain packComplete first APO prototype vehicleComplete Vehicle Design Specification (VDS)Confirm corporate strategy is compatible with targets arStrategic Confirmation <SC> ApprovalCommit subsytem targetsComplete subsystem design verification plans (DVP)Package for theme selection harpoints frozenProportions & Hardpoints <PH> ApprovalComplete end-item/component design verification plansDemonstrate conformance to safety design guidelinesComplete reliability and robustness demonstration planDemonstrate package feasibilityDemonstrate fuel economy and emissions statusSign end-item/component target agreements (targets bComplete first AP1 prototype vehicleConfirm final component design specificationsConfirm final market mix/order guideVerity technology readiness is completeConfirm final program strategyProoram Atoroval <PA> Anoroved
1 11 1
1 1
111 1 1 1
1 1 11 11 1111 11 1 1
11 111 1 1
SelectAlternative
1 1
1 1 1Set Targets
1 1 1o141
11 1 1 1
111 i141 1 1 1
1111 1 111111 1 1 1 1
1 1 1 11 1 1
1 1 1 11 11 1
Findings: Pre-Program DSM
The Pre-Program DSM provided more detail in terms of task definition and
interactions among the tasks than the Enterprise DSM. Three prominent
iteration blocks emerge from the Pre-Program DSM. The team's task re-
sequencing exercise resulted in only a few task sequence changes, which
provided little impact to the overall process. The three iteration blocks are
identified; the Set Strategy, Select Alternative, and Set Targets blocks. In
general programs iterate within these blocks and do not return to earlier blocks,
with a few exceptions. There have been cases where external market or
85
1 111
1
1i 111
11
I
111
111
111

Chapter 5. Simplifying Complex Interactions Using Design Structure Matrices
internal financial conditions have driven change and iteration that skips back
more than one block. Such iteration can introduce significant delays, rework,
and risk to programs. The following sections describe the three blocks in more
detail.
Set Strategy Block
The Set Strategy Block considers the product options given the financial and
resource constraints along with the high-level market wants. At this stage
information external to the program is a key driver in program assumption
development. Some of the questions answered at this stage of the program
include the following:
- Does the program fit within the limits and capabilities of the platform
constraints?
* Is it generally feasible, including profitability, targets, resources, and
strategy?
- Does manufacturing and supply chain capacity exist?
* Can it compete in the marketplace?
Select Alternative Block
The Select Alternative Block selects a prime alternative among alternatives and
adds refinement to the plan and assumptions. During this iteration loop, the
program proposal communicates assumptions to the functional areas in order
to establish design feasibility confirmation. Iterations take place as tradeoffs
are made. This group of tasks is critical in balancing the product between
styling, safety/regulatory and attributes. Multiple iterations of this loop take
86
(hapter 5. Simplifying Complex Interactions Using Design Structure Matrices
place due to the resources and investment required to continue beyond this
point in a program.
Set Targets Block
The Set Targets Block answers the question of "How do we do it?" The focus
is on the cascade of requirements both from system to component level and
downstream to production requirements. The information from the Target
Development and Cascading Block is further developed in order to confirm the
program strategy. Targets are cascaded at the later stages of this block from
the vehicle and system levels to the subsystem and component levels. The
potential cost and timing impact of requirement non-compliance can be
significant post <PA> as iterative loops are large and may involve target
deviations or program assumption changes. It is critical at this stage that
functional targets are balanced with cost, weight, quality, and timing
requirements. This stage in the process takes approximately one year. In many
instances analytical verification methods are used to highlight and correct
potential issues that can lead to requirement non-compliance. Component
bench tests are another method used to decouple verification test plans in
order to allow parallel work streams. Late rework discovery especially close to
<PA> causes major timing issues. A typical response of rework discovery is to
compress downstream activities in order to maintain vehicle production and
Job<1> dates. A slip inJob<1> date can result in the loss of competitive
advantage in the marketplace and a loss of confidence among Wall Street
investment and credit rating analysts.
87

Chapter 5. Simplifying Complex Interactions Using Design Structure Matrices
Key Interfaces
Criteria were developed to determine the key Interfaces in the Pre-Program
DSM, including considerations such as the potential for major rework or
retiming in the event that a particular requirement is not met. Based on the
considerations identified, the team highlighted the following as key interfaces in
the Pre- <PA> DSM:
" Marketing and Engineering: Must achieve market wants, must be
functionally achievable.
* Engineering and Finance: Must be functionally achievable and affordable.
- Engineering and Manufacturing: Must meet function and must be able to
assemble it.
* Marketing and Finance: Must be able to sell X amount and provide Y ROI.
Examples in the auto industry where key interfaces were not managed until late
in the development process, when a high level of costs were incurred, include
the following:
. Marketing and Engineering: Designing and developing a vehicle for an
overseas market then determining not to ship the vehicle. Installing a low-
powered engine in a vehicle then deciding not to sell it.
- Engineering and Finance: Designing and developing a vehicle with
sophisticated systems then reverting to simpler, lower cost systems later to
achieve profitability.
* Engineering and Manufacturing: Developing systems that cannot be
assembled due to package constraints.
88

Chapter 5. Simplifying Complex interactions Using Design Structure Matrices
While these examples do not occur often, the costs of such situations can be
significant due to the long iterative loops and substantial resources involved.
Insights: Pre Program Approval <PA> DSM
Opportunities to Smphk
The Pre <PA> process is complex. Efforts that lead to a reduction in the
complicatedness provide high leverage and minimize the potential for
mismanagement of interfaces that have a significant impact on the success of
the program. The general insights follow.
1. Decouple generic information from program-specific information.
Information decoupling will allow the removal of generic information
requirements from the critical path, which will allow the team to focus
on the program-specific information and communication. Generic
information that is removed from the critical path can be maintained on
an on-going basis so that the information is available when required by
the programs. Examples of such information include market data,
quality data, and objective performance data for the relevant
competition.
2. Communicate downstream risks upstream to reduce the potential of
rework. There is a great deal of information that can be reviewed to
ensure that mistakes made on vehicle programs in the past are not
repeated. Examples of such information include the analysis of late
changes of past programs and the root-causes for the changes.
Databases such as Global 8-D's and 6-Sigma DMAIC reports can be
89

Chapter 5. SimpiyitNing Complex interactions Using Design Structure Matrices
reviewed to ensure that the issues that could affect the new program are
considered upfront. Global 8D refers to an internal Ford Motor
Company best practice problem solving process and computerized
archival system that merged elements of different organizational
approaches to solving problems into one process and one database. The
corporate-wide process and supporting system is available to employees
and suppliers in an effort to provide a common source of lessons
learned. Six-Sigma is a methodology that applies a set of statistical tools
to help improve quality in an organizations products and services. It
attempts to systematically reduce variability in any business or
manufacturing process, while also reducing or eliminating defects. The
core of the Six Sigma methodology is referred to as DMAIC - Define,
Measure, Analyze, Improve and Control.
Conclusions: Pre-Program DSM
Where the Enterprise DSM analysis emerged with the central conclusion that
stressed the importance of a comprehensive information management strategy,
the Pre-Program analysis stresses the importance of interface identification and
management and reuse strategies.
Interface Management
Interface management is accomplished in a number of ways and in a number of
domains at the Pre-Program phase of the automobile development process.
The organizational structure can be aligned to facilitate communication
between individuals. At Ford Motor Company, the organization has oscillated
from a program-based to a functionally based emphasis. Organizational
90

Chapter 5. Simplifying Complex Interactions Using) Design Structure Matrices
differences lead to differences in incentives and individual performance criteria.
The scope of this thesis does not include the analysis of the strengths and
weaknesses and particular recommendations for organization structure, but
rather focuses on the need to establish explicit interfaces for critical
requirements and where critical decisions are made. This will allow the team to
function more effectively regardless of the type of organizational structure
deployed. When interfaces are made explicit, e.g. through requirements
management, people better understand their role in terms of information
transactions. Dong points out in DSM development that people are
reasonably accurate in answering what "information" they need before they can
do there job, and where to get this information, but are less aware when it
comes to knowing where their information goes and who uses it. Strategies
that foster interface management include co-location of teams and an explicit
meeting cadence, which facilitate communication of expectations and
deliverables.
Reuse
A number of program specific conclusions are apparent when one considers
the Pre-Program DSM and the automobile company that produces multiple
products. The first is that there are significant benefits of reduced rework and
iteration through the reuse of platform, system, subsystem, and components.
Thoughtful reuse of platforms, systems, subsystems, and components can
reduce the level of resources required for many of the tasks highlighted in the
Pre-Program DSM (figure 32). Many steps in the process are simplified
through reuse. Many tasks become information-based instead of test or
analysis-based when incorporating a reuse strategy. For example, verification
91

C;hapter 5. Simplifying Complex Interactions Using Design Structure Matrices
for a particular functional requirement that is reused typically involves the
confirmation of the validation information, rather than conducting additional
component test and analyses. Reuse also allows the Enterprise the opportunity
to manage the overall scope of the product and production portfolio and
smooth resource allocation. A number of the automotive manufacturers will
elect to change one major system such as the body, chassis, engine, or assembly
plant at a time, so as to reduce complexity and minimize the potential for
significant rework.
Vehicle Chassis Tuning Task-Based DSM
The enterprise and pre-program DSMs considered the interactions among
activities on a vehicle program. Interactions that take place at a lower level of
abstraction are considered next. The analysis that follows is an investigation of
the task sequence for chassis tuning for vehicle dynamics and NVH. The goal
is to highlight critical interfaces that affect both attributes and to extract
insights relative to task sequence and the overall process. The scope of the
DSM includes the chassis "tunable" parts. These consist of the suspension
components that require modification once vehicle prototypes are available and
overall system performance can be assessed.
Method: Task-Based Chassis Tuning DSM
A chassis tuning Design Structure Matrix was developed with inputs from
tuning process documentation and Vehicle Dynamics subject matter experts.
The original task list consisted of twenty-nine (29) tasks. The build, final
assembly, pre-tuning, and tuning subtasks were consolidated from seventeen
(17) to four to simplify the analysis.

Chapter 5. Simplifying Complex Interactions Using) Design Structure Matrices
Findings Task-Based Chassis Tuning DSM
The chassis tuning DSM is summarized in Figure 33. If the desired vehicle
dynamic properties do not meet target levels, one of two things occurs: either a
target deviation is submitted or the process iterates back to the suspension
geometry, necessitating significant rework. The chassis tuning process DSM
indicates a process that is generally well sequenced, with no significant re-
sequencing opportunities to reduce time or rework. This is the result of an
evolved process that has been applied by an engineering community with a
significant history with and knowledge of the tuning process.
The importance of ordering the proper range (stiffness, damping, etc.) of
tuning component alternatives is apparent when considering the potential
feedback steps. If the vehicle does not exhibit target performance levels while
meeting functional requirements once the tuning process is complete,
additional parts may be necessary. This will result in long delays as parts are
ordered, fabricated, and measured. A second insight from review of the task-
based DSM is the high level of iteration involved in the tire, bushing, and shock
tuning block.
93
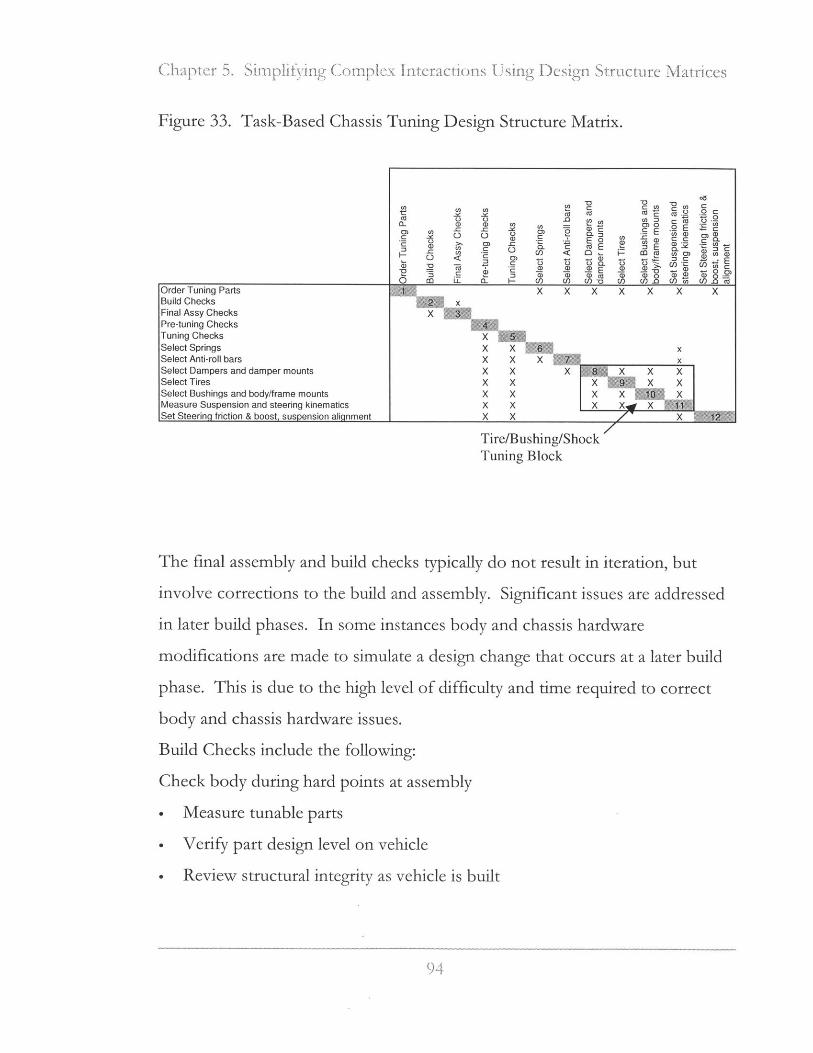
5er . S1i 1plifying Complex Intcratios sing Design StrLctcUre Matrices
Figure 33. Task-Based Chassis Tuning Design Structure Matrix.
CO
0)
C)0)
*0nm
0
0
C-)
UD
0)
Z3)
U)
00)-c00)CC
0)
CL
C')
0)0)75
CU
0
.-LZ)
0)
Ml
CJU)
E20ca E
a0)
C)-n
0)
C.)
_00) 0
0) 0
l
*0
CL
Cn
0)
W
0j;
Order Tuning Parts X X X X X X XBuild Checks xFinal Assy Checks XPre-tuning ChecksTuning Checks XSelect Springs X X xSelect Anti-roll bars X X X xSelect Dampers and damper mounts X X X X X XSelect Tires X X X X XSelect Bushings and body/frame mounts X X X XMeasure Suspension and steering kinematics X X X X X MWSet Steering friction & boost, suspension alignment X X X
Tire/Bushing/ShockTuning Block
The final assembly and build checks typically do not result in iteration, but
involve corrections to the build and assembly. Significant issues are addressed
in later build phases. In some instances body and chassis hardware
modifications are made to simulate a design change that occurs at a later build
phase. This is due to the high level of difficulty and time required to correct
body and chassis hardware issues.
Build Checks include the following:
Check body during hard points at assembly
* Measure tunable parts
* Verify part design level on vehicle
* Review structural integrity as vehicle is built
94
C,OC
rCL)
C
0 )U0
(l0

Chapter 5. Simplifying Complex Interactions UsingiDesign Structure Matrices
Final Assy Checks include the following:
" Check suspension components for looseness
- Verify fastener torques
* Verify ride heights
- Check and set suspension alignment
* Collect Kinematics and Compliance measurements & verify to design
- Verify suspension travels
- Check for chassis/bushing groundouts
- Neutralize all suspension, exhaust system, body/frame/engine mounts
The largest iterative block, tire/bushing/shock tuning, in some instances also
includes spring and anti-roll bar selection. More than 100 iterations can occur
before a solution is reached in this iterative block. Pre-tuning and tuning
checks involve some of the following:
- Check and reduce friction in suspension and steering to meet system targets
- Set rotating mass imbalance to production specifications.
- Check steering and suspension components for lash, build quality and
general integrity.
* Check tire pressures daily
* Repeat appropriate checks from Final Assembly list for every component
change
- Use consistent vehicle loading
When prototype vehicles are dedicated to the tuning process some of the pre-
tuning checks can be avoided, depending on the part changes involved. In
instances where prototype vehicles are shared among development engineers,
9 5
hapte 5.pex interactions Using Design Structure Matrices
these steps need to be conducted. In some instances these checks do not occur
due to the compressed schedule of the shared vehicles. This drives additional
risk of more rework due to late rework discovery in the event of pre-tuning and
vehicle setup issues.
Tuning DSM Insights: NVH and Vehicle Dynamics Interactions
Two vehicle dynamics tuning steps, tire selection and bushing & body/frame
mount selection, can have significant effects on NVH attributes such as road
noise, tire noise, and driveline NVH. The current process does not involve
NVH in the initial selection of tires or bushing rates. Vehicle dynamics
engineers use the program Product Attribute Leadership Strategy (PALS) to
support tire and tuning bushing tradeoff experiments. NVH is typically called
in if there are issues with the selected tuning such as unwanted tire noise. In
many instances the only short-term NVH countermeasure is adding sound
barrier and absorption material to the vehicle interior. This can result in
significant cost and weight increases. This is due to the fact that changes to
tires and bushings/mounts can cause significant rework, requirement
revalidation, and program risks. Process improvements that involve NVH in
the tire and bushing selection process will help prevent such issues. A step can
be introduced into the tire selection process to identify the NVH opportunity
of tire and bushing/mount selection. Such a step may involve running NVH
experiments with the softest tires and bushings in the tuning kit and or running
with a master set of tires without tread (slicks). The Vehicle Engineering
management team will then be more informed with respect to the tradeoffs and
opportunities involved in tire and bushing/mount selection at the earliest
stages. Prescribing tire & bushing/mount selection early will provide the
96
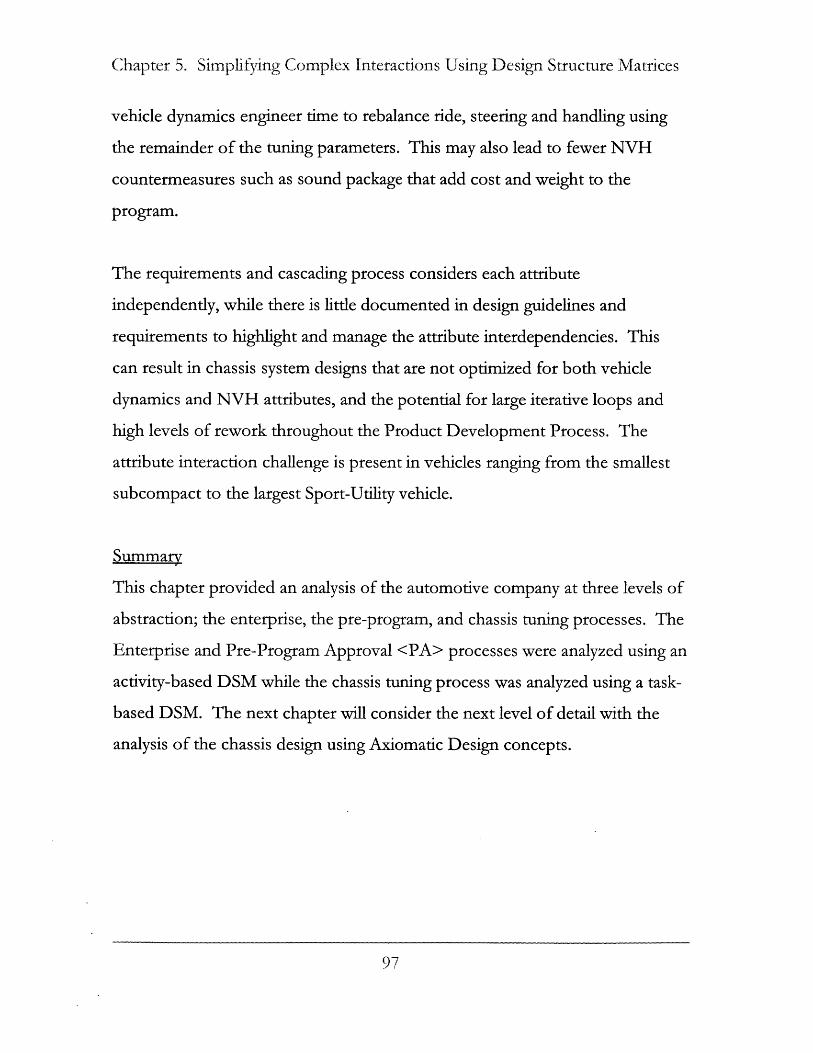
Chapter 5. Simplifying Complex Interactions Using Design Structure Matrices
vehicle dynamics engineer time to rebalance ride, steering and handling using
the remainder of the tuning parameters. This may also lead to fewer NVH
countermeasures such as sound package that add cost and weight to the
program.
The requirements and cascading process considers each attribute
independently, while there is little documented in design guidelines and
requirements to highlight and manage the attribute interdependencies. This
can result in chassis system designs that are not optimized for both vehicle
dynamics and NVH attributes, and the potential for large iterative loops and
high levels of rework throughout the Product Development Process. The
attribute interaction challenge is present in vehicles ranging from the smallest
subcompact to the largest Sport-Utility vehicle.
Summary
This chapter provided an analysis of the automotive company at three levels of
abstraction; the enterprise, the pre-program, and chassis tuning processes. The
Enterprise and Pre-Program Approval <PA> processes were analyzed using an
activity-based DSM while the chassis tuning process was analyzed using a task-
based DSM. The next chapter will consider the next level of detail with the
analysis of the chassis design using Axiomatic Design concepts.
97

Chapter 5. Simplifying Complex Interactions L'sing Design Structure Matrices
This page intentionally left blank.
98

Chapter 6. Simplitying Design Interactions U sing Axiomatic I)esign Concepts
Introduction
Chapter 5 considered complexity at the Enterprise, Pre-Program, and vehicle
development levels. This chapter takes the analysis of complexity to the next
level of detail with the analysis of automotive chassis design. The axiomatic
design concepts utilized for this analysis were presented in Chapter 4. This
chapter summarizes the analysis and comparison of two suspension types using
Axiomatic Design principles. The goal is to use axiomatic design concepts to
improve the suspension design to achieve higher level of attribute performance
for both the vehicle dynamics and NVH attributes.
The Challenge
Vehicle Dynamics and Noise/Vibration/Harshness (NVH) design
requirements conflict in a number of ways. The vehicle dynamic tuning
process goals include providing responsive steering and handling
characteristics. In order to achieve the desired attribute performance,
compliance of the chassis system is minimized. This typically manifests in
bushings and mounting systems that have less compliance, which equates to
increased bushing stiffness. NVH design requirements for the chassis system
include the desire to achieve high levels of isolation. This high level of
isolation is achieved through selection of bushing and mounting systems that
are compliant. These compliant bushings isolate the cabin from unwanted road
and Powertrain vibration inputs.
Coupling in Suspension bushing isolation and stiffness manifests through
vibration levels and compliance as a result of road forces through the wheel
and vibration generated by the driveline/axle. Axiomatic design concepts are
99

Chapter 6. Simplifying Design Inter.actions Using Axiomatic Design Concepts
used to reconcile the challenges of achieving functional performance of the
chassis design given the challenges identified. Two rear suspension designs are
assessed for their ability to provide both dynamic tuning capability and
isolation from unwanted road and driveline vibration.
Method
A description of axiomatic design concepts was provided in Chapter 4. The
rear chassis systems analyzed in this chapter have been in production for many
years. Reverse engineering was used in the review of the systems and
components under consideration. The design matrices that follow were
developed by synthesizing insights gained from technical literature reviews, the
author's knowledge of the interactions in suspension function, and subject
matter expert consultation. The analyses are intended to provide a basic
understanding of the methods that were used to go from the "what" to the
"how" in suspension design. An X in the design matrix represents dominant
relationships between functional requirements and design parameters, while an
x represents a relationship that has a secondary effect. A 0 signifies
relationships that have very little effect relative to the other factors.
Three-Link Solid Axle Design
Independence Axiom
A Design Matrix for a three-link solid axle suspension at the higher (parent)
level using the Independence Axiom design principle is summarized in figure
34. Note the analysis considers the functional requirements for both NVH and
Vehicle Dynamics attributes. The analysis demonstrates the highly coupled
nature of the design of the three-link solid axle suspension.
400U(
Chapter 6. Simplifying Design Interactions Usin.g Axiom'atic Design Cloncepts
Figure 34. Axiomatic Design Matrix for a Three-link Solid Axle Design.
Three-Link Solid Axle SuspensionDesign Parameters
DPI Susp. DP2 Susp. Compliance
Geometry / DP2.1 Lower DP2.2 Upper DP2.3
KinemticsLink Bushin Link Bushing Lateral LinkKinmaic--- K M -R -,.Bushing K
FRI Veh FR1.1 Ride x x
C:0 Dynamicsy FR1.2 Handling/Steering X X X X
C FR2.1 Road NVH 0 X 0 XU FR2 NVH
F2NHFR2.2 Driveline NVH 0X X
FRi & FR2 NVH and Vehicle Dynamics are Highly Coupled
Information Axiom
When the information content of the Three-Link design is considered from the
Information Axiom perspective, a significant amount of "information" is
required to satisfy the functional requirements. For example, the variation in
functional performance for FR2.2 Driveline NVH is affected by DP2.1 lower
link bushing stiffness, DP2.2 upper link bushing stiffness, and DP2.3 lateral
link bushing stiffness variation. The result is higher functional complexity. For
example, when the stiffness of DP2.3 lateral link bushing is decreased, the
other paths (DP2.1 and DP2.2) can become most critical as the vibration
energy of the source (axle) is distributed in a different way. This suggests that
the range in bushing isolation performance as it relates to axle noise is affected
by the ability of the design of each of the DP components to meet the target
levels.
.01

(hapter 6. Simplifying Design Interactions Using Axiomatic Desisgn Concepts
Independent Rear Suspension Design
Independence Axiom
The design matrix for an independent rear suspension at the higher (parent)
level is summarized in figure 35. One of the strengths of the independent
suspension is the introduction of additional design parameters (DP's) to make
isolation parameters independent of suspension kinematics and compliance
parameters. The analysis demonstrates a design that tends toward the
decoupled design, with most of the strong interactions below the diagonal.
This provides the opportunity for NVH and Vehicle Dynamics development
engineers to develop the vehicle tuning with more independence, i.e., with
fewer interactions and less probability of rework.
Figure 35. Axiomatic Design Matrix for an Independent Suspension.
DP3: Additional Design Parameters
Independent Rear Suspension ____________________Design Paramet
DP1 Susp. fP3 Stationary Mou-i,D~iSup. DP2 Susp. DP3.1
Geometry / Compianc SubramKinematis Compnce Subfrare BP3.2ng
,Mount K
,, FR1 Veh FR1.1 Ride X X x 0
SDynamicsFR1.2 Handling/Steering X X x 0
=3 FR2.1 Road NVH 0 x X 0U- FR2 NVH
FR2.2 Driveline NVH 0 0 x X
Dominant NVH & Vehicle Dynamics FRs and DPs are Decoupled
Information Axiom
When the information content of the Independent Suspension design is
considered, less "information" is required for each functional requirement, as
102
Chapter 6. Simplifying Design Interactions Using Axiomatic Design Concepts
there are fewer design parameters that can contribute in terms of performance
variation. For example, the variation in functional performance for road NVH
is dominated by the variation in the functional performance of DP3.1,
Subframe mount stiffness.
Suspension Mount Design
The three-link and independent rear suspension design matrices considered
suspension design decomposition from a high level, considering only the
dominant effects of design parameters on functional requirements. The
functional requirements and design parameters can be further decomposed to
lower levels. This section outlines further decomposition of FRs and DPs for
suspension mounts. The particular example is for the rear subframe mount,
DP3.1 from independent rear suspension decomposition. The decomposition
is performed at two levels. The first decomposition describes how the
subframe mounts DP3.1 affect the functional requirements in the independent
rear suspension system. The second decomposition considers the subframe
mounts DP3.1 at the component level, in an effort to describe the component
design.
First level Decomposition for DP3. 1 Subframe Mounts
The functional requirement and design parameter decomposition was
considered for the DP3.1 subframe mount in the case of the independent rear
suspension. Figure 36 describes the dominant relationships among functional
requirements and design variables. The design variables considered relate to
the mount performance for the three translational degrees of freedom, X, Y,
and Z.
103

(hapter 6. Simplifying Design Interactions Using Axiomatic Design o...ncepts
Figure 36. Independent Rear Suspension Subframe Mount (DP3.1) Design
Matrix: Mount Performance.
Design Parameters
DP3.1.1 DP3.1.2 DP3.1.3Bushing X Bushing Y Bushing ZStiffness Stiffness stiffness
CO
FR1Veh FR1. Ride X 0 x
. E Dynamics FRI.2 Handling/5 ___ SteeringC-
" FR2 NVH FR2.1 Road NVH X 0 X
The independent rear suspension subframe mount design matrix demonstrates
decoupling among functional requirements and design parameters for the
dominant relationships. This suggests that selection of bushing parameters can
be made in such a way as to achieve low stiffness for FR2 NVH and higher
mount stiffness for FR1 vehicle dynamics through judicious selection of
bushing rates in the X, Y, and Z direction. This insight is useful when
determining the range of bushing rates to order in the initial vehicle
development tuning set (task 1 of the Task-based Chassis Tuning DSM,
Chapter 5). In typical independent rear suspension designs four subframe
mounts are used. This level of decomposition does not consider the effects of
relative differences among the four subframe mounts, which would be
considered at a higher level of decomposition.
Second Level Decompositionfor DP3. 1 Subframe Mounts
The next level of decomposition of DP3.1 subframe mounts considers the
properties of the mount that govern the X, Y, and Z stiffness rates that were
considered in the first level subframe mount decomposition. Figure 37
104
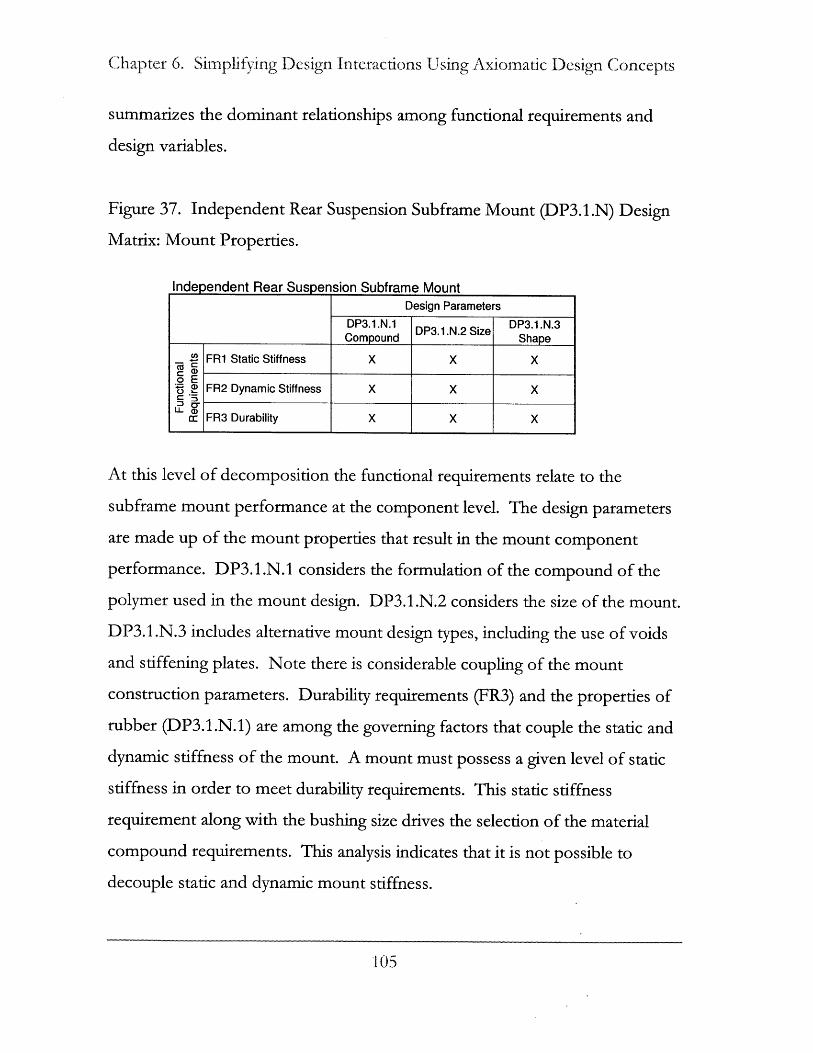
Chapter 6. Simplifying Design Interactions Using Axiomatic Design Concepts
summarizes the dominant relationships among functional requirements and
design variables.
Figure 37. Independent Rear Suspension Subframe Mount (DP3.1.N) Design
Matrix: Mount Properties.
Independent Rear Suspension Subframe MountDesign Parameters
DP3.1.N.1 DP3.1.N.2 Size DP3.1.N.3Compound Shape
.4 FR1 Static Stiffness X X X
o EFR2 Dynamic Stiffness X X X
cc FR3 Durability X X X
At this level of decomposition the functional requirements relate to the
subframe mount performance at the component level. The design parameters
are made up of the mount properties that result in the mount component
performance. DP3.1.N.1 considers the formulation of the compound of the
polymer used in the mount design. DP3.1.N.2 considers the size of the mount.
DP3.1.N.3 includes alternative mount design types, including the use of voids
and stiffening plates. Note there is considerable coupling of the mount
construction parameters. Durability requirements (FR3) and the properties of
rubber (DP3.1.N.1) are among the governing factors that couple the static and
dynamic stiffness of the mount. A mount must possess a given level of static
stiffness in order to meet durability requirements. This static stiffness
requirement along with the bushing size drives the selection of the material
compound requirements. This analysis indicates that it is not possible to
decouple static and dynamic mount stiffness.
105
Chapter 6. Simplifying )esign Interactions Using Axiomatic Design Concepts
Conclusions: Axiomatic Design
The goal of axiomatic design is to "establish a scientific basis for design an to
improve design activities by providing the designer with a theoretical
foundation based on logical and rational though processes and tools." 2s The
tool attempts to reduce the seemingly random design search process, minimize
iterative trial and error, and determine the best designs among alternatives.
This chapter demonstrates that axiomatic design principles can be used to
reduce coupling of suspension design parameters to achieve a design that
improves both vehicle dynamics and NVH attribute performance. The high-
level suspension design matrices represent the design intent. Further
decomposition was developed in order to facilitate execution of the design.
The decomposition of functional requirements and design parameters from the
suspension design to the bushing design levels aids the engineer in making
design decisions at the lower level that are consistent with the high level design
intent. In many instances this level of knowledge is present in the experts
minds; the benefit of the concepts are in their ability to facilitate
communication among experts and management in order to ensure that the
knowledge is being used where it is required.
106

Chapter 7. Conclusions, Recommendations, and pportuniti es tor FurtherStudy
Conclusions and Recommendations
This thesis provided insights into the decision-making, design, and
development processes in an automotive company, while presenting methods
to assist teams solve problems that arise due to high complexity. The following
provides a summary of the conclusions from the studies, recommended actions
to address limitations in the design and development process, and
opportunities for further study related to the work presented herein.
DSM and Axiomatic Design are Useful to Reduce Complicatedness
Automobiles are complex and complicated. Quick decisions that are not
informed with the knowledge of the interactions can be costly. Interactions
must be considered in the decision-making process to avoid the adverse
consequences of decisions and eliminate "surprises" or adverse system
emergent properties. The application of system engineering tools such as the
Design Structure Matrix and Axiomatic Design concepts can reduce the
increasing complexity and complicatedness in automotive design and
development. While it is not always possible to uncouple functional
requirements and design parameters in complex systems, the use of axiomatic
design concepts facilitates dialog within the team and can lead to systems with
reduced coupling. These methods make interaction information available when
needed and provide a mechanism to preserve and accumulate systems
knowledge, so that challenges can be addressed to ensure that the resulting
solution resides along the efficient frontier of product design.
107

Chapter 7. Conclusions, Recommencidations, and Opportunities for Further
Study
Start Simply
This thesis has demonstrated that DSM's and Design Matrices with matrix
elements that highlight critical interfaces are useful to foster communication of
issues relevant to the team organization and decision-making processes in
product design and development. Identification of the "critical few"
relationships that are dominant in system performance at the various levels of
abstraction will align behavior and decisions to achieve optimal results at each
level of abstraction. As the concepts and methods become second nature to
engineers, more sophisticated applications can be developed. Prior studies
have shown that methods such as the Design Structure Matrix and Axiomatic
Design concepts have limitations in that they do not include the probability or
strength of interactions. Such limitations require more sophisticated models
that define the objective functions between interactions.
Manage Information Explicitly
This investigation highlighted the importance of information in automotive
design and development. It is critical that the importance of information is
recognized and managed. Individuals should be trained to recognize the
importance of making the results of their efforts accessible, and skills should be
taught and time allocated to allow individuals to seek out information related to
their efforts. Information that is non-program specific should be identified and
decoupled from the product development process to minimize the length of
rework cycles. Downstream knowledge should be brought upfront. This can
be accomplished by rotating personnel with downstream process and launch
experience upstream to support new development efforts.
108

(hapter 7. Conclusions, Recommendations, and Opportunities for FurtherStudy
Account and Provision for Risks in the Development Process
Risks have to be taken and decisions have to be made without perfect
information in automotive design and development. An understanding of the
upfront risks should be accommodated by budgeting time and cost reserves
commensurate with the risk in order to make a more informed and optimal
decision when making program decisions early in the product development.
Foster and provision for early iteration, when learning can occur at lower cost
and to reduce the risk of changes downstream. The addition of low-cost
workhorse vehicles to address platform capability and target-setting studies is
just one approach.
Reduce Complexity and Complicatedness through Reuse
Reduce complexity and complicatedness in organizational, process, and
technical domains through reuse. Each of the Design Structure Matrices
presented herein demonstrate that each product development or design change
has a significant "ripple effect" on other activities, attributes, and designs. The
opportunity of change should be balanced against the cost of complexity vs.
using existing systems.
OrganiZe to Support and Foster a Systems Approach
Coupling of attributes/functional requirements and suspension
architecuture/design parameters drives the need for an organization that
fosters a systems approach in order to ensure that appropriate decisions are
made at key stages in the product design and development process. Building
competency of managers in Systems Engineering concepts and providing
appropriate time, engineering, and financial resources to support the added
109

Chapter 7. Conclusions, Recommendations, and Opportunities for FurtherStudy
tasks involved in upfront chassis design and development will lead to less
rework and improved attribute performance downstream. Explicit interface
meetings and interface documents should be established to increase dialog
among stakeholders and clarify the interactions and impact of decisions on
system performance.
Opportunities for Future Study
Axiomatic design concepts are useful for reducing coupling of functional
requirements and design parameters in automotive design. While these
concepts are useful to communicate differences among alternatives, the process
does not include the impact to cost, which can be a key driver in architecture
selection. A useful extension of this effort would be to develop an approach to
integrate cost into the design structure matrix using one of the existing value
engineering methods.
A second opportunity for continued research is in the area of identifying
constraints in the Design Structure Matrix and Design Matrix interactions that,
if released, would provide high leverage for the process or design. This would
allow the team to develop and focus research on high-leverage challenges. An
example related to the work presented would be in the area of bushing design.
If a new material could be developed that would provide isolation of vibration
at higher frequencies while maintaining desired static properties, it would result
in great flexibility in chassis design and development to improve vehicle
dynamics and NVH performance without requiring tradeoffs.
110

Appendix A.Ford Tfaurus
A Simple System Dynamic Model of The Automotive Market:
This page intentionally left blank.
111

Appendix A.Ford Taurus
A Simple System Dynamic Model of The Automotive Market:
This page intentionally left blank.
112
Appendix A. A Simple System Dynamic Model of The Automotive Market:Ford Taurus
Introduction
The following provides an example of a system dynamic model of the
automotive market for the Ford Motor Company Taurus vehicle. The model is
provide to highlight the dynamic complexity in the automotive industry along
with a number of the important reinforcing and balancing feedback loops.
Ford Taurus
Getting the product right is critical. The Ford Taurus was introduced in 1985
and was a market hit. By 1992, the Taurus was the number one selling
passenger car in the United States with sales of 410,000/year. Since that time,
sales have steadily declined to 325,500 in 2002, with approximately half sold to
employees and rental or corporate fleets. Taurus has lost most of its sales to
high quality competitors, specifically, exports. Many factors account for the
loss of sales and market share including price, relative quality index in the
market and frequency of product updates. Figure 38 details the system
dynamics of Taurus sales and the feedback loops that reinforce the reduction
of sales that have occurred.
113

Appendix A. A. Sirnple Systen IDyrnami1ic Nd of TCihe Autom tive Naret:Ford Taurus
Figure 38. System Dynamics Model for The Ford Taurus.
+ Prie
Total Product cost + Profts
+ Pdtes tass Ford Taurus
Inflow of new carsj aesT. m Purchase Ownerscustomers Rate +.ieWodB32 Postive Word of
Quick Cash + +_+tMiehIncentives Wordof
t Custo r demand Mouth
Lres PC hwies for
Greates Vaniabie Awak R ness
< od updafl; Maretin Market Product Deek > nntownershipR0
Cost Cuttin
Warranty Cost Market share
Supren umQuary Cost Reduction
Warranty Product ffort S P
Reduction attractiveness R,049
Payr Quality-Improvement
Enginernog
Price premium fbr Taurus Quaty Index Improvements +unique new product
ProductFreshening Product update
Reinforcing and Balancing Loops
Nine important reinforcing loops and two balancing loops affect the sales rate.
Figure 39 describes the loops and their main effects. Also, the current relative
strength of the feedback is assessed in the table.
1 '1.

Appendix A. A Simple System Dynamic Model of The Automotive Market:Ford Taurus
Figure 39. Significant Market Reinforcing and Balancing Loops for the Ford
Motor Company Taurus.
Loop Relative
Description Effect of Loop Strengthof Loop
Ri: New Taurus owners create positive/negative awareness of car due LowWord of Mouth to word of mouth reinforcing more/less Taurus sales.R2: As the Taurus market share increases/decrease, purchase rate LowMarket increases/decreases and owners increase/decrease, hence,Ownership reinforcing the direction of market share.R3: As profits increase/decrease, investment in quality MediumWarranty increases/decreases, thus, reducing/increasing warranty costs (afterReduction a delay) which subsequently effects total costs and reinforces
more/less profits.R4: As profits increase/decrease, investment in quality LowQuality increases/decreases yielding a delayed improvement/reduction inImprovement product attractiveness and reinforces more/less sales.R5: As relative quality in the target market segment LowPay for Quality increases/decreases, the delayed price premium for quality
increases/decreases subsequently raising/lowering price and profit.The increase/decrease in profit affects the amount of qualityinvestment and reinforces the direction of relative quality.
R6: As profit increases/decreases, product updates increase/decrease LowProduct after a significant delay allowing increase/decrease in priceFreshening premium for a fresh product affecting vehicle price and reinforcing
the profit increase/decrease.R7: As profit increases/decreases, the investment in product updates LowLatest and increases/decreases which increase/decrease product demandGreatest (delayed), hence, increasing/decreasing the purchase rate and
reinforcing high/low profit.R8: Increasing/decreasing variable marketing reduces/increases HighStarve PD investment in quality, hence, reducing/increasing attractiveness
and market share, reinforcing variable marketing cost direction.R9: As profit increases/decreases, cost cutting efforts increase/decrease HighCost Cutting which decreases/increases investment in quality, hence,
reducing/increasing attractiveness and customer demand,reinforcing the profit direction.
Bl: As market share decreases, variable marketing and incentives HighCash Back increase which increases the purchase rate and owner pool, hence,
increasing market share.B2: As profits decrease, cost cutting efforts increase, thus, decreasing HighQuick Cash total product cost and increasing profits.
115

End Notes / Reference List
This page intentionally left blank
116

E'nd Notes / Reference List
End Notes / Reference List
1 J. M. Utterback, "Mastering the Dynamics of Innovation, "Harvard BusinessSchool Press, 1994.2 J. M. Utterback, "Disruptive Technologies; Predator or Prey," MIT CourseSlide 16 Class 1, Spring 2003.3 J. M. Utterback, "Disruptive Technologies; Predator or Prey," MIT CourseSlide 18 Class 1, Spring 2003.4 Volvo Specifications and Options, Volvocars.us.com.' D. Kahneman, P. Slovic and A. Tervsky, Judgment Under Uncertainty:Heuristics and Biases, Cambridge University Press, 19826 Steven Pinker, How the Mind Works, W.W. Norton &Company, NY 19977 Miller, G. S., 1956, "The Magical Number Seven, Plus or Minus Two,"Psychology Review (63), pp 81-97.8 John D. Sterman, Business Dynamics-Systems thinking and modeling for aComplex World, McGraw-Hill, Boston,20009 B. S. Blanchard, W. J. Fabrycky, "Systems Engineering and Analysis," ThirdEdition, Prentice Hall, 1997.10 T. D. Gillespie, "Fundamentals of Vehicle Dynamics", Ford Motor CompanyCourse Notes, 1991." D. J. Rinkevich, F. P. Samson, "An Improved Powertrain AttributesDevelopment Process With The Use of Design Structure Matrix,", MIT SDMThesis, February, 2004.12 Q. Dong, D. Whitney, "Designing a Requirement Driven ProductDevelopment Process," ASME 2001 Design Engineering TechnicalConference, September 9-12, 2001." Q. Dong, "A Proposed Approach for Building Credible DSMs," and"Important Observations/Issues Considered When Collecting DSM Data,"MIT DSM website, October, 2004.14 A. Yassine, D. Whitney, J. Lavine, T. Zambito, "Do-It-Right-First-Time(DRFT) Approach to DSM Restructuring," ASME 2000 International DesignEngineering Technical Conference, September 10-13, 2000.s S. Daleiden, "Chassis Flexibility: Assessing Architectural Differences and
Their Effect on Managing Derivative Product Development," MIT SDMThesis, January 24, 2000.
117
End Notes / Reference List
16 Hrishikesh V. Deo and Nam P. Suh, "Axiomatic Design of AutomobileSuspension and Steering Systems: Proposal for a Novel Six-Bar Suspension,"SAE Technical Paper 2004-01-0811, January, 2004.17 G. Guo, S. Xu, "Design Optimization of Two Combined Four-BarMechanisms Using the Principles of Axiomatic Design,"2004 SAE WorldCongress, March 8-11, 2004.
18 S. Eppinger, D. Whitney, A. Yassine, "The Design Structure Matrix (DSM)Home Page," MIT Website, MIT & UIUC DSM Research Teams.19 N. P. Suh. Axiomatic Design: Advances and Applications. CIRP DesignBook Series. Oxford University Press, 2001.20 Q. Dong, "Important observations / issues considered when collecting DSMdata," MIT DSM Website.21M. Bagley, L. Garza, H. Holtz, J. Kim, R. Ziegler, "Enterprise Value StreamMapping & Analysis (EVSMA) - Ford Motor Company "Explorer" PlatformEnterprise," Integrating the Lean Enterprise Course Paper, December 9, 2003.22 L. Garza, R. Ziegler, "Ford Motor Company Pre-Program Approval VehicleDevelopment Process," System Design and Management Course, MIT,December 3, 2003.23 J. Tobin, "Richard Riff: Pointing the Way Toward Change With New DigitalTechnologies," Ford Communication Network internal news, December 1,2004.24 Q. Dong, "Important observations / issues considered when collecting DSMdata," MIT DSM Website.25 N. Suh, "Axiomatic Design, Advances and Applications," Oxford UniversityPress, 2001.
1 18