composite index scores (cis) understanding accountability for strategic goal setting august 24, 2015...
TRANSCRIPT

Composite Index Scores (CIS)
Understanding Accountability for Strategic Goal Setting
August 24, 2015Andrew Milligan | RIDE Office of Transformation
Objectives
• Firm up a technical understanding of the current Composite Index Score (CIS) and how it informs school improvement planning in general, and goal setting in particular
• Understand the impact of the PARCC transition on the CIS and planning for the future

Agenda
1. (Re)-Introduction to the CIS – 5 min
2. Deeper Divea) Proficiency & work-time – 12 minb) Gaps & work-time – 12 minc) Growth & work-time – 8 mind) Graduation – 8 min
3. Questions – 15 min
Exit Criteria
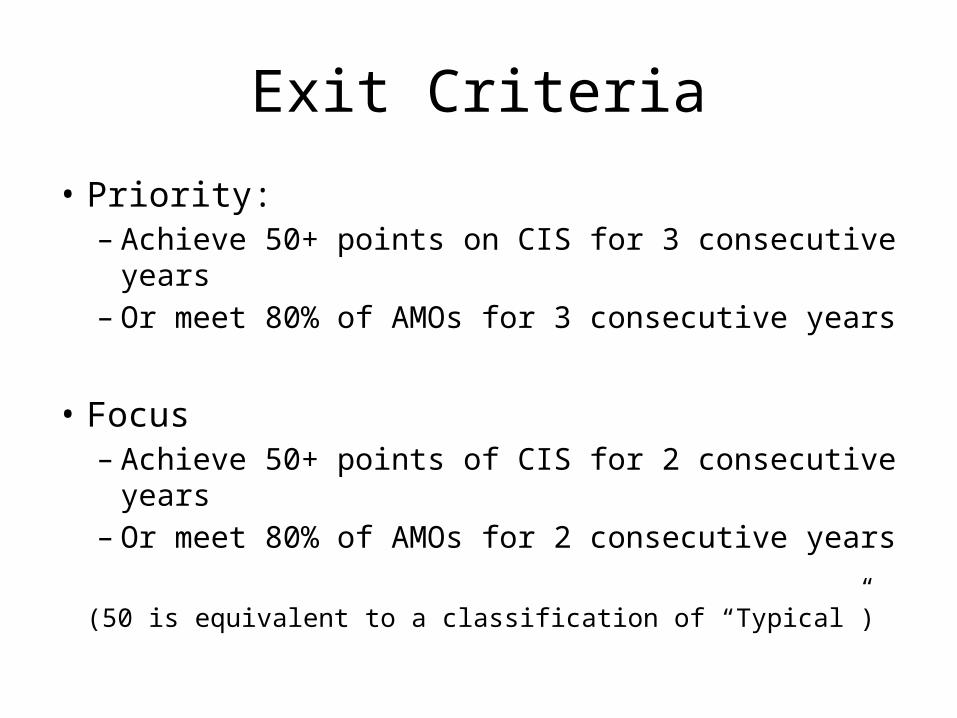
• Priority:– Achieve 50+ points on CIS for 3 consecutive years– Or meet 80% of AMOs for 3 consecutive years
• Focus– Achieve 50+ points of CIS for 2 consecutive years– Or meet 80% of AMOs for 2 consecutive years
(50 is equivalent to a classification of “Typical”)

What You Probably Already KnowAll schools will be assigned a composite index score between 20 and 100.
Measure DefinitionElementary
/ Middle Schools
High Schools
Absolute Percent Proficient
How many students have attained proficiency or better? 30 points 30 points
Progress To 2017 Target
Is the school approaching its 2017 targets? 10 points 10 points
Achievement GapsIs the school serving all students, including
those with disabilities and English Learners? 30 points 30 points
Percent of Students at Distinction Level
How many students have attained distinction? 5 points 5 points
Growth Are all students making progress? 25 points n/a
HS Graduation RatesIs the school reaching its graduation-rate
goals? n/a 20 points
High School Scaled Score Is the school improving annually?
n/a 5
TOTAL100
possible points
100 possible points

What about PARCC?• The transition to PARCC this year will have
minor changes to the CIS for 2014-15:Measure NECAP PARCC (E/M) PARCC (H)
Absolute Percent Proficient 30 points 33.33 points 35.3
Progress To 2017 Target 10 points 0 points 0 points
Achievement Gaps 30 points 33.33 points 35.3
Percent of Students at Distinction Level
5 points 5.56 points 5.89
Growth (E/M) 25 points 27.78 points n/aHS Graduation Rates (H) 20 n/a 23.53
High School Scaled Score (H) 5 n/a n/a
TOTAL100 possible
points100 possible
points
A Closer Look
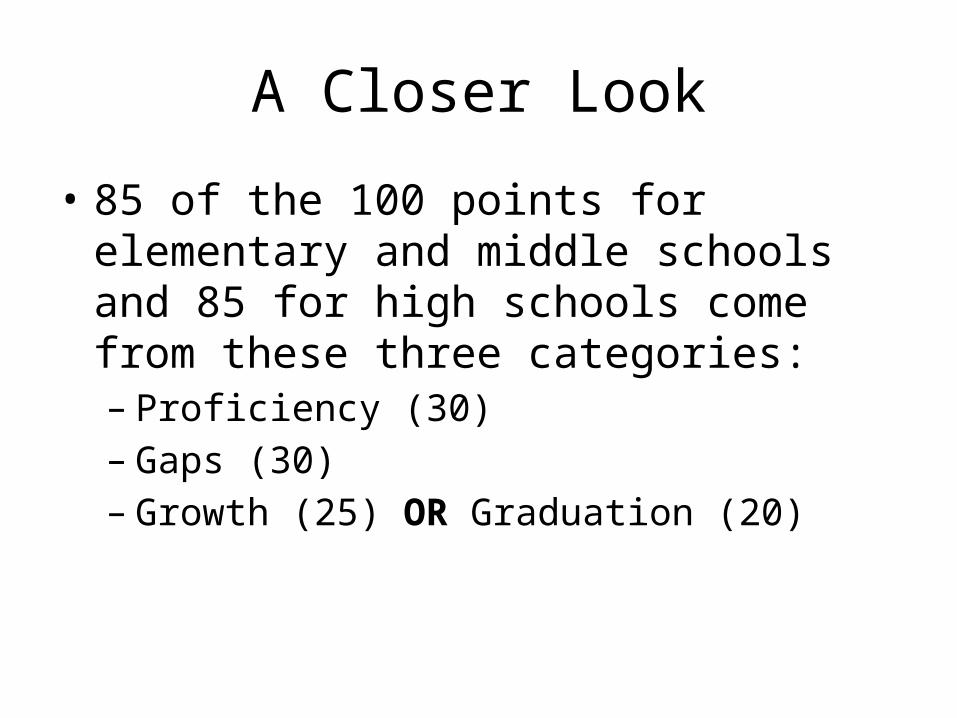
• 85 of the 100 points for elementary and middle schools and 85 for high schools come from these three categories:– Proficiency (30)– Gaps (30)– Growth (25) OR Graduation (20)

A Closer Look Cont.
• Three of these components have subcomponents based on subjects…– Reading– Math
• …and one or more student subgroups– All students– Reference students– Minority/SES– IEP/ELL
Lets Try The Math
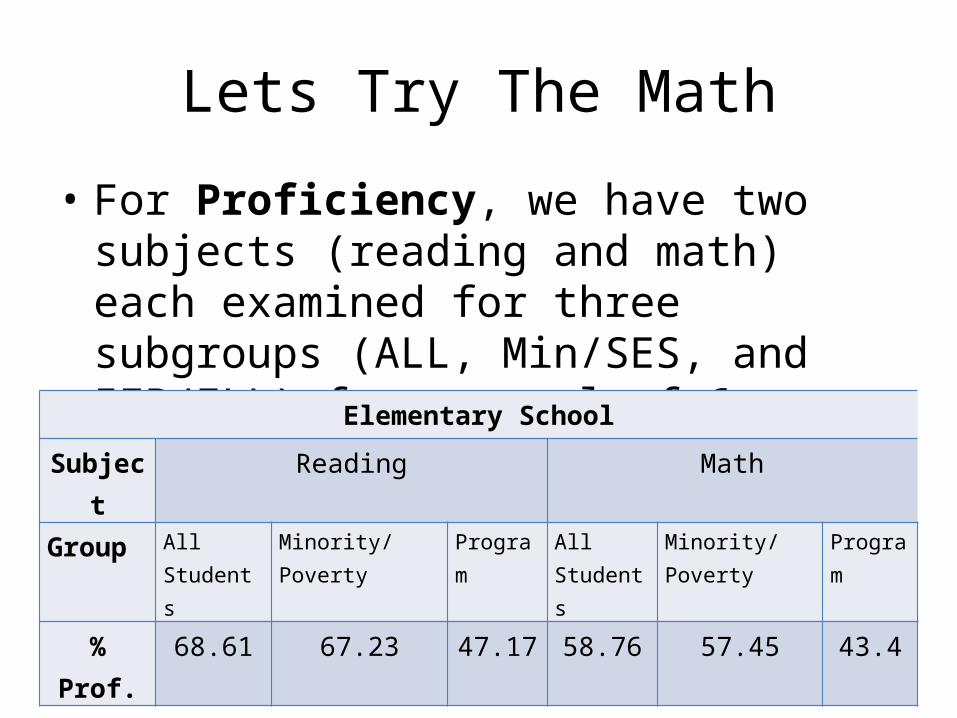
• For Proficiency, we have two subjects (reading and math) each examined for three subgroups (ALL, Min/SES, and IEP/ELL) for a total of 6 subcomponents
Elementary School
Subject Reading Math
Group All Students
Minority/Poverty Program All Students
Minority/Poverty Program
% Prof. 68.61 67.23 47.17 58.76 57.45 43.4

Elementary SchoolSubject Reading Math
Group All Students
Minority/Poverty Program All Students
Minority/Poverty Program
% Prof. 68.61 67.23 47.17 58.76 57.45 43.4
Each subcomponent is then converted into a “subscore” using a score-specific table. Each one looks a little different
but here’s the table for “Proficiency”

Elementary SchoolSubject Reading Math
Group All Students
Minority/Poverty Program All Students
Minority/Poverty Program
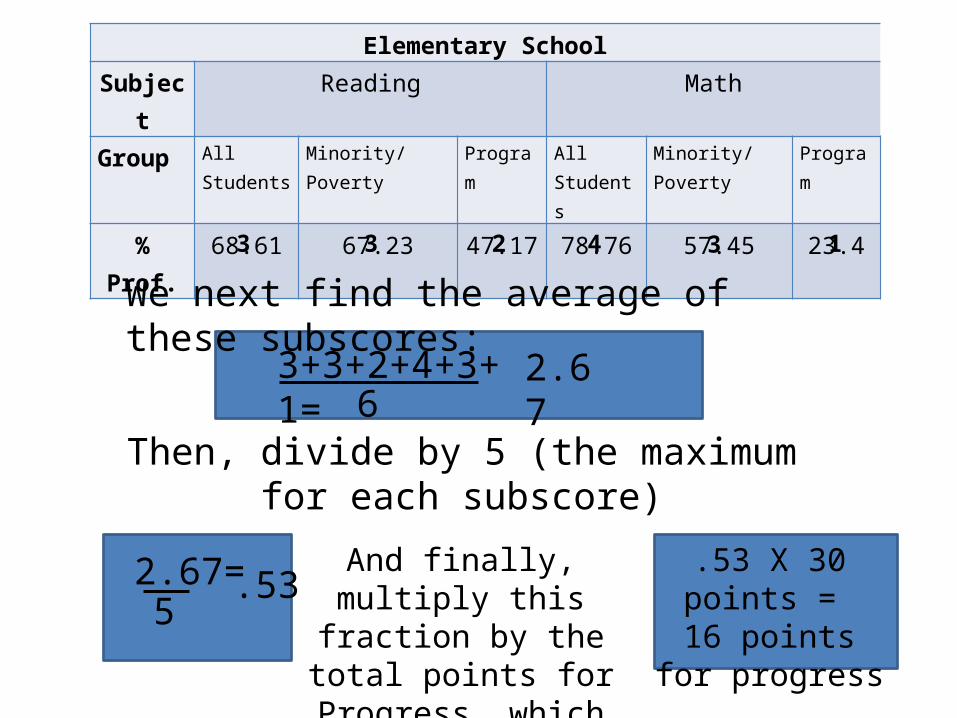
% Prof. 68.61 67.23 47.17 78.76 57.45 23.4
3 3 2 4 3 1
Elementary SchoolSubject Reading Math
Group All Students
Minority/Poverty Program All Students
Minority/Poverty Program
% Prof. 68.61 67.23 47.17 78.76 57.45 23.4
3 3 2 4 3 1
We next find the average of these subscores:
2.67
Then, divide by 5 (the maximum for each subscore)
3+3+2+4+3+1=6
2.67=5
.53And finally, multiply this
fraction by the total points for Progress, which
was 30
.53 X 30 points = 16 points for
progress

Work time (12 minutes)
Try re-creating your schools “Proficiency” component score using this procedure:
1. Find each subscore using the cut score table provided
2. Average the subscores3. Divide the average by 5 to get a fraction4. Multiple your fraction by the max points

Lets Try The Math
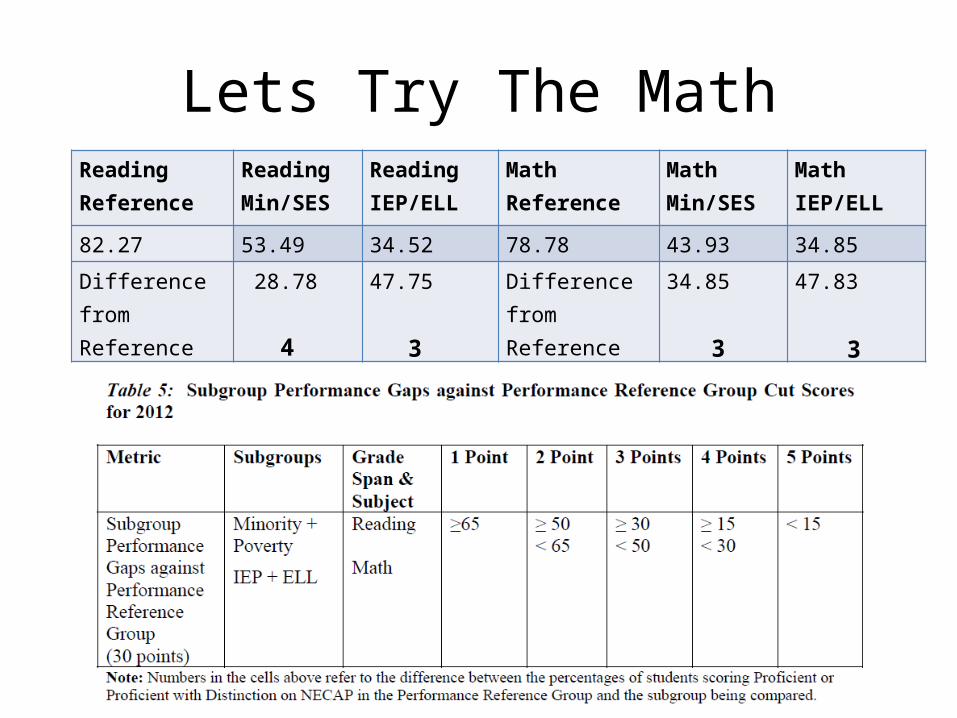
• For Gaps, we have two subjects (reading and math) each examined for two subgroups (Min/SES and IEP/ELL) for a total of 4 subcomponents
ReadingReference
Reading Min/SES
Reading IEP/ELL
MathReference
Math Min/SES
Math IEP/ELL
82.27 53.49 34.52 78.78 43.93 34.85
Difference from Reference
28.78 47.75 Difference from Reference
34.85 47.83

Lets Try The Math
Each subcomponent is then converted into a subscore by looking up the differences, or gaps on this cut score table for “Gaps”:
ReadingReference
Reading Min/SES
Reading IEP/ELL
MathReference
Math Min/SES
Math IEP/ELL
82.27 53.49 34.52 78.78 43.93 34.85
Difference from Reference
28.78 47.75 Difference from Reference
34.85 47.83
Lets Try The MathReadingReference
Reading Min/SES
Reading IEP/ELL
MathReference
Math Min/SES
Math IEP/ELL
82.27 53.49 34.52 78.78 43.93 34.85
Difference from Reference
28.78 47.75 Difference from Reference
34.85 47.83
4 3 3 3

We next find the average of these subscores:
3.25
Then, divide by 5 (the maximum for each subscore)
4+3+3+3=4
3.25=5
.65And finally, multiply this
fraction by the total points for Gaps, which
was 30
.65 X 30 points = 19.5 points for
gaps
ReadingReference
Reading Min/SES
Reading IEP/ELL
MathReference
Math Min/SES
Math IEP/ELL
82.27 53.49 34.52 78.78 43.93 34.85
Difference from Reference
28.78 47.75 Difference from Reference
34.85 47.83
4 3 3 3
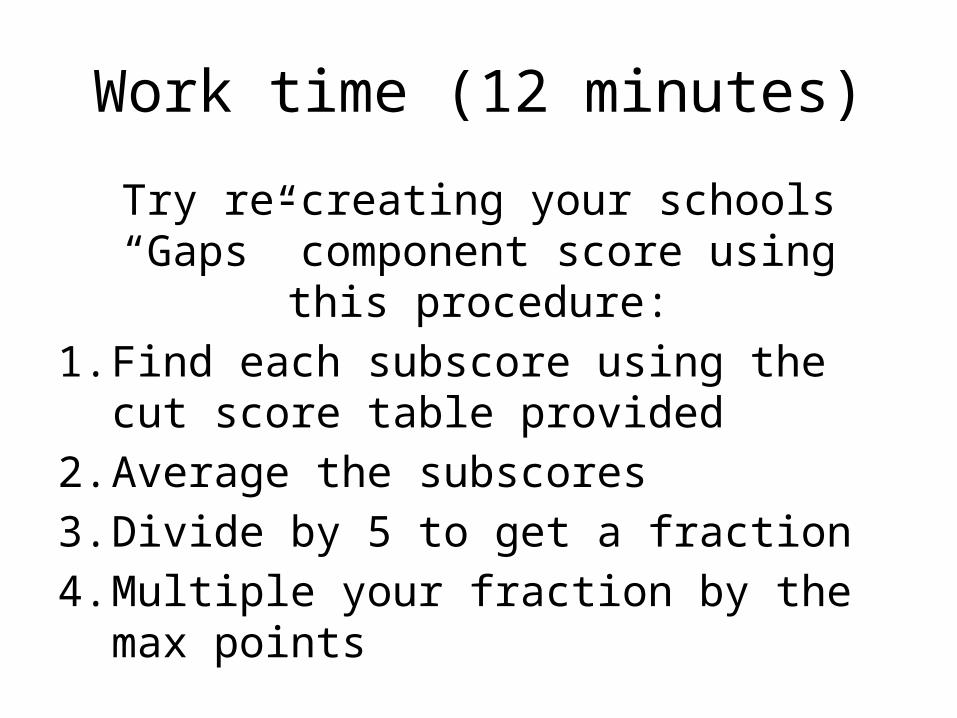
Work time (12 minutes)
Try re-creating your schools “Gaps” component score using this procedure:
1. Find each subscore using the cut score table provided
2. Average the subscores3. Divide by 5 to get a fraction4. Multiple your fraction by the max points
Lets Try The Math
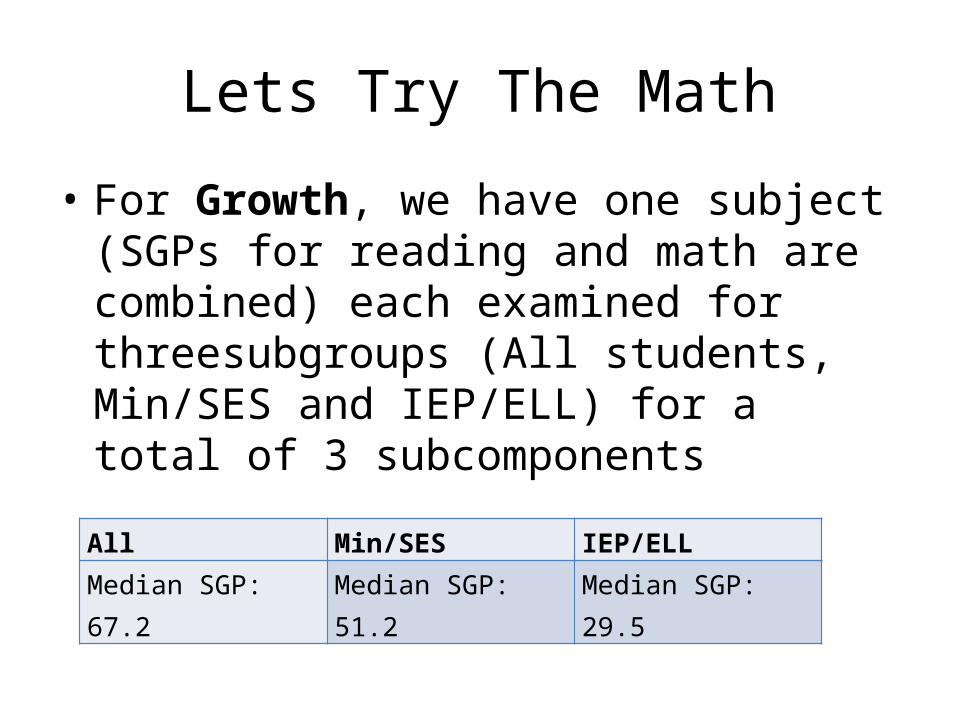
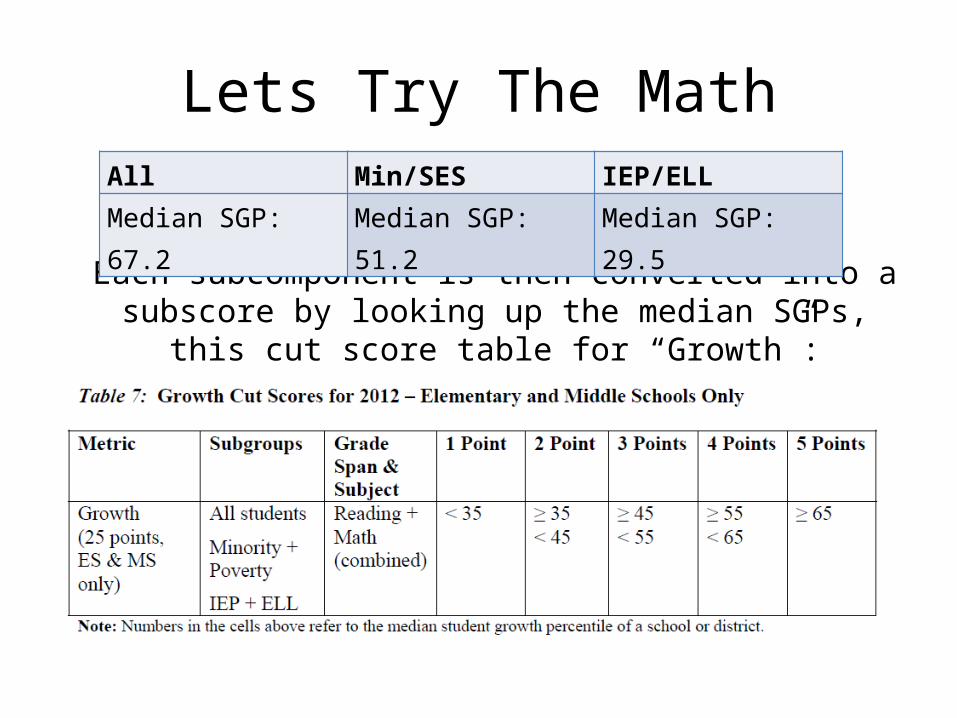
• For Growth, we have one subject (SGPs for reading and math are combined) each examined for threesubgroups (All students, Min/SES and IEP/ELL) for a total of 3 subcomponents
All Min/SES IEP/ELLMedian SGP: 67.2 Median SGP: 51.2 Median SGP: 29.5
Lets Try The Math
Each subcomponent is then converted into a subscore by looking up the median SGPs, this cut score table for “Growth”:
All Min/SES IEP/ELLMedian SGP: 67.2 Median SGP: 51.2 Median SGP: 29.5
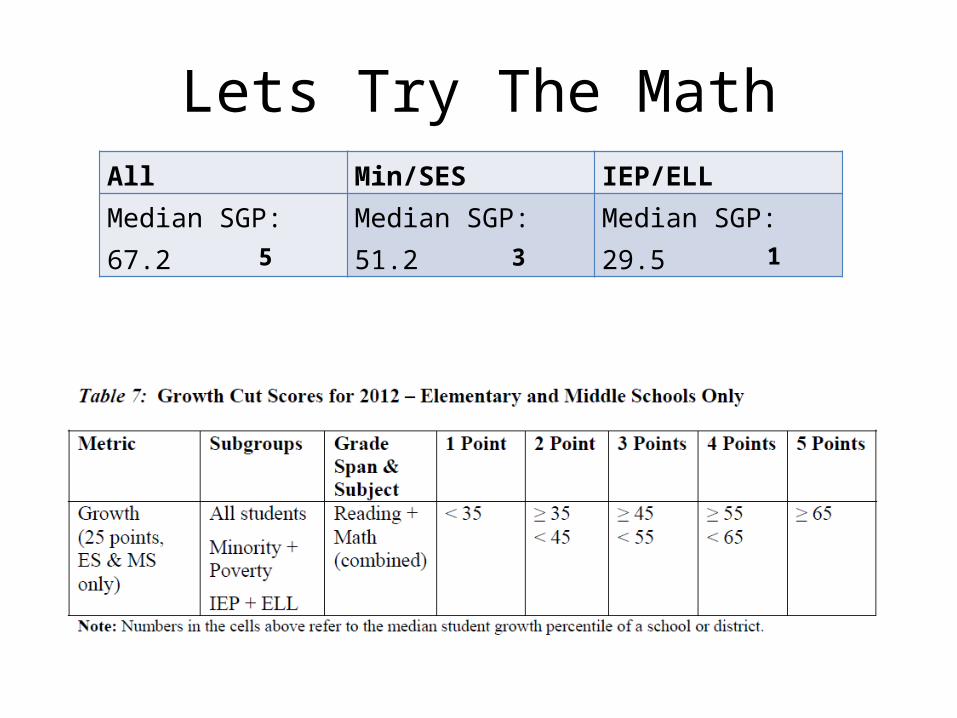
Lets Try The MathAll Min/SES IEP/ELLMedian SGP: 67.2 Median SGP: 51.2 Median SGP: 29.5
5 3 1
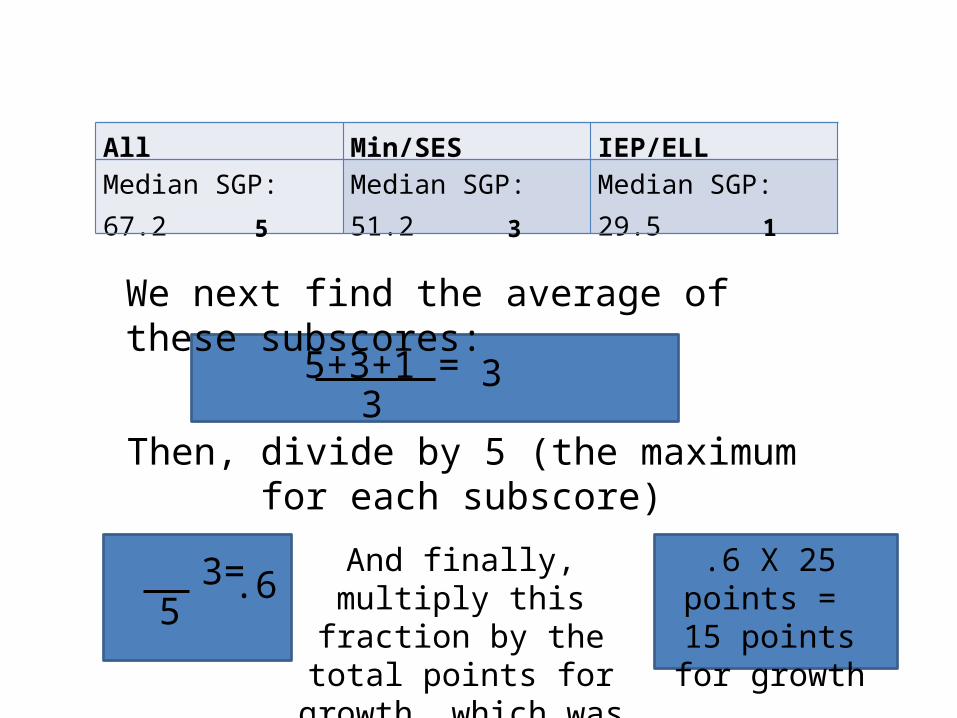
We next find the average of these subscores:
3
Then, divide by 5 (the maximum for each subscore)
5+3+1 =3
3=5
.6And finally, multiply this
fraction by the total points for growth, which
was 30
.6 X 25 points = 15 points for
growth
All Min/SES IEP/ELLMedian SGP: 67.2 Median SGP: 51.2 Median SGP: 29.5
5 3 1

Work time (8 minutes)
Try re-creating your schools “Growth” component score using this procedure:
1. Find each subscore* using the cut score table provided
2. Average the subscores3. Divide by 5 to get a fraction4. Multiple your fraction by the max points*Note: Two of our subcomponents are not reported publicly, but you can find more detailed information on different student groups in the growth model visualization tool. I have provided you with your schools subscore for this exercise.

Lets Try The Math
• For Graduation, we have one “subject” and one student group, so we only have one subcomponent.
• However, graduation uses either the 4-year rate or the composite index rate, whichever is higher
• We also need to know a schools grad. rate target and the state average
All Students (2013)4 Year Grad. Rate: 73.8Composite Grad. Rate: 76.0School Target: 66.2 ± 5.6Statewide Average: 80

Lets Try The Math
Grad. rate points are determined using a subscore and an additional bonus point. To determine the subscore use the table below. To determine the bonus point, simply see whether the grad. rate meet the school target or was higher than the state average?
All Students (2013)
4 Year Grad. Rate: 73.8Composite Grad. Rate: 76.0School Target: 66.2 ± 5.6Statewide Average: 80

Lets Try The MathAll Students (2013)4 Year Grad. Rate: 73.8Composite Grad. Rate: 76.0Statewide Average: 80
School Target: 66.2 ± 5.6
3
+1
4

Lets Try The MathAll Students (2013)4 Year Grad. Rate: 73.8Composite Grad. Rate: 76.0Statewide Average: 80
School Target: 66.2 ± 5.6
3
+1
4
Divide the subscore by 6 (instead of 5!!)
46
= .66
Multiply this percentage by 20
.66 X 20 = 13.33

Work time (8 minutes)
Try re-creating your schools “Graduation” component score using this procedure:
1. Determine whether to use the 4 year or composite rate, whichever is higher
2. Using the cut score table provided find your subscore3. Determine if either the rate is higher than the target
or the state average, if so add a bonus point to your subscore
4. Divide the subscore by 65. Multiple your fraction by the max points (20)

Questions?