comprehensive national industrial strategy and...
TRANSCRIPT
COMPREHENSIVE NATIONAL
INDUSTRIAL STRATEGY AND
INDUSTRY ROADMAPS
Employers’ Sectoral Consultation27 May 2016, Makati City
Securing the Future of Industries
Presentation OutlineI. Macroeconomic Performance, Opportunities
and ChallengesII. New Industrial Policy: Structural Transformation for
Inclusive & Sustainable Growth Address unemployment and poverty Attract more investments Global value chains
III. PH Manufacturing Resurgence Program Industry Roadmaps
IV. Comprehensive National Industrial Strategy (CNIS) Manufacturing, Agriculture, Services
2
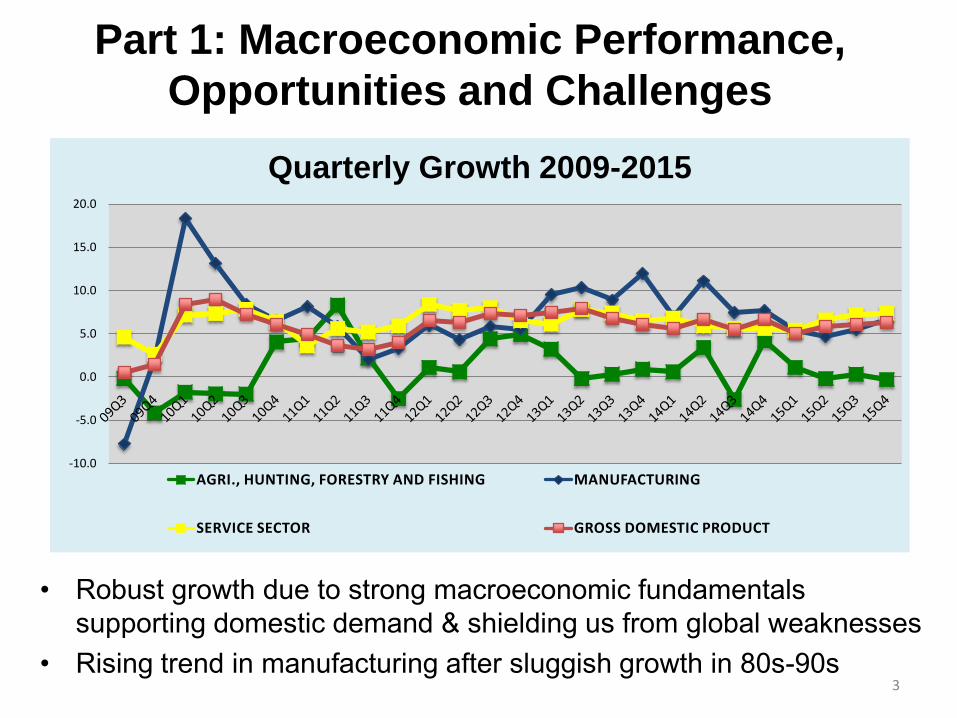
Part 1: Macroeconomic Performance,
Opportunities and Challenges
• Robust growth due to strong macroeconomic fundamentals supporting domestic demand & shielding us from global weaknesses
• Rising trend in manufacturing after sluggish growth in 80s-90s
-10.0
-5.0
0.0
5.0
10.0
15.0
20.0
Quarterly Growth 2009-2015
AGRI., HUNTING, FORESTRY AND FISHING MANUFACTURING
SERVICE SECTOR GROSS DOMESTIC PRODUCT
3
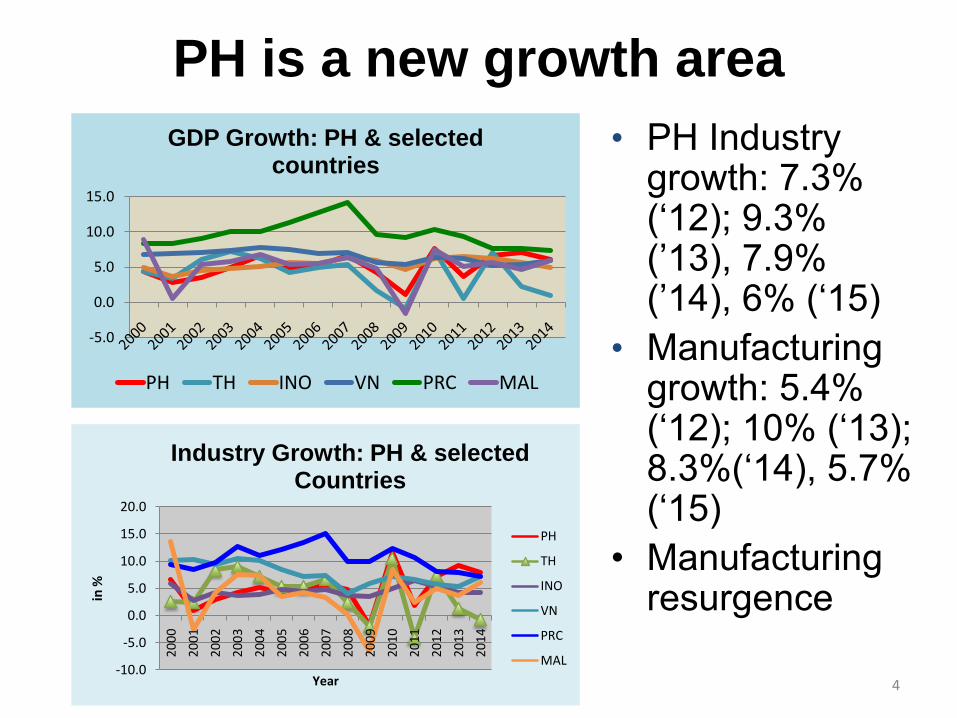
PH is a new growth area
• PH Industry growth: 7.3% (‘12); 9.3% (’13), 7.9% (’14), 6% (‘15)
• Manufacturing growth: 5.4% (‘12); 10% (‘13); 8.3%(‘14), 5.7% (‘15)
• Manufacturing resurgence
-5.0
0.0
5.0
10.0
15.0
GDP Growth: PH & selected countries
PH TH INO VN PRC MAL
-10.0
-5.0
0.0
5.0
10.0
15.0
20.0
20
00
20
01
20
02
20
03
20
04
20
05
20
06
20
07
20
08
20
09
20
10
20
11
20
12
20
13
20
14
in %
Year
Industry Growth: PH & selected Countries
PH
TH
INO
VN
PRC
MAL
4
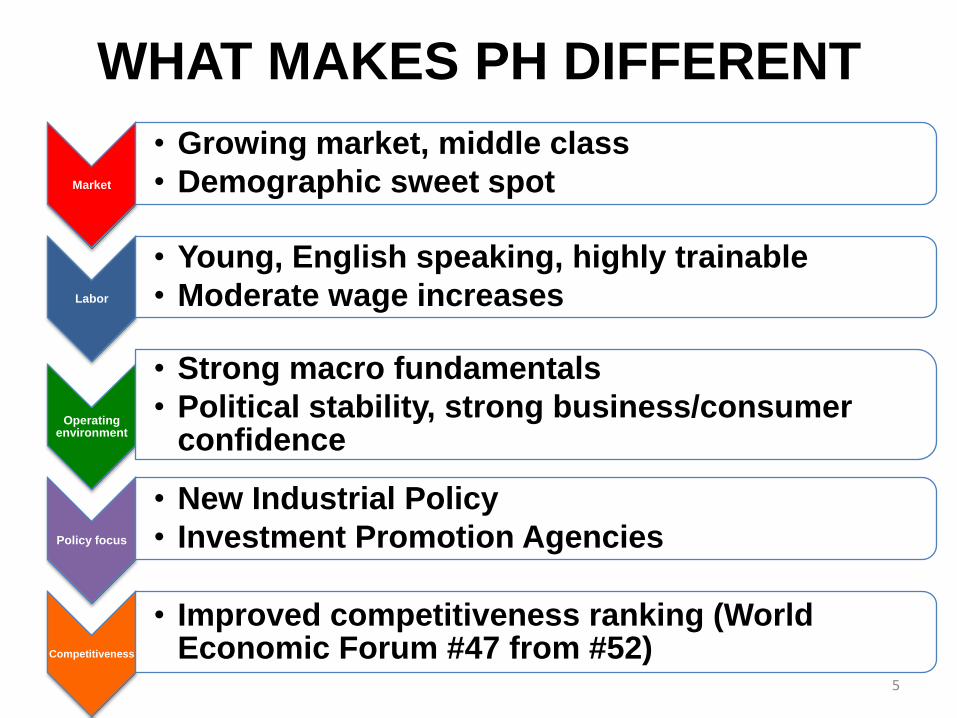
WHAT MAKES PH DIFFERENT
Market
• Growing market, middle class
• Demographic sweet spot
Labor
• Young, English speaking, highly trainable
• Moderate wage increases
Operating environment
• Strong macro fundamentals
• Political stability, strong business/consumer confidence
Policy focus
• New Industrial Policy
• Investment Promotion Agencies
Competitiveness
• Improved competitiveness ranking (World Economic Forum #47 from #52)
5
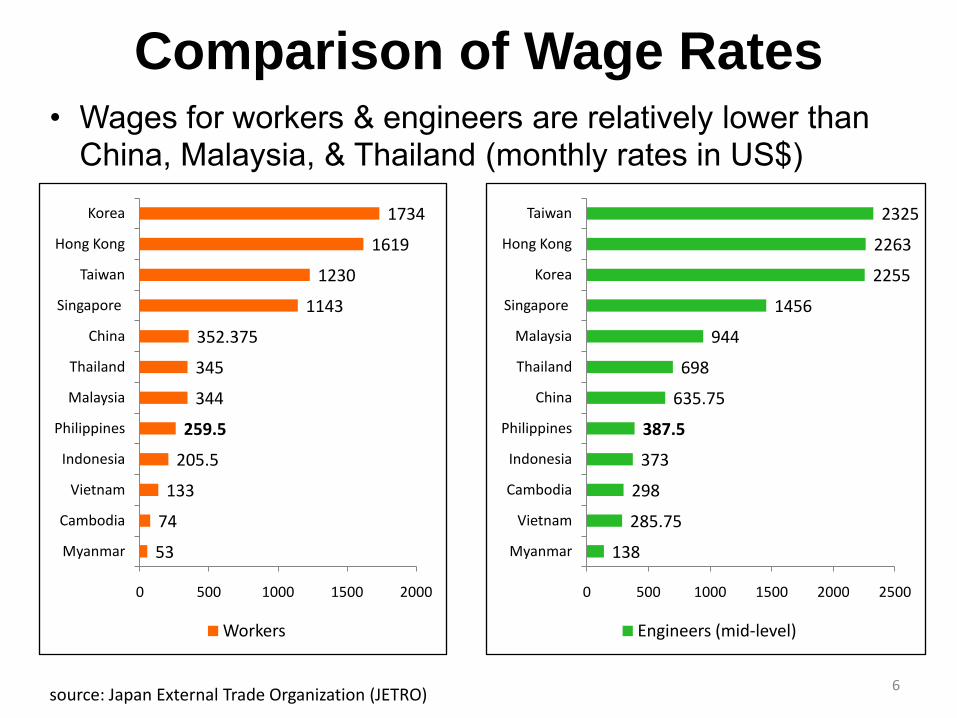
Comparison of Wage Rates
53
74
133
205.5
259.5
344
345
352.375
1143
1230
1619
1734
0 500 1000 1500 2000
Myanmar
Cambodia
Vietnam
Indonesia
Philippines
Malaysia
Thailand
China
Singapore
Taiwan
Hong Kong
Korea
Workers
source: Japan External Trade Organization (JETRO)
138
285.75
298
373
387.5
635.75
698
944
1456
2255
2263
2325
0 500 1000 1500 2000 2500
Myanmar
Vietnam
Cambodia
Indonesia
Philippines
China
Thailand
Malaysia
Singapore
Korea
Hong Kong
Taiwan
Engineers (mid-level)
• Wages for workers & engineers are relatively lower than China, Malaysia, & Thailand (monthly rates in US$)
6
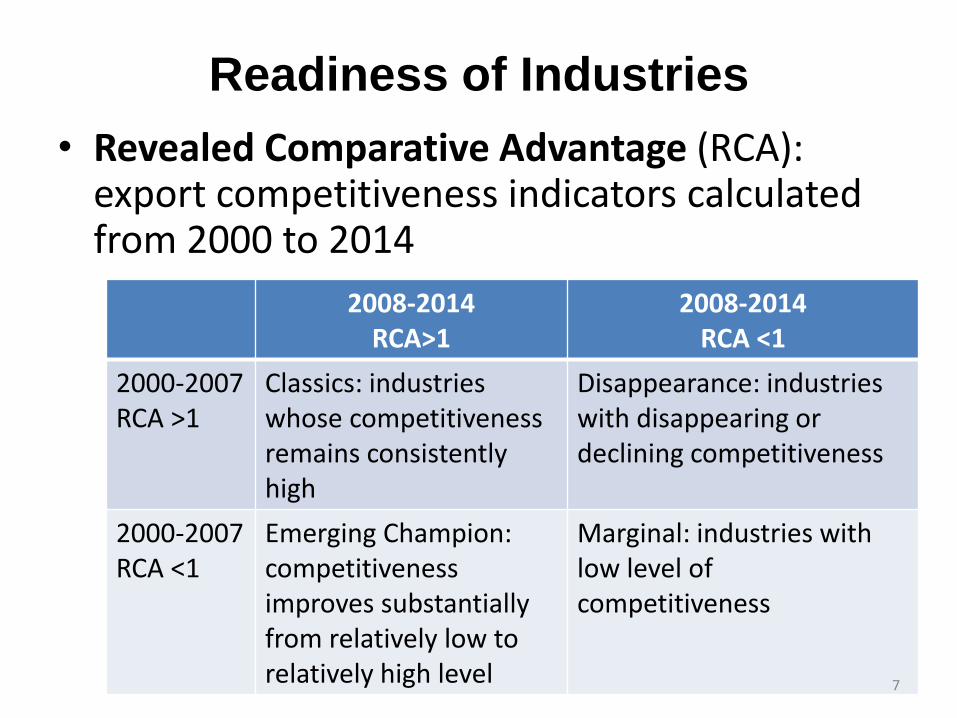
Readiness of Industries
• Revealed Comparative Advantage (RCA): export competitiveness indicators calculated from 2000 to 2014
2008-2014RCA>1
2008-2014RCA <1
2000-2007 RCA >1
Classics: industrieswhose competitivenessremains consistently high
Disappearance: industries with disappearing or declining competitiveness
2000-2007 RCA <1
Emerging Champion: competitiveness improves substantially from relatively low to relatively high level
Marginal: industries with low level of competitiveness
7

CODE PRODUCT DESCRIPTION611 Sugars, beet and cane, raw, solid
2659 Vegetable textile fibres, nes, and waste4243 Coconut (copra) oil541 Potatoes, fresh or chilled, excluding sweet potatoes
8745 Measuring, controlling and scientific instruments, nes7621 Radio receivers for motor-vehicles573 Banana, plantain, fresh or dried
7591 Parts, nes of & accessories for machines of headings 7511 or 75187722 Printed circuits, and parts thereof, nes8432 Women’s, girls’, infants’ outerwear, textile, not knitted or crocheted
7763 Diodes, transistors, photocells, etc585 Fruit or vegetable juices589 Fruit prepared or preserved, nes
8811 Photographic cameras, flashlight apparatus, parts, accessories, nes
7764 Electronic microcircuits615 Molasses371 Fish, prepared or preserved, nes577 Nuts edible, fresh or dried
Classics
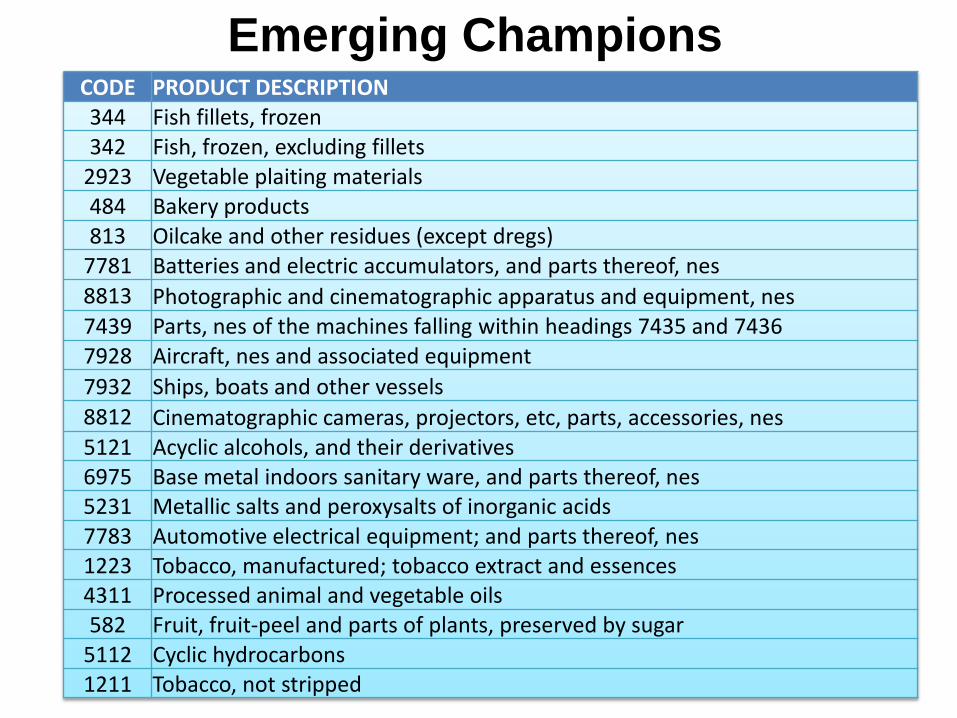
CODE PRODUCT DESCRIPTION344 Fish fillets, frozen342 Fish, frozen, excluding fillets
2923 Vegetable plaiting materials484 Bakery products813 Oilcake and other residues (except dregs)
7781 Batteries and electric accumulators, and parts thereof, nes
8813 Photographic and cinematographic apparatus and equipment, nes7439 Parts, nes of the machines falling within headings 7435 and 74367928 Aircraft, nes and associated equipment
7932 Ships, boats and other vessels
8812 Cinematographic cameras, projectors, etc, parts, accessories, nes5121 Acyclic alcohols, and their derivatives6975 Base metal indoors sanitary ware, and parts thereof, nes5231 Metallic salts and peroxysalts of inorganic acids7783 Automotive electrical equipment; and parts thereof, nes1223 Tobacco, manufactured; tobacco extract and essences4311 Processed animal and vegetable oils582 Fruit, fruit-peel and parts of plants, preserved by sugar
5112 Cyclic hydrocarbons1211 Tobacco, not stripped
Emerging Champions

CODE PRODUCT DESCRIPTION
612 Refined sugar etc712 Coffee extracts, essences or concentrates711 Coffee green, roasted; coffee substitutes containing coffee723 Cocoa butter and paste730 Chocolate and other preparations containing cocoa, nes721 Cocoa beans, raw, roasted752 Spices, except pepper and pimento2331 Synthetic rubber, latex; factice derived from oils421 Rice in the husk or husked, but not farther prepared422 Rice, semi-milled or wholly milled440 Maize, unmilled4242 Palm oil4244 Palm kernel oil4249 Fixed vegetable oils, nes6639 Articles of ceramic materials, nes7851 Motorcycles, auto-cycles; side-cars of all kind, etc5530 Perfumery, cosmetics, toilet preparations, etc224 Milk and cream, preserved, concentrated or sweetened2882 Other non-ferrous base metal waste and scrap, nes
Marginals
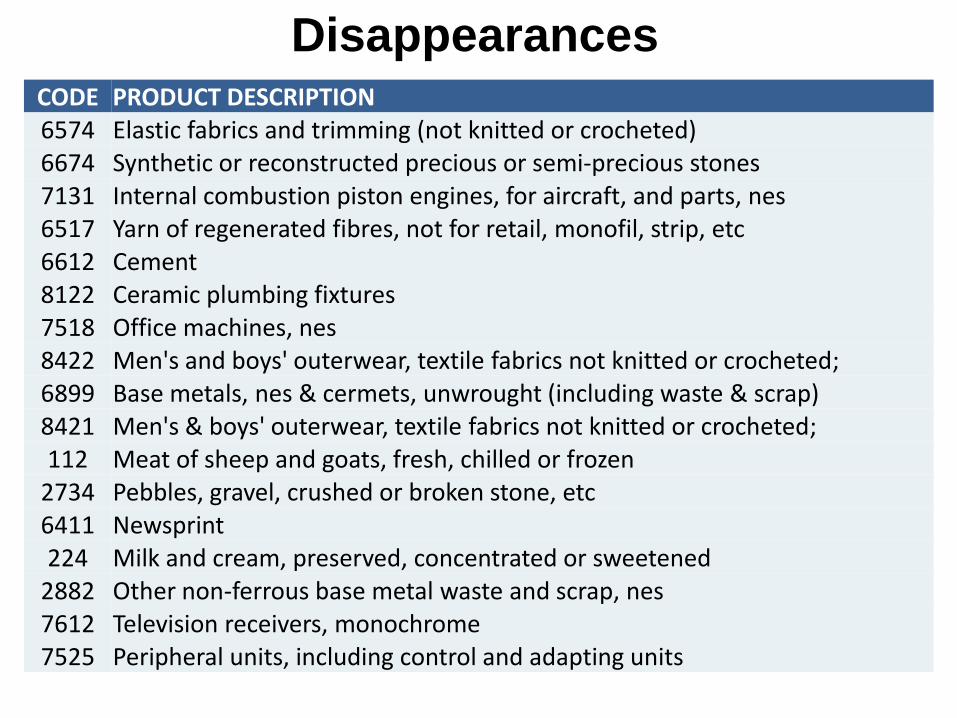
CODE PRODUCT DESCRIPTION6574 Elastic fabrics and trimming (not knitted or crocheted)6674 Synthetic or reconstructed precious or semi-precious stones7131 Internal combustion piston engines, for aircraft, and parts, nes6517 Yarn of regenerated fibres, not for retail, monofil, strip, etc6612 Cement8122 Ceramic plumbing fixtures7518 Office machines, nes8422 Men's and boys' outerwear, textile fabrics not knitted or crocheted;6899 Base metals, nes & cermets, unwrought (including waste & scrap)8421 Men's & boys' outerwear, textile fabrics not knitted or crocheted;112 Meat of sheep and goats, fresh, chilled or frozen
2734 Pebbles, gravel, crushed or broken stone, etc6411 Newsprint224 Milk and cream, preserved, concentrated or sweetened
2882 Other non-ferrous base metal waste and scrap, nes7612 Television receivers, monochrome7525 Peripheral units, including control and adapting units
Disappearances
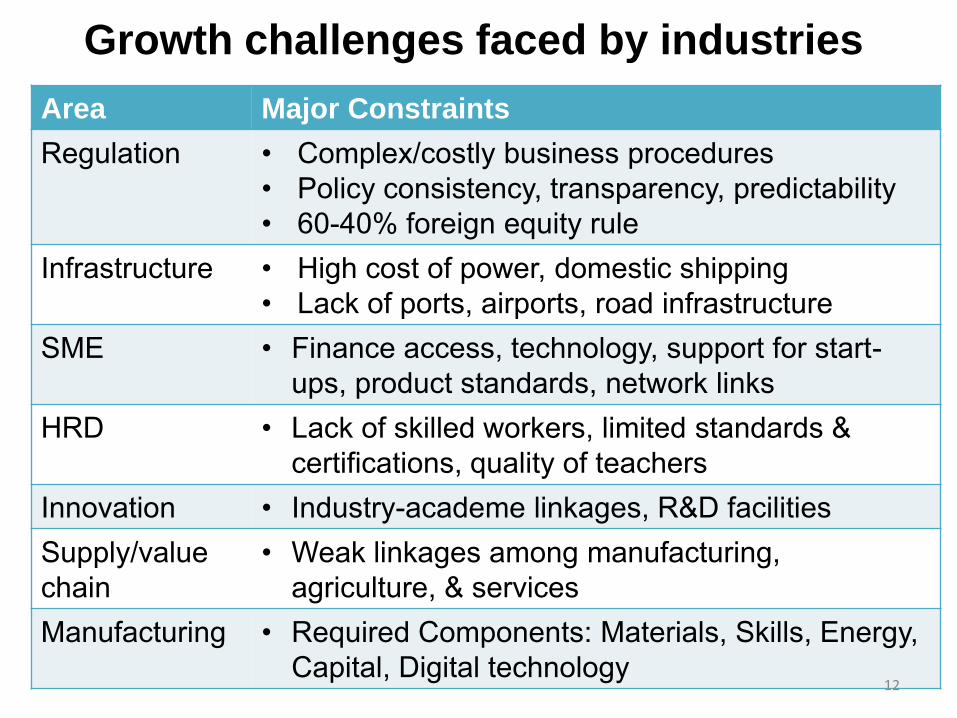
Growth challenges faced by industries
Area Major Constraints
Regulation • Complex/costly business procedures • Policy consistency, transparency, predictability • 60-40% foreign equity rule
Infrastructure • High cost of power, domestic shipping• Lack of ports, airports, road infrastructure
SME • Finance access, technology, support for start-ups, product standards, network links
HRD • Lack of skilled workers, limited standards & certifications, quality of teachers
Innovation • Industry-academe linkages, R&D facilitiesSupply/value chain
• Weak linkages among manufacturing, agriculture, & services
Manufacturing • Required Components: Materials, Skills, Energy, Capital, Digital technology
12

Part 2: Government Strategy
New Industrial Policy
Inclusive growth
Regional economic
integration, FTAs
Jobs,
Competitive-
ness
Competitiveness - crucial in upgrading, rising regional integration & global value chains
Industrial policy -best way to create jobs, reduce poverty, & achieve inclusive growth
13

• Upgrade industries
• Remove growth obstacles
GOAL: Improve Competitiveness
• Create proper environment for private sector development
• Private sector: proximate source of growth
Government as Facilitator
• How to plug in regional production networks
• Move up the value chain
• Build strong regional economies
GVC-focused,
Cluster-based
Strategic Industrial Policy
14
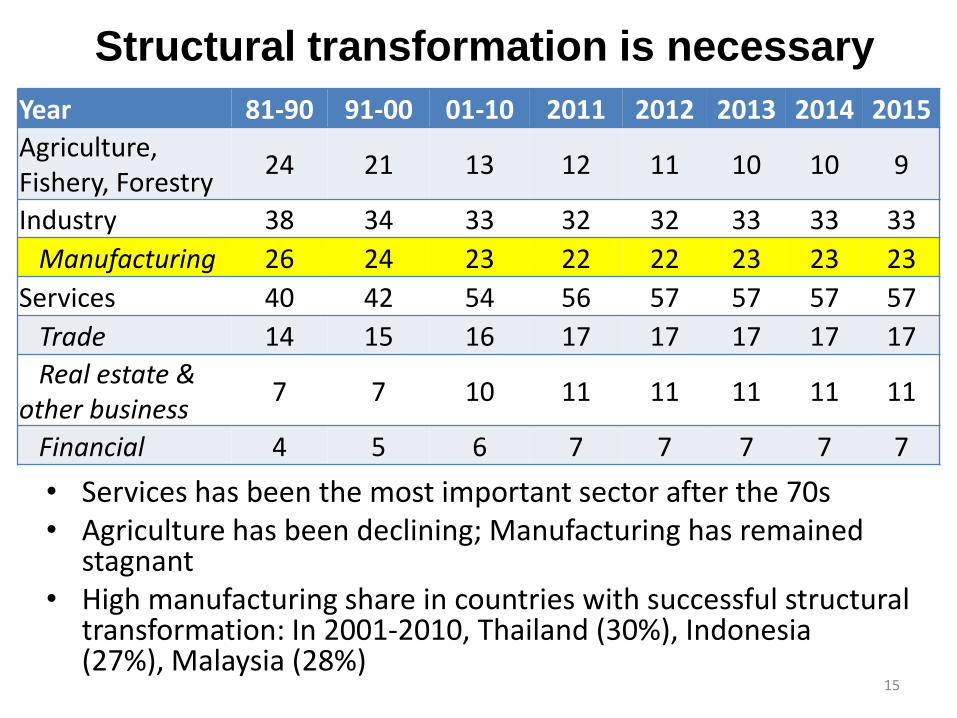
Structural transformation is necessary
• Services has been the most important sector after the 70s• Agriculture has been declining; Manufacturing has remained
stagnant• High manufacturing share in countries with successful structural
transformation: In 2001-2010, Thailand (30%), Indonesia (27%), Malaysia (28%)
Year 81-90 91-00 01-10 2011 2012 2013 2014 2015
Agriculture, Fishery, Forestry
24 21 13 12 11 10 10 9
Industry 38 34 33 32 32 33 33 33
Manufacturing 26 24 23 22 22 23 23 23
Services 40 42 54 56 57 57 57 57
Trade 14 15 16 17 17 17 17 17
Real estate & other business
7 7 10 11 11 11 11 11
Financial 4 5 6 7 7 7 7 7
15

Regional Economic Transformation is crucialSuccessful structural change relies on the strength of regional economies
• Imbalances: NCR, Calabarzon, Central Luzon: largest share of GDP; highest manufacturing share to GRDP, highest unemployment
• ARMM, CARAGA, IVB, V, IX: poverty incidence persistently high • Industrial policy efforts in the regions: improve productivity in
agriculture where half of the poor are, agribusiness
NCR
CAR
ILOCOSCAGAYAN VALLEY
CENTRAL LUZON
CALABARZON
MIMAROPA BICOL
WESTERN VISAYAS
CENTRAL VISAYAS
EASTERN VISAYAS
ZAMBOANGA PENINSULA
NORTHERN MINDANAO
DAVAO REGION SOCCSKSARGEN
CARAGAARMM
-10%
0%
10%
20%
30%
40%
50%
60%
70%
-5% 0% 5% 10% 15% 20%
Average Growth Rate (’12-’14)
Man
ufa
ctu
rin
g as
% o
f G
RD
P
16
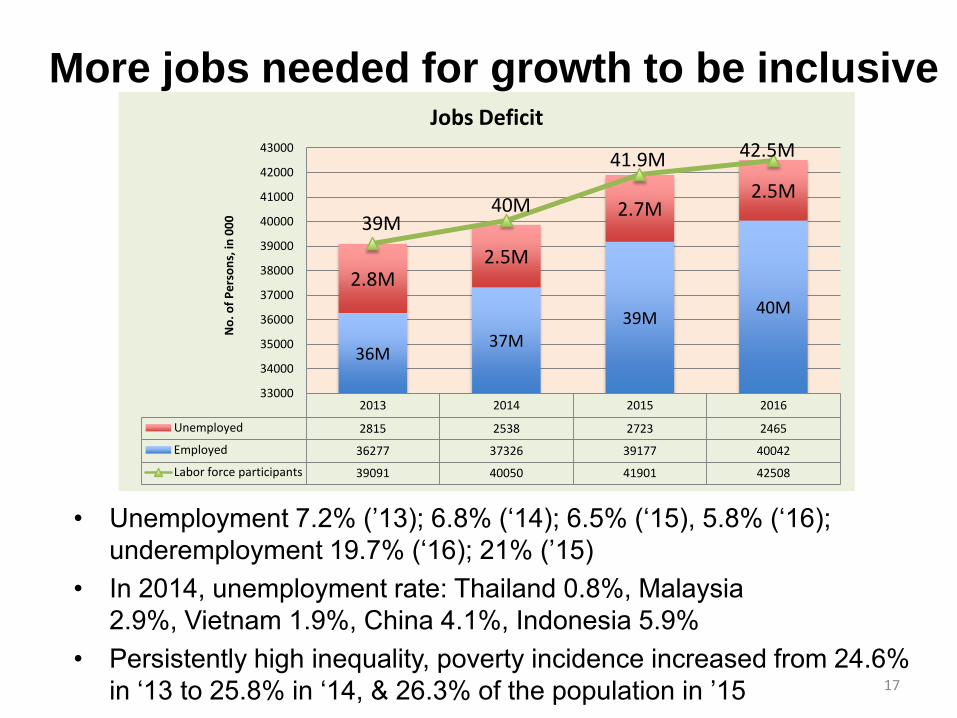
More jobs needed for growth to be inclusive
• Unemployment 7.2% (’13); 6.8% (‘14); 6.5% (‘15), 5.8% (‘16); underemployment 19.7% (‘16); 21% (’15)
• In 2014, unemployment rate: Thailand 0.8%, Malaysia 2.9%, Vietnam 1.9%, China 4.1%, Indonesia 5.9%
• Persistently high inequality, poverty incidence increased from 24.6% in ‘13 to 25.8% in ‘14, & 26.3% of the population in ’15
2013 2014 2015 2016
Unemployed 2815 2538 2723 2465
Employed 36277 37326 39177 40042
Labor force participants 39091 40050 41901 42508
36M37M
39M40M
2.8M2.5M
2.7M2.5M
39M40M
41.9M 42.5M
33000
34000
35000
36000
37000
38000
39000
40000
41000
42000
43000
No
. of
Pe
rso
ns,
in 0
00
Jobs Deficit
17

Need to attract more FDIs
• 2013-2014: PH ($3.9B; 6.2B) still lags behind Indonesia ($18B; 25.9), Malaysia ($12.3; 10.6B), Thailand ($12.9B; 12.7B), Singapore ($63.8B; 67B ), & Vietnam ($8.9B
• aggressive marketing/promotion program to attract FDI esp. technology intensive, target companies to fit our IP strategy
-10000
0
10000
20000
30000
40000
50000
60000
70000
FDI Inflows, annual 1970-2013 (million US$)
Brunei Darussalam
Cambodia
Indonesia (…2002)
Lao People's Dem. Rep.
Malaysia
Myanmar
Philippines
Singapore
Thailand
Viet Nam
18
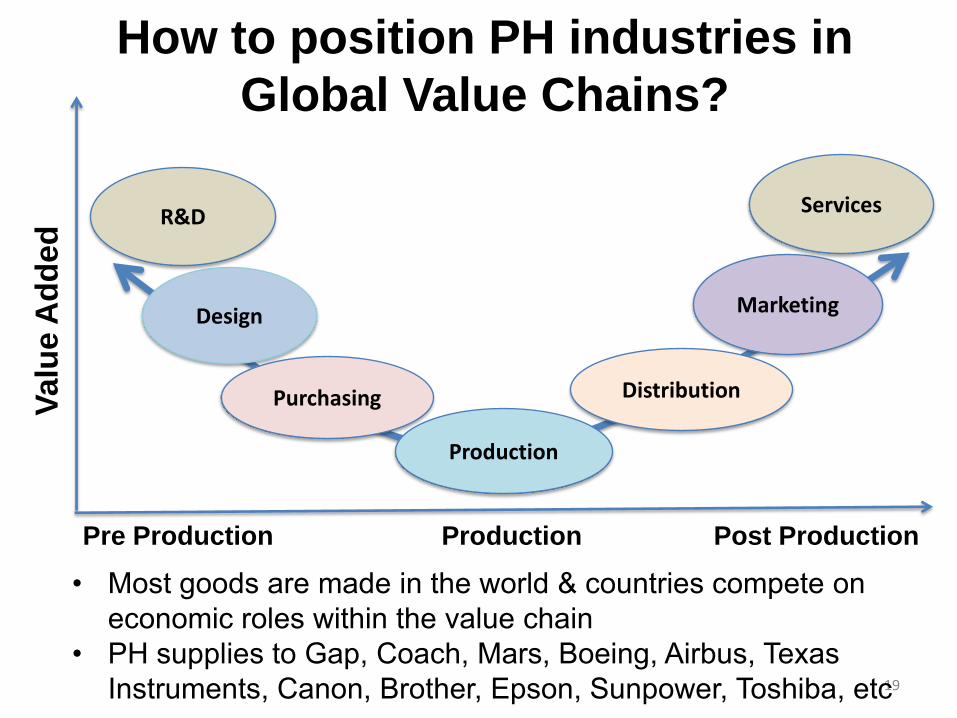
How to position PH industries in
Global Value Chains?V
alu
e A
dd
ed
19
Design
Purchasing
Production
Distribution
Marketing
Services
Pre Production Production Post Production
• Most goods are made in the world & countries compete on economic roles within the value chain
• PH supplies to Gap, Coach, Mars, Boeing, Airbus, Texas Instruments, Canon, Brother, Epson, Sunpower, Toshiba, etc
R&D

Part 3: Manufacturing Resurgence
Program (MRP)
Enhance manufacturing competitiveness • Lead Implementing Agency: DTI• Participating Agencies: DTI, DOST, DOLE, DOLE-
TESDA, CHED, DOE, DA, NPC, NEA, PCA
Targets by 2025: 30% share of manufacturing to GDP; 15% share to Total Employment
Industry Development Program DTI-BOI’s contributory program to MRP Comprehensive Automotive Resurgence Strategy
(CARS) Program – E.O. 182
20
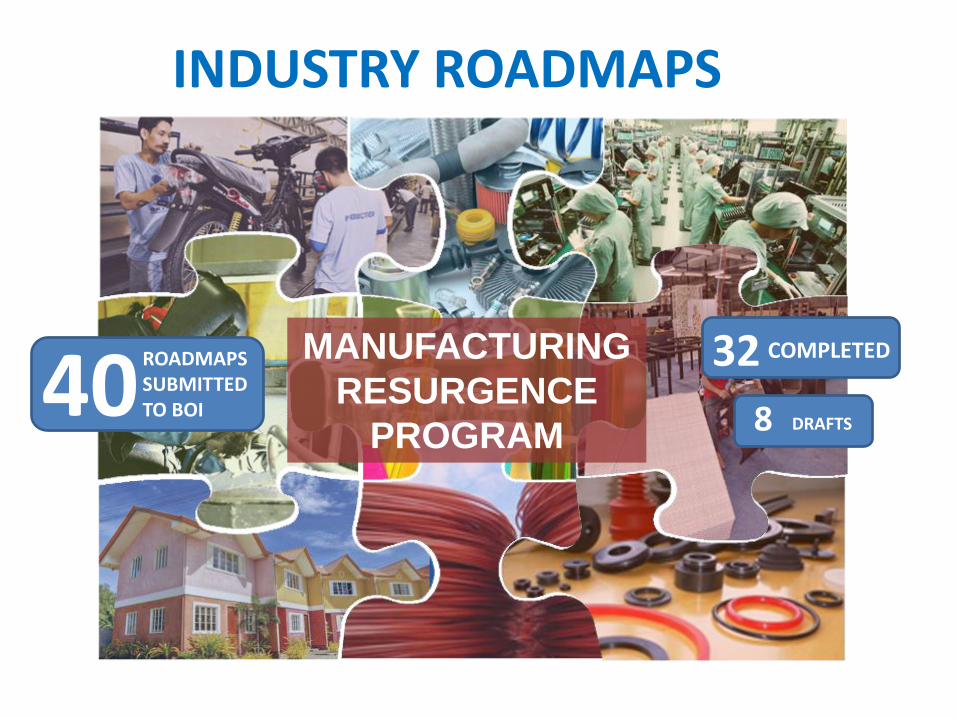
INDUSTRY ROADMAPS
MANUFACTURING
RESURGENCE
PROGRAM40
ROADMAPS SUBMITTEDTO BOI
32 COMPLETED
8 DRAFTS
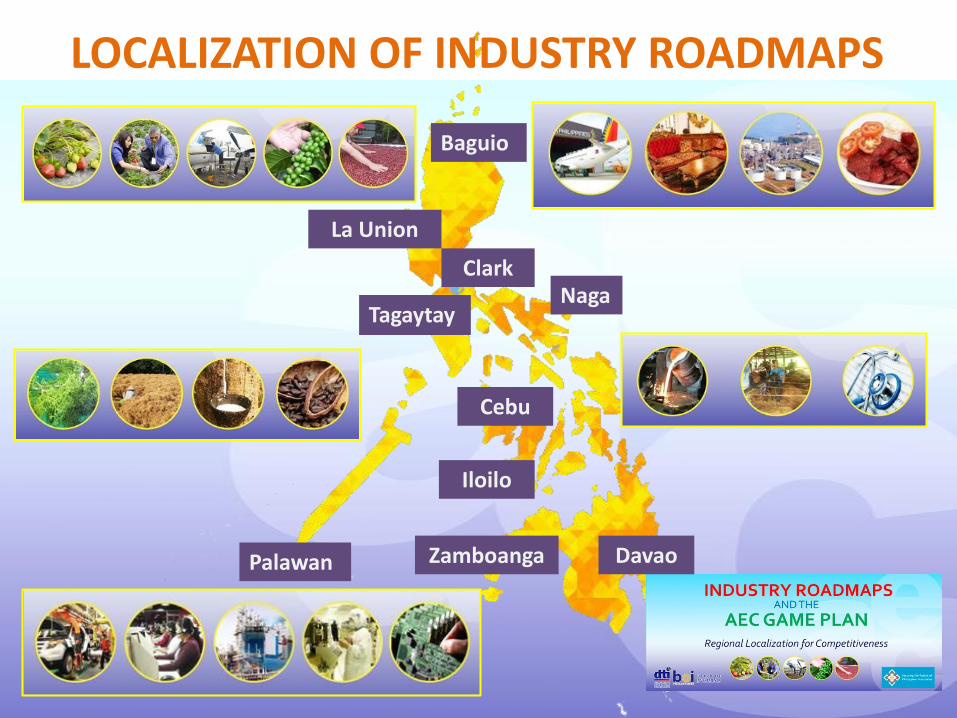
LOCALIZATION OF INDUSTRY ROADMAPS
Baguio
Clark
Palawan
TagaytayNaga
Iloilo
Zamboanga Davao
Cebu
La Union
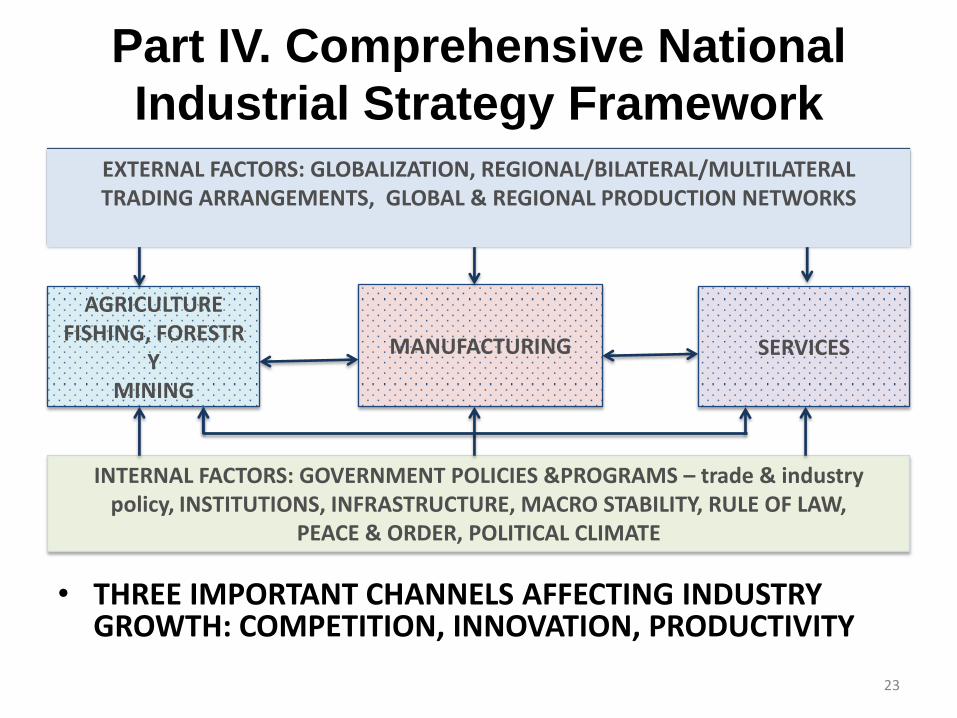
Part IV. Comprehensive National
Industrial Strategy Framework
• THREE IMPORTANT CHANNELS AFFECTING INDUSTRY GROWTH: COMPETITION, INNOVATION, PRODUCTIVITY
23
MANUFACTURING SERVICES
AGRICULTURE FISHING, FORESTR
YMINING
INTERNAL FACTORS: GOVERNMENT POLICIES &PROGRAMS – trade & industry policy, INSTITUTIONS, INFRASTRUCTURE, MACRO STABILITY, RULE OF LAW,
PEACE & ORDER, POLITICAL CLIMATE
EXTERNAL FACTORS: GLOBALIZATION, REGIONAL/BILATERAL/MULTILATERAL TRADING ARRANGEMENTS, GLOBAL & REGIONAL PRODUCTION NETWORKS
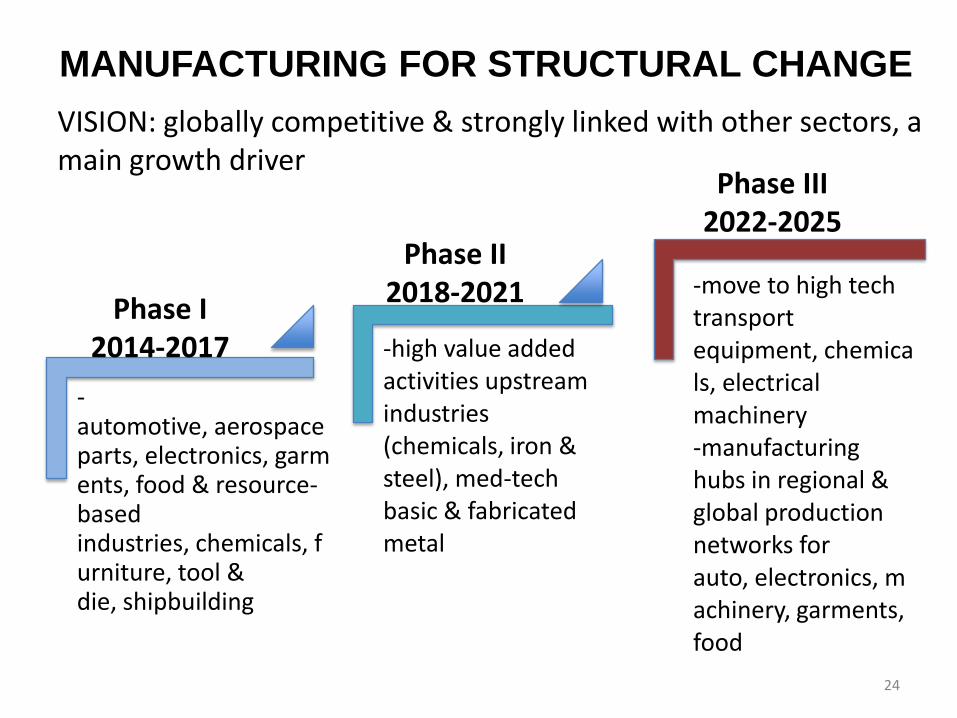
MANUFACTURING FOR STRUCTURAL CHANGE
-automotive, aerospace parts, electronics, garments, food & resource-based industries, chemicals, furniture, tool & die, shipbuilding
-move to high tech transport equipment, chemicals, electrical machinery-manufacturing hubs in regional & global production networks for auto, electronics, machinery, garments, food
-high value added activities upstream industries (chemicals, iron & steel), med-tech basic & fabricated metal
Phase I 2014-2017
Phase II 2018-2021
Phase III 2022-2025
VISION: globally competitive & strongly linked with other sectors, a main growth driver
24

AGRIBUSINESS: CATALYST TO DRIVE
REGIONAL ECONOMIC TRANSFORMATIONTransform & upgrade agriculture from traditional farming to a globally competitive agribusiness sector
-rubber, coconut, mangoes, coffee, cacao,banana, palm oil & other high value crops; supply chain gaps: strengthen agro-processing & its linkages to production
-deepen participation in GVC -PH as agribusiness regional hub
- strengthen supply chains, upgrade commodity clusters; R&D, access to technologies, finance; regulatory & certification system
Phase I 2014-2017
Phase II 2018-2021
Phase III 2022-2025
25
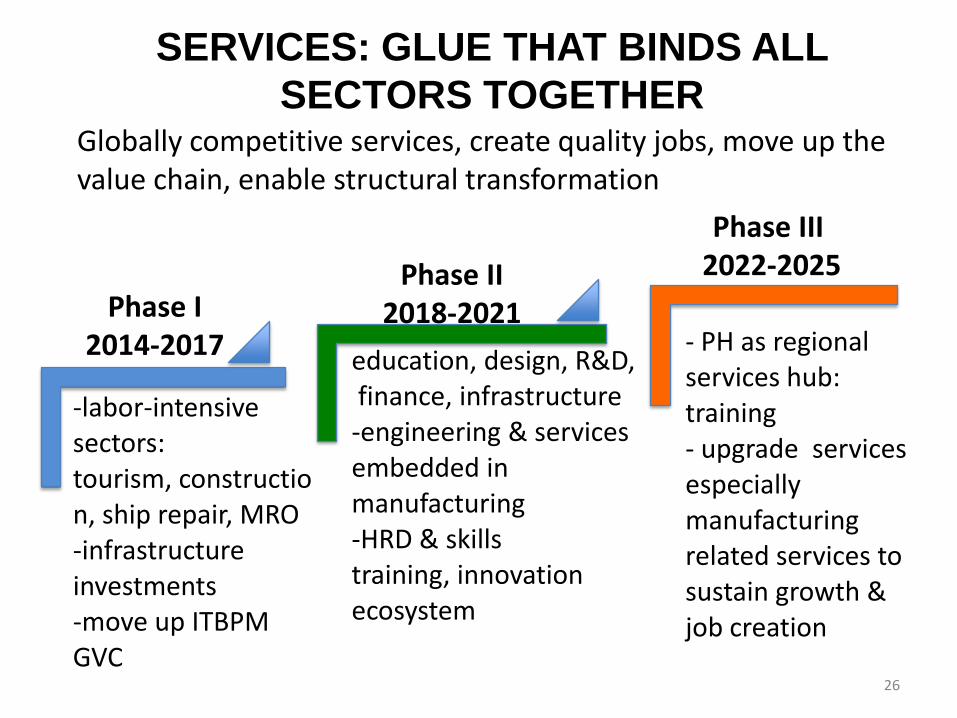
SERVICES: GLUE THAT BINDS ALL
SECTORS TOGETHER
-labor-intensive sectors: tourism, construction, ship repair, MRO-infrastructure investments -move up ITBPM GVC
- PH as regional services hub: training - upgrade services especially manufacturing related services to sustain growth & job creation
education, design, R&D,finance, infrastructure-engineering & services embedded in manufacturing-HRD & skills training, innovation ecosystem
Phase I 2014-2017
Phase II 2018-2021
Phase III2022-2025
Globally competitive services, create quality jobs, move up the value chain, enable structural transformation
26
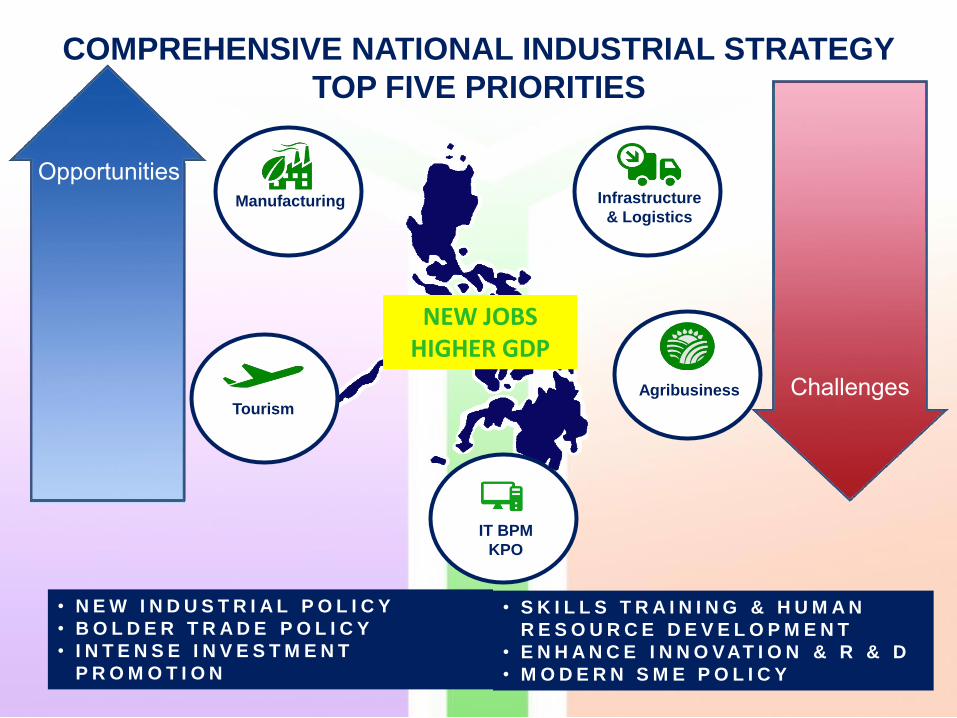
COMPREHENSIVE NATIONAL INDUSTRIAL STRATEGY
TOP FIVE PRIORITIES
Opportunities
Challenges
Manufacturing
Tourism
IT BPM
KPO
Agribusiness
Infrastructure
& Logistics
NEW JOBSHIGHER GDP
• N E W I N D U S T R I A L P O L I C Y
• B O L D E R T R A D E P O L I C Y
• I N T E N S E I N V E S T M E N T
P R O M O T I O N
• S K I L L S T R A I N I N G & H U M A N
R E S O U R C E D E V E L O P M E N T
• E N H A N C E I N N O VAT I O N & R & D
• M O D E R N S M E P O L I C Y
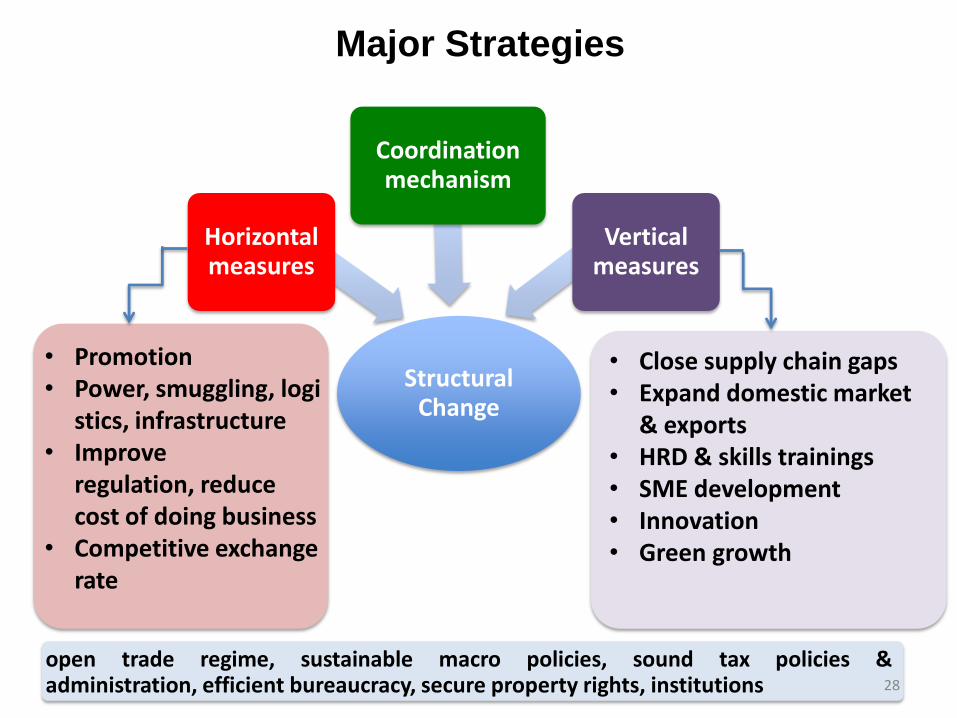
Major Strategies
Structural Change
Horizontal measures
Coordination mechanism
Vertical measures
• Close supply chain gaps• Expand domestic market
& exports• HRD & skills trainings• SME development• Innovation • Green growth
• Promotion• Power, smuggling, logi
stics, infrastructure• Improve
regulation, reduce cost of doing business
• Competitive exchange rate
open trade regime, sustainable macro policies, sound tax policies &administration, efficient bureaucracy, secure property rights, institutions 28
