computational analysis of the beta adrenergic receptor: insights …€¦ · adrenergic receptor:...
TRANSCRIPT

Computational Analysis of the Beta2 Adrenergic Receptor: Insights into Potential
Treatments for Congestive Heart Failure
Name
Department of Chemistry, City University of New York at the College of Staten Island, 2800 Victory
Boulevard, Staten Island, NY 10314, USA
Abstract
The first crystalized G-protein coupled receptor (GPCR) was the B2 adrenergic receptor (B2-
AR). Since that point the B2-AR has become a prototype system for studying GPCRs. Fenoterol
a very well-known agonist of the B2-AR has proven to bind with differing affinity based on its
stereochemical configuration ((R,R’)>(R,S’)=(S,R’)>(S,S’)). Our aim is to study why the
stereoisomers of fenoterol and some of its derivatives (N = 32 molecules) have differences in
their binding affinities to the B2-AR. Our current study exploits computational techniques to
obtain the free energy of binding involved in the formation of fenoterol derivative B2-AR
complexes. The molecular models of B2-AR used in the current study were taken from the
crystal structures of a nanobody-stabilized (active state) of the B2-AR with the bound agonist
BI-167107 (PDB ID: 3P0G) and the human (inactive state) B2-AR T4 lysozyme fusion protein
with bound (S)-carazolol (PDB ID: 2RH1). One computational technique, known as the docking
procedure allowed us to analyze the binding sites for fenoterol and its derivatives. The
docking studies revealed homology between the active residues Ser203, Ser207, Asp113,
Lys305, Asn312, Tyr308, Asp192 and the 3-D space occupied the all ligands, which was
between TM III, TM V, TM VI and TM VII. A second computational technique known as

molecular dynamics, was used to study the atom stability between two ligands ((R,R’)- and
(S,S’)-fenoterol) and the B2-AR. The molecular dynamics stimulations reaffirmed the B2-AR
bias towards the (R,R’) stereoconfiguration of fenoterol. Ultimately, the analysis of these
computation techniques, leaves the scientific world with a new awareness about
stereoselective interactions ligands face with the B2-AR. This new awareness will allow for the
improved design of B2-AR linked medications, which will lead to better ways of treating and
preventing congestive heart failure.
1. Introduction
1.1- GPCRs & G Proteins General Background
G-protein coupled receptors (GPCR’s) are defined as a diverse class of cell-surface receptors
which upon stimulation serve as an activator of G proteins, through guanine nucleotide
exchange factor (GEF) activity. The diversity of ligands (binding partners) for these receptors is
massive and includes neurotransmitters, hormones, light, taste, and odor. With a great diversity
of ligands, it should come as no surprise that GPCR genes are ubiquitous, with over 800 genes
[1] in the human genome coding for this critical class of receptors. One surprising aspect to
GPCR genes is that are predominately intronless [2], which are non-expressed sections of the
DNA/RNA within a protein sequence. Just for comparison, 95% [3] of the human genome that
encodes for proteins contain one or more introns. In terms of the geometric shape or topology
of the receptor we see a highly conserved serpentine heptahelical shape. GPCRs have seven
alpha helical transmembrane domains, while also having the appearance of a snake when seen
from the extracellular face.

GPCRs are separated into many three major families. It has been
reported that the three families contain 25% amino acid sequence
homology [1]. Family A is by far the largest and is known as the
rhodopsin-like family. Family A’s most notable GPCRs include
rhodopsin, the olfactory GPCRs, and the adrenergic receptors (α &
β). Family B is remarkably smaller with approximately 25 members,
and is known as the secretin-like family. Family B is almost uniquely
composed of gastrointestinal hormones GPCRs including ones for
secretin and glucagon. Family C is similar in size to Family B, and is
known as the glutamate-like family. Family C’s most notable GPCRs
include the metabotropic glutamate receptor and some taste
receptors. All of these families couple to key signaling molecules
known as G-proteins.
G-proteins are a class of polypeptides named for their high binding affinity for the nucleotide
guanine. They are generally assorted into two categories: heterotrimeric and small G-proteins.
Heterotrimeric G-proteins consist of three subunits (α, β, γ) while the small G-proteins consist
of one subunit which resembles the α subunit found in heterotrimeric G-proteins. The
interesting property of G-proteins is that their active and inactive state depend on the type of
guanine nucleotide bound. If GTP is bound the G-protein is active, and if GDP is bound then the
G-protein will be inactive. The nucleotide bound is controlled by accessory proteins, which are
generally classified into two classes: guanine nucleotide exchange factors (GEF) and GTPase
activator proteins (GAP). GEF’s promote the dissociation of GDP from the inactive G-protein,
Figure 1- Shows the three
major families of GPCRs and
their binding partners

which allows for the activation [4] of the G-protein through the binding of GTP, one of the
largest class of GEFs are GPCRs. GAP’s promote the hydrolysis of GTP to GDP, leading to the
inactivation [5] of an activated G-protein, one of the largest class of GAPs are regulator of G-
protein signaling (RGS) proteins.
1.2- Heterotrimeric G Proteins (Gs,Gi,Gq,G0) General Signaling Pathway
As discussed earlier, GPCRs exclusively couple with heterotrimeric G-proteins, which consist of
three subunits (α, β, γ). There are generally 4 major classes of heterotrimeric G-proteins, which
include: Gs, Gi, Gq, and G0. The signaling pathway for all 4 major classes begin in a similar
fashion. The initial event involves a ligand binding to a GPCR, once associated with the ligand
the GPCR undergoes a conformational change. That conformational change gives the GPCR the
ability to act as a GEF, which leads to the activation of the associated heterotrimeric G-protein
(GDP gets swapped out for GTP). Once GTP is bound to the α subunit, the heterotrimeric G-
protein undergoes a dissociation, which will leave a β-γ complex with the GPCR and a diffusing
Figure 2- Shows a simple
picture of what GEFs [4] and
GAPs [5] do when they
interact with G-Proteins.
α subunit. The primary role of the α subunit is to be an allosteric modulator of an effector
protein. Up until this point, all of the four major classes of heterotrimeric G-proteins follow the
same mechanism, after this point they will diverge depending on the effector protein.
The major effector of the Gs and Gi classes of heterotrimeric G proteins is adenylyl cyclase [1,6],
a huge 12 TM domain protein that converts intracellular ATP into cAMP. Gs’s α subunit activates
adenylyl cyclase, thus leading to an increase in intracellular cAMP. The increased levels of cAMP
can lead to the activation of many important proteins including protein kinase A (PKA). As with
all kinase proteins, PKA phosphorylates proteins with a certain consensus sequence. Ultimately,
the effects of PKA can be felt at the genetic level with transcriptional regulation. Gi’s α subunit
inactivates adenylyl cyclase, leading to a decrease in intracellular cAMP, which will also lead to
changes in gene expression.
The major effector of the Gq class of heterotrimeric G proteins is phospholipase C, an enzyme
that cleaves phospholipid in the sn3 position [1]. One major phospholipid that phospholipase C
cleaves is phosphatidylinositol-4,5-bisphosphate (PIP2) . Once PIP2 is cleaved there is an
increase in two second messengers, diacylglycerol (DAG) and inositol-triphosphate (IP3). The
role of the second messenger IP3 is to bind to IP3 receptors found on the endoplasmic
reticulum, promoting the release of a tertiary messenger Ca2+ from the endoplasmic reticulum.
The role of the second messenger DAG is to activate protein kinase C (PKC). As with all kinase
proteins, PKC phosphorylates proteins with a certain consensus sequence. Ultimately, the
effects of PKC can be felt at the genetic level with transcriptional regulation.
The major effectors of the G0 class of heterotrimeric G proteins are potassium (K+) channels,
adenylyl cyclase, and more [7]. It is key to note that most cells have sodium potassium pumps,
which bring K+ into the cells against its concentration gradient. Once the K+ channels open from
the G0 activation they pour potassium out of the cell, leaving the cell more negative on the
inside when compared to resting, which is known as hyperpolarization. When G0 inactivates
adenylyl cyclase, it leads to a decrease in intracellular cAMP, which will also lead to changes in
gene expression.
1.3- Introduction to the B2-AR
As alluded to earlier, the beta adrenergic receptors are found in family A of GPCRs. There are 3
subtypes of the beta adrenergic receptor, and they include: B1-AR, B2-AR, B3-AR. The three
subtypes are unequally distributed [8] among the human body. The B1-AR is in higher ratio in
the heart, the B2-AR is in higher ratio in smooth muscle, and the B3-AR is in higher ratio in
adipocytes. The natural ligand (or binding partner) for the 3 subtypes of the beta adrenergic
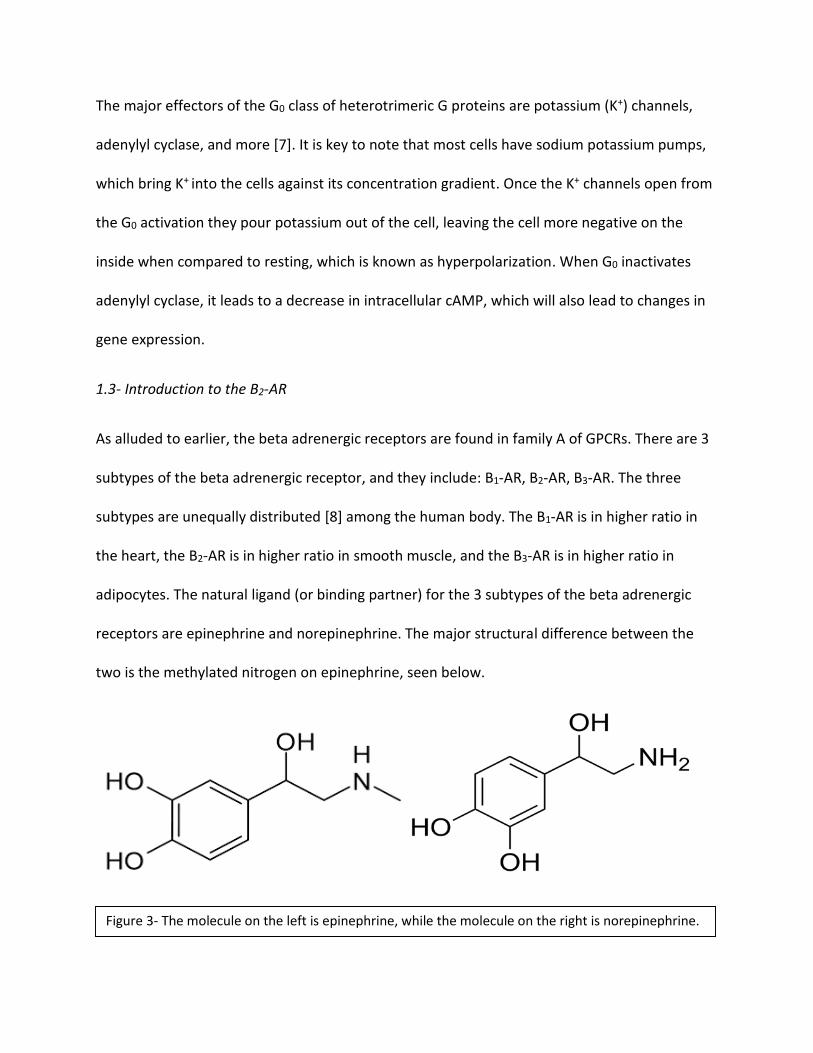
receptors are epinephrine and norepinephrine. The major structural difference between the
two is the methylated nitrogen on epinephrine, seen below.
Figure 3- The molecule on the left is epinephrine, while the molecule on the right is norepinephrine.

The primary role of the beta adrenergic receptor is
found in the autonomic nervous system, or the
unconscious nervous system. The autonomic
nervous system is generally broken up into two
classes: sympathetic or parasympathetic. Adrenergic
receptors ( α, β) play the premier role [9] in the
sympathetic nervous system’s fight or flight
response, while muscarinic receptors play the
premier role in the parasympathetic nervous
system’s rest or digest response. As a result of being
a part of the sympathetic nervous system, the B-ARs
are involved with the recruitment of glucose through gluconeogenesis and glycogenolysis. One
of the more interesting paradoxes [8] is the B2-AR involvement with muscular contractions in
the heart, while also being involved with muscular relaxation in smooth muscle cells. This
paradox will be discussed more in the coming section.
1.4- B2-AR Signaling Pathway
The initial event in the B2-AR signaling pathway involves a ligand binding to the B2-AR, once
associated with the ligand the B2-AR undergoes a conformational change. The change gives the
B2-AR the ability to act as a GEF, which leads to activation of the associated Gs heterotrimeric G-
protein (GDP gets swapped out for GTP). Once GTP is bound to the α subunit, the
Figure 4- Shows the effects [9] of the
sympathetic nervous system on various
organs, found in the human body.

heterotrimeric G-protein undergoes a dissociation, which will leave a β-γ complex with the
GPCR and a diffusing α subunit. The primary role of the α subunit is to be an allosteric
modulator of adenylyl cyclase.
Adenylyl cyclase, a huge 68 kilo-Dalton protein which converts intracellular ATP into cAMP. Gs’s
α subunit activates adenylyl cyclase, thus leading to an increase in intracellular cAMP. The
increased level of cAMP can lead to activation of many important proteins including protein
kinase A (PKA). As with all kinase proteins, PKA phosphorylates proteins with a certain
consensus sequence, which in PKA’s case is RRX(S/T)Y . Ultimately, the effectors of PKA are
diverse and depend on the proteins available in that specific cell.
Figure 5- Shows the common initial steps [10] of B2-AR signaling pathway in all cells

This brings us back to the paradox found in the B2-AR pathway, which has an effect of
constriction in the heart, while having an effect of relaxation in smooth muscle found in the
lungs. First, let’s look at the targets of PKA that can be found in lung’s smooth muscle cells; the
primary two proteins are phospholamban [11] and MAXI-K (K+) channels [12]. Phospholamban
is an enzyme that blocks a calcium pump found in the ER, known as SERCA. By blocking SERCA,
phospholamban promotes increased levels of intracellular calcium, which is required for
contraction. When phospholamban is phosphorylated by PKA, phospholamban can no longer
block SERCA, meaning decreased levels of intracellular calcium, which leads to relaxation.
MAXI-K channels are K+ channels, meaning they can promote the flow of potassium through an
electrochemical gradient. It is key to note that most cells have sodium-potassium pumps, which
bring K+ into the cells against its concentration gradient. Once the MAXI-K channels open from
PKA phosphorylation they pour potassium out of the cell, leaving the cell more negative on the
inside then resting, which is known as hyperpolarization. Once hyperpolarized the muscle cell
relaxes. Next, let’s look at the targets of PKA that can be found in heart’s muscle cells; the
primary protein is the L-type calcium channels [13]. It is key to note that most cells have a low
intracellular calcium concentration. Once the L-type calcium channels open from the PKA
phosphorylation, calcium pours into the cell, leaving the cell more excited and more positive on
the inside then resting, which is known as depolarization. Once depolarized the muscle cell can
contract.
1.5- B2-AR Signaling Pathway Regulation
All critical intracellular processes whether they are related to metabolism or cell signaling are
highly regulated. In the B2-AR signaling pathway there are three major forms of regulation, each

which regulate a unique point in the cascade. At the level of G-protein stimulation there is an
intrinsic GTPase function [14], which the α subunit can take part in. Once the GTPase function
turns on, the α subunit can no longer modulate adenylyl cyclase, effectively ending the B2-AR
signaling pathway. It is key to note that the intrinsic GTPase activity of the α subunit is weak
and normally needs GAPs (section 1.1) to help aid in the process.
A second level of regulation takes place at the level of second messenger formation. Adenylyl
cyclase converts ATP into cAMP, but cAMP levels can be regulated by protein known as
phosphodiesterase. The role of phosphodiesterase, is to convert a cyclic mononucleotide
(cAMP) into a straight chain mononucleotide (AMP) with the help of a molecule of water.
The third major level of regulation exerts its effects directly on the B2-AR, through a process
known as internalization. This regulation’s initial step involves proteins known as G-protein
receptor kinases (GRKs), which phosphorylate the GPCR [1] at certain locations. Once the B2-AR
is phosphorylated, a class of proteins known as arrestins bind to the receptor. Arrestins
promote receptor endocytosis, which leads to an alternative ERK signaling pathways.
1.6- Fenoterol & Congestive Heart Failure
Figure 6- Shows the reaction catalyzed by phosphodiesterase [15].

Congestive heart failure has had a devastating impact on America, with some estimating a $32
[16] billion dollar yearly cost from the disease. Such costs have made the gov’t prioritize
research aimed at curbing the disease [17]. Recently, there has been an interesting twist, which
involves the B2-AR, once an afterthought to the B1-AR in the heart, it has been discovered
through various articles [8], that it might play a critical cardioprotective role in the heart. That
cardioprotective discovery lead a group of researchers [18] to a B2-AR agonist known as
fenoterol. The molecule fenoterol
consists of 2 chiral centers, meaning that
there are in total four stereoisomers
(fig.7). That same group of researchers
[18] devised a strategy that involved
synthesizing 90 derivative compounds of
fenoterol, by using various chemical
modifications to the aminoalkyl tail and
stereo-chemical configurations.
That group of researchers were able to
come up the various binding affinities (pKi) [18] of the modified ligands to the B2-AR, seen in
table 1. The interesting component of the findings was the B2-AR stereoselectivity for the (R,R’)
form of fenoterol and its derivatives. Also seen in table 1, there is moderate affinity for the
(R,S’) & (S,R’) forms and low affinity for the (S,S’) forms. A last thing the table gave us was the
binding affinities for various R1 and R2 derivatives of fenoterol.
Figure 7- Shows fenoterol and its stereoisomers. Also
seen is the R1 and R2 positions of modification.

First, we will use computational analysis,
specifically a docking procedure to investigate the
similarities and differences in the ligand binding
site for fenoterol and it’s derivatives on an active
and inactive form of the B2-AR from the PDB.
Second, we will use computational analysis,
specifically a molecular dynamics stimulation to
help determine the difference in ligand binding
stability involved in the binding of (R,R’) and (S,S’)
fenoterol to the B2-AR active and inactive receptor.
The receptor models selected in this experiment
carry quite a bit of history. For the inactive state,
the receptor selected was the first GPCR crystal
model ever done [19] (PDB ID: 2RH1). This inactive
state features a co-cyrstalized inverse agonist
known as (S)-carazolol. For the active state, the
receptor selected was the first ever activated
GPCR with nanobody stabilization ever done [20]
(PDB ID: 3P0G). This active state features a co-
cyrstalized agonist known as BI-167107.
2. Materials & Methods
Table 1- Shows fenoterol & derivatives
with the binding affinities [18].
2.1- Docking Methodology
The first step involved taking fenoterol and its derivatives with their stereoisomers (presented
in Table 1), and preparing them for docking procedure. This preparation was done using
HyperChem 6.03 (HyperCube Inc., Gainesville, FL) which contains a Model Build procedure, also
included is an electron optimization which uses the AM1 quantum method to properly give the
ligand’s electrons quantum effects. The next step involved was manually adding the ligand’s
positive charge, which was done in Molegro Virtual Docker software (MVD v. 2010.4.0.0) [21].
Following the optimization of the ligands, they were docked into the binding pocket of the two
high resolution X-ray crystal structures of B2-AR [19, 20] (PDB IDs: 2RH1 and 3P0G). The
optimization of these receptors is discussed in the modeling B2 adrenergic receptors section
(2.1.1). It is key to note that optimization of the receptors included removal of co-crystalized
ligands and other non-essential molecules. After receptor optimization, the ligands were placed
into a sphere with a radius 11 Å, covering the area of the ligands originally co-crystallized with
B2-AR ((S)-carazolol and BI-167107). Next, the MolDock SE search algorithm was implored with
the number of searching runs set to 100. Apart of the search was the following parameters:
population size = 50, maximum iteration = 1500, energy threshold = 100.00, max steps = 300,
the maximum number of poses to generate which is normally 5 was increased to 10. The results
of the docking study were described by the MVD implemented scoring function [22] (MolDock
Score). The lower the MolDock score, the greater the free energy of binding. Critical to any
computational technique validation was completed by running docking simulations of the
molecules originally co-crystallized with their respective protein model. ((S)-carazolol was

docked to PDB ID: 2RH1/Inactive B2-AR, & BI-167107 was docked to PDB ID: 3P0G/Active B2-
AR).
2.1- Molecular Dynamics
2.1.1- Modeling the B2-AR
First, it is key to note that modeling was based off the two selected crystal structure of the B2-
AR [19, 20], which include an inactive crystal structure of human B2-AR-T4 lysozyme fusion
protein co-crystalized with inverse agonist (S)-carazolol and an active crystal structure of a
nanobody-stabilized active state of the β2-AR co-crystallized with the agonist BI-167107 . Next,
we had to use an the ab initio approach to predict the conformations of N-/C- termini and the
second intracellular loop connecting TM V and TM VI, which were not seen in the crystal
structures. To predict the missing amino acid residues of the crystal structures, a human B2-AR
amino acid sequence was obtained from the Swiss-Prot database (code P07550). The modeling
of the N- and C-terminal domains of the receptor (which include residues Met1 to Glu30 and
Cys341 to Leu413 respectively) was completed using an I-TASSER server [22]. The other
predicted component of the B2-AR, was the second intercellular loop of the receptor (which
included residues Leu230 to Leu266), which was estimated using a CABS program [23]. It’s
important to note that the rest of the crystal structure was considered ready for computational
analysis. The next step involved bringing together the predicted components with the accepted
crystal structure through a simulated annealing routine implemented in GROMACS (v. 3.3) [24].
While still in the GROMACS (v. 3.3) program package the PDB2GMX procedure was used to
apply the proper atomics charges for all receptor protein atoms. It was found that the total

charge of the receptor proteins were +2. Lastly the charges were assigned to be in agreement
with a modified GROMOS96 force field [25].
2.1.2- Stimulating the Receptor Models in Membrane
Initially, applying Inflategro procedure [26] the two B2-AR models were inserted into an
equilibrated palmitoyl-oleoyl-phosphatidylcholine (POPC) cell membrane. Next, the addition of
solvated water molecules and ions to the POPC lipid bilayer took place. The two separate
systems consisted of the B2-AR protein (either active or inactive), 125 POPC lipid molecules (due
to computational strength), 16271 water molecules (including 16 water molecules seen in the
B2-AR crystal structures) and two sodium ions. To constrain energy, we applied 2000 steps of
steepest decent algorithm followed by 2000 steps of l-bfgs algorithm. Following that, a four
step molecular dynamics (MD) simulation was executed. At the first step, each system was
simulated for 100 picoseconds with no pressure coupling and constraints to all the protein
atoms to maintain initial positions with the help of a “freeze” option. The next step included a
MD simulation lasting 1 nanosecond with the Berendsen method [27] for pressure coupling and
similar position restraints imposed on all backbone atoms of the receptor model. The third step
of MD simulations lasted 2 nanoseconds, and involved the removal of position restraints from
the loops connecting the seven trans-membrane helices and the N- and C-terminal domains of
the B2-AR model. The 4th and final step included a 40 nanoseconds run with no restraints. The
force field, which is the main calculator of atomic potential energy was a modified GROMOS96
force field (ffG53a6 parameters set) [25] with extra parameters for POPC molecules taken from
Kukol [28]. For the water molecules the SPC water model [29] was used and for treatment of
the long-range electrostatic interactions the PME method [30] was applied. Every bond

involving a hydrogen atom was constrained with the LINCS algorithm [31]. In terms of
temperature the MD was performed at 310 K, and the pressure was at 1013 hPa. Lastly, the
calculations and data analysis were completed by using a GROMACS (v. 3.3) program.
2.1.3- Modeling the Receptor-Ligand Complexes
Initially, we used a PRODRG server [32] to obtain the force field parameters for the MD
simulation and the ligand structures for (R,R’)- and (S,S’)-fenoterol. Next came the geometry
optimization for two ligands (in their protonated-nitrogen forms), which was completed using
Hartree–Fock procedure employing the 6–31G* basis set in Gaussian (v.03 rev. C.02, Gaussian
Inc.) [33]. Also, we obtained the partial charges for the two molecules using the R.E.D.III
procedure [34]. Next, we analyzed our docking data for the lowest-energy structures obtained
during the docking simulations. After that analysis, ligands were inserted into the lowest-energy
structure of the inactive B2-AR model and the active B2-AR model. All receptor-ligand complexes
had similar starting structures during the restrained MD simulation lasting 200 picoseconds. In
that case, the protein backbone atoms were constrained to its initial positions using the
“freeze” option and weak harmonic distance restraints were applied (force constant of 1000 kJ
mol-1 nm-1 and the distance parameters: r0 = 0.0 nm, r1 = 0.3 nm and r2 = 0.5 nm) on three
receptor-ligand atom pairs (Pair 1: An oxygen atom of hydroxyl group of Ser203 and the oxygen
atom of the first meta-OH group of 3,5-dihydroxyphenyl moiety; Pair 2: The oxygen atom of the
hydroxyl group in Ser207 and the oxygen atom of the second meta-OH group of 3,5-
dihydroxyphenyl moiety; Pair 3: The Cγ atom of Asp113 and the protonated nitrogen atom of
the ligand). This was done in order to conserve similar starting position for the two ligands
inside the binding cavity. Next, a two step MD simulation of the receptor-ligand complexes was

performed. The first step lasted 2 nanoseconds, had weak harmonic position restraints imposed
on backbone atoms of trans-membrane helices of the receptor only and ligand-receptor
restraints were released. The second step lasted 5 nanoseconds with no restraints. The two
step MD simulation was repeated 44 times applying random starting velocities for every atom,
11 times for the inactive B2-AR-(S,S’)-fenoterol complex, 11 times for the inactive B2-AR-(R,R’)-
fenoterol complex, 11 times for the active B2-AR-(S,S’)-fenoterol complex and 11 times for the
active B2-AR-(R,R’)-fenoterol complex, respectively. The stimulation parameters were a replica
to that of the MD simulations of the B2-AR models (Section 2.2.2).
3. Results
3.1- pKi vs Docking Scores- Insights into the Native form of the B2-AR
The docking method’s MolDock scoring helped to show us the free energy of binding in both
the active and inactive state of the receptor (table 2). While, the pKi gave us a look into the
binding affinity from previous work with the native B2-AR. By plotting the two (MolDock & pKi)
we will get insights into how the active and inactive states of the B2-AR compare with the native
state of the receptor.
Looking at figure eight, we obtain two major pieces of information. The first major piece of
information can be seen on the left graph, which looks at the correlation coefficient (R2)
between the Moldock scores and pKi. With a correlation coefficient of 0.6251, there seems to
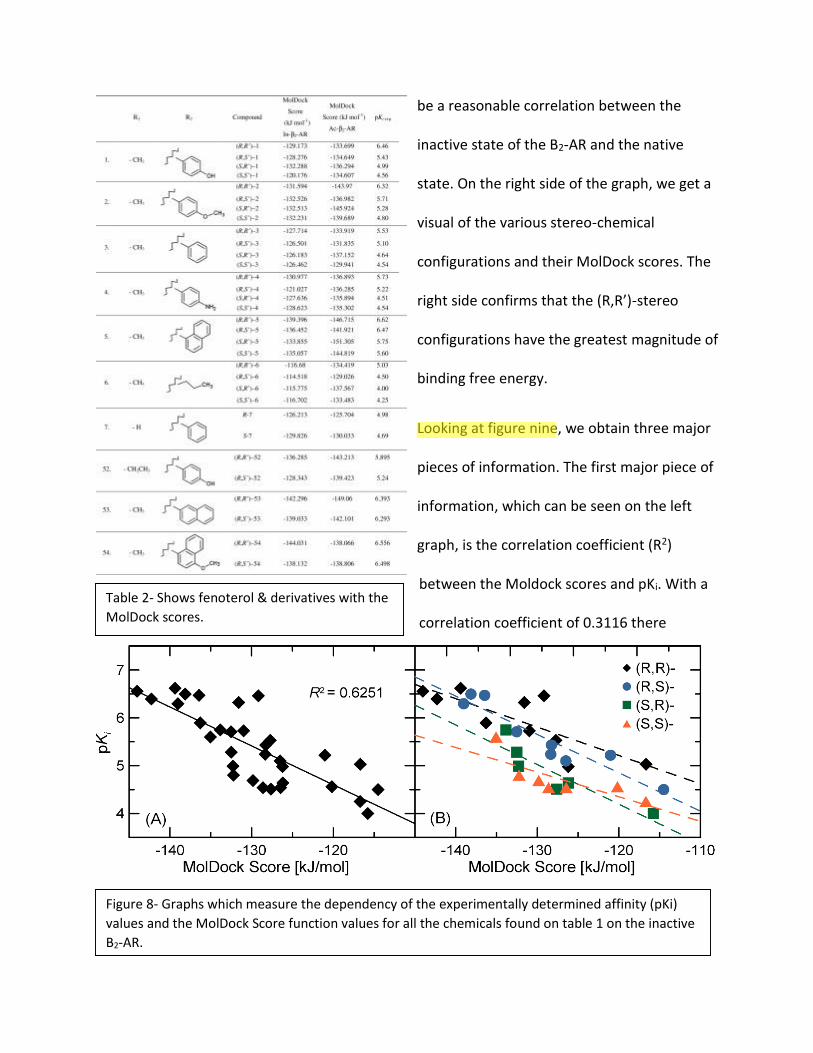
be a reasonable correlation between the
inactive state of the B2-AR and the native
state. On the right side of the graph, we get a
visual of the various stereo-chemical
configurations and their MolDock scores. The
right side confirms that the (R,R’)-stereo
configurations have the greatest magnitude of
binding free energy.
Looking at figure nine, we obtain three major
pieces of information. The first major piece of
information, which can be seen on the left
graph, is the correlation coefficient (R2)
between the Moldock scores and pKi. With a
correlation coefficient of 0.3116 there
Table 2- Shows fenoterol & derivatives with the
MolDock scores.
Figure 8- Graphs which measure the dependency of the experimentally determined affinity (pKi)
values and the MolDock Score function values for all the chemicals found on table 1 on the inactive
B2-AR.
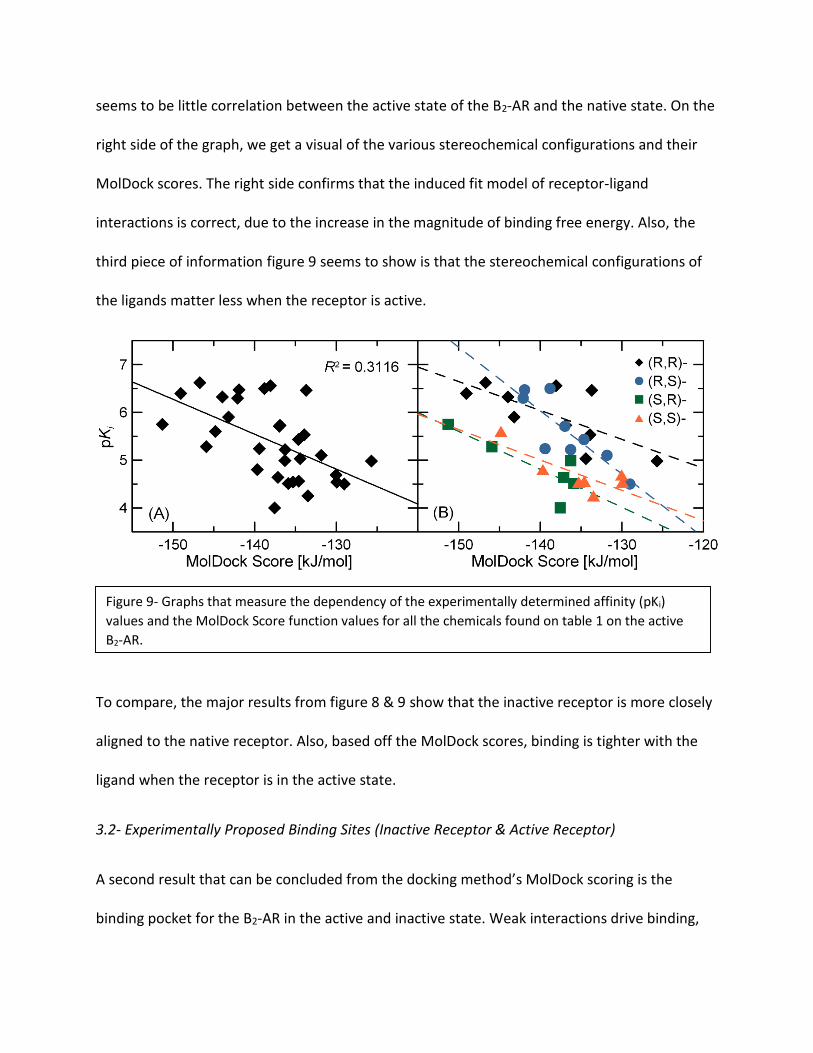
seems to be little correlation between the active state of the B2-AR and the native state. On the
right side of the graph, we get a visual of the various stereochemical configurations and their
MolDock scores. The right side confirms that the induced fit model of receptor-ligand
interactions is correct, due to the increase in the magnitude of binding free energy. Also, the
third piece of information figure 9 seems to show is that the stereochemical configurations of
the ligands matter less when the receptor is active.
To compare, the major results from figure 8 & 9 show that the inactive receptor is more closely
aligned to the native receptor. Also, based off the MolDock scores, binding is tighter with the
ligand when the receptor is in the active state.
3.2- Experimentally Proposed Binding Sites (Inactive Receptor & Active Receptor)
A second result that can be concluded from the docking method’s MolDock scoring is the
binding pocket for the B2-AR in the active and inactive state. Weak interactions drive binding,
Figure 9- Graphs that measure the dependency of the experimentally determined affinity (pKi)
values and the MolDock Score function values for all the chemicals found on table 1 on the active
B2-AR.

by knowing the key weak interactions, we can design a more selective drug for the B2-AR. The
binding pocket study focused on the conserved residues.
Looking at figure ten alone, we obtain no major pieces of information, but when combined with
figure 11 and figure 12, we obtain major clinically significant results. In the case of both B2-AR
models (figures 10,11), the 3,5-dihydroxyphenyl and amine moieties of the docked ligands lie in
the orthosteric site, which is located between TM III, TM V, TM VI and TM VII. The orthosteric
Figure 10- Computed binding site and scheme for the possible interactions in the (R,R’)-fenoterol
and inactive B2-AR complex. Red lines denote hydrogen bonds and green lines denote hydrophobic
interactions ( Π-Π interactions).

site is simply, the location where epinephrine and norepinephrine would bind in an non-
modulated form of the receptor. Interestingly, the largest homology between the two proposed
binding sites exists in the orthosteric pocket. One key homologous weak interaction in ligand
binding is the hydrogen bonding that occurs with the 3,5-dihydroxyphenyl moiety, in both cases
with the B2-AR, the hydrogen bonding takes place with residues found on TM domain V. The
conserved interactions include Ser203 & Ser207 H-bonding, but in the case of the inactive
receptor Thr118 can play a role in the H-bonding. Another significant weak interaction involves
Figure 11- Computed binding site and scheme for the possible interactions in the (R,R’)-fenoterol
and active B2-AR complex. Red lines denote hydrogen bonds and green lines denote hydrophobic
interactions ( Π-Π interactions).

the protonated nitrogen found on all of the ligands, forming a salt bridge with Asp113 in both
the active and inactive state of the B2-AR. That very same Asp113 also plays a role in stereo-
specificity, by only hydrogen binding with the β-OH moiety when the ligands have an (R,*)
confirmation. The major key difference with the proposed orthosteric site between the active
and inactive B2-AR, exists with Asn312 side chain’s ability to form dual hydrogen bonds with
both the β-OH and the protonated amine moiety found on all ligands. The additional dual
hydrogen bonding may account for some of the considerable difference in binding between the
active and inactive state of the B2-AR.
The extended orthosteric pocket includes interactions with the ligand molecule‘s methyl moiety
located on the α’ carbon atom of the compound (the second chiral center) and the ligand
molecule’s phenyl/naphthyl rings. In the case of both the active and inactive state of the B2-AR
model, the ligand molecule’s 4'-hydroxy-/4'-methoxy-/4'-amino-phenyl and methoxynaphthyl /
naphthyl moieties of fenoterol derivatives can potentially assume four possible hydrogen-
bonding interactions (Fig. 9 & 10), which can be with Cys191 or Asp192 (from ECL2) (IIA site) or
Thr110 (TM III) (IIB site) or Tyr308 (TM VII) (IIC site). One key difference in the hydrogen binding
between the active and inactive state is the presence of a Lys305 in the active state of the
receptor which forms stronger hydrogen bonding with the 4'-hydroxy-/4'-methoxy-/4'-amino-
phenyl and methoxynaphthyl / naphthyl moieties of the fenoterol derivatives. Lastly, all ligands
with an aromatic group in the orthosteric extended pocket also enjoy pi-pi interactions with
either Tyr308 (TM VII) or Phe193 residue (ECL2).
3.3- Confirmation of a Similar Binding Pocket for the B2-AR

While the experiment’s primary focus was on fenoterol and its derivatives, we were also able to
identify the position of binding with respect to the originally co-crystallized ligands. Using the
docking study’s greatest magnitude of binding energy, we superimposed images from the co-
crystalized ligand on top of an image of (R,R’)-fenoterol (Fig. 12). The significance of this finding
is that the binding pocket for the B2-AR is conserved for a diverse group of ligands. Figure 13
clearly shows the major structural differences between (R,R’)-fenoterol, (S)-carazolol, and BI-
167107. This finding has significant ramifications for drug design in combating congestive heart
failure.
Figure 12- These images superimpose the positions of the original ligands co-crystallized with β2-AR
(in gray), (S)-carazolol (PDB ID: 2RH1) (a) and BI-167107 (PDB ID: 3P0G) (b) with (R,R’)- fenoterol
docked to the inactive B2-AR (a) and the active B2-AR model (b). (R,R’)- Fenoterol takes a similar
position to that of (S)-carazolol and BI-167107 present in the crystal structures of B2-AR. The
positions of (R,R’)-fenoterol, is the lowest scoring function values for (R,R’)-fenoterol.
Figure 13- Structural diversity of ligands is seen in this figure. On the left, the structure of fenoterol,
in the middle the structure of (S)-carazolol, and on the right it’s the structure of BI-167107.

3.4- Confirmation of Stereo-chemical Preference (Docking)
One of the primary reasons we are investigating the B2-AR is the interesting experimental
affinities of previous work which claims that stereochemistry plays a crucial role in the
interactions with the receptor [18]. When combining Fig. 12’s (R,R’) binding with Fig. 14’s (S,S’)
binding, we can clearly see that when comparing the docking of (S,S’)-fenoterol to the inactive
B2-AR model to the docking of (R,R’)-fenoterol, there is little difference. In fact, the only
difference lies in the reorientation of moieties associated with the two chiral centers, which are
the β-OH and –CH3 groups. These orientations are in the opposite directions. As a result, the β-
OH moiety of (S,S’)-fenoterol does not hydrogen bond with Asp113 in the inactive B2-AR and
the methyl moiety does not exhibit favorable orientation towards the hydrophobic surface of
the binding site formed by TM III (Trp109) and ECL2 (Phe193). These inverted positions cause a
difference in 9.0 kJ/mol between the (R,R’) and (S,S’) states.
Interestingly, the docking of (S,S’)-fenoterol to the active B2-AR reveals more significant
differences when compared to the docking of (R,R’)-fenoterol to the active B2-AR. First, the 3,5-
Figure 14- Shows a direct comparison between the structural models of (S,S’)-fenoterol binding to
the inactive B2-AR (a) and the (S,S’)-fenoterol binding to the active B2-AR (b). Note the position of
K305 in the inactive and active receptor (S,S’)-fenoterol binding.

dihydroxyphenol moiety of (S,S’)-fenoterol is significantly reoriented, so that only one meta-OH
moiety is able to form a hydrogen bond with Ser203, versus the (R,R’)-fenoterol which has both
meta-OH groups interacting with Ser207 and Ser203, respectively. Moreover, the β-OH moiety
of (S,S’)-fenoterol doesn’t form hydrogen bonds with Asp113 in the active state B2-AR, while
the (R,R’)-fenoterol’s β-OH does form hydrogen bonds with Asp113. Strangely enough, these
significant differences between docked (R,R’)-fenoterol to the active B2-AR and (S,S’)-fenoterol
docked to the active B2-AR, aren’t noticeably in the MolDock Score values, which are equal to -
133.5 and -134.6 kJ/mol, respectively (Table 2). The inactive B2-AR crystal structure better
predicts the stereoselective binding effects, when compared to the active B2-AR crystal
structure.
3.5- Influence of the R1 & R2 substituents on Binding
To study the influence of R1 and R2 substituents we selected two fenoterol derivatives, which
are (R,R’)-52 and (R,R’)-54 (Table 2). For each, we compared the binding modes with the
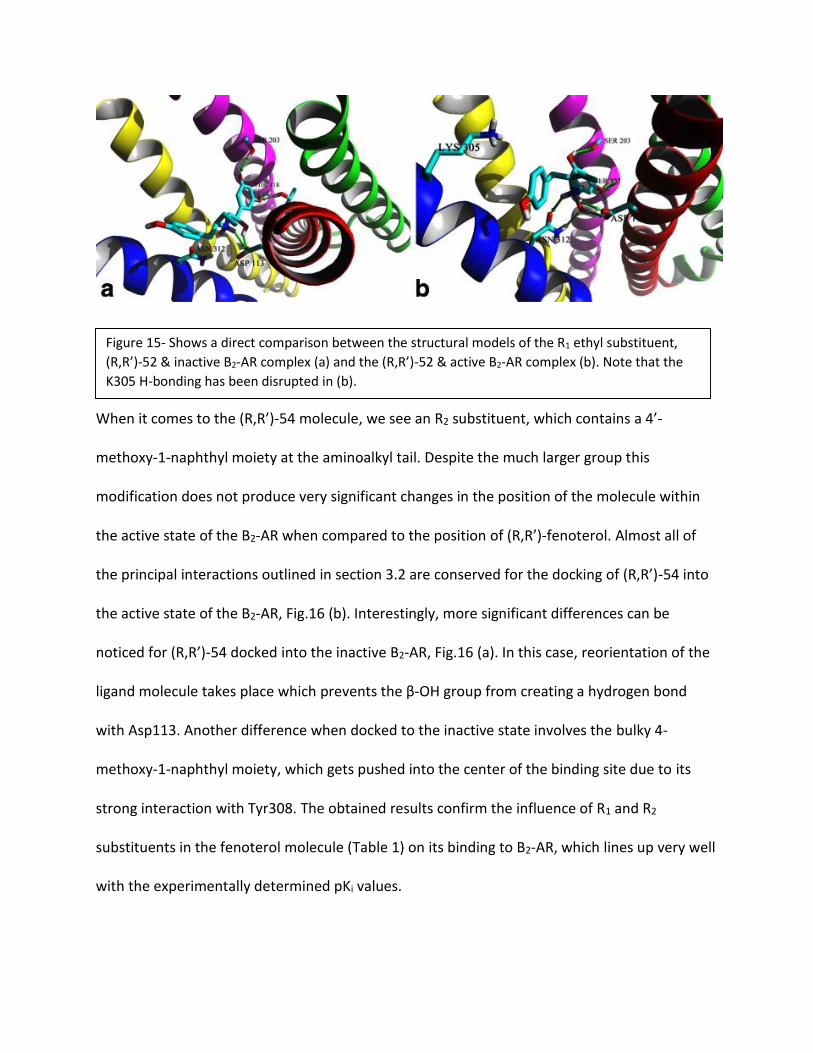
inactive and active form of the receptor (Fig. 15, 16 (a, b)). First, on the (R,R’)-52 we had an R1
substituent that replaced fenoterol’s methyl moiety for an ethyl group attached to the second
chiral center. The effects of this change, include a reorientation of the 4'-hydroxyphenyl moiety
when bound to the active state of the B2-AR and compared to (R,R’)-fenoterol docked to the
active B2-AR. The reorientation of the 4'-hydroxyphenyl moiety, leads to a disruption in its
interaction with Lys305, therefore lowering the magnitude of the binding free energy. All other
significant interactions that are present in the (R,R’)-fenoterol’s docking to the active B2-AR is
parallel to the docked (R,R’)-52. When being docked to the inactive receptor, no significant
difference between (R,R’)-52 and (R,R’)-fenoterol is found.
When it comes to the (R,R’)-54 molecule, we see an R2 substituent, which contains a 4’-
methoxy-1-naphthyl moiety at the aminoalkyl tail. Despite the much larger group this
modification does not produce very significant changes in the position of the molecule within
the active state of the B2-AR when compared to the position of (R,R’)-fenoterol. Almost all of
the principal interactions outlined in section 3.2 are conserved for the docking of (R,R’)-54 into
the active state of the B2-AR, Fig.16 (b). Interestingly, more significant differences can be
noticed for (R,R’)-54 docked into the inactive B2-AR, Fig.16 (a). In this case, reorientation of the
ligand molecule takes place which prevents the β-OH group from creating a hydrogen bond
with Asp113. Another difference when docked to the inactive state involves the bulky 4-
methoxy-1-naphthyl moiety, which gets pushed into the center of the binding site due to its
strong interaction with Tyr308. The obtained results confirm the influence of R1 and R2
substituents in the fenoterol molecule (Table 1) on its binding to B2-AR, which lines up very well
with the experimentally determined pKi values.
Figure 15- Shows a direct comparison between the structural models of the R1 ethyl substituent,
(R,R’)-52 & inactive B2-AR complex (a) and the (R,R’)-52 & active B2-AR complex (b). Note that the
K305 H-bonding has been disrupted in (b).

3.6 - Confirmation of Stereo-chemical Preference (Molecular Dynamics)
Molecular dynamics was selected to give us more information about the stereo-chemical
preference of the two models for the B2-AR. To maintain project integrity, figure 17 was
included, which shows that both ligands were inserted in the middle of the receptor binding
site. During the 44 MD simulations with no restraints (11 MD simulations for each fenoterol
stereoisomer–receptor complex), we obtained differences in the conformational stability that
fenoterol stereoisomer had inside the receptor binding sites.
Figure 16- Shows a direct comparison between the structural models of the R2 methoxy -1 –
naphthyl substituent, (R,R’)-54 & inactive B2-AR complex (a) and the (R,R’)-54 & active B2-AR
complex (b). The K305 H bonding has been strengthened (b).
Figure 17- Shows the starting positions of (R,R’)-fenoterol (red), and (S,S’)-fenoterol (blue), inside the
inactive B2-AR (A) and active B2-AR (B).

A thorough investigation of the 44 MD simulations, displayed a higher conformational stability
for the (R,R’)-fenoterol when compared to the (S,S’)-fenoterol stereoisomer. Stability of the two
ligands was monitored in the form of RMSD autocorrelation function. In both, the case of the
active and inactive B2-AR, we observe that the averaged RMSF values are lower for (R,R’)-
fenoterol isomer. RMSF is simply the calculation of root mean square fluctuation (RMSF) for the
position ligand atoms.
The blue and green boxes
indicate specific
fragments of two
fenoterol isomers
showing the highest
difference in RMSD
fluctuation (Fig. 18).
Figure 18- The charts show the average movement (RMSF values) of ligand atoms during 5 ns of MD
simulation of ligand & inactive B2-AR (top) and ligand & active B2-AR (bottom). The (R,R’)-fenoterol
values are in red, and the (S,S’)-fenoterol values are in black. The green and blue rectangles
represent the greatest delta in RMSF values. Charts confirm that (R,R’) has is more stable when
interacting with both forms of the receptor.

4. Discussion
4.1- General Conclusions
Computational analysis of the B2-AR has left us with a far better understanding of the native
state, binding pocket, and stereochemical preference of this valuable GPCR. When it comes to
the native state, we were assisted by previous work [18], which primarily focused on the
binding affinities of Table 1’s various derivatives of fenoterol. By plotting those various binding
affinities against our docking scores (Fig.8 & 9) we are able to conclude that the native state of
the receptor more closely resembles the inactive state of the B2-AR. From the same data (Fig.8
& 9) we were also able to reaffirm from the delta in the docking scores between the active and
inactive state that ligand-receptor interactions are based off an induced fit model, not the more
traditionally accepted lock-key model.
Our most critical findings were the proposed binding pockets (Fig.10 & 11) for the active and
inactive B2-AR. First, we were pleased to discover that (S)-carazolol, BI-167107, fenoterol, and
its derivatives (table 1) took similar positions in the binding cavity of the B2-AR, especially in the
orthosteric site (Fig. 10/11/12/13). Since we were dealing with two states of the receptor, our
key interests lied in the conserved residues involved with binding in both states, which probably
play a huge role in the native B2-AR binding of any ligand. One similarity (Fig.10 & 11) include
the meta-OH groups of the tested compounds, which create hydrogen bonds with Ser203 found
on TM V. A second similarity involves a salt bridge interaction between the protonated amine
of the ligands and the Asp113 sidechain (TM III). These similarities could directly affect how the
next generation congestive heart failure and asthma medication will be designed.

Stereochemistry and its effects on the binding of ligands to the B2-AR, is quite possibly the
largest question we wanted to answer in this experiment. To better understand why certain
stereoisomers of fenoterol have differing binding affinities to the B2-AR we used docking
studies. Through those studies we were able to see several substantial patterns between ligand
R/S configurations and binding free energy. The molecular docking scores (table 2) are in
accordance with the experimental data and indicate that the most potent agonists are those
with (R,R’)-configuration. Docking studies also indicate that the hydroxyl group at the first chiral
center of ligand creates HB with Asp113 or/and Asn312 in the case of (R,R’)-stereoisomers
mainly. The stereochemistry was also studied in a molecular dynamics stimulation, which pitted
(R,R’)-fenoterol against (S,S’)- fenoterol. Molecular dynamics shows a stark difference between
fenoterol ‘s (R,R’) and (S,S’) stereoisomers, when it comes to the stability of the atoms that are
involved. Overall, molecular dynamics simulations reveal that the change in atomic space is
larger in the case of (S,S’)-fenoterol when compared to the of (R,R’)-fenoterol (Fig.16). The
largest differences between (R,R’)- and (S,S’)-fenoterol were observed in the region containing
the β-OH, (– NH2+ –), and 4’-OH functional groups, which interact the strongest with the
receptor (Fig. 18).
4.2- Future Studies
Despite all these computational analysis, we are still left with very real questions. One of these
questions is just how selective fenoterol and its derivatives are for the B2-AR. It is key to note
that the B1-AR promotes congestive heart failure [8], thus agonizing the B1-AR, would be
counterproductive to the B2-AR cardioprotective role. To test this question one will have to look
to the PDB and find models for the B1-AR, such as PDB ID: 3ZPQ. Once obtained that receptor

will be modified to remove any non-receptor co-crystalized molecules, then docking studies
similar to the ones included in this experiment will be run with fenoterol and its derivatives.
Running this experiment will give us an idea of the selectivity of these ligands for the B2-AR.
A second question, can we design an agonist with a higher binding affinity to the B2-AR with the
results from these computational studies? I believe we can, first by looking at making a
derivative of fenoterol. It is clear from the results (table 2) of the docking studies that any R1
substituent change will lead to lower free energy of binding, thus I would leave a methyl on the
R1 component of the derivative. On the R2 side of things, I would replace the phenol with a
hydroxylated- napthyl moiety. I believe that the OH side chain will bind more tightly to the
receptor then the methoxy found on compound 54. Then docking studies similar to the ones
included in this experiment will be run with the newly synthesized fenoterol derivative and the
B2-AR.
A last question, can we apply these computational techniques to get further understanding of
other clinically significant GPCR. The one limitation would be the number of non-crystalized
GPCR’s would not be studied. Taking PDB models for critical GPCRs, such as the muscarinic
receptor (PDB ID: 4MQS). Next, we would model agonist such as iperoxo using HyperChem.
Lastly, we would run a docking study using the PDB GPCR and agonist, to obtain a model of the
binding pocket for the GPCR, which will lead to improved drug design.
5. References
[1]- Pierce et al. Nature Reviews Molecular Cell Biology 3, 639-650 (2002).
[2]- Gentles et al. Trends in Genetics 15, 47-49 (1999).
[3]- Venter et al. Science 291, 1304–1351 (2001).
[4]- De Rooij et al. Nature 396, 474-477 (1998).
[5]- Paulin et al. Current Biology 11, 55-59 (2001).
[6]- Field et al. Molecular and Cellular Biology 8 2159-2165 (1988).
[7]- Liu et al. Journal of Biological Chemistry 269, 13880-13886 (1994).
[8]- Woo AY et al. Acta Pharmacol Sin. 33, 335–341 (2012).
[9]- Triposkiadis et al. Journal of the American College of Cardiology 54, 1747-1762 (2009).
[10]- Kotlikoff et al. Annual review of physiology 58, 115-141 (1996).
[11]- Molenaar et al. Circulation 102, 1814-1821 (2000).
[12]- Nara et al. Journal of Biological Chemistry 273, 14920-14924 (1998).
[13]- Kamp et al. Circulation research 87, 1095-1102 (2000).
[14]- Markby, David et al. Science 262, 1895-1901 (1993).
[15]- Baillie, George et al. Proceedings of the National Academy of Sciences 100, 940-945
(2003).
[16]- Heidenreich PA, et al. Circulation 123, 933–44 (2011).
[17]- Wermuth et al. CG Drug Discovery Today 11, 160-4 (2006).
[18]- Jozwiak K et al. J Med Chem. 50, 2903-15 (2007).
[19]- Cherezov V et al. Science 318, 1258-65 (2007).
[20]- Rasmussen et al. Nature 469, 175-80 (2011).
[21]- Thomsen R et al. J Med Chem. 49, 3315-21 (2006).
[22]- Roy A et al. Nat Protoc. 5, 725-38 (2010).
[23]- Kolinski A et al. Acta Biochim Pol. 51, 349-71 (2004).
[24]- Van Der Spoel D et al. J Comput Chem. 26, 1701-18 (2005).
[25]- Oostenbrink C et al. J Comput Chem. 25, 1656-76 (2004).
[26]- Kandt C et al. Methods. 41, 475-88 (2007).
[27]- Berendsen HJC et al. J Chem Phys. 81, 3684 (1984).
[28]- Kukol A et al. J Chem Theory Comput. 5, 615–626 (2009).
[29]- Van Der Spoel D et al. J Chem Phys. 108, 10220–10230 (1998).
[30]- Darden T et al. J Chem Phys. 98, 10089–10092 (1993).
[31]- Hess B et al. J Comput Chem. 18, 1463–1472 (1997).
[32]- Schüttelkopf AW et al. Acta Crystallogr D Biol Crystallogr. 60, 1355-63 (2004).
[33]- Frisch MJ et al. Wallingford: Gaussian Inc. (2004).

[34]- Bayly CI et al. J Phys Chem. 97,10269–10280 (1993).