computational materials science · pdf filetion and non-newtonian to newtonian viscosity. a...
TRANSCRIPT

Computational Materials Science 69 (2013) 494–504
Contents lists available at SciVerse ScienceDirect
Computational Materials Science
journal homepage: www.elsevier .com/locate /commatsci
Computational modeling of plastic deformation and shear bandingin bulk metallic glasses
0927-0256/$ - see front matter � 2012 Elsevier B.V. All rights reserved.http://dx.doi.org/10.1016/j.commatsci.2012.12.014
⇑ Corresponding author. Tel.: +1 410 516 7833; fax: +1 410 516 7473.E-mail address: [email protected] (S. Ghosh).
Jiahao Cheng a, Somnath Ghosh b,⇑a Department of Civil Engineering, Johns Hopkins University, United Statesb Departments of Civil and Mechanical Engineering, Johns Hopkins University, Baltimore, MD 21218, United States
a r t i c l e i n f o a b s t r a c t
Article history:Received 10 September 2012Received in revised form 19 November 2012Accepted 6 December 2012Available online 20 January 2013
Keywords:Bulk metallic glassesViscosityFree volumeShear bandPlastic deformationABAQUS
The study of plastic deformation of bulk metallic glasses (BMGs) reveals two modes. At low temperaturesand high stresses plastic deformation is inhomogeneous, in which case the failure of BMGs is mostly dueto the formation of a very thin shear band. Inside this band, the evolving strain is highly localized. At hightemperatures and low stresses, plastic deformation is homogeneous and the BMGs exhibit a Newtonianviscosity. It is generally acknowledged that the shear-induced free volume evolution plays an importantrole in the failure of BMGs under both modes of deformation. In this paper, a free volume-based consti-tutive model is proposed, which accounts for the transition of inhomogeneous to homogeneous deforma-tion and non-Newtonian to Newtonian viscosity. A time integration algorithm is presented in this paperwith a description of its implementation in the commercial code ABAQUS through the user-defined mate-rial window UMAT. 2 and 3-Dimensional finite element simulations are performed and the model is val-idated with results of uniaxial compression and micro-indentation experiments for a wide range oftemperatures and strain rates. The simulation results exhibit hydrostatic pressure dependence, and sug-gest that a mixed-power-strain-rate-dependent free volume creation mode is more effective than thecommonly used strain-rate-dependent free volume creation law, when considering large temperatureranges.
� 2012 Elsevier B.V. All rights reserved.
1. Introduction
Metallic glasses are amorphous alloys with superior mechanicalproperties. They possess disordered microstructures due to rapidquenching of the liquid alloy from a molten state that prevent crys-tallization. Because of their amorphous structure and lack of long-range ordering, crystal defects such as dislocations and grainboundaries that commonly exist in metallic structures do not occurin metallic glass. This results in their superior mechanical proper-ties such as high yield stress, high strength-to-density ratio, corro-sion resistance and high wear resistance. Predominantlyresearched metallic glasses in the recent years include alloys suchas Zr–Ti-based ‘Vitreloy’ and Pb-based materials. These differ fromthe early classes of Au–Si-based metallic glasses, whose productionrequired a high cooling rate of �105–106 K/s and yielded thick-nesses in the micron scale. This new class of ‘bulk’ metallic glassesor BMG’s has a high glass forming ability at a low critical coolingrate �1� K/s that enables larger thicknesses in the centimeter scale.This progress has enabled the application of BMG in sportinggoods, biomedical equipment structural and MEMS materials.
It is now possible to conduct large-scale experiments such astension, compression and bending tests at temperatures rangingfrom room temperature to supercooled temperatures, which werepreviously impossible due to premature crystallization. Experi-ments on Vitreloy-1 (the first commercially used BMG) exhibiteda transition from Newtonian flow at supercooled temperatures tonon-Newtonian flow at room temperatures, as well as transitionfrom homogeneous flow to inhomogeneous localized flow as thestrain rate is increased in the vicinity of the glass transition tem-perature (Tg = 625 K) [1]. At both temperature regimes, cata-strophic failure is observed due to the formation of shear bands,inside which the strain and strain rate highly localized. Develop-ment of effective 3D constitutive models for implementation in fi-nite deformation, computer simulation codes is necessary inunderstanding the shear band formation in bulk metallic glasses.
Considerable efforts have gone into the deformation modelingof BMG. Early work on the atomic and microstructural scales ofBMG, e.g. in [2,3] focused on flow defect models, viz. the evolu-tion of free volume, which is considered as the primary mecha-nism of deformation localization in amorphous structure.However most of these models were one-dimensional, whichwere not capable of capturing three-dimensional stress and strainstates leading to localization and shear banding. A 3D phenome-nological finite deformation constitutive model with von-Mises

J. Cheng, S. Ghosh / Computational Materials Science 69 (2013) 494–504 495
yield criterion and free volume dependent visco-plasticity wasdeveloped in [4]. While other studies, e.g. in [5,6] have producedsimilar models, the model in [4] has the advantage of capturingdeformation features over a wide range of temperatures fromroom temperature to super-liquid region and reproduces experi-mentally observed stress–strain responses for many differentstrain-rates. However, the lack of a clear free volume evolutionlaw in [4] impedes its accuracy near the glass transition temper-ature for certain strain rates. Furthermore, indentation experi-ments at different scales have shown that the von-Mises criteriais inappropriate in describing the deformation of BMG. AFMimages of pyramidal nano-indented surfaces have been comparedwith simulated values using the Mohr–Coulomb stress criterionin [7], which showed good agreement of the nano-indentationbehavior of Vitreloy-1. Spherical micro-indentation tests of Vitre-loy-1 have suggested good agreement with values for the Mohr–Coulomb friction parameter are in the range from 0.08 to 0.14 [8].These agreements are further consolidated in studies of the frac-ture mechanics, highlighting the effects of hydrostatic pressure inpredicting the orientation of fracture surface [9]. Recent studies in[10] suggest that under low stress conditions corresponding tohomogeneous deformation, the disordering process of free vol-ume tends to follow a power-law stress-strain-rate behavior. Thisdisordering process in homogeneous deformation modes is foundto be strongly correlated to the drop in stress carrying capacityunder different strain-rates. Homogeneous deformation modesenables determination of the functional dependencies on stress,strain and strain rate.
The present study extends the above constitutive models forpredicting deformation induced shear-band localization in bulkmetallic glasses. The constitutive framework incorporates finitedeformation kinematics, the Mohr–Coulomb yield criteria andthe kinetic law governing the evolution of density and free volumeunder different strain rates. The power law disordering model forfree volumes is extended to a moderately high stress region.Numerical algorithms are developed for implementation of thismodel into the commercial software ABAQUS through a user-defined material subroutine UMAT. The model is validated withresults of uniaxial compression and micro-indentation tests for arange of temperatures and strain-rates.
2. Constitutive model for BMG
A finite deformation, elastic-viscoplasticity model is developedin this section for accommodating large deformation within shearbands. The formulation follows the multiplicative decomposition,logarithmic strain measures and exponential mapping proposedin [11,12], which has been proved to be efficient and accuratefor large strain elasto-plasticity without loss of generality. Theinelastic part of the deformation is described using the Mohr–Coulomb yield criteria with a thermodynamically-based associ-ated flow rule and free-volume dependent isotropic hardening/softening law.
2.1. Kinematic relations and increments
The kinematic model assumes a multiplicative decompositionof the deformation gradient into elastic and plastic parts, withthe establishment of an intermediate configuration as:
F ¼ FeFp; detFe > 0 ð1Þ
where the Fe and Fp are the elastic and plastic components of thedeformation gradient tensor respectively. The plastic velocity gradi-ent pull-back to intermediate configuration is expressed as:
Lp ¼ _FpFp�1 ð2Þ
The symmetric part of Lp is the plastic deformation rate tensorDp, while the skew part Wp = asym(Lp) describes the plastic spin inthe intermediate configuration.
In the present BMG constitutive model, plastic deformation isassumed to be dominated by free volume that causes volumetricchange without any plastic spin. Vanishing plastic spin is consid-ered in this model according to [4,5], and consequently:
Lpw symðLpÞ ¼ Dp ð3Þ
Integrating Eq. (2) from time t to t + Dt by the backward Euleralgorithm and substituting Eq. (3), yields an exponential updateof plastic deformation gradient tensor [12] as:
tþDt0 F
p ¼ expðDttþDtDpÞt0Fp ð4Þ
The superscripts t to t + Dt corresponds to the current configu-ration, while the subscript 0 corresponds to the reference configu-ration. Additionally, the logarithmic elastic strain tensor is definedas (see [12]):
Ee ¼ 12
lnðFeT FeÞ ð5Þ
This has the advantage of effectively reducing the finite strainupdate to the infinitesimal strain update, expressed as:
tþDt0 F
e ¼ tþDt0 Ft
0Fp�1 expð�DttþDtDpÞ ¼ tþDtt F
e� expð�DttþDtDpÞ
where
tþDtt F
e� ,
tþDt0 Ft
0Fp�1 ð6Þ
If Ee� ¼ 1
2 ln tþDtt FeT
�tþDtt Fe
�
� �represents a trial elastic logarithmic
strain tensor, the logarithmic elastic strain at time t + Dt may be
expressed as:
tþDt0 E
ew Ee
� � DttþDtDp ð7Þ
2.2. Hyperelastic stored energy function and stress–strain relation
For an isotropic BMG response, a hyperelastic stored energyfunction is defined in terms of the logarithmic elastic strain tensoras:
we ¼ lkEe;devk2 þ k2
trðEeÞ � atðT � T0Þ� �2 ð8Þ
where l and k are the shear and bulk modulus respectively, tr(Ee) isa measure of volume change produced by the hydrostatic stress,and Ee;dev ¼ Ee � 1
3 trðEeÞI is the deviatoric part of elastic logarithmicstrain. at(T � T0) is the volumetric strain due to change in tempera-ture T, where at is the coefficient of thermal expansion and T0 is theinitial temperature.
The free energy is defined as the sum of the hyperelastic storedenergy and the thermal energy as:
w ¼ weðEe; TÞ þ wTðTÞ ð9Þ
where the thermal energy is:
wT ¼ q0Cv ðT � T0Þ � T logTT0
� �ð10Þ
In this expression, q0 is the mass density per unit volume in ref-erence configuration and Cv is the mass specific heat at the con-stant volume.
The stress–strain relation for BMG materials has been expressedin terms of the Mandel stress tensor N [4]. The symmetric part ofthis stress tensor is related to the second Piola–Kirchhoff stresstensor S and Kirchhoff stress tensor s as (see [12]):

496 J. Cheng, S. Ghosh / Computational Materials Science 69 (2013) 494–504
Nsym ¼12ðCeSþ SCeÞ ¼ UeSUe ¼ ReTsRe ¼ �s ð11Þ
Ue = UTe is the elastic right stretch tensor of the elastic deformationgradient, obtained by polar decomposition of Fe = ReUe, where Re isthe orthogonal rotation tensor. For isotropic elasticity, the rightCauchy-Green tensor Ce has the same eigenvector as the second Pio-la–Kirchhoff stress tensor S and thus they can commute as in thesecond term of Eq. (11). �s corresponds to a rotated Kirchhoff stresstensor in an intermediate rotated configuration that can be derivedfrom the hyperelastic stored energy [12,13] as:
�s ¼ @w
@Ee ð12Þ
Inserting Eqs. (8) and (12) in Eq. (11) yields the explicit form ofMandel stress as:
Nsym ¼@w
@Ce ¼ 2lEe;dev þ k ½trðEeÞ � atðT � T0Þ� I ð13Þ
This stress is used as the thermodynamic stress measure in thesubsequent constitutive model.
2.3. Yield surface and associated flow rule
Thermodynamic conditions of extremum dissipation in terms ofthe generalized yield function f(Nsym,b,rf), yields the flow rule andother evolutionary plasticity relations for internal variables as [12]:
Dp ¼ _k@f
@Nsymð14Þ
_n ¼ � _k@f@b
ð15Þ
_f ¼ � _k@f@rf
ð16Þ
In these equations, the yield function f = f(Nsym,b,rf) is assumedto be a function of the stress tensor N, a back-stress tensor b and ascalar flow stress. _n is a tensor internal variable resembling astrain-rate that is work-conjugate to b, and _f is a scalar internalvariable resembling strain that is work-conjugate to the flow stressrf. The consistency parameter _k appears in all the three relations(14)–(16). This can be briefly illustrated from the solution of themaximum plastic dissipation condition [12]:
_Dp ¼ b : _nþ rf_fþ Nsym : Dp P 0
with the yield function f as a constraint. By extremizing theLagrangian, in which _k is the Lagrange multiplier, given as:
LðNsym;b;rf Þ ¼ _Dp � _kf
the extreme condition yields Eqs. (14)–(16) with the consistencyparameter _k. The back-stress term is associated with kinematichardening that arises in cyclic loading and is not considered furtherin this work. Uniaxial compression and tension tests in [9] haveshown that hydrostatic component of stress has a significant effecton the yield function, representing plastic deformation in BMG. Thehydrostatic stress dependent yield function has a direct effect onthe orientation of shear band formation [14], that is also corroboratedthrough indentation experiments in [15]. The pressure-sensitive yieldfunction is constructed following the Mohr–Coulomb framework as:
f ¼ sþ a �p� rf ð17Þ
where s ¼ffiffiffiffiffiffiffiffiffiffiffiffiffiffiffiffiffiffiffiffiffiffiffiffiffiffiffiffiffiffiffiffiffiffiffiffiffiffiffiffiffiffiffiffiffiffiffiffiN�sym
� �dev: N�sym
� �devr
is proportional to the effective
Von-Mises stress, �p ¼ 13 trðNsymÞ is the hydrostatic pressure, a is a
pressure sensitivity parameter and rf is a rate-dependent, isotropichardening flow stress.
The plastic rate of deformation tensor Dp is expressed in termsof the flow direction tensor Nflow, which is derived from (17) as:
Dp ¼ _epNflow where Nflow ¼ @f@Nsym
¼ 13
aIþM ð18Þ
_ep is a plastic flow multiplier that may be equated to the consistencyparameter _k in Eq. (14). The tensor M is the direction correspondingto the effective shear stress [4,16], i.e.
M ¼ @s@Nsym
s:t: trðMÞ ¼ 0 and MT ¼M ð19Þ
Substituting Eq. (13) into Eq. (19) yields:
M ¼ Ee;dev
kEe;devkð20Þ
This is consistent with other BMG models, such as in [16]. Cor-respondingly, the plastic rate of deformation tensor is given as:
Dp ¼ _ep 13
aIþM
ð21Þ
Also from (16) and (17), the rate of the internal scalar variablemay be related as _f ¼ _k ¼ _ep. Hence _ep is the only internal variablein the model.
Eq. (18) shows that plastic incompressibility constraint does notapply to the BMG constitutive model. Plastic volumetric change iscaused by free volume change, which governs the plastic deforma-tion. The free volume of an atom is the nearest neighboring freespace, whose size (atomic hard-sphere) is greater than a criticalvolume m⁄. The average free-volume is defined as the free volumein the atomic configuration mf, in relation to the critical volumem⁄ per atom in a unit volume, i.e. the free volume concentrationis expressed as:
n ¼ mf
m�ð22Þ
In Section 2.5 it will be shown that the free-volume evolutionlaw has a form:
_n ¼ kþs _ep þ k� _ep ð23Þ
where n is the free-volume concentration. The first term on the righthand side is the shear induced free-volume nucleation, while thesecond term is the free-volume annihilation due to structure relax-ation. Since _ep ¼ _n
kþsþk�from Eq. (23), the dilatation part of the plas-
tic rate of deformation Dp in Eq. (21) can be expressed as:
13
a _epI ¼ 13
akþsþ k�
_nI ð24Þ
Eq. (24) shows the explicit connection between the plastic rateof dilatation and the free-volume evolution, which has also beenshown in the model of [5].
2.4. Flow stress
The flow stress rf, which exhibits strain hardening, thermalsoftening, as well as rate-dependence, is expressed as:
rf ¼ r0 þ g _ep ð25Þ
Here r0 is a threshold stress that determines the onset of inelas-tic deformation under different applied strain rates. The viscosityparameter g ¼ gðn; T; _eÞ is a function of free-volume, temperatureand strain rate. Its specific form may be derived from thermody-namic considerations. Based on the free-volume theory in [2], plas-tic deformation in metallic glasses occurs by the shear of localizedgroups of atoms, for which the flow equations under an externalshear stress s is:

J. Cheng, S. Ghosh / Computational Materials Science 69 (2013) 494–504 497
_c ¼ 2f 0 exp �an
kf sinh
sX2kBT
ð26Þ
where _c is the shear strain rate, f0 is frequency of atomic vibration,a(61) is a geometrical factor, kf is a temperature-dependent constant,X is the atomic volume and kB is the Boltzmann constant. At low stres-ses and high temperatures, the hyperbolic term in of Eq. (26) approx-imates a linear form. Under these conditions, the Eq. (26) is assumedto describe the visco-plastic response of BMG. Hence _c ands may bereplaced by _ep and rf, for which Eq. (26) reduces to:
_ep ¼ 2f 0 exp �an
kf
X2kT
rf ð27Þ
The inverse kinetic relation is then established as:
rf ¼kBTf0X
1kf
f 0 expan
_ep ¼ g0ðTÞ exp
an
_ep ¼ gðn; TÞ _ep ð28Þ
Eq. (28) is the flow equation with the Newtonian viscosity as
g0 exp an
� �in the low stress and high temperature regime. In [17],
g0 has been alternatively described by an entropy-based phenom-
enological model as hm�, where h is the Planck’s constant.
In the high stress and low temperature regime, metallic glassesare often observed to have non-Newtonian viscosity and inhomo-geneous flow. A transition from Newtonian to non-Newtonian vis-cosity has been experimentally observed in [18] with decrease intemperature and increase in strain-rate. To extend Eq. (28) to abroader range of temperatures and strain-rates, a general expres-sion of viscosity has been proposed in [17] as:
gðn; T; _eÞ ¼ g0
1þ exp an
� �g0 _er0
� �bðTÞ expan
ð29Þ
where r0 is a reference stress. The term exp an
� �g0 _er0
� �bðTÞaccount for
the temperature and strain-rate effects. The temperature dependentcoefficient has been proposed to be b(T) = 1.0–4.325 � 10�10
� (T � 293)3 in [4]. While this expression is suitable for lowerstrain-rates, the accuracy drops for rates higher than 10�2. Conse-quently, a third-order polynomial expression in temperature isfitted from the experimental results in [4] as b(T) = 0.995–9.15 � 10�5 T + 2.6 � 10�7T2 � 1.992 � 10�10T3 where T is in K. Inthe temperature range 293–700 K, the value of b(T) is between 1.0and 0.95, which corresponds to a non-Newtonian viscosity. At high
temperatures the term exp an
� �g0 _er0
� �bðTÞ! 0 and hence the Newto-
nian viscosity is recovered. Values of these parameters are listed
Table 1Mechanical properties and parameters for Vitreloy-1 (Data is taken from [4]).
Property Value
Young’s modulus in glassy state Egl 70 GPaYoung’s modulus in supercooled liquid state Esc 23.5 GPaSlope of Young’s modulus in glassy state kEgl �80 MPa/KSlope of Young’s modulus in supercooled liquid state kEsc 0 MPa/KParameter for the Young’s modulus DE 24.63Poisson’s ratio v 0.36Reference stress r0 0.54 GPaMass density (room temperature) q 6000 kg m�3Melting temperature Tm 936 KGlass transition temperature Tg 625 KReference temperature for nT:Tref 693 KParameter for threshold stress b 1‘‘Gas’’ limit viscosity s0 4 � 10�5 Pa s
Material parameter for _n:v 0.4
Material parameter for _n : a0x 0.4
Parameter for viscosity: a 0.11Parameter in the Cohen–Grest model: d1 47,948Parameter in the Cohen–Grest model: d2 189Thermal expansion coefficient aT 4.0 � 10�5 K�1
in Table 1. The viscosity is Eq. (29) is very sensitive to free-volumeconcentration n. The conventional viscosity form is obtained byreplacing the viscosity term in Eq. (28) with Eq. (29) and adding athreshold term, i.e.
rf ¼ r0 þ gðn; T; _eÞ _ep ð30Þ
The threshold stress r0 is the experimentally observed elasticlimit and varies with temperature and strain-rates. In this model,it is taken as an average of the steady state flow stress as:
r0 ¼ bgðn; T; _eÞ _e ð31Þ
where b is a material constant and _e ¼ ksymð _FF�1Þk is the totaleffective strain rate. Eqs. (29)–(31) define the hardening and soften-ing response in this model.
2.5. Free-volume and temperature evolution
The evolution of free-volume that occurs during shearing inplastic deformation is regarded as an order–disorder process. Thekinetic law of free-volume generally incorporates a combinationform of creation and annihilation in the form:
_n ¼ vð _nþ þ _n�Þ ð32Þ
where v is an order constant. While diffusion also contributes to thechange of free-volume, it is not considered in this mode due to thelack of understanding of this process. Free-volume is created inshear mode when an atom is squeezed into a void, which is smallerthan the critical volume. The resulting expression for free-volumecreation is given in [2] as:
_nþ ¼ 2af0
mfexpð�a
nÞkf
kBTS
coshð sX2kBT
Þ � 1� �
ð33Þ
The bracketed term in Eq. (33) can be expanded in a Taylor ser-ies as
coshsX
2kBT
� 1 ¼ 1þ 1
2sX
2kBT
2
þ � � � � 1 ð34Þ
For low stresses and high temperatures, the higher order termsin the series can be ignored to yield the functional form:
_nþ ¼ af0
mf Sexpð�a
nÞkf
s2X2
2kBTð35Þ
Substituting Eq. (26) into (35) and replacing s with rf yields therelation for work-rate (power) dependent free-volume creation as[10]:
_nþf ¼12
aXmf S
rf _ep ¼ a0xarf _ep ð36Þ
Disordering is described by the single adjustable parameter a0x.In [10], the evolution law in Eq. (36) has been shown to accuratelypredict the uniaxial compression creep experimental response ofPb-based metallic glass up to moderately high stresses andtemperatures (600 MPa, 550 K). For higher stress regimes, thefree-volume evolution law follows a strain-rate-dependent formas given in [19,4,5]. The hyperbolic functions in Eqs. (26) and (33)approximate exponentials and consequently, Eq. (33) reduces to:
_nþf ¼ axa _ep ð37Þ
where ax is a temperature and strain-rate dependent parameter.Combining Eqs. (36) and (37), a general form of the free-volumeevolution for a wide range of stresses and temperatures regionsmay be given as:
_nþf ¼ acx a0xrf �1�ca _ep ð38Þ

498 J. Cheng, S. Ghosh / Computational Materials Science 69 (2013) 494–504
where a0x is a constant and the parameter c rf
T
�2 ½0;1� accounts
for the transition from the low stress regime to the high stressregime. ax has been computed in [4] and the parameters chas been fitted to experimental data in [1] to yield
c ¼ 0:5 1þ tanh 10�5 rf
T � 0:7� 106� �� �h i
.
Annihilation of the free-volume takes place by bimolecular pro-cess induced structure relaxation [10], where it is assumed that theexcess free volume created by shear will tend to be relaxed towarda metastable equilibrium value nT. Using a simple model for visco-elastic behavior of Newtonian flows, the relaxation time is relatedto the viscosity as t ¼ g
l, and the free volume relaxation rate is [4]:
_n� ¼ n� nT
g=l¼ n� nT
rf =l _epð39Þ
The equilibrated, temperature dependent free-volume concen-tration, which represents the free-volume in a stress-free stateaccording to the Cohen-Grest or CG model [20] is given as:
nT ¼1
2d1T � Tref þ
ffiffiffiffiffiffiffiffiffiffiffiffiffiffiffiffiffiffiffiffiffiffiffiffiffiffiffiffiffiffiffiffiffiffiffiffiðT � Tref Þ2 þ d2T
q� �ð40Þ
This parameter nT may also be used as the initial value of thefree-volume concentration. For monotonic loading case startingfrom a stress-free state, the free-volume concentration evolutionrate should always be larger or equal than zero in the presenceof a positive plastic strain rate, i.e. _n P 08 _ep P 0.
The free-volume concentration nT is determined by the equilib-rium temperature according to the Cohen-Grest or CG model [20],which also affects the viscosity. Additionally, experimental mea-surements of the elastic modulus of the a variety of bulk metallicglasses, e.g. in [21,22] have shown a dependence on temperature.The shear modulus, bulk modulus and Poisson’s ratio have beenmeasured at temperatures ranging from 400 K down to liquidnitrogen temperature for Zr, ZrCu and Mg-based BMG’s in [23].These studies have shown low Poisson’s ratio and high shear andbulk moduli at low temperatures, which are consistent with exper-imental observations in [21]. A functional form of the temperaturedependent Young’s modulus E(T) is assumed following the modelin [24] for amorphous polymers as:
EðTÞ¼12ðEglþEscÞ�
12ðEgl�EscÞtanh
1DEðT�TgÞ
þkEðT�TgÞ ð41Þ
where Egl,Esc are the moduli in glassy and supercooled liquid regionsrespectively, DE is a fitting parameter, Tg is the glass transition tem-perature and kE corresponds to the slope of temperature variation ofthe Young’s modulus beyond the transition region, i.e.
kE ¼kEgl if T < Tg
kEsc if T P Tg
�ð42Þ
In the case of inhomogeneous deformation, temperature evolu-tion is generally due to adiabatic heating inside the very thin shearband where the shear strain rate is much higher than in otherparts. This rate of temperature change can be equated to the con-ventional heat flux and plastic energy dissipation terms as [4]:
q0Cv _T ¼ b0r _ep �r �H ð43Þ
where b0 is the Taylor–Quinney coefficient, H is the outward heatflux. For isothermal and adiabatic heating condition the _T ¼ 0 andr � H = 0 respectively. Constitutive parameters for the Vitreloy-1BMG is given in Table 1.
3. Implementation of the constitutive model in the commercialcode ABAQUS
The constitutive model discussed in Section 2 is incorporated inthe commercial FEM code ABAQUS through the user interfacematerial subroutine (UMAT). An implicit time integration schemewith the return mapping algorithm [25] is used in UMAT to updatestress, effective plastic strain rate, free volume, temperature andother state dependent variables from a known state at time t tonext incremental state at time t + Dt. The following general stepsare pursued to integrate the constitutive relations. This is also de-picted in Fig. 1.
(1) Start with the elastic predictor corresponding to Dep = 0, thatis assuming an elastic increment. Thus:
Fp;pretþDt ¼ Fp
t ;Fe;pretþDt ¼ FtþDtF
p�1tþDt ð44Þ
Calculate wtþDt; stþDt; �ptþDt;rf ðtþDtÞ and other terms based onthis decomposition.
(2) Determine: stþDt þ a�ptþDt � rf ;tþDt
(i) If stþDt þ a�ptþDt � rf ;tþDt 6 0, then the increment is elas-tic. Dep = 0 and the corresponding results are correct.The elastic updates correspond to the total updates.
(ii) If stþDt þ a�ptþDt � rf ;tþDt > 0, then the increment isinelastic. Introduce the corrector using a Newton–Raph-son iterative update.
(3) Calculate Dep using a Newton–Raphson iterative scheme
Depðiþ1Þ ¼ DepðiÞ � HðDepðiÞÞHðDepþdepÞ�HðDepðiÞ�depÞ
2dep
ð45Þ
where HðDepÞ ¼ stþDt þ a�ptþDt � rf ðtþDtÞ and d ep correspondsto a perturbation on Dep.
(4) Calculate the free-volume concentration increment Dn fromEq. (31). The decomposition of deformation gradient is nowaltered as:
FptþDt ¼ expða0DnIþ DepMtþDtÞFp
t; FetþDt ¼ FtþDtF
p�1tþDt ð46Þ
where the plastic flow direction tensor Mt+Dt is calculatedexplicitly from Eq. (19) and the predictor: Fe;pre
tþDt .(5) Repeat calculation for wtþDt ; stþDt ; �ptþDt rf (t+Dt) with the new
decomposition. Check for convergence again, go back to step(2).
(6) Repeat calculations for wtþDt ; stþDt ; �ptþDt ;rf ðtþDtÞ with the newdecomposition of Ft+Dt until the convergencestþDt þ a�ptþDt � rf ðtþDtÞ 6 0 is reached.
(7) Update the temperature T(t + Dt) for next step similar toconventional staggered update algorithm for thermo-mechanical coupled problems.
4. Computational simulations and experimental validation
Two types of simulations are conducted with the ABAQUS com-mercial code, in which the BMG constitutive model are incorpo-rated through the user material subroutine (UMAT). The first is asimple numerical simulation of a single material point that is as-sumed to lie inside a shear band. This numerical experiment is con-ducted to examine the effectiveness of the proposed model incomparison with that in [4]. The second is a three-dimensionalfinite element simulation for uniaxial-compression test. While2-dimensional simulations has been conducted in the literature[5,14], the 3D model is used to better understand the 3D shearband formation process.

Fig. 1. Flow chart of the integration algorithm implemented in ABAQUS-UMAT.
0 0.05 0.1 0.15 0.2 0.25 0.30
500
1000
1500
2000
2500
Fig. 2. True stress–strain response for various strain-rates (0.1, 0.01, 0.001, 0.0001)at 295 K in uniaxial compression simulations. Experimental data are taken from[1,18,27].
J. Cheng, S. Ghosh / Computational Materials Science 69 (2013) 494–504 499
4.1. Quasi-static compression behavior in various temperature andstrain rate
In this example, a uniaxial compression simulation is performedto test the validity of the constitutive model and verify its numer-ical implementation through comparison with a similar study in[4]. The problem domain is setup by assuming a temperatures from295 K to 687 K and strain-rates from 0.0001 to 0.32. The truestress–strain results from this simulation are small volume insidea shear band with an applied normal compression and shear loadon the top and bottom surfaces respectively. Following the studiesin [4,26,5], the tests are conducted for the BMG Vitreloy-1 over arange of compared with experiment data given in [1,18] and alsowith results from a 3D simulation of a single 8-noded brick ele-ment in ABAQUS, under the same loading conditions. The truestress–strain responses are shown in the Figs. 2–4, 6 and 7.
Fig. 2 shows the true stress–strain response for simulations con-ducted at a temperature of 295 K and compares it with experimen-tal data in [1,18,27]. The experimental data in the figure are for astrain-rate of 1 � 10�4. as there is no significant rate-effect ob-served at this temperature. This rate insensitivity, especially atsmaller strains, is also reflected in the model predictions with al-most overlapping responses. The drop in stress is due to the free-volume induced drop in viscosity as shown in Fig. 3, which depictsthe non-Newtonian viscosity evolution for different strain-rates at

visc
osity
m2 /s
0 0.1 0.2 0.3
1010
1011
1012
1013
1014
Fig. 3. Viscosity evolution for various strain-rates (0.1, 0.01, 0.001, 0.0001) at 295 Kin uniaxial compression simulations.
0 0.05 0.1 0.15 0.2 0.25 0.3 0.35 0.40
500
1000
1500
2000
0 0.1 0.2 0.3 0.40
500
1000
1500
2000
0 0.05 0.1 0.15 0.2 0.25 0.3 0.35 0.40
500
1000
1500
(a)
(c)
Fig. 4. True stress–strain response for various strain-rates at (a) 613 K, (b) 623 K,and (c) 643 K in uniaxial compression simulations. Experimental data are takenfrom [1,18].
500 J. Cheng, S. Ghosh / Computational Materials Science 69 (2013) 494–504
295 K. Furthermore, strain-rate-dependent free-volume evolutionis the only disordering mode, since as c = 1 in Eq. (38).
Fig. 4a–c presents the simulated stress–strain behavior of Vitre-loy-1 in the vicinity of the glass transition temperature, i.e. at613 K, 623 K and 643 K, for different applied strain-rates rangingfrom 1� 10�5 to 0.32. In this regime, the power-density-dependentfree-volume evolution part starts to dominate in Eq. (38), as capproaches 0. This is shown in Fig. 5 which illustrates the evolutionof c with flow stress and temperature. The results show that thepower-strain rate-dependent free-volume evolution model is ableto match the experimental results well. The stress–strain responseis highly strain-rate sensitive in this temperature range. It is no-ticed that for a temperature 613 K, there is a stress undershootright after a stress drop and before reaching steady-state. Thisresults from a free volume relaxation process, probably due to freevolume diffusion, which is not captured by the simulation. Also fora temperature 623 K at an advanced deformation stage after reach-ing steady-state stress, different softening and hardening behav-iors seem to appear. It is unclear what causes this behavior, andit only occurs in the experiments at a temperature 623 K. This isalso not captured by simulation. At low strain rates e.g. at2 � 10�4, the peak stress is low and the strain softening phenome-non is nearly non-existent. This results in a homogeneous defor-mation. This result is also in contrast with Fig. 2, where shearband tends to form indicating nonhomogeneous deformation.
Fig. 6 presents the results of numerical simulations at 683 K,both under isothermal and adiabatic heating conditions. In thetemperature evolution Eq. (43), the left hand side corresponds tothe local change in thermal energy, the first term on right handside is the heat source from plastic energy dissipation and the sec-ond term is the heat flux. Under isothermal conditions with _T ¼ 0in Eq. (43), the results agree rather well with experiments at rela-tively low strain-rates, e.g. from 1 � 10�1/s to 1 � 10�2/s. In this re-gime, the system has enough time to reach a thermal equilibriumstate.
However, at a strain-rate of 3.2 � 10�1/s, this model under qua-si-static assumptions predicts a higher equilibrium stress than isexperimentally observed, for higher strains. This may be causedby the temperature changes as within shear bands, representingadiabatic heating conditions. Consequently, adiabatic heating withthe heat flux term r � H = 0 in Eq. (43), and transient heat transfermust be taken into account in the numerical simulations in this
temperature regime. Numerical simulations with adiabatic heatingare conducted. For lower strain-rates 60.1, the temperature rise

c
105 106 107-0.2
0
0.2
0.4
0.6
0.8
1
1.2
σ
Fig. 5. The parameter c in the free-volume evolution law (38) as a function of flowstress and temperature.
0 0.05 0.1 0.15 0.2 0.25 0.3 0.35 0.40
200
400
600
800
Fig. 6. True stress–strain response for various strain-rates at 683 K in uniaxialcompression simulations. Experimental data are taken from [1,18].
0 0.1 0.2 0.3 0.4 0.5 0.6 0.70
200
400
600
800
1000
Fig. 7. True stress–strain response with instantaneous changes in the strain-ratesat 643 K in uniaxial compression simulations. Experimental data are taken from[1,18].
J. Cheng, S. Ghosh / Computational Materials Science 69 (2013) 494–504 501
due to plastic dissipation is very small and thus the isothermal andadiabatic heating conditions do not exhibit much difference. Athigher rates, even including the adiabatic heating condition doesnot significantly improve the simulated results as seen in Fig. 6.The peak stress at lower strains is significantly lower in the model,however better match with the experimental results are observedat much higher strains beyond the plot in the figure.
4.1.1. Strain-rate jump testIn this example, numerical simulations are conducted with a
jump in the strain-rate at a temperature of 643 K (near the glasstransition temperature 625 K) corresponding to experiments in[1,18]. Initially the specimen is deformed at a strain-rate of5 � 10�3 s�1. At 20% strain, the strain-rate is instantaneously in-creased to 1 � 10�2, and again at 40% strain the strain-rate is re-duced back to 5 � 10�3 s�1. The stress–strain response, simulatedby a single C3D8 element in ABAQUS, is shown in Fig. 7. Withthe upward jump in the strain-rate, the stress level increases to a
new peak before strain-softening take places again. Again withthe drop in the strain-rate to 5 � 10�3 s�1, the stress peak drops be-low the steady-state response before slowly catching up again. Thesimulation results show that model captures the strain-rate depen-dence rather well at this temperature.
4.2. Micro-indentation simulations
Simulations of a spherical indentation tests of Vitreloy-1 is per-formed to study the hydrostatic pressure sensitivity and also tovalidate the proposed constitutive model for BMGs. The experi-ment data are taken from [8], in which a micro-indenter (MicroHardness Tester, CSM instruments, Switzerland) is loaded in aforce control mode at a load rate of 2 N/min. The indenter tip hasa radius of R = 50 lm that is significantly smaller than the BMGmaterial specimen. The experimental temperature is around roomtemperature of T = 295 K.
The simulation is performed using a plane-strain model in theABAQUS code with 1000 (40 � 25) CPE4 full integration planestrain elements as shown in Fig. 8. The figure shows a convergedmesh with respect to stress results. The ratio of the size of the spec-imen to the indenter tip radius in the model are: H
R ¼ 4; WR ¼ 8. The
contact between the rigid indenter tip and specimen is set to befrictionless, and the penalty method is used to enforce the non-penetration constraint. Displacement-control is applied at the ref-erence point of the rigid tip with two rates, viz. 10 lm/s and 1 lm/srespectively. In this range of rates at room temperature, the BMGmaterial is rate-insensitive, and displacement control used in thesimulation should give the same results as under load-control appliedin experiments.
The contour plot of the von-Mises stress is shown in Fig. 9 cor-responding to a maximum indentation depth of 0.18R. The speci-men is large enough to avoid effects of boundaries other than theindenter. The maximum stress is around 1.9 GPa, which is consis-tent with the experimentally observed yield stress in [8]. The nor-malized displacement–load responses with different hydrostaticpressure sensitivity coefficients a = 0.0, 0.045, 0.13, 0.2 are plottedin Fig. 9. The displacement is normalized with the indenter radiusas h/R and the load is normalized as P/ER2, where E = 96 GB is theelastic modulus. The pure elastic solution predicts the same slopeas experiments in the elastic deformation regime, i.e. (h/R < 0.1).However, the inelastic portion of the deformation shows a much

Von Mises stress
+1.506e+07+1.727e+08+3.304e+08+4.880e+08+6.457e+08+8.033e+08+9.609e+08+1.119e+09+1.276e+09+1.434e+09+1.592e+09+1.749e+09+1.907e+09
Fig. 8. Von-Mises stress contour plot at maximum indentation depth in the indentation example. Dimensions of the model correspond to HR ¼ 4;W
R ¼ 8 where H and Wcorrespond to the height and width of the specimen and R is the indenter tip radius.
0 0.05 0.1 0.15 0.20
0.01
0.02
0.03
0.04
0.05
0.06
0.07
0.08
h/R
P/ER
2
experimentelastic predictionVon-Mises (a=0)Mohr-Coulomb (a=0.045)Mohr-Coulomb (a=0.13)Mohr-Coulomb (a=0.20)
Fig. 9. Normalized load–displacement plots in the indentation test exhibitingresults using pure elastic, non-linear with Mises yield function and non-linear withMohr–Coulomb yield function. The triangular dots represent experimental datafrom [8].
+1.885e−02+2.740e−02+3.595e−02+4.450e−02+5.304e−02+6.159e−02+7.014e−02+7.869e−02+8.723e−02+9.578e−02+1.043e−01+1.129e−01+1.214e−01
+1.385e−02
+1.714e−01
Fig. 10. The finite element model and mesh in ABAQUS showing the shear band andthe principal strains.
502 J. Cheng, S. Ghosh / Computational Materials Science 69 (2013) 494–504
higher slope. The stresses obtained by using the von Mises yieldfunction with a = 0.0 in Eq. (17), have lower values than the exper-imental results. With increasing a in Eq. (17), the slopes of the sim-ulated load–displacement plots increase, and at a = 0.13 it showsthe best match with experimental data. This value is used in thecompression tests to predict the stress–strain behavior.
No noticeable difference is observed at a constant a with differ-ent loading rates (not shown). This is consistent with the previousstress–strain results in compression tests at room temperaturewhere the strain-rate dependence does not exist.
4.3. 3-D compression simulation showing shear band formation
The BMG model is further validated with a 3-D uniaxial com-pression simulation for the material Zr50.7Cu28Ni9Al12.3. The mate-rial properties have been given in [28] and include the glasstransition temperature of 719 K, yield strength 1.9 GPa, heatcapacity 12.9 kJ/mol. Fig. 10 shows half of a cylinder that is mod-eled using 21,318 8-noded brick elements with selective reducedintegration in ABAQUS. Displacement boundary conditions are ap-plied on the top and bottom surface nodes in vertical direction asthe loading. Adiabatic heating condition is assumed for the simu-lations, with nodes on the top and bottom boundary set to a con-stant ambient temperature of 295 K as a temperature boundary
condition. A weak point is introduced at a location inside thespecimen to initiate a local stress concentration and trigger shearbanding. At this point, the threshold stress r0 in Eq. (25) is setto a 20% lower value than other points in the body. Physicallythis corresponds to a local defect, such as precipitate or localfree-volume concentration, for which the location is chosen inthe way to represent the general case. The weak point is appliedin a symmetric way so that only half the cylinder can be modeled.The principal strain distribution at 3.5% overall applied strain isplotted in the Fig. 10. The strain is highly localized in a thinshear-band plane across the specimen, which is the precursor tofracture.
Results of the simulation are presented in Fig. 11. The overallstress is calculated from the net vertical reaction force on the topand bottom surfaces respectively, while the overall strain corre-sponds to the applied displacement. The stress–strain response isplotted in Fig. 11a. In the initial stages of elastic deformation (pointA in Fig. 11) at a uniform rate over the whole body, the deformation
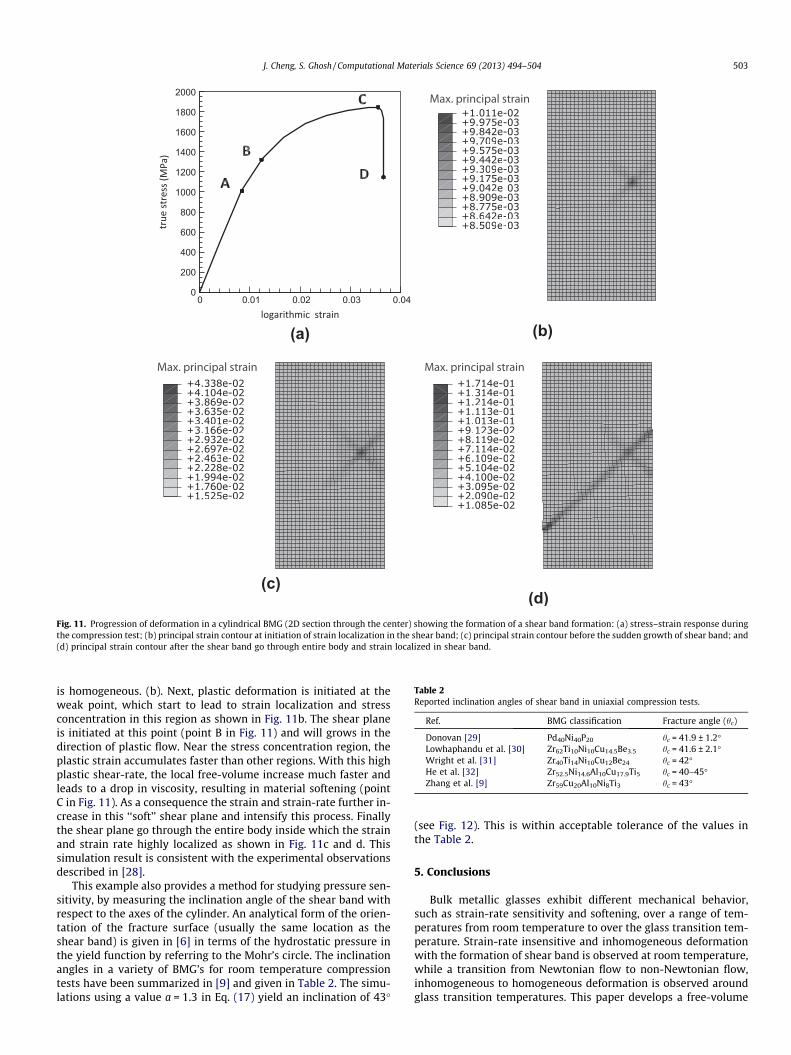
Fig. 11. Progression of deformation in a cylindrical BMG (2D section through the center) showing the formation of a shear band formation: (a) stress–strain response duringthe compression test; (b) principal strain contour at initiation of strain localization in the shear band; (c) principal strain contour before the sudden growth of shear band; and(d) principal strain contour after the shear band go through entire body and strain localized in shear band.
Table 2Reported inclination angles of shear band in uniaxial compression tests.
Ref. BMG classification Fracture angle (hc)
Donovan [29] Pd40Ni40P20 hc = 41.9 ± 1.2�Lowhaphandu et al. [30] Zr62Ti10Ni10Cu14.5Be3.5 hc = 41.6 ± 2.1�Wright et al. [31] Zr40Ti14Ni10Cu12Be24 hc = 42�He et al. [32] Zr52.5Ni14.6Al10Cu17.9Ti5 hc = 40–45�Zhang et al. [9] Zr59Cu20Al10Ni8Ti3 hc = 43�
J. Cheng, S. Ghosh / Computational Materials Science 69 (2013) 494–504 503
is homogeneous. (b). Next, plastic deformation is initiated at theweak point, which start to lead to strain localization and stressconcentration in this region as shown in Fig. 11b. The shear planeis initiated at this point (point B in Fig. 11) and will grows in thedirection of plastic flow. Near the stress concentration region, theplastic strain accumulates faster than other regions. With this highplastic shear-rate, the local free-volume increase much faster andleads to a drop in viscosity, resulting in material softening (pointC in Fig. 11). As a consequence the strain and strain-rate further in-crease in this ‘‘soft’’ shear plane and intensify this process. Finallythe shear plane go through the entire body inside which the strainand strain rate highly localized as shown in Fig. 11c and d. Thissimulation result is consistent with the experimental observationsdescribed in [28].
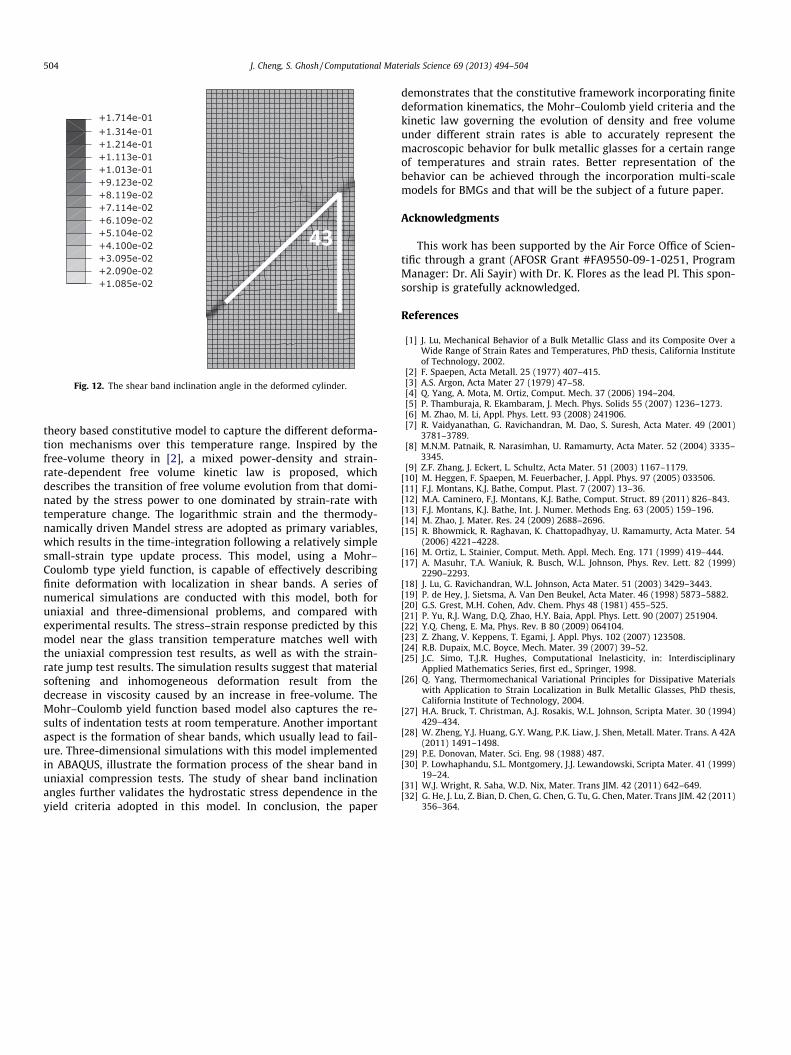
This example also provides a method for studying pressure sen-sitivity, by measuring the inclination angle of the shear band withrespect to the axes of the cylinder. An analytical form of the orien-tation of the fracture surface (usually the same location as theshear band) is given in [6] in terms of the hydrostatic pressure inthe yield function by referring to the Mohr’s circle. The inclinationangles in a variety of BMG’s for room temperature compressiontests have been summarized in [9] and given in Table 2. The simu-lations using a value a = 1.3 in Eq. (17) yield an inclination of 43�
(see Fig. 12). This is within acceptable tolerance of the values inthe Table 2.
5. Conclusions
Bulk metallic glasses exhibit different mechanical behavior,such as strain-rate sensitivity and softening, over a range of tem-peratures from room temperature to over the glass transition tem-perature. Strain-rate insensitive and inhomogeneous deformationwith the formation of shear band is observed at room temperature,while a transition from Newtonian flow to non-Newtonian flow,inhomogeneous to homogeneous deformation is observed aroundglass transition temperatures. This paper develops a free-volume
43
Fig. 12. The shear band inclination angle in the deformed cylinder.
504 J. Cheng, S. Ghosh / Computational Materials Science 69 (2013) 494–504
theory based constitutive model to capture the different deforma-tion mechanisms over this temperature range. Inspired by thefree-volume theory in [2], a mixed power-density and strain-rate-dependent free volume kinetic law is proposed, whichdescribes the transition of free volume evolution from that domi-nated by the stress power to one dominated by strain-rate withtemperature change. The logarithmic strain and the thermody-namically driven Mandel stress are adopted as primary variables,which results in the time-integration following a relatively simplesmall-strain type update process. This model, using a Mohr–Coulomb type yield function, is capable of effectively describingfinite deformation with localization in shear bands. A series ofnumerical simulations are conducted with this model, both foruniaxial and three-dimensional problems, and compared withexperimental results. The stress–strain response predicted by thismodel near the glass transition temperature matches well withthe uniaxial compression test results, as well as with the strain-rate jump test results. The simulation results suggest that materialsoftening and inhomogeneous deformation result from thedecrease in viscosity caused by an increase in free-volume. TheMohr–Coulomb yield function based model also captures the re-sults of indentation tests at room temperature. Another importantaspect is the formation of shear bands, which usually lead to fail-ure. Three-dimensional simulations with this model implementedin ABAQUS, illustrate the formation process of the shear band inuniaxial compression tests. The study of shear band inclinationangles further validates the hydrostatic stress dependence in theyield criteria adopted in this model. In conclusion, the paper
demonstrates that the constitutive framework incorporating finitedeformation kinematics, the Mohr–Coulomb yield criteria and thekinetic law governing the evolution of density and free volumeunder different strain rates is able to accurately represent themacroscopic behavior for bulk metallic glasses for a certain rangeof temperatures and strain rates. Better representation of thebehavior can be achieved through the incorporation multi-scalemodels for BMGs and that will be the subject of a future paper.
Acknowledgments
This work has been supported by the Air Force Office of Scien-tific through a grant (AFOSR Grant #FA9550-09-1-0251, ProgramManager: Dr. Ali Sayir) with Dr. K. Flores as the lead PI. This spon-sorship is gratefully acknowledged.
References
[1] J. Lu, Mechanical Behavior of a Bulk Metallic Glass and its Composite Over aWide Range of Strain Rates and Temperatures, PhD thesis, California Instituteof Technology, 2002.
[2] F. Spaepen, Acta Metall. 25 (1977) 407–415.[3] A.S. Argon, Acta Mater 27 (1979) 47–58.[4] Q. Yang, A. Mota, M. Ortiz, Comput. Mech. 37 (2006) 194–204.[5] P. Thamburaja, R. Ekambaram, J. Mech. Phys. Solids 55 (2007) 1236–1273.[6] M. Zhao, M. Li, Appl. Phys. Lett. 93 (2008) 241906.[7] R. Vaidyanathan, G. Ravichandran, M. Dao, S. Suresh, Acta Mater. 49 (2001)
3781–3789.[8] M.N.M. Patnaik, R. Narasimhan, U. Ramamurty, Acta Mater. 52 (2004) 3335–
3345.[9] Z.F. Zhang, J. Eckert, L. Schultz, Acta Mater. 51 (2003) 1167–1179.
[10] M. Heggen, F. Spaepen, M. Feuerbacher, J. Appl. Phys. 97 (2005) 033506.[11] F.J. Montans, K.J. Bathe, Comput. Plast. 7 (2007) 13–36.[12] M.A. Caminero, F.J. Montans, K.J. Bathe, Comput. Struct. 89 (2011) 826–843.[13] F.J. Montans, K.J. Bathe, Int. J. Numer. Methods Eng. 63 (2005) 159–196.[14] M. Zhao, J. Mater. Res. 24 (2009) 2688–2696.[15] R. Bhowmick, R. Raghavan, K. Chattopadhyay, U. Ramamurty, Acta Mater. 54
(2006) 4221–4228.[16] M. Ortiz, L. Stainier, Comput. Meth. Appl. Mech. Eng. 171 (1999) 419–444.[17] A. Masuhr, T.A. Waniuk, R. Busch, W.L. Johnson, Phys. Rev. Lett. 82 (1999)
2290–2293.[18] J. Lu, G. Ravichandran, W.L. Johnson, Acta Mater. 51 (2003) 3429–3443.[19] P. de Hey, J. Sietsma, A. Van Den Beukel, Acta Mater. 46 (1998) 5873–5882.[20] G.S. Grest, M.H. Cohen, Adv. Chem. Phys 48 (1981) 455–525.[21] P. Yu, R.J. Wang, D.Q. Zhao, H.Y. Baia, Appl. Phys. Lett. 90 (2007) 251904.[22] Y.Q. Cheng, E. Ma, Phys. Rev. B 80 (2009) 064104.[23] Z. Zhang, V. Keppens, T. Egami, J. Appl. Phys. 102 (2007) 123508.[24] R.B. Dupaix, M.C. Boyce, Mech. Mater. 39 (2007) 39–52.[25] J.C. Simo, T.J.R. Hughes, Computational Inelasticity, in: Interdisciplinary
Applied Mathematics Series, first ed., Springer, 1998.[26] Q. Yang, Thermomechanical Variational Principles for Dissipative Materials
with Application to Strain Localization in Bulk Metallic Glasses, PhD thesis,California Institute of Technology, 2004.
[27] H.A. Bruck, T. Christman, A.J. Rosakis, W.L. Johnson, Scripta Mater. 30 (1994)429–434.
[28] W. Zheng, Y.J. Huang, G.Y. Wang, P.K. Liaw, J. Shen, Metall. Mater. Trans. A 42A(2011) 1491–1498.
[29] P.E. Donovan, Mater. Sci. Eng. 98 (1988) 487.[30] P. Lowhaphandu, S.L. Montgomery, J.J. Lewandowski, Scripta Mater. 41 (1999)
19–24.[31] W.J. Wright, R. Saha, W.D. Nix, Mater. Trans JIM. 42 (2011) 642–649.[32] G. He, J. Lu, Z. Bian, D. Chen, G. Chen, G. Tu, G. Chen, Mater. Trans JIM. 42 (2011)
356–364.