consolidated financial statements - 任天 …. others (1) changes for important subsidiaries during...
TRANSCRIPT

CONSOLIDATED FINANCIAL STATEMENTSNintendo Co., Ltd. and Consolidated Subsidiaries
October 25, 2007Nintendo Co., Ltd. 11-1 Kamitoba hokotate-cho,Minami-ku, Kyoto 601-8501Japan
FINANCIAL HIGHLIGHTS
1. Consolidated Results for the Six Months Ended September 2006 and 2007, and Year Ended March 31, 2007(1) Consolidated operating results (Amounts below one million are rounded down)
Net sales Operating income Income before income taxes and extraordinary items Net income
million yen % million yen % million yen % million yen % Six months ended Sept. 30, '07Six months ended Sept. 30, '06
Year ended Mar. 31, '07
Net income per share Diluted income per share
yen yen Six months ended Sept. 30, '07Six months ended Sept. 30, '06
Year ended Mar. 31, '07
(2) Consolidated financial position
Total assets Net assets Capital adequacyratio
Net assets pershare
million yen million yen % yen As of Sept. 30, '07As of Sept. 30, '06As of Mar. 31, '07
(3) Consolidated cash flowsCash and cash
equivalents - endingmillion yen million yen million yen million yen
Six months ended Sept. 30, '07Six months ended Sept. 30, '06
Year ended Mar. 31, '07
2. Cash dividendsDividend per share
Interim Year-end Annualyen yen yen
Year ended Mar. 31, '07Year ending Mar. 31, '08Year ending Mar. 2008
(forecast)
3. Forecast for the fiscal year ending March 2008 (April 1, 2007 - March 31, 2008)
million yen % million yen % million yen % million yen % yen
Year ending Mar. 2008
- - -
1,090.00
690.00
950.00
620.00
(25,485)
1,152,250 69.4
275,000
7,733.31
(40,994) 580,835
140.0070.00
1,263,030
19,993
Cash flows fromoperating activities
60.4 85.8 59.3 1,550,000 420,000 460,000
25,848 106,995
(174,603)
132,421
174,290 - 54,345 48.4
143.7 215,376
288,839 - 94,676 66.6
127.5 188,784
226,024 - 67,111 242.2
181.3
1,035.36
1,362.61
298,817 69.4
424.86
694,803
966,534 -
132.5
78.3
746,557 (79,533)
8,614.97 69.9
688,737
1,659,239 9,008.34
1,575,597
Cash flows frominvesting activities
Cash flows fromfinancing activities
274,634 (50,137)
1,102,018 989,319
Net sales Operating income Income before income taxes and extraordinary items Net income Net income
per share
2,150.16 57.8
- 1 -

4. Others(1) Changes for important subsidiaries during the six months ended September 30, 2007
Not applicable
(2) Changes on the basis of consolidated financial statements preparation① Related to accounting standard revisions etc. Applicable② Other changes Not applicable[Note] Please refer to "Changes on the Basis of Consolidated Financial Statements Preparation" at page 13 for details.
(3) Outstanding shares (common shares)① Number of shares outstanding (including treasury stock) shares
As of Sept. 30, '07: As of Sept. 30, '06: As of Mar. 31, '07:② Number of treasury stock shares
As of Sept. 30, '07: As of Sept. 30, '06: As of Mar. 31, '07:③ Average number of shares shares
As of Sept. 30, '07: As of Sept. 30, '06: As of Mar. 31, '07:
(Reference) Non-consolidated results1. Non-consolidated results for the years ended September 2006 and 2007, and year ended March 31, 2007(1) Non-consolidated operating results
Net sales Operating income Income before income taxes and extraordinary items Net income
million yen % million yen % million yen % million yen % Six months ended Sept. 30, '07Six months ended Sept. 30, '06
Year ended Mar. 31, '07
Net income per shareyen
Six months ended Sept. 30, '07Six months ended Sept. 30, '06
Year ended Mar. 31, '07
(2) Non-consolidated financial position
Total assets Net assets Capital adequacyratio
Net assets pershare
million yen million yen % yen As of Sept. 30, '07As of Sept. 30, '06As of Mar. 31, '07
190.1 100.4 139.5 121.7 109,935
13,773,215
127,899,242
141,669,000
13,759,852
127,911,816
141,669,000
898,639 - 212,288 - - 50.7 37,897 (4.3)
142,743 -
141,669,000
13,765,987
127,908,919
69.7
1,115.98
634,996 166,987 186,257286,393 59.2 69,727 148.0 92,923
1,366,267 947,076 69.3 7,404.64 6,663.94
859.55
263,403
7,625.76 1,078,404 852,378 79.0
296.28
1,400,267 975,302
[Note]Consolidated results for the year ending March 31, 2008 is revised and forecast figures after revision are set forth above.
Please refer to "Notice of Financial Forecast Modifications" and "Notice of Dividend Forecast Modification" (both datedOctober 25, 2007) announced today for details.
Forecasts announced by the Company referred to above were prepared based on management's assumptions with informationavailable at this time and therefore involve known and unknown risks and uncertainties.
Please note such risks and uncertainties may cause the actual results to be materially different from the forecasts (earningsforecast, dividend forecast, and other forecasts). With respect to the forecast, please refer to page 3 for the forward-looking conditions.
- 2 -
Nintendo Co., Ltd.
OPERATING RESULTS1. Analysis of Operations
(1) Six months ended September 30, 2007Throughout the six months ended September 30, 2007, the Japanese economy continued to show a pattern of recovery
while concerns still remain over crude oil price trends and the impact of a slowdown in the U.S. economy. Intensifiedcapital investments due to improvement in corporate earnings, as well as steady consumer spending led by improvements inemployment, helped to support the Japanese economy. Looking overseas, in the U.S., instability in the financial marketscould have a negative impact on its economy, despite making sustained and moderate improvements. The Europeaneconomy showed steady performance supported by capital investments and exports.
In the video game industry, market expansion which had been led by handheld gaming machines is now expected to beaccelerated by the new console gaming hardware.
Under such circumstances, Nintendo has continued to execute its strategy of expanding the gaming audience andtherefore, has introduced unique products. "Nintendo DS" has gained wide-spread popularity with its software lineupknown as "Touch! Generations" by which Nintendo has expanded the definition of video games. In addition, Nintendo’sgaming console, "Wii", has been attracting all the members of family and has impacted how families view entertainment inthe household.
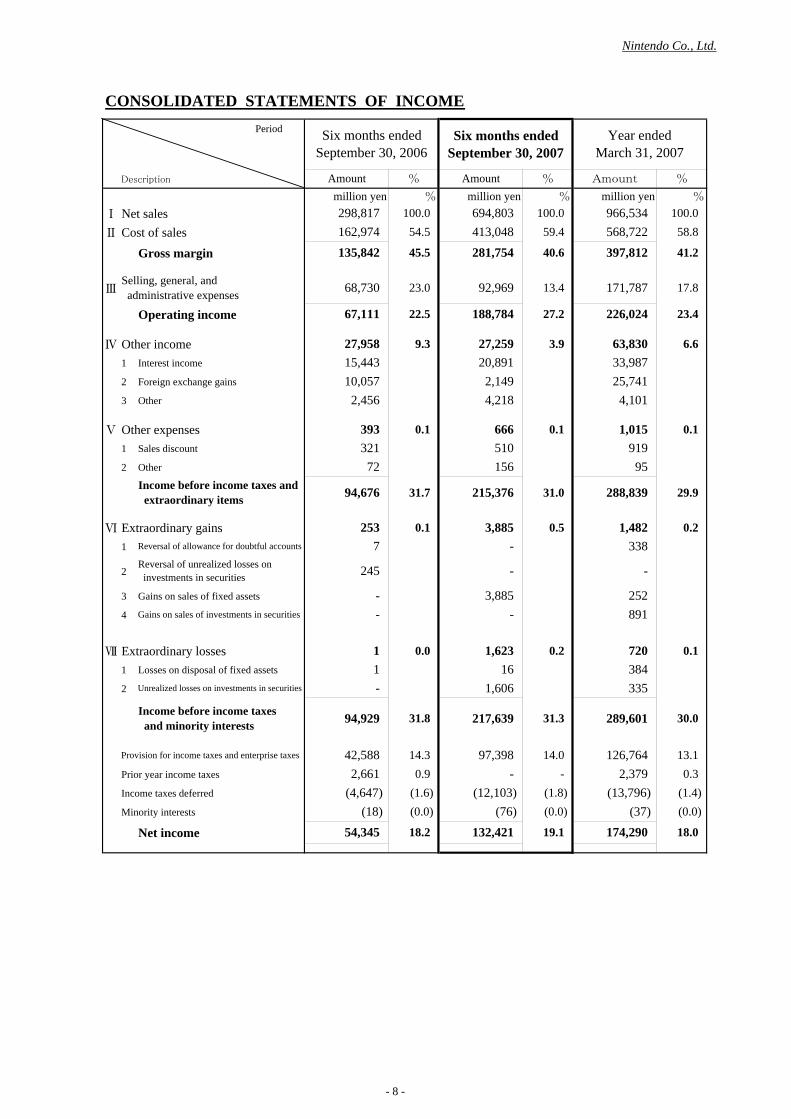
Consolidated net sales for the half year ended September 30, 2007 resulted in 694.8 billion yen, including overseas salesof 541.0 billion yen, which accounted for 77.9% of total sales. Income before income taxes and extraordinary items was215.3 billion yen. Net income was 132.4 billion yen.
With respect to sales by business category within the electronic entertainment products division, "Nintendo DS" hascontinued to enjoy favorable sales worldwide, reaching a total of 13.35 million units in these six months. As for "NintendoDS" software, for instance, "Pokémon Diamond and Pearl" was released overseas after a launch in Japan last year and solda total of 6.95 million units worldwide (12.17 million units life-to-date). In addition, both "Brain Age: Train Your Brain inMinutes a Day!" and the sequel version (which was released overseas during the half year) performed well, reaching a totalof 5.19 million units (17.19 million units life-to-date). In addition, a number of long-term selling titles such as"Nintendogs" and "New Super Mario Bros." contributed to handheld software sales growth in the six months endedSeptember 30, 2007.
As for the console business, "Wii" hardware sold a total of 7.33 million units in the first six months of the 2008 fiscalyear. "Wii" software, such as "Mario Party 8", (which consists of more than 70 mini-games that allow the player to operate"Wii Remote" in its unique ways), sold a total of 2.89 million units. "Wii Sports" and "Wii Play", released in the last fiscalyear, have continued to enjoy favorable sales as well. As a result, net sales in the electronic entertainment products divisionwere 693.2 billion yen, while sales in the other products division (playing cards, karuta, etc.) were 1.5 billion yen.
With respect to results by geographic segment, sales in Japan were 635.0 billion yen including inter-segment sales of475.1 billion yen. Operating income was 167.1 billion yen. Sales in the Americas were 268.4 billion yen including inter-segment sales of 1.0 billion yen. Operating income was 14.8 billion yen. Sales in Europe were 246.0 billion yen. Operatingincome was 23.7 billion yen.
(2) Outlook for fiscal year ending March 31, 2008Nintendo will continue to pursue expansion of the gaming population and offer various entertainment options that take
root in our daily lives using the "Wii". Nintendo will aim to integrate health in entertainment with the launch of health-oriented software "Wii Fit" by using the "Balance Wii Board" which will enable you to measure your body balance andassist in your personal fitness while having fun at the same time. Nintendo's goal is to achieve higher internet connectionrates and commence "WiiWare" which is to be purchased and downloaded as software for "Wii" exclusive use, offeringvarious games rich in ideas. Moreover, Nintendo expects to satisfy both novice and skilled gamers alike by releasing"Super Mario Galaxy" and other software to be released such as "Super Smash Bros. Brawl".
Capitalizing on the widespread installed base of "Nintendo DS", Nintendo will continue to introduce multiple softwarelineups that will attract wide ranging user demographics.
With regard to consolidated performance forecasts for the fiscal year ending March 31, 2008, net sales are projected toreach 1,550 billion yen, operating income 420 billion yen, income before income taxes and extraordinary items 460 billionyen, net income 275 billion yen. Exchange rates used for the forecast are 115 yen per U.S. dollar and 160 yen per Euro.
- 3 -

Nintendo Co., Ltd.
2. Financial Positions
Cash flows from operating activities:
Cash flows from investing activities:
Cash flows from financing activities:
Cash flow index trend
% % % % %
[Notes] Capital adequacy ratio: Total owners' equity and valuation and translation adjustments divided by Total assets Capital adequacy ratio at market value: Total market value of stocks divided by Total assets *Percentage figures are calculated on a consolidated basis.
3. Basic Policy of Profit Distribution and Dividends
*Total market value of stocks is calculated by multiplying closing price and the number of shares outstanding (excluding treasury stock) at the end of the period.
As ofSeptember 30, 2007
Capital adequacy ratio at market value
Capital adequacy ratio 88.1
139.1
As ofMarch 31, 2004
As ofMarch 31, 2005
As ofMarch 31, 2006
As ofMarch 31, 2007
460.9
69.4
278.0
69.9
194.0
83.9
134.4
81.4
Total assets increased overall by 83.6 billion yen compared to the previous fiscal year-end to 1,659.2 billion yen, due to anincrease in trade accounts receivable accelerated by strong sales and inventories for this holiday season sales even thoughcash and deposits decreased due to payments of income taxes and dividends. Total liabilities increased by 33.4 billion yencompared to the previous fiscal year-end to 506.9 billion yen, mainly due to an increase in expenses related to the growth insales. Net assets increased by 50.2 billion yen compared to the previous fiscal year-end to 1,152.2 billion yen, resultingfrom the fact that net income ended in 132.4 billion yen while dividends for the previous fiscal year amounted to 79.2billion yen.
The ending balance of "Cash and cash equivalents" (collectively, Cash) as of September 30, 2007 increased by 57.8billion yen compared to the previous fiscal year-end to 746.5 billion yen. Net increase (decrease) of Cash and contributingfactors during the six months period ended September 30, 2007 are as follows.
Net cash from operating activities increased by 25.8 billion yen, primarily due to the fact that income before incometaxes and minority interests ended in 217.6 billion yen, whereas notes and trade accounts receivable and inventoriesshowed gains and income taxes amounted to 96.3 billion yen.
Net cash from investing activities increased by 106.9 billion yen mainly resulting from the decrease in time depositsexceeding the increase.
Net cash from financing activities decreased by 79.5 billion yen mainly due to payments for cash dividends.
It is the Company's basic policy to internally provide the capital necessary to fund future growth, including capitalinvestments, and to maintain a strong and liquid financial position in preparation for changes in the business environmentand intensified competition. As for direct profit returns to our shareholders, dividends are paid based on profit levelsachieved in each fiscal period.
The annual dividend per share will be established at the higher of the amount calculated by dividing 33% of consolidatedoperating income by the total number of outstanding shares, excluding treasury stock, as of the end of the fiscal yearrounded up to the 10 yen digit, and the amount calculated based on the 50% consolidated net income standard rounded upto the 10 yen digit.
The interim dividend for the six months ended September 30, 2007 has been established at 140 yen as set forth in theinitial announcement. Dividend for the fiscal year ending March 31, 2008 will be 1,090 yen (interim : 140 yen, year-end :950 yen) if earnings are in line with the financial forecast herein.
Retained earnings are maintained for effective use in research of new technology and development of new products,capital investments and securing materials, enhancement of selling power including advertisement, and common stockbuyback whenever deemed appropriate.
[Note] Forecasts announced by the Company referred to above were prepared based on management's assumptions withinformation available at this time and therefore involve known and unknown risks and uncertainties. Please note such risksand uncertainties may cause the actual results to be materially different from the forecasts (earnings forecast, dividendforecast, and other forecasts).
- 4 -

Nintendo Co., Ltd.
COMPANY GROUP INFORMATION
MANAGEMENT POLICY
(Nintendo homepage)http://www.nintendo.co.jp/ir/en/index.html
Among Nintendo Co., Ltd. ("the Company") and its related companies, which are composed of the Company, twenty-twosubsidiaries, and eight affiliates as of September 30, 2007, the main business is manufacturing and distribution of electronicentertainment products.
1.Basic Management Policy and 2.Target Management Index are omitted since nothing significant has changed from the
ones set forth in the financial statements announced on June 29, 2007. Please refer to the following URL for further
information.
This information is omitted since nothing significant has changed from the one set forth in the Annual Securities Reportfiled on June 29, 2007.
3.Medium and Long Term Management Strategy and Challenges
Nintendo established its basic strategy of expanding the gaming audience some years ago after identifying that the marketwas stagnating due to the "Gamer Drift" phenomenon. Nintendo believed that the road to a bright future in the gamingindustry would be achieved through expanding the size of the gaming population. To achieve this, Nintendo is offeringbrand new entertainment that takes root in our daily lives by expanding the definition of video games for all of ourcustomers, regardless of age, gender or gaming experience.
“Nintendo DS” has been positioned as "a machine that enriches the owner's daily life". Nintendo has positioned “Wii” as"a machine that puts smiles on surrounding people's faces", encouraging communication among family members as each ofthem find something personally relevant and motivated to turn on the power every day in order to enjoy "the new life with ’Wii’".
In the challenging and competitive gaming industry, which consistently requires new and innovative products, it isessential for our human resources to be even more flexible and positive. By capitalizing on being the only hardwareplatform producer with powerful in-house software development teams, Nintendo will strive to expand its business andincrease revenue and profit while adding new ideas to gaming and, as a result, continuing the pursuit of Nintendo ’ sobjective of expanding the gaming population.
- 5 -

Nintendo Co., Ltd.
CONSOLIDATED BALANCE SHEETS
Date
Description Amount % Amount % Amount %
(Assets) million yen million yen million yen
Ⅰ Current assets1 Cash and deposits
2 Notes and trade accounts receivable
3 Securities
4 Inventories
5 Deferred income taxes
6 Other current assets
7 Allowance for doubtful accounts
Total current assets
Ⅱ Fixed assets1 Property, plant, and equipment
(1) Buildings and structures
(2) Land
(3) OthersTotal property, plant, and equipment
2 Intangible fixed assets
3 Investments and other assets
(1) Investments in securities
(2) Deferred income taxes
(3) Other investments and other assets
(4) Allowance for doubtful accountsTotal investments and other assets
Total fixed assets
Total assets
As of September 30, 2006
84,588
15,359
5,467
18,418
(2,022) 1,094,900 86.7
783,630
1,659,239 100.0 100.0 1,263,030
71,358
168,130
As of September 30,2007
13.3
56,549
11,132
111,060 (20)
519
57,154 58,270 28,634 97,873
962,197
92,412
6,981
1,394,673 (1,886)
57,600
18,433
115,757
93,434
174,170
3,900 (10)
912,668
89.5
152,494 122,444 135,485 45,520
119,013
1,485,069 (2,557)
11.5
100.0 1,575,597
122,818
32,663 31,520 32,595
505
10.5 180,924
As of March 31,2007
88.5
35,631 88,609
115,971
104,483
18,022
89,666
(10)
17,749
57,919 8,650
492
16,001 14,414
- 6 -

Nintendo Co., Ltd.
Date
Description Amount % Amount % Amount %million yen million yen million yen
Ⅰ Current liabilities1 Notes and trade accounts payable2 Accrued income taxes3 Reserve for bonuses4 Reserve for directors' bonuses5 Other current liabilities
Total current liabilities
Ⅱ Non-current liabilities1 Non-current accounts payable
2
Total non-current liabilities
Total liabilities
(Net assets)Ⅰ Owners' equity
1 Common stock2 Additional paid-in capital3 Retained earnings4 Treasury stock
Total owners' equityⅡ Valuation and translation adjustments
1 Unrealized gains on other securities
2 Translation adjustments
Ⅲ Minority interestsTotal net assetsTotal liabilities and net assets
5,971
1,102,018 121 0.0
1,152,250 69.4 138
0.7 15,331 12,794
10,065 11,586
1,220,293 (155,396)
1,273,414 (155,738)
1,575,597 1,659,239 100.0
1,086,549
8,898 6,432
1,139,335
6,822
1,263,030 100.0 78.3 0.0
989,319 157
130
Reserve for employees' retirement and severance benefits
273,711
268,722
4,989
863
4,125
(Liabilities)
As of September 30,2007
As of September 30, 2006
0.3
501,649
836
154,285 46,089
0.4
1,555
66,660
4,502
21.3
376 -
30.6 506,988
468,436
698
5,338 5,142
30.3 75,563 101,676
1,651 90,013 92,255
305,690
473,578
As of March 31,2007
4,443
1,779
68.7
301,080
Total valuation and translation adjustments
9,910 3,513
13,423
10,065 11,585
1.0
1,109,301 (155,214)
77.3
29.8
0.3
30.1
100.0
69.0
0.9
0.0 69.9
21.7
975,737
10,065 11,593
- 7 -
Nintendo Co., Ltd.
CONSOLIDATED STATEMENTS OF INCOMEPeriod
Description
million yen % million yen % million yen %
Ⅰ Net salesⅡ Cost of sales
Gross margin
Ⅲ
Operating income
Ⅳ Other income1 Interest income
2 Foreign exchange gains
3 Other
Ⅴ Other expenses1 Sales discount
2 Other
Ⅵ Extraordinary gains1
2
3 Gains on sales of fixed assets
4
Ⅶ Extraordinary losses1 Losses on disposal of fixed assets
2
Prior year income taxes
Income taxes deferred
Minority interests
Net income
%
Year endedMarch 31, 2007
Amount % Amount
694,803
%
100.0 298,817 100.0
Amount
54.5 162,974 135,842 45.5
13.4
188,784 27.2
59.4
40.6
413,048 281,754
92,969
510
27,259 3.9 20,891 2,149 4,218
666
3,885 0.5
156
215,376
3,885 -
31.3
0.2
217,639
14.0
132,421 19.1
(1.8) (0.0)
(12,103) (76)
-
1,623 16
1,606
97,398
22.5
0.1
15,443 10,057 2,456
393
31.7
253 0.1
72
94,676
54,345 18.2
(0.0) (1.6)
171,787
(4,647) (18)
94,929 31.8
42,588 14.3
1,482
100.0 568,722 58.8
397,812 41.2
966,534
6.6 33,987 25,741
17.8
23.4
63,830
226,024
0.1 919 95
288,839
2,379 0.3
-
30.0
252 891
126,764
720 384 335
18.0
(13,796) (37)
174,290
(1.4) (0.0)
13.1
289,601
1 0.0 1 -
2,661 0.9 -
Selling, general, and administrative expenses
Income before income taxes and extraordinary items
Reversal of allowance for doubtful accounts
Provision for income taxes and enterprise taxes
Six months endedSeptember 30, 2006
Six months endedSeptember 30, 2007
Income before income taxes and minority interests
Unrealized losses on investments in securities
Reversal of unrealized losses on investments in securities
Gains on sales of investments in securities
68,730
67,111
7
245
- -
321
27,958 9.3
23.0
-
-
4,101
1,015
338
31.0
0.1
29.9
0.2
0.1
- 8 -

Nintendo Co., Ltd.
CONSOLIDATED STATEMENT OF NET ASSETS
Six months period ended September 30, 2006 (April 1, 2006 - September 30, 2006)million yen
Owners' equity
Balance as of March 31, 2006Amount of changes in the six months period* Dividends from retained earnings* Directors' bonuses
Net incomePurchase of treasury stockDisposal of treasury stock
Total amount of changes in the six months period
Balance as of September 30, 2006
million yen
Balance as of March 31, 2006Amount of changes in the six months period* Dividends from retained earnings* Directors' bonuses
Net incomePurchase of treasury stockDisposal of treasury stock
Total amount of changes in the six months period
Balance as of September 30, 2006[Note] * Allocated at the annual general meeting of shareholders' held in June 2006.
(155,214)
(102) 0
-
(102)
-
- - - - 0
-
- - -
- -
0 11,585 10,065
Net amount of changes in the six months period other than owners' equity
Valuation and translation adjustments
Minority interests
Net amount of changes in the six months period other than owners' equity
-
-
-
-
-
176
(807)
- - - -
-
2,751
157
- - -
-
(18)
(18)
(102) 0
(185)
-
-
- -
13,227 13,125 975,737
-
- -
(40,932)
54,345
Treasury stock Totalowners' equity
1,096,073 (155,112) 962,611
Common stock Additionalpaid-in capital
Retainedearnings
10,065 11,585
9,910
Unrealized gainson
other securities
Translationadjustments
(807)
10,717 762
2,751 3,513
-
-
1,109,301
(40,932) (185)
54,345
- 9 -

Nintendo Co., Ltd.
CONSOLIDATED STATEMENT OF NET ASSETS
Six months period ended September 30, 2007 (April 1, 2007 - September 30, 2007)million yen
Owners' equity
Balance as of March 31, 2007Amount of changes in the six months period
Dividends from retained earningsNet incomePurchase of treasury stockDisposal of treasury stock
Total amount of changes in the six months period
Balance as of September 30, 2007
million yen
Balance as of March 31, 2007Amount of changes in the six months period
Dividends from retained earningsNet incomePurchase of treasury stockDisposal of treasury stock
Total amount of changes in the six months period
Balance as of September 30, 2007
1,139,335 (155,738)
(344) 2
(342)
- -
52,786
Unrealized gainson
other securities
Translationadjustments
8,898 6,432
Net amount of changes in the six months period other than owners' equity
Valuation and translation adjustments
Minority interests
Net amount of changes in the six months period other than owners' equity
- -
- 6 11,593
(2,075)
- - -
121
- - -
(17)
6,822 (2,075)
5,971
- - -
(461)
(461)
132,421 (344)
8
-
-
(17)
138
-
1,273,414
Common stock Additionalpaid-in capital
Retainedearnings
(79,299)
10,065 11,586
Treasury stock Totalowners' equity
1,220,293
(79,299) -
(155,396) 1,086,549
-
6 - -
-
10,065
- -
- -
-
132,421
53,121
-
-
- 10 -
Nintendo Co., Ltd.
CONSOLIDATED STATEMENT OF NET ASSETS
Year ended March 31, 2007 (April 1, 2006 - March 31, 2007)million yen
Owners' equity
Balance as of March 31, 2006Amount of changes in the fiscal year* Dividends from retained earnings
Dividends from retained earnings* Directors' bonuses
Net incomePurchase of treasury stockDisposal of treasury stock
Total amount of changes in the fiscal yearBalance as of March 31, 2007
million yen
Balance as of March 31, 2006Amount of changes in the fiscal year* Dividends from retained earnings
Dividends from retained earnings* Directors' bonuses
Net incomePurchase of treasury stockDisposal of treasury stock
Total amount of changes in the fiscal yearBalance as of March 31, 2007[Note] * Allocated at the annual general meeting of shareholders' held in June 2006.
124,219 1,220,293 10,065
8,898
Unrealized gainson
other securities
Translationadjustments
(1,819)
10,717 762
5,670
Common stock Additionalpaid-in capital
Retainedearnings
10,065 11,585
Treasury stock Totalowners' equity
1,096,073 (155,112) 962,611
-
-
-
- - - -
-
-
- - -
(8,953) (40,932)
- (185) -
(40,932)
174,290 (284)
2
(185) (8,953)
6,432
-
- - -
-
5,670
138
-
- - -
-
(37)
-
(37)
(1,819)
- - -
Net amount of changes in the fiscal year other than owners' equity
Valuation and translation adjustments
Minority interests
Net amount of changes in the fiscal year other than owners' equity
- -
- 1 11,586
-
-
174,290
-
- -
176
1 - -
-
123,937 1,086,549 (155,396)
(284) 1
(283)
- -
- 11 -

Nintendo Co., Ltd.
CONSOLIDATED STATEMENTS OF CASH FLOWS
Period
Description Amount Amount Amountmillion yen million yen million yen
Ⅰ Cash flows from operating activities: Income before income taxes and minority interestsDepreciation and amortizationIncrease (decrease) in allowance for doubtful accountsInterest and dividends income Interest expenses Foreign exchange losses (gains)
Decrease (increase) in notes and trade accounts receivable Decrease (increase) in inventories Increase (decrease) in notes and trade accounts payable Increase (decrease) in consumption taxes payable Other, net
Interest and dividends received Interest paid Income taxes paid
Net cash provided by (used in) operating activities
Ⅱ Cash flows from investing activities:Increase in time deposits Decrease in time deposits Payments for acquisition of securities Proceeds from sales and redemption of securities Payments for acquisition of property, plant and equipment Proceeds from sales of property, plant and equipment Payments for investments in securities Proceeds from sales and redemption of investments in securities Other, net
Net cash provided by (used in) investing activities
Ⅲ Cash flows from financing activities:Payments for acquisition of treasury stock Cash dividends paid Other, net
Net cash provided by (used in) financing activities Ⅳ
Ⅴ Net increase (decrease) of cash and cash equivalentsⅥ Cash and cash equivalents - BeginningⅦ Cash and cash equivalents - Ending 688,737
(50,137) 21,704 71,597
617,139
(282) (49,857)
2
(174,603)
(6,144) 372
(52,069) 6,173
651,372 (112,957) 117,001
(1,485)
274,634
(776,866)
338,037 32,921
(0) (96,324)
(54,669) 168,070
3,416 24,707
(798)
(42,687)
(34,510) 0
(21,375)
Year EndedMarch 31, 2007
289,601 5,968
313
617,139 (36,304)
580,835 746,557
57,820 688,737
4,509 (79,533)
(25,485)
(110) (344)
(40,994) 2
(267) 106,995
336 1,207
(14,327) -
(30,930) 4,888
(1,160) 7
(4,037)
(319,182) 328,775 (51,254)
(285,373)
19,993 25,848
472
(10,006) (1,051)
(15,707) 0 0
(21,122)
Effect of exchange rate changes on cash and cash equivalents
0 (40,884)
10,182
(2,424)
108,678
429,477 (133,855)
(1,279) 18,633
(4,136)
(96,379)
(62,915) (45,850)
(26,007) (26,334)
Six months endedSeptember 30, 2006
Six months endedSeptember 30, 2007
Sub-total20,561 15,012
72,904 101,667
Equity in losses (earnings) of non-consolidated subsidiary and affiliates
699
(1,292)
2,032 94,929
3,474 217,639
36,179 794
17,844
48,528
(67,924) (0) (0)
(79,190)
- 12 -

Nintendo Co., Ltd.
CHANGES ON THE BASIS OF CONSOLIDATED FINANCIAL STATEMENTS PREPARATION
(Changes in accounting policies)
(Depreciation procedure for important depreciable assets)
(Addtional information)
NOTES PERTAINING TO CONSOLIDATED FINANCIAL STATEMENTS
(Consolidated balance sheets information)million yen million yen million yen
As of September 30, 2006 As of September 30, 2007 As of March 31, 2007
(Consolidated statements of cash flows information)
Reconciliation between cash and cash equivalents - ending and the amount shown on consolidated balance sheets
million yen million yen million yenAs of September 30, 2006 As of September 30, 2007 As of March 31, 2007
Cash and deposits accountTime deposits (over 3 months)
Cash and cash equivalents - Ending
a. Notes pertaining to consolidated balance sheets, statements of income, statements of net assets, and statements of cash flows
Accumulated depreciation of property, plant, and equipment 40,642 46,201 43,265
580,835 746,557 688,737
962,197 912,668 783,630 (225,718) (225,308) (360,838)
Short-term investments due within 3 months after aquisition 22,923 59,198 87,378
Effective as of the consolidated accountingperiod ended September 30, 2007, the Company and its
domestic subsidiaries have changed their depreciation procedure based on an amendment in
corporation tax law (partial amendment in income tax law No. 6 dated March 30, 2007 and partial
amendment in income tax law enforcement order No. 83 dated March 30, 2007) for the tangible
assets acquired on and after April 1, 2007. The impact on operating income, income before income
taxes and extraordinary items, and income before income taxes and minority interests is minor.
As for tangible assets acquired on and before March 31, 2007, differences between 5% equivalent
of acquisitionprice and memorandumvalue are equally depreciated over 5 years from the year after
tangible assets are thoroughly depreciated to the limits of depreciable amount. The impact on
operating income, income before income taxes and extraordinary items, and income before income
taxes and minority interests is minor.
- 13 -

Nintendo Co., Ltd.
b. Segment Information
1. Segment Information by Business Categories
2. Segment Information by Seller's LocationSix months period ended September 30, 2006 million yen
Net sales(1)(2)
Total
Operating income
Six months period ended September 30, 2007 million yen
Net sales(1)(2)
Total
Operating income
Year ended March 31, 2007 million yen
Net sales(1)(2)
Total
Operating income
3. Overseas salesSix months ended September 30, 2006 million yen
The Americas Europe Other TotalⅠ Overseas sales ………………………………………………………Ⅱ Consolidated net sales ………………………………………………Ⅲ Ratio of overseas sales to consolidated net sales ……………………
Six months ended September 30, 2007 million yenThe Americas Europe Other Total
Ⅰ Overseas sales ………………………………………………………Ⅱ Consolidated net sales ………………………………………………Ⅲ Ratio of overseas sales to consolidated net sales ……………………
Year ended March 31, 2007 million yenThe Americas Europe Other Total
Ⅰ Overseas sales ………………………………………………………Ⅱ Consolidated net sales ………………………………………………Ⅲ Ratio of overseas sales to consolidated net sales ……………………
966,534 36.5% 27.5% 2.5% 66.5%
353,242 266,205 23,602 643,050
(552,418) 740,509 212,240 14,378 16,952 (98) 243,472 (17,448) 226,024
Operating expenses 686,529 340,345 249,219 898,770 354,723 266,171 16,735
966,534 Inter-segment sales 567,384 2,345 15 121 569,866 (569,866) - Sales to third parties 331,385 352,377 266,156
Inter-segment sales
3,046
14,861 167,177
59.4%
177,641 298,817
31.2% 26.1%
2.1%
93,150 78,051 6,439
-
188,784
Japan
161,919
0 119 694,803
TheAmericas Europe Other
77.9%
TotalEliminations
orcorporate
Consolidated
1,536,401 (569,866) 966,534
966,534 -
3.9%
541,012 694,803
27,016 267,893 246,101
207,683 963,475
1,917 23,727
38.6% 35.4%
16,614
16,833 1,292,928
Japan Europe Other
21,442
3,519 286,393 94,031 78,043
69,605 3
(18,898)
Consolidated
67,111
694,803 (476,355) -
298,817
298,817 -
231,705
TotalEliminations
orcorporate
(163,171)
72,623
(163,171)
(157,659) (5,511)
298,817
389,364 461,988
Eliminationsor
corporate
(476,355) 694,803
-
TheAmericas
Europe Other Total
163,171 40 2 1,207
94,028 74,996
506,018
Operating expenses
Japan TheAmericas
Consolidated
19,644 268,456
216,788
1,059
Operating expenses (457,456) 635,055 246,085
476,355 1,171,158 21,561
92,823 124,474 Sales to third parties
467,878 253,595
Sales to third parties 159,878 267,397 Inter-segment sales 475,176
3,478 78,040
222,357
246,084
3,551 (32)
Considering similarities of categories, characteristics, manufacturing method, or sales market of what Nintendo deals in, the electronic
entertainment product segment accounts for over 90% of total sales and operating income of all business category segments, with no
other segments to be reported on the basis of disclosure rules. Therefore, this information is not applicable to Nintendo's business.
- 14 -
Nintendo Co., Ltd.
NON-CONSOLIDATED BALANCE SHEETS
Date
Descriptionmillion yen million yen million yen
Ⅰ Current assets1 Cash and deposits2 Notes receivable3 Trade accounts receivable4 Inventories5 Deferred income taxes6 Other current assets7 Allowance for doubtful accounts
Total current assets
Ⅱ Fixed assets1 Property, plant and equipment
(1) Buildings(2) Land(3) OthersTotal property, plant and equipment
2 Intangible assets
3 Investments and other assets(1) Investments in securities(2) Investments in affiliates(3) Deferred income taxes(4)(5) Allowance for doubtful accountsTotal investments and other assets
Total fixed assets
Total assets
13.6
100.0
Amount
796,140 1,517
192,654
As of March 31,2007
%
148,322
25,077
86.4
32,604
20,234
3,632
22,002
(2)
12,631
1,180,869
84,992
Other investments and other assets
100.0 1,078,404
14,067
100.0
174,741
(Assets)
87.4 83.8
113,866
(3)
25,077
41,341
10,434 15,697
(10) 143,719 185,398
337
1,366,267
12.6 176,351
1,400,267
3,985 41,414
84,090 32,791
308
(10) 134,628
As of September 30,2007
Amount
735,344
140,969 24,265
%
362 288,138 34,839
1,223,916
12,351
2,668
3,689
40,529
16.2
32,487
25,184
459
76,992
133,752
9,102 17,436 (2,266)
98,625
20,482
903,662
12,676
(6)
17,559
As of September 30,2006
Amount
650,623 2,511
%
- 15 -
Nintendo Co., Ltd.
Date
Descriptionmillion yen million yen million yen
Ⅰ Current liabilities1 Notes payable2 Trade accounts payable3 Other accounts payable4 Accrued income taxes5 Reserve for bonuses6 Reserve for directors' bonuses7 Other current liabilities
Total current liabilities
Ⅱ Non-current liabilities1 Non-current accounts payable
Total non-current liabilities
Total liabilities
(Net assets)Ⅰ Owners' equity
1 Common stock2 Additional paid-in capital
(1) Capital reserve(2) Other additional paid-in capitalTotal additional paid-in capital
3 Retained earnings(1) Legal reserve(2) Other retained earnings
Special reserveGeneral reserve
Total other retained earningsTotal retained earnings
4 Treasury stockTotal owners' equity
Ⅱ1 Unrealized gains on other securities
Total net assetsTotal liabilities and net assets 1,078,404 100.0 1,400,267 100.0
0.5 8,895 0.6
852,378 79.0 975,302 69.7 947,076 69.3
Total valuation and translation adjustments 9,909 0.9 6,821
Valuation and translation adjustments 9,909 6,821 8,895
Unappropriated retained earnings 209,368 1,100,044 1,069,408
240,003 973,516 113,473
40 860,000 860,000
40 860,000
42
11,584
2,516 2,516
1 11,585
2,516
2 11,586
9 11,593
1,071,925
938,181 68.7
1,366,267 100.0
(155,396)
0.1
30.7
As of March 31,2007
%
8,919 287,029 21,837
-
30.6
11,584
%
30.3 424,288
%
17,937 225,180
10,065
21,421
676
424,965
As of September 30,2006
845
226,025
20,650
Amount
78,294 1,779
8,463
1,628 77,687
As of September 30,2007
30.3
292,477
370 22,239
0.0 676
21.0
Amount
1,555 130
845
11,584
15,023
0.1
38,985
20.9
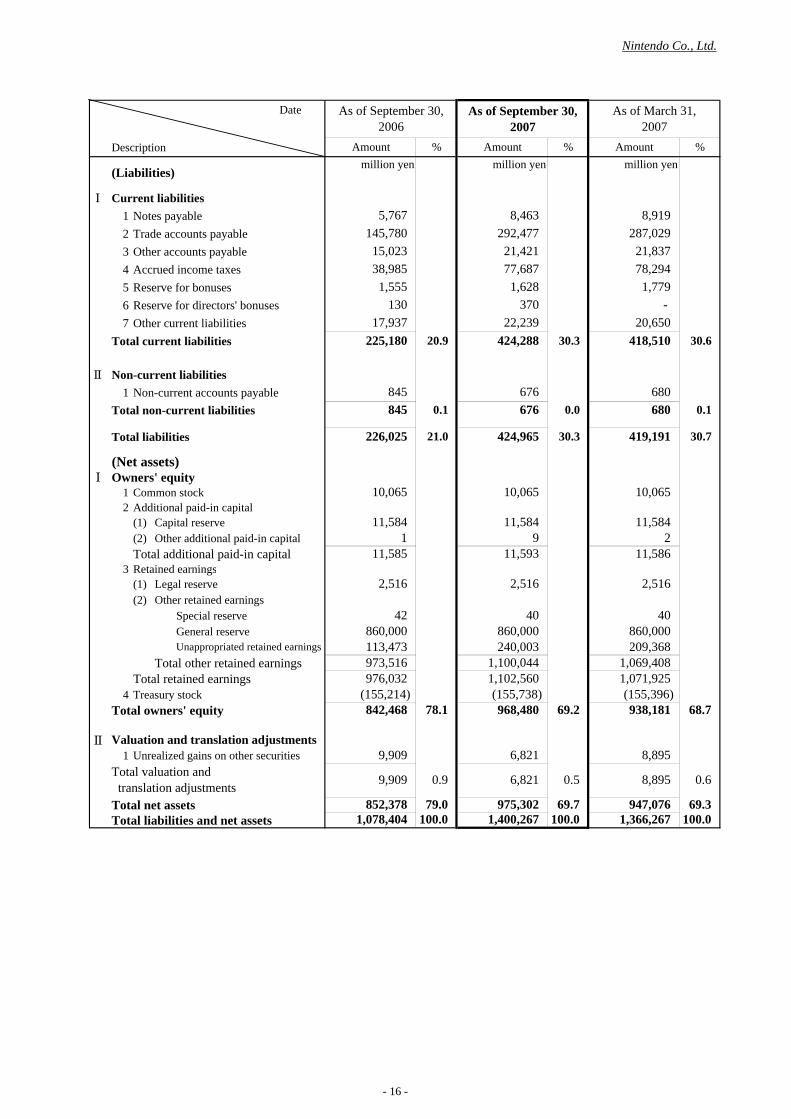
(Liabilities)
Amount
5,767 145,780
(155,214) 842,468 78.1
418,510
680
10,065 10,065
680
419,191
976,032
69.2
1,102,560 (155,738) 968,480
- 16 -

Nintendo Co., Ltd.
NON-CONSOLIDATED STATEMENTS OF INCOME
Period
Descriptionmillion yen million yen million yen
Ⅰ Net salesⅡ Cost of sales
Gross margin
Ⅲ
Operating income
Ⅳ Other income1 Interest income2 Foreign exchange gains3 Other
Ⅴ Other expenses1 Sales discount2 Other
Ⅵ Extraordinary gains
Ⅶ Extraordinary losses
Prior year income taxesIncome taxes deferred
Net income
17,798 1.9 17,798 6.2 - -
5,236
10.0 89,843
24,055
23.6
52,423 5.8
23,131
212,288
Six months endedSeptember 30, 2006
0.5
(4,478) 109,935 37,897
Amount
24.3
% Amount
13,094
634,996
591
177,659
39,006
286,393
108,734 428,697
100.0 62.0
13.7
625
-
206,299
69,727
34
38.0
0.3
45
2,877 3,923
Six months endedSeptember 30, 2007
Year EndedMarch 31, 2007
0.1
166,987 26.3
19,895 3.1
6.2 39,312
%Amount
67.5 32.5
100.0
-
0.2 29.1
%
8.3
10,174 1,962
0.2
(2,290)
1,553
12.5
32.2
13.6
92,171 184,596
79,140
1,660
(0.7)
112,221 12.5
0.2
100.0 596,507 66.4 302,132 33.6
898,639
1,308
2,067 29.5
4,056 0.4
265,392
0.1
32.4 92,923
11,495
1,233
29.3 263,403 29.3 186,257
75
15.9 (7,371)
13.2 (0.8)
142,743 (0.8)
17.3
Income before income taxes
Provision for income taxes and enterprise taxes 38,765
Selling, general, and administrative expenses
Income before income taxes and extraordinary items
436
23,632
390
801
- 17 -
<Appendix> Nintendo Co., Ltd.
NON-CONSOLIDATED STATEMENT OF NET ASSETSSix months period ended September 2006 (April 1, 2006 - September 30, 2006)
million yenOwners' equity
Additional paid-in capital
Balance as of March 31, 2006
* Reversal of special reserve* Dividends from retained earnings* Directors' bonuses* General reserve
Net incomePurchase of treasury stockDisposal of treasury stock
Balance as of September 30, 2006
million yen
Owners' equity
Retained earningsOther retained earnings
Balance as of March 31, 2006
* Reversal of special reserve* Dividends from retained earnings* Directors' bonuses* General reserve
Net incomePurchase of treasury stockDisposal of treasury stock
Balance as of September 30, 2006[Note] *Allocated at the annual general meeting of shareholders' held in June 2006.
42
(2)
-
Valuation and translationadjustments
-
845,785
11,584
(155,112) 166,686
2,516
-
-
-
-
- (2)
-
- -
-
-
-
0
- - - - -
- - - -
- -
- 0
1
Unappropriatedretained earnings
Legal reserve
0 -
- -
810,000 2,516 44
- -
Other additionalpaid-in capitalCapital reserve
-
- 2
(40,932)
General reserve
Treasurystock
Totalowners'equity
10,065
Amount of changes in the six months period
- -
Common stock
10,065
-
11,584
-
Amount of changes in the six months period
Total amount of changes in the six months period
Total amount of changes in the six months period
Net amount of changes in the six months period other than owners' equity
Net amount of changes in the six months period other than owners' equity
- - -
- - -
(50,000) 37,897
-
- 50,000
- -
-
- - -
-
- -
50,000
860,000 842,468 (155,214) 113,473
(53,212)
37,897 (102)
(806)
0
(3,316) (102)
(806)
-
0 (102)
-
-
(180) -
Special reserve
- (40,932)
- -
(180) -
9,909
Unrealized gains onother securities
- - - -
10,716
-
-
- 18 -

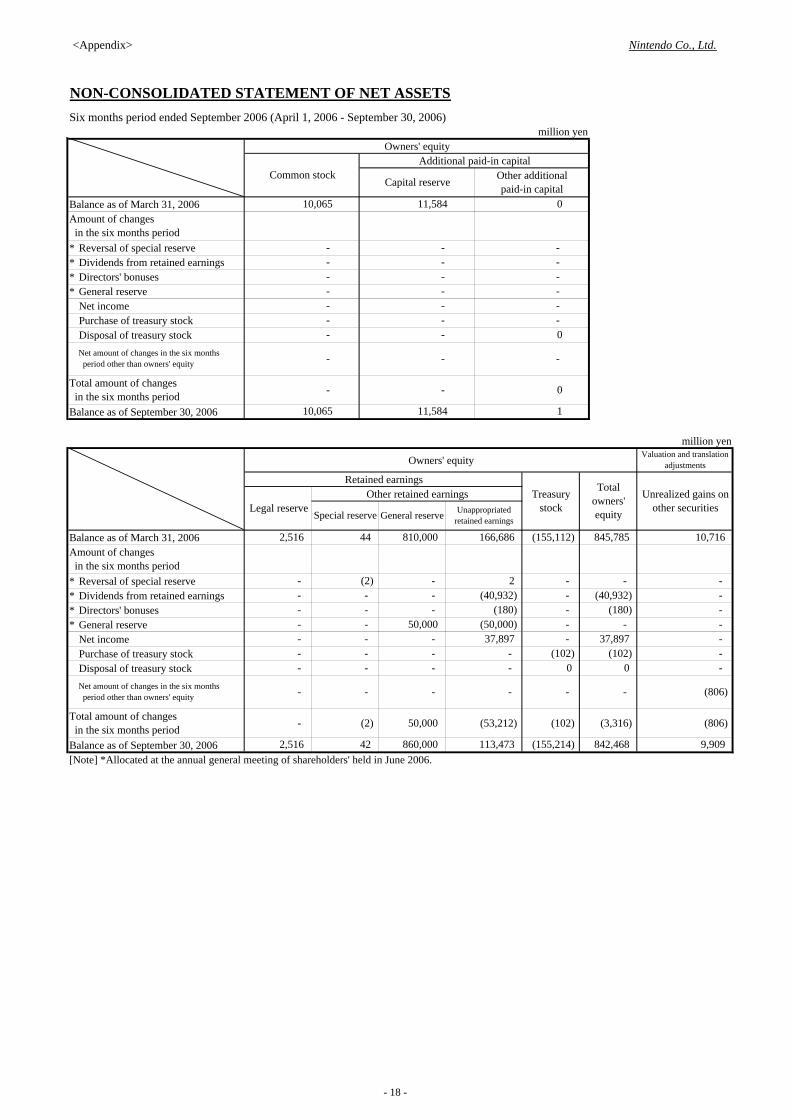
<Appendix> Nintendo Co., Ltd.
NON-CONSOLIDATED STATEMENT OF NET ASSETSSix months ended September 2007 (April 1, 2007 - September 30, 2007)
million yenOwners' equity
Additional paid-in capital
Balance as of March 31, 2007
Dividends from retained earningsNet incomePurchase of treasury stockDisposal of treasury stock
Balance as of September 30, 2007
million yen
Owners' equity
Retained earningsOther retained earnings
Balance as of March 31, 2007
Dividends from retained earningsNet incomePurchase of treasury stockDisposal of treasury stock
Balance as of September 30, 2007
-
Valuation and translationadjustments
(79,299) -
938,181
11,584
(155,396) 209,368
6
Totalowners'equity
2,516
- -
-
-
-
40
-
-
-
- -
-
10,065
-
-
- 6
2 11,584
- -
10,065 9
Unappropriatedretained earnings
Legal reserve
860,000
-
-
Special reserve General reserve
Treasurystock
-
- -
-
Net amount of changes in the six months period other than owners' equity
Total amount of changes in the six months period
Common stock Other additionalpaid-in capitalCapital reserve
-
-
2,516 40
(79,299)
Amount of changes in the six months period
Amount of changes in the six months period
Total amount of changes in the six months period
Net amount of changes in the six months period other than owners' equity
- 109,935 - -
- -
- - -
- - - -
2
-
860,000 968,480 (155,738) 240,003
30,635 30,299 (342)
Unrealized gains onother securities
- - -
8,895
(2,073)
(2,073)
-
6,821
109,935 (344)
-
8 (344)
-
- 19 -

<Appendix> Nintendo Co., Ltd.
NON-CONSOLIDATED STATEMENT OF NET ASSETSYear ended March 2007 (April 1, 2006 - March 31, 2007)
million yenOwners' equity
Additional paid-in capital
Balance as of March 31, 2006
* Reversal of special reserveReversal of special reserve
* Dividends from retained earningsDividends from retained earnings
* Directors' bonuses* General reserve
Net incomePurchase of treasury stockDisposal of treasury stock
Balance as of March 31, 2007
million yen
Owners' equity
Retained earningsOther retained earnings
Balance as of March 31, 2006
* Reversal of special reserveReversal of special reserve
* Dividends from retained earningsDividends from retained earnings
* Directors' bonuses* General reserve
Net incomePurchase of treasury stockDisposal of treasury stock
Balance as of March 31, 2007[Note] *Allocated at the annual general meeting of shareholders' held in June 2006.
-
8,895
Unrealized gains onother securities
- - - -
10,716
-
- -
-
(180) -
Special reserve
-
(40,932)
-
- -
142,743 (284)
(1,821)
1
92,395 (283)
(1,821)
-
2 (284)
- -
50,000
860,000 938,181 (155,396) 209,368
42,681
-
- - -
(180) (50,000) 142,743
-
-
- - -
- 50,000 - - -
-
Amount of changes in the fiscal year
Total amount of changes in the fiscal year
Total amount of changes in the fiscal year
Net amount of changes in the fiscal year other than owners' equity
Net amount of changes in the fiscal year other than owners' equity
- -
Amount of changes in the fiscal year
- -
Common stock Other additionalpaid-in capitalCapital reserve
-
- - -
- (2)
-
-
-
-
-
-
810,000
-
2,516 44
(8,953) -
2
(40,932)
- 2 -
General reserve
Treasurystock
Totalowners'equity
10,065 2
Unappropriatedretained earnings
Legal reserve
1 -
- -
- -
- -
- -
10,065
-
- 1
0
-
-
-
11,584
-
-
-
- (2)
-
- -
-
-
-
2,516
- -
-
-
-
40
(4)
-
Valuation and translationadjustments
(8,953) - -
845,785
-
11,584
(155,112) 166,686
- 20 -

Nintendo Co., Ltd.
Others
(1)Consolidated sales information million yen
HardwareHandheldConsoleOthers
Hardware totalSoftware
HandheldConsole
Royalty, content income, etc.Software total
Electronic entertainment products totalOther Playing cards, Karuta, etc.
Total
(2)Other consolidated information million yen
Capital investments
Depreciation expenses of tangible assets
Research and development expenses
Marketing expenses
Foreign exchange gains
Foreign exchange losses
Number of employees (At year-end)
Average exchange rates 1 US $ =
1 Euro =
(3)Balance of assets in major foreign currencies without exchange contracts (Non-consolidated) million U.S. dollars / eurosAs of September 30, 2006 As of September 30, 2007 As of March 31, 2007 As of March 31, 2008
Balance Balance Balance Estimated exchange rates
US $ Cash and deposits 1 US $ = 1 US $ = 1 US $ = 1 US $ =Trade accounts receivable
Euro Cash and deposits 1 Euro = 1 Euro = 1 Euro = 1 Euro =Trade accounts receivable
(Note) Trade accounts payable as of September 30, 2007 : 293 million U.S. dollars.
379,578 964,379
2,154 966,534
271 149.77 yen
Year endedMarch 31, 2007
374,063 156,478
54,258 584,800
291,916 82,361
5,301
499 117.90 yen752
115.38 145.97
Exchange rate
2,934
28,178 10,057
- 3,257
Six months endedSeptember 30, 2006
4,025 1,961
19,156
157.33 yen
118.05 yen
160.00 yen
155,696 3,814
Six months endedSeptember 30, 2007
Year endedMarch 31, 2007
Year endingMarch 31, 2008 (forecast)
10,684 1,108
129,346
210,793
Business category Main products Six months endedSeptember 30, 2006
Six months endedSeptember 30, 2007
Electronicentertainment
products
9,096 168,607
117,554
200,928 40,966
452,687
152,528 83,008
5,074 240,611 693,299
1,503 694,803
5,160 11,232
297,954 862
298,817
3,358 18,084 46,335
2,149 -
3,586 119.34
25,741 -
3,373 117.02
10,000 6,500
45,000 115,000
Exchange rate
5,093 37,725 82,339
- 9,000
- 117.17 161.15
2,592 1,130
2,940 779
162.31 150.09
115.00 yen
Exchange rate
693 522
972 862 163.38 yen
115.43 yen
- 21 -

Nintendo Co., Ltd.(4) Consolidated sales units, number of new titles, and sales unit forecast
Sales units in ten thousandsNumber of new titles released
Actual Actual Life-to-date ForecastApr.-Sept. '06 Apr.-Sept. '07 Sept. '07 Apr. '07-Mar. '08
Game Boy Advance Hardware JapanThe Americas
OtherTotal
of which Game Boy Advance SP JapanThe Americas
OtherTotal
Software JapanThe Americas
OtherTotal
New titles JapanThe Americas
Other Nintendo DS Hardware Japan
The AmericasOtherTotal
of which Nintendo DS Lite JapanThe Americas
OtherTotal
Software JapanThe Americas
OtherTotal
New titles JapanThe Americas
Other Nintendo GameCube Hardware Japan
The AmericasOtherTotal
Software JapanThe Americas
OtherTotal
New titles JapanThe Americas
Other Wii Hardware Japan
The AmericasOtherTotal
Software JapanThe Americas
OtherTotal
New titles JapanThe Americas
Other
[Notes]1 New titles-Other include new titles in the European and Australian markets.2 Actual sales units of software include quantity bundled with hardware.3
1,673 100 55 4,165
8 7
58 39 2,210 166 102 8,048
6 0 651
51 36 1,231 100 54 2,401
156 90 4,282 170 22 7,259
455 129 8,660 1,355 487 21,344
1,000 14 - 786
1,980 638 37,263
52 11 915 75 18 1,010
461 368 1,971 240 432 1,606 309 535 1,788
1,009 1,335 5,364 2,800 440 368 1,316 223 432 1,073 186 507 1,104 848 1,307 3,493
2,064 2,001 9,513 1,194 2,440 8,242 1,059 3,109 8,193 4,316 7,550 25,948 16,500
100 207 652 52 121 393 47 138 400
2 0 402 27 8 1,288
6 0 476
788 166 13,778
35 8 2,166 30 6 2,747
14 4,248 898 185 20,774 250
80
6 - 275 28 3 552 14 1 453
- 167 367 - 309 546 - 257 404 - 733 1,317 1,750 - 577 1,190 - 1,900 3,349 - 1,220 2,043 - 3,697 6,581 9,700 - 36 74 - 67 114
Software forecast figures do include quantity bundled with hardware for the results ended September 30, 2007, however,software forecast figures in and after October 2007 do not include quantity bundled with hardware.
- 47 92
- 22 -