construction engineering research laboratory · crystal driver, robert fulton, jennifer ollero,...
TRANSCRIPT

Approved for public release; d
ERD
C/C
ERL
TR-0
5-5
Inhalation Toxicity of Cogenerated Graphite Flake and Fog Oil Smoke in the Brown-headed Cowbird and the Red-winged Blackbird, Size-specific Inhalation Surrogates for the Red-cockaded Woodpecker Crystal Driver, Robert Fulton, Jennifer Ollero, Mark Clark, Gary Dennis, Brett Tiller, and Harold E. Balbach
January 2005
Con
stru
ctio
n E
ngin
eeri
ng
Res
earc
h La
bora
tory
istribution is unlimited.


ERDC/CERL TR-05-5January 2005
Inhalation Toxicity of Cogenerated Graphite Flake and Fog Oil Smoke in the Brown-headed Cowbird and the Red-winged Blackbird, Size-specific Inhalation Surrogates for the Red-cockaded Woodpecker Crystal Driver, Robert Fulton, Jennifer Ollero, Mark Clark, Gary Dennis, and Brett Tiller Pacific Northwest National Laboratory PO Box 999 902 Battelle Boulevard Richland, WA 99352 Harold E. Balbach Construction Engineering Research Laboratory PO Box 9005 Champaign, IL 61826-9005
Final Report Approved for public release; distribution is unlimited.
Prepared for Strategic Environmental Research and Headquarters, U.S. Army and Development Program Forces Command Arlington, VA 22203 Fort McPherson, GA 30330
Under CS-507: Threatened, Endangered, and Sensitive Resources

ABSTRACT: The red-cockaded woodpecker (Picoides borealis) is an endangered species found on many installations where troop readiness training is conducted. Conducting maneuvers under obscurant cover is important for realistic training. Generators that combine fog oil for visual obscuration with graphite flakes for infrared obscuration are being deployed for training scenarios. The effect of this combination on avian species was unknown. Our data indicate that toxicity of inhaled and/or preened graphite flake and cogenerated graphite flake and fog oil is low and similar to controls for adult cowbird and blackbird surrogates for the red-cockaded woodpecker. No mortality, body weight loss, clinical signs of toxicity, or respiratory function deficits were observed in the graphite flake-only, or cogenerated graphite flake/fog oil-treated birds when compared to controls. Hematological response was normal and no toxic effects in eryth-rocytes or leukocytes were found. White blood cell counts, spleen weights, and incidence of parasitism and disease were indicative of normal immune function in all treatments. Because repeated exposure that may result in particle overload in the lung has the greatest potential for causing harm to birds, it is suggested that exposures to high concentrations of the aerosol-graphite mixture be limited to fewer than eight within any 2-month period.
DISCLAIMER: The contents of this report are not to be used for advertising, publication, or promotional purposes. Citation of trade names does not constitute an official endorsement or approval of the use of such commercial products. All product names and trademarks cited are the property of their respective owners. The findings of this report are not to be construed as an official Department of the Army position unless so designated by other authorized documents. DESTROY THIS REPORT WHEN IT IS NO LONGER NEEDED. DO NOT RETURN IT TO THE ORIGINATOR.

This report was prepared as an account of work sponsored by an agency of the United States Government. Neither the United States Government nor any agency thereof, nor Battelle Memorial Institute, nor any of their employees, makes any warranty, express or implied, or assumes any legal liability or responsibility for accuracy, completeness, or usefulness of any information, apparatus, product, or process disclosed, or represents that its use would not infringe privately owned rights. Reference herein to any specific commercial product, process, or service by trade name, trademark, manufacturer, or otherwise does not necessarily constitute or imply its endorsement, recommendation, or favoring by the United States Government or any agency thereof, or Battelle Memorial Institute. The views and opinions of authors expressed herein do not necessarily state or reflect those of the United States Government or any agency thereof.
Prepared for the U.S. Department of Energy under a related services contract for the U.S. Army Forces Command.

iv ERDC/CERL TR-05-5
Contents
List of Figures and Tables .............................................................................................................. vi
Conversion Factors....................................................................................................................... viii
Preface............................................................................................................................................... ix
1 Introduction ................................................................................................................................ 1 Background......................................................................................................................... 1 Objective............................................................................................................................. 2 Scope.................................................................................................................................. 3 Approach ............................................................................................................................ 3 Mode of Technology Transfer ............................................................................................. 4
2 Methods....................................................................................................................................... 5 Test Animals........................................................................................................................ 5
Source and Husbandry of Test Animals......................................................................................... 7 Bird Identification and Group Assignment...................................................................................... 7
Exposures........................................................................................................................... 8 Test Material .................................................................................................................................. 9 Exposure Chambers.................................................................................................................... 10 Aerosol Generation...................................................................................................................... 12 Exposure Characterization .......................................................................................................... 16 Fog Oil Deposition on Feathers ................................................................................................... 18 Estimate of Graphite Flake Ingested by Cowbirds.......................................................................19 Estimate of Graphite Flake Deposition in Lung............................................................................ 19
Response Measures......................................................................................................... 20 Mortality and Clinical Signs of Toxicity and/or Stress................................................................... 20 Gross Lesions and Histopathology .............................................................................................. 20 Clinical Pathology - Hematology and Blood Chemistry................................................................ 21 Body Weight and Organ Mass.....................................................................................................22 Behavior ...................................................................................................................................... 22
Weather Measurements ................................................................................................... 23
3 Results and Discussion ..........................................................................................................24 Exposure Characterization ............................................................................................... 24
Graphite Flake and Fog Oil Concentration and Droplet Size....................................................... 24

ERDC/CERL TR-05-5 v
Elemental Composition of Graphite Flake ................................................................................... 29 Concentration of Polynuclear Aromatic Hydrocarbons in Fog Oil Aerosols ................................. 30 PAH Deposition on Feathers and Estimated Oral Dose .............................................................. 31 Estimate of Oral Exposure to Graphite Flake .............................................................................. 32 Estimate of Inhalation Dose of Graphite Flake ............................................................................ 33
Response Measures......................................................................................................... 34 Mortality, Clinical Signs of Toxicity, and Behavioral Abnormalities ............................................... 34 Gross Pathology .......................................................................................................................... 35 Histopathology............................................................................................................................. 38 Clinical Pathology ........................................................................................................................ 45 Body Weight ................................................................................................................................ 49 Organ Weight .............................................................................................................................. 51 Weather Conditions ..................................................................................................................... 52
4 Conclusions..............................................................................................................................53
References.......................................................................................................................................55
Report Documentation Page.........................................................................................................62

vi ERDC/CERL TR-05-5
List of Figures and Tables
Figures
1. Exposure system used for testing the effects of fog oil and graphite flake aerosols on avian health. ......................................................................................................... 11
2. Cowbirds in test chamber prior to initiation of aerosol exposure studies.......................... 12 3. The TSI Model 3400 Fluidized Bed Aerosol Generator used to deliver graphite flake
aerosol to the exposure chamber.............................................................................. 13 4. The fog oil generator used to flash vaporize oil which is delivered to a buffer volume
(35-gallon drum), then directed as an aerosol to the manifold and test chambers................................................................................................................... 14
5. A schematic of the temperature controlled fog oil aerosol generator used in conjunction with the graphite flake generator for mixed aerosols............................. 15
6. Relationship between millivolt readings of the optical dust sensor and the mass of fog oil collected on glass fiber filters. ........................................................................ 17
7. Fog oil and graphite flake aerosol collected on cascade impactor filter inserts................ 17 8. Particle size distribution of fog oil smoke. ......................................................................... 26 9. Particle size distribution of graphite flake.......................................................................... 27 10. Aerosol size distribution of cogenerated graphite flake and fog oil smoke. .................... 27 11. Size distribution of fog oil droplets and graphite flake in cogenerated aerosol. .............. 28 12. Graphite flake in feces of a cowbird................................................................................ 33 13. The cumulative probability of capturing a given treated cowbird with respect to five
capture order categories. .......................................................................................... 35 14. Liver tissue from a control cowbird showing multifocal granulomatous hepatitis. .......... 39 15. Mild coccidiosis in the intestines of a cowbird................................................................. 40 16. Biliary hyperplasia in liver of a red-winged blackbird. ..................................................... 41 17. Anthracosis of blackbird lung. ......................................................................................... 43
Tables
1. Typical body mass for red-cockaded woodpecker and the surrogates used in this study. ........................................................................................................................... 6
2. Concentration of test material during the cowbird exposures........................................... 25 3. Concentration of test material during the blackbird exposures......................................... 25 4. Elemental composition of the graphite flake obscurant. ................................................... 29

ERDC/CERL TR-05-5 vii
5. Fog oil composition before and after generation............................................................... 31 6. Number of graphite flakes in feces of cowbirds exposed to graphite flake aerosols
or cogenerated aerosols of graphite flake and fog oil for 4 days and estimated mass of ingested flake per bird. ................................................................................ 33
7. Incidence of gross lesions in cowbirds exposed to graphite flake or cogenerated graphite/fog oil smoke. .............................................................................................. 36
8. Incidence of gross lesions in red-winged blackbirds exposed to graphite flake or cogenerated graphite/fog oil smoke for 4 consecutive days..................................... 37
9. Incidence of histopathologic lesions in cowbirds exposed to graphite flake or cogenerated graphite/fog oil smoke.......................................................................... 38
10. Incidence of histopathologic lesions in red-winged blackbirds exposed to graphite flake or cogenerated graphite/fog oil smoke for 4 consecutive days. ....................... 39
11. Total and differential white blood cell counts for adult female red-winged blackbirds exposed to graphite flake aerosols and cogenerated aerosols of graphite flake and fog oil for 4 consecutive days............................................................................. 45
12. Total and differential white blood cell counts for brown-headed cowbirds exposed to graphite flake aerosols and cogenerated aerosols of graphite flake and fog oil. .............................................................................................................................. 47
13. Blood chemistry of adult brown-headed cowbirds exposed to graphite flake aerosols and cogenerated aerosols of graphite flake. .............................................. 48
14. Blood chemistry of adult female red-winged blackbirds exposed to graphite flake aerosols and cogenerated aerosols of graphite flake and fog oil. ............................ 49
15. Mean body weights (in grams) of adult brown-headed cowbirds exposed to graphite flake aerosols and cogenerated aerosols of graphite flake and fog oil....... 50
16. Mean change in body mass (in grams) of adult female red-winged blackbirds exposed to graphite flake aerosols or cogenerated aerosols of graphite flake and fog oil for 4 consecutive days............................................................................. 50
17. Organ weights (as percentage of body weight) of adult cowbirds exposed to aerosols of graphite flake or cogenerated aerosols of graphite flake and fog oil. .... 51
18. Organ weights (as percentage of body weight) of adult red-winged blackbirds exposed to aerosols of graphite flake or cogenerated aerosols of graphite flake and fog oil for 4 consecutive days............................................................................. 52
19. 1998 Weather. April through June represent the exposure and post exposure periods for the cowbirds. October and November represent the exposure and post exposure periods for the red-winged blackbirds. .............................................. 52

viii ERDC/CERL TR-05-5
Conversion Factors
Non-SI* units of measurement used in this report can be converted to SI units as follows:
Multiply By To Obtain acres 4,046.873 square meters
cubic feet 0.02831685 cubic meters
cubic inches 0.00001638706 cubic meters
degrees (angle) 0.01745329 radians
degrees Fahrenheit (5/9) x (°F – 32) degrees Celsius
degrees Fahrenheit (5/9) x (°F – 32) + 273.15. kelvins
feet 0.3048 meters
gallons (U.S. liquid) 0.003785412 cubic meters
horsepower (550 ft-lb force per second) 745.6999 watts
inches 0.0254 meters
kips per square foot 47.88026 kilopascals
kips per square inch 6.894757 megapascals
miles (U.S. statute) 1.609347 kilometers
pounds (force) 4.448222 newtons
pounds (force) per square inch 0.006894757 megapascals
pounds (mass) 0.4535924 kilograms
square feet 0.09290304 square meters
square miles 2,589,998 square meters
tons (force) 8,896.443 newtons
tons (2,000 pounds, mass) 907.1847 kilograms
yards 0.9144 meters
*Système International d’Unités (“International System of Measurement”), commonly known as the “metric system.”

ERDC/CERL TR-05-5 ix
Preface
This study was supported by two projects. The first project funded a series of stud-ies to evaluate the health effects of fog oil aerosols in surrogates for the red-cockaded woodpecker. These studies were conducted for the Strategic Environ-mental Research and Development Program (SERDP) under project number CS-507 “Threatened, Endangered, and Sensitive Resources: Impact of Smokes and Obscur-ants on TES.” The technical monitor was Dr. Femi A. Ayorinde, SERDP Cleanup and Conservation Program Manager, followed by Dr. Robert W. Holst, Compliance and Conservation Program Manager. The second project, funding this specific re-search on the inhalation toxicity of graphite flake and fog oil smoke, was conducted for the U.S. Army Forces Command. Dr. Bert Bivings, FORSCOM Natural Re-source Program Manager, was the sponsor. Preparation of this ERDC report was funded by U.S. Army Threatened and Endangered Species (TES) research funds, Project P62720A896, Work Unit F474HJ, within the TES Mitigation and Manage-ment work package.
The work was performed by the Pacific Northwest National Laboratory (PNNL), Richland, Washington, under Military Interdepartmental Purchase Request MIPR7MR9761045 R97660 S09177. Crystal Driver was the PNNL Principal Inves-tigator. Jennifer Ollero, Mark Clark, Robert Fulton, Brett Tiller, and Gary Dennis also are employed by PNNL. The report was prepared by the Ecological Processes Branch (CN-N) of the Installations Division (CN), Construction Engineering Re-search Laboratory (CERL). Dr. Harold Balbach, CECER-CN-N, was the CERL Principal Investigator. Steve Hodapp is Chief, CEERD-CN-N, and Dr. John T. Bandy is Chief, CEERD-CN. The associated Technical Director was Dr. William D. Severinghaus, CEERD-CV-T. The Director of CERL is Dr. Alan W. Moore.
Special thanks goes to Elizabeth Keane, Engineering Aide, CEERD-CN-N, who co-ordinated preparation of the final report.
CERL is an element of the U.S. Army Engineer Research and Development Center (ERDC), U.S. Army Corps of Engineers. The Commander and Executive Director of ERDC is COL James R. Rowan, and the Director of ERDC is Dr. James R. Houston.


ERDC/CERL TR-05-5 1
1 Introduction
Background
The relatively large expanses of habitat conserved within military installations of-ten support populations of threatened and endangered wildlife species. To ensure that concerns about the continued health of these critical populations do not impede the military mission activities, more accurate knowledge about the actual sensitivi-ties of these species is needed. In the absence of accurate knowledge, regulatory re-quirements may be established that, while extensive enough to assure population maintenance, have the potential to unnecessarily restrict the military missions of the installations. Troop readiness training is an essential military function of sev-eral installations where endangered avian species such as the red-cockaded wood-pecker (Picoides borealis) occur. Important components of readiness training at these installations are the generation of obscurant material and maneuvers under obscurant cover. Obscurants have long been used to mask movements of troops and mechanized equipment. Of the conventional smokes, the white “smoke” generated from vaporization and re-condensation of liquid fog oil (SGF-2) is an effective ob-scurant in the visible range and has been used for training for many years. How-ever, the modern battlefield has become more complex, with visual detection being augmented by a wide range of methods for detection and targeting. As a result, ef-fective training for tactical readiness requires experience with both visual and in-frared obscurants. Recently, generators have been developed for battlefield uses that are capable of co-emitting fog oil for visual obscuration and graphite to defeat infrared detection.
Because sensitive avian populations must be managed without significant reduction in realistic troop training opportunities, deployment of these smoke generators re-quires an accurate assessment of the toxicity and health effects of the obscurants in species such as the red-cockaded woodpecker, and others. In a previous study (Driver et al. 2002a) the health effects of fog oil smoke were assessed in wild captive blackbirds, a species used as a surrogate for the red-cockaded woodpecker. In that study, birds were exposed to field-typical levels of airborne fog oil (50 and 100 mg/m3) and to a near-source concentration of 400 mg/m3 for 4 hours. Test results showed that, for several potential pathways, the whole body exposures (inhalation, preening, and dermal uptake) did not adversely affect the health or well being of the birds. No mortality, clinical signs of toxicity, weight change, abnormal behavior, or

2 ERDC/CERL TR-05-5
gross or histopathologic lesions related to fog oil exposure were observed in any of the test birds compared to controls. Therefore, as a result of these studies, a “no ob-servable adverse effect” level was estimated to be greater than 400 mg/m3 for acute (4-hour) inhalation of fog oil smoke in nonreproductive red-winged blackbirds and birds of similar size-specific ventilation. This interpretation included several listed species of concern to the Army, including the red-cockaded woodpecker.
Primarily through a series of studies sponsored by the Strategic Environmental Re-search and Development Program (SERDP) (Driver et al. 2002a, b and Driver et al. 2004), some information on the toxicological response of birds to airborne fog oil has been developed. However, virtually no data were available on the inhalation toxic-ity of airborne graphite flake and mixed aerosols of graphite flake and fog oil on wildlife and, in particular, avian species. Inhalation of graphite flake aerosols has been investigated in human surrogate species (laboratory rodents); however, ex-trapolation of these data to birds is problematic because of several fundamental dif-ferences in the structure and physiology of their respiratory systems.
In contrast to mammals, birds lack alveoli (blind terminal dilations of the airways) and therefore, maintain a continuous circulation of air through the lung instead of an alternating inflow and outflow. This continuous exposure coupled with an excep-tionally thin blood gas barrier makes the avian respiratory surface more liable to damage from airborne particulate and chemicals (Scheuermann et al. 1997) and re-sults in increased sensitivity to inspired toxins (Dumonceaux and Harrison 1994). Transport and clearance of airborne particles in the lung also differ markedly be-tween mammals and birds (Klika et al. 1996). In addition to the high efficiency of their respiratory system, birds are generally more susceptible to inhaled toxins be-cause of their rapid metabolic rate, small size, and low body fat content. Because of their elevated metabolic rate and the demands of flight, respiratory rates in birds are generally higher. Consequently, birds ventilate a greater volume of air than those of mammals of comparable size and thereby receive much higher doses of air-borne contaminants on a body weight basis (Hill 1994, Schafer 1972, Schafer et al. 1983). Similarly, feather deposition and subsequent oral uptake via preening can-not be estimated from mammalian studies. For bird species with critical popula-tions (threatened and endangered species), exposure and toxicity are best estimated from weight-specific avian surrogates.
Objective
The objective of this study was to evaluate the health effects of graphite flake and mixed aerosols of graphite flake and fog oil in surrogate species for the red-cockaded woodpecker. The information from this study will also be used for general and site-

ERDC/CERL TR-05-5 3
specific risk assessments and for the management of obscurant generation and training activities. A secondary objective was to characterize the physical nature of the mixed aerosols created by mixing graphite flakes with the fog oil.
Scope
For this study, as for the previous studies in this series (Driver et al. 2002a,b and Driver et al. 2004), exposure is designed to emulate the field conditions for actual use of the obscurants. This was not a classic toxicological study in which a lethal endpoint was sought, and no attempt was made to determine a lethal concentration or duration of exposure. The exposure concentrations and durations, therefore, were planned to parallel those experienced in training exercises on military installations.
Approach
As with earlier studies of the potential effects of fog oil on sensitive listed species, particularly the red-cockaded woodpecker, it was not possible to utilize that species directly in the studies. Neither was any closely related woodpecker species avail-able as a test population, which could be maintained under aviary and laboratory conditions. The brown-headed cowbird (Molothrus ater) and the red-winged black-bird (Agelaius phoeniceus) were used as species surrogates for the red-cockaded woodpecker because of their similarity in physical size to the red-cockaded wood-pecker. The similarity in physical size provided a weight-specific minute ventilation and a feather/body surface area comparable to those of the woodpecker (i.e., similar respiratory and preening/dermal exposure).
The exposure period was patterned after the worst-case scenario usage anticipated in field training. In this study wild cowbirds were exposed to airborne concentra-tions of graphite flake or to mixed aerosols of graphite flake and fog oil smoke at typical field concentrations (35 mg/m3 graphite flake; 100 mg/m3 fog oil) or to levels estimated to be present at less than 100 m from the generator (70 mg/m3; 120 mg/m3 fog oil). Red-winged blackbirds were exposed to 35 mg/m3 of graphite flake or to 185 mg/m3 graphite flake cogenerated with 300 mg/m3 fog oil for 30 minutes each day for 4 consecutive days. Control birds were exposed under the same test conditions but without fog oil in the air stream. Two additional groups received a single 1-hour ex-posure to either 60 mg/m3 of graphite flake or 60 mg/m3 of graphite flake in combi-nation with 120 mg/m3 of fog oil smoke. Birds that were not exposed to control or treatment atmospheres served as aviary controls for comparison of post exposure behavior.

4 ERDC/CERL TR-05-5
Because the polynuclear aromatic hydrocarbon (PAH) content of fossil fuels may contribute significantly to the toxicity of refined oils and because they can be prod-ucts of pyrolysis, samples of both the stock fog oil and the fog oil aerosols were col-lected for PAH analysis. The composition of the fog oil was similar to that of fog oil used in a previous study (Driver et al. 2002a). Fog oil deposition on feathers was also determined to estimate oral exposure from preening. Oral exposure to graphite flake via preening and/or clearance of the respiratory system was estimated from the occurrence of graphite flake in feces.
Mode of Technology Transfer
The information included in this report is one portion of the materials prepared by the Engineer Research and Development Center (ERDC) to assist installation natu-ral resource and Threatened and Endangered Species program managers. The pri-mary means of communicating the hatchling and nestling toxicity information will be through publication in the scientific literature, as well as through the availability of this report. The specific data presented are intended to be used in the prepara-tion of biological opinions related to planned Army actions where the red-cockaded woodpecker (or other similar avian species) is present, and for endangered species management plans (ESMPs), integrated natural resource management plans (INRMPs), and in the preparation of ecological risk assessments involving fog oil smoke and avian species.
This report will be made accessible through the World Wide Web (WWW) at URL: http://www.cecer.army.mil

ERDC/CERL TR-05-5 5
2 Methods Whole body exposures of two species of wild birds to graphite flake and fog oil ob-scurants were conducted under simulated field conditions. Post-exposure response of the birds to the obscurants was monitored for several weeks and terminal tissue pathology and hematological status evaluated.
Test Animals
Red-winged blackbirds (Agelaius phoeniceus) were selected as test subjects because they have long been used as a sensitive test species in environmental toxicology (Schafer 1972, Schafer 1994, Schafer et al. 1983) and have served as a surrogate for the red-cockaded woodpecker in a previous study on the inhalation toxicity of fog oil (Driver et al. 2002a). Nonreproductive female blackbirds from eastern Washington were used in this study because their mean body mass (46.9 g to 48.3 g) is similar to that of the female red-cockaded woodpecker (about 45.9 g to 48.5 g; Table 1) and be-cause female animals are generally more sensitive to test substances (Lipnick et al. 1995). The mean body mass of male red-winged blackbirds in the western United States is about 20 to 25 percent greater than that of red-winged blackbird from other areas of the country (Beletsky and Beadle 1996). The brown-headed cowbird (Molothrus ater) was selected as one of the test species for this study because of its history of use in environmental toxicity studies (Van Velzen et al. 1972, Heinz and Johnson 1982, Beyer et al. 1996) and its similarity in physical size to the red-cockaded woodpecker.
The sensitivity of cowbirds to environmental pollutants has been shown to be com-parable to, if not greater than that of other passerine species including the red-winged blackbird (Van Velzen et al. 1972, Stickel et al. 1979, Heinz and Johnson 1982, Stickel et al. 1983, Stickel et al. 1984, Beyer et al. 1996). Mean body mass of the male cowbirds used in this study (47.5 g to 49 g) is comparable to the average weight of the male red-cockaded woodpecker (48.1g to 49.8g); however, mean female body mass of cowbirds (37.6 g to 38.8 g) is about 19% less than that of the red-cockaded woodpecker (Table 1). Because of its smaller size, the female cowbird will likely receive a greater dose of obscurants (ventilation of a greater volume of the contaminated air) than the woodpecker on a body weight basis and thereby serve as a conservative surrogate of exposure. Body length of the cowbird averaged about 20 cm (8.0 in.). The average body length of the red-cockaded woodpecker has been re-

6 ERDC/CERL TR-05-5
ported to be about 22 cm (8.5 in.). Body length is considered a good indicator of size because it, unlike body mass, does not change seasonally but is highly correlated with body mass (Connell et al. 1960, Searcy 1979). The similarity in body size should result in similar weight-specific minute volumes and consequently similarity in inhaled dose (Phalen 1984). Because feather mass and body surface area can be expressed as a function of body mass in birds (Calder and King 1974; Turcek 1966), contamination of these surfaces/exposure routes should also be similar between the two species.
Table 1. Typical body mass for red-cockaded woodpecker and the surrogates used in this study.
Species Sex Mass (g) Region
Male 61.0 – 70.5 Red-winged Blackbird (1)
Female 41.6 – 43.8
Ohio
Male 63.6 ± 4.43 Red-winged Blackbird (2) Female 41.5 ± 2.74
Pennsylvania [as reported in (3)]
Red-winged Blackbird
Female 44.3 – 45.6 Benton County, Washington (as used in this study)
Brown-headed Cowbird (4)
Male 47.1 – 48.9 Ontario, Canada
Brown-headed Cowbird
Male Female Combined
48.9 ± 5.7 38.6 ± 4.0 OR 33.9-53.9
Benton County, Washington (as used in this study)
Male 49.0 ± 1.77 Brown-headed Cowbird (2)
Female 38.8 ± 1.93
Pennsylvania [as reported in (3)] Range for this is 30.5-58.0 (combined)
Male 47.5 ± 3.7 Brown-headed Cowbird (5)
Female 37.6 ± 3.6
California
Male 49.8 ± 1.78 Red-cockaded Woodpecker (6) Female 48.2 ± 2.19
Noxubee, Mississippi
Male 48.5 ± 2.46 Red-cockaded Woodpecker (6) Female 46.9 ± 2.46
Fort Polk, Louisiana
Male 48.1 ± 1.81 Red-cockaded Woodpecker (6) Female 45.9 ± 3.18
Savannah River Site Aiken, South Carolina
(1) Holcomb, L. C. and G. Twiest. 1968. Red-winged Blackbird nestling growth compared to adult size and differential development of structures. Ohio J. Sci. 68: 277–284. (2) Clench, M. H. and R. C. Leberman. 1978. Weights of 151 species of Pennsylvania birds analyzed by month, age, and sex. Bulletin Carnegie Museum of Natural History no. 5, 87 pp. (3) Dunning, J. B., Jr. 1993. CRC Handbook of Avian Body Masses. CRC Press, Boca Raton, Florida. (4) Weatherhead, P. J. and K. L. Teather. 1987. The paradox of age-related dominance in Brown-headed Cowbirds (Molothrus ater). Can. J. Zool. 65: 2354–2389. (5) Fleischer, R. C. and S. I. Rothstein. 1988. Known secondary contact and rapid gene flow among subspecies and dialects in the Brown-headed Cowbird. Evolution 42: 1146–1158. (6) Jackson, J. A. 1994. Red-cockaded Woodpecker (Picoides borealis). In The Birds of North America, No. 85 (A. Poole and F. Gill, Eds.). Philadelphia: The Academy of Natural Sciences; Washington, D.C.: The American Ornithologists’ Union.

ERDC/CERL TR-05-5 7
Source and Husbandry of Test Animals
Wild adult cowbirds were baited to traps in Benton and Franklin Counties, Wash-ington, and transferred to an outdoor aviary at Pacific Northwest National Labora-tory (PNNL) 8 weeks prior to testing. Blackbirds were trapped 4 weeks prior to ex-posure. The birds were housed (at different time periods without overlap of species) in a 9.1-m wide by 15.2-m long by 3.7-m high (30 ft by 50 ft by 12 ft) aviary that was divided into five 3-m wide flight pens. The different species occupied different pens and/or were held at different times. A metal roof covered one-third of each section. Continuous flowing water was provided for drinking and bathing/swimming in each flight pen by capping the end of a 3-m (10-ft) long PVC gutter and providing a con-stant flow of potable water into one end of the gutter. Spillover ran across the width of each pen to a drain and provided wading area. Wooden rods suspended from the roof frame provided perches for the birds in covered portions of the aviary. Natural and artificial evening roosts consisted of fir (Abies spp) and spruce (Picea spp) trees placed in planters and arranged around 4-ft high roost boxes. Willow trees (Salix spp), spruce trees, arborvitae (Thuja occidentalis) and dwarf conifers provided natu-ral cover in the open areas of the flight pens.
Birds were fed a pelleted, complete diet for insect-eating soft-billed birds (Zeigler Bros, Inc., Gardners, PA, Product No. 73534800). Minimum values for crude protein and crude fat content of the semi moist feed were 30.0 percent and 12.0 percent, re-spectively. Maximum crude fiber was 4.0 percent, maximum moisture was 15.0 per-cent and the maximum ash content was 8.0 percent. Although the diet was com-plete, other, varied food items, including meal worms (Tenebrio molitor, Zophobas morio), larvae of the greater bee moth (Galleria mellonella), crickets (Acheta domes-tica), fresh corn (on the cob), commercial mix of wild bird seed, cracked corn wheat, natural millet sprays, berries, and lettuce were also provided for both dietary vari-ety and environmental enrichment.
The aviary perches, roost boxes, water troughs, and floor were disinfected daily. Natural perches were sprayed down with water each day.
The birds were observed by a laboratory animal veterinarian during the quarantine and acclimation period, were found to be in good health, and were released for study at the end of 8 weeks of acclimation.
Bird Identification and Group Assignment
All birds of one species were housed in a single flight pen. To uniquely identify each bird, a 2-mm by 12-mm barcode transponder (Avid Company, Norco, California) was implanted in the pectoralis muscle of each bird with a needle injector. The trans-

8 ERDC/CERL TR-05-5
ponders were stored in 70 percent ethanol until implanted. A povidone iodine solu-tion was applied to the skin at the implant site as an antiseptic prior to injection of the transponder. Individual birds were identified when needed using a barcode reader (AVID Company, Norco, California). Treatment group designation was made by colored leg bands (National Band and Tag, Newport, Kentucky).
Cowbirds were randomly assigned to test groups using a random numbers genera-tor (Microsoft® Excel). Body weights were measured at 4 weeks prior to testing. The data were analyzed for homogeneity of variance using Bartlett's test and for differences in mean body weights among test groups using one-way analysis of vari-ance (Zar 1974). The results of these statistical tests showed that all the group population variances were homogeneous and no significant differences existed among the mean body weights of all groups (P> 0.05). Therefore, the group assign-ments were retained for the study.
Data from the cowbird study indicated that the capture order of the birds was pos-sibly influenced by some of the treatments. However, this observation could not be sufficiently documented, in part because the relative ease of capture of the birds prior to treatment had not been recorded, and was treated as unknown. Therefore, the group assignments for the subsequent test using red-winged blackbirds were made by capture order. The first 3 birds captured were randomly assigned to one of the 3 experimental groups. This procedure was repeated for each round of capture until each group contained 12 subjects. The groups were then compared on a body-weight basis and the homogeneity of the group population variances were evaluated statistically as described for the cowbirds. No significant differences among the mean body weights of the groups were found.
Exposures
Birds were transferred to the Aerosol Research Facility at Pacific Northwest Na-tional Laboratory (PNNL) and exposed to graphite flake or cogenerated aerosols of graphite flake and fog oil within 30 minutes of arrival at the facility. Control birds were similarly collected, transferred, and held in the exposure chambers but were not exposed to the graphite flake or aerosols. A group of birds remained at the avi-ary and served as untreated aviary controls. For the cowbirds, 2 concentrations of graphite flake were used in the inhalation tests and included a typical (35 mg/m3) field concentration and a high, near-source concentration of 70 mg/m3. The toxicity of graphite flake aerosols was tested alone and in combination with fog oil smoke. The cogenerated fog oil smoke concentrations were 100 mg/m3 and 120 mg/m3, re-spectively. Test concentrations were based on predictions from a modified Gaussian plume dispersion model for cogenerated aerosols of graphite flake and fog oil (Driver
ERDC/CERL TR-05-5 9
et al. 1993a,b). Birds were exposed for 30 minutes each day for 4 consecutive days. In addition to the 30 minutes at the treatment concentration, the birds were ex-posed to 15 minutes of aerosols as the test atmospheres reached the target test con-centrations.
Two single exposure tests were also performed. One group of cowbirds was exposed for 1 hour to 60 mg/m3 of graphite flake and a second group was exposed for 1 hour to the cogenerated graphite flake (60 mg/m3) and fog oil (120 mg/m3). Control birds were handled, transported, and placed in the chambers in a manner similar to treated birds but without exposure to the obscurants.
Red-winged blackbirds were exposed for 4 consecutive days to 30 minutes of graph-ite flake (35 mg/m3) or to 185 mg/m3 graphite flake cogenerated with a 300 mg/m3 aerosol of fog oil. Controls were placed in the chambers without aerosol exposure.
Test conditions, aerosol characteristics, and bird behaviors were monitored during the exposure tests. After exposure, the birds were returned to their home flight pens in the outdoor aviary. Observations were made for mortality, body weight change, behavioral deficits, and potential signs of toxicity associated with the aero-sol exposure during the post exposure period. Cowbirds and blackbirds were sacri-ficed and examined for hematological, gross and histological lesions at 7 weeks and 5 weeks post exposure, respectively.
Test Material
The test material was obtained from U.S. Army sources and chemically character-ized at PNNL. Particle/droplet characteristics of the aerosols were also determined.
Graphite Flake – Source and Composition
Graphite flake was obtained from the Program Manager, Smokes, at Aberdeen Prov-ing Ground, Maryland. The particle size distribution of the flake was characterized as described in Exposure Characterization (page 16).
Energy dispersive X-ray fluorescence was used to analyze two aliquots (200 mg each) of the graphite flake. A comparison standard of 2500 ppm silica was made from 200 mg of cellulose spiked with 50 µL of a 50 µg/mL silica standard (National Institute of Standards and Technology) that was dried to a constant weight. Un-spiked cellulose served as the blank matrix control. Data were compared to the trace element recovery in our tests using standard reference materials (coal and oyster tissue) from the National Institute of Standards and Technology.

10 ERDC/CERL TR-05-5
Fog Oil – Source and Composition
A variety of fog oils have been used to provide white smoke obscurant; however, SGF-2 is the fog oil that has been in use for year-round obscuration needs for the past 20 years (U.S. Army 1986). In 1986, promulgation of military specification MIL-F-12070C specified procurement and use of fog oil with reduced quantities of some of the potentially harmful components of the material (e.g., polynuclear aro-matic hydrocarbons). Fog oil used in this study was Lot number 71808 manufac-tured by American Lubricating Company, Memphis, TN and supplied to PNNL by the National Training Center, Fort Irwin, CA. Upon receipt of the oil, it was bar coded and tracked through the PNNL Chemical Management System.
Because the toxicity of petroleum oils is often related to the amount of polynuclear aromatic hydrocarbons (PAHs) present, samples of fog oil were collected prior to generation and at entry into the test chambers during generation of fog oil smoke both to characterize the stock oil and to determine if the smoke generation process (high heat vaporization) produced an aerosol of different composition than that of the stock oil. Aerosol samples were collected during preliminary generations (air-borne concentrations of 120 mg/m3) on aluminum foil deposition coupons (929 cm2). Samples were collected for 30 minutes. Unused foil coupons and foil coupons placed in control test chambers receiving output from the generation system described in Aerosol Generation, Fog Oil (page 13) but without fog oil were used as blank con-trols. All samples were placed in bottles with Teflon-lined lids and stored at -20°C until analyzed for PAH content. Glassware and foil were ashed at 400°C for 24 hours and Teflon-lined lids were rinsed with GC (gas chromatography)-grade hex-ane and methylene chloride prior to use.
Fog oil samples were extracted with methylene chloride according the National Oceanic and Atmospheric Administration's Status and Trends Program Technical Memorandum NMFS F/NWC 153 (Krahn et al. 1988). Samples were then cleaned using Silica/Alumina (5 percent deactivated) chromatography followed by High Pressure Liquid Chromatography (HPLC) cleanup. Selected dueterated surrogate PAH compounds were added at the beginning of each extraction to assess the effi-ciency of the method and all results corrected for the recoveries of the surrogates. Extracts were quantified using gas chromatography/mass spectrometry (GC/MS) in the selected ion mode (SIM) following a procedure based on EPA method 8270 (U.S. EPA 1986).
Exposure Chambers
Four Plexiglas chambers were constructed within the PNNL Aerosol Research Wind Tunnel (Figure 1). Each chamber was cubical in shape with a volume of 0.23 m3 (61

ERDC/CERL TR-05-5 11
cm on all sides). Three inlet portals, one each for introduction of graphite flake, fog oil aerosols, and dilution air were attached to the upper portions of each chamber. Two additional ports were installed in the chambers to obtain physical samples and allow a small flow to be withdrawn and passed to optical dust sensors for real-time monitoring of aerosol concentrations. No ports were fitted to the control chamber. A single exhaust port was used to control chamber vacuum, and directed aerosols to a wet scrubber/HEPA filtration system prior to venting to the outside. A vacuum gauge was fitted to each exposure chamber to aid in ensuring reproducibility of ex-posure conditions.
Figure 1. Exposure system used for testing the effects of fog oil and graphite flake aerosols on avian health.
Ambient temperature and humidity of the exposure chambers were maintained at the average values recorded between 09:00 and 11:00 hours at the aviary during a 5-day period prior to the day of exposure. The mean temperature and relative hu-midity during exposure for the cowbirds were 18.0°C (17.50°C to 18.1°C) and 42.3 percent RH (41.7 percent to 44 percent RH), respectively.
To reduce stress and limit startle responses during testing, the walls of the cham-bers were made opaque during the exposure tests. One wall of the chamber was moveable and was outfitted with removable perches (Figure 2). To move the birds

12 ERDC/CERL TR-05-5
out of the chamber and into transfer cages with minimum stress, the perches were pulled out of the chamber side of the wall and affixed to exterior side to be used as handles. The wall was then slowly moved toward the opposing wall, which con-tained a transfer portal. The transfer cage was covered and the birds returned to their home aviary.
Figure 2. Cowbirds in test chamber prior to initiation of aerosol exposure studies.
Aerosol Generation
Graphite flake was generated using a fluidized bed aerosol generator. Fog oil smoke was generated by recondensation of vaporized oil under conditions simulating field generation. The method of cogeneration of the two obscurants is also described.
Graphite Flake
Graphite flake aerosols were generated by directing the output from a TSI, Incorpo-rated Model 3400 Fluidized Bed Aerosol Generator (FBAG) through a Kr80 particle charge neutralizer mounted atop the FBAG, and into the exposure chamber (Figure 3). The air flow rate of the fluidized bed and the graphite flake feed rate from the hopper were adjusted to give the desired concentration within the test chamber. Ad-justments typically resulted in a graphite flake-laden airflow rate into the test chamber of 15 Lpm. Graphite flake feed rate from the hopper to the fluidized bed was about 0.8 mg/min using the original factory supplied gearing. To increase the

ERDC/CERL TR-05-5 13
output of graphite flake aerosol from the TSI Fluidized Bed Generator for the red-winged blackbird cogeneration test, the internal gearing was changed from a gear ratio of 12.5:1 to a ratio of 15:1. The gearing change increased the dry powder feed rate to the fluidized bed chamber by about 20 percent. All other factors remained unchanged. The combination of increased aerosol output and reduced dilution air resulted in the increased graphite flake aerosol concentration attained within the test chamber for the mixed aerosol of graphite flake (185 mg/m3) and fog oil (300 mg/m3).
Figure 3. The TSI Model 3400 Fluidized Bed Aerosol Generator used to deliver graphite flake aerosol to the exposure chamber.
Fog Oil
Fog oil aerosols were generated by metering steady rates of liquid fog oil onto a heated immersion element maintained at 600 °C (Figures 4 and 5) and contained within a 1-m long, 2.5-cm diameter stainless steel pipe. The liquid fog oil was va-porized on the element and the vapor was subsequently recondensed as it cooled, forming a fog oil aerosol. Low oxygen carrier gas (a mixture of 96 percent nitrogen and 4 percent air) was used to flush the condensing fog oil vapor through a tempera-ture-controlled region at 300 °C and into a 35-gallon buffer volume with a residence

14 ERDC/CERL TR-05-5
time of 5 minutes. The oxygen content of the carrier gas was about 0.8 percent, a value typical of the oxygen content present in the exhaust of diesel engines. In the buffer volume, fresh air was mixed with the concentrated fog oil aerosol and the mixture drawn through PVC pipes into the test chambers in the wind tunnel at am-bient temperature (18 °C). Valves were used to adjust the flow of aerosol into each of three exposure chambers. Separate valves were used to regulate a flow of fresh air into each chamber. To ensure mixing, restrictions were installed at the aerosol inlet to each chamber. The restrictions caused the fog oil aerosol to jet into the up-per regions of the chambers and then quickly mixed to a uniform concentration at the breathing zone height of the birds. The feed rate of the oil was adjusted periodi-cally, based on sensor monitored aerosol concentration to maintain the test concen-trations (see Exposure Characterization, page 16).
Figure 4. The fog oil generator used to flash vaporize oil which is delivered to a buffer volume (35-gallon drum), then directed as an aerosol to the manifold and test chambers.

ERDC/CERL TR-05-5 15
Figure 5. A schematic of the temperature controlled fog oil aerosol generator used in conjunction with the graphite flake generator for mixed aerosols.
Simultaneous Generation of Graphite Flake/Fog Oil Aerosols
Mixed graphite flake/fog oil aerosol generation was performed by initiating the fog oil generator and allowing the chamber concentration to reach equilibrium (about 15 minutes). Fog oil concentrations were monitored in real time using optical dust sensors and confirmed by gravimetric analysis of samples collected on glass fiber filters (see Exposure Characterization, page 16). The exhaust and fog oil input valves were adjusted as needed to achieve the desired concentration. After estab-lishing the fog oil concentration, the powder feed was initiated in the FBAG and the combined aerosols were allowed to reach equilibrium. Samples for mass concentra-tion determination were obtained and the mass contributed by fog oil was sub-tracted to determine the airborne concentration of graphite flake in the chamber. The airflow rate of the fluidized bed was adjusted as needed to obtain the appropri-ate concentration of graphite flake.
The entire exposure system, both fog oil smoke and graphite flake, was driven by the exhaust system (energized by the scrubber), with valve lines connected to each chamber. To control flow through the entire aerosol generation and exposure sys-tem, careful control of a number of manual valves was necessary to achieve the de-sired chamber concentrations.
To end a cogeneration, the fog oil pump, the fog oil aerosol intake valve, the carrier gases (nitrogen and air), and the heaters were sequentially shut off. Airflow from the FBAG was turned off and the unit shut down. The fresh air inlet valve was fully opened allowing a few minutes for chamber purge. Following chamber purge, the scrubber was turned off.

16 ERDC/CERL TR-05-5
Exposure Characterization
In addition to the chemical characterization of the graphite flake and the stock and generated fog oil (see Test Material, page 9), the concentration of graphite flake, the fog oil concentration, and the droplet size distribution of the aerosols to which the birds were exposed were characterized during the exposures. To characterize the preening/dermal exposure of the birds, the deposition rate of fog oil to feathers was determined. Oral exposure to graphite flake from preening and respiratory clear-ance was estimated from examination of the feces.
Fog Oil Concentration and Droplet Size
In a previous study (Driver et al. 2002a), the vapor component of the fog oil expo-sures was shown to be minimal. Therefore, particle count and aerosol mass meth-ods were used to determine both the airborne graphite flake and fog oil concentra-tions during the current exposure tests. The concentration of fog oil aerosol in each of the test chambers was monitored in real time using M.I.E. Model IDS 10 Optical Dust Sensors (Monitoring Instruments for the Environment, Inc., Billerica, Mary-land). Actual concentrations were determined from simultaneous gravimetric sam-ples taken by drawing chamber air through preweighed 47-mm high efficiency glass fiber filters (Gelman, Ann Arbor, Michigan) at 1 Lpm for 15 minutes. The filters were weighed to the nearest 0.1 mg on a Mettler Model AE 163 Analytical Balance prior to and after sample collection to determine the mass collected. Airborne fog oil concentrations were reported in mg/m3. The optical dust sensor values collected during fog oil generation were compared to the gravimetrically derived air concen-trations of fog oil. Least squares linear regression was used to test the relationship between the optical dust sensor mV readings and the gravimetric air concentrations (Figure 6). The equation of the linear relationship (r2= 0.98) was then used to con-vert the sensor readings into air concentrations values during the exposures.
The particle size distribution of the fog oil aerosols was measured during prestudy testing, independent of graphite flake aerosol. Samples were collected from fog oil aerosols at a concentration of approximately 160 mg/m3 using an Andersen cascade impactor operated at a flow rate of 20 Lpm (Figure 7).

ERDC/CERL TR-05-5 17
Figure 6. Relationship between millivolt readings of the optical dust sensor and the mass of fog oil collected on glass fiber filters.
Figure 7. Fog oil and graphite flake aerosol collected on cascade impactor filter inserts.

18 ERDC/CERL TR-05-5
Graphite Flake
The concentration of graphite flake aerosol in the test chamber was also monitored in real time using an optical dust sensor. Since graphite flake is used under field conditions to obscure the light path, the optical dust sensor was considerably more insensitive to graphite flake aerosol concentration compared to fog oil aerosol. Ac-tual concentrations were measured using high efficiency glass fiber filters (GFF). The particle size distribution of the graphite flake aerosol was measured independ-ent of fog oil aerosol during the preexposure testing phase using an Andersen cas-cade impactor operated at a flow rate of about 20 Lpm.
Cogenerated Graphite Flake and Fog Oil Smoke
Particle size distribution measurements were obtained in a similar manner for the simultaneously generated graphite flake/fog oil aerosols.
Fog Oil Deposition on Feathers
An estimate of the amount of fog oil available for ingestion through feather preening was made by placing taxidermic birds in the control and test chambers during a 1-hour generation. The feathers of the birds were then removed and placed in sol-vent-rinsed jars with Teflon-lined lids and stored at -20 °C until analyzed for fog oil content. Ions 43 and 57 which are predominant ions in alkanes, the principle com-ponent of fog oil, were used to “finger print” the fog oil on the feathers by GC/MS as described in Test Material (page 9). Ion 57 was used as the quantifying ion. How-ever, some late eluting compounds (probably natural feather oils) that had ions 43 and 57 were found in the feather extracts. Potential exaggeration of the fog oil value from this matrix was circumvented by summing only the area between 20 and 40 minutes, which appeared to account for all the fog oil in the feathers while ex-cluding the natural oils.
Fog oil was reported on a per-gram-of-feathers basis and the amount deposited on the bird estimated from the equation:
Y = 0.09M0.95 [Equation 1]
where: Y = the plumage weight in grams, and M = the average body weight in grams (Turcek 1966, Walsberg and King 1978).

ERDC/CERL TR-05-5 19
Estimate of Graphite Flake Ingested by Cowbirds
Graphite flake ingestion from two sources, preening and swallowing flake cleared from the respiratory system via the mucociliary escalator, was estimated from the amount excreted in the feces of the cowbirds. Feces from each of the groups were composited daily during the post exposure holding and transport period. Three ali-quots of the composited fecal material from each group were weighed and suspended in distilled water and 0.5 ml of each of the suspensions transferred to a Petroff Hausser Counting Chamber. Graphite flakes were viewed under a brightfield mi-croscope and the number of flakes counted. Samples were compared to clean (no fecal matter) dilutions of graphite flake to ensure identification of the flakes from background material. A rough estimate of the mass of flakes ingested by each bird was calculated from the density, average dimensions, and the number of flakes pre-sent. The value was then divided by the number of birds in each group. Flake in-gestion was estimated to be roughly equivalent to the fecal output and expressed on a per-bird basis. The calculation was made assuming fecal and flake output was constant and that the graphite flake was chemically resistant to dissolution within the gastrointestinal tract.
Estimate of Graphite Flake Deposition in Lung
Worst case deposition of graphite flake was estimated from the equation:
D = CVT(103 ml/L)(m3/106 mL) (1/M) [Equation 2] where: D = the amount of graphite flake deposited in the lung (expressed in mg/g lung), C = the airborne concentration of the flake in mg/m3, V = the minute volume of air breathed, T = the cumulative duration of exposure in minutes, and M = the mean lung mass for the species.
The respiratory minute volume (V) for resting birds was estimated from the equa-tion:
V = 0.291M0.94 [Equation 3] where: M = the body mass of the bird in kg (Bernstein 1987).

20 ERDC/CERL TR-05-5
Response Measures
The response of the birds to the graphite flake and mixed graphite flake and fog oil aerosols was monitored by measures of mortality rate, clinical signs of toxicity and stress, body weight changes, behavioral changes, hematology and blood chemistries, and the gross and histopathologic examination of organs and tissues.
Mortality and Clinical Signs of Toxicity and/or Stress
Observations for clinical signs of toxicity, mortality, and moribund birds were re-corded twice daily (before 10:00 hours and after 15:00 hours) during normal work-days and on weekends. In addition to overall condition, observers were required to check for, but were not limited to, the following clinical signs: hyperactivity/ hypoactivity, emaciation, abnormal posture, alopecia, swelling, hypothermia, dehy-dration, tremor, excessive preening, cloacal stain, feather loss, fecal discoloration, eye irritation or sunken appearance, fluffed feathers, excessive face and beak rub-bing, and ataxia.
Particular consideration was given to clinical signs of upper and lower respiratory disease. Clinical signs of upper respiratory disease for which observers looked in-cluded open-mouth breathing, gular flutter, nasal discharge, change in voice, exer-cise intolerance, dypsnea, head shaking, stretching the neck, yawning, and epiphora. Clinical signs of lower respiratory lesions for which the observers looked were tail bobbing, loss of voice, change in vocalization, labored respiration, and coughing.
Gross Lesions and Histopathology
All birds were sacrificed at 7 weeks post exposure. A gross necropsy was performed on each bird. Birds were sacrificed by carbon dioxide asphyxiation. Immediately following sacrifice, the intestines were excised, examined, and injected with l0 per-cent buffered formalin to prevent autolysis. All major organs were examined for gross lesions. The breast muscle was examined for atrophy and the terminal body weight, general body condition, and presence of body fat recorded. Air sacs were viewed for lesions and clarity of tissue. The skin, lung, trachea, heart, liver, spleen, proventriculus, pancreas, small and large intestine, gizzard, kidney, and gonad were excised and preserved in 10 percent buffered formalin. The trachea and lung were perfused with formalin prior to storage in sample jars containing buffered formalin. The sex of the bird and its reproductive status were confirmed during necropsy. Tis-sues were prepared for histologic examination and submitted for reading by a vet-erinary pathologist. Tissues were labeled so that specific treatment of individual birds was not identifiable by the pathologist.

ERDC/CERL TR-05-5 21
Clinical Pathology - Hematology and Blood Chemistry
As measures of stress and the impact of the obscurants on immune response, leuko-cyte numbers and morphology in peripheral blood were examined. Because hemo-lytic, regenerative anemia is well documented in birds exposed to petroleum prod-ucts (Leighton 1982), erythrocyte morphology and packed cell volume (PCV) were measured to determine the incidence of anemia among treated birds and the ability of the bone marrow to respond to the anemic state.
Cytologic examination of the peripheral blood of both cowbirds and blackbirds was performed at necropsy. Blood smears were obtained immediately following blood collection to preserve cell morphology and were made using a standard 2-slide wedge technique. Differential white cell counts were performed on blood smears stained with a Wright Giemsa stain. Total white cell counts were performed using Natt Herrick’s stain with a hemocytometer. Cells were stained and classified ac-cording to Dein (1984). Leukocyte, thrombocyte, and erythrocyte morphology were evaluated for signs of toxicity (degeneration) and the degree of toxicity reported sub-jectively on a scale of +1 to +4. A value of +1 reflects a slight damage and +4 indi-cates severe damage. Abnormal leukocyte morphology was described by increased cytoplasmic basophilia, vacuolation, immature or abnormal cytoplasmic granules, degranulation, and nuclear karyolyis. Toxic changes in thrombocytes were noted by diffuse eosinophilic cytoplasm, spindle shaped cells and immature cells. Erythro-cyte toxicity was characterized by presence of immature erythrocytes, polychroma-sia, variations in nucleus location and shape, cytoplasmic basophilic stippling, and agglutination.
Hematocrit was determined on whole blood samples from the red-winged blackbirds only. The packed cell volume was obtained by centrifugation of a blood filled micro-hematocrit tube at 12,000 G for 5 minutes.
Several clinical chemistries were also conducted on the peripheral blood. Endpoint metabolites including calcium, cholesterol, glucose, total protein, albumin, globulin, and uric acid were measured to assess the functional integrity/capacity of the major organs. Blood was collected from each bird at necropsy by heart stick and the sam-ple transferred to a MICROTAINER® brand serum separator tube and centrifuged at 14,000 rpm for 10 minutes. The clot was removed and the serum stored at 80 °C until analysis. Metabolite concentrations were determined using a Hitachi® model 7170 clinical analyzer and the reagents and procedures standardized for use with the analyzer. Cholesterol, glucose, and uric acid were analyzed enzymatically using microbial cholesterol esterase, hexokinase, and uricase, respectively. Dye binding techniques were used for the calcium and albumin determinations and total protein was determined by biuret method.

22 ERDC/CERL TR-05-5
Cell counts and metabolite concentrations of treated birds were compared to control values and to published reference intervals that define the normal limits for healthy populations of passerine species (Altman et al. 1997). Among groups, determination of significant differences concerning the same parameter was measured using one-way analysis of variance (ANOVA) at an alpha level of 0.05 and the means sepa-rated by Dunnett’s t-test. When data were nonparametric as determined by Bar-lett’s test of equal variance (p ≤ 0.05), the Kruskal Wallis test was used (Zar 1974). Those blood parameters expressed in a ratio were analyzed using an arcsine trans-formation. The software system SAS® (SAS Institute, 1995, Cary, North Carolina) was used to conduct all statistical analyses.
Body Weight and Organ Mass
Body weights were measured to the nearest gram on a Sartorius QS4000 balance at 4 weeks prior to exposure, at exposure (Day 0), and at days 14, 24, 36, and 46 post treatment. Organ weights were obtained at necropsy. The tissue mass was deter-mined to the nearest milligram using a Mettler AE260 Analytical Balance. Prior to each weighing session, the scale and balance calibrations were checked using a cali-brated Troemner (Philadelphia, Pennsylvania) metric weight set (2 mg to 100 g). The balance and weight set calibrations are traceable to National Institute of Stan-dards and Technology standards. Body weight data were analyzed using one-way analysis of variance (ANOVA) to test for differences in mean body weights among test groups. Organ weights were expressed on a percentage of body weight basis and an arcsine transformation applied to this proportion. The arcsine transformed data were also tested by ANOVA. Treatment group means were compared to the mean weight of the control group by Dunnett’s t test (Zar 1974). Statistical analy-ses were made using the software system SAS® (SAS Institute, 1995, Cary, North Carolina).
Behavior
Behavioral observations were made twice daily (see Mortality and Clinical Signs of Toxicity and/or Stress, page 20) for 1 week prior to fog oil exposure and for Days 0 through 5 and Days 13, 23, 35, and 45 post-exposure. Observers were outfitted with Swarnovski/Habicht SL 10 X 50 binoculars. Birds were observed 30 minutes in the morning and 30 minutes in the late afternoon and for 30 minutes after return to the aviary following exposure. In addition to general signs of stress or disease (see Mor-tality and Clinical Signs of Toxicity, page 20), the observers were instructed to look for behaviors related to feather cleaning and those behaviors that have been ob-served in birds dosed with crude or refined oils (Hartung 1967; Croxall 1977; Flem-ing et al. 1982). These behaviors included thermal deficient behaviors such as in-creased feeding, hiding, and lethargy, and postural abnormalities wherein the head
ERDC/CERL TR-05-5 23
is held close to the body and the breast held lower than in normal stances during walking or standing. The number of birds engaged in each of these behaviors dur-ing the observational periods was compared to the number of control birds display-ing similar behaviors during the same period. A video record was made of any prominent behavioral changes as they occurred.
After the first 2 recaptures of the cowbirds for body weight measurement, it ap-peared that birds from some treatment groups were more easily caught than birds from control groups. Therefore the order of capture was recorded for each of the subsequent capture events. Although the group identification was always recorded, the individual bird identity record related to capture order was not complete for two of the recapture events. At the end of the study, the birds were categorized by ease of capture for each capture event and placed in 1 of 5 capture categories for any given day of capture. The categories represented the first 20 percent captured, the second 20 percent captured, and so forth.
Because conclusions from these data were greatly impacted by omissions in the data collection (no pre-exposure capture order, no data during the exposures period and immediately post exposure, and missing data tracking individual bird capture), the subsequent design of the red-winged blackbird exposure study included pre-exposure capture events and individual as well as group identification for all post-exposure recaptures.
In addition, the group assignment method was altered so those members of capture categories were distributed equally among groups. The capture data were tabulated in contingency tables and analyzed by the Chi-square statistic (Zar 1974). The fre-quency of capture for each treatment group was compared to the control group and the alpha value reported.
Weather Measurements
Wind speed, temperature, relative humidity, and rainfall were monitored through-out the acclimation and test phases of the studies using a Met One (Grants Pass, Oregon) weather station equipped with a Model 034 wind sensor.
24 ERDC/CERL TR-05-5
3 Results and Discussion Graphite flake was found in the lung and feces of exposed birds. More flakes ap-peared to be deposited in the lungs of birds exposed to graphite flake without fog oil. However, greater numbers of flakes were seen in the feces of birds exposed to graph-ite flake cogenerated with fog oil. An immune response to the flake was only ob-served in birds exposed to graphite flake without fog oil. These data suggest that flake deposition in the lung was reduced when flake was cogenerated with fog oil and may be related to coagulation of the flakes in the presence of fog oil.
Generation of fog oil results in changes in chemical composition of the oil. Primar-ily, the concentration of acutely toxic naphthalene was reduced by about 98 percent and the number and concentration of high molecular weight PAHs was increased. However, the airborne concentrations of the high molecular weight PAHs were very low to nondetectable. Estimated oral doses of oil and PAHs from preening were much lower than levels reported to cause hypothermia, gross pathologies, tissue damage, or death.
Exposure Characterization
Mean airborne concentrations of graphite flake and fog oil and the mean droplet size of the exposure aerosols were comparable to those measured in or predicted for field tests (Driver et al. 1993a,b). The high exposure concentrations were similar to near source values. Fog oil and PAH exposure appeared to be low for both inhaled and oral (preened) routes. Graphite flake ingestion from preening or from swallow-ing mucous expelled from the respiratory tract was less than 1 mg/kg body weight. Cogeneration with fog oil appeared to reduce the particle loading of the lung.
Graphite Flake and Fog Oil Concentration and Droplet Size
The airborne concentration of test material for each cowbird exposure is shown in Table 2. For cowbirds, the mean graphite flake concentrations over the 4 consecu-tive days of exposure were 34 mg/m3 and 69 mg/m3 for the low and high graphite only exposures, respectively. The mean graphite flake concentrations during the cogeneration tests were also 34 mg/m3 and 69 mg/m3. Fog oil concentrations for these tests were 121 mg/m3 and 103 mg/m3, respectively. In the single 1-hour expo-sures, the graphite concentrations were 59 mg/m3 for the graphite flake only expo-

ERDC/CERL TR-05-5 25
sure and 55 mg/m3 when generated simultaneously with fog oil. The fog oil concen-tration during the 1-hour single exposure was 131 mg/m3.
Table 2. Concentration of test material during the cowbird exposures. Estimated Component Concentration Within Mixed Aerosols
Test Aerosol
Exposure Day
Measured Total Concentration (mg/m3)
Std Dev (mg/m3)
Coeff Variation (%)
Fog Oil (mg/m3)
Graphite Flake (mg/m3)
GF only (a) 0 55.1 8.6 15.6 --- --- GF only 0 26.6 3.6 13.4 --- --- GF only 1 72.2 10.9 15.1 --- --- GF only 1 35.1 2.5 7.1 --- --- GF only 1 72.2 10.9 15.1 --- --- GF only 1 35.1 2.5 7.1 --- --- GF only 2 68.9 6.9 10.0 --- --- GF only 2 32.5 3.6 10.9 --- --- GF only 3 79.72 15.15 19.0 --- --- GF only 3 40.03 6.55 16.4 --- --- GF/FO (b) 0 211.9 35.4 16.7 156.8 55.1 GF/FO 0 151.3 3.7 2.5 124.7 26.6 GF/FO 1 182.1 5.5 3.0 109.9 72.2 GF/FO 1 138.5 3.5 2.5 130.4 35.1 GF/FO 2 162.1 0.6 0.4 93.2 68.9 GF/FO 2 148.6 18.0 12.1 116.1 32.5 GF/FO 3 202.1 15.07 7.5 122.4 79.7 GF/FO 3 106.3 6.82 6.4 66.3 40.0 (a) Unmixed aerosol of graphite-flake only. (b) Mixed (cogenerated) aerosol of graphite-flake and fog oil.
The test concentrations for the blackbird exposures are shown in Table 3. Black-birds were exposed to a mean concentration of 37 mg/m3 of graphite flake during the graphite only exposures. The mean graphite concentration for the mixed aerosol was 185 mg/m3. The mean fog oil concentration in the mixed aerosol was 298 mg/m3.

26 ERDC/CERL TR-05-5
Table 3. Concentration of test material during the blackbird exposures. Estimated Concentration of Components in Mixture
Test Aerosol
Exposure Day
Measured Total Concentration (mg/m3)
Std Dev (mg/m3)
Coeff Variation (%)
Fog Oil (mg/m3)
Graphite Flake (mg/m3)
GF (a) 0 38.03 7.87 20.69 --- --- GF 1 37.20 7.33 19.70 --- --- GF 2 34.72 6.88 19.82 --- --- GF 3 36.38 8.96 24.63 --- --- GF/FO (b) 0 633.27 108.42 17.12 357.14 220.90 GF/FO 1 511.74 58.31 11.39 287.70 179.18 GF/FO 2 656.42 172.48 26.28 370.37 228.84 GF/FO 3 314.98 65.21 20.70 175.26 111.78 (a) Unmixed aerosol of graphite-flake only. (b) Mixed (cogenerated) aerosol of graphite-flake and fog oil.
The aerodynamic mass median diameter (AMMD) of the fog oil smoke droplets was 1.1 µm with a geometric standard deviation (GSD) of 1.7 (Figure 8). The graphite flake size distribution when generated without fog oil is shown in Figure 9. The flake size was 3.5 AMMD with a GSD of 2.1. A slight bimodality was apparent in the graphite flake distribution. These droplet distributions are typical of oil aero-sols generated in the field (Driver et al. 1993a,b).
Figure 8. Particle size distribution of fog oil smoke. The AMMD was 1.1 µm with a GSD of 1.7.
ERDC/CERL TR-05-5 27
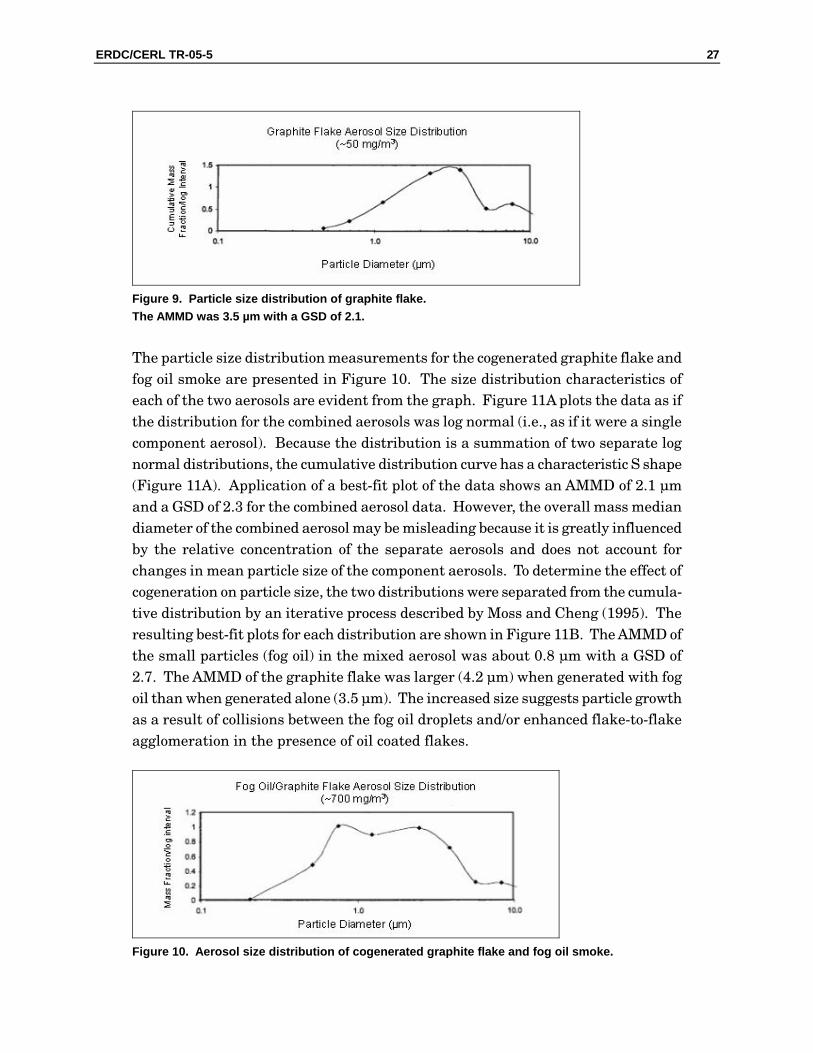
Figure 9. Particle size distribution of graphite flake. The AMMD was 3.5 µm with a GSD of 2.1.
The particle size distribution measurements for the cogenerated graphite flake and fog oil smoke are presented in Figure 10. The size distribution characteristics of each of the two aerosols are evident from the graph. Figure 11A plots the data as if the distribution for the combined aerosols was log normal (i.e., as if it were a single component aerosol). Because the distribution is a summation of two separate log normal distributions, the cumulative distribution curve has a characteristic S shape (Figure 11A). Application of a best-fit plot of the data shows an AMMD of 2.1 µm and a GSD of 2.3 for the combined aerosol data. However, the overall mass median diameter of the combined aerosol may be misleading because it is greatly influenced by the relative concentration of the separate aerosols and does not account for changes in mean particle size of the component aerosols. To determine the effect of cogeneration on particle size, the two distributions were separated from the cumula-tive distribution by an iterative process described by Moss and Cheng (1995). The resulting best-fit plots for each distribution are shown in Figure 11B. The AMMD of the small particles (fog oil) in the mixed aerosol was about 0.8 µm with a GSD of 2.7. The AMMD of the graphite flake was larger (4.2 µm) when generated with fog oil than when generated alone (3.5 µm). The increased size suggests particle growth as a result of collisions between the fog oil droplets and/or enhanced flake-to-flake agglomeration in the presence of oil coated flakes.
Figure 10. Aerosol size distribution of cogenerated graphite flake and fog oil smoke.

28 ERDC/CERL TR-05-5
A. Size distribution plotted as a single aerosol, but demonstrating a cumulative summation of two log-normal distributions.
B. Best-fit curves for the separate size distributions.
Figure 11. Size distribution of fog oil droplets and graphite flake in cogenerated aerosol. The horizontal axis displays both probit (whole number) and cumulative mass percentage values.

ERDC/CERL TR-05-5 29
Elemental Composition of Graphite Flake
Elemental composition of the graphite flake obscurant is shown in Table 4. The graphite flake contained about 0.1 percent silica, an element implicated in fibro-genic disease of the lung. This level of silica, however, is below concentrations that induce silicosis in test animals exposed to carbon dusts (Thomson et al. 1986 and 1987, Anderson et al. 1989). Other elements detected in the flake totaled less than 0.09 percent of the graphite composition. Results are also shown for our analyses of the National Institute of Standards and Technology (NIST) coal standard and the cellulose comparison sample. Table 4. Elemental composition of the graphite flake obscurant.
Graphite Flake Reference Standards
Elements Rep1 Rep2 Cellulose Spike Coal
Percent Recovery
Si 950* 1179 2700 36000 113
P ND (a) ND (a) 295 ND (a) 326
S 117 97 ND (b) 14230 105
Cl ND (c) ND (c) 58 1037 128
K 57.3 69.9 7.5 2920 121
Ca 267 285 46.9 4660 123
Ti 56 61.6 ND (d) 946 95
V 10.2 10.2 ND (e) 45 129
Cr 15.9 21.5 ND (f) 19.1 96
Mn 4.1 3.9 ND (g) 39.9 106
Fe 217 203 5.5 8420 107
Co ND (h) ND (h) ND (h) 18.0 267
Ni 2.9 3.47 1.03 16.1 114
Cu 48 79.4 ND (i) 18.8 104
Zn ND (j) ND (j) ND (j) 33.9 95
Ga ND (k) ND (k) ND (k) 5.25 74
Hg ND (l) ND (l) ND (l) ND (l) NA
Se ND (m) ND (m) ND (m) 2.1 70
Pb ND (n) ND (n) ND (n) 10 42
As ND (o) ND (o) ND (o) 4.78 82
Br ND (p) ND (p) ND (p) 17.5 92
Rb ND (q) ND (q) ND (q) 20 100
* Values are in ppm.
(a) P < 450; (b) S < 50; (c) Cl < 41; (d) Ti < 16; (e) V < 10; (f) Cr < 7.2; (g) Mn < 2.5; (h) Co < 18; (i) Cu < 1.1; (j) Zn < 1.1; (k) Ga < 1.3 (l) Hg < 3.9; (m) Se < 0.94; (n) Pb < 2.7; (o) As < 1.2; (p) Br < 0.87; (q) Rb < 1.1.

30 ERDC/CERL TR-05-5
Concentration of Polynuclear Aromatic Hydrocarbons in Fog Oil Aerosols
The composition of the fog oil before generation is shown in Table 5. Concentrations of lower and higher molecular weight PAHs in the pregeneration oil totaled 266 ppm and 32 ppm, respectively. These concentrations are low and are less than half of the PAH concentrations found in the pregeneration fog oil from an earlier experiment (Driver et al. 2002a). No PAHs were detected in post-generation samples. Genera-tion may not have been long enough to collect sufficient samples for PAH detection (but represents the amount to which the birds were exposed). In the previous study, the composition of the fog oil changed during generation, producing an aerosol with greatly reduced levels of naphthalene (a compound very toxic to birds) and minimal concentrations of higher weight PAHs. Because the airborne concentration of fog oil in the previous study was about 4 times greater than that of the current study and the levels of the toxic components were low; it is unlikely that the cowbirds in the current study were exposed to harmful levels of PAHs.
No fog oil was found (< detection limit of 1 µg/g) on the feathers of taxidermic birds exposed for 30 minutes to airborne fog oil concentrations of 120 mg/m3 or less. A fog oil deposition rate of 2.8 µg/g feathers/min to 5.5 µg oil/g feathers/min has been de-termined in a previous study (Driver et al. 2002a) for birds sitting in aerosols of about 400 mg/m3. From these data a rough estimate of the deposition rate of fog oil in a 100 mg/m aerosol would be about 0.7 µg/g feathers/min to 1.4 µg/g feathers/min.
With deposition rates of fog oil on feathers about 0.7 µg/g feathers/min to 1.4 µg/g feathers/min, oil accumulations of 0.09 mg/g of feathers to 0.19 mg/g of feathers could be expected for birds exposed to 100 mg/m3 for 30 minutes. Typically, birds contaminated in oil spills preen between 20 and 50 percent of the oil deposited to feathers within an 8-hour period (Hartung 1963, 1967). Assuming a worst-case sce-nario that birds would ingest, from preening, 100 percent of the feather-deposited fog oil and using Equation 1 (page 18), the accumulated dose over 4 days for red-cockaded woodpeckers exposed for 30 minutes to fog oil concentrations of 100 mg/m3 is estimated to be 26 mg/Kg to 48 mg/Kg in adult males. These doses are considera-bly lower than those found to be harmful to birds ingesting unrefined oils (Hartung and Hunt 1966, Chia 1971). Significant pathologies from preening unrefined petro-leum oils have been observed only in waterfowl that have obtained doses of at least 1 ml/Kg (Hartung and Hunt 1966, Chia 1971). No toxic or gross lesions were asso-ciated with fog oil exposure in the current study. Therefore, preening does not ap-pear to be a toxicologically significant route of uptake for concentrations of aerosol-ized fog oil used in military exercises.

ERDC/CERL TR-05-5 31
Table 5. Fog oil composition before and after generation. Conc (µg/g Fog Oil)
Constituent Before Generation
After Generation(a)
Lower Molecular Weight PAHs:
Naphthalene 78.5 1.8
1-methyl naphthalene 98.3 <MDL(b)
Biphenyl 22.2 <MDL
2, 6 dimethyl naphthalene 110 <MDL
2,3,5 trimethyl naphthalene 71.9 <MDL
Acenaphthylene <MDL 2.5
Acenaphthene 8.9 3.2
Fluorene 32.4 21.5
Dibenzothiophene 335 264.0
Phenanthrene 165 162.0
1 methyl phenanthrene 50 <MDL
Anthracene 23.9 15.2
Fluoranthene 14.6 27.2
Higher Molecular Weight PAHs:
Pyrene 9.1 40.2
Benzo(a)anthracene <MDL 14.5
Chrysene 52.7 57.2
Benzo(b)fluoranthene <MDL <MDL
Benzo(k)fluoranthene <MDL <MDL
Benzo(e)pyrene <MDL <MDL
Benzo(a)pyrene <MDL <MDL
Perylene <MDL <MDL
Indeno(123-cd)pyrene <MDL <MDL
Dibenzo(a,h)anthrancene <MDL <MDL
Benzo(g,h,I)perylene <MDL <MDL
PAH Deposition on Feathers and Estimated Oral Dose
It has been suggested that the differences in toxicity observed for various crude oils and other petroleum products in birds are due to the variability in the aromatic composition of the oils (Leighton 1982). Because the toxicity of petroleum oil is largely attributed to its PAH content (Hoffman 1979; Patton and Dieter 1980; Pea-kall et al. 1981, 1982), the oral dose of the individual and combined PAHs in the fog
32 ERDC/CERL TR-05-5
oil were estimated. However, no detectable levels of either the concentrations of low molecular weight (2 and < 4 benzene rings) or high molecular weight (>4 benzene rings) PAHs were found on feathers of taxidermed birds exposed to fog oil aerosol or on foil deposition coupons after 30 minutes of exposure. Assuming a linear relation-ship between the deposition rate (ng of total PAH/g feathers/min) of PAH on feath-ers and the airborne fog oil concentration as described in Driver et al. (2002a), the oral uptake of low molecular weight PAHs from preening contaminated feathers was estimated. For an airborne concentration of 100 mg/m3, the rate of PAH deposition would be about 3.5 ng/g feathers/min. Assuming the worst case scenario described in Concentration of Polynuclear Aromatic Hydrocarbons in Fog Oil Aerosols, (page 30) a male red-cockaded woodpecker could receive an oral dose of low molecular weight PAH of about 0.008 mg/Kg after 30 minutes of exposure. This dose is con-siderably lower than the 25 mg/Kg “no effect” dose estimated for PAHs in wild birds (Driver et al. 2002a).
Estimate of Oral Exposure to Graphite Flake
Birds appeared to be swallowing a large number of graphite flakes (Table 6); how-ever, ingestion of the flake on a mass basis (via preening and from respiratory clear-ance) was minimal (Table 6). Cumulative oral doses were estimated to be less than 85 µg/Kg for the cowbirds over the first 4 days of the test. Of interest is the pattern of greater excretion of graphite flakes by birds exposed to fog oil during the graphite exposures (Table 6). Birds exposed to the cogenerated aerosols excreted about 20 percent more flakes per gram of feces, and they also excreted about 40 to 100 per-cent more total flake mass than birds exposed to aerosols of graphite flake alone. These data parallel the diminished deposition of graphite flake in the deep lung of birds exposed to the cogenerated aerosol and the leukocyte response in these birds (see Histopathology, page 38 and Clinical Pathology – Hematology and Blood Chem-istry, page 21). The increase in excreted flakes may be due to agglomeration of the flakes with fog oil droplets and flakes in the presence of fog oil. The resulting in-crease in particle size would likely lead to greater deposition of flakes on feathers and therefore greater ingestion from preening. The increase in AMMD would also result in less penetration to lung and greater deposition in the upper regions of the respiratory tract where the material would be more readily removed via the muco-ciliary escalator.
Graphite flake within the feces of a bird exposed to a field typical concentration of graphite flake is shown in Figure 12.

ERDC/CERL TR-05-5 33
Table 6. Number of graphite flakes in feces of cowbirds exposed to graphite flake aerosols or cogenerated aerosols of graphite flake and fog oil for 4 days and estimated mass of ingested flake per bird.
Treatment
Number of Flakes in Feces (Flake/g Feces)
Mass Graphite Flake Ingested (ng/bird)
Control 0 0
Graphite Flake
35 mg/m3 3,062,500 1,647
70 mg/m3 2,864,583 1,719
Graphite Flake/Fog Oil
35 mg/m3 3,723,404 2,457
70 mg/m3 3,625,000 3,177
Figure 12. Graphite flake in feces of a cowbird. The cowbird was exposed to 35 mg/m3 of graphite flake 30 minutes per day for 4 consecutive days.
Estimate of Inhalation Dose of Graphite Flake
The amount of graphite flake estimated to deposit in the cowbird lung after 4 expo-sures was about 0.11 mg/g lung for aerosols containing 35 mg/m3 graphite flake and 0.25 mg/m3 for aerosols containing 70 mg/m3 graphite flake. Single 1-hour expo-sures to aerosols containing 60 mg/m3 graphite flake were estimated to deposit about 0.10 mg/g lung in the bird lungs. Red-winged blackbirds exposed to 185 mg/m3 graphite flake may have received as much as 0.6 mg/g lung. These estimates assume all respirable particles will deposit in the lung and that particle size is not changed during aerosol generation. However, particle coalescence is possible in the presence of fog oil; the deposition may be less in lungs of birds exposed to the cogen-erated aerosols.

34 ERDC/CERL TR-05-5
Response Measures
No mortality, clinical pathology, gross lesions, or behavioral deficits were induced by graphite flake alone or cogenerated with fog oil. Histologic lesions were not clini-cally significant and appeared to be related to prior antigenic exposure. A small number of birds had fatty liver lesions probably related to diet and onset of ovula-tion. Minimal to mild anthracosis was observed in treated birds. No tissue damage was evident in the lungs. A WBC response, presumably to the lung-deposited flake, was subclinical at the time of necropsy but was greater in birds exposed to graphite flake without fog oil. Reduced deposition or retention of graphite flake was ob-served in birds exposed to the cogenerated aerosol. No leukocyte response was ob-served in birds exposed to the fog oil.
Mortality, Clinical Signs of Toxicity, and Behavioral Abnormalities
Cowbirds exposed for 30 minutes/day for 4 consecutive days to up to 70 mg/m3 of graphite flake or mixed aerosols of graphite flake and fog oil smoke did not die or exhibit clinical signs of toxicity at anytime during the exposure or post-exposure pe-riod. No behavioral abnormalities were observed, including those associated with hypothermia, general stress, and oil-specific postural changes reported for oiled birds or birds fed diets containing petroleum products. Mortality and overt signs of toxicity were also lacking among birds subjected to the single 1-hour exposures. In-tense preening was observed in all birds including the exposure controls upon re-turn to the aviary. Aviary control birds did not exhibit this behavior indicating that the behavior was in response to the confinement/handling of the birds during trans-port and exposure rather than to the test material.
Cowbirds exposed to 35 mg/m3 graphite flake without fog oil appeared to be caught more readily than birds from the control group (p ≤ 0.04). These data imply that exposure to graphite flake may affect the vulnerability of cowbirds to predation for several weeks after exposure. However, exposure to a higher concentration of graphite flake (70 mg/m3) or to the same level (35 mg/m3) of flake in combination with fog oil did not result in a statistically significant behavioral change. In con-trast, cowbirds exposed to 70 mg/m3 graphite flake cogenerated with fog oil ap-peared to be captured later in order than control birds (P ≤ 0.01). Interpreting these data was further complicated by the lack of pre-exposure capture frequency and the capture order for the first two post-exposure captures. In addition, the individual capture order was not complete for each capture event. Also, the initial group as-signments may not have been random with respect to capturability. Without this information it is difficult to conclude that the behavioral deficit was induced by ex-posure to graphite flake rather than individual behavior in repeatedly captured birds.
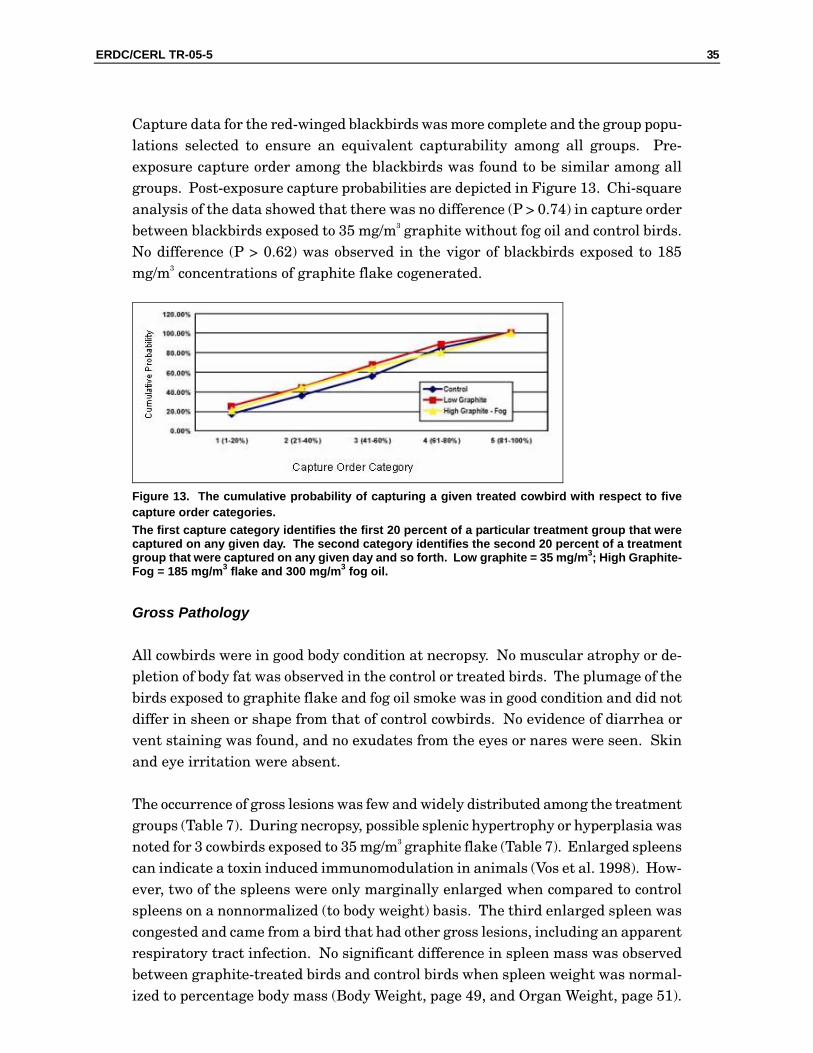
ERDC/CERL TR-05-5 35
Capture data for the red-winged blackbirds was more complete and the group popu-lations selected to ensure an equivalent capturability among all groups. Pre-exposure capture order among the blackbirds was found to be similar among all groups. Post-exposure capture probabilities are depicted in Figure 13. Chi-square analysis of the data showed that there was no difference (P > 0.74) in capture order between blackbirds exposed to 35 mg/m3 graphite without fog oil and control birds. No difference (P > 0.62) was observed in the vigor of blackbirds exposed to 185 mg/m3 concentrations of graphite flake cogenerated.
Figure 13. The cumulative probability of capturing a given treated cowbird with respect to five capture order categories. The first capture category identifies the first 20 percent of a particular treatment group that were captured on any given day. The second category identifies the second 20 percent of a treatment group that were captured on any given day and so forth. Low graphite = 35 mg/m3; High Graphite-Fog = 185 mg/m3 flake and 300 mg/m3 fog oil.
Gross Pathology
All cowbirds were in good body condition at necropsy. No muscular atrophy or de-pletion of body fat was observed in the control or treated birds. The plumage of the birds exposed to graphite flake and fog oil smoke was in good condition and did not differ in sheen or shape from that of control cowbirds. No evidence of diarrhea or vent staining was found, and no exudates from the eyes or nares were seen. Skin and eye irritation were absent.
The occurrence of gross lesions was few and widely distributed among the treatment groups (Table 7). During necropsy, possible splenic hypertrophy or hyperplasia was noted for 3 cowbirds exposed to 35 mg/m3 graphite flake (Table 7). Enlarged spleens can indicate a toxin induced immunomodulation in animals (Vos et al. 1998). How-ever, two of the spleens were only marginally enlarged when compared to control spleens on a nonnormalized (to body weight) basis. The third enlarged spleen was congested and came from a bird that had other gross lesions, including an apparent respiratory tract infection. No significant difference in spleen mass was observed between graphite-treated birds and control birds when spleen weight was normal-ized to percentage body mass (Body Weight, page 49, and Organ Weight, page 51).

36 ERDC/CERL TR-05-5
Splenic “enlargement” was not seen grossly in birds exposed to the same concentra-tion of graphite flake (35 mg/m3) when cogenerated with fog oil smoke or in birds exposed to 70 mg/m3 of graphite flake alone or in combination with fog oil. Further, no treatment-induced histologic abnormalities of the spleen were observed (Histopa-thology, page 38).
Table 7. Incidence of gross lesions in cowbirds exposed to graphite flake or cogenerated graphite/fog oil smoke.
Tissues in Which Abnormalities were Found Treatment (mg/m3) Respiratory Gonad Spleen Peritoneum 4-Day Exposure: Graphite Only 0 -- -- -- -- 35 1/8(a) -- -- -- 70 -- -- 1/8(b) -- Graphite/Fog Oil 35 1/8(c) 1/8(d) 3/8(e) -- 70 -- -- -- -- 1-Hour Exposure: Graphite Only 0 -- -- -- -- 60 -- -- -- 1/5(f) Graphite/Fog Oil 60 -- -- -- -- Values are the number of birds with lesion/number of birds in test group. Exposure concentrations refer to the graphite flake content of aerosol. Fog oil concentrations for the mixed aerosols 121 mg/m3 for the low graphite 4-day exposures and 103 mg/m3 for the high 4-day graphite exposures. The fog oil concentration for the single exposure of mixed aerosol was 131 mg/m3. (a) Necrotic foci. (b) Slightly pale. (c) Petechial and ecchymotic hemorrhages. (d) Right testis atrophied; lesion occurred in same individual as denoted in (c). (e) Enlarged. Enlarged spleen from the same individual as denoted in (c) was also congested. (f) Large hematomain peritoneum (may have occurred during sacrifice).
The spleen of one blackbird appeared to be atrophied at necropsy, but when normal-ized to the body weight, was not different from the control spleen weight ratios and did not differ from the controls histologically.

ERDC/CERL TR-05-5 37
The only incidence of gross respiratory lesion seen in the cowbirds was the presence in the air sacs of one bird from the 35 mg/m3 graphite flake-only exposure group of white buttoned-shaped plaques suggestive of aspergillosis infection. Air sacs and lungs were clear in all other cowbirds.
The majority of gross lesions observed in the red-winged blackbirds were related to viral or fungal infection. The incidence of disease was unrelated to treatment (Table 8). Most blackbirds had mild papular lesions on unfeathered skin around the nares, eyes, and commissures of the beak suggestive of Avianpoxvirus infection. In three cases, the pox-like lesions were more severe and were also found in the buccal cav-ity. Poxvirus was confirmed histologically (Histopathology, page 38). A probable case of aspergillosis was observed in one individual.
A wide spectrum of gross pathology has been associated with acute toxicity of re-fined hydrocarbons. The most commonly reported visceral lesion is hemorrhagic gastroenteritis (Crocker et al. 1974, Langenberg and Dein 1982). Other gross le-sions associated with petroleum exposure are the same as those reported in birds debilitated by stress and include urate nephropathy and visceral gout, enlarged hemorrhagic adrenal glands, and focal myocardial degeneration (Crocker et al. 1974; Miller et al. 1978a,b; Pattee and Franson 1982; Szaro et al. 1978, 1981). None of these gross lesions were found in the fog oil-exposed cowbirds or blackbirds.
No gross lesions attributable to graphite exposure (e.g., abnormal coloration of the lung) were found in treated birds of either species.
Table 8. Incidence of gross lesions in red-winged blackbirds exposed to graphite flake or cogenerated graphite/fog oil smoke for 4 consecutive days.
Tissues in Which Abnormalities were Found Treatment (mg/m3) Respiratory Liver Spleen Pancreas
Avian Pox Lesion
0 -- -- -- 5/8 35 (Graphite Only) 1/8(a) 1/8(b) 1/8(c) 7/8 70 (Graphite/Fog Oil)
-- -- -- 9/12
Values are the number of birds with lesion/number of birds in test group. (a) Yellow nodules in air sacs (b) Atrophy (c) Slightly pale

38 ERDC/CERL TR-05-5
Histopathology
The histological lesions found in the cowbirds and red-winged blackbirds are listed in Tables 9 and 10.
Table 9. Incidence of histopathologic lesions in cowbirds exposed to graphite flake or cogenerated graphite/fog oil smoke.
Lymphocytic Lesions Treatment (mg/m3) Liver Pancreas Kidney Adipose Other
Fatty Change of the Liver Anthracosis
4-Day Exposure: Graphite Only 0 3/8 1/8 2/8 -- 1/8 (a) 1/8 2/8 (f) (g) 35 4/8 2/8 -- -- 2/8 (b) 1/8 7/8 (g) 70 4/8 1/8 -- 1/6 -- 1/8 2/8; 4/8 Graphite/Fog Oil 35 8/8 1/8 3/8 1/8 2/8 (c) 1/8 5/8 70 3/8 3/8 3/8 -- 3/8 (d) 2/8 7/8 (g) 1-Hour Exposure: Graphite Only 0 1/8 -- 1/8 -- -- -- 0/5 (g) 60 -- -- -- -- 2/8 (e) 1/8 5/5 (g) Graphite/Fog Oil 60 -- -- -- -- -- -- 2/5 Values are the number of birds with lesion/number of birds in test group. Exposure concentrations refer to the graphite flake content of the aerosol. Fog oil concentrations for the mixed aerosols 121 mg/m3 for the low graphite 4-day exposures and 103 mg/m3 for the high 4-day graphite exposures. The fog oil concentration for the single exposure of mixed aerosol was 131 mg/m3. (a) Focal granuloma surrounding ova of an helminth parasite. (b) Granulomatous dermatitis at cloaca; lymphocytic myocarditis and epicarditis. (c) Multifocal lymphocytic myocarditis; multifocal lymphocytic pericholangitis. (d) Mild focal lymphocytic pericholangitis; focal lymphocytic myocarditis; mild focal lymphocytic encephalitis. (e) Lymphocytic pericholangitis; mild lymphocytic adrenalitis. (f) Ranked on a severity scale of minimum, mild, moderated, and marked, the first ratio is the number of birds with minimum severity anthrocosis (i.e., very few flakes present; no fibrotic tissue changes); second ratio is the number of birds with mild severity anthracosis (i.e. few flakes present, no fibrotic tissue changes). No moderate or marked cases were found. Note that in the two cases of minimum anthracosis in the control group, 1 case of the 35 mg/m3 graphite-only birds, and 3 cases of the 35 mg/m3 mixed aerosol exposed birds, the black pigmentation did not appear to be similar in structure to the graphite flake. (g) Minimal amount of “dust” and/or silica present in the lungs of at least 1 bird of the test group. These contaminants were unrelated to the obscurants.

ERDC/CERL TR-05-5 39
Table 10. Incidence of histopathologic lesions in red-winged blackbirds exposed to graphite flake or cogenerated graphite/fog oil smoke for 4 consecutive days.
Treatment (mg/m3) Hepatitis Liver/Biliary Hyperplasia
Dermatitis (Avian Pox) Parasites Anthracosis
0 -- -- 5/8 6/8 (b) 0/8 (d)
35 (Graphite Only) 1/8 (a) -- 7/8 3/8 (b) 4/8; 2/8 (e)
70 (Graphite/Fog Oil) -- 1/8 9/12 5/12 (c) 8/12; 3/12
Values are the number of birds with lesion/number of birds in test group. (a) Focal granulomatous hepatitis. (b) Intestinal coccidian. (c) Coccidia in 5 birds; 1 bird with helminth within the proventriculus. (d) Ranked on a severity scale of minimum, mild, moderate, and marked, the first ratio is the number of birds with minimum severity anthrocosis (i.e., very few flakes present; no fibrotic tissue changes); second ratio is the number of birds with mild severity anthracosis (i.e. few flakes present, no fibrotic tissue changes). No moderate or marked cases were observed. (e) Minimal amount of “dust” and/or silica present in the lungs of at least 1 bird in the test group. These contaminants were unrelated to the obscurants.
A large number of the cowbirds had nonspecific, multifocal lymphocytic to granulo-matous hepatitis (Figure 14). This lesion was mild to moderate in severity and was likely due to prior antigenic exposure, particularly in response to such infectious agents such as bacteria and mycoplasma species or to parasite migration (Yoder 1984). A few cowbirds had lymphocytic pancreatitis and interstitial nephritis, again nonspecific and probably incidental findings given their broad distribution among treatment groups (including the controls).
Figure 14. Liver tissue from a control cowbird showing multifocal granulomatous hepatitis.
Mild infections of coccidiosis were observed histologically in most of the cowbirds and blackbirds (Figure 15). Although intestinal coccidiosis was present, no evidence of intestinal damage was observed histologically in infected birds, and it did not con-

40 ERDC/CERL TR-05-5
found the histopathologic response in this tissue. Coccidial infection was observed in both control and treated birds equally and followed a subclinical course inde-pendent of the treatments.
Figure 15. Mild coccidiosis in the intestines of a cowbird.
Only a few blackbirds had nonspecific inflammatory lesions (Table 10). However, proliferative and inflammatory lesions of epithelial tissue due to a poxvirus were observed in birds from all groups. The poxvirus was confirmed by the presence of intracytoplasmic eosinophilic inclusions (Bollinger bodies) in the tissue.
Splenic tissue was normal in all cowbirds. In contrast, the spleens of all the black-birds (including controls) showed degeneration of lymphocytes within lymphoid fol-licles. The overall lack of lesions in the blackbirds suggests that this lymphocyte degeneration may be a normal change (apoptosis) representing turnover of lym-phoid cells in the spleen.
Fatty change of the liver, a reversible hepatocelluar change, was observed in 7 cow-birds. Mild degenerative changes in the liver, including fatty change, have been ob-served in a number of wild or experimentally oiled birds (Hartung and Hunt 1966; Beer 1968; Snyder et al. 1973; Szaro et al. 1978, 1981; Pattee and Franson 1982). Although fatty change indicates cell injury, it is not specific for any particular etiol-ogy. Metabolic disturbances as well as toxicities can cause this lesion (Lumeij 1994). For example, birds on high energy diets (e.g., mealworms or formulated diet) and limited exercise have developed fatty liver syndrome with the onset of egg produc-tion, presumably because of the increase in liver lipogenesis induced by estrogen to supply the developing ova (Jordan 1990). Of the seven cowbirds with fatty change, six were female. Overall, the incidence of fatty liver was low and did not appear to

ERDC/CERL TR-05-5 41
be related to obscurant exposure (Table 9). No incidence of fatty degeneration of the liver was found in the female red-winged blackbirds exposed to graphite and mixed graphite fog oil aerosols at similar or much higher concentrations (Table 10). Nota-bly, the blackbirds were exposed to the treatments after the end of the reproductive season. Also, fatty livers were not observed in a previous study in which red-winged blackbirds were exposed to 400 mg/m3 of fog oil for 4 hours (Driver et al. 2002a).
The liver of one red-winged blackbird exposed to a cogenerated aerosol of 185 mg/m3 graphite flake and 300 mg/m3 of fog oil had a focus of biliary hyperplasia with a mixed inflammatory cell response including heterophils (Figure 16). The cells of the hyperplastic tissue appeared mature and exhibited little pleiomorphism. No pe-ripheral tissue compression or invasion by the biliary tissue was apparent. Tissue hyperplasia adjacent to inflammatory lesions is common in birds (Campbell 1994). Biliary hyperplasia is also commonly found in birds exposed to aflatoxin, a my-cotoxin produced by Aspergillus flavus and other fungal species. Aflatoxin is a con-taminant found in a wide variety of seeds consumed by birds (Dumonceaux and Harrison 1994). Because tissue hyperplasia adjacent to inflammatory lesions or in response to mycotoxin exposure can be expected in wild caught birds, the isolated incidence of biliary hyperplasia appears to be unrelated to obscurant exposure. With the exception of the fatty degeneration of the liver, none of the wide variety of histologic changes in organ morphology that have been documented in oiled birds (Hartung and Hunt 1966; Beer 1968; Pattee and Franson 1982; Snyder et al. 1973, Szaro et al. 1978, 1981) were observed in the treated cowbirds or blackbirds. The most common lesions reported for oil-treated birds are intestinal necrosis, pneumo-nia, and renal tubule nephrosis, none of which were observed in the cowbirds or blackbirds exposed to aerosols containing fog oil.
Figure 16. Biliary hyperplasia in liver of a red-winged blackbird.
Anthracosis, the occurrence of exogenous black pigmentation in the lung caused by inhalation of carbon particles, was observed in 67 percent of the cowbirds and 65
42 ERDC/CERL TR-05-5
percent of the red-winged blackbirds that were exposed to graphite flake alone or in combination with fog oil (Tables 9 and 10). Only 4 percent of the treated cowbirds and 10 percent of the treated blackbirds had sufficient pigment in lung tissue for the lesion to be considered mild. Most of the treated birds had minimal lung pig-mentation. Notably, birds exposed to high concentrations of graphite flake had greater incidence of anthracosis and greater severity of the lesion compared to birds exposed to the same concentration of flake in combination with fog oil. This appar-ent decreased deposition (or greater clearance) of flakes in birds exposed to cogener-ated aerosols may be due to particle coalescence/adherence in the presence of fog oil. Coalescence may occur within the plume and/or the nasal turbinates and trachea of the birds. Particle growth is a well documented phenomenon (Green and Lane 1964) and coagulation of multicomponent aerosols has been shown to increase parti-cle size during inhalation in humans (Ingebrethsen 1989). As shown in Figures 11 and 12, the particle size distribution of the graphite flake appeared to change when the flake was cogenerated with fog oil resulting in a somewhat larger AMMD. It is possible that collisions of the flakes with fog oil droplets increased the flake size, or that fog oil coated the graphite flakes and enhanced flake-to-flake coagulation. Par-ticle growth during inhalation was not measured. Such flake growth would result in altered depositional patterns in the respiratory system. In a study using fluores-cent microspheres, the nasal operculum in quail (Colinus virginianus) chicks was shown to effectively filter out particles greater than about 2 µm in diameter (Driver et al. 1990). Even if the opercula of adult passerines allow particles greater than 2 µm to enter the nasal turbinates, enlarged flakes would deposit in higher regions of the lung or nasal passages than would flakes from the single component aerosol and would be cleared from the respiratory tract by the mucociliary escalator. This rapid clearance of larger particles may be reflected in the greater graphite concentrations in the feces of the birds exposed to the graphite flake cogenerated with fog oil (Esti-mate of Oral Exposure to Graphite Flake, page 32).
The dark, flake-shaped particles in the cowbird and blackbird lungs were found in the airway epithelial layers and in bronchus associated lymphoid tissue (BALT, Fig-ure 17). The particles were scattered with focally intense accumulations in these areas. This response is expected as the foreign particles are gathered phagocytically and “stored” perivascularly in BALT, or in interstitial tissues, or are cleared from the lungs via the mucociliary escalator (Klika et al. 1997, Scheuermann et al. 1997).

ERDC/CERL TR-05-5 43
Figure 17. Anthracosis of blackbird lung. Flakes (A) appear as dark particles. The blackbird was exposed to 185 mg/m3 of graphite flake co-generated with 300 mg/m3 of fog oil 30 minutes per day for 4 consecutive days.
Two cowbird controls also had a small amount of dark pigmented material in lung tissue; however, it differed markedly in appearance from the material found in the lung tissue of the treated birds. The pigmented material in the control lungs was globular in form with some refractivity compared to the nonrefractive black flakes seen in the lung tissue of the birds exposed to the obscurant aerosols. The globular material was also found in a few treated birds and appeared to be “dust.”
Pigments in the lung can injure or kill macrophages during phagocytosis, releasing compounds that induce fibrosis. If severe enough, the fibrosis can lead to respira-tory insufficiency and is suspected of predisposing animals to pulmonary infections (Jones and Hunt 1983). Pulmonary damage has been reported for humans and ani-mals exposed to natural graphite dusts (Gaensler et al. 1966; Klienerman et al. 1979; Martin et al. 1972; Hilscher and Schlipkoter 1972). The reported damage ranges from reticulin deposits to massive fibrosis of the respiratory tissue (Gaensler et al. 1966, Klienerman et al. 1979). These lesions, however, are often attributable to fibrogenic impurities such as silica rather than graphite particles. Synthetic graphite flake of obscurant quality contains only trace quantities of these impuri-ties. The graphite flake in the current study contained about 0.1 percent silica (Ta-ble 4), which is below levels that induce silicosis in mammals (Thomson et al. 1986 and 1987, Anderson et al. 1989).
Although normal clearance mechanisms may be capable of removing all of the parti-cles when the exposure is low, repeated or chronic exposure to high concentrations of even low silica carbon particles can overwhelm the lung clearance mechanisms and fibrosis can form in response to the retained particles (Lee 1985, Thomson et al. 1988). There have been no studies which examined lung clearance rates or mecha-nisms in birds. In mammals, inhalation of large quantities of particles over a long
44 ERDC/CERL TR-05-5
period of time is required before a moderate lesion develops with corresponding symptoms (Jones and Hunt 1983). The amount of nontoxic dust associated with lung overload appears to be about 1 mg dust/g lung in rats. Retardation of lung clearance, which accelerates the accumulation of dust, occurs at about 0.5 mg dust/g lung in rats (Morrow 1992, Pritchard 1989). The critical deposition rate above which macrophage-mediated lung clearance is overwhelmed has not been determined. If lung clearance in birds is overwhelmed at similar dust concentrations as those for rats, then exposure for 30 minutes to field typical levels (35 mg/m3) of graphite flake for 8 consecutive days could result in adverse health effects in birds having the same size-adjusted minute volume as cowbirds and female red-winged blackbirds (Table 6). Similarly, significant dust accumulation would be expected at 0.5 mg/g lung with an effective half-life of at least 2 months (Snipes 1989). However, dust retention only 1 month after exposure was minimal in lung tissue of the blackbirds that had estimated dust loadings of 0.6 mg/g lung (Table 6). Although these data may indicate that the threshold concentration is higher for blackbirds, they could also reflect reduced pulmonary deposition of flakes because of particle coagulation in the presence of fog oil aerosol.
A difference in the pulmonary defense system makes it difficult to extrapolate dust-induced effects on lung clearance in mammals to birds. This difference even may provide the avian lung with greater resistance to particulate damage. Recently it was demonstrated that birds lack cells that correspond to the alveolar macrophages of mammals. Instead, the entire epithelial surface in the parabronchi, atria, and part of the infundibulum is capable of taking up particulate matter and transport-ing the engulfed material to interstitial macrophages (Klicka et al. 1996, Scheuer-mann et al. 1997). Such an increase is phagocytic area is thought to explain the relatively high resistance of the avian lung to infectious agents (Gerlach 1994) and may be applied to the effective removal of other particles as well.
In the current study, no collagen deposition or alteration of lung structure was ob-served in either brown-headed cowbirds or red-winged blackbirds that were exposed to aerosols of graphite flake or cogenerated graphite flake and fog oil for 4 consecu-tive days. At the time of necropsy, there were only minimal amounts of graphite flake in lung tissue and no tissue-level indication of inflammation in the lung. These data indicate that birds can tolerate exposures to graphite flake of up to 185 mg/m3 for 4 consecutive days without clinically significant damage to the lung when cogenerated with fog oil.

ERDC/CERL TR-05-5 45
Clinical Pathology
Hematological response to the obscurant exposures was minimal and limited to graphite-only aerosols. No obscurant-induced changes in endpoint metabolites were observed.
Hematology
Hemolytic anemia, a well-documented pathology in birds that have been exposed to petroleum products (Leighton 1982, Leighton et al. 1985) was not observed in any of the treated cowbirds or blackbirds. Erythrocyte morphology was normal in all cow-birds. Only one red-winged blackbird had an abnormal erythron. This bird was ex-posed to the cogenerated aerosol (185 mg/m3 graphite flake and 300 mg/m3 fog oil) and displayed mild (+1) anisocytosis (size variation between red blood cells) and mild polychromasia (color variation between red blood cells). Although increases in erythrocyte polychromasia and anisocytosis are seen in clinical anemia, slight to mild polychromasia, such as observed in this bird, is common and is indicative of normal red blood cell regeneration (Richie et al. 1994). In addition, hematocrit lev-els for treated red-winged blackbirds were not different from those of controls (Table 11) and were within reference ranges reported for healthy passerines (Altman et al. 1997).
Table 11. Total and differential white blood cell counts for adult female red-winged blackbirds exposed to graphite flake aerosols and cogenerated aerosols of graphite flake and fog oil for 4 consecutive days.
Cell Type(a) Control Graphite Flake 35 mg/m3
Graphite Flake/Fog Oil 185 mg/m3
ANOVA P Value
Heterophile 61.3 (7.9) 57.8 (10.9) 61.1 (10.0) 0.97 Lymphocyte 36.4 (7.5) 38.5 (10.2) 36.9 (9.9) 0.99 Monocyte 2.4 (0.7) 3.5 (1.3) 1.9 (0.4) 0.38 Eosinophile 0 0 0 1.0 Basophile 0 0 0 1.0 Total WBC(b) 3000 (327) 3500 (289) 3714 (747) 0.60 PCV 60.3 (5.4) 67.3 (1.7) 64.3 (2.9) 0.58 Values are means with standard error in parentheses. Fog oil concentration in the cogenerated aerosol was 300 mg/m3. (a) Expressed as percentage of total number of WBCs. (b) Expressed as cells/µL.

46 ERDC/CERL TR-05-5
No toxic changes were observed in the leukocytes of both cowbirds and blackbirds. WBC counts were within normal ranges reported for passerines (3000 to 9000 cells/µL; Altman et al. 1997). However, the total number of leukocytes in peripheral blood was significantly elevated compared to controls in those cowbirds exposed for 4 days to 70 mg/m3 of graphite flake or to a single 1-hour exposure of 60 mg/m3 of graphite flake. Exposure to the same level of graphite flake in combination with fog oil did not result in elevated WBC counts in cowbirds.
Cogeneration with fog oil appeared to reduce the impact of graphite flake on WBC concentrations (Table 12) and paralleled the incidence and severity of anthracosis observed in the birds (see Histopathology, page 38). This reduced response may be a result of decreased deposition of the flake in the lung as a result of particle growth from agglomeration with fog oil droplets and fog oil-coated flakes.
Although WBC numbers were elevated in some test groups, all WBC counts were below levels suggestive of leukocytosis (<10,000 cell/µL) in birds and probably re-flect a residual inflammatory response to the foreign material in the lung.
The number of WBCs in the peripheral blood of red-winged blackbirds treated with obscurants was somewhat higher than those in the peripheral blood of control blackbirds, but the differences were not statistically significant (Table 11). The lack of response to a higher graphite flake concentration (185 mg/m3) than that which elicited a response in the cowbirds (70 mg/m3) may again be due to particle growth, as a result of particle coagulation (Histopathology, page 38). With a graphite flake concentration of 185 mg/m3 in the presence of a high fog oil droplet concentration (300 mg/m3), opportunity for flake-flake agglomeration is greatly increased and probably reflected in decreased deposition of the foreign material in the deep lung.

ERDC/CERL TR-05-5 47
Table 12. Total and differential white blood cell counts for brown-headed cowbirds exposed to graphite flake aerosols and cogenerated aerosols of graphite flake and fog oil.
Treatment Group (mg/m3) Four-Day Exposure Single Exposure
Graphite Only Graphite/Fog Oil Graphite Only
Graphite/ Fog Oil
Cell Type(a)
Control
35 70 35 70 60 60 Heterophile 31.4c
(7.0) 43.8c,d (4.2)
52.0d (4.2)
32.1c (2.7)
48.1c,d (4.5)
48.3c,d (15.5)
25.7c,d (10.8)
Lymphocyte 53.3 (10.0)
55.6 (4.1)
45.7 (3.6)
68.3 (2.9)
50.1 (5.0)
50.7 (14.9)
71.0 (11.1)
Monocyte 1.0 (0.4)
0.6 (0.3)
1.3 (0.6)
0.6 (0.3)
1.7 (0.6)
1.0 (0.6)
3.3 (0.3)
Eosinophile 0 (0)
0 (0)
0.2 (0.2)
0 (0)
0 (0)
0 (0)
0 (0)
Basophile 0 (0)
0 (0)
0 (0)
0 (0)
0 (0)
0 (0)
0 (0)
Total WBC(b) 3429e (841)
4800e (583)
6500f (957)
4857e (857)
5286f,e (834)
7667f (1453)
5000e,f (2082)
Exposure concentrations refer to the graphite flake content of the aerosol. Fog oil concentrations for the mixed aerosols 121 mg/m3 for the low graphite 4-day exposures and 103 mg/m3 for the high 4-day graphite exposures. The fog oil concentration for the single exposure of mixed aerosol was 131 mg/m3. (a) Cell types are expressed in percentage of the total number of WBCs. (b) Expressed as cells/µL. Different superscripts indicate significant (≤0.05) differences between treatments for each type, Dunnet’s T-Test.
Total and differential WBC counts were not depressed in any of the birds exposed to the airborne obscurants (Tables 11 and 12) indicating that the materials did not compromise the nonspecific immune function of the birds.
The number of heterophils in the peripheral blood of the cowbirds was elevated in those birds that were repeatedly exposed to 70 mg/m3 of graphite flake generated without fog oil. The heterophil response appeared to be the primary contributor to the elevated WBC counts observed in the cowbirds. A single 1-hour exposure to the obscurants did not result in an elevation of this cell type (Table 11).
Adequate thrombocyte counts were found in all birds and no toxic changes were ob-served in these cells. Also, no blood parasites were found in any of the cowbirds or blackbirds.

48 ERDC/CERL TR-05-5
Blood Chemistry
Blood chemistries of the cowbirds and blackbirds are shown in Tables 13 and 14, respectively. For both species of birds, exposure to the obscurants did not appear to alter metabolite concentrations in the peripheral blood. All metabolites were within reference ranges that characterize normal organ function in birds (Altman et al. 1997).
No significant differences between the metabolite concentrations of the male and female cowbirds were found, therefore the data were pooled (Table 11).
Table 13. Blood chemistry of adult brown-headed cowbirds exposed to graphite flake aerosols and cogenerated aerosols of graphite flake.
Treatment Group (mg/m3) Four-Day Exposure Single Exposure
Graphite Only Graphite/Fog Oil Graphite Only Graphite/Fog Oil
Metabolite(a)
Control 35 70 35 70 60 60
Protein 4.9 (0.2)
4.6 (0.4)
4.5 (0.1)
4.9 (0.5)
4.4 (0.2)
4.4 (0.3)
5.5 (0.8)
Albumin 2.7 (0.09)
2.4 (0.11)
2.3 (0.14)
2.4 (0.14)
2.3 (0.08)
2.1 (0.14)
2.6 (0.09)
Globulin 2.1 (0.25)
2.2 (0.35)
2.2 (0.19)
2.2 (0.35)
2.1 (0.13)
2.3 (0.34)
3.0 (0.72)
A/G 1.57 (0.39)
1.25 (0.17)
1.13 (0.17)
1.81 (0.72)
1.01 (0.15)
0.99 (0.16)
0.99 (0.27)
Cholesterol 393 (24)
387 (39)
371 (24)
399 (19)
367 (36)
444 (104)
438 (25)
Uric Acid 11.8 (1.2)
11.5 (1.9)
10.1 (1.7)
11.0 (1.0)
13.5 (1.9)
12.4 (2.1)
11.2 (0.2)
Glucose 424 (23.0)
402 (24.5)
390 (26.2)
376 (24.6)
351 (23.0)
404 (32.5)
378 (37.6)
Calcium 11.1 (1.6)
9.4 (1.7)
16.5 (1.9)
10.2 (1.7)
12.0 (1.6)
14.5 (2.3)
11.5 (2.6)
Values are means with standard errors in parentheses Exposure concentrations refer to the graphite flake content of the aerosol. Fog oil concentrations for the mixed aerosols 121 mg/m3 for the low graphite 4-day exposures and 103 mg/m3 for the high 4-day graphite exposures. The fog oil concentration for the single exposure of mixed aerosol was 131 mg/m3. (a) Values for protein are in g/dL; all other metabolites are reported in mg/dL.

ERDC/CERL TR-05-5 49
Table 14. Blood chemistry of adult female red-winged blackbirds exposed to graphite flake aerosols and cogenerated aerosols of graphite flake and fog oil.
Metabolite(a)
Control
Graphite Flake 35 mg/m3
Graphite Flake/Fog Oil 185 mg/m3
ANOVA P Value
Protein 5.6 (0.3) 5.0 (0.6) 5.2 (0.6) 0.66
Albumin 2.6 (0.2) 2.2 (0.2) 2.5 (0.3) 0.51
Globulin 3.0 (0.25) 2.8 (0.43) 2.7 (0.29) 0.80
A/G 0.89 (0.05) 0.82 (0.09) 0.94 (0.06) 0.63
Cholesterol 413 (16) 364 (21) 416 (60) 0.69
Uric Acid 8.1 (2.3) 8.2 (2.6) 8.9 (1.2) 0.95
Glucose 227 (51) 359 (42) 215 (53) 0.18
Calcium 11.0 (1.02) 12.7 (0.25) 12.0 (1.37) 0.62
Values are means with standard errors in parentheses. Fog oil concentration in the cogenerated aerosol was 300 mg/m3. (a) Values for protein are in g/dL; all other metabolites are reported in mg/dL.
Although not statistically different, calcium concentrations in female cowbirds (10.3 mg/dL to 16.5 mg/dL) were more variable and somewhat higher than in males (12 mg/dL to 13.4 mg/dL). A slight to moderate increase and variability in calcium lev-els would be anticipated for female birds approaching the end of breeding season as were the test birds at the conclusion of this study. Also, cholesterol levels for both the cowbirds (367 mg/dL to 444 mg/dL) and blackbirds (364 mg/dL to 416 mg/dL) were elevated over the reference values for passerines (291 mg/dL to 391 mg/dL) but were normal for birds on carnivorous diets. Insects and insect larvae comprised a large portion of the diets of both species in this study.
Body Weight
Mean body weights of brown-headed cowbirds and red-winged blackbirds during the acclimation and test periods are presented in Tables 15 and 16, respectively. No dif-ferences in body weight between control and treated birds were observed for either the graphite flake or graphite flake/fog oil exposures throughout the study period in either species. Reports on the effects of oral ingestion of petroleum on body mass and growth in birds are conflicting. The conflicting reports may be a result of the use of different crude oils and refined products, different dosing regimes, and the varying ages of the birds (Clark 1984). Apparently the combined dermal, preening, and inhaled doses in this study were below concentrations that cause weight loss.

50 ERDC/CERL TR-05-5
Table 15. Mean body weights (in grams) of adult brown-headed cowbirds exposed to graphite flake aerosols and cogenerated aerosols of graphite flake and fog oil.
Treatment Group (mg/m3) Four-Day Exposure Single Exposure
Graphite/Fog Oil Graphite Only Graphite Only Graphite/Fog Oil
Day Post-Exposure
Control 35 70 35 70 60 60
28 Days
Pre-Test 33.0 34.8 36.1 37.0 34.8 41.8 34.0
0 35.1 33.7 42.0 36.7 38.2 39.5 38.1
14 39.1 40.4 43.7 44.3 40.9 47.1 44.0
24 37.8 38.5 42.6 43.7 38.5 40.1 40.7
36 36.2 40.7 42.4 44.2 41.7 47.8 45.3
46 38.2 41.7 42.6 43.7 38.5 40.1 40.7
(a)Exposure concentrations refer to the graphite flake content of the aerosol. Fog oil concentrations for the mixed aerosols 121 mg/m3 for the low graphite 4-day exposures and 103 mg/m3 for the high 4-day exposures. The fog oil concentration for the single exposure of mixed aerosol was 131 mg/m3. (b) No significant differences in body weight was observed among groups; ANOVA, n=8. The mean body weight of each treatment group was not significantly different (P>0.05) from the control mean; Two-Tailed Dunnett’s Test.
Table 16. Mean change in body mass (in grams) of adult female red-winged blackbirds exposed to graphite flake aerosols or cogenerated aerosols of graphite flake and fog oil for 4 consecutive days.
Day Post-Exposure
Control
Graphite Flake 35 mg/m3
Graphite Flake/Fog Oil 185 mg/m3
ANOVA P Value
0 58.2 54.5 58.1 0.58
1 53.4 52.1 52.0 0.88
3 48.1 45.4 45.2 0.50
15 50.6 45.4 52.1 0.12
23 50.2 47.0 48.4 0.47
29 47.9 47.5 45.7 0.55
35 45.6 45.1 44.3 0.76
(a) Fog oil concentration in the cogenerated aerosol was 300 mg/m3. (b) No significant differences in body weight was observed among groups; ANOVA, n=12. The mean body weight of each treatment group was not significantly different (P>0.05) from the control mean; Two-Tailed Dunnett's Test
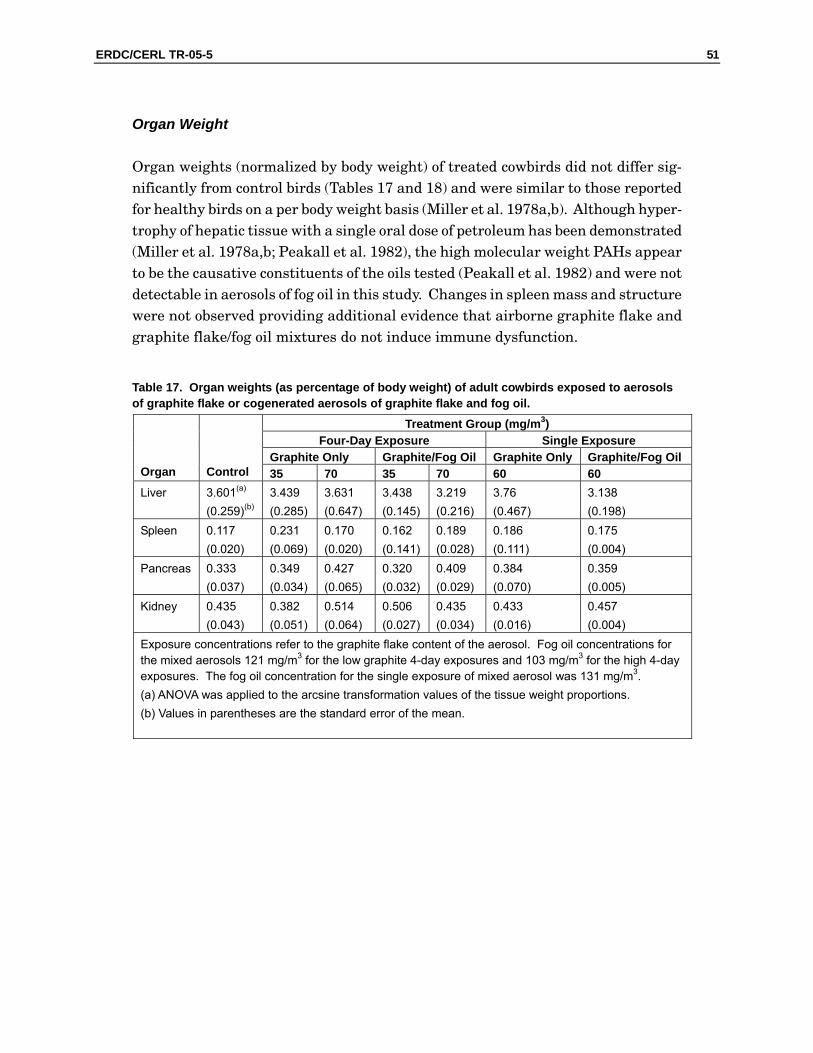
ERDC/CERL TR-05-5 51
Organ Weight
Organ weights (normalized by body weight) of treated cowbirds did not differ sig-nificantly from control birds (Tables 17 and 18) and were similar to those reported for healthy birds on a per body weight basis (Miller et al. 1978a,b). Although hyper-trophy of hepatic tissue with a single oral dose of petroleum has been demonstrated (Miller et al. 1978a,b; Peakall et al. 1982), the high molecular weight PAHs appear to be the causative constituents of the oils tested (Peakall et al. 1982) and were not detectable in aerosols of fog oil in this study. Changes in spleen mass and structure were not observed providing additional evidence that airborne graphite flake and graphite flake/fog oil mixtures do not induce immune dysfunction.
Table 17. Organ weights (as percentage of body weight) of adult cowbirds exposed to aerosols of graphite flake or cogenerated aerosols of graphite flake and fog oil.
Treatment Group (mg/m3) Four-Day Exposure Single Exposure
Graphite Only Graphite/Fog Oil Graphite Only Graphite/Fog Oil
Organ
Control 35 70 35 70 60 60
Liver 3.601(a) (0.259)(b)
3.439 (0.285)
3.631 (0.647)
3.438 (0.145)
3.219 (0.216)
3.76 (0.467)
3.138 (0.198)
Spleen 0.117 (0.020)
0.231 (0.069)
0.170 (0.020)
0.162 (0.141)
0.189 (0.028)
0.186 (0.111)
0.175 (0.004)
Pancreas 0.333 (0.037)
0.349 (0.034)
0.427 (0.065)
0.320 (0.032)
0.409 (0.029)
0.384 (0.070)
0.359 (0.005)
Kidney 0.435 (0.043)
0.382 (0.051)
0.514 (0.064)
0.506 (0.027)
0.435 (0.034)
0.433 (0.016)
0.457 (0.004)
Exposure concentrations refer to the graphite flake content of the aerosol. Fog oil concentrations for the mixed aerosols 121 mg/m3 for the low graphite 4-day exposures and 103 mg/m3 for the high 4-day exposures. The fog oil concentration for the single exposure of mixed aerosol was 131 mg/m3. (a) ANOVA was applied to the arcsine transformation values of the tissue weight proportions. (b) Values in parentheses are the standard error of the mean.
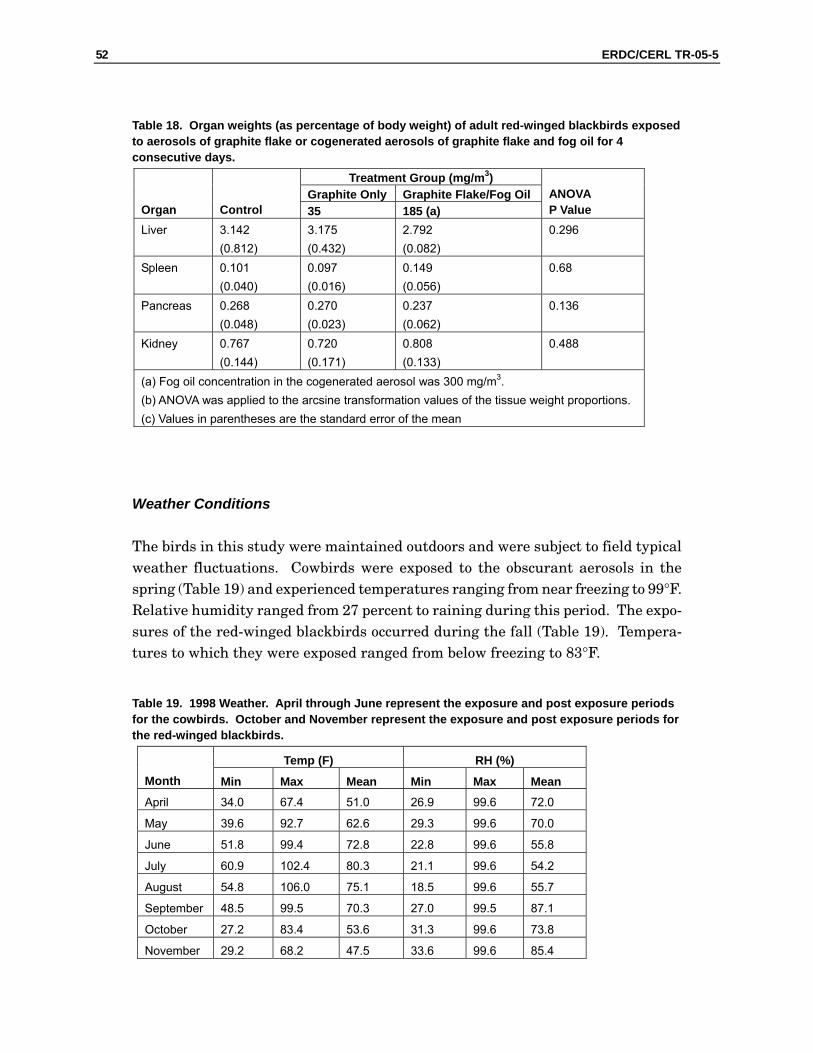
52 ERDC/CERL TR-05-5
Table 18. Organ weights (as percentage of body weight) of adult red-winged blackbirds exposed to aerosols of graphite flake or cogenerated aerosols of graphite flake and fog oil for 4 consecutive days.
Treatment Group (mg/m3) Graphite Only Graphite Flake/Fog Oil
Organ
Control 35 185 (a)
ANOVA P Value
Liver 3.142 (0.812)
3.175 (0.432)
2.792 (0.082)
0.296
Spleen 0.101 (0.040)
0.097 (0.016)
0.149 (0.056)
0.68
Pancreas 0.268 (0.048)
0.270 (0.023)
0.237 (0.062)
0.136
Kidney 0.767 (0.144)
0.720 (0.171)
0.808 (0.133)
0.488
(a) Fog oil concentration in the cogenerated aerosol was 300 mg/m3. (b) ANOVA was applied to the arcsine transformation values of the tissue weight proportions. (c) Values in parentheses are the standard error of the mean
Weather Conditions
The birds in this study were maintained outdoors and were subject to field typical weather fluctuations. Cowbirds were exposed to the obscurant aerosols in the spring (Table 19) and experienced temperatures ranging from near freezing to 99°F. Relative humidity ranged from 27 percent to raining during this period. The expo-sures of the red-winged blackbirds occurred during the fall (Table 19). Tempera-tures to which they were exposed ranged from below freezing to 83°F.
Table 19. 1998 Weather. April through June represent the exposure and post exposure periods for the cowbirds. October and November represent the exposure and post exposure periods for the red-winged blackbirds.
Temp (F) RH (%) Month Min Max Mean Min Max Mean April 34.0 67.4 51.0 26.9 99.6 72.0
May 39.6 92.7 62.6 29.3 99.6 70.0
June 51.8 99.4 72.8 22.8 99.6 55.8
July 60.9 102.4 80.3 21.1 99.6 54.2
August 54.8 106.0 75.1 18.5 99.6 55.7
September 48.5 99.5 70.3 27.0 99.5 87.1
October 27.2 83.4 53.6 31.3 99.6 73.8
November 29.2 68.2 47.5 33.6 99.6 85.4

ERDC/CERL TR-05-5 53
4 Conclusions Field typical and higher concentrations of airborne obscurant were generated and characterized. Fog oil composition was changed by the generation process, but the aerosolized oil was not harmful to birds. The effects of airborne graphite flake alone or in combination with fog oil were minimal in brown-headed cowbirds and red-winged blackbirds, the two species of passerine birds used in these studies. Small amounts of graphite flake were observed in lung tissue of treated birds but no tissue damage was observed, indicating that exposure to field typical and higher concen-trations of obscurants for 4 consecutive days does not overwhelm the clearance mechanisms of the avian lung. The amount of graphite flake present in lung and feces and the WBC response to the obscurants suggest that the impact of graphite flake is lessened in the presence of fog oil.
No mortality, clinical signs of toxicity, behavioral abnormalities, or poor response to weather fluctuations were induced by obscurant exposure. No cowbirds or black-birds appeared to have developed gross histological lesions associated with hydro-carbon toxicity or debilitating stress in this study. Evidence of graphite pneumoco-niosis was not observed in the birds under gross necropsy nor did the birds appear to exhibit overt respiratory difficulty during or after exposure to the obscurants. Graphite flake was found in the lungs of treated cowbirds and blackbirds but at low levels. No evidence of tissue damage was associated with the graphite retention in the lung. No damage to major organs and tissues from exposure to graphite flake alone or in combination with fog oil was seen. Endpoint metabolite levels in periph-eral blood indicated that the functional integrity/capacity of the major organs was intact. Hematological response was normal and no blood cell damage was observed. A mild elevation in WBCs indicative of a past inflammatory response was observed only in birds exposed to graphite flake without fog oil. Total and differential WBC counts indicated that nonspecific immune function was not diminished by the treatments. Spleen weights were also indicative of normal immune function. Fur-ther, the incidence of disease and parasitism, which play a role in population regu-lation, were found to be unrelated to treatment. Thus, it appears that exposure to field typical and high concentrations of graphite flake and fog oil obscurant smoke for 30 minutes/day for 4 consecutive days does not result in mortality, long term or-gan dysfunction, immunomodulation, behavioral abnormalities, sublethal gross le-sions or significant histopathology in brown-headed cowbirds or red-winged black-birds.

54 ERDC/CERL TR-05-5
Estimates of flake loading and clearance rate in the lung compared to reported mammalian values suggest avian lung may be more resistant to particulate over-load and damage.
No adverse health impacts in birds of similar size would be expected from exposure to graphite flake cogenerated with fog oil at levels less than 200 mg/m3 graphite flake and a fog oil concentration of at least 100 mg/m3. Because repeated exposure that may result in particle overload in the lung has the greatest potential for caus-ing harm to birds, it is suggested that exposures at high concentrations be limited to fewer than 8 within a 2-month period. Further information on particle overload phenomena and respiratory clearance of the flakes would be needed to extrapolate other exposure scenarios.

ERDC/CERL TR-05-5 55
References
Altman, R. B., S. L. Clubb, G. M. Dorrestien, K. Quessenberry. 1997. Avian Medicine and Surgery. W. B. Saunders Co., Philadelphia, PA, pp. 1004-1022.
Anderson, R. S., S. M. Thomson, and L. L. Gutshall Jr. 1989. “Comparative effects of inhales silica or synthetic graphite dusts on rat alveolar cells.” Arch. Enviro. Contam. Toxicol. Nov;18(6):844-849.
Beer, J. V. 1968. Postmortem findings in oiled auks dying during attempted rehabilitation. In The Biological Effects of Oil Pollution on Littoral Communities, J. D. Carthy and D. R. Arthur (eds), pp. 123-129. Field Studies Council, London.
Beletsky, L. D. and Beadle, D. 1996. The Red-winged Blackbird. The Biology of a Strongly Polygamous Songbird. pp. 31-34. Academic Press, Harcourt Brace and Co., Publishers, London.
Bernstein, M. H. 1987. Respiration in flying birds, in T. J. Seller (ed) Bird Respiration, Vol 11, pp. 43-74. CRC Press, Inc, Boca Raton, Florida.
Beyer, W. N., G. H. Heinz, and A. W. Redmon-Norwood. 1996. Environmental Contaminants in Wildlife: Interpreting Tissue Concentrations. CRC Press, Inc., Florida.
Calder, W. A., and J. R. King. 1974. Thermal and caloric relations of birds. In D. S. Farner and J. R. King (eds), Avian Biology, Vol IV, pp.259-413. Academic Press, New York.
Campbell, T. W. 1994. "Hematology"' In Avian Medicine, Principles and Application. B. Ritchie, G. Harrison, and L. Harrison (eds.), Wingers Publishing, Inc, Lake Worth, Florida.
Chia, F. S. 1971. Diesel oil spill at Anacortes. Mar. Pollut. Bull. 2(7):105-106.
Clark, R. B. 1984. Impact of Oil Pollution on Seabirds. Environ. Pollution (Series A) 33:1-22.
Clench, M. H. and R. C. Leberman. 1978. Weights of 151 species of Pennsylvania birds analyzed by month, age, and sex. Bulletin Carnegie Museum of Natural History no. 5, 87 pp.
Connell, C. E., E. P. Odum, and H. Kale. 1960, Fat-free weights of birds. Auk 77:1-9.
Crocker, A. D., J. Cronshaw, and W. N. Holmes. 1974. The effect of crude oil on intestinal absorption in ducklings (Anas platyrhynchos). Environ. Pollut. 7:165-177.
Croxall, J. P. 1977. The effects of oil on seabirds. Rapp. P. -v. Reun. Cons. Int. Explor. Mer. 171:191-195.

56 ERDC/CERL TR-05-5
Dein, F. J. 1984. Laboratory Manual of Avian Hematology. Association of Avian Veterinarians, East Northport, New York.
Driver, C. J., L. G. Smith, J. K. Briant, A. E. Jarrell, a. Fairbrother, and P. Bucholz. 1990. "Respiratory exposure of avian wildlife to airborne microbial pest control agents: assessment methodologies." In Review of Progress in Biotechnology Microbial Pest Control Agent Risk Assessment Program EPA160010-901029 Office of Research and Development, U. S. Environmental Protection Agency.
Driver, C. J., M. W. Ligotke, J. L. Downs, B. L. Tiller, T. M. Poston, E. B. Moore, Jr., and D. A. Cataldo. 1993a. Environmental and Health Effects Review for Obscurant Fog Oil. Report Number ERDEC-CR-071, U.S. Army Chemical and Biological Defense Agency, Edgewood Research, Development and Engineering Center, Aberdeen Proving Ground, Maryland.
Driver, C. J., M. W. Ligotke, W. G. Landis, J. L. Downs, B. L. Tiller, E. B. Moore Jr., and D. A. Cataldo. 1993b. Environmental and Health Effects Review for Obscurant Graphite Flakes. ERDEC-CR-056, U.S. Army Chemical and Biological Defense Agency, Edgwood Research, Development and Engineering Center, Aberdeen Proving Ground, Maryland.
Driver, C. J., M. W. Ligotke, H. Galloway-Gorby, G. Dennis, K. A. Reinbold and H. E. Balbach. 2002a. Acute Inhalation Toxicity of Fog Oil Smoke in the Red-winged Blackbird, a Size-specific Inhalation Surrogate for the Red-cockaded Woodpecker. ERDC/CERL Technical Report, TR-02-6, Engineer Research and Development Center, U.S. Army Construction Engineering Research Laboratory, Champaign, Illinois.
Driver, C. J., Ollero, J., Fong Su, Y., Fulton, R., Dennis, G., Tiller, B., Balbach, H., and K. Reinbold. 2002b. Effects of Fog Oil Smoke on the Hatchability and Fledgling Survival of the House Sparrow (Passer domesticus), a Nestling Surrogate for the Red-cockaded Woodpecker. ERDC/CERL Technical Report, TR-02-34, Engineer Research and Development Center, U.S. Army Construction Engineering Research Laboratory, Champaign, Illinois.
Driver, C. J., Jarrell, A., Ollero, J., Tiller, G., Fulton, R., Dennis, B., Balbach, H., and K. Reinbold. 2004. Effects of Fog Oil Smoke on Immune Responses in the House Sparrow (Passer domesticus) and Red-winged Blackbird (Agelaius phoeniceus). ERDC/CERL Technical Report, TR-04-13, Engineer Research and Development Center, U.S. Army Construction Engineering Research Laboratory, Champaign, Illinois.
Dumonceaux, G. and G. J. Harrison. 1994. "Toxins" In In Avian Medicine, Principles and Application. B. Ritchie, G. Harrison, and L. Harrison (eds.), Wingers Publishing, Inc, Lake Worth, Florida.
Dunning, J. B., Jr. 1993. CRC Handbook of Avian Body Masses. CRC Press, Boca Raton, Florida.
Fleischer, R. C. and S. I. Rothstein. 1988. Known secondary contact and rapid gene flow among subspecies and dialects in the Brown-headed Cowbird. Evolution 42: 1146–1158.
Fleming, W. J., L. Sileo, and J. C. Franson. 1982. Toxicity of Prudhoe Bay crude oil to sandhill cranes. J. Wildl. Manage. 46(2):474-478.
Gaensler, E. A., J. B. Cadigan, A. A. Sasahara, E. O. Fox, and H. E. MacMahon. (1966). Graphite pneumoconiosis of electrotypers. Am. J. Med. 41, 864–882

ERDC/CERL TR-05-5 57
Gerlach, G. 1994. "Defense mechanisms of the avian host." In Avian Medicine, Principles and Application. B. Ritchie, G. Harrison, and L. Harrison (eds.), Wingers Publishing, Inc, Lake Worth, Florida.
Green, H. L., W. R. Lane. 1964. Particulate Clouds, Dusts, Smokes, and Mists: Their Physics and Physical Chemistry and Industrial and Environmental Aspects. Van Nostrand Co., Inc., New York, pp. 138-178.
Harting, R. 1963. Ingestion of oil by waterfowl. Papers of the Michigan Academy of Science 48:49-55.
Hartung, R. 1967. Energy metabolism in oil-covered ducks. J. Wildl. Manage. 31:798-804.
Hartung, R., and G. S. Hunt 1966. Toxicity of some oils to waterfowl. J. Wildl. Manage. 31:564-570.
Heinz, G. H., and R. W. Johnson. 1982. "Diagnostic brain residues of dieldrin: some new insights." In Avian and Mammalian Wildlife Toxiciology: Second Conference, D. W. Lamb and E. E. Kenaga (eds.), ASTM STP 757. American Society for Testing and Materials, Philadelphia.
Hill, E. F. 1994. Acute and subacute toxicology in evaluation of pesticide hazard to avian wildlife. In, Wildlife Toxicology and Population Modeling: Integrated Studies of Agroecosystems, R. J. Kendall and T. E. Lacher, Jr. (eds), SETAC Special Publication Series, Lewis Publishers, London.
Hilscher, W. and H. W. Schlipkoter. 1972. Antagonistic factors in the pathogenesis of coal workers' pneumoconiosis. Ann NY Acad Sci 200: 166-181.
Hoffman, D. J. 1979. Embryotoxic and teratogenic effects of petroleum hydrocarbons in mallards. J. Toxicol. Environ. Health 5:835-844.
Holcomb, L.C. and G. Twiest. 1968. Red-winged Blackbird nestling growth compared to adult size and differential development of structures. Ohio J. Sci. 68: 277–284.
Ingebrethsen, B. 1989. "The physical properties of mainstream cigarette smoke and their relationship to deposition in the respiratory tract." In Extrapolation of Dosimetfic Relationships for Inhaled Particles and Gases, J. D. Crapo, E. D. Smolko, F. H. Miller, J. A. Graham, and A. Wallace Hayes. Academic Press, Inc, San Diego, California.
Jackson, J. A. 1971. The evolution, taxonomy, distribution, past populations and current status of the red-cockaded woodpecker. In The Ecology and Management of the Red-cockaeded woodpecker: Proceedings of a Symposium at Okefenokee National Wildlife refuge, Folston, Ga, May 26-29, R. L. Thompson (ed.). Tallahassee, Fl:Tall Timbers Res. Station.
Jackson, J. A. 1994. Red-cockaded Woodpecker (Picoides borealis). In The Birds of North America, No. 85 (A. Poole and F. Gill, Eds.). Philadelphia: The Academy of Natural Sciences; Washington, D.C.: The American Ornithologists’ Union.
Jones, T.C. and R.D. Hunt. 1983. Veterinary Pathology, Fifth Edition. Lea and Febiger, Philadelphia, PA. p. 74-76.

58 ERDC/CERL TR-05-5
Jordan, F. T. W. 1990. Nutritional Disorders, In Poultry Diseases, 3" Edition, pp. 295-219, Barlbiere Tindall, London.
Kleinerman J., F. Green, R. S. Harley, L. Lapp, W. Laqueur, R. L. Naeye, P. Pratt, G. Taylor, J. Wiot, and J. Wyatt. Pathology standards for coal workers' pneumoconiosis. Arch Pathol Lab Med 103:375-432 (1979).
Klika, E., D. W. Scheuermann, M. H. A. De Groodt-Lasseel, 1. Bazantova, and A. Switka. 1997. Lymphatics in the Lung of a Precocial Bird Before and After .Hatching. Lymphology 30:173-185.
Klika, E., D. W. Scheuermann, M. H. A. De Groodt-Lasseel, 1. Bazantova, and A. Switka. 1996. Pulmonary macrophages in birds (Barn owl, Tyto -tyto alba), domestic fowl (Gallus gallus f. domestica), quail (Coturnix coturnix), and Pigeons (Columbia livia). The Anatomical Record. 246:87-97.
Krahn, M. M., C. A. Wigren, R. W. Pearce, L. K. Moore, and R. G. Bogar. 1988. New HPLC cleanup and revised extraction procedures for organic contaminants. NOAA Technical Memorandum NMFS F/NWC-153.
Langenberg, J. A., and F. A. Dein. 1982. Pathology of Ruddy Ducks (Oxyura jamaicensis) Contaminated with Spilled #6 Fuel Oil. In The Effects of Oil on Birds: Physiological Research, Clinical Applications and Rehabilitation, D. Rosie and S. N. Barnes (eds), pp. 139-142. Tri-State Bird Rescue and Research, Inc., Wilmington, Delaware.
Lee, K. P., H. J. Trochimowicz, and C. F. Reinhardt. 1985. Pulmonary response of rats exposed to titanium dioxide (TiO2) by inhalation for two years. Toxicol. Appl. Pharmacol. 79, 179–192
Leighton, F. A. 1982. The Pathophysiology of Petroleum Oil Toxicity in Birds: A Review. In The Effects of Oil on Birds: Physiological Research, Clinical Applications and Rehabilitation, D. Rosie and S. N. Barnes (eds), pp. 1-28. Tri-State Bird Rescue and Research, Inc., Wilmington, Delaware.
Leighton, F. A., Y. Z. Lee, A. D. Rahimtula, P. J. O'Brien, and D. B. Peakall. 1985. Biochemical and functional disturbances in red blood cells of herring gulls ingesting Prudhoe Bay crude oil. Toxicol. Appl. Pharmacol. 81:25-31.
Lipnick, R. L., J. A. Cotruvo, R. N. Hill, R. D, Bruce, K. A. Stitzel, A. P. Walker, I. Chu, M. Goodard, L. Segal., J. A. Springer, and R. C. Myeres. 1995. Comparison of the up and-down, conventional LD50, and fixed dose acute toxicity procedures. Food Chem. Toxicol. 33:223-231.
Lumeij, J. T. 1994. "Nephrology" In Avian Medicine, Principles and Application. B. Ritchie, G. Harrison, and L. Harrison (eds.), Wingers Publishing, Inc, Lake Worth, Florida.
Martin J. C., H. Daniel-Moussard, L. Le Bouffant, A. Policard. 1972. The role of quartz in the development of coal workers' pneumoconiosis. Ann NY Acad. Sci 200:127-141.
Miller, D. A., J. Kahn, E. Shaeen, D. B. Peakall, W. B. Kinter. 1978a. Effects of ingestion of a weathered crude oil on immature black guillemots, Cepphus grylle, and herring gulls, Larus argentatus. Bull. Mt. Desert Is. Biol. Lab. 17:40-42.

ERDC/CERL TR-05-5 59
Miller, D. S., D. B. Peakall, and W. B. Kinter. 1978b. Ingestion of crude oil: sublethal effects in herring gull chicks. Science 199:315-317.
Morrow, P. E. 1992. Dust overloading of the lungs: update and appraisal. Toxicol. Appl. Pharm. 113:1-12.
Moss, 0. R. and Y-S Cheng. 1995. "Generation and characterization of test atmospheres: particles and droplets." In Concepts in Inhalation Toxicology. Second Edition, R.O. McClellan and R. F. Henderson (eds.), Taylor and Francis, Washington D.C.
Pattee, 0. H., and J. C. Franson. 1982. Short-term effects of oil ingestion on American kestrels (Falco sparverius). J. Wildl. Dis. 18:235-241.
Patton, J. F., and M. P. Dieter. 1980. Effects of petroleum hydrocarbons on hepatic function in the duck. Comp. Biochem. Physiol. 65C:33-36.
Peakall, D. B., J. Tremblay, W. B. Kinter, and D. S. Miller. 1981. Endocrine dysfunction in seabirds caused by ingested oil. Environ. Res. 24:6-14.
Peakall, D. B., D. J. Hallett, J. R. Bend, G. L. Fourman, and D. S. Miller. 1982. Toxicity of Prudhoe Bay crude oil and its aromatic fractions to nestling herring gulls. Environ. Res. 27:206-215.
Phalen, R. F. 1984. Inhalation Studies: Foundations and Techniques. Pp.220-241. CRC Press, Inc., Boca Raton, Florida.
Pritchard, J. N. 1989. Dust overloading-a case for lowering the TLV of nuisance dusts. J. Aerosol Sci. 20:1341-1344.
Richie, B. W., G. J. Harrison, and L. R. Harrison. 1994. Avian Medicine: Principles and Application. Wingers Publishing, Inc., Lake Worth, Florida, pp. 865-874.
Schafer E. W. 1972. The acute oral toxicity of 369 pesticidal and pharmaceutical and other chemicals to wild birds. Toxicol. Applied Pharmacol. 21:315-330.
Schafer, E. W. 1994. Comparative avian toxicology: What is its role in predicting and monitoring the effect of agricultural pesticides. In, Wildlife Toxicology and Population Modeling: Integrated Studies of Agroecosystems, R. J. Kendall and T. E. Lacher, Jr. (Eds), pp.321-338. SETAC Special Publication Series, Lewis Publishers, London.
Schafer, E.W., Jr., W. A. Bowles, Jr., and J. Hurlbut. 1983. The acute oral toxicity, repellency, and hazard potential of 998 chemicals to one or more species of wild and domestic birds. Arch. Environm. Contam Toxicol. 12:355-382.
Scheuermann, D. W., E. Klika, M. H. A. De Groodt-Lasseel, 1. Bazantova, and A. Switka. 1997. An electron microscopic study of the parabronchial epithelium in the mature lung of four bird species. The Anatomical Record. 249:213-225.
Searcy, W. A. 1979. Sexual selection and body size in male red-winged blackbirds. Evolution 33:649-661.

60 ERDC/CERL TR-05-5
Snipes, M. B. 1989. Long-term retention and clearance of particles inhaled by mammalian species. Crit. Rev. Toxicol. 20:175-211.
Snyder, S. B., J. G. Fox, and 0. A. Soare. 1973. Mortalities in Waterfowl Following Bunker C Fuel Exposure. Div. Lab. Animal Med., Stanford Med. Ctr. Stanford, 50 pp.
Stickel, L. F., W. H. Stickel, R. D. McArthur, and D. L. Hughes. 1979. Chordane in birds: A study of lethal residues and loss rates. Toxicology and Occupational Medicine, W.B. Deichmann, ed. Elsevier/North Holland, New York, NY. Pp 387-396.
Stickel, L. F., W. H. Stickel, R. A. Dyranland, and D. L. Hughes. 1983. Oxychlordane, HCS-3260, and nonachlor in birds: lethal residues and loss rates. J. Toxicol. Environ. Health 12:611-622.
Stickel, W. H., L. F. Stickel, R. A. Dyrland, and D. L. Huges. 1984. Arocolor 1254 residues in birds: lethal levels and loss rates. Arch. Envrion. Contam. Toxicol. 13:7-13.
Szaro, R. C., M. P. Dieter, G. H. Heinz, and J. F. Ferrell. 1978. Effects of chronic ingestion of south Louisiana crude oil on mallard ducklings. Environ. Res. 17:426-436.
Szaro, R. C., G. Hensler, and G. H. Heinz. 1981. Effects of chronic ingestion of No.2. Fuel oil on mallard ducklings. J. Toxicol. Environ. Health. 7:789-799.
Thomson, S. A., J. D. Bergmann, D. C. Burnett, J. C. Carpin, C. L. Crose, R. J. Hilaski, B. Infiesto, and E. Lawerence-Beckett. 1988. Comparative Inhalation Screen of Titanium Dioxide and Graphite Dusts. Report Number CRDEC-TR-88-88161. U. S. Army Chemical Research, Development and Engineering Center, Aberdeen Proving Ground. Maryland.
Thomson, S. A., D. C. Burnett, R. S. Anderson, and R. J. Hilaski. 1987. Pulmonary and Pathological Responses of Rats to Acute Inhalation of Synthetic Graphite. Toxicologist 7:199.
Turcek, E.F. 1966. On plumage quantity in birds. Ekol. Pol. Ser. A 14:617-634.
U.S. Army. 1986. Workshop to Select Test Systems for Ecological Assessment and Monitoring. January 19-22, 1986, U.S. Army Construction Engineering Research Laboratory (CERL), University of Illinois at Urbana-Champaign, Illinois.
Van Velzen, A. C., W. B. Stiles, and L. F. Stickel. 1972. Lethal mobilization of DDT by cowbirds. J. Wildl. Manage. 36:733-739.
Vos, J. G., 1. Kdimber, C. Kuper, H. Van Loveren, and H. Schuurman. 1998. The Immune System, In: Target Organ Pathology, J. Turton and J. Hooson eds, pp 207-237, Taylor and Francis, Bristol, Pennsylvania.
Walsberg, G. E., and J. R. King. 1978. The relationship of external surface area of birds to skin surface area and body mass. J. Exp. Biol. 76:185-189.
Weatherhead, P. J. and K. L. Teather. 1987. The paradox of age-related dominance in Brown-headed Cow-birds (Molothrus ater). Can. J. Zool. 65: 2354–2389.

ERDC/CERL TR-05-5 61
Yoder, H. W. 1984. Avian Mycoplasmosis In M. S. Hofstad, H. J. Barnes, B. W. Calnek, W. M. Reider, and H. W. Yoder, Jr. (ed), Diseases of Poultry, Eighth Edition, pp.193-195. Iowa State University Press, Ames, Iowa.
Zar, H. H. 1974. Biostatistical Analysis. Prentice-Hall, Inc., Englewood Cliffs, New Jersey.

REPORT DOCUMENTATION PAGE Form Approved OMB No. 0704-0188
Public reporting burden for this collection of information is estimated to average 1 hour per response, including the time for reviewing instructions, searching existing data sources, gathering and maintaining the data needed, and completing and reviewing this collection of information. Send comments regarding this burden estimate or any other aspect of this collection of information, includ-ing suggestions for reducing this burden to Department of Defense, Washington Headquarters Services, Directorate for Information Operations and Reports (0704-0188), 1215 Jefferson Davis Highway, Suite 1204, Arlington, VA 22202-4302. Respondents should be aware that notwithstanding any other provision of law, no person shall be subject to any penalty for failing to comply with a collection of information if it does not display a currently valid OMB control number. PLEASE DO NOT RETURN YOUR FORM TO THE ABOVE ADDRESS.
1. REPORT DATE (DD-MM-YYYY) 01-2005
2. REPORT TYPE Final
3. DATES COVERED (From - To)
5a. CONTRACT NUMBER 5b. GRANT NUMBER
4. TITLE AND SUBTITLE Inhalation Toxicity of Cogenerated Graphite Flake and Fog Oil Smoke in the Brown-headed Cowbird and the Red-winged Blackbird, Size-specific Inhalation Surrogates for the Red-cockaded Woodpecker 5c. PROGRAM ELEMENT NUMBER
5d. PROJECT NUMBER SERDP 5e. TASK NUMBER CS-507; F474HJ
6. AUTHOR(S) Crystal Driver, Robert Fulton, Jennifer Ollero, Mark Clark, Gary Dennis, Brett Tiller, and Harold E. Balbach
5f. WORK UNIT NUMBER 8. PERFORMING ORGANIZATION REPORT
NUMBER 7. PERFORMING ORGANIZATION NAME(S) AND ADDRESS(ES) U.S. Army Engineer Research and Development Center (ERDC) Construction Engineering Research Laboratory (CERL) PO Box 9005 Champaign, IL 61826-9005
ERDC/CERL TR-05-5
9. SPONSORING / MONITORING AGENCY NAME(S) AND ADDRESS(ES) 10. SPONSOR/MONITOR’S ACRONYM(S) Program Manager Strategic Environmental Research and
Development Program 901 N Stuart St., Suite 303 Arlington, VA 22203
U.S. Army Forces Command Fort McPherson, GA 30330 11. SPONSOR/MONITOR’S REPORT
NUMBER(S)
12. DISTRIBUTION / AVAILABILITY STATEMENT Approved for public release; distribution is unlimited.
13. SUPPLEMENTARY NOTES Copies are available from the National Technical Information Service, 5285 Port Royal Road, Springfield, VA 22161.
14. ABSTRACT
The red-cockaded woodpecker (Picoides borealis) is an endangered species found on many installations where troop readiness training is conducted. Conducting maneuvers under obscurant cover is important for realistic training. Generators that combine fog oil for vis-ual obscuration with graphite flakes for infrared obscuration are being deployed for training scenarios. The effect of this combination on avian species was unknown. Our data indicate that toxicity of inhaled and/or preened graphite flake and cogenerated graphite flake and fog oil is low and similar to controls for adult cowbird and blackbird surrogates for the red-cockaded woodpecker. No mortality, body weight loss, clinical signs of toxicity, or respiratory function deficits were observed in the graphite flake-only, or cogenerated graphite flake/fog oil-treated birds when compared to controls. Hematological response was normal and no toxic effects in erythro-cytes or leukocytes were found. White blood cell counts, spleen weights, and incidence of parasitism and disease were indicative of normal immune function in all treatments. Because repeated exposure that may result in particle overload in the lung has the greatest potential for causing harm to birds, it is suggested that exposures to high concentrations of the aerosol-graphite mixture be limited to fewer than eight within any 2-month period.
15. SUBJECT TERMS fog oil endangered species natural resource management red-cockaded woodpecker smoke and obscurants military training 16. SECURITY CLASSIFICATION OF: 17. LIMITATION
OF ABSTRACT 18. NUMBER
OF PAGES 19a. NAME OF RESPONSIBLE PERSON
Harold E. Balbach a. REPORT
Unclassified b. ABSTRACT
Unclassified c. THIS PAGE
Unclassified
SAR
74 19b. TELEPHONE NUMBER (in-
clude area code) 217-352-6511, ext 6785
NSN 7540-01-280-5500 Standard Form 298 (Rev. 8-98) Prescribed by ANSI Std. 239.18