consumer and retail - harriswilliams.com · 03/22/16 03/22/16 the michaels companies, inc. mik...
TRANSCRIPT

www.harriswilliams.com
Investment banking services are provided by Harris Williams LLC, a registered broker-dealer and member of FINRA and SIPC, and Harris Williams & Co. Ltd, which is private limited companyincorporated under English law with its registered office at 5th Floor, 6 St. Andrew Street, London EC4A 3AE, UK, registered with the Registrar of Companies for England and Wales (registrationnumber 7078852). Harris Williams & Co. Ltd is authorized and regulated by the Financial Conduct Authority. Harris Williams & Co. is a trade name under which Harris Williams LLC and HarrisWilliams & Co. Ltd conduct business.
CONSUMER AND RETAIL
INDUSTRY UPDATE │ JANUARY 2017

PAGE |
KEY TRADING STATISTICS (DETAIL BEGINS ON PAGE 5)
PUBLIC MARKETS OVERVIEW
PUBLIC COMPANY SECTOR PERFORMANCE (12-MONTH % CHANGE IN STOCK PRICE)
CONSUMER AND RETAIL
INDUSTRY UPDATE │ JANUARY 2017
1
Change in Stock Price
3 mos. 12 mos. Revenue EBITDA Revenue EBITDA
Consumer Products & Services
Apparel & Footwear 24 $2,586 (3.9%) (18.8%) 1.2x 10.5x 1.7x 10.1x
Consumer Durables 6 6,249 8.9% (8.3%) 0.9x 8.3x 0.9x 9.3x
Consumer Serv ices and Retail Franchisors 7 2,271 5.1% (21.9%) 2.2x 11.2x 1.4x 7.4x
Home & Office Furniture & Furnishings 10 1,770 22.6% 5.4% 0.9x 9.8x 1.1x 14.6x
Household Products 5 17,586 (0.6%) 6.0% 3.7x 14.3x 3.7x 15.2x
Housewares 10 2,187 6.0% 9.4% 1.0x 10.7x 1.3x 9.7x
Infant & Juvenile 12 1,373 (1.6%) 8.1% 0.9x 8.6x 0.9x 11.2x
Outdoor & Lifestyle 20 995 (3.3%) (0.6%) 1.3x 10.4x 1.3x 12.7x
Personal Care Products 13 4,438 (3.4%) (0.6%) 1.4x 10.9x 1.5x 10.0x
Pet Care 8 1,122 (0.8%) 5.4% 1.7x 13.8x 1.8x 16.0x
Retail
Apparel & Footwear Retail 31 1,360 (8.2%) (33.7%) 0.5x 6.2x 0.6x 5.2x
Department Chains 8 5,693 (18.5%) (54.2%) 0.5x 5.9x 0.6x 4.3x
Discount Stores & Mass Merchants 13 24,552 0.5% 1.7% 0.7x 10.9x 0.7x 12.0x
Furniture & Furnishings Retailers 14 1,206 6.6% (38.5%) 0.7x 7.6x 0.9x 7.3x
Internet Retail 12 5,687 4.0% 30.5% 2.6x 19.6x 3.1x 21.4x
Specialty & Other Retail 15 2,784 5.6% (11.0%) 0.7x 8.2x 0.8x 6.3x
Consumer Products & Services 115 $2,229 (0.7%) 2.4% 1.3x 10.6x 1.3x 10.6x
Retail 93 $4,235 2.2% (22.3%) 0.7x 7.9x 0.7x 6.8x
Consumer & Retail Index 208 $2,429 (0.1%) (0.6%) 0.9x 10.5x 1.2x 10.1x
SectorNumber of
Companies
Median Enterprise
Value ($ M)
Median TEV/
Forward Mulitples
Median TEV/
LTM Multiples
Department Chains
Furniture & Furnishings Retailers
Apparel & Footwear Retail
Consumer Serv ices and Retail
Franchisors
Apparel & Footwear
Specialty & Other Retail
Consumer Durables
Pet Care
Consumer & Retail Index
Outdoor & Lifestyle
Discount Stores & Mass Merchants
Personal Care Products
Home & Office Furniture &
Furnishings
Household Products
Infant & Juvenile
Housewares
S&P 500
Internet Retail
(60.0%) (50.0%) (40.0%) (30.0%) (20.0%) (10.0%) 0.0% 10.0% 20.0% 30.0% 40.0%

PAGE |
CONSUMER AND RETAIL INDUSTRY STOCK PERFORMANCE
PUBLIC MARKETS OVERVIEW
2
RECENT EQUITY OFFERINGS
CONSUMER AND RETAIL
INDUSTRY UPDATE │ JANUARY 2017
Close Date Filing Date Issuer Ticker
Transaction
Type
Gross Proceeds
($ M) Primary Industry
07/27/16 07/27/16 Ollie's Bargain Outlet Holdings, Inc. OLLI Follow-on $303.8 Department Stores
06/22/16 06/22/16 Blue Buffalo Pet Products, Inc. BUFF Follow-on 330.0 Pet Food
05/30/16 05/30/16 Spin Master Corp. TOY Follow-on 100.0 Toys and Recreational Products
05/12/16 05/12/16 Bright Horizons Family Solutions BFAM Follow-on 138.7 Education Serv ices
05/05/16 02/17/16 Walgreens Boots Alliance WBA Follow-on 1,200.0 Drug Retail
04/22/16 02/12/16 Vince Holding Corp VNCE Follow-on 63.8Apparel, Accessories and Luxury
Goods
04/12/16 04/12/16 Sportsman's Warehouse SPWH Follow-on 67.5 Specialty Stores
03/22/16 03/22/16 The Michaels Companies, Inc. MIK Follow-on 443.4 Specialty Stores
02/18/16 02/05/16 Ollie's Bargain Outlet Holdings OLLI Follow-on 155.5 Retail
12/14/15 12/14/15 Norwegian Cruise Line Holdings Ltd. NCLH Follow-on 596.1 Hotels, Resorts and Cruise Lines
11/23/15 11/23/15 The J. M. Smucker Company SJM Follow-on 467.3 Packaged Foods and Meats
11/19/15 10/06/15 Duluth Holdings Inc. DLTH IPO 80.0 Internet Retail
50
75
100
125
150
175
200
225
250
Jan-13 May-13 Sep-13 Jan-14 May-14 Sep-14 Jan-15 May-15 Sep-15 Jan-16 May-16 Sep-16 Jan-17
Ind
ex
Dow Jones U.S. Retail Index Dow Jones U.S. Consumer Goods Index Dow Jones U.S. Consumer Services S&P 500 Index
PAGE | 3
CONSUMER AND RETAIL
INDUSTRY UPDATE │ JANUARY 2017
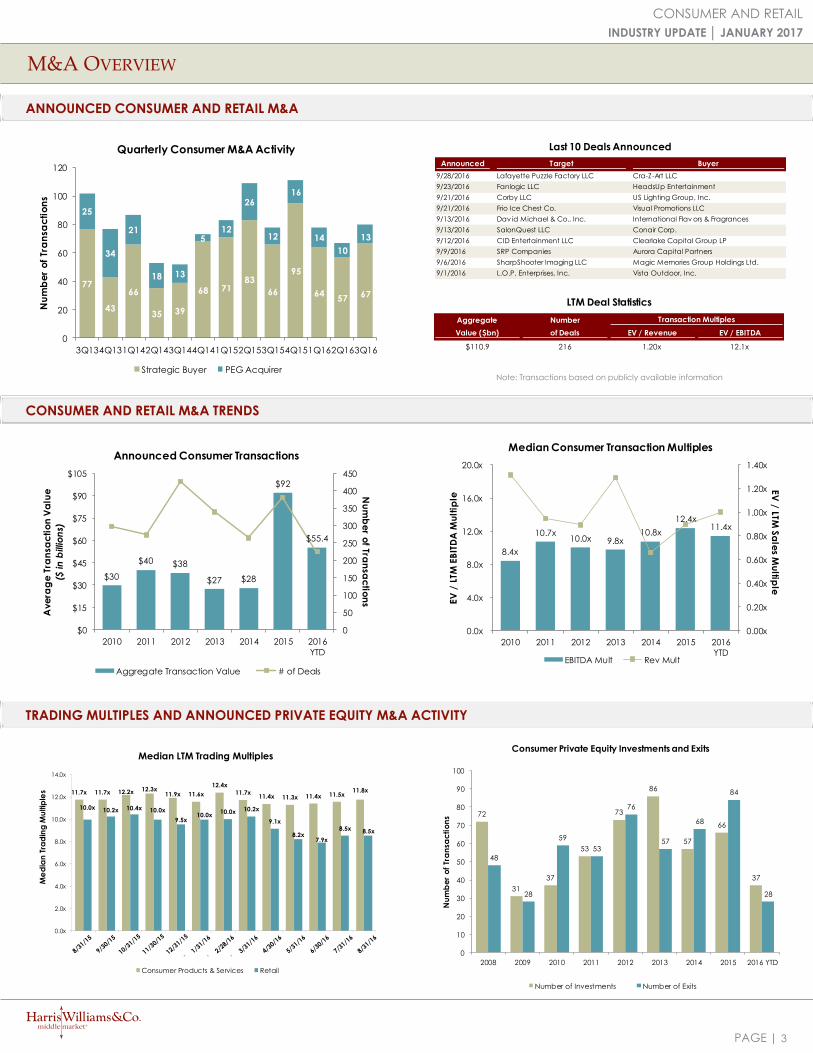
M&A OVERVIEW
CONSUMER AND RETAIL M&A TRENDS
TRADING MULTIPLES AND ANNOUNCED PRIVATE EQUITY M&A ACTIVITY
ANNOUNCED CONSUMER AND RETAIL M&A
Note: Transactions based on publicly available information
8.4x
10.7x 10.0x 9.8x
10.8x
12.4x 11.4x
0.00x
0.20x
0.40x
0.60x
0.80x
1.00x
1.20x
1.40x
0.0x
4.0x
8.0x
12.0x
16.0x
20.0x
2010 2011 2012 2013 2014 2015 2016
YTD
EV
/ LTM S
ale
s Mu
ltiple
EV
/ L
TM E
BIT
DA
Mu
ltip
leMedian Consumer Transaction Multiples
EBITDA Mult Rev Mult
Announced Target Buyer
9/28/2016 Lafayette Puzzle Factory LLC Cra-Z-Art LLC
9/23/2016 Fanlogic LLC HeadsUp Entertainment
9/21/2016 Corby LLC US Lighting Group, Inc.
9/21/2016 Frio Ice Chest Co. Visual Promotions LLC
9/13/2016 Dav id Michael & Co., Inc. International Flav ors & Fragrances
9/13/2016 SalonQuest LLC Conair Corp.
9/12/2016 CID Entertainment LLC Clearlake Capital Group LP
9/9/2016 SRP Companies Aurora Capital Partners
9/6/2016 SharpShooter Imaging LLC Magic Memories Group Holdings Ltd.
9/1/2016 L.O.P. Enterprises, Inc. Vista Outdoor, Inc.
Last 10 Deals Announced
Aggregate Number Transaction Multiples
Value ($bn) of Deals EV / Revenue EV / EBITDA
$110.9 216 1.20x 12.1x
LTM Deal Statistics
72
31
37
53
73
86
57
66
37
48
28
59
53
76
57
68
84
28
0
10
20
30
40
50
60
70
80
90
100
2008 2009 2010 2011 2012 2013 2014 2015 2016 YTD
Nu
mb
er
of
Tra
nsa
cti
on
s
Consumer Private Equity Investments and Exits
Number of Investments Number of Exits
11.7x 11.7x 12.2x 12.3x11.9x 11.6x
12.4x
11.7x11.4x 11.3x 11.4x 11.5x
11.8x
10.0x 10.2x 10.4x 10.0x
9.5x10.0x
10.0x 10.2x
9.1x
8.2x7.9x
8.5x 8.5x
0.0x
2.0x
4.0x
6.0x
8.0x
10.0x
12.0x
14.0x
Me
dia
n T
rad
ing
Mu
ltip
les
Median LTM Trading Multiples
Consumer Products & Services Retail
77
43
66
35 39
68 7183
66
95
6457 67
25
34
21
18 13
512
26
12
16
14
10
13
0
20
40
60
80
100
120
3Q134Q131Q142Q143Q144Q141Q152Q153Q154Q151Q162Q163Q16
Nu
mb
er
of
Tra
nsa
cti
on
s
Quarterly Consumer M&A Activity
Strategic Buyer PEG Acquirer
$30
$40 $38
$27 $28
$92
$55.4
0
50
100
150
200
250
300
350
400
450
$0
$15
$30
$45
$60
$75
$90
$105
2010 2011 2012 2013 2014 2015 2016
YTD
Nu
mb
er o
f Tran
sac
tion
s
Ave
rag
e T
ran
sac
tio
n V
alu
e
($ in
bill
ion
s)
Announced Consumer Transactions
Aggregate Transaction Value # of Deals

PAGE |
0
2
4
6
8
10
12
14
1Q09 3Q09 1Q10 3Q10 1Q11 3Q11 1Q12 3Q12 1Q13 3Q13 1Q14 3Q14 1Q15
Loa
n V
olu
me
by
Qu
art
er
($ i
n b
illi
on
s)
Quarterly Retail Loan Volume
Institutional Pro Rata
4
CONSUMER AND RETAIL
INDUSTRY UPDATE │ JANUARY 2017
DEBT MARKET OVERVIEW
COMMENTARY ON RECENT CONSUMER AND RETAIL DEBT TRANSACTIONS1
KEY RETAIL CREDIT STATISTICS
1) Source: S&P Capital IQ LCD
0.00
2.00
4.00
6.00
8.00
10.00
12.00
14.00
4Q09 2Q10 4Q10 2Q11 4Q11 2Q12 4Q12 2Q13 4Q13 2Q14 4Q14 2Q15 4Q15
Loa
n V
olu
me
by
Qu
art
er
($ in
billio
ns)
Quarterly Retail Loan Volume
Institutional Pro Rata
L + 0
L + 100
L + 200
L + 300
L + 400
L + 500
L + 600
L + 700
2007 2008 2009 2010 2011 2012 2013 2014 2015 4Q15
Ave
rag
e S
pre
ad
Ove
r LI
BO
R
Average Spread on Retail Loans
Revolving Credit / Term Loan A Weighted-Average Institutional
L + 0
L + 500
L + 1000
L + 1500
L + 2000
L + 2500
4Q05 4Q06 4Q07 4Q08 4Q09 4Q10 4Q11 4Q12 4Q13 4Q14 4Q15
Ave
rag
e S
pre
ad
Ove
r LI
BO
R
Average Secondary Spread
0.0x
1.0x
2.0x
3.0x
4.0x
5.0x
6.0x
Debt/EBITDA Senior Debt/EBITDA EBITDA/Cash
Interest
EBITDA -
Capex/Cash
Interest
EB
ITD
A M
ultip
le
Credit Statistics
2010 2011 2012 2013 2014 2015
• Underwriters are currently marketing a $180 million add-on B term loan for Mister Car Wash. Proceeds from the add-on will repay revolver debt and fund a distribution to sponsor Leonard Green & Partners. Price talk is L+450, with a1% LIBOR floor, offered at 99. The existing $196 million tranche will increase to the same level; additionally, a $40million delayed-draw term loan will be available for on year.
• Cosmetics company e.l.f. Beauty repaid loans from PennantPark BDCs in the recent quarter. On Sept. 27, e.l.f.Beauty completed an IPO, selling 9.6 million shares at $17 each, resulting in $63 million in proceeds after expenses.Part of the proceeds was then used to repay a $40 million second-lien term loan in full. As of June 30, PennantParkInvestment Corporation’s portfolio included a $34 million second-lien loan due 2019 (L+1,000) to J.A. Cosmetics, aswell as equity.
• Forman Mills received a $32.5 million term loan, and a $35 million revolver, backing a buyout of the company byprivate equity firm Goode Partners. Monroe Capital was sole lead arranger and administrative agent on the termloan. The deal was not syndicated. CIT Retail Finance was sole lead arranger on the $35 million senior securedcredit facility. Proceeds from the debt financing fund the acquisition, store expansion, infrastructure investment,and working capital. Forman Mills, based in Pennsauken, N.J., sells off-price apparel, footwear, and home goods

PAGE |
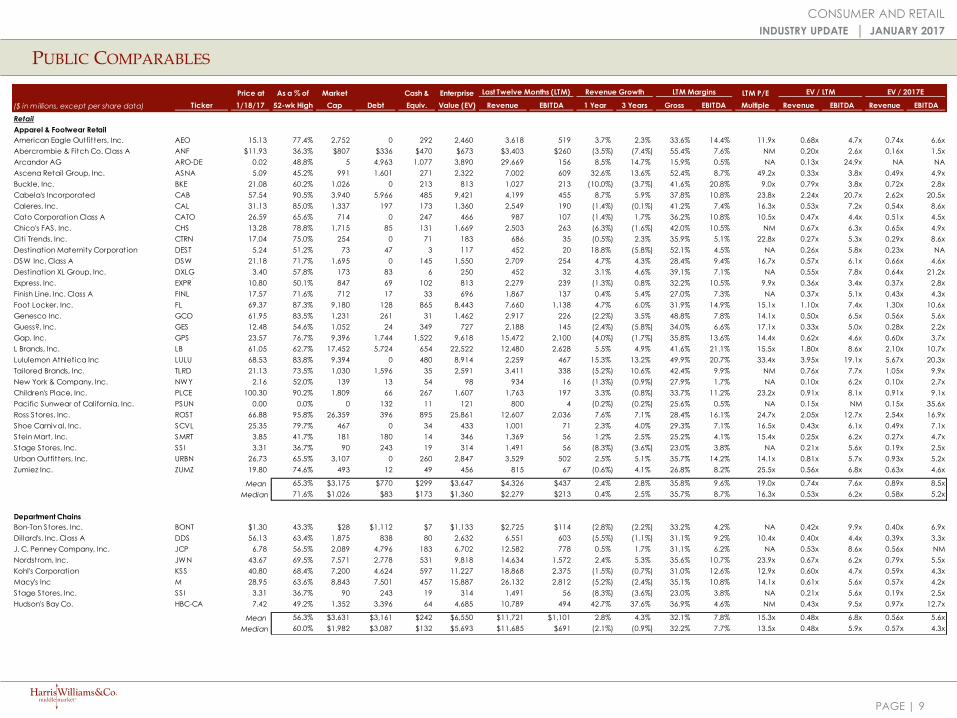
PUBLIC COMPARABLES
CONSUMER AND RETAIL
INDUSTRY UPDATE │ JANUARY 2017
5
Price at As a % of Market Cash & Enterprise LTM P/E
($ in m illions, except per share data) Ticker 1/18/17 52-wk High Cap Debt Equiv. Value (EV) Revenue EBITDA 1 Year 3 Years Gross EBITDA Multiple Revenue EBITDA Revenue EBITDA
Consumer Products & Services
Apparel & Footwear
Coach, Inc. COH 35.26 80.7% 9,884 591 1,533 8,942 4,499 991 7.6% (3.9%) 68.2% 22.0% 20.8x 1.99x 9.0x 1.81x 5.7x
Columbia Sportswear Company COLM 54.70 86.1% 3,821 15 220 3,616 2,359 291 2.4% 12.6% 43.7% 12.4% 23.7x 1.53x 12.4x 2.15x 20.0x
Carter's, Inc. CRI 85.94 76.3% $4,243 $581 $141 $4,683 $3,132 $434 3.8% 7.0% 42.5% 13.8% 18.7x 1.50x 10.8x 1.77x 12.4x
Crocs, Inc. CROX 7.01 55.9% 515 4 150 369 1,058 12 (2.8%) (3.8%) 41.8% 1.2% NA 0.35x 30.1x 0.31x 2.7x
Deckers Outdoor Corporation DECK 60.06 85.9% 1,927 310 110 2,127 1,831 229 0.3% 16.0% 45.7% 12.5% 17.2x 1.16x 9.3x 1.70x 10.7x
Fossil Group, Inc. FOSL 25.04 48.2% 1,205 724 236 1,693 3,076 288 (6.8%) (0.7%) 52.5% 9.4% 12.5x 0.55x 5.9x 0.52x 2.6x
G-III Apparel Group, Ltd. GIII 26.89 48.1% 1,306 91 45 1,353 2,311 158 (0.9%) 12.5% 34.3% 6.8% 16.3x 0.59x 8.6x 0.80x 9.4x
Hanesbrands Inc. HBI 22.18 70.7% 8,390 4,128 450 12,069 5,862 966 0.3% 9.3% 38.2% 16.5% 17.7x 2.06x 12.5x 2.61x 17.6x
Iconix Brand Group, Inc. ICON 10.37 96.4% 582 1,290 240 1,632 367 168 (5.0%) (3.8%) 0.0% 45.6% NA 4.45x 9.7x 3.77x 6.2x
Kate Spade & Co KATE 17.97 67.9% 2,303 394 308 2,389 1,340 222 10.5% (7.1%) 60.1% 16.6% 18.0x 1.78x NM 1.89x 20.5x
NIKE, Inc. Class B NKE 53.13 81.2% 87,889 3,537 5,943 85,483 33,458 4,641 6.3% 8.4% 43.9% 13.9% 23.6x 2.55x 18.4x 3.19x 21.3x
Oxford Industries, Inc. OXM 52.76 67.6% 885 142 5 1,022 1,021 125 3.8% 4.2% 56.8% 12.3% 15.3x 1.00x 8.2x 1.12x 8.9x
Perry Ellis International, Inc. PERY 24.00 82.8% 372 108 43 437 871 32 (3.5%) (3.0%) 35.1% 3.6% NA 0.50x 13.8x 0.48x 13.4x
PVH Corp. PVH 92.23 79.9% 7,311 3,324 662 9,972 8,208 1,018 2.9% 1.8% 52.1% 12.4% 13.3x 1.21x 9.8x 1.25x 8.2x
Ralph Lauren Corporation Class A RL 88.16 76.1% 7,248 973 994 7,227 7,190 1,007 (4.2%) 0.6% 56.2% 14.0% 38.9x 1.01x 7.2x 0.99x 5.2x
Steven Madden, Ltd. SHOO 35.30 87.1% 2,140 0 93 2,047 1,407 179 0.3% 3.0% 35.4% 12.7% 18.2x 1.45x 11.4x 1.56x 9.5x
Skechers U.S.A., Inc. Class A SKX 24.88 72.6% 3,928 75 665 3,337 3,522 441 17.6% 25.3% 42.5% 12.5% 14.7x 0.95x 7.6x 1.81x 25.1x
Gildan Activewear Inc. GIL-CA 25.77 80.8% 5,975 691 82 6,583 2,244 391 5.8% 1.9% 25.7% 17.4% 26.3x 2.93x 16.8x 3.12x 15.3x
Tumi Holdings, Inc. TUMI 0.00 0.0% 0 7 113 (106) 565 117 4.0% 9.2% 59.4% 20.7% NA NM NM NM NM
Under Armour, Inc. Class C UA 25.51 55.2% 12,046 1,074 180 12,940 4,691 577 27.2% 29.6% 47.1% 12.3% 38.3x 2.76x 22.4x 5.55x 41.0x
V.F. Corporation VFC 50.71 75.6% 20,979 3,088 738 23,330 12,300 2,136 (2.4%) 3.3% 48.9% 17.4% 21.9x 1.90x 10.9x 2.04x 12.3x
Vera Bradley, Inc. VRA 11.76 56.8% 426 0 83 343 505 76 0.8% (2.3%) 58.2% 15.1% 14.3x 0.68x 4.5x 0.64x 3.1x
Weyco Group, Inc. WEYS 28.23 87.4% 295 23 18 300 302 28 (8.0%) 0.2% 37.9% 9.2% 20.3x 0.99x 10.8x 1.00x NA
Wolverine World Wide, Inc. WWW 22.93 89.8% 2,262 1,052 531 2,784 2,516 272 (8.5%) (1.1%) 39.4% 10.8% 22.8x 1.11x 10.2x 1.03x 9.4x
Mean 71.2% $7,747 $926 $566 $8,107 $4,360 $617 2.1% 5.0% 44.4% 14.2% 20.6x 1.52x 11.8x 1.79x 12.8x
Median 76.2% $2,282 $487 $200 $2,586 $2,335 $280 0.6% 2.5% 43.8% 12.6% 18.4x 1.21x 10.5x 1.70x 10.1x
Consumer Durables
Arcelik A.S. ARCLK-TR 5.73 74.5% 3,873 1,724 908 4,689 5,289 544 (0.8%) (3.0%) 32.4% 10.3% 8.6x 0.89x 8.6x 0.91x 8.7x
Electrolux AB Class B ELUX.B-SE 25.72 87.0% 7,963 1,174 1,328 7,809 14,215 1,203 (6.6%) (5.2%) 22.8% 8.5% 21.9x 0.55x 6.5x 0.46x 8.0x
iRobot Corporation IRBT 59.95 98.5% 1,627 0 203 1,424 655 78 14.9% 12.3% 47.3% 12.0% 35.6x 2.18x 18.2x 2.92x 24.7x
Middleby Corporation MIDD 131.77 91.8% 7,582 833 62 8,354 2,206 488 27.7% 18.0% 40.1% 22.1% 29.8x 3.79x 17.1x 5.85x 28.4x
Haier Electronics Group Co., Ltd. 1169-HK 1.78 92.2% 4,961 196 1,722 3,435 9,363 462 (11.6%) 0.1% 16.8% 4.9% 11.5x 0.37x 7.4x 0.33x 7.5x
Whirlpool Corporation WHR 185.82 95.7% 13,957 5,389 1,025 18,321 20,622 2,268 (3.3%) 3.7% 17.9% 11.0% 16.2x 0.89x 8.1x 0.98x 10.0x
Mean 90.0% $6,660 $1,553 $875 $7,339 $8,725 $841 3.4% 4.3% 29.5% 11.5% 20.6x 1.44x 11.0x 1.91x 14.5x
Median 92.0% $6,271 $1,004 $967 $6,249 $7,326 $516 (2.1%) 1.9% 27.6% 10.6% 19.1x 0.89x 8.3x 0.94x 9.3x
Last Twelve Months (LTM) EV / LTM EV / 2017ERevenue Growth LTM Margins

PAGE |
PUBLIC COMPARABLES
CONSUMER AND RETAIL
INDUSTRY UPDATE │ JANUARY 2017
6
Price at As a % of Market Cash & Enterprise LTM P/E
($ in m illions, except per share data) Ticker 1/18/17 52-wk High Cap Debt Equiv. Value (EV) Revenue EBITDA 1 Year 3 Years Gross EBITDA Multiple Revenue EBITDA Revenue EBITDA
Consumer Services and Retail Franchisors
GNC Holdings, Inc. Class A GNC 11.12 31.0% 760 1,549 37 2,271 2,588 399 (1.5%) 0.1% 35.5% 15.4% 4.3x 0.88x 5.7x 0.86x 4.3x
H&R Block, Inc. HRB 23.61 67.2% 4,893 1,968 342 6,519 3,029 826 (1.6%) 1.1% 44.9% 27.3% 20.7x 2.15x 7.9x 2.18x 7.4x
Planet Fitness, Inc. Class A PLNT 20.55 81.9% 1,250 482 68 1,664 368 147 31.4% 32.0% 42.4% 40.0% 32.9x 4.53x 11.3x NA NA
Regis Corporation RGS 14.34 86.6% 663 120 149 635 1,772 87 (2.8%) (3.7%) 38.3% 4.9% NA 0.36x 7.3x 0.32x 5.7x
Realogy Holdings Corp. RLGY 25.72 68.9% 3,668 3,725 234 7,159 5,765 640 1.4% 3.1% 19.3% 11.1% 23.3x 1.24x 11.2x 1.35x 9.0x
Serv iceMaster Global Holdings, Inc. SERV 37.31 88.4% 5,026 2,785 256 7,555 2,714 630 5.6% (4.9%) 45.9% 23.2% 36.5x 2.78x 12.0x 3.29x 16.3x
Winmark Corporation WINA 115.10 86.5% 474 48 1 521 66 38 (3.7%) 6.3% 92.1% 57.3% 22.7x 7.87x 13.7x NA NA
Mean 72.9% $2,391 $1,525 $155 $3,761 $2,329 $395 4.1% 4.9% 45.5% 25.6% 23.4x 2.83x 9.9x 1.60x 8.5x
Median 81.9% $1,250 $1,549 $149 $2,271 $2,588 $399 (1.5%) 1.1% 42.4% 23.2% 23.0x 2.15x 11.2x 1.35x 7.4x
Home & Office Furniture & Furnishings
Dixie Group, Inc. DXYN 3.50 62.9% 56 116 0 172 403 17 (3.8%) 7.9% 24.7% 4.2% NA 0.43x 10.2x 0.50x NA
HNI Corporation HNI 50.92 89.4% 2,264 237 35 2,466 2,219 255 (5.7%) 2.7% 37.8% 11.5% 21.5x 1.11x 9.7x 1.20x 16.1x
Hooker Furniture Corporation HOFT 33.90 85.8% 393 49 43 399 464 38 84.6% 26.3% 21.8% 8.2% 21.2x 0.86x 10.5x 1.75x 26.5x
Kimball International, Inc. Class B KBAL 16.77 93.2% 623 0 63 561 654 61 59.7% (19.1%) 32.3% 9.3% 23.7x 0.86x 9.2x 0.45x NA
Knoll, Inc. KNL 27.13 95.5% 1,334 193 11 1,516 1,177 155 8.4% 10.1% 38.1% 13.2% 17.7x 1.29x 9.8x 1.76x 20.1x
Leggett & Platt, Incorporated LEG 47.29 86.6% 6,322 1,056 317 7,061 3,801 610 (3.2%) 0.9% 24.2% 16.1% 17.3x 1.86x 11.6x 1.88x 14.9x
LaZBoy Incorporated LZB 28.90 87.8% 1,414 1 130 1,284 1,518 154 4.2% 2.9% 39.3% 10.1% 18.5x 0.85x 8.3x 0.95x 11.8x
Herman Miller, Inc. MLHR $31.45 86.3% $1,884 $220 $80 $2,024 $2,295 $259 3.7% 8.0% 38.4% 11.3% 13.9x 0.88x NM 1.10x 10.2x
Steelcase Inc. Class A SCS 16.75 92.3% 1,965 297 236 2,027 3,011 247 (1.7%) 0.9% 33.1% 8.2% 11.4x 0.67x 8.2x 0.68x 8.4x
Tempur Sealy International Inc TPX 64.26 78.1% 3,721 1,685 89 5,317 3,125 447 (0.1%) 13.7% 41.3% 14.3% 31.0x 1.70x 11.9x 2.16x 14.2x
Mean 85.8% $1,998 $385 $100 $2,283 $1,867 $224 14.6% 5.4% 33.1% 10.6% 19.6x 1.05x 9.9x 1.24x 15.3x
Median 87.2% $1,649 $206 $71 $1,770 $1,869 $201 1.8% 5.4% 35.5% 10.7% 18.5x 0.87x 9.8x 1.15x 14.6x
Household Products
Church & Dwight Co., Inc. CHD 44.70 83.3% 11,562 930 232 12,260 3,471 815 2.5% 2.9% 45.5% 23.5% 25.6x 3.53x 15.0x 3.84x 17.2x
Colgate-Palmolive Company CL $67.87 90.0% $60,317 $6,523 $1,543 $65,297 $15,373 $4,402 (6.0%) (3.9%) 59.7% 28.6% 43.6x 4.25x 14.8x 3.75x 14.2x
Clorox Company CLX 121.07 86.2% 15,587 2,407 408 17,586 5,814 1,230 2.1% 1.0% 45.0% 21.2% 24.4x 3.02x 14.3x 3.14x 15.2x
Prestige Brands Holdings, Inc. PBH 51.89 89.3% 2,747 1,480 30 4,196 833 295 6.0% 10.0% 54.9% 35.4% 40.2x 5.04x 14.2x 6.96x 20.1x
Procter & Gamble Company PG 85.01 94.1% 227,459 31,125 15,941 242,643 65,290 17,525 (9.3%) (8.3%) 50.8% 26.8% 23.7x 3.72x 13.8x 2.90x 12.7x
Mean 88.6% $63,534 $8,493 $3,631 $68,396 $18,156 $4,853 (1.0%) 0.3% 51.2% 27.1% 31.5x 3.91x 14.4x 4.12x 15.9x
Median 89.3% $15,587 $2,407 $408 $17,586 $5,814 $1,230 2.1% 1.0% 50.8% 26.8% 25.6x 3.72x 14.3x 3.75x 15.2x
Housewares
Fiskars Oyj Abp FIS1V-FI 19.33 93.7% 1,584 275 526 1,332 1,326 110 18.1% 9.3% 40.1% 8.3% 16.7x 1.01x 12.1x 1.21x 10.2x
Helen of Troy Limited HELE 92.40 87.0% 2,494 565 17 3,042 1,546 223 0.6% 5.1% 43.4% 14.4% 22.7x 1.97x 13.7x 2.32x 15.7x
Jarden Corporation JAH 0.00 0.0% 0 6,381 1,298 5,083 8,603 965 3.8% 8.7% 30.9% 11.2% NA 0.59x 5.3x 0.69x 5.4x
Libbey Inc. LBY 18.10 86.2% 395 414 43 767 810 80 (3.3%) (0.4%) 19.6% 9.9% 8.9x 0.95x 9.6x 0.94x 5.7x
Lifetime Brands, Inc. LCUT 16.11 83.2% 232 141 6 367 585 39 (1.2%) 5.9% 36.0% 6.6% 19.3x 0.63x 9.5x 0.73x 9.2x
NACCO Industries, Inc. Class A NC 80.45 80.8% 545 137 44 638 859 9 (7.3%) (2.9%) 21.5% 1.0% 23.9x 0.74x 73.2x NA NA
Newell Brands Inc NWL 47.49 85.6% 22,912 12,748 670 34,990 10,689 1,091 81.8% 23.2% 32.4% 10.2% NM 3.27x 32.1x 6.15x 38.0x
Safety-Kleen, Inc. SK 0.21 88.6% 0 224 40 184 1,284 130 19.6% 1.4% 11.2% 10.1% NA 0.14x 1.4x NA NA
Spectrum Brands Holdings, Inc. SPB 123.05 88.6% 7,342 3,620 275 10,687 5,040 899 7.5% 7.3% 38.2% 17.8% 20.5x 2.12x 11.9x 2.56x 16.0x
Tupperware Brands Corporation TUP 55.98 83.7% 2,830 807 99 3,538 2,204 368 (7.1%) (6.1%) 67.4% 16.7% 14.1x 1.61x 9.6x 1.32x 7.5x
Mean 77.7% $3,833 $2,531 $302 $6,063 $3,295 $391 11.2% 5.1% 34.1% 10.6% 18.0x 1.30x 17.8x 1.99x 13.5x
Median 85.9% $1,064 $489 $71 $2,187 $1,436 $176 2.2% 5.5% 34.2% 10.2% 19.3x 0.98x 10.7x 1.27x 9.7x
Last Twelve Months (LTM) LTM Margins EV / LTM EV / 2017ERevenue Growth

PAGE |
PUBLIC COMPARABLES
CONSUMER AND RETAIL
INDUSTRY UPDATE │ JANUARY 2017
7
Price at As a % of Market Cash & Enterprise LTM P/E
($ in m illions, except per share data) Ticker 1/18/17 52-wk High Cap Debt Equiv. Value (EV) Revenue EBITDA 1 Year 3 Years Gross EBITDA Multiple Revenue EBITDA Revenue EBITDA
Infant & Juvenile
Carter's, Inc. CRI 85.94 76.3% 4,243 581 141 4,683 3,132 434 3.8% 7.0% 42.5% 13.8% 18.7x 1.50x 10.8x 1.77x 12.4x
Crown Crafts, Inc. CRWS 7.75 75.7% 78 0 10 68 77 11 (12.7%) (1.3%) 27.4% 14.9% 12.1x 0.87x 5.9x 0.84x 6.4x
Dorel Industries Inc. Class B DII.B 27.57 88.9% 895 518 42 1,370 2,623 176 (3.4%) 2.7% 22.1% 6.7% NM 0.52x 7.8x 0.56x 8.1x
Hasbro, Inc. HAS 84.88 95.9% 10,592 1,727 854 11,465 4,848 898 13.1% 5.9% 51.0% 18.5% 20.2x 2.36x 12.8x 2.81x 15.4x
JAKKS Pacific, Inc. JAKK 5.50 56.4% 110 208 48 270 703 36 (15.9%) 3.8% 31.4% 5.1% 30.6x 0.38x 7.5x 0.43x NM
Mattel, Inc. MAT 30.45 87.6% 10,415 2,433 297 12,552 5,622 1,012 (1.3%) (5.3%) 49.2% 18.0% 29.4x 2.23x 12.4x 1.94x 9.2x
Mothercare plc MTC-GB 1.44 46.6% 246 39 45 239 976 64 (8.8%) (5.5%) 9.2% 6.6% 4.4x 0.25x 3.7x 0.20x 4.2x
Newell Brands Inc NWL 47.49 85.6% 22,912 12,748 670 34,990 10,689 1,091 81.8% 23.2% 32.4% 10.2% NM 3.27x 32.1x 6.15x 38.0x
Children's Place, Inc. PLCE 100.30 90.2% 1,809 66 267 1,607 1,763 197 3.3% (0.8%) 33.7% 11.2% 23.2x 0.91x 8.1x 0.91x 9.1x
Goodbaby International Holdings Ltd. 1086-HK 0.43 68.7% 483 204 134 553 835 61 (9.5%) 14.5% 31.9% 7.3% 16.6x 0.66x 9.0x 1.02x 15.9x
Summer Infant, Inc. SUMR 1.91 78.3% 35 48 1 83 201 11 (2.4%) (3.2%) 29.7% 5.4% NA 0.41x 7.6x 0.40x 11.2x
Tomy Company, Ltd. 7867-JP 10.81 94.7% 1,040 706 370 1,377 1,449 118 13.2% (9.0%) 34.7% 8.1% NA 0.95x 11.7x 0.90x 12.1x
Mean 78.7% $4,405 $1,606 $240 $5,771 $2,743 $342 5.1% 2.7% 32.9% 10.5% 19.4x 1.19x 10.8x 1.49x 12.9x
Median 82.0% $968 $363 $137 $1,373 $1,606 $147 (1.9%) 0.9% 32.2% 9.2% 19.4x 0.89x 8.6x 0.90x 11.2x
Outdoor & Lifestyle
Arctic Cat Inc. ACAT $13.55 68.4% $177 $74 $9 $242 $557 ($49) (12.7%) (6.9%) 8.9% NM NA 0.43x NM 0.34x 3.3x
Brunswick Corporation BC 55.55 97.4% 4,982 452 451 4,984 4,392 478 8.2% 5.1% 27.3% 10.9% 20.6x 1.13x 10.4x 1.28x 12.3x
Black Diamond, Inc. BDE 5.88 85.8% 177 21 96 102 150 (4) (9.8%) (7.7%) 27.9% NM NA 0.68x NM 0.50x 13.1x
Columbia Sportswear Company COLM 54.70 86.1% 3,821 15 220 3,616 2,359 291 2.4% 12.6% 43.7% 12.4% 23.7x 1.53x 12.4x 2.15x 20.0x
Callaway Golf Company ELY 11.41 90.8% 1,073 1 125 949 862 49 4.4% 1.0% 43.4% 5.7% 33.5x 1.10x NM 1.13x 29.1x
Escalade, Incorporated ESCA 13.10 89.1% 187 37 4 220 166 17 8.6% 1.6% 25.0% 10.4% 17.3x 1.33x 12.7x NA NA
Fox Factory Holding Corp. FOXF 26.73 94.6% 985 73 16 1,042 387 58 12.2% 13.6% 31.9% 15.0% 30.6x 2.69x 18.0x 3.82x 21.0x
GoPro, Inc. Class A GPRO 9.19 52.0% 1,292 0 225 1,067 1,081 (318) (40.5%) 27.2% 38.7% NM NA 0.99x NM 1.08x 8.3x
Amer Sports Oyj Class A AMEAS-FI 26.98 84.9% 3,198 1,025 275 3,947 2,900 286 1.4% 1.9% 44.8% 9.9% 21.4x 1.36x 13.8x 1.34x 14.6x
Rapala VMC Oyj RAP1V-FI 4.51 81.7% 176 134 12 298 306 37 (15.5%) (6.4%) 26.1% 12.0% 23.9x 0.97x 8.1x 0.75x 6.4x
Harley-Davidson, Inc. HOG 58.60 94.0% 10,355 6,926 860 16,421 6,066 1,452 0.9% 1.0% 40.0% 23.9% 15.4x 2.71x 11.3x 3.12x 12.1x
Johnson Outdoors Inc. Class A JOUT 35.08 77.3% 350 7 87 270 434 42 0.8% 0.6% 40.7% 9.6% 26.3x 0.62x 6.5x 0.63x NA
Malibu Boats Inc Class A MBUU 17.86 88.9% 316 56 16 356 258 41 8.2% 13.3% 27.8% 16.0% 17.4x 1.38x 8.7x NA NA
Marine Products Corporation MPX 13.19 88.7% 460 0 17 443 234 25 20.2% 12.9% 21.1% 10.5% 29.5x 1.89x NM 2.64x 41.2x
Nautilus, Inc. NLS 16.05 64.2% 500 68 59 508 389 58 21.1% 23.5% 53.5% 14.9% 15.4x 1.31x 8.8x 2.32x 26.5x
Polaris Industries Inc. PII 87.93 84.3% 5,635 437 123 5,949 4,438 536 (11.5%) 7.3% 26.5% 12.1% 22.0x 1.34x 11.1x 1.57x 9.1x
Sturm, Ruger & Company, Inc. RGR 51.15 65.5% 957 0 101 855 655 164 25.6% 0.3% 32.7% 25.0% 12.0x 1.31x 5.2x 1.24x 4.3x
American Outdoor Brands Corporation SWHC 20.39 65.4% 1,149 195 74 1,269 872 257 44.8% 11.7% 40.4% 29.4% 8.7x 1.46x 4.9x 2.07x 7.5x
Shimano Inc. 7309-JP 164.47 93.4% 15,249 82 1,710 13,621 2,955 741 (7.1%) 1.1% 40.7% 25.1% 35.4x 4.61x 18.4x 5.28x 27.8x
Vista Outdoor Inc VSTO 27.41 50.8% 1,613 1,121 48 2,685 2,519 362 22.4% 28.2% 27.3% 14.4% 9.5x 1.07x 7.4x NA NA
Mean 80.2% $2,633 $536 $226 $2,942 $1,599 $226 4.2% 7.1% 33.4% 15.1% 21.3x 1.50x 10.5x 1.84x 16.0x
Median 85.3% $1,029 $70 $92 $995 $758 $58 3.4% 3.5% 32.3% 12.4% 21.4x 1.32x 10.4x 1.34x 12.7x
Last Twelve Months (LTM) Revenue Growth LTM Margins EV / LTM EV / 2017E

PAGE |
PUBLIC COMPARABLES
CONSUMER AND RETAIL
INDUSTRY UPDATE │ JANUARY 2017
8
Price at As a % of Market Cash & Enterprise LTM P/E
($ in m illions, except per share data) Ticker 1/18/17 52-wk High Cap Debt Equiv. Value (EV) Revenue EBITDA 1 Year 3 Years Gross EBITDA Multiple Revenue EBITDA Revenue EBITDA
Personal Care Products
Avon Products, Inc. AVP 5.67 81.4% 2,485 2,338 902 3,921 5,026 456 (34.1%) (21.2%) 60.1% 9.1% NA 0.78x 8.6x 0.39x 3.9x
Estee Lauder Companies Inc. Class A EL 79.56 81.6% 29,161 2,500 1,189 30,472 11,293 2,253 2.8% 3.1% 80.7% 20.0% 27.3x 2.70x 13.5x 2.88x 14.8x
Herbalife Ltd. HLF 53.21 73.7% 4,951 1,443 788 5,606 4,542 516 0.8% (0.5%) 78.8% 11.4% 18.6x 1.23x 10.9x 1.16x 6.5x
Kimberly-Clark Corporation KMB 116.41 83.8% 41,689 7,648 884 48,453 18,197 3,993 2.7% (4.9%) 36.3% 21.9% 21.1x 2.66x 12.1x 2.29x 11.5x
Medifast, Inc. MED 41.16 95.4% 488 0 82 406 273 39 7.1% (9.0%) 74.5% 14.3% 28.1x 1.48x 10.4x 1.14x 7.7x
Nu Skin Enterprises, Inc. Class A NUS 51.44 77.9% 2,801 430 533 2,698 2,249 338 (1.6%) (6.4%) 78.6% 15.0% 21.0x 1.20x 8.0x 0.85x 4.6x
Procter & Gamble Company PG 85.01 94.1% 227,459 31,125 15,941 242,643 65,290 17,525 (9.3%) (8.3%) 50.8% 26.8% 23.7x 3.72x 13.8x 2.90x 12.7x
Elizabeth Arden, Inc. RDEN 0.00 0.0% 0 422 45 377 966 15 0.0% (10.4%) 40.6% 1.5% NA 0.39x 25.2x 0.30x 3.8x
Revlon, Inc. Class A REV 33.84 89.0% 1,776 2,761 99 4,438 2,055 370 8.5% 13.3% 59.7% 18.0% 46.1x 2.16x 12.0x 2.97x 17.0x
Sally Beauty Holdings, Inc. SBH 25.88 78.6% 3,715 1,784 87 5,413 3,953 614 3.1% 3.0% 47.2% 15.5% 17.3x 1.37x 8.8x 1.48x 9.1x
Ulta Salon, Cosmetics & Fragrance, Inc. ULTA 264.20 94.8% 16,442 0 243 16,199 4,542 797 22.7% 21.0% 36.1% 17.5% 44.1x 3.57x 20.3x 6.16x 38.1x
USANA Health Sciences, Inc. USNA 62.30 83.1% 1,518 1 135 1,385 986 155 7.9% 12.1% 47.0% 15.7% 15.3x 1.40x 9.0x 1.93x 11.0x
All for One Steeb AG A1OS-DE $59.10 74.2% $294 $25 $37 $283 $296 $32 6.9% 6.6% 19.2% 10.7% 22.4x 0.96x 8.9x 1.06x NA
Mean 77.5% $25,599 $3,883 $1,613 $27,869 $9,205 $2,085 1.3% (0.1%) 54.6% 15.2% 25.9x 1.82x 12.4x 1.96x 11.7x
Median 81.6% $2,801 $1,443 $243 $4,438 $3,953 $456 2.8% (0.5%) 50.8% 15.5% 22.4x 1.40x 10.9x 1.48x 10.0x
Pet Care
Blue Buffalo Pet Products Inc BUFF 25.37 92.3% 4,983 384 316 5,051 1,120 252 12.0% 28.9% 44.2% 22.5% 48.1x 4.51x 20.0x NA NA
Central Garden & Pet Company CENT $32.67 94.7% $1,601 $395 $104 $1,892 $1,829 $174 10.8% 3.4% 30.2% 9.5% 37.3x 1.03x 10.9x 1.15x 23.2x
Freshpet Inc FRPT $10.25 86.8% $347 $9 $3 $352 $129 $7 16.9% 43.7% 41.2% 5.8% NA 2.73x 47.0x NA NA
Oil-Dri Corporation of America ODC 32.82 80.2% 239 15 29 225 262 28 0.3% 1.5% 29.4% 10.5% 18.3x 0.86x 8.2x NA NA
Spectrum Brands Holdings, Inc. SPB 123.05 88.6% 7,342 3,620 275 10,687 5,040 899 7.5% 7.3% 38.2% 17.8% 20.5x 2.12x 11.9x 2.56x 16.0x
Maabarot Products Ltd. MABR-IL 16.09 98.6% 158 3 45 116 91 8 1.4% (2.1%) 40.6% 8.7% 23.2x 1.28x 14.7x NA NA
Echo Trading Co., Ltd. 7427-JP 5.99 91.0% 36 44 30 50 702 1 13.7% (3.5%) 11.6% 0.1% 11.4x 0.07x 77.6x 0.07x NA
Unicharm Corporation 8113-JP 21.89 82.6% 13,590 656 1,289 12,957 6,377 999 4.6% 2.5% 46.0% 15.7% 28.8x 2.03x 13.0x 2.37x 14.9x
Mean 89.3% $3,537 $641 $262 $3,916 $1,944 $296 8.4% 10.2% 35.2% 11.3% 26.8x 1.83x 25.4x 1.54x 18.0x
Median 89.8% $974 $214 $74 $1,122 $911 $101 9.1% 3.0% 39.4% 10.0% 23.2x 1.66x 13.8x 1.76x 16.0x
LTM MarginsLast Twelve Months (LTM) EV / 2017ERevenue Growth EV / LTM
PAGE |
PUBLIC COMPARABLES
CONSUMER AND RETAIL
INDUSTRY UPDATE │ JANUARY 2017
9
Price at As a % of Market Cash & Enterprise LTM P/E
($ in millions, except per share data) Ticker 1/18/17 52-wk High Cap Debt Equiv. Value (EV) Revenue EBITDA 1 Year 3 Years Gross EBITDA Multiple Revenue EBITDA Revenue EBITDA
LTM MarginsLast Twelve Months (LTM) EV / 2017ERevenue Growth EV / LTM
Retail
Apparel & Footwear Retail
American Eagle Outfitters, Inc. AEO 15.13 77.4% 2,752 0 292 2,460 3,618 519 3.7% 2.3% 33.6% 14.4% 11.9x 0.68x 4.7x 0.74x 6.6x
Abercrombie & Fitch Co. Class A ANF $11.93 36.3% $807 $336 $470 $673 $3,403 $260 (3.5%) (7.4%) 55.4% 7.6% NM 0.20x 2.6x 0.16x 1.5x
Arcandor AG ARO-DE 0.02 48.8% 5 4,963 1,077 3,890 29,669 156 8.5% 14.7% 15.9% 0.5% NA 0.13x 24.9x NA NA
Ascena Retail Group, Inc. ASNA 5.09 45.2% 991 1,601 271 2,322 7,002 609 32.6% 13.6% 52.4% 8.7% 49.2x 0.33x 3.8x 0.49x 4.9x
Buckle, Inc. BKE 21.08 60.2% 1,026 0 213 813 1,027 213 (10.0%) (3.7%) 41.6% 20.8% 9.0x 0.79x 3.8x 0.72x 2.8x
Cabela's Incorporated CAB 57.54 90.5% 3,940 5,966 485 9,421 4,199 455 8.7% 5.9% 37.8% 10.8% 23.8x 2.24x 20.7x 2.62x 20.5x
Caleres, Inc. CAL 31.13 85.0% 1,337 197 173 1,360 2,549 190 (1.4%) (0.1%) 41.2% 7.4% 16.3x 0.53x 7.2x 0.54x 8.6x
Cato Corporation Class A CATO 26.59 65.6% 714 0 247 466 987 107 (1.4%) 1.7% 36.2% 10.8% 10.5x 0.47x 4.4x 0.51x 4.5x
Chico's FAS, Inc. CHS 13.28 78.8% 1,715 85 131 1,669 2,503 263 (6.3%) (1.6%) 42.0% 10.5% NM 0.67x 6.3x 0.65x 4.9x
Citi Trends, Inc. CTRN 17.04 75.0% 254 0 71 183 686 35 (0.5%) 2.3% 35.9% 5.1% 22.8x 0.27x 5.3x 0.29x 8.6x
Destination Maternity Corporation DEST 5.24 51.2% 73 47 3 117 452 20 18.8% (5.8%) 52.1% 4.5% NA 0.26x 5.8x 0.23x NA
DSW Inc. Class A DSW 21.18 71.7% 1,695 0 145 1,550 2,709 254 4.7% 4.3% 28.4% 9.4% 16.7x 0.57x 6.1x 0.66x 4.6x
Destination XL Group, Inc. DXLG 3.40 57.8% 173 83 6 250 452 32 3.1% 4.6% 39.1% 7.1% NA 0.55x 7.8x 0.64x 21.2x
Express, Inc. EXPR 10.80 50.1% 847 69 102 813 2,279 239 (1.3%) 0.8% 32.2% 10.5% 9.9x 0.36x 3.4x 0.37x 2.8x
Finish Line, Inc. Class A FINL 17.57 71.6% 712 17 33 696 1,867 137 0.4% 5.4% 27.0% 7.3% NA 0.37x 5.1x 0.43x 4.3x
Foot Locker, Inc. FL 69.37 87.3% 9,180 128 865 8,443 7,660 1,138 4.7% 6.0% 31.9% 14.9% 15.1x 1.10x 7.4x 1.30x 10.6x
Genesco Inc. GCO 61.95 83.5% 1,231 261 31 1,462 2,917 226 (2.2%) 3.5% 48.8% 7.8% 14.1x 0.50x 6.5x 0.56x 5.6x
Guess?, Inc. GES 12.48 54.6% 1,052 24 349 727 2,188 145 (2.4%) (5.8%) 34.0% 6.6% 17.1x 0.33x 5.0x 0.28x 2.2x
Gap, Inc. GPS 23.57 76.7% 9,396 1,744 1,522 9,618 15,472 2,100 (4.0%) (1.7%) 35.8% 13.6% 14.4x 0.62x 4.6x 0.60x 3.7x
L Brands, Inc. LB 61.05 62.7% 17,452 5,724 654 22,522 12,480 2,628 5.5% 4.9% 41.6% 21.1% 15.5x 1.80x 8.6x 2.10x 10.7x
Lululemon Athletica Inc LULU 68.53 83.8% 9,394 0 480 8,914 2,259 467 15.3% 13.2% 49.9% 20.7% 33.4x 3.95x 19.1x 5.67x 20.3x
Tailored Brands, Inc. TLRD 21.13 73.5% 1,030 1,596 35 2,591 3,411 338 (5.2%) 10.6% 42.4% 9.9% NM 0.76x 7.7x 1.05x 9.9x
New York & Company, Inc. NWY 2.16 52.0% 139 13 54 98 934 16 (1.3%) (0.9%) 27.9% 1.7% NA 0.10x 6.2x 0.10x 2.7x
Children's Place, Inc. PLCE 100.30 90.2% 1,809 66 267 1,607 1,763 197 3.3% (0.8%) 33.7% 11.2% 23.2x 0.91x 8.1x 0.91x 9.1x
Pacific Sunwear of California, Inc. PSUN 0.00 0.0% 0 132 11 121 800 4 (0.2%) (0.2%) 25.6% 0.5% NA 0.15x NM 0.15x 35.6x
Ross Stores, Inc. ROST 66.88 95.8% 26,359 396 895 25,861 12,607 2,036 7.6% 7.1% 28.4% 16.1% 24.7x 2.05x 12.7x 2.54x 16.9x
Shoe Carnival, Inc. SCVL 25.35 79.7% 467 0 34 433 1,001 71 2.3% 4.0% 29.3% 7.1% 16.5x 0.43x 6.1x 0.49x 7.1x
Stein Mart, Inc. SMRT 3.85 41.7% 181 180 14 346 1,369 56 1.2% 2.5% 25.2% 4.1% 15.4x 0.25x 6.2x 0.27x 4.7x
Stage Stores, Inc. SSI 3.31 36.7% 90 243 19 314 1,491 56 (8.3%) (3.6%) 23.0% 3.8% NA 0.21x 5.6x 0.19x 2.5x
Urban Outfitters, Inc. URBN 26.73 65.5% 3,107 0 260 2,847 3,529 502 2.5% 5.1% 35.7% 14.2% 14.1x 0.81x 5.7x 0.93x 5.2x
Zumiez Inc. ZUMZ 19.80 74.6% 493 12 49 456 815 67 (0.6%) 4.1% 26.8% 8.2% 25.5x 0.56x 6.8x 0.63x 4.6x
Mean 65.3% $3,175 $770 $299 $3,647 $4,326 $437 2.4% 2.8% 35.8% 9.6% 19.0x 0.74x 7.6x 0.89x 8.5x
Median 71.6% $1,026 $83 $173 $1,360 $2,279 $213 0.4% 2.5% 35.7% 8.7% 16.3x 0.53x 6.2x 0.58x 5.2x
Department Chains
Bon-Ton Stores, Inc. BONT $1.30 43.3% $28 $1,112 $7 $1,133 $2,725 $114 (2.8%) (2.2%) 33.2% 4.2% NA 0.42x 9.9x 0.40x 6.9x
Dillard's, Inc. Class A DDS 56.13 63.4% 1,875 838 80 2,632 6,551 603 (5.5%) (1.1%) 31.1% 9.2% 10.4x 0.40x 4.4x 0.39x 3.3x
J. C. Penney Company, Inc. JCP 6.78 56.5% 2,089 4,796 183 6,702 12,582 778 0.5% 1.7% 31.1% 6.2% NA 0.53x 8.6x 0.56x NM
Nordstrom, Inc. JWN 43.67 69.5% 7,571 2,778 531 9,818 14,634 1,572 2.4% 5.3% 35.6% 10.7% 23.9x 0.67x 6.2x 0.79x 5.5x
Kohl's Corporation KSS 40.80 68.4% 7,200 4,624 597 11,227 18,868 2,375 (1.5%) (0.7%) 31.0% 12.6% 12.9x 0.60x 4.7x 0.59x 4.3x
Macy's Inc M 28.95 63.6% 8,843 7,501 457 15,887 26,132 2,812 (5.2%) (2.4%) 35.1% 10.8% 14.1x 0.61x 5.6x 0.57x 4.2x
Stage Stores, Inc. SSI 3.31 36.7% 90 243 19 314 1,491 56 (8.3%) (3.6%) 23.0% 3.8% NA 0.21x 5.6x 0.19x 2.5x
Hudson's Bay Co. HBC-CA 7.42 49.2% 1,352 3,396 64 4,685 10,789 494 42.7% 37.6% 36.9% 4.6% NM 0.43x 9.5x 0.97x 12.7x
Mean 56.3% $3,631 $3,161 $242 $6,550 $11,721 $1,101 2.8% 4.3% 32.1% 7.8% 15.3x 0.48x 6.8x 0.56x 5.6x
Median 60.0% $1,982 $3,087 $132 $5,693 $11,685 $691 (2.1%) (0.9%) 32.2% 7.7% 13.5x 0.48x 5.9x 0.57x 4.3x

PAGE |
PUBLIC COMPARABLES
CONSUMER AND RETAIL
INDUSTRY UPDATE │ JANUARY 2017
10
Price at As a % of Market Cash & Enterprise LTM P/E
($ in m illions, except per share data) Ticker 1/18/17 52-wk High Cap Debt Equiv. Value (EV) Revenue EBITDA 1 Year 3 Years Gross EBITDA Multiple Revenue EBITDA Revenue EBITDA
Discount Stores & Mass Merchants
Big Lots, Inc. BIG 49.89 88.2% 2,223 363 60 2,526 5,205 389 0.1% (1.5%) 37.9% 7.5% 15.6x 0.49x 6.5x 0.48x 8.1x
Costco Wholesale Corporation COST 163.75 96.6% 71,917 5,092 6,116 70,893 119,598 5,035 2.6% 4.0% 13.4% 4.2% 29.9x 0.59x 14.1x 0.66x 17.3x
CVS Health Corporation CVS 83.32 78.1% 88,861 26,733 2,263 113,331 172,701 12,839 15.8% 11.3% 16.5% 7.4% 18.0x 0.66x 8.8x 0.89x 11.5x
Dollar General Corporation DG 72.45 74.8% 20,015 3,175 200 22,990 21,264 2,384 6.2% 7.3% 30.9% 11.2% 17.5x 1.08x 9.6x 1.32x 11.2x
Dollar Tree, Inc. DLTR 77.12 77.2% 18,206 7,084 738 24,552 20,449 2,247 62.2% 37.6% 30.5% 11.0% 23.0x 1.20x 10.9x 3.15x 21.3x
Gordmans Stores, Inc. GMAN 0.78 27.6% 15 63 9 69 642 6 (1.0%) 1.1% 38.6% 1.0% NA 0.11x 10.9x 0.11x 2.6x
PriceSmart, Inc. PSMT 84.45 89.0% 2,568 97 176 2,489 2,933 181 2.6% 7.4% 15.8% 6.2% 28.6x 0.85x 13.7x 1.05x 15.6x
Rite Aid Corporation RAD 8.63 98.3% 9,077 7,275 227 16,125 32,574 1,152 11.1% 8.7% 23.8% 3.5% NM 0.50x 14.0x 0.63x 12.5x
Target Corporation TGT 66.81 79.4% 37,521 12,826 1,231 49,116 70,431 7,472 (3.0%) (1.5%) 26.7% 10.6% 12.8x 0.70x 6.6x 0.68x 7.8x
TJX Companies Inc TJX 76.34 91.3% 49,760 2,227 2,826 49,160 32,678 4,489 7.9% 6.1% 29.0% 13.7% 22.5x 1.50x 11.0x 1.80x 12.7x
Tuesday Morning Corporation TUES 4.63 50.1% 210 33 6 236 966 25 6.6% 4.4% 35.9% 2.6% NM 0.24x NM 0.28x NA
Walgreens Boots Alliance Inc WBA 83.69 95.1% 90,336 18,872 9,598 99,610 116,819 7,817 3.5% 16.8% 23.7% 6.7% 22.3x 0.85x 12.7x 1.35x 18.0x
Wal-Mart Stores, Inc. WMT 67.76 90.1% 208,239 50,005 5,939 252,305 483,983 32,385 (0.0%) 0.7% 25.5% 6.7% 14.9x 0.52x 7.8x 0.53x 6.9x
Mean 79.7% $46,073 $10,296 $2,261 $54,108 $83,096 $5,879 8.8% 7.9% 26.8% 7.1% 20.5x 0.71x 10.6x 0.99x 12.1x
Median 88.2% $20,015 $5,092 $738 $24,552 $32,574 $2,384 3.5% 6.1% 26.7% 6.7% 20.2x 0.66x 10.9x 0.68x 12.0x
Furniture & Furnishings Retailers
Aaron's, Inc. AAN $32.12 93.9% $2,294 $496 $340 $2,450 $3,234 $1,659 3.7% 12.8% 47.5% 51.3% 16.8x 0.76x 1.5x 1.10x 9.0x
Bed Bath & Beyond Inc. BBBY 40.96 77.7% 6,157 1,491 473 7,175 12,100 1,499 0.6% 1.1% 35.4% 12.4% 8.9x 0.59x 4.8x 0.63x 3.9x
Conn's, Inc. CONN 11.08 51.6% 342 1,260 190 1,411 1,621 95 2.4% 14.4% 45.3% 5.8% NA 0.87x 14.9x 1.21x 8.0x
Ethan Allen Interiors Inc. ETH 32.10 82.7% 888 41 69 859 797 106 5.7% 3.3% 56.0% 13.3% 16.4x 1.08x 8.1x 1.16x 9.8x
hhgregg, Inc. HGG 0.70 25.6% 19 0 1 18 1,910 (6) (8.1%) (8.5%) 26.9% NM NA 0.01x NM 0.01x 0.3x
Haverty Furniture Companies, Inc. HVT 22.58 92.0% 477 56 84 449 817 71 1.9% 3.7% 53.7% 8.7% 18.8x 0.55x 6.3x 0.60x 6.1x
Kirkland's, Inc. KIRK 13.89 76.4% 221 0 28 193 590 46 9.0% 8.1% 33.6% 7.7% 19.7x 0.33x 4.2x 0.42x 4.9x
LaZBoy Incorporated LZB 28.90 87.8% 1,414 1 130 1,284 1,518 154 4.2% 2.9% 39.3% 10.1% 18.5x 0.85x 8.3x 0.95x 11.8x
Pier 1 Imports, Inc. PIR 7.74 80.0% 641 226 86 782 1,858 103 (1.1%) 0.9% 34.9% 5.6% 31.4x 0.42x 7.6x 0.44x 3.5x
Rent-A-Center Inc RCII 10.03 61.3% 533 725 130 1,128 3,073 959 (5.9%) (0.2%) 37.9% 31.2% NA 0.37x 1.2x 0.36x 3.4x
RH RH 29.53 45.1% 1,202 568 226 1,544 2,195 175 7.4% 14.1% 32.9% 8.0% 43.5x 0.70x 8.8x 1.02x 10.8x
Select Comfort Corporation SCSS 20.62 72.8% 927 0 51 875 1,213 91 (8.2%) 8.5% 61.2% 7.5% 45.7x 0.72x 9.7x 0.91x 7.2x
Sherwin-Williams Company SHW 285.28 91.3% 26,505 1,962 703 27,764 11,678 1,967 3.3% 5.5% 50.6% 16.8% 23.8x 2.38x 14.1x 2.73x 20.3x
Williams-Sonoma, Inc. WSM 49.64 80.1% 4,361 125 75 4,410 5,089 670 3.2% 5.5% 36.7% 13.2% 15.0x 0.87x 6.6x 1.01x 7.3x
Mean 72.7% $3,284 $497 $185 $3,596 $3,407 $542 1.3% 5.2% 42.3% 14.7% 23.5x 0.75x 7.4x 0.90x 7.6x
Median 78.9% $907 $176 $108 $1,206 $1,884 $130 2.8% 4.6% 38.6% 10.1% 18.8x 0.71x 7.6x 0.93x 7.3x
EV / 2017ELast Twelve Months (LTM) Revenue Growth LTM Margins EV / LTM

PAGE |
PUBLIC COMPARABLES
CONSUMER AND RETAIL
INDUSTRY UPDATE │ JANUARY 2017
11
Price at As a % of Market Cash & Enterprise LTM P/E
($ in m illions, except per share data) Ticker 1/18/17 52-wk High Cap Debt Equiv. Value (EV) Revenue EBITDA 1 Year 3 Years Gross EBITDA Multiple Revenue EBITDA Revenue EBITDA
Internet Retail
Amazon.com, Inc. AMZN 806.15 95.2% 383,072 18,988 18,815 383,245 127,993 11,131 27.2% 22.2% 34.6% 8.7% NM 2.99x 34.4x 5.15x 74.4x
Alibaba Group Holding Ltd. Sponsored ADR BABA $95.60 87.0% $232,252 $13,208 $16,674 $228,786 $19,164 $6,820 38.7% 41.3% 60.5% 35.6% 47.4x 11.94x 33.5x NA NA
Cimpress N.V. CMPR 94.84 91.0% 3,000 831 61 3,770 1,856 206 20.8% 15.9% 55.2% 11.1% NM 2.03x NM 3.09x 22.6x
eBay Inc. EBAY 30.29 91.2% 33,856 9,031 8,045 34,842 8,906 2,930 (20.3%) (16.9%) 77.5% 32.9% 19.6x 3.91x 11.9x 2.17x 6.5x
MercadoLibre, Inc. MELI 175.96 90.9% 7,770 306 472 7,604 769 191 21.6% 20.3% 61.0% 24.8% NM 9.89x NM 16.09x 44.8x
Blue Nile, Inc. NILE 40.67 98.3% 477 0 41 437 472 19 (3.2%) 2.3% 19.6% 4.0% NM 0.93x 23.2x 0.97x 20.2x
Overstock.com, Inc. OSTK 16.40 83.2% 416 50 125 341 1,754 15 6.4% 12.0% 16.3% 0.9% 45.4x 0.19x 22.5x 0.26x 10.5x
Priceline Group Inc PCLN 1,530.99 95.6% 75,672 7,343 4,379 78,636 10,395 4,015 14.7% 17.3% 100.7% 38.6% 39.2x 7.57x 19.6x 11.58x 29.4x
Shutterfly, Inc. SFLY 53.18 97.4% 1,805 401 93 2,113 1,121 149 12.7% 15.7% 49.5% 13.3% 40.1x 1.88x 14.2x 2.70x 14.0x
Stamps.com Inc. STMP 119.90 96.9% 2,045 165 84 2,125 328 119 76.6% 37.8% 78.6% 36.3% 47.7x 6.47x 17.8x 16.63x 51.9x
Rakuten, Inc. 4755-JP 9.88 68.7% 14,150 6,879 5,899 15,130 6,730 1,394 16.1% 6.8% 70.5% 20.7% 34.8x 2.25x 10.9x 3.07x 13.6x
Wayfair, Inc. Class A W 40.06 81.2% 3,427 29 293 3,163 3,136 (121) 63.4% 73.4% 23.8% NM NA 1.01x NM NA NA
Mean 89.7% $63,162 $4,769 $4,582 $63,349 $15,219 $2,239 22.9% 20.7% 54.0% 20.6% 39.2x 4.26x 20.9x 6.17x 28.8x
Median 91.1% $5,598 $616 $382 $5,687 $2,496 $199 18.5% 16.6% 57.8% 20.7% 40.1x 2.62x 19.6x 3.08x 21.4x
Specialty & Other Retail
Best Buy Co., Inc. BBY 44.23 89.5% 13,877 1,367 3,311 11,933 39,544 2,295 1.6% (0.6%) 23.7% 5.8% 13.6x 0.30x 5.2x 0.28x 6.3x
Big 5 Sporting Goods Corporation BGFV 15.10 74.2% 331 27 5 352 1,030 43 2.5% 1.4% 31.4% 4.2% 26.1x 0.34x 8.2x 0.35x 5.1x
Barnes & Noble, Inc. BKS $11.25 82.5% $818 $191 $11 $998 $4,063 $165 (19.0%) (14.8%) 28.6% 4.1% NM 0.25x NM 0.15x 5.9x
Dick's Sporting Goods, Inc. DKS 51.96 82.6% 5,855 266 85 6,036 7,679 725 6.8% 8.1% 30.2% 9.4% 18.4x 0.79x 8.3x 0.98x 8.7x
Home Depot, Inc. HD 135.67 97.6% 165,256 22,881 3,589 184,548 93,368 15,038 7.7% 5.6% 32.3% 16.1% 22.0x 1.98x 12.3x 2.35x 17.1x
Hibbett Sports, Inc. HIBB 34.00 74.2% 747 3 41 709 972 122 3.7% 4.5% 33.4% 12.5% 11.6x 0.73x 5.8x 0.83x 5.5x
MarineMax, Inc. HZO 18.75 85.0% 489 167 39 617 942 48 25.4% 17.2% 24.0% 5.1% 20.6x 0.65x 12.8x 1.04x 39.3x
Lumber Liquidators Holdings, Inc. LL 15.53 77.3% 423 20 9 434 950 (76) (6.4%) (0.1%) 29.4% NM NM 0.46x NM 0.43x 3.2x
Lowe's Companies, Inc. LOW 71.12 85.0% 61,846 15,195 1,083 75,958 62,469 6,526 7.0% 5.8% 32.3% 10.4% 26.2x 1.22x 11.6x 1.43x 13.4x
Movado Group, Inc. MOV 26.00 81.4% 596 38 201 433 565 70 (3.5%) 0.2% 53.9% 12.4% 16.3x 0.77x 6.2x 0.77x 5.0x
Office Depot, Inc. ODP 4.54 57.3% 2,394 1,191 801 2,784 11,773 632 (20.7%) 4.3% 24.2% 5.4% 8.4x 0.24x 4.4x 0.25x 7.1x
Staples, Inc. SPLS 9.28 81.6% 6,034 1,047 1,076 6,005 20,476 1,341 (4.5%) (4.9%) 25.6% 6.5% NA 0.29x 4.5x 0.26x 3.5x
Tiffany & Co. TIF 79.53 93.1% 9,899 1,105 787 10,217 3,986 967 (4.6%) 0.1% 62.0% 24.3% 22.4x 2.56x 10.6x 2.55x 10.6x
Tractor Supply Company TSCO 76.15 78.3% 10,000 321 56 10,266 6,510 809 5.6% 8.9% 32.3% 12.4% 24.6x 1.58x 12.7x 1.99x 16.7x
Vitamin Shoppe, Inc. VSI 22.70 70.3% 541 125 2 664 1,278 126 1.2% 6.8% 29.6% 9.8% 13.1x 0.52x 5.3x 0.61x 4.7x
Mean 80.7% $18,607 $2,930 $740 $20,797 $17,040 $1,922 0.2% 2.8% 32.9% 9.9% 18.6x 0.84x 8.3x 0.95x 10.1x
Median 81.6% $2,394 $266 $85 $2,784 $4,063 $632 1.6% 4.3% 30.2% 9.6% 19.5x 0.65x 8.2x 0.77x 6.3x
Last Twelve Months (LTM) Revenue Growth LTM Margins EV / LTM EV / 2017E

PAGE |
M&A TRANSACTIONS
RECENT NORTH AMERICAN CONSUMER M&A
CONSUMER AND RETAIL
INDUSTRY UPDATE │ JANUARY 2017
12
Private Equity
Announced Target Seller Buyer Involvement
9/28/2016 Lafayette Puzzle Factory LLC - Cra-Z-Art LLC
9/23/2016 Fanlogic LLC - HeadsUp Entertainment
9/21/2016 Corby LLC - US Lighting Group, Inc.
9/21/2016 Frio Ice Chest Co. - Visual Promotions LLC
9/13/2016 David Michael & Co., Inc. - International Flavors & Fragrances
9/13/2016 SalonQuest LLC - Conair Corp.
9/12/2016 CID Entertainment LLC - Clearlake Capital Group LP P
9/9/2016 SRP Companies Seidler Equity Partners Aurora Capital Partners
9/6/2016 SharpShooter Imaging LLC - Magic Memories Group Holdings Ltd.
9/1/2016 L.O.P. Enterprises, Inc. - Vista Outdoor, Inc.
9/1/2016 Amety Ltd. - Park Lawn Corp.
9/1/2016 Jones Media, Inc. - Adams Publishing Group LLC
9/1/2016 New Homes Guide - NewPoint Media Group LLC
9/1/2016 Diversified Industrial Services - Orion Industries
8/31/2016 Focus Products Group International LLC /Kitchen Division/ - Lifetime Brands, Inc.
8/31/2016 Promax Nutrition Corp. /Sport Perfomance Brand/ - NuGo Nutrition
8/31/2016 Boomerang Carwash LLC - Zips Car Wash LLC
8/30/2016 Plus II Sanitation Supplies, Inc. - Bunzl Plc
8/30/2016 Apex Sanitation Products Ltd. - Bunzl Plc P
8/30/2016 800Razors.com LLC - Shave Mob LLC
8/30/2016 The River Club - Landeavor LLC
8/30/2016 Coast Apparel LLC - Delta Apparel, Inc.
8/30/2016 Heritage Golf Club - ClubCorp Holdings, Inc.
8/30/2016 True Contact - Appsbuyout P
8/29/2016 Playworld Systems, Inc. - Littlejohn & Co. LLC; PlayPower, Inc.
8/29/2016 Toulon Design - Callaway Golf Co.
8/19/2016 Affinity Sports - Dick's Sporting Goods, Inc.
8/17/2016 Ecodesarrollo Papagayo SA - Gencom Group
8/16/2016 RunHaven Moko Social Media Ltd. Calera Capital Advisors P
8/16/2016 RCL Benziger Publishing LLC New Mountain Learning LLC Kendall/Hunt Publishing Co.
8/16/2016 Alienation, Inc. - J&B Importers, Inc.
8/16/2016 LeftField Media LLC - Urban Exposition LLC
8/2/2016 Swimways Corp. - Spin Master Corp.
8/15/2016 InterHealth Nutraceuticals, Inc. - Lonza Group AG
8/15/2016 Wisconsin Cemeteries - StoneMor Partners LP
8/15/2016 Pounds Media LLC - Snapshot Interactive LLC
8/12/2016 Edwards & Zuck DPC - Stantec, Inc.
8/12/2016 The Car Wash Barn - Car Wash Partners, Inc.
8/11/2016 Canada à la Carte Viad Corp. VBR Tours LLC
8/10/2016 Preptix LLC - Huddle, Inc.
8/10/2016 Dacor, Inc. - Samsung Electronics America, Inc.
8/10/2016 Sina Pearson Textiles, Inc. - Riverside Partners LLC (New York); Momentum Textiles, Inc.; Momentum GroupP
8/10/2016 ECM Publishers, Inc. - Adams Publishing Group LLC
8/10/2016 Mocean Holding Co. Llc - SNC Technical Services LLC
8/9/2016 Stefano A, Inc. - JN Phillips Auto Glass, Inc.
8/9/2016 Hope River Entertainment - Moonstruck Management LLC
8/9/2016 Herington Times-Sun Printing & Publishing - Kansas Publishing Ventures LLC
8/8/2016 Becker & Mayer LLC The McEvoy Group LLC Quarto Publishing Group USA, Inc.
8/8/2016 Whistler Blackcomb Holdings, Inc. - Vail Resorts, Inc.
8/8/2016 Delta Ultraviolet Corp. - AEA Investors LP; Neptune-Benson, Inc.; Evoqua Water Technologies LLCP
8/8/2016 Flick Brothers Auto Body - 3-D Body Works, Inc.
8/8/2016 Rooftop2 Productions, Inc. - Lagardère Sports SAS
8/5/2016 Pokervision Media, Inc. - Network Life Sciences, Inc.
8/4/2016 S&D Coffee, Inc. - Cott Corp. (Canada)
8/3/2016 Stein World Operating Co. - ELK Group International, Inc.
8/3/2016 Create-A-Treat Ltd. - Thomas H. Lee Partners LP; Give & Go Prepared Foods Corp. P
8/2/2016 Oak State Products, Inc. - Vestar Capital Partners, Inc.; Goldman Sachs Private Equity Group; Hearthside Food Solutions LLCP
8/2/2016 HC Operating Co. LLC - Avista Capital Holdings LP; WideOpenWest Finance LLC; Constitution Capital Partners LLC
8/2/2016 The GameTV Corp. Kilmer Group Anthem Sports & Entertainment Corp.
8/1/2016 Carstar Collision Care of Kings, Inc. /Cincinnati 10 Shops/ Carstar Collision Care of Kings, Inc. The Boyd Group, Inc.
7/29/2016 Dr. Smoothie Brands, Inc. Dr. Smoothie Enterprises Highlander Partners LP; Bevolution Group P
7/27/2016 Peds Legwear, Inc. - Gildan Activewear, Inc.
7/26/2016 Vizio Holdings, Inc. - Leshi Internet Information & Technology
7/26/2016 Legion Industries, Inc. - The Legacy Cos.
7/25/2016 Donna Karan International, Inc. LVMH Moët Hennessy Louis Vuitton SE G-III Apparel Group Ltd.
7/22/2016 Model in a Bottle - American International Industries P
7/19/2016 Golden Enterprises, Inc. - UTZ Quality Foods, Inc.
7/13/2016 Tessive LLC - RealD, Inc.; Rizvi Traverse Management LLC P
7/7/2016 Erno Laszlo, Inc. - CITIC Capital Partners Ltd. P
7/6/2016 First Act, Inc. - Alleghany Capital Partners LLC P
7/6/2016 Idaho Pacific Holdings, Inc. - Arlon Group LLC
7/5/2016 Source Media LLC /Traders Magazine/ Source Media LLC Markets Media LLC
7/5/2016 Hostess Brands LLC - The Gores Group LLC; Gores Holdings, Inc. P
7/5/2016 Thunder Jet - Brunswick Corp.
7/5/2016 Sea Crest Resort & Conference Center Scout Real Estate Capital LLC Delaware North Cos., Inc.
7/5/2016 D.K. Shifflet & Associates Ltd. - Peninsula Capital Partners LLC; MMGY Global Inc.

PAGE |
M&A TRANSACTIONS
13
RECENT NORTH AMERICAN CONSUMER M&A (CONTINUED)
CONSUMER AND RETAIL
INDUSTRY UPDATE │ JANUARY 2017
Private Equity
Announced Target Seller Buyer Involvement
7/1/2016 Oliva Cigar Co. - V.D.M. Invest CVA; J. Cortès Cigars NV
7/1/2016 Harris Publications, Inc. - Athlon Media Group
7/1/2016 Supplies On The Fly Instawares Holding Co. LLC Sysco Corp.
7/1/2016 Heartland Habitat for Humanity, Inc. - Habitat For Humanity Kansas City, Inc.
6/30/2016 VF Corp. /Contemporary Premium Brand Business/ VF Corp. Delta Galil Industries Ltd.
6/30/2016 The Hershey Co. - Mondelez International, Inc.
6/28/2016 Peekaboo Child Care Centre, Inc. /Child Care Centres (20)/Peekaboo Child Care Centre, Inc. BrightPath Early Learning, Inc.
6/28/2016 Mile High Hoodies LLC - Vaprwear Gear LLC
6/28/2016 ABT Power Management, Inc. - Total Fleet Solutions Ltd.
6/27/2016 Clean Ones Corp. - Butler Home Products LLC
6/26/2016 Bromeland Publishing, Inc. /Scuttlebutt Magazine/ Bromeland Publishing, Inc. Forum Communications Co.
6/24/2016 The Sun Products Corp. - Henkel AG & Co. KGaA
6/24/2016 Skullcandy, Inc. - Incipio Technologies, Inc.
6/23/2016 HDMI Digital Media, Inc. - 8020 Connect, Inc.
6/22/2016 Hillcrest Golf & Country Club LP - PulteGroup, Inc.
6/22/2016 Binder Casting - RWS & Associates Entertainment, Inc.
6/22/2016 Collision Care Auto Body Centers, Inc. - Caliber Bodyworks, Inc.
6/21/2016 Fodors LLC Bertelsmann SE & Co. KGaA Kohlberg Kravis Roberts & Co. LP; Internet Brands, Inc. P
6/20/2016 Plantation Patterns LLC - Kohlberg & Co. LLC; NBGroup LLC
6/17/2016 Vista Clara Ranch Spa Resort - The Chi Center, Inc.
6/17/2016 Autism Behavioral Consulting, Inc. - CARD Capital
6/16/2016 Elizabeth Arden, Inc. - Revlon, Inc.
6/15/2016 24 Hour Fitness USA, Inc. 24 Hour Fitness Worldwide, Inc. Gold's Gym International, Inc.
6/15/2016 EBONY Magazine Johnson Publishing Co., Inc. Clear View Group LLC
6/13/2016 Georgia International Travel, Inc. - ABRY Partners LLC; Direct Travel, Inc. P
6/13/2016 Superior Cake Products, Inc. - Hostess, Apollo Global Management
6/13/2016 Charlebois Truck Parts, Inc. - FleetPride, Inc.; TPG Capital Management LP
6/10/2016 Generation Brands Holdings Quad-C Management, Inc. AEA Investors LP P
6/6/2016 Aardvark Safaris, Inc. - Inflexion Private Equity Partners LLP; Scott Dunn
6/3/2016 EdgeCraft Corp. Domajaparo, Inc. The Legacy Cos.
6/2/2016 Vogue International LLC - Johnson & Johnson
6/2/2016 Gurwitch Products LLC (New York) - Shiseido Americas Corp.
6/1/2016 The Redbury Hotel Alticor Global Holdings, Inc. 1717 Vine LLC
5/27/2016 Fly by Wings SA de CV /6 Wings Restaurants/ - Operadora y Administradora de Restaurantes Gigante SA de CV
5/25/2016 Tripoli Country Club, Inc. Pebblebrook Hotel Trust University Club of Milwaukee
5/24/2016 Keenmount Ltd. - Global Harvest, Inc. (BVI)
5/24/2016 Chinook Asia LLC /Mozo Shoes Brand/ CMR SAB de CV Advent International Corp.; AEA Investors LP; Shoes for Crews LLC; CCMP Capital Advisors LP; SFC Holdings LLC
5/23/2016 Conagra Foods, Inc. /Spicetec Flavors & Seasonings Business/3G Capital Partners LP (New York) Givaudan SA
5/20/2016 Hudson Lock LLC - Jacob Holtz Co. P
5/19/2016 John C. Nordt, Inc. - Richline Group, Inc.
5/19/2016 MMO Music Group, Inc. - Hal Leonard Corp.
5/18/2016 Global Fantasy Sports, Inc. Chinook Asia LLC Satya Worldwide, Inc.
5/18/2016 Empacadora Ponderosa SA de CV ConAgra Foods, Inc. Grupo Bafar SAB de CV
5/18/2016 Traveline Travel Agency, Inc. - ABRY Partners LLC; Direct Travel, Inc.
5/16/2016 High Ridge Brands Co. - Clayton, Dubilier & Rice, Ltd. P
5/12/2016 P& Christina Aguilera Line - Elizabeth Arden, Inc..
5/10/2016 Gaiam Inc. - Sequential Brands Group (NasdaqCM:SQBG)
5/9/2016 Baby Tula LLC - The ERGO Baby Carrier, Inc.
5/9/2016 Jade Swimwear L.P - The Riverside Company P
5/9/2016 The Mountain Corporation - Gladstone Investment Corporation
5/5/2016 Go Green Hydroponics Inc. OSL Holdings Inc. (OTCPK:OSLH) Growlife, Inc. (OTCPK:PHOT)
5/4/2016 A and G, Inc. Ennis Inc. (NYSE:EBF) Gildan Activewear Inc. (TSX:GIL)
5/2/2016 ReNew Life Formulas, Inc. Swander Pace Capital The Clorox Company (NYSE:CLX) P
4/29/2016 Norvell Skin Solutions, LLC - MT Industries, Inc.
4/29/2016 Eagle One Industries, Inc. Niteo Products, LLC American Covers Inc.
4/27/2016 Baby Trend Inc. - Alpha Group (SZSE:002292)
4/27/2016 Gemvara, Inc. Canaan Partners; Highland Capital Partners; Norwest Venture Partners; Balderton CapitalRichline Group, Inc.
4/26/2016 NeoStrata Company, Inc. McGovern Capital LLC Johnson & Johnson Consumer Inc. P
4/25/2016 Twin-Star International, Inc. Trivest Partners, L.P. Z Capital Management LLC P
4/19/2016 Southern Tide, LLC Brazos Private Equity Partners, LLC; Golub Capital CP Funding, LLC; Golub Capital Pearls Direct Lending Program, L.P; CenterOak Partners LLC; S/T Group Blocker, Inc.; GCP Southern Tide Coinvest, Inc.; S/T Group AIV2, LP; S/T Group AIV1, LP; GCP Equity Ltd.Oxford of South Carolina, Inc. P
4/19/2016 WKI Holding Company, Inc. - GP Investments Acquisition Corp. (NasdaqCM:GPIA)
4/19/2016 World Kitchen - GPIAC P
4/18/2016 ILLUME - Regent Holding Company
4/12/2016 JAYBIRD, LLC - Logitech International SA (SWX:LOGN)
4/12/2016 Scorpion Bike Stands LLC - Feedback Sports LLC
4/6/2016 Always For Me LLC - Waveland Investments LLC P
4/5/2016 TK Enterprises - The Jordan Company, L.P. P
4/1/2016 Alstyle Apparel, LLC Ennis Inc. (NYSE:EBF) Alstyle Apparel, LLC
4/1/2016 Momentum Textiles, LLC Norwest Equity Partners The Riverside Company P
4/1/2016 Strength of Nature Global, LLC - Godrej Consumer Products
4/1/2016 Wilton Armetale, Inc. - Lifetime Brands, Inc. (NasdaqGS:LCUT)
3/31/2016 POW Inc. Alliance of Angels, Investment Arm; Dan Rosen and Associates; Columbia Pacific Advisors, LLC; POW Holdings, LLCRojo Australia Pty Ltd.
3/29/2016 J.America, Inc. - Blue Point Capital Partners P
3/28/2016 South Moon Sales, Inc. - NewSpring Capital; JPB Capital Partners P
3/24/2016 Ramcat Broadheads - Arcus Hunting, LLC
3/22/2016 Controlled Products, LLC - Clearview Capital, LLC P

PAGE |
HW&CO. CONSUMER TEAM
M&A TRANSACTIONS
CONSUMER AND RETAIL
INDUSTRY UPDATE │ JANUARY 2017
RECENT NORTH AMERICAN CONSUMER M&A (CONTINUED)
14
Tim AlexanderManaging [email protected]+1 (612) 359-2716
Brant [email protected]+1 (612) 359-2709
Ed ArkusManaging [email protected]+44 20 7518 8905
Ryan BudlongManaging [email protected]+1 (415) 217-3409
John Neuner IVManaging [email protected]+1 (804) 915-0125
Glenn GurtcheffManaging [email protected]+1 (612) 359-2702
Corey [email protected]+1 (804) 932-1342
Will [email protected]+44 20 7518 8906
Brent SpillerManaging [email protected]+1 (804) 915-0183
Matt [email protected]+1 (415) 217-3423
Andy WarczakVice [email protected]+1 (612) 359-2714
Ryan [email protected]+1 (612) 359-2703
Private Equity
Announced Target Seller Buyer Involvement
3/21/2016 Karmaloop, Inc. CapX Partners; Comvest Partners Shiekh Shoes, LLC P
3/17/2016 Newell Rubbermaid Inc., Window Coverings Business Newell Rubbermaid Inc. (NYSE:NWL) Hunter Douglas N.V. (ENXTAM:HDG)
3/12/2016 Thom Browne, Inc. Stripe International Inc. Sandbridge Capital, LLC P
3/10/2016 Denver Design Company, LLC - 5 Horizons Group, LLC
3/10/2016 Natural Dynamics, LLC - Wellnext, LLC
3/9/2016 The Gents Place Men's Fine Grooming of Leawood, LLC - Massage Heights Corporate, LLC
3/8/2016 Thirsty Promo and Bag Warehouse Mark-It Smart Inc. The Image Group, Inc.
3/3/2016 The Procter & Gamble Company., Portfolio of Hair Care BrandsThe Procter & Gamble Company (NYSE:PG) Henkel AG & Co. KGaA (DB:HEN3)
3/3/2016 Tumi Holdings, Inc. (NYSE:TUMI) Doughty Hanson & Co.; Stockwell Capital LLC Samsonite International S.A. (SEHK:1910)
3/2/2016 The Guildery Inc. SoftTech VC; Forerunner Ventures; Cowboy Ventures; BBG VenturesMINTED LLC P
3/1/2016 Kuissential - SCS Direct Inc.
2/26/2016 DECIEM, Grow Gorgeous DECIEM Inc. The Hut.com Ltd
2/24/2016 Bell Sports Corp. BRG Sports, Inc. Vista Outdoor Inc. (NYSE:VSTO)
2/22/2016 Hayneedle Inc. Insight Venture Partners; Sequoia Capital Jet.com, Inc. P
2/22/2016 Zenith Products Corporation Charlesbank Capital Partners, LLC The Laces Company P
2/19/2016 Flint And Tinder USA, LLC Lerer Hippeau Ventures Huckberry LLC P
2/18/2016 Lise Watier Cosmétiques, Inc. Imperial Capital Group Ltd. Groupe Marcelle Inc. P
2/16/2016 Ebuys, Inc. - DSW Shoe Warehouse, Inc.
2/16/2016 The Pet Outpost, L.L.C - Bentley's Pet Stuff LLC
2/15/2016 True Textiles, Inc. Thomas H. Lee Partners, L.P.; LBC Credit Partners, Inc.; Sun Capital Partners, Inc.Duvaltex Inc. P
2/12/2016 THE WHEAT GROUP, INC. - United Legwear Company, LLC
2/11/2016 Furniture Factory Outlet, LLC Alpine Investors, LP Sun Capital Partners, Inc. P
2/11/2016 Sprig Toys, Inc. - BeginAgain, Inc.
2/11/2016 Etch A Sketch and Doodle Sketch The Ohio Art Company, Inc. (OTCPK:OART) Spin Master Corp. (TSX:TOY)
2/11/2016 WorldStrides, Inc. The Carlyle Group LP (NasdaqGS:CG) Metalmark Capital LLC P
2/10/2016 Stop Aging Now, LLC - Wellnext, LLC
2/10/2016 iDevices, LLC, iGrill® iDevices, LLC Weber-Stephen Products LLC
2/7/2016 Apollo Education (NasdaqGS:APOL) Glenview Capital Management, LLC; Fidelity Management & Research Company; Robeco Boston Partners; T. Rowe Price Associates, Inc.; Aronson+Johnson+Ortiz, LPNajafi Companies P
2/5/2016 LeapFrog Enterprises Inc. (NYSE:LF) Blue Pacific Partners, LLC; Franklin Templeton Investments Corp.Vtech Holdings Ltd. (SEHK:303) P
2/5/2016 efsAUDIO Inc. - Compass Biotechnologies Inc. (OTCPK:COBI)
2/4/2016 Large Car Wash Operation - First Colombia Gold Corp. (OTCPK:FCGD)
2/4/2016 LMC Right Start, Inc. Liberty Interactive Corporation (NasdaqGS:QVCA)giggle, Inc.
2/2/2016 Rona Inc. (TSX:RON) Capital d'Amérique CDPQ Inc.; Invesco Canada Ltd.; First Asset Investment Management Inc.; Fonds régional de solidarité FTQ Montérégie; Caisse de dépôt et placement du Québec; Fonds de solidarité FTQLowe's Companies Canada, ULC P
2/2/2016 mophie, inc. mStation Corporation; Beringea LLC; Grosvenor Capital Management Customized Fund Investment GroupZAGG Inc (NasdaqGS:ZAGG) P
2/2/2016 Blumenthal Lansing Company, LLC - CSS Industries Inc. (NYSE:CSS)
2/1/2016 Vitamin World, Inc. NBTY, Inc. Centre Lane Partners, LLC P
1/29/2016 Creative Embroidery - -
1/28/2016 TicketBreak Ltd. MapleCore Ltd. Ticketfly, Inc.
1/28/2016 All Star Vending & Coffee Service LLC - Canteen Vending Services, Inc.
1/28/2016 Ellsworth Handcrafted Bicycles, Inc. Iso Nano International LLC -
1/28/2016 GetGoing, Inc. Y Combinator; Data Collective; TA Ventures; InVenture PartnersBCD Travel B.V. P
1/28/2016 Really Good Stuff, Inc. - Excelligence Learning Corporation
1/27/2016 Triboro Quilt Manufacturing Corporation - Gerber Childrenswear LLC
1/25/2016 Valeant Groupe Cosméderme Inc. Valeant Canada Ltd. INTEGA Skin Sciences Inc.
1/25/2016 Mccarthy's Hockey & Lacrose Supply Co, Inc. - LaxWorld Inc.
1/22/2016 Swanson Health Products, Inc. - Swander Pace Capital P
1/22/2016 Fiskars Brands, Inc., American Designer Pottery Fiskars Brands, Inc. Bloem Living LLC
1/21/2016 Triumph Sports USA, Inc. - Escalade Sports, Inc.
1/21/2016 SparkBox Toys LLC. - Pley Inc.
1/21/2016 Rose America Corporation - Guardian Capital Partners P
1/21/2016 A Fresh Start II, LLC - CORE TEAM, Inc.
1/20/2016 Cybex International Inc. UM Holdings Ltd. Brunswick Corporation (NYSE:BC) P
1/20/2016 BBC Ice Cream, LLC Iconix Brand Group, Inc. (NasdaqGS:ICON) -

Energy, Power& Infrastructure
IndustrialsHealthcare & Life Sciences
Transportation & Logistics
Aerospace, Defense & Government
Services
Business Services
Building Products & Materials
Technology, Media & Telecom
Specialty Distribution
Consumer
PAGE |
HARRIS WILLIAMS & CO. OFFICE LOCATIONS
UNITED STATES EUROPE
BostonOne International Place24th FloorBoston, Massachusetts 02110Phone: +1 (617) 482-7501
Cleveland1900 East 9th Street20th FloorCleveland, Ohio 44114Phone: +1 (216) 689-2400
Minneapolis222 South 9th StreetSuite 3350Minneapolis, Minnesota 55402Phone: +1 (612) 359-2700
Richmond (Headquarters)1001 Haxall Point9th FloorRichmond, Virginia 23219Phone: +1 (804) 648-0072
San Francisco575 Market Street31st FloorSan Francisco, California 94105Phone: +1 (415) 288-4260
Washington, D.C. 800 17th St. NW2nd FloorWashington, D.C. 20006Phone: +1 202-207-2300
FrankfurtBockenheimer Landstrasse 33-3560325 FrankfurtGermanyPhone: +49 069 3650638 00
London63 Brook StreetLondon W1K 4HS, EnglandPhone: +44 (0) 20 7518 8900
NETWORK OFFICES
Beijing
Hong Kong
Mumbai
New Delhi
Shanghai
Consumer
OUR FIRM
15
INDUSTRY UPDATE │ JANUARY 2017
CONSUMER AND RETAIL
Harris Williams & Co. has a broad range of industry expertise, which creates powerful opportunities.Our clients benefit from our deep-sector experience, integrated industry intelligence andcollaboration across the firm, and our commitment to learning what makes them unique. For moreinformation, visit our website at www.harriswilliams.com/industries.

PAGE |
HARRIS WILLIAMS & CO.
16
SOURCES
S&P Capital IQ.
Thomson Financial.
Reuters.
S&P Capital IQ LCD.
Harris Williams & Co. (www.harriswilliams.com) is a preeminent middle market investment bank focused on the advisory needs of clients worldwide. The firm has deep industry knowledge, global transaction expertise, and an unwavering commitment to excellence. Harris Williams & Co. provides sell-side and acquisition advisory, restructuring advisory, board advisory, private placements, and capital markets advisory services.
Investment banking services are provided by Harris Williams LLC, a registered broker-dealer and member of FINRA and SIPC, andHarris Williams & Co. Ltd, which is private limited company incorporated under English law with its registered office at 5th Floor, 6 St.Andrew Street, London EC4A 3AE, UK, registered with the Registrar of Companies for England and Wales (registration number7078852). Harris Williams & Co. Ltd is authorized and regulated by the Financial Conduct Authority. Harris Williams & Co. is a tradename under which Harris Williams LLC and Harris Williams & Co. Ltd conduct business.
THIS REPORT MAY CONTAIN REFERENCES TO REGISTERED TRADEMARKS, SERVICE MARKS AND COPYRIGHTS OWNED BY THIRD-PARTY INFORMATION PROVIDERS. NONE OF THE THIRD-PARTY INFORMATION PROVIDERS IS ENDORSING THE OFFERING OF, AND SHALL NOT IN ANY WAY BE DEEMED AN ISSUER OR UNDERWRITER OF, THE SECURITIES, FINANCIAL INSTRUMENTS OR OTHER INVESTMENTS DISCUSSED IN THIS REPORT, AND SHALL NOT HAVE ANY LIABILITY OR RESPONSIBILITY FOR ANY STATEMENTS MADE IN THE REPORT OR FOR ANY FINANCIAL STATEMENTS, FINANCIAL PROJECTIONS OR OTHER FINANCIAL INFORMATION CONTAINED OR ATTACHED AS AN EXHIBIT TO THE REPORT. FOR MORE INFORMATION ABOUT THE MATERIALS PROVIDED BY SUCH THIRD PARTIES, PLEASE CONTACT US.
The information and views contained in this report were prepared by Harris Williams & Co. (“Harris Williams”). It is not a research report, as such term is defined by applicable law and regulations, and is provided for informational purposes only. It is not to be construed as an offer to buy or sell or a solicitation of an offer to buy or sell any financial instruments or to participate in any particular trading strategy. The information contained herein is believed by Harris Williams to be reliable, but Harris Williams makes no representation as to the accuracy or completeness of such information. Harris Williams and/or its affiliates may be market makers or specialists in, act as advisers or lenders to, have positions in and effect transactions in securities of companies mentioned herein and also may provide, may have provided, or may seek to provide investment banking services for those companies. In addition, HarrisWilliams and/or its affiliates or their respective officers, directors and employees may hold long or short positions in the securities, options thereon or other related financial products of companies discussed herein. Opinions, estimates and projections in this report constitute Harris Williams’ judgment and are subject to change without notice. The financial instruments discussed in this report may not be suitable for all investors, and investors must make their own investment decisions using their own independent advisors as they believe necessary and based upon their specific financial situations and investment objectives. Also, past performance is not necessarily indicative of future results. No part of this material may be copied or duplicated in any form or by any means, or redistributed, without Harris Williams’ prior written consent.
Copyright© 2017 Harris Williams & Co., all rights reserved.
CONSUMER AND RETAIL
INDUSTRY UPDATE │ JANUARY 2017
DISCLOSURES