consumption-based emission accounting for chinese cities · 5 school of management and economics,...
TRANSCRIPT

1
Consumption-based emission accounting for Chinese cities
Zhifu Mi1, Yunkun Zhang1, Dabo Guan1,*, Yuli Shan1, Zhu Liu2, Ronggang Cong3, Xiao-Chen
Yuan4,5, Yi-Ming Wei4,5
1 Tyndall Centre for Climate Change Research, School of International Development, University of
East Anglia, Norwich NR4 7TJ, UK
2 Applied Physics and Materials Science, California Institute of Technology Resnick Sustainability
Institute, Pasadena CA 91125, USA
3 Department of Environmental Science, Aarhus University, Roskilde 4000, Denmark
4 Center for Energy and Environmental Policy Research, Beijing Institute of Technology, Beijing
100081, China
5 School of Management and Economics, Beijing Institute of Technology, Beijing 100081, China
Abstract: Most of China’s CO2 emissions are related to energy consumption in its cities. Thus,
cities are critical for implementing China’s carbon emissions mitigation policies. In this study, we
employ an input-output model to calculate consumption-based CO2 emissions for thirteen Chinese
cities and find substantial differences between production- and consumption-based accounting in
terms of both overall and per capita carbon emissions. Urban consumption not only leads to carbon
emissions within a city’s own boundaries but also induces emissions in other regions via
interregional trade. In megacities such as Shanghai, Beijing and Tianjin, approximately 70% of
consumption-based emissions are imported from other regions. Annual per capita consumption-
based emissions in the three megacities are 14, 12 and 10 tonnes of CO2 per person, respectively.
Some medium-sized cities, such as Shenyang, Dalian and Ningbo, exhibit per capita emissions that
resemble those in Tianjin. From the perspective of final use, capital formation is the largest
contributor to consumption-based emissions at 32–65%. All thirteen cities are categorized by their
trading patterns: five are production-based cities in which production-based emissions exceed
consumption-based emissions, whereas eight are consumption-based cities, with the opposite
emissions pattern. Moreover, production-based cities tend to become consumption-based as they
undergo socioeconomic development.
Keywords: Consumption-based accounting; Production-based emissions; Embodied emissions;
Input-output analysis; Carbon footprint; City
1. Introduction
China has been the world’s largest producer of CO2 emissions since 2007. In 2013, its CO2 emissions
from fuel combustion totalled 8.5 billion tonnes, which accounted for a quarter of global CO2
* Corresponding author at: School of International Development, University of East Anglia, Norwich NR4 7TJ, UK E-mail address: [email protected] (D. Guan).

2
emissions [1, 2]. China has prioritized climate change mitigation in the past decade, announcing in
the 2014 “U.S.–China Joint Announcement on Climate Change” that its CO2 emissions will peak
by 2030. In addition, in its 2015 Intended Nationally Determined Contributions, China promised to
decrease its CO2 emissions per unit of GDP by 60-65% (based on 2005 levels) by 2030 [3].
Accompanying its rapid economic growth, China’s urban population has increased dramatically
during recent decades. The urban population grew to 750 million in 2014, increasing from
approximately 300 million in 1990. Today, more than half of China’s population lives in cities [4].
This rapid urbanization and industrialization have led to increased demands for energy and materials,
which result in substantial emissions of greenhouse gases (GHG), including CO2 [5, 6].
Approximately 85% of China’s CO2 emissions are related to urban energy consumption, a rate that
is much higher than that experienced in Europe (69%) or in the U.S. (80%) [7, 8]. Therefore, cities
are critical for implementing China’s carbon emissions mitigation policies. There is an urgent need
to understand China’s urban CO2 emissions, as such understanding is fundamental to proposing
mitigation actions.
There are two approaches to measuring GHG emissions: production-based and consumption-based
accounting [9-11]. Production-based CO2 emissions are emissions caused by domestic production,
including exports [12]. This approach accounts for CO2 emissions at the point of production, without
consideration of where goods are used or who ultimately uses them [13, 14]. This approach is widely
used in global climate change agreements, including the United Nations Framework Convention on
Climate Change (UNFCCC) and the Kyoto Protocol. Conversely, under consumption-based
accounting, all emissions occurring along the chains of production and distribution are allocated to
the final consumers of products [15]. Pursuant to this approach, areas that import products are
allocated the emissions related to their production. Therefore, consumption-based emissions include
imports and emissions embodied in trade but exclude exports, whereas production-based emissions
include exports and exclude imports [12]. Recent studies have compared the two approaches and
demonstrated the advantages of consumption-based accounting [16-19]. For example, Steininger et
al. [13] argued that a consumption-based climate policy approach can improve both cost-
effectiveness and justice, while Guan et al. [20] indicated that consumption-based accounting helps
mitigate global air pollution. Moreover, Larsen and Hertwich [21] argued that consumption-based
accounting provides a more useful and less misleading indicator for assessing the performance of
local climate actions. Finally, Peters and Hertwich [22] have noted that consumption-based
accounting has many advantages over production-based accounting, such as addressing carbon
leakage, promoting environmental comparative advantages, increasing options for mitigation, and
encouraging technology diffusion.
There are numerous studies on consumption-based carbon emissions at the global and national
levels [23]. Peters and Hertwich [22] calculated CO2 emissions embodied in international trade
among 87 countries. They found that 53 billion tonnes of CO2 emissions in 2001 were embodied in
international trade and that developed countries were net importers of emissions. Hertwich and
Peters [24] quantified consumption-based greenhouse gas emissions for 73 nations and 14
aggregated world regions. At the global level in 2001, 72% of greenhouse gas emissions were
related to household consumption, 18% to investment and 10% to government consumption. Davis
and Caldeira [25] used a fully coupled multi-region input-output (MRIO) model to construct a
consumption-based CO2 emissions inventory of 113 countries and regions. The results showed that

3
62 billion tonnes of CO2 were traded internationally, which accounted for 23% of global emissions.
These CO2 emissions were mainly exported from China and other emerging markets to developed
countries. Peters et al. [26] developed a global database for consumption-based CO2 emissions for
113 countries. In most developed countries, consumption-based emissions increased faster than
territorial production-based emissions. Under consumption-based accounting, net CO2 emissions
transferred from developing countries to developed countries grew from 4 billion tonnes in 1990 to
16 billion tonnes in 2008.
At the national level, Wood and Dey [27] applied a consumption-based approach to calculating
Australia’s carbon footprint and found that emissions embodied in exports were much higher than
those embodied in imports and that Australia’s total carbon footprint was 522 million tonnes (Mt)
in 2005. Nansai et al. [28] applied a global link input-output model to analyse Japan’s carbon
footprint. Wiedmann et al. [29] and Barrett et al. [30] both calculated the UK’s consumption-based
greenhouse gas emissions and found that consumption-based carbon emissions were rapidly
increasing and that there was a widening gap between production- and consumption-based
emissions. Feng et al. [31] tracked carbon emissions embodied in products in the Chinese provinces;
these authors found that 57% of total emissions were related to goods and services that were used
outside of the province in which they were produced. For example, 80% of the emissions embodied
in goods used in the highly developed coastal provinces were imported from less developed areas.
Studies of emission inventories for cities are limited, and most are focused on production-based
accounting. Dhakal [8] compiled energy usage and emissions inventories for 35 provincial capital
cities in China. The results showed that these 35 cities accounted for 40% of China’s energy
consumption and CO2 emissions and that the carbon intensity for these cities decreased throughout
the 1990s. Hoornweg et al. [32] analysed per capita GHG emissions for several large cities and
reviewed emissions for 100 cities. They showed that annual per capita emissions for cities varied
from more than 15 tonnes of CO2 equivalent to less than half a tonne. Sugar et al. [33] provided
detailed GHG emission inventories for Beijing, Shanghai and Tianjin and found that Chinese cities
are among the world’s highest per capita emitters when compared with ten other global cities. Liu
et al. [34] analysed features, trajectories and driving forces of GHG emissions in four Chinese
megacities (Beijing, Tianjin, Shanghai and Chongqing) from 1995 to 2009. The emission
inventories compiled in this paper include both direct emissions and emissions from imported
electricity. Creutzig [35] used data from 274 cities to explore the potential for urban mitigation of
global climate change. The results showed that urban energy use will grow threefold between 2005
and 2050, if current trends in urban expansion continue.
Few studies have researched consumption-based emissions for cities [36, 37]. Hasegawa et al. [38]
constructed a multi-region input-output table among 47 prefectures in Japan and estimated their
consumption-based carbon emissions. They found that production-based emissions differed great
from consumption-based emissions. Moreover, the ratio of carbon leakage to carbon footprint was
more than 50% on average at the regional level. Almost all previous studies of consumption-based
emissions in Chinese cities focus on the same four megacities, i.e., Beijing, Shanghai, Tianjin and
Chongqing. Dhakal [39] used a consumption-based approach to analyse the carbon footprints of
four Asian megacities, including Beijing and Shanghai. Feng et al. [40] also analysed consumption-
based carbon emissions in the four Chinese megacities and found that urban consumption imposed
high emissions on surrounding regions via interregional trade. In this study, we use an input-output
4
model to construct consumption-based CO2 emissions for thirteen Chinese cities.
2. Method and data
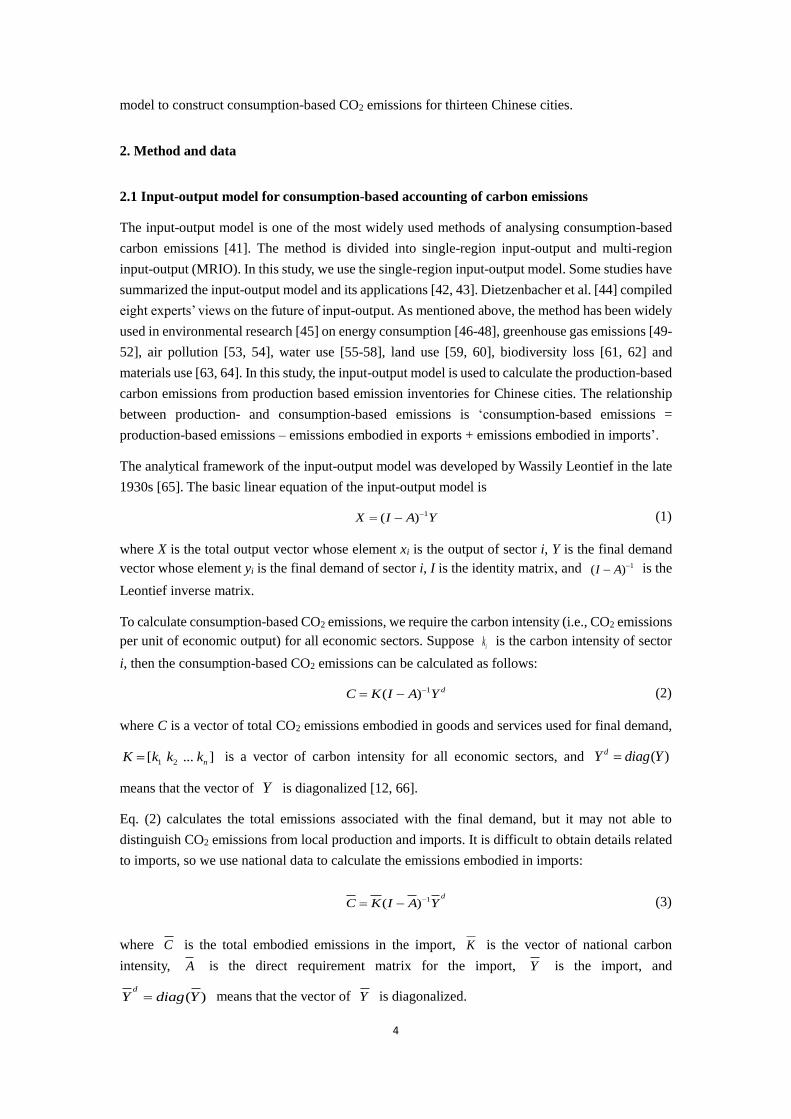
2.1 Input-output model for consumption-based accounting of carbon emissions
The input-output model is one of the most widely used methods of analysing consumption-based
carbon emissions [41]. The method is divided into single-region input-output and multi-region
input-output (MRIO). In this study, we use the single-region input-output model. Some studies have
summarized the input-output model and its applications [42, 43]. Dietzenbacher et al. [44] compiled
eight experts’ views on the future of input-output. As mentioned above, the method has been widely
used in environmental research [45] on energy consumption [46-48], greenhouse gas emissions [49-
52], air pollution [53, 54], water use [55-58], land use [59, 60], biodiversity loss [61, 62] and
materials use [63, 64]. In this study, the input-output model is used to calculate the production-based
carbon emissions from production based emission inventories for Chinese cities. The relationship
between production- and consumption-based emissions is ‘consumption-based emissions =
production-based emissions – emissions embodied in exports + emissions embodied in imports’.
The analytical framework of the input-output model was developed by Wassily Leontief in the late
1930s [65]. The basic linear equation of the input-output model is
1( )X I A Y (1)
where X is the total output vector whose element xi is the output of sector i, Y is the final demand
vector whose element yi is the final demand of sector i, I is the identity matrix, and 1( )I A is the
Leontief inverse matrix.
To calculate consumption-based CO2 emissions, we require the carbon intensity (i.e., CO2 emissions
per unit of economic output) for all economic sectors. Suppose ik is the carbon intensity of sector
i, then the consumption-based CO2 emissions can be calculated as follows:
1( ) dC K I A Y (2)
where C is a vector of total CO2 emissions embodied in goods and services used for final demand,
1 2[ ... ]nK k k k is a vector of carbon intensity for all economic sectors, and ( )dY diag Y
means that the vector of Y is diagonalized [12, 66].
Eq. (2) calculates the total emissions associated with the final demand, but it may not able to
distinguish CO2 emissions from local production and imports. It is difficult to obtain details related
to imports, so we use national data to calculate the emissions embodied in imports:
1( )d
C K I A Y (3)
where C is the total embodied emissions in the import, K is the vector of national carbon
intensity, A is the direct requirement matrix for the import, Y is the import, and
( )d
Y diag Y means that the vector of Y is diagonalized.

5
Notably, emissions from residential energy consumption are not included in our calculations.
2.2 Data sources
In this study, we use the input-output model to calculate consumption-based CO2 emissions for
thirteen cities in China. The input-output tables for the cities are derived from regional statistics
bureaus. Population data are obtained from the database of the National Bureau of Statistics of China
[4]. China does not officially release carbon emissions data, and data quality is relatively poor at the
city level—with the exception of a few megacities. Therefore, we developed a method for
constructing a production-based CO2 emissions inventory for Chinese cities using the definition
provided by the IPCC territorial emission accounting approach [67-69]. Each inventory covers 47
socioeconomic sectors, 20 energy types and 9 primary industry products.
3. Results
3.1 Consumption-based carbon emissions for thirteen cities in China
Table 1 shows the socio-economic information of the thirteen cities in 2007. It can be seen that
Shanghai has the highest GDP per capita and the highest population density. On the contrary,
Hengshui has the lowest GDP per capita with only 12724 Chinese Yuan (CNY) per capita. Capital
formation occupies the highest percentage in the final demand. For example, Xian’s capital
formation occupies more than 70% in the total final demand.

6
Table 1 Socio-economic information of the thirteen cities in 2007.
Note: ¥ means Chinese Yuan (CNY).
Population
(Million)
Area
(km2)
GDP per capita
(¥ per person)
Household consumption
(Million ¥)
Government consumption
(Million ¥)
Fixed capital formation
(Million ¥)
Inventory increase
(Million ¥)
Export
(Million ¥)
Import
(Million ¥)
Beijing 12.2 16411 78762 284654 221379 408256 47571 1179544 1183462
Shanghai 13.8 6340 88398 445552 156079 504140 52709 2165237 2104832
Tianjin 9.6 11920 52382 130924 75515 268135 24111 851749 845395
Chongqing 32.4 82400 12918 181557 59575 221678 9046 245238 299169
Dalian 5.8 13237 54146 76832 39215 170614 16101 385848 375542
Harbin 9.9 53840 24680 69486 41707 105799 19634 111420 104367
Hengshui 4.3 8815 12724 18367 5798 20927 7686 561432 559760
Ningbo 5.6 9816 60844 66565 40943 166523 27301 710087 667917
Qingdao 7.6 11282 49955 100176 41389 172300 19382 571674 526269
Shenyang 7.1 12948 45383 79783 50200 181827 2287 169577 161559
Shijiazhuang 9.6 15848 24841 67565 26044 128040 113 527903 512420
Tangshan 7.2 13472 38355 71417 25075 69382 33204 337393 258530
Xian 7.6 10108 23065 70717 27502 126904 16928 102712 168490

7
Fig. 1. Imported and domestic emissions in the total consumption-based CO2 emissions. The
percentages of imported emissions are shown above the bars.
Consumption-based emissions include imported emissions (emissions embodied in imports) and
domestic emissions (from the consumption of domestic products). Fig. 1 shows that imported
emissions were much higher than domestic emissions in 2007 in most cities. In megacities such as
Shanghai, Beijing and Tianjin, approximately 70% of consumption-based emissions are imported
from other regions. Hengshui has the highest percentage of imported emissions in its total
consumption-based emissions because its imports are approximately 11 times greater than its final
consumption. Overall, this reveals that urban consumers rely largely on goods and services produced
elsewhere in China. This result is consistent with studies on cities in other countries. For example,
Hasegawa et al. [38] found that imported CO2 emissions accounted for about 40-80% in total
emissions for Japanese prefectures.
In several cities, including Chongqing, Shenyang and Harbin, more than half of the consumption-
based CO2 emissions occur within city boundaries. Approximately 29% of Harbin’s emissions are
imported from other regions for two reasons. First, Harbin has lower imports than other cities. For
example, Shijiazhuang’s imports are 4 times those of Harbin, although the two cities have similar
GDPs. Second, the carbon intensity of Harbin’s exports is much higher than that of its imports.
Specifically, the carbon intensity of its exports is 215 g CO2 per CNY, which is 37% higher than
that of its imports.
0
50
100
150
200
Co
nsu
mp
tio
n E
mis
sio
ns
(Mt
CO
2)
Imported emissions
Domestic emissions
71%
70%
43% 68%
38%
66% 74% 72% 29% 65% 68%54%
94%

8
Fig. 2. Embodied CO2 emissions in major final demand categories. The percentages of emissions
induced by capital formation are shown above the bars.
From the perspective of final consumption, CO2 emissions are produced by four final demand
categories, including household consumption, government, changes in inventories, and capital
formation. Fig. 2 shows that capital formation is the largest contributor to consumption-based
emissions, which corroborates previous research on CO2 emissions in China [70-72]. The high
contribution of capital investments to consumption-based emissions is driven by rapid urbanization,
large-scale economic growth, and government policies [40, 73]. Capital formation contributes more
than 60% of emissions in four cities, including Shijiazhuang (65%), Ningbo (63%), Xian (61%) and
Shenyang (61%). Shijiazhuang has the highest percentage of emissions derived from capital
formation, which is determined by its consumption structure. Its capital formation accounted for 58%
in its total final demands in 2007. After capital formation, household consumption is the second
largest driver of emissions. The percentages of emissions produced by household consumption
range between 19% (Ningbo) and 38% (Harbin). Harbin exhibits the highest percentage of
emissions attributed to household consumption. In this city, capital formation and household
consumption make similar contributions to final, with each contributing 38% of total CO2 emissions.
0
50
100
150
200
Co
nsu
mp
tio
n E
mis
sio
ns
(Mt
CO
2)
Capital Formation
Changes in Inventories
Government
Household
50%
63%56%61%
55%55%
46%
65%38%60% 61%
32%
44%

9
Fig. 3. CO2 emissions embodied in imports and exports for thirteen cities.
Carbon emissions embodied in imports and exports vary greatly in the thirteen Chinese cities
included in this study (see Fig. 3). Emissions embodied in imports for the four megacities are much
larger than in other medium-sized cities. For example, emissions embodied in imports in Shanghai
are 140 Mt CO2, which is 13 times greater than in Hengshui. The sector of metal products is the
largest contributor to the embodied emissions of imports. In the city of Dalian, the imports of metal
products produce 10 Mt CO2, which account for 26% of the total emissions embodied in imports.
In addition, the sector of construction also cause substantial carbon emissions in Chinese cities. For
example, Qingdao’s imports in Construction generate 11 Mt CO2 or approximately 28% of total
emissions embodied in imports.
For most cities, the emissions embodied in their imports are greater than the emissions embodied in
their exports. For instance, the embodied emissions of Xian’s imports are 34 Gt CO2, whereas the
embodied emissions of its exports are only 6 Gt CO2. In fact, Xian’s imports were approximately
1.6 times greater than its exports in 2007. In addition, the carbon intensity of Xian’s production is
lower than that of its exports. The carbon intensity of Xian’s imports was 201 g CO2 per CNY in
2007, which was much higher than that of its exports (61 g CO2 per CNY). Therefore, one unit of
import embodies more CO2 emissions than an equivalent unit of export. However, the embodied
emissions in imports are smaller than the embodied emissions in exports for five cities, including
Tangshan, Shijiazhuang, Harbin, Ningbo and Shenyang. Therefore, the producer responsibility is
greater than the consumer responsibility in these regions. For example, emissions embodied in
Tangshan’s imports equal 22 Gt CO2, which is less than half the emissions embodied in its exports
(55 Gt CO2) mainly because the carbon intensity of its imports is much lower than that of its exports.
The carbon intensities of Tangshan’s imports and exports were 85 and 164 g CO2 per CNY in 2007,
respectively.
3.2 Comparisons between production- and consumption-based emissions

10
Fig. 4. Production- and consumption-based CO2 emissions at the city level. The black circles
represent production-based emissions, whereas the other circles represent consumption-based
emissions, with the four colours representing emissions produced by household consumption,
government, capital formation and changes in inventory, respectively. Total production- and
consumption-based CO2 emissions are shown in the pie charts (in Mt CO2).
Fig. 4 compares production- and consumption-based carbon emissions in a selection of Chinese
cities. It can be seen that there are great differences between production- and consumption-based
emissions for all cities. It is mainly caused by two factors: trade deficit and different carbon intensity
[74, 75]. All thirteen cities are categorized by their trading patterns. Fig. 4 shows that five are
production-based cities in which production-based emissions are higher than consumption-based
emissions. Shijiazhuang is a typical production-based city with production- and consumption-based
CO2 emissions at 87 and 47 Mt, respectively. Its annual per capita production-based emissions total
9 tonnes, which is 83% higher than its annual per capita consumption-based emissions (5 tonnes).
Notably, Shijiazhuang’s imports and exports are almost equal, although there is a substantial
difference between the CO2 emissions embodied in its imports and exports, which is mainly due to
its high-carbon-intensity domestic production. The average carbon intensity of its exports is 136 g
CO2 per CNY, which is much higher than that of its imports (63 g CO2 per CNY). Therefore,
improving technology and reducing carbon intensity are critical for these cities to control
production-based emissions. Because of the large gap between the two approaches to emission
accounting, the production-based cities prefer that consumption-based accounting be used to
allocate responsibilities for climate change mitigation.
Consumption-based emissions are larger than production-based emissions in eight cities. For
example, Xian’s consumption-based CO2 emissions are 52 Mt, which is more than twice its
production-based emissions (24 Mt). In fact, Xian’s imports are approximately 1.6 times more than
its exports. In addition, the carbon intensity of Xian’s domestic production is lower than other cities.

11
The carbon intensity of its exports is 61 g CO2 per CNY, which is similar to Tianjin. However, the
carbon intensity of Xian’s imports is 201 g CO2 per CNY—much higher than its exports.
Production-based accounting benefits these consumption-based cities in allocating responsibilities.
Clearly, the most developed cities in China, such as Beijing, Shanghai and Tianjin, tend to be
consumption-based cities On the contrary, most medium-sized cities are production-based cities.
Production-based cities tend to become consumption-based cities as they undergo further
socioeconomic development.
Fig. 5 Thirteen cities’ consumption-based emissions (row 1), production-based emissions (row 2),
emissions embodied in imports (row 3), and emissions embodied in exports (row 4). This figure
shows regional emissions totals (left column), emissions intensity (centre column), and per capita
emissions (right column). The colour of the bars corresponds to the city’s GDP per capita, from
the most affluent cities in red to the least developed cities in green (see scale).

12
Fig. 5, row 1, Left, shows the consumption-based emissions for thirteen cities in China. Overall
consumption-based emissions are greatest in the four megacities, i.e., Shanghai (199 Mt CO2),
Beijing (142 Mt CO2), Chongqing (97 Mt CO2) and Tianjin (93 Mt CO2). Consumption-based
emissions in Shanghai are approximately 18 times those of Hengshui (11 Mt CO2). Annual per
capita consumption-based emissions in Shanghai, Beijing and Tianjin are 14, 12 and 10 tonnes of
CO2 per person, respectively (Fig. 5, row 1, Right). Some medium-sized cities, such as Shenyang,
Dalian and Ningbo, have per capita emissions that are similar to Tianjin’s. In Chongqing, per capita
consumption-based emissions are very low (3 tonnes CO2 per person), although this city’s total
consumption-based emissions are high.
With regard to production-based emissions, Shanghai is the largest emitter with 146 Mt CO2 (Fig.
5, row 2, Left). Shijiazhuang has rather high production-based emissions (87 Mt CO2), which are
even higher than Beijing (81 Mt CO2) and Tianjin (80 Mt CO2). Domestic production-based
emissions per unit of GDP reflect the technological level of a city’s production (Fig. 5, row 2,
Centre). Shijiazhuang has the highest carbon intensity of the thirteen Chinese cities, with 366 g CO2
per CNY, which is one of the main reasons for its high production-based emissions. By contrast,
Beijing and Shanghai have the highest levels of technology, and their carbon intensities are 85 and
120 g CO2 per CNY, respectively. The highest annual per capita production-based emissions are
found in Ningbo, Shenyang, Shanghai and Tangshan (10-12 tonnes CO2 per person; Fig. 5, row 2,
Right). In Chongqing, per capita production-based emissions are low, as are its per capita
consumption-based emissions. We find a substantial difference between production- and
consumption-based accounting in terms of overall carbon emissions as well as per capita levels. As
a result, the choice of an emission accounting approach has a major impact on allocating
responsibilities for climate change mitigation. Thus, the two different accounting approaches must
be considered comprehensively in identifying fair mitigation policies.
Overall emissions embodied in imports are shown in Fig. 5, row 3, Left. We find that more developed
cities tend to import more CO2 emissions. As the two most developed cities in China, Shanghai and
Beijing have the largest amounts of emissions embodied in imports. By contrast, Harbin and
Hengshui, two less developed cities, have the lowest amounts of emissions embodied in imports,
which further confirms that production-based cities tend to become consumption-based cities as
they undergo further socioeconomic development. In the case of exports (Fig. 5, row 4, Left), emissions embodied in exports are greatest in Shanghai (88 Mt CO2) and Shijiazhuang (72 Mt CO2),
which is a primary reason for Shijiazhuang’s high production-based CO2 emissions.
4. Conclusions
Consumption-based CO2 emissions have been accepted by an increasing number of researchers and
policy makers. In this study, we calculate consumption-based CO2 emissions for thirteen Chinese
cities and find that consumption in these cities not only leads to carbon emissions within their own
boundaries but also induces emissions in other regions via interregional trade. For instance, more
than 70% of consumption-based emissions in Beijing and Shanghai are imported from other regions,
which shows that urban consumers rely largely on goods and services imported from elsewhere in
China. Therefore, cooperation between consuming and producing regions is critical to mitigate
climate change. China currently has pilot carbon trading systems in seven cities and plans to
establish a national emissions trading scheme by 2017, which will help improve regional
cooperation on mitigation in China. In addition, a clean development mechanism (CDM) within
China may encourage cooperation between cities and their neighbours. Under such a mechanism,
cities may invest in their surrounding areas and obtain carbon emission permits.
Capital formation is the largest contributor to consumption-based emissions in the thirteen cities.
For example, more than 60% of consumption-based emissions were caused by capital formation in
Shenyang and Ningbo in 2007. The high contribution of capital investment to consumption-based
emissions is driven by rapid urbanization, large-scale economic growth, and government policies.
Household consumption is the second largest driver of emissions, but the percentage of emissions
induced by household consumption remains much smaller in China than in other countries. In the future, more residents will transition from rural to urban lifestyles as China continues its rapid
urbanization, leading to increased CO2 emissions related to household consumption.
13
All thirteen cities are categorized in terms of their trading patterns. In five production-based cities,
production-based emissions are higher than consumption-based emissions. Shijiazhuang is a typical
production-based city, whose production- and consumption-based CO2 emissions are 87 and 47 Mt,
respectively. Improving technology and reducing carbon intensity are critical if these cities are to
control production-based emissions. Conversely, eight of the cities are consumption-based cities in
which consumption-based emissions exceed production-based emissions. For example, Xian’s
consumption-based CO2 emissions are 52 Mt, more than twice its production-based emissions (24
Mt). Clearly, the most developed cities in China tend to be consumption-based cities, such as Beijing,
Shanghai and Tianjin. Similarly, most medium-sized cities are production-based cities, and
production-based cities tend to become consumption-based cities as they undergo further
socioeconomic development. Based on this trend, more Chinese cities will transition from
production-based to consumption-based cities as a result of rapid social development. Consequently,
more production-based CO2 emissions will be transferred to rural areas or abroad. Therefore, rural
and urban areas must cooperate to tackle the challenge of climate change within China.
At present, few governments choose consumption-based accounting in determining their mitigation
policies, and most global climate change agreements are based on production-based accounting,
including the United Nations Framework Convention on Climate Change (UNFCCC) and the Kyoto
Protocol. Consumption-based accounting’s advantages have been shown in many studies; this
approach elucidates the drivers of emissions growth, improves cost-effectiveness and justice,
addresses carbon leakage, promotes environmental comparative advantages, and encourages
technology diffusion [13, 22, 26, 40]. There are substantial differences between production- and
consumption-based accounting in terms of calculating both overall and per capita carbon emissions
levels. As a result, the selection of an emission accounting approach has a major influence on the
allocation of responsibilities for climate change mitigation. The two different accounting
approaches must thus be considered comprehensively to identify fair mitigation policies. At the city
level, consumption-based accounting can help cities to reduce emissions both within city boundaries
and along their entire supply chains at minimum cost. Interregional cooperation on climate change
mitigation should employ consumption-based accounting to allocate mitigation responsibilities
more fairly and efficiently. Therefore, consumption-based carbon emission accounting is a
complementary tool for promoting climate action at the city level.
Acknowledgements
This study was supported by the Natural Science Foundation of China (41328008), the UK
Economic and Social Research Council (ES/L016028/1) Natural Environment Research Council
(NE/N00714X/1) and British Academy Grant (AF150310).
References
[1] Chang K, Chang H. Cutting CO2 intensity targets of interprovincial emissions trading in China.
Applied Energy. 2016;163:211-21.
[2] Arce G, López LA, Guan D. Carbon emissions embodied in international trade: The post-China era.
Applied Energy. 2016;(in press).
[3] Xinhua. Enhanced actions on climate change: China's intended nationally determined contributions,
http://news.xinhuanet.com/english/china/2015-06/30/c_134369837.htm; 2015 [accessed 2015-09-01].
[4] NBSC. National data, http://data.stats.gov.cn/english/; 2015 [accessed 2015-02-01].
[5] Wei Y, Liu L, Wu G, Zou L. Energy economics: CO2 emissions in China. New York: Springer; 2011.
[6] Nam K-M, Waugh CJ, Paltsev S, Reilly JM, Karplus VJ. Carbon co-benefits of tighter SO2 and NOx
regulations in China. Glob Environ Change. 2013;23:1648-61.
[7] Dhakal S. GHG emissions from urbanization and opportunities for urban carbon mitigation. Curr
Opin Environ Sustain. 2010;2:277-83.
[8] Dhakal S. Urban energy use and carbon emissions from cities in China and policy implications.
Energy Policy. 2009;37:4208-19.
[9] Senbel M, McDaniels T, Dowlatabadi H. The ecological footprint: a non-monetary metric of human

14
consumption applied to North America. Glob Environ Change. 2003;13:83-100.
[10] Shigeto S, Yamagata Y, Ii R, Hidaka M, Horio M. An easily traceable scenario for 80% CO2 emission
reduction in Japan through the final consumption-based CO2 emission approach: A case study of Kyoto-
city. Applied Energy. 2012;90:201-5.
[11] Zhang B, Qiao H, Chen ZM, Chen B. Growth in embodied energy transfers via China’s domestic
trade: Evidence from multi-regional input–output analysis. Applied Energy. 2015;(in press).
[12] Peters GP. From production-based to consumption-based national emission inventories. Ecol Econ.
2008;65:13-23.
[13] Steininger K, Lininger C, Droege S, Roser D, Tomlinson L, Meyer L. Justice and cost effectiveness
of consumption-based versus production-based approaches in the case of unilateral climate policies. Glob
Environ Change. 2014;24:75-87.
[14] Atkinson G, Hamilton K, Ruta G, Van Der Mensbrugghe D. Trade in ‘virtual carbon’: Empirical
results and implications for policy. Glob Environ Change. 2011;21:563-74.
[15] Wiedmann T. A review of recent multi-region input–output models used for consumption-based
emission and resource accounting. Ecol Econ. 2009;69:211-22.
[16] Peters GP, Hertwich EG. Post-Kyoto greenhouse gas inventories: production versus consumption.
Clim Change. 2008;86:51-66.
[17] Jakob M, Steckel JC, Edenhofer O. Consumption- versus production-based emission policies. Annu
Rev Resour Econ. 2014;6:297-318.
[18] Girod B, van Vuuren DP, Hertwich EG. Climate policy through changing consumption choices:
Options and obstacles for reducing greenhouse gas emissions. Glob Environ Change. 2014;25:5-15.
[19] Steininger KW, Lininger C, Meyer LH, Munoz P, Schinko T. Multiple carbon accounting to support
just and effective climate policies. Nature Clim Change. 2015;(in press).
[20] Guan D, Lin J, Davis SJ, Pan D, He K, Wang C, et al. Reply to Lopez et al.: Consumption-based
accounting helps mitigate global air pollution. Proc Natl Acad Sci USA. 2014;111:E2631.
[21] Larsen HN, Hertwich EG. The case for consumption-based accounting of greenhouse gas emissions
to promote local climate action. Environ Sci Policy. 2009;12:791-8.
[22] Peters GP, Hertwich EG. CO2 embodied in international trade with implications for global climate
policy. Environ Sci Technol. 2008;42:1401-7.
[23] Tian X, Chang M, Lin C, Tanikawa H. China’s carbon footprint: A regional perspective on the effect
of transitions in consumption and production patterns. Applied Energy. 2014;123:19-28.
[24] Hertwich EG, Peters GP. Carbon footprint of nations: A global, trade-linked analysis. Environ Sci
Technol. 2009;43:6414-20.
[25] Davis SJ, Caldeira K. Consumption-based accounting of CO2 emissions. Proc Natl Acad Sci USA.
2010;107:5687-92.
[26] Peters GP, Minx JC, Weber CL, Edenhofer O. Growth in emission transfers via international trade
from 1990 to 2008. Proc Natl Acad Sci USA. 2011;108:8903-8.
[27] Wood R, Dey CJ. Australia's carbon footprint. Econ Syst Res. 2009;21:243-66.
[28] Nansai K, Kagawa S, Kondo Y, Suh S, Inaba R, Nakajima K. Improving the completeness of product
carbon footprints using a global link input-output model: the case of Japan. Econ Syst Res. 2009;21:267-
90.
[29] Wiedmann T, Wood R, Minx JC, Lenzen M, Guan D, Harris R. A carbon footprint time series of the
UK - results from a multi-region input-output model. Econ Syst Res. 2010;22:19-42.
[30] Barrett J, Peters G, Wiedmann T, Scott K, Lenzen M, Roelich K, et al. Consumption-based GHG
emission accounting: a UK case study. Clim Policy. 2013;13:451-70.
[31] Feng K, Davis SJ, Sun L, Li X, Guan D, Liu W, et al. Outsourcing CO2 within China. Proc Natl
Acad Sci USA. 2013;110:11654-9.
[32] Hoornweg D, Sugar L, Gomez CLT. Cities and greenhouse gas emissions: moving forward. Environ
Urban. 2011;1:1-21.
[33] Sugar L, Kennedy C, Leman E. Greenhouse gas emissions from Chinese cities. J Ind Ecol.
2012;16:552-63.
[34] Liu Z, Liang S, Geng Y, Xue B, Xi F, Pan Y, et al. Features, trajectories and driving forces for
energy-related GHG emissions from Chinese mega cites: The case of Beijing, Tianjin, Shanghai and
Chongqing. Energy. 2012;37:245-54.
[35] Creutzig F, Baiocchi G, Bierkandt R, Pichler P-P, Seto KC. Global typology of urban energy use
and potentials for an urbanization mitigation wedge. Proc Natl Acad Sci USA. 2015;112:6283-8.
[36] Jan M, Giovanni B, Thomas W, John B, Felix C, Kuishuang F, et al. Carbon footprints of cities and
other human settlements in the UK. Environmental Research Letters. 2013;8:035039.
[37] Fan J, Guo X, Marinova D, Wu Y, Zhao D. Embedded carbon footprint of Chinese urban households:
structure and changes. J Clean Prod. 2012;33:50-9.

15
[38] Hasegawa R, Kagawa S, Tsukui M. Carbon footprint analysis through constructing a multi-region
input–output table: a case study of Japan. Journal of Economic Structures. 2015;4:1-20.
[39] Dhakal S. Urban energy use and greenhouse gas emissions in Asian mega-cities. Kitakyushu, Japan:
Institute for Global Environmental Strategies; 2004.
[40] Feng K, Hubacek K, Sun L, Liu Z. Consumption-based CO2 accounting of China's megacities: The
case of Beijing, Tianjin, Shanghai and Chongqing. Ecol Indic. 2014;47:26-31.
[41] Wiedmann T. A first empirical comparison of energy Footprints embodied in trade — MRIO versus
PLUM. Ecol Econ. 2009;68:1975-90.
[42] Minx JC, Wiedmann T, Wood R, Peters GP, Lenzen M, Owen A, et al. Input–output analysis and
carbon footprinting: An overview of applications. Econ Syst Res. 2009;21:187-216.
[43] Wiedmann T. Carbon footprint and input-output analysis - an introduction. Econ Syst Res.
2009;21:175-86.
[44] Dietzenbacher E, Lenzen M, Los B, Guan D, Lahr ML, Sancho F, et al. Input-output analysis: the
next 25 years. Econ Syst Res. 2013;25:369-89.
[45] Wiedmann T, Lenzen M, Turner K, Barrett J. Examining the global environmental impact of regional
consumption activities — Part 2: Review of input–output models for the assessment of environmental
impacts embodied in trade. Ecol Econ. 2007;61:15-26.
[46] Wei Y-M, Mi Z-F, Huang Z. Climate policy modeling: An online SCI-E and SSCI based literature
review. Omega. 2015;57:70-84.
[47] Cellura M, Di Gangi A, Longo S, Orioli A. An Italian input–output model for the assessment of
energy and environmental benefits arising from retrofit actions of buildings. Energy Build. 2013;62:97-
106.
[48] Yuan C, Liu S, Xie N. The impact on chinese economic growth and energy consumption of the
Global Financial Crisis: An input–output analysis. Energy. 2010;35:1805-12.
[49] Yan J, Zhao T, Kang J. Sensitivity analysis of technology and supply change for CO2 emission
intensity of energy-intensive industries based on input–output model. Applied Energy. 2016;171:456-67.
[50] Su B, Ang BW. Input–output analysis of CO2 emissions embodied in trade: A multi-region model
for China. Applied Energy. 2014;114:377-84.
[51] Mi Z-F, Pan S-Y, Yu H, Wei Y-M. Potential impacts of industrial structure on energy consumption
and CO2 emission: a case study of Beijing. J Clean Prod. 2015;103:455-62.
[52] Wei Y-M, Mi Z-F, Zhang H. Progress of integrated assessment models for climate policy. Syst Eng
Theory Pract. 2013;33:1905-15 (in Chinese).
[53] Lin J, Pan D, Davis SJ, Zhang Q, He K, Wang C, et al. China’s international trade and air pollution
in the United States. Proc Natl Acad Sci USA. 2014;111:1736-41.
[54] Yang S, Fath B, Chen B. Ecological network analysis of embodied particulate matter 2.5 – A case
study of Beijing. Applied Energy. 2016;(in press).
[55] Cazcarro I, Duarte R, Sanchez Choliz J. Multiregional input–output model for the evaluation of
Spanish water flows. Environ Sci Technol. 2013;47:12275-83.
[56] Aviso KB, Tan RR, Culaba AB, Cruz Jr JB. Fuzzy input–output model for optimizing eco-industrial
supply chains under water footprint constraints. J Clean Prod. 2011;19:187-96.
[57] Ewing BR, Hawkins TR, Wiedmann TO, Galli A, Ertug Ercin A, Weinzettel J, et al. Integrating
ecological and water footprint accounting in a multi-regional input–output framework. Ecol Indic.
2012;23:1-8.
[58] Yu Y, Hubacek K, Feng K, Guan D. Assessing regional and global water footprints for the UK. Ecol
Econ. 2010;69:1140-7.
[59] Costello C, Griffin WM, Matthews HS, Weber CL. Inventory development and input-output model
of US land use: Relating land in production to consumption. Environ Sci Technol. 2011;45:4937-43.
[60] Weinzettel J, Hertwich EG, Peters GP, Steen-Olsen K, Galli A. Affluence drives the global
displacement of land use. Glob Environ Change. 2013;23:433-8.
[61] Lenzen M, Moran D, Kanemoto K, Foran B, Lobefaro L, Geschke A. International trade drives
biodiversity threats in developing nations. Nature. 2012;486:109-12.
[62] Lenzen M, Murray SA. A modified ecological footprint method and its application to Australia. Ecol
Econ. 2001;37:229-55.
[63] Weisz H, Duchin F. Physical and monetary input-output analysis: What makes the difference? Ecol
Econ. 2006;57:534-41.
[64] Wiedmann TO, Schandl H, Lenzen M, Moran D, Suh S, West J, et al. The material footprint of
nations. Proc Natl Acad Sci USA. 2015;112:6271-6.
[65] Leontief WW. Quantitative input and output relations in the economic systems of the United States.
Rev Econ Stat. 1936;18:105-25.
[66] Turner K, Lenzen M, Wiedmann T, Barrett J. Examining the global environmental impact of regional

16
consumption activities — Part 1: A technical note on combining input–output and ecological footprint
analysis. Ecol Econ. 2007;62:37-44.
[67] Mi Z-F, Wei Y-M, He C-Q, Li H-N, Yuan X-C, Liao H. Regional efforts to mitigate climate change
in China: a multi-criteria assessment approach. Mitig Adapt Strateg Glob Chang. 2015;(in press).
[68] Shan Y, Guan D, Liu J, Liu Z, Liu J, Schroeder H, et al. CO2 emissions inventory of Chinese cities.
Atmospheric Chemistry and Physics Discussions. 2016;(in press).
[69] Shan Y, Liu J, Liu Z, Xu X, Shao S, Wang P, et al. New provincial CO2 emission inventories in
China based on apparent energy consumption data and updated emission factors. Applied Energy.
2016;(in press).
[70] Feng K, Siu YL, Guan D, Hubacek K. Analyzing drivers of regional carbon dioxide emissions for
China. J Ind Ecol. 2012;16:600-11.
[71] Guan D, Peters GP, Weber CL, Hubacek K. Journey to world top emitter: An analysis of the driving
forces of China's recent CO2 emissions surge. Geophys Res Lett. 2009;36:1-5.
[72] Peters GP, Weber CL, Guan D, Hubacek K. China's growing CO2 emissions: a race between
increasing consumption and efficiency gains. Environ Sci Technol. 2007;41:5939-44.
[73] Minx JC, Giovanni B, Peters GP, Weber CL, Dabo G, Klaus H. A "carbonizing dragon": China's fast
growing CO2 emissions revisited. Environ Sci Technol. 2011;45:9144-53.
[74] Jakob M, Marschinski R. Interpreting trade-related CO2 emission transfers. Nature Clim Change.
2013;3:19-23.
[75] López L-A, Arce G, Zafrilla J. Financial crisis, virtual carbon in global value chains, and the
importance of linkage effects. The Spain-China case. Environ Sci Technol. 2014;48:36-44.
Support information
In this study, the production-based CO2 emissions inventories are compiled according to
Intergovernmental Panel on Climate Change (IPCC) guidance and include two parts: CO2 emissions
from fossil fuel consumption and from industrial processes. Error! Reference source not found.
presents the methodology framework of the inventory compilation.
17
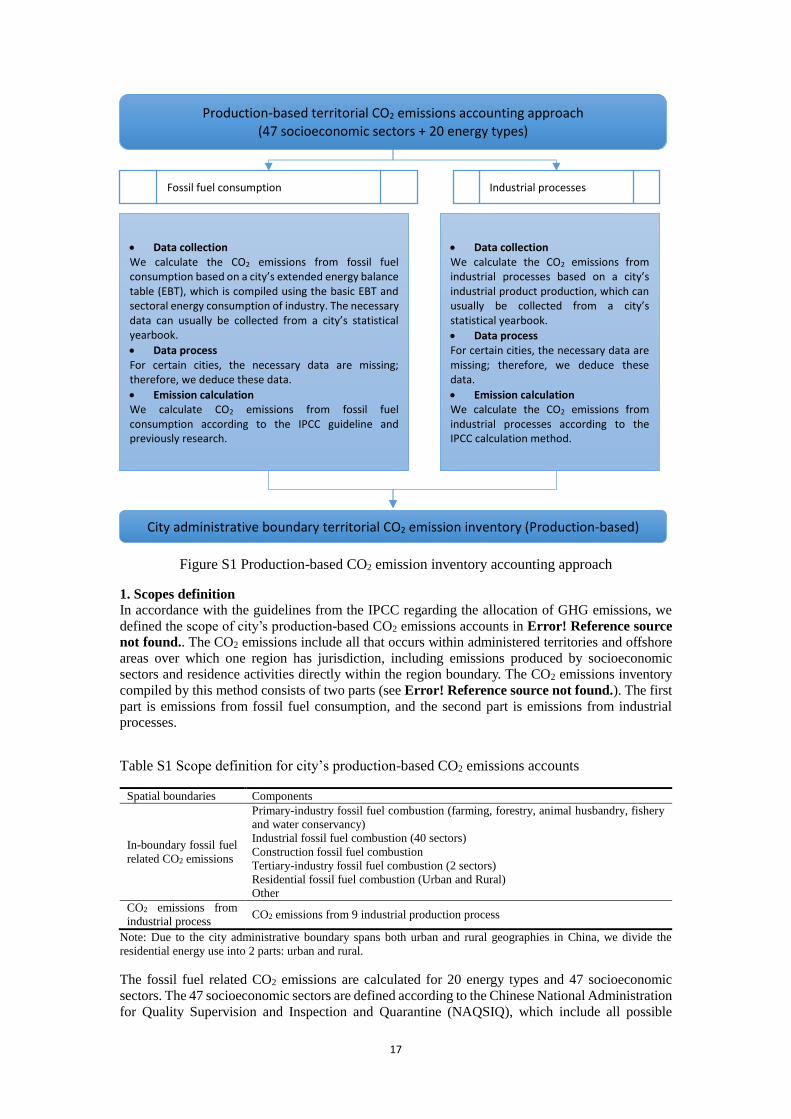
Figure S1 Production-based CO2 emission inventory accounting approach
1. Scopes definition
In accordance with the guidelines from the IPCC regarding the allocation of GHG emissions, we
defined the scope of city’s production-based CO2 emissions accounts in Error! Reference source
not found.. The CO2 emissions include all that occurs within administered territories and offshore
areas over which one region has jurisdiction, including emissions produced by socioeconomic
sectors and residence activities directly within the region boundary. The CO2 emissions inventory
compiled by this method consists of two parts (see Error! Reference source not found.). The first
part is emissions from fossil fuel consumption, and the second part is emissions from industrial
processes.
Table S1 Scope definition for city’s production-based CO2 emissions accounts
Spatial boundaries Components
In-boundary fossil fuel
related CO2 emissions
Primary-industry fossil fuel combustion (farming, forestry, animal husbandry, fishery
and water conservancy)
Industrial fossil fuel combustion (40 sectors)
Construction fossil fuel combustion
Tertiary-industry fossil fuel combustion (2 sectors)
Residential fossil fuel combustion (Urban and Rural)
Other
CO2 emissions from
industrial process CO2 emissions from 9 industrial production process
Note: Due to the city administrative boundary spans both urban and rural geographies in China, we divide the
residential energy use into 2 parts: urban and rural.
The fossil fuel related CO2 emissions are calculated for 20 energy types and 47 socioeconomic
sectors. The 47 socioeconomic sectors are defined according to the Chinese National Administration
for Quality Supervision and Inspection and Quarantine (NAQSIQ), which include all possible
Production-based territorial CO2 emissions accounting approach (47 socioeconomic sectors + 20 energy types)
Fossil fuel consumption Industrial processes
Data collection We calculate the CO2 emissions from fossil fuel consumption based on a city’s extended energy balance table (EBT), which is compiled using the basic EBT and sectoral energy consumption of industry. The necessary data can usually be collected from a city’s statistical yearbook.
Data process For certain cities, the necessary data are missing; therefore, we deduce these data.
Emission calculation We calculate CO2 emissions from fossil fuel consumption according to the IPCC guideline and previously research.
Data collection We calculate the CO2 emissions from industrial processes based on a city’s industrial product production, which can usually be collected from a city’s statistical yearbook.
Data process For certain cities, the necessary data are missing; therefore, we deduce these data.
Emission calculation We calculate the CO2 emissions from industrial processes according to the IPCC calculation method.
City administrative boundary territorial CO2 emission inventory (Production-based)

18
socioeconomic activities conducted in a Chinese city’s administrative boundary (see Error!
Reference source not found.).
Table S2 Sectors defined in city’s CO2 emission inventory
No. (𝒊) Socioeconomic sectors Category
1 Farming, Forestry, Animal Husbandry, Fishery and Water
Conservancy Primary industry
2 Coal Mining and Dressing
Mining
3 Petroleum and Natural Gas Extraction
4 Ferrous Metals Mining and Dressing
5 Nonferrous Metals Mining and Dressing
6 Non-metal Minerals Mining and Dressing
7 Other Minerals Mining and Dressing
8 Logging and Transport of Wood and Bamboo
Manufacturing
9 Food Processing
10 Food Production
11 Beverage Production
12 Tobacco Processing
13 Textile Industry
14 Garments and Other Fibre Products
15 Leather, Furs, Down and Related Products
16 Timber Processing, Bamboo, Cane, Palm Fibre & Straw Products
17 Furniture Manufacturing
18 Papermaking and Paper Products
19 Printing and Record Medium Reproduction
20 Cultural, Educational and Sports Articles
21 Petroleum Processing and Coking
22 Raw Chemical Materials and Chemical Products
23 Medical and Pharmaceutical Products
24 Chemical Fibre
25 Rubber Products
26 Plastic Products
27 Non-metal Mineral Products
28 Smelting and Pressing of Ferrous Metals
29 Smelting and Pressing of Nonferrous Metals
30 Metal Products
31 Ordinary Machinery
32 Equipment for Special Purposes
33 Transportation Equipment manufacturing
34 Electric Equipment and Machinery
35 Electronic and Telecommunications Equipment
36 Instruments, Meters, Cultural and Office Machinery
37 Other Manufacturing Industry
38 Scrap and waste
39 Production and Supply of Electric Power, Steam and Hot Water
(Electricity generation) Electric power, gas and water
production and supply 40 Production and Supply of Gas
41 Production and Supply of Tap Water
42 Construction Construction
43 Transportation, Storage, Post and Telecommunication Services
(Transportation services) Services sectors / Tertiary
industry 44
Wholesale, Retail Trade and Catering Services (Wholesale
services)
45 Urban Residential usage
46 Rural
47 Other Other
We include 20 energy types in this paper that are widely used in the Chinese energy system (see
Error! Reference source not found.). We exclude emissions from imported electricity and heat
consumption from outside the city boundary owing to the lack of data on the energy mix in the
generation of imported electricity.
19
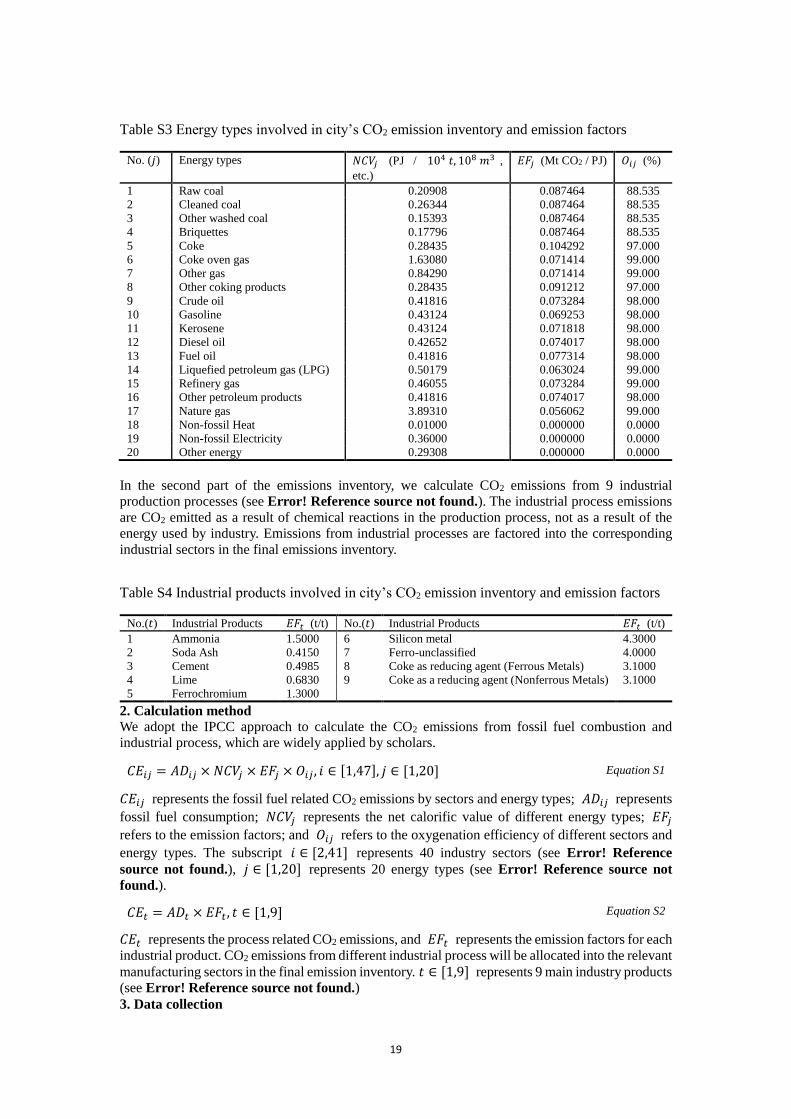
Table S3 Energy types involved in city’s CO2 emission inventory and emission factors
No. (𝑗) Energy types 𝑁𝐶𝑉𝑗 (PJ / 104 𝑡, 108 𝑚3 ,
etc.)
𝐸𝐹𝑗 (Mt CO2 / PJ) 𝑂𝑖𝑗 (%)
1 Raw coal 0.20908 0.087464 88.535
2 Cleaned coal 0.26344 0.087464 88.535
3 Other washed coal 0.15393 0.087464 88.535
4 Briquettes 0.17796 0.087464 88.535
5 Coke 0.28435 0.104292 97.000
6 Coke oven gas 1.63080 0.071414 99.000
7 Other gas 0.84290 0.071414 99.000
8 Other coking products 0.28435 0.091212 97.000
9 Crude oil 0.41816 0.073284 98.000
10 Gasoline 0.43124 0.069253 98.000
11 Kerosene 0.43124 0.071818 98.000
12 Diesel oil 0.42652 0.074017 98.000
13 Fuel oil 0.41816 0.077314 98.000
14 Liquefied petroleum gas (LPG) 0.50179 0.063024 99.000
15 Refinery gas 0.46055 0.073284 99.000
16 Other petroleum products 0.41816 0.074017 98.000
17 Nature gas 3.89310 0.056062 99.000
18 Non-fossil Heat 0.01000 0.000000 0.0000
19 Non-fossil Electricity 0.36000 0.000000 0.0000
20 Other energy 0.29308 0.000000 0.0000
In the second part of the emissions inventory, we calculate CO2 emissions from 9 industrial
production processes (see Error! Reference source not found.). The industrial process emissions
are CO2 emitted as a result of chemical reactions in the production process, not as a result of the
energy used by industry. Emissions from industrial processes are factored into the corresponding
industrial sectors in the final emissions inventory.
Table S4 Industrial products involved in city’s CO2 emission inventory and emission factors
No.(𝑡) Industrial Products 𝐸𝐹𝑡 (t/t) No.(𝑡) Industrial Products 𝐸𝐹𝑡 (t/t)
1 Ammonia 1.5000 6 Silicon metal 4.3000
2 Soda Ash 0.4150 7 Ferro-unclassified 4.0000
3 Cement 0.4985 8 Coke as reducing agent (Ferrous Metals) 3.1000
4 Lime 0.6830 9 Coke as a reducing agent (Nonferrous Metals) 3.1000
5 Ferrochromium 1.3000
2. Calculation method
We adopt the IPCC approach to calculate the CO2 emissions from fossil fuel combustion and
industrial process, which are widely applied by scholars.
𝐶𝐸𝑖𝑗 represents the fossil fuel related CO2 emissions by sectors and energy types; 𝐴𝐷𝑖𝑗 represents
fossil fuel consumption; 𝑁𝐶𝑉𝑗 represents the net calorific value of different energy types; 𝐸𝐹𝑗
refers to the emission factors; and 𝑂𝑖𝑗 refers to the oxygenation efficiency of different sectors and
energy types. The subscript 𝑖 ∈ [2,41] represents 40 industry sectors (see Error! Reference
source not found.), 𝑗 ∈ [1,20] represents 20 energy types (see Error! Reference source not
found.).
𝐶𝐸𝑡 = 𝐴𝐷𝑡 × 𝐸𝐹𝑡, 𝑡 ∈ [1,9] Equation S2
𝐶𝐸𝑡 represents the process related CO2 emissions, and 𝐸𝐹𝑡 represents the emission factors for each
industrial product. CO2 emissions from different industrial process will be allocated into the relevant
manufacturing sectors in the final emission inventory. 𝑡 ∈ [1,9] represents 9 main industry products (see Error! Reference source not found.)
3. Data collection
𝐶𝐸𝑖𝑗 = 𝐴𝐷𝑖𝑗 × 𝑁𝐶𝑉𝑗 × 𝐸𝐹𝑗 × 𝑂𝑖𝑗 , 𝑖 ∈ [1,47], 𝑗 ∈ [1,20] Equation S1

20
3.1 Activity data
We need energy balance table, sectoral energy consumption for industry enterprises by energy types,
and Industrial products’ production to calculate the city’s CO2 emission inventory. The data are
collected from cities’ statistical yearbooks. However, due to the data limitation at city-level, some
necessary data is missing (see Error! Reference source not found.). We deduce the missing data
in the following ways.
Table S5 Data availability of 13 case cities
City
Energy
balance
table
Sectoral energy consumption for ADS
industry enterprises by energy types Industry products’ production
Shanghai Yes Yes For the whole industry enterprises
Beijing Yes Yes For the whole industry enterprises
Chongqing Yes Yes For the whole industry enterprises
Tianjin Yes Yes For the whole industry enterprises
Shenyang N/A Yes For the whole industry enterprises
Dalian N/A Yes For the whole industry enterprises
Ningbo N/A Yes For ADS industry enterprises
Qingdao N/A Yes For ADS industry enterprises
Harbin N/A Yes For the whole industry enterprises
Xi’an N/A Yes For ADS industry enterprises
Shijiazhuang N/A Yes For the whole industry enterprises
Tangshan Yes Yes For ADS industry enterprises
Hengshui N/A Yes For ADS industry enterprises
Note: The abbreviation “ADS” is short for “above-designated-size” in this paper.
1.1.1 Energy balance table
For most city in China, there is no energy balance table in the city’s statistical yearbook, such as
Shenyang, Dalian, Ningbo, Harbin, Xi’an, Shijiazhuang, and Hengshui in our case. We deduce the
city’s basic energy balance table from the corresponding provincial energy balance table. We divide
the provincial energy balance table by the corresponding percentage of one city takes in its province
to get the city’s energy balance table.
1.1.2 Energy consumption for industry sectors
Almost every city statistics the sectoral energy consumption for ADS (above-designated-size)
industry enterprises by energy types in the city’s statistical yearbook, such as all the 13 case cities
in this paper. We expand the sectoral energy consumption for ADS enterprises by whole industry
energy consumption to get the sectoral energy consumption for the whole industry.
1.1.3 Industry products’ production
The city’s statistical yearbook statistics industry products’ production as well. If the production is
for ADS industry enterprises (such as Ningbo, Harbin, Xi’an, Tangshan, and Hengshui), we expand
the production to the whole industry enterprises by the city’s whole industry output to ADS industry
output ratio.
3.2 Emission factors
To calculate the CO2 emissions from energy consumption, we collect 𝑁𝐶𝑉𝑗, 𝐸𝐹𝑗, and 𝑂𝑖𝑗 from
our latest research, which are measured based on 602 coal sample from the 100 largest coal-mining
areas in China. The measured emission factors are assumed to be more accurate compare with IPCC
and default value (see Error! Reference source not found.). The emissions factors for 9 industrial
products are collected from IPCC and National Development and Reform Commission (NDRC)
in China, shown in Error! Reference source not found..
4. Production-based CO2 emission inventory
Based on the methodology provided above, we get the production-based CO2 emission inventory
for the thirteen cities in China (see Error! Reference source not found.). The carbon emissions
from urban and rural residents’ energy consumption are shown in the table, although they are not
included in this study.

21
Table S6 Production-based CO2 emission inventory for 13 cities
Beijin
g
Shanghai Tianji
n
Chon
gqing
Dalia
n
Harbi
n
Ning
bo
Qing
dao
Sheny
ang
Shijia
zhuan
g
Tangs
han
Xian Hengs
hui
Farming, Forestry, Animal Husbandry, Fishery and
Water Conservancy
1.24 1.19 0.92 5.17 1.07 2.20 0.97 1.06 0.73 0.21 0.61 0.19 0.07
Coal Mining and Dressing 0.02 0.00 0.00 7.56 0.00 0.08 0.00 0.00 13.15 0.11 11.09 0.00 0.00
Petroleum and Natural Gas Extraction 0.31 0.00 0.84 0.11 0.00 0.00 0.00 0.00 0.00 0.00 0.49 0.00 0.00
Ferrous Metals Mining and Dressing 0.04 0.00 0.00 0.11 0.00 0.00 0.00 0.01 0.00 0.04 0.30 0.00 0.00
Nonferrous Metals Mining and Dressing 0.00 0.00 0.00 0.01 0.00 0.02 0.00 0.03 0.00 0.04 0.00 0.04 0.00
Non-metal Minerals Mining and Dressing 0.04 0.00 0.11 0.30 0.08 0.00 0.00 0.15 0.06 2.90 0.06 0.00 0.00
Other Minerals Mining and Dressing 0.00 0.00 0.00 0.00 0.00 0.00 0.00 0.00 0.00 0.13 0.00 0.00 0.00
Logging and Transport of Wood and Bamboo 0.00 0.00 0.00 0.00 0.00 0.00 0.00 0.00 0.00 0.00 0.00 0.00 0.00
Food Processing 0.13 0.09 0.05 0.10 0.39 0.32 0.09 0.62 0.54 3.31 0.03 0.46 0.06
Food Production 0.11 0.22 0.07 0.11 0.07 0.37 0.10 0.34 0.19 1.34 0.04 0.14 0.02
Beverage Production 0.25 0.09 0.16 0.11 0.23 0.37 0.09 0.25 0.30 0.25 0.04 0.28 0.06
Tobacco Processing 0.00 0.00 0.01 0.02 0.00 0.12 0.00 0.00 0.01 0.02 0.00 0.00 0.00
Textile Industry 0.06 0.25 0.09 0.21 0.06 0.13 1.10 0.68 0.06 2.29 0.01 0.06 0.06
Garments and Other Fibre Products 0.08 0.13 0.04 0.01 0.16 0.00 0.34 0.38 0.08 0.90 0.00 0.00 0.01
Leather, Furs, Down and Related Products 0.00 0.01 0.01 0.01 0.01 0.00 0.02 0.32 0.15 2.36 0.00 0.00 0.02
Timber Processing, Bamboo, Cane, Palm Fibre &
Straw Products
0.01 0.03 0.03 0.01 0.02 0.11 0.03 0.09 0.12 1.14 0.00 0.01 0.06
Furniture Manufacturing 0.03 0.03 0.02 0.00 0.10 0.02 0.03 0.13 0.13 1.87 0.00 0.00 0.00
Papermaking and Paper Products 0.09 0.24 0.07 0.34 0.13 0.17 2.04 0.57 0.10 2.28 0.48 0.93 0.02
Printing and Record Medium Reproduction 0.06 0.06 0.01 0.01 0.01 0.05 0.07 0.07 0.04 0.09 0.01 0.01 0.00
Cultural, Educational and Sports Articles 0.01 0.05 0.01 0.00 0.00 0.01 0.10 0.11 0.01 0.11 0.00 0.00 0.01
Petroleum Processing and Coking 2.88 6.78 3.37 0.63 2.64 17.16 5.78 2.39 1.87 2.89 1.60 2.15 0.01
Raw Chemical Materials and Chemical Products 4.74 2.67 1.82 5.78 2.15 0.14 0.69 4.07 2.45 9.13 2.18 1.22 1.15
Medical and Pharmaceutical Products 0.08 0.11 0.09 0.21 0.10 1.21 0.03 0.09 1.20 0.17 0.01 0.09 0.04
Chemical Fibre 0.00 0.03 0.00 0.00 0.00 0.18 0.56 0.00 0.00 0.04 0.00 0.00 0.00
Rubber Products 0.02 0.12 0.12 0.05 0.06 0.00 0.08 0.96 0.23 0.17 0.02 0.01 0.06
Plastic Products 0.04 0.19 0.06 0.03 0.06 0.02 0.31 0.18 0.16 2.02 0.04 0.02 0.01
Non-metal Mineral Products 1.69 1.22 0.98 4.58 3.20 2.50 0.82 1.62 2.42 32.97 2.22 0.57 0.10

22
Smelting and Pressing of Ferrous Metals 1.68 5.25 4.51 1.76 1.83 0.13 0.59 1.29 0.37 6.41 6.75 0.13 0.12
Smelting and Pressing of Nonferrous Metals 0.02 0.27 0.06 0.54 0.01 0.09 0.46 0.08 1.06 0.71 0.01 0.02 0.00
Metal Products 0.08 0.31 0.19 0.08 0.08 0.16 0.46 0.31 0.50 3.65 0.14 0.02 0.11
Ordinary Machinery 0.17 0.61 0.24 0.40 0.84 0.22 0.95 0.98 1.07 2.22 0.20 0.16 0.05
Equipment for Special Purposes 0.18 0.15 0.07 0.10 0.12 0.10 0.21 0.31 0.56 0.49 0.04 0.25 0.02
Transportation Equipment manufacturing 0.33 0.56 0.28 1.03 0.38 1.25 0.41 0.39 0.81 0.10 0.07 0.81 0.02
Electric Equipment and Machinery 0.05 0.19 0.08 0.07 0.07 0.22 0.42 0.61 0.61 0.00 0.01 0.07 0.03
Electronic and Telecommunications Equipment 0.05 0.12 0.08 0.01 0.08 0.00 0.12 0.11 0.04 0.15 0.00 0.10 0.00
Instruments, Meters, Cultural and Office Machinery 0.02 0.02 0.01 0.03 0.01 0.07 0.07 0.03 0.02 0.01 0.00 0.03 0.00
Other Manufacturing Industry 0.15 0.03 0.03 0.02 0.02 0.00 0.06 0.20 0.16 0.01 0.00 0.05 0.01
Scrap and waste 0.01 0.02 0.01 0.01 0.00 0.00 0.02 0.00 0.00 2.25 0.00 0.00 0.00
Production and Supply of Electric Power, Steam and
Hot Water (Electricity generation)
38.41 74.23 51.58 38.01 18.55 22.81 47.4
3
17.81 38.87 0.02 43.04 9.79 6.40
Production and Supply of Gas 0.04 1.57 0.01 0.01 0.10 3.91 0.00 0.52 0.00 0.00 0.00 0.01 0.00
Production and Supply of Tap Water 0.01 0.00 0.00 0.00 0.02 0.03 0.01 0.00 0.04 0.00 0.00 0.01 0.00
Construction 1.19 2.20 1.09 0.89 0.58 0.05 0.54 0.37 0.47 0.20 0.10 0.27 0.03
Transportation, Storage, Post and Telecommunication
Services
13.99 37.36 6.69 8.71 14.09 5.12 3.83 11.58 7.05 2.72 3.19 3.75 0.54
Wholesale, Retail Trade and Catering Services 4.18 4.37 4.59 1.04 0.32 3.04 0.37 0.86 0.47 0.27 0.62 2.52 0.05
Others 8.82 5.56 1.63 0.23 0.78 0.61 0.30 1.00 1.01 0.86 0.80 0.26 0.18
Urban 8.05 5.16 2.47 1.92 1.07 1.82 0.82 1.47 1.46 1.05 0.28 1.59 0.27
Rural 3.58 1.98 0.94 2.33 0.37 0.32 0.48 0.29 0.39 1.40 2.71 0.30 0.83
Total Consumption 92.95 153.47 83.44 82.68 49.85 65.13 70.7
8
52.35 79.00 89.28 77.22 26.34 10.44

23