contextual design for mobile technology jennifer ockerman, ph.d. georgia institute of technology...
TRANSCRIPT
Contextual Design for Mobile Technology
Jennifer Ockerman, Ph.D.Georgia Institute of
TechnologyAtlanta, GA USA
Based on Contextual Design: Defining Customer Centered Systems, byHugh Beyer and Karen Holtzblatt, 1998, Morgan Kaufmann Publishers
Contextual Design Timeline Contextual Inquiry (CI) Modeling Work
Individual Organization
Redesigning Work Designing Technology Usability Studies
Principles of Contextual Inquiry
Chapters 2 & 3
Gathering Customer Data Why?
Many Problems with Software / IT Systems Can Be Traced Back to Problems With Requirements
Also True of Other Types of Systems Theory
Better Customer Contact Better Data Better Design
What Sort of Data Do We Want?
Accurate Data Appropriate Data
Relevant to Design Not Just Averages / Aggregate Data e.g. Marketing Data Not Always Useful:
May Say What People Will BUY,Not How To Design It
Detailed Data Specific Enough to Answer Design Trade-
Offs e.g. Marketing Data Usually Pretty Broad
Why Is GatheringCustomer Data Hard? I
Customers Focused on Current Operations Tend to Suggest Small Fixes May Not Have Ever Thought of Significantly
Different Way of Doing Task Customers Tend to Give Partial Input
Tendency to Focus on Parts of Task They Have to Think About
Aren’t Aware of All the Contextual Factors Aren’t Aware of All Their Skills
Procedural vs Declarative Knowledge
Example of Unnoticed Data
“An entire project team hangs out in the hallway outside their offices
every morning and chats over coffee and donuts. Does anyone know that this is a critical project coordination
meeting?” If you don’t catch this essential fact,
your information system to enable telecommuting may be unsuccessful.
Why Is GatheringCustomer Data Hard? II
Customers Don’t Get Very Detailed Tend to Generalize Things Often Can’t Even Explain Them Out of
Context Customers May Not Be Very Accurate
Qualitative Statements Relative Statements (e.g. Too Much
Work!) Inaccurate Estimates of Quantities
Example of Poor Data Try Getting Someone to Explain To You
In a Lecture Hall How They: Fly a Plane Drive a Car Run a Warehouse
Domain Experts Are Not Necessarily Good Communicators.
Communicating Out of Context Is Difficult.
Why Is GatheringCustomer Data Hard? III Surveying All The Customers. Who Is Your Customer? Customers Often Have a ‘Frame of
Reference’ Engineers Will Suggest Technical Fixes... Managers Will Suggest Regulatory Fixes… Workers Will Suggest Procedural Changes…
You Have a ‘Frame of Reference’. You Already Are Biased by Design Ideas.
A Cautionary Note...
Don’t Get Ahead of Yourself Your Design Ideas Should Be
Driven By Data -- Not Vice-Versa!
But It’s So Tempting To Sketch Out Some Design Ideas And Show It To Them...
Purpose of Contextual Inquiry Get Data Suitable For Design
Understand Structure of Work Practice…
Get Concrete Understanding of Domain Experts’ Unarticulated Knowledge and Skill
Get Suitably Detailed Data Don’t Accept Generalizations and
Abstractions
‘Textbook’ Contextual Inquiry Each Interview 2-3 Hours 10-20 Interviews (Or More) Follow-Up Design Meetings Practices
Context: Go To Customer’s Workplace Partnership: Talk With Them and Engage Them Interpretation: Develop a Shared Understanding Focus: Direct the Inquiry To Meet Design Needs
Can’t Always Get This! Resource Issues Intrusiveness / Safety Lack of Partnership
So Compensate! Try to Situate Interviewees In Context Use Videotapes and Artifacts Become (Partial) Domain Experts

Conducting an Interview No One Hard-And-Fast Rule No Matter How Curmudgeonly the Interviewee,
Remember That You Are the Interviewer Think About an Appropriate Relationship Model...
Scientist/Subject Interviewer/Interviewee Expert/Novice Guest/Host Master/Apprentice!
They Demonstrate, You Investigate, They Explain… There Will Be Times You Need to Deviate A Bit…
And Play The Part! Won’t Always Work, For Reasons Outside Your Control
No
Yes!
NoNo
No
Note What They Say andWhat They Do Note What They Say
Declarative Knowledge
Note What They Do Ask About It
Create Opportunities To Examine Procedural Knowledge
Create Opportunities To Examine Habitual Behavior
Create Opportunities To Get Greater Detail
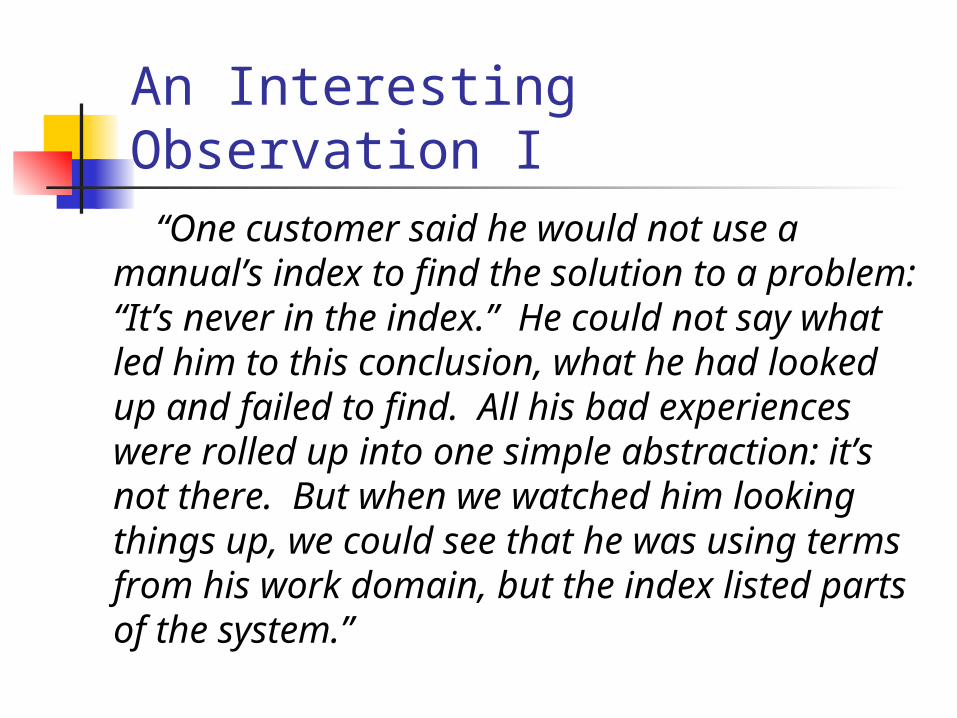
An Interesting Observation I“One customer said he would not use a
manual’s index to find the solution to a problem: “It’s never in the index.” He could not say what led him to this conclusion, what he had looked up and failed to find. All his bad experiences were rolled up into one simple abstraction: it’s not there. But when we watched him looking things up, we could see that he was using terms from his work domain, but the index listed parts of the system.”
An Interesting Observation II
“A customer was unable to describe how she made her monthly report. When asked to create it, she pulled out her last report and started filling in the parts.”
Talking About WorkWhile Doing It
Allows You To Quickly Get Past Generalizations
Allows You To See The Entire Context
Allows You To Develop Some Domain Expertise (and Intuition for Design)
Also Makes Customers Happier
Principles of Contextual Inquiry
Context Partnership Interpretation Focus
First Principle of CI Context: “Go to the Customer’s
Workplace and See the Work As It Unfolds” Summary vs Ongoing Experience
Get Around Generalizations! See Things From Multiple Frames!
Concrete Data vs Abstract Data Normally Abstraction Is a Valuable Skill…
But Does the Customer Have the Right Abstractions?
Get Concrete Data Get Artifacts Don’t Just Aggregate Things
Second Principle of CI Partnership: “Make you and the customer
collaborators in understanding her work.” Use your relationship model to tilt the roles to
one that gets them to give you information Control the interview process -- don’t control
what data is given Play a bit with the relationship model -- you need
data (good apprentice) and also insights into practices (more observant partner, educator)
Withdrawal and return… Describe technology...
Third Principle of CI Interpretation: “giving meaning to
observations” Change ‘data’ into ‘information’ Examine it from many different frames Look for structure, work patterns, etc. From facts, make hypothesizes about
implications, test them out -- and look at implications for design
But don’t bias them -- and listen carefully!“It’s like a travelling office”, you say, looking at how a
salesman has set up his car. “Well -- like a traveling desk,”he responds.
Fourth Principle of CI Focus: “keep the conversation on
useful topics without wresting control entirely away from your customer/expert” Remain objective, on track Like steering a conversation -- gently! Think of it as:
Getting more detail Covering all relevant aspects of the domain
Focus should be pre-specified Capitalize on surprises! Admit ignorance!
Contextual Interview Structure Conventional Interview
Administrative Stuff Transition
Explain the Ground Rules Contextual Interview Proper Wrap-Up
Back-up, Back-out -- What Didn’t You Cover?
More on Contextual Inquiry
Chapters 3 & 4
So What is Contextual Inquiry? A Process by Which To Gather
Customer Data with the Following Objectives:
Get Data About the Structure of Work Practice
Make Unarticulated Knowledge Explicit Capture Details of Habitual, Invisible Work
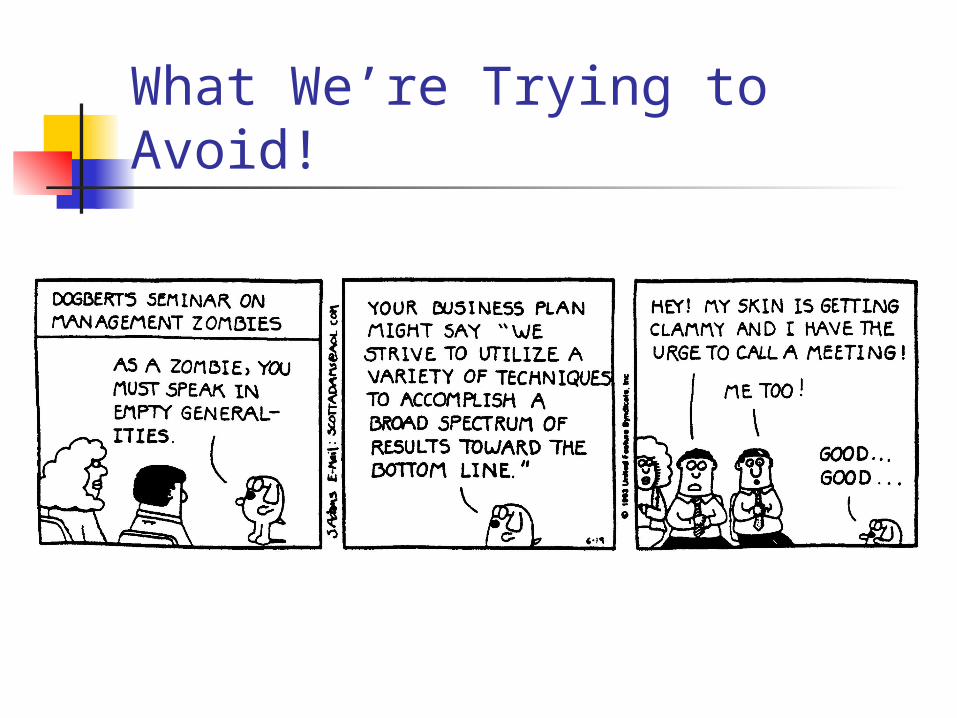
What We’re Trying to Avoid!
Before Interview: Decide on a Focus Focus: 4th Principle of Contextual Inquiry Should Be Decided Upon Before
Interview(s) Will Change As Project Evolves
Narrower or Broader… Different Reference Frames Different Subject Matter
Look for Metaphors And Use Them as Data Collection Tools
Metaphors
E.g. You’re Tasked With Making an On-Line Search and Retrieval System Examine How People Do Search and
Retrieval In a Number of Domains Physical (e.g. Library) On-Line
Use These Outside Studies to Bring Insights to Topic at Hand
Variations in Focus I Designing a Known Product
i.e. Something Already Known and Accepted in the Workplace Expectations Already Exist Competitive Products for Comparison Customer Feedback on Good-and-Bad Need to Add More:
More Functionality More Usability
Variations in Focus II Addressing a New Work Domain
i.e. A Work Domain Created By New Technology and Practices (e.g. Telecommuting, Word Processing, etc.) More Difficult -- No Current Practice to Study Can Study Current Domains, Though! Much of Results of Your Design Will Be
Driven By: Intent and Goals Inherent Structures to Tasks Information Flow Solutions to Historic Technological Limitations
Variations in Focus III New Technology
i.e. How Can I Apply Technology to New Domain? Look at Fundamental Needs of the Domain
Do They Need Technology? How Could the Technology Be Used to Improve
Things? Look at Metaphors Look at Analogous Situations
Variations in Focus IV Designing Information Technology
i.e. Bring Technology Into Data Flow and Coordination Activities of an Organization Implementing IT Requires Knowledge:
How Activities Can Be Integrated ‘Within’ a Single Job Within an Organization
How Information Can / Should Flow What Technology Already Exists What Work Processes Would Work Well
Before Interview: Who to Interview? Who Is Your Customer? Who Is The Worker? How Much Variation Is There?
Culturally Allowably (e.g. Do Workers Have Much
Freedom?) Think Between and Within Departments
How Much Variation Should You Support?
During Interview: Interview Structure Conventional Interview
Administrative Stuff Transition
Explain the Ground Rules Contextual Interview Proper Wrap-Up
Back-up, Back-out -- What Didn’t You Cover?
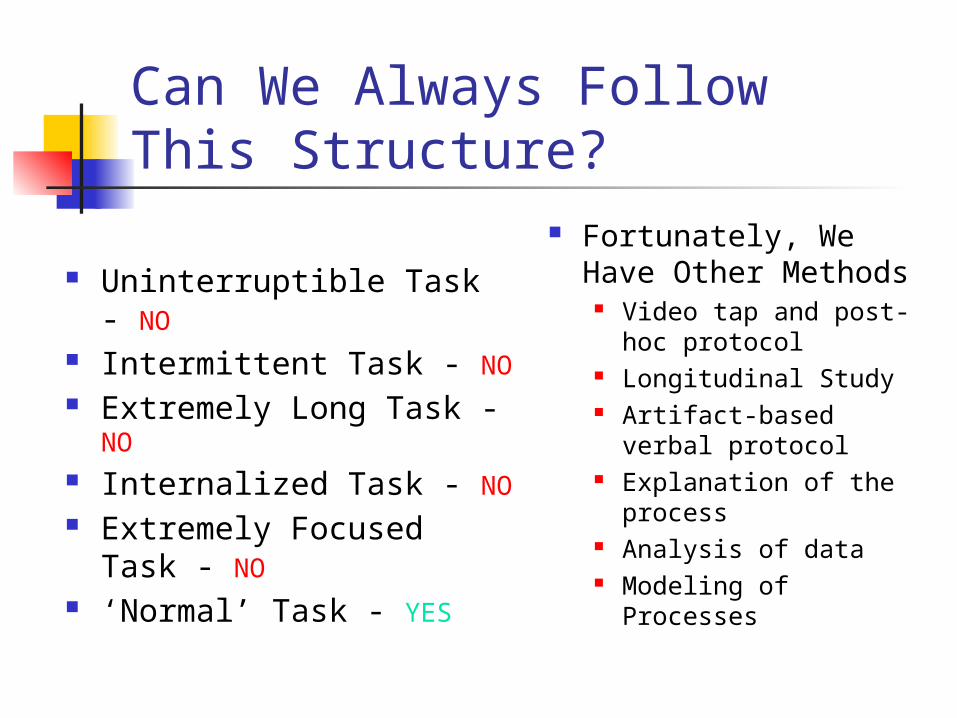
Can We Always Follow This Structure?
Uninterruptible Task - NO Intermittent Task - NO Extremely Long Task - NO Internalized Task - NO Extremely Focused Task -
NO ‘Normal’ Task - YES
Fortunately, We Have Other Methods
Video tap and post-hoc protocol
Longitudinal Study Artifact-based verbal
protocol Explanation of the
process Analysis of data Modeling of Processes
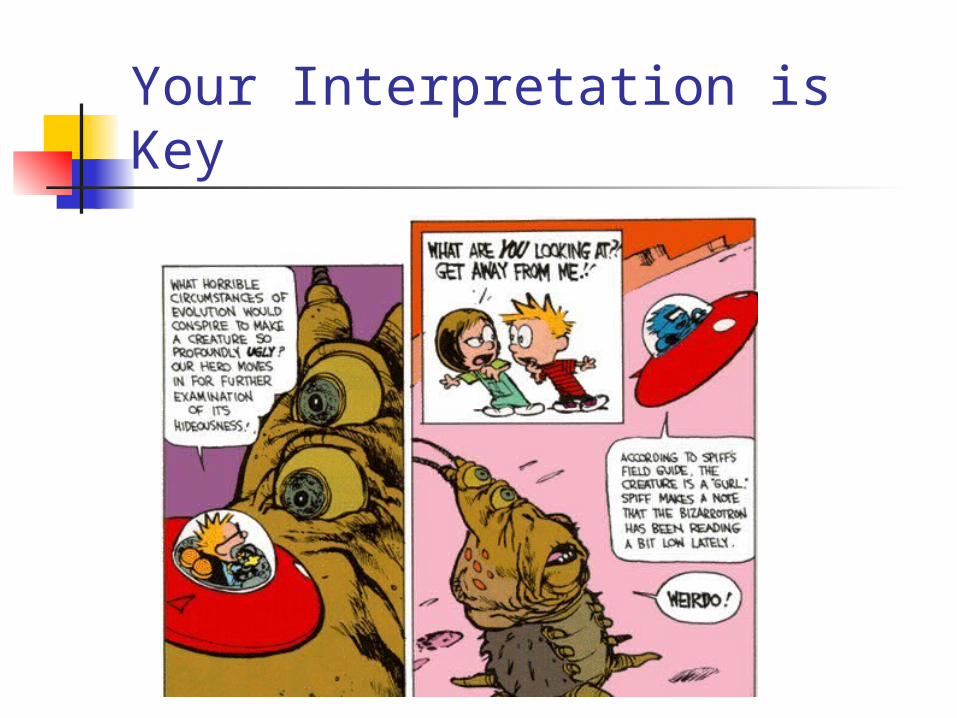
Your Interpretation is Key
Factors Impacting Interpretation
Frames of Reference
Biasesi.e. HOW You Look At Customer Data(and How Customer Looks At Themselves)
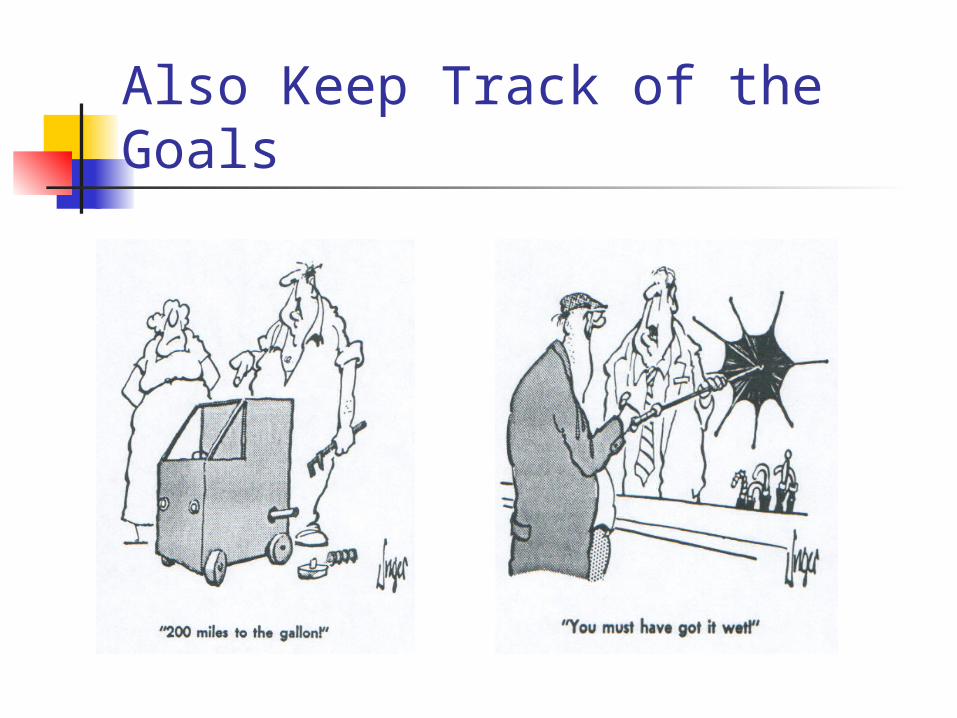
Also Keep Track of the Goals
Modeling Work
Chapters 5, 6 & 7
Building on Contextual Inquiry
“Contextual Inquiry produces huge amounts of detailed knowledge about the customer. This knowledge is critical to system design, but it isn’t amenable to reductive statistical
techniques: you can’t take the average of 20 interviews to identify the ‘typical’ customer.
Work models provide a coherent way of structuring all this detailed data, revealing underlying structure without glossing over
the detail.”
What is Work? Is It Physical Actions? Is It Processing Information? Is It Making Decisions? Is It Communicating Information? Is It Learning New Things?
It May Be All Of The Above -- As Is Appropriate to the Task At Hand
What Is Involved In Work?
Flow (Overall Organization and Coordination)
Sequence (Detailed Model of Actions) Artifact (Detailed Model of Artifact Use) Culture (Schematic of Influences on
Workers) Physical Structure of the Environment
Flow Models of Work
Purpose: Capture and Visualize:
Roles of Individuals Communication and Coordination Mechanisms That Help and Hinder Strategies
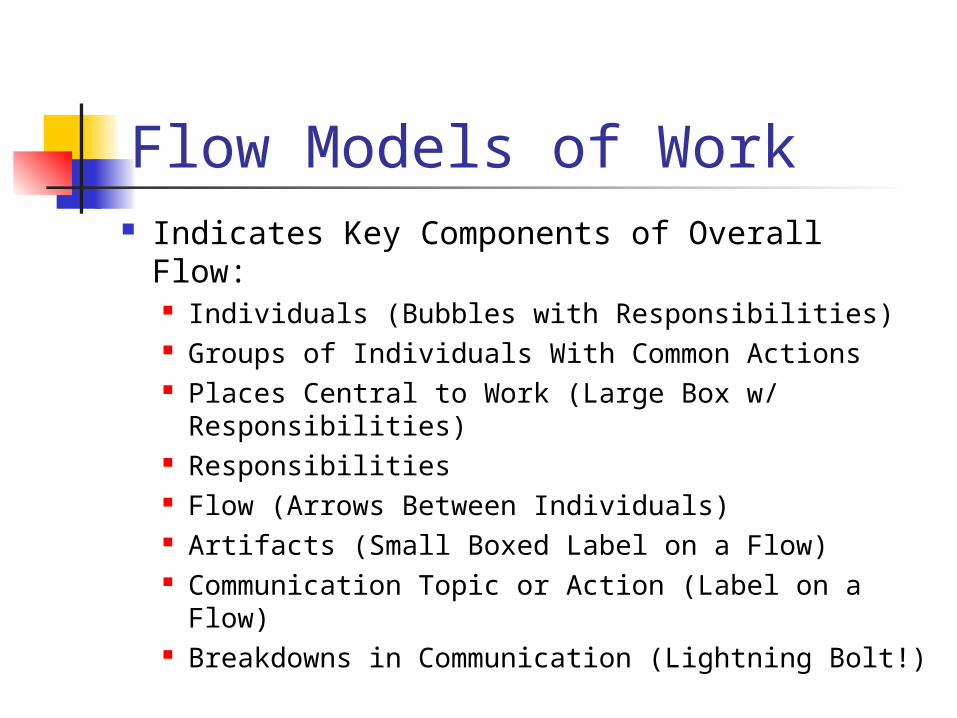
Flow Models of Work Indicates Key Components of Overall Flow:
Individuals (Bubbles with Responsibilities) Groups of Individuals With Common Actions Places Central to Work (Large Box w/
Responsibilities) Responsibilities Flow (Arrows Between Individuals) Artifacts (Small Boxed Label on a Flow) Communication Topic or Action (Label on a Flow) Breakdowns in Communication (Lightning Bolt!)
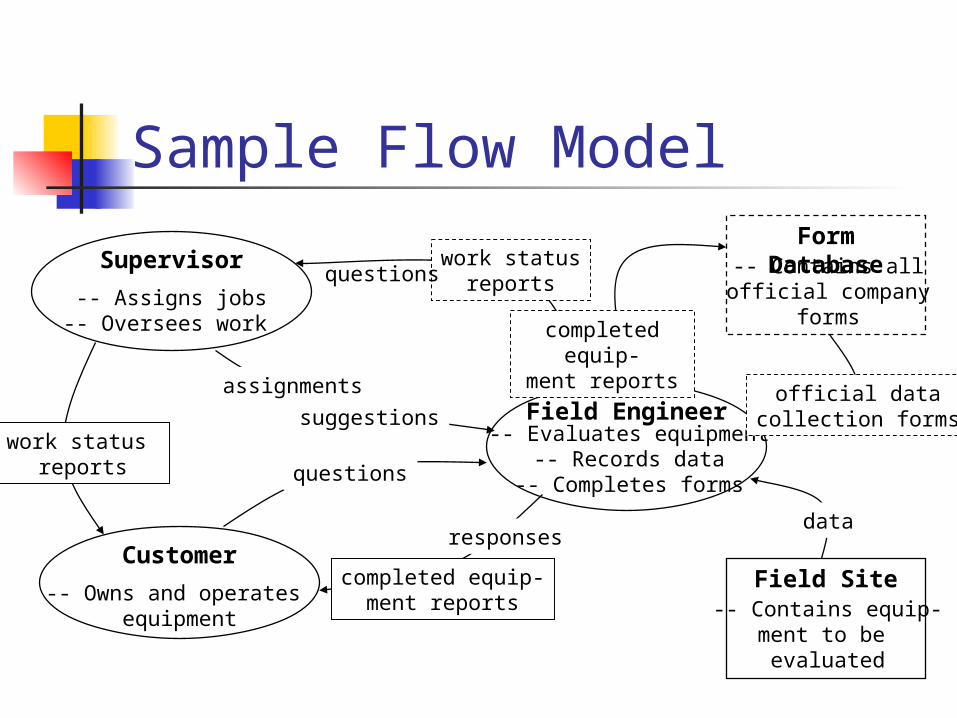
Sample Flow Model
Field Engineer-- Evaluates equipment
-- Records data-- Completes forms
Customer
-- Owns and operates equipment
Supervisor
-- Assigns jobs-- Oversees work
Field Site-- Contains equip-
ment to be evaluated
Form Database-- Contains all
official companyforms
data
questions
responses
completed equip-ment reports
work statusreportsquestions
assignments
suggestionswork status
reports
official datacollection forms
completed equip-ment reports
Flow Models and CI Flow Models Can Hold A Lot Of Information
Contextual Inquiry Gets A Lot of Information! Beyond the Official Org Chart…
Coordination As It Actually Happens Information Flow As It Actually Happens Strategies and Perceived Contributions Roles -- Assigned and Actual -- and Their Basis Informal Structures
Sequence Models of Work Examines The Actions of Workers, and
How/When They Occur By Examining Their Structure, Can
Identify: Their Strategy Their Intent Important Dynamics of the Task
Related to ‘Procedures’
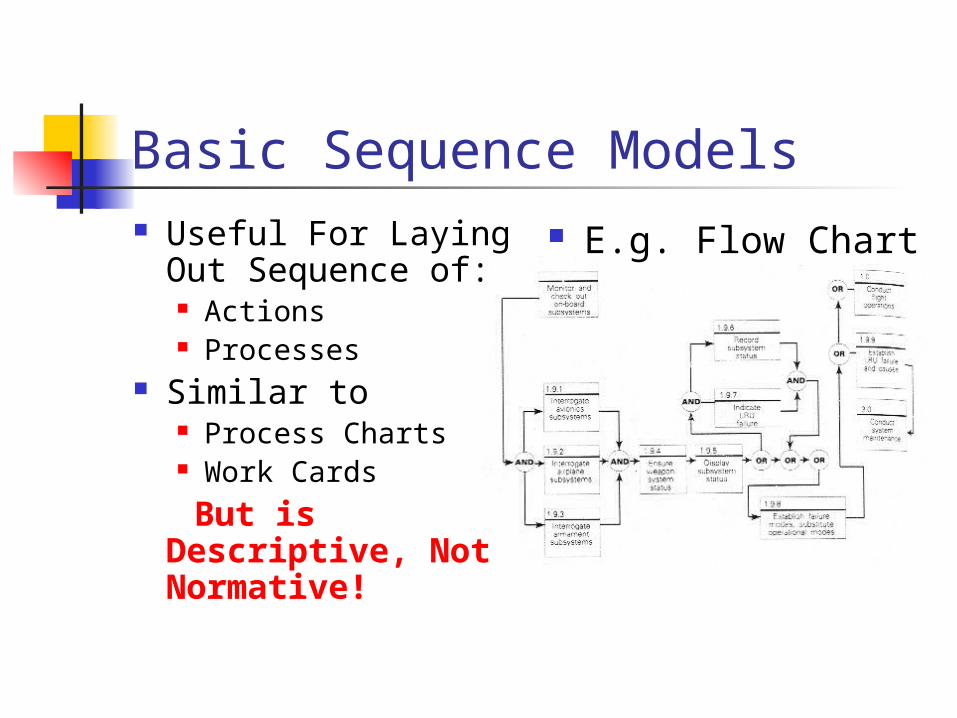
Basic Sequence Models Useful For Laying
Out Sequence of: Actions Processes
Similar to Process Charts Work Cards
But is Descriptive, Not Normative!
E.g. Flow Chart
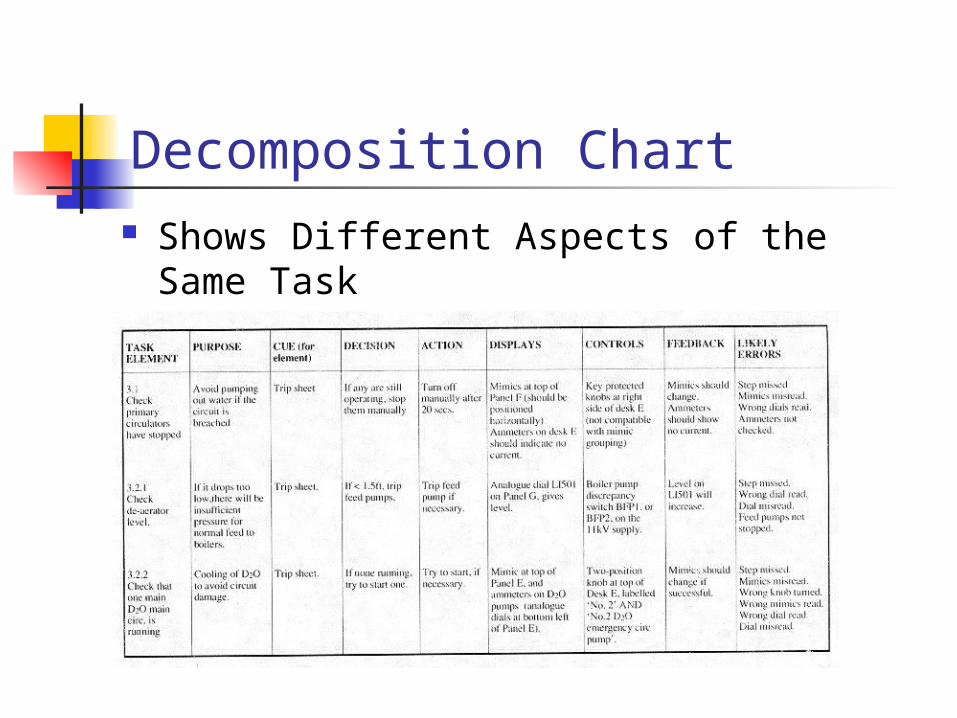
Decomposition Chart Shows Different Aspects of the Same
Task Which Contextual Inquiry Should Provide!
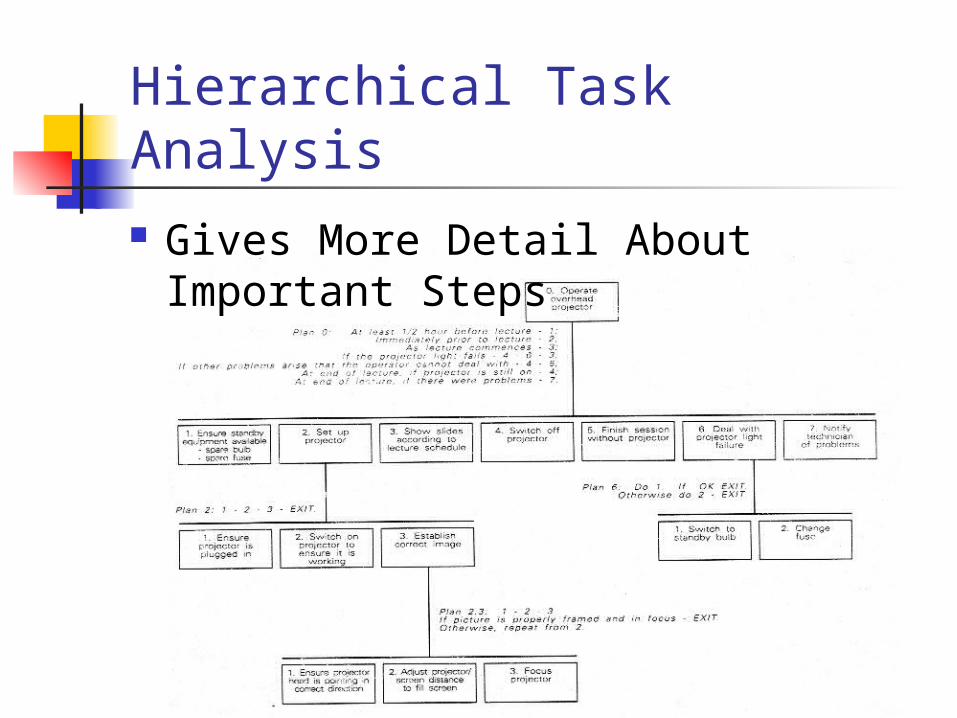
Hierarchical Task Analysis Gives More Detail About Important
Steps
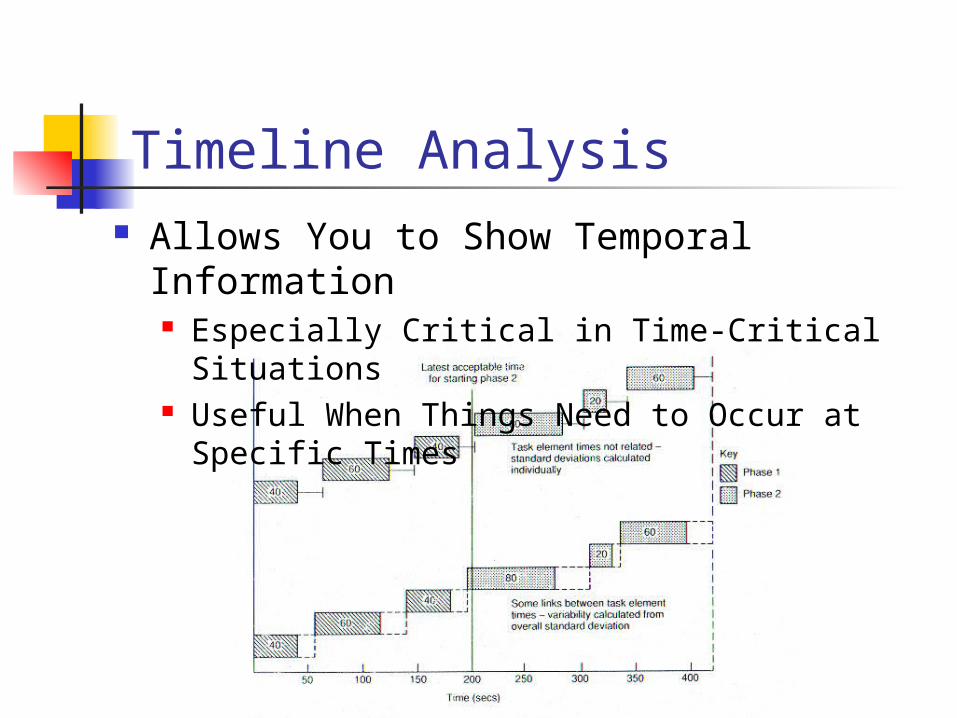
Timeline Analysis Allows You to Show Temporal Information
Especially Critical in Time-Critical Situations Useful When Things Need to Occur at Specific
Times
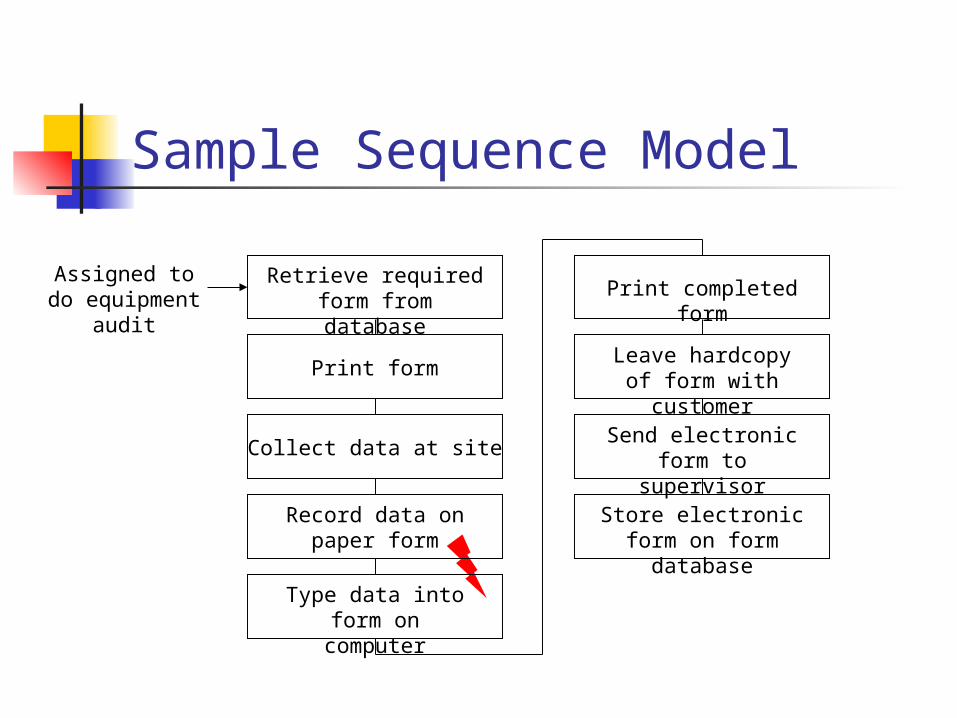
Sample Sequence Model
Print completed form
Leave hardcopy of form with customer
Assigned to do equipment audit
Send electronic form to supervisor
Store electronic form on form database
Retrieve required form from database
Type data into form on computer
Record data onpaper form
Collect data at site
Print form
Artifact Models People Create, Use, Modify Things
During Work Tool or End-Object ‘Official’ or ‘Informal’
Way of Working Can Be Built Right Into Artifact Reveals Strategies, Required
Structures, Information
Distinctions In Artifact Model Usage of Artifact Problems In Using Artifact Information Provided Parts Which Are Distinct In Usage Structure Given To Artifact by Worker Presentation, And How It Supports the Task Annotations!
Tells You What Is Missing From Formal Tools
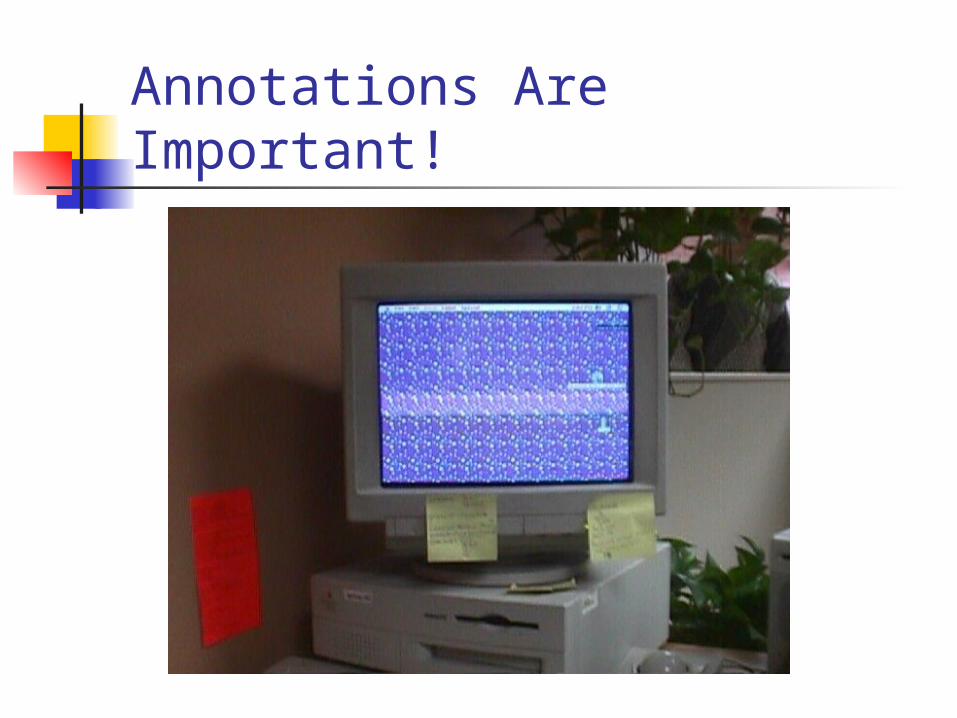
Annotations Are Important!
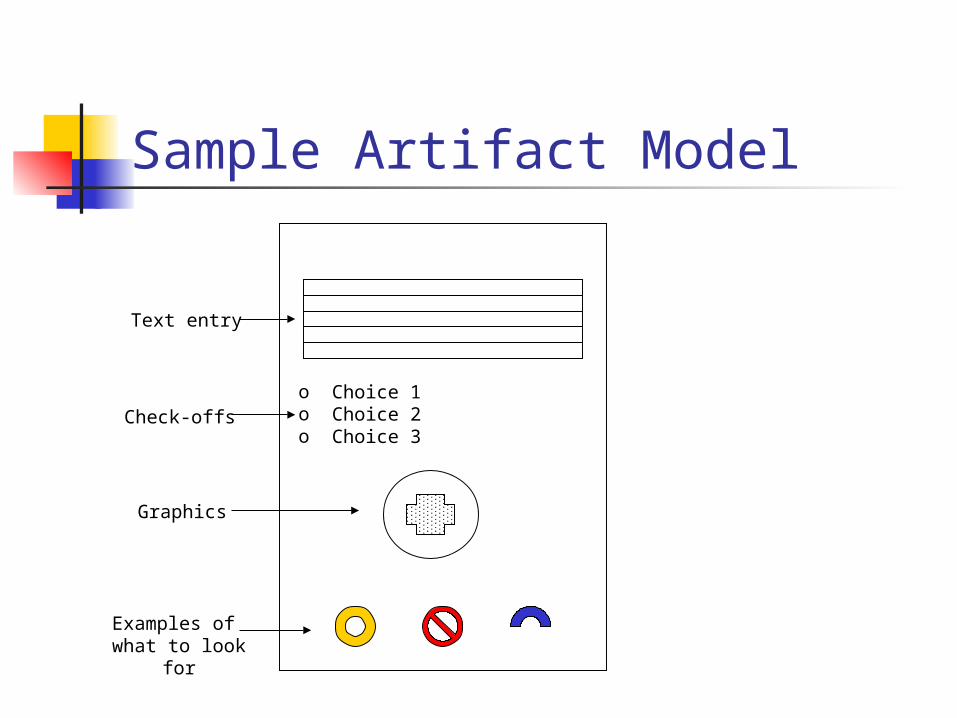
Sample Artifact Model
Text entry
Graphics
Examples of what to look for
o Choice 1o Choice 2o Choice 3
Check-offs
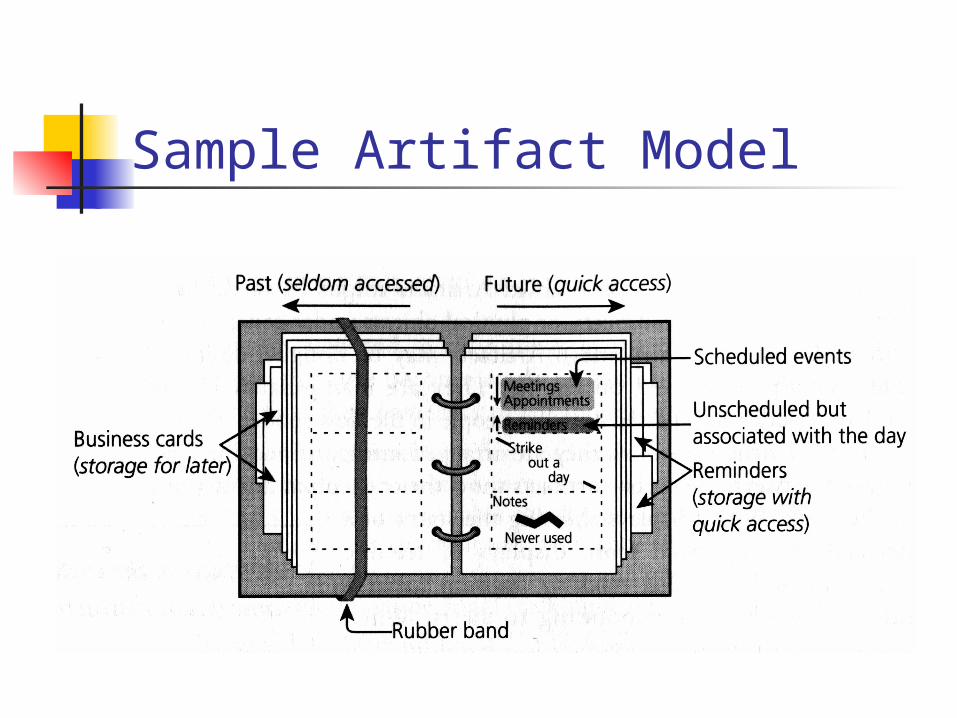
Sample Artifact Model
Importance of Cultural Models Your End-Product Might Work Well In
Theory, But In Practice Wouldn’t Be Used Because Of: Differing Expectations Specific Desires Policies Values Changes In Approach at Organizational
Level
Change exampleFor Example, Webvan Works Well For Me! BUT:
Some People Want to Pick Out Their Food Directly
Some People Won’t Plan A Day Ahead Some People Might View Shopping As
a Social Activity or Out-Of-House Event
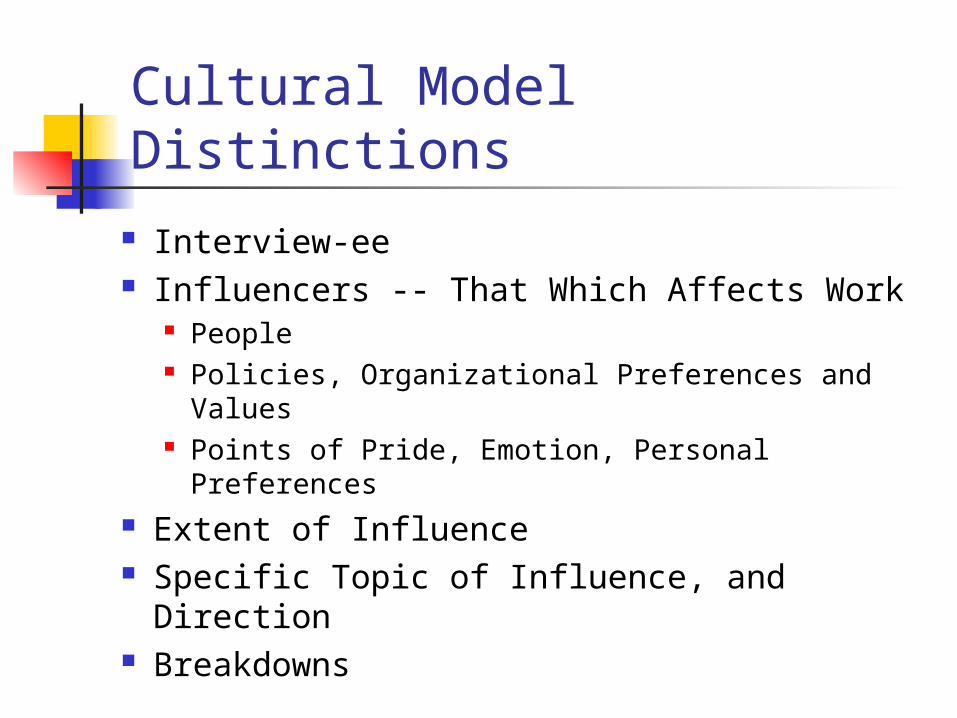
Cultural Model Distinctions
Interview-ee Influencers -- That Which Affects Work
People Policies, Organizational Preferences and Values Points of Pride, Emotion, Personal Preferences
Extent of Influence Specific Topic of Influence, and Direction Breakdowns
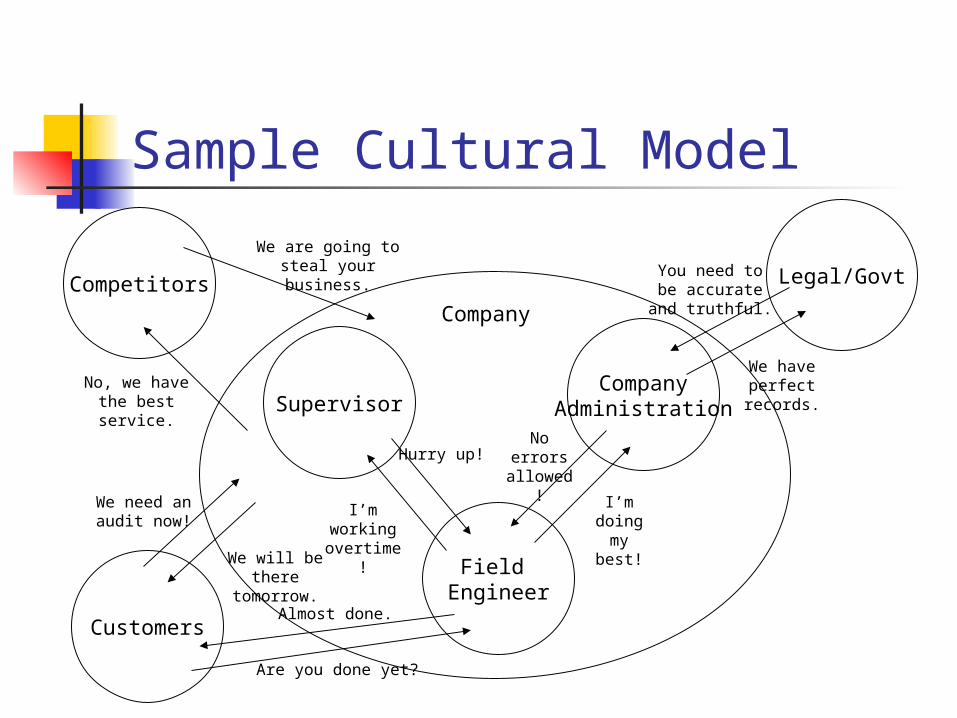
Sample Cultural Model
Customers
Legal/GovtCompetitors
Field Engineer
SupervisorCompany
Administration
Company
You need to be accurate and
truthful.
We have perfect records.
No errors allowed!
I’m doing my best!
Hurry up!
We are going to steal your business.
No, we have the best service.
Are you done yet?
I’m working overtime!
We need an audit now!
Almost done.
We will be there tomorrow.
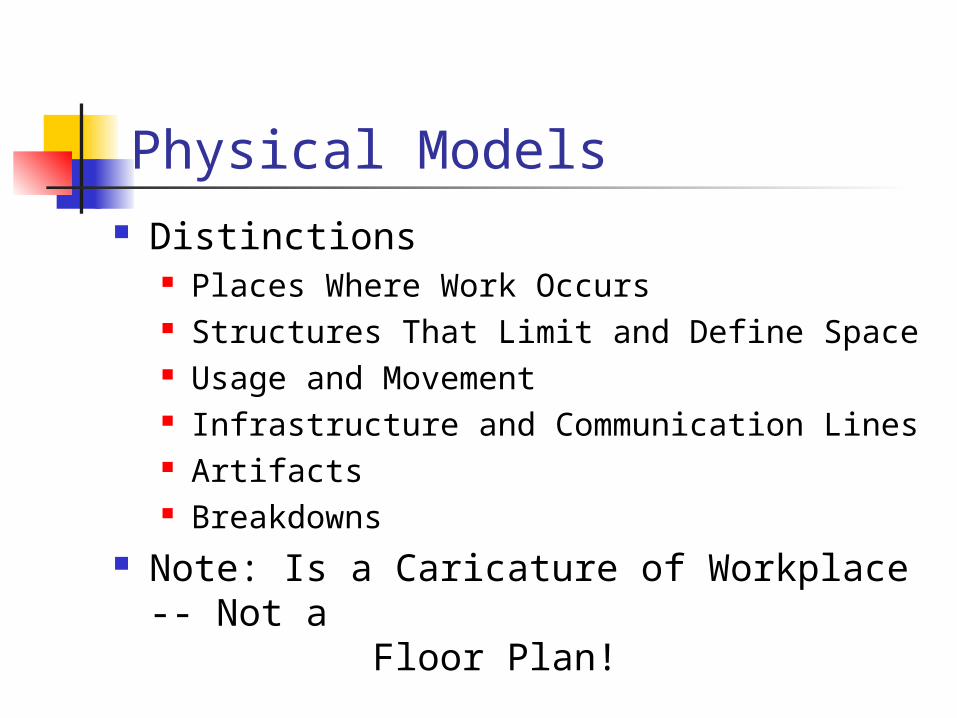
Physical Models Distinctions
Places Where Work Occurs Structures That Limit and Define Space Usage and Movement Infrastructure and Communication Lines Artifacts Breakdowns
Note: Is a Caricature of Workplace -- Not a Floor Plan!

Physical Models From CI Organization of Space
Work Efficiency, or Space Efficiency, or Management Efficiency?
Division of Space Does It Help? Hinder? How Is It Dealt With?
Grouping of People By Function, or by Project, or by Random?
Organization of Workspace Indications for Task Structure?
Movement Do People Move Around Much? Why?
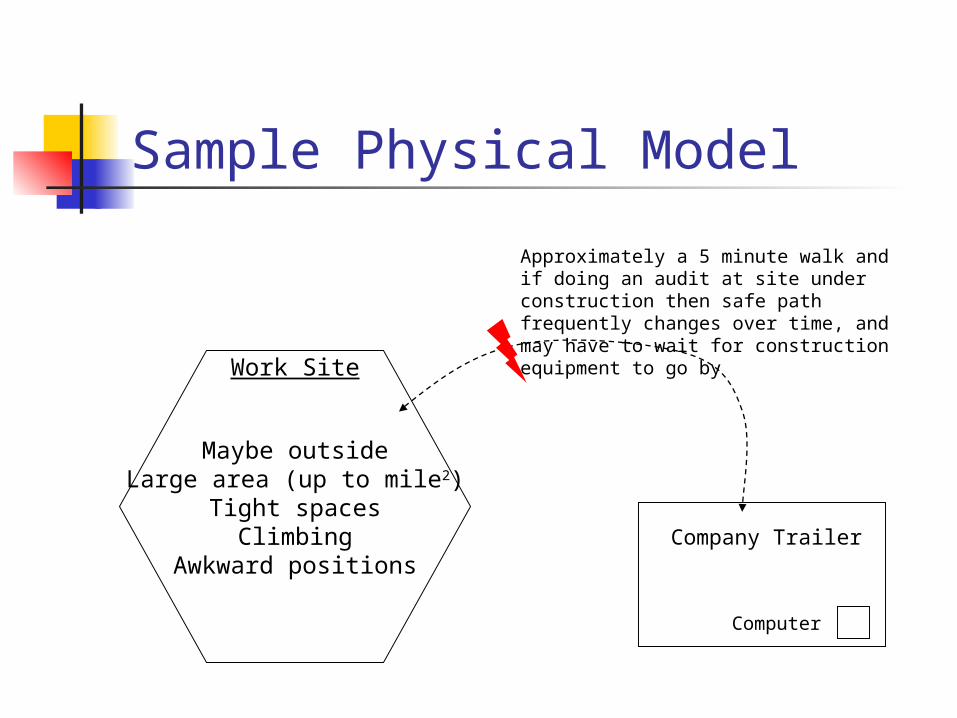
Sample Physical Model
Work Site
Maybe outsideLarge area (up to mile2)
Tight spacesClimbing
Awkward positionsCompany Trailer
Computer
Approximately a 5 minute walk and if doing an audit at site under construction then safe path frequently changes over time, and may have to wait for construction equipment to go by
Using and Applying Work Models
Chapters 7 - 12
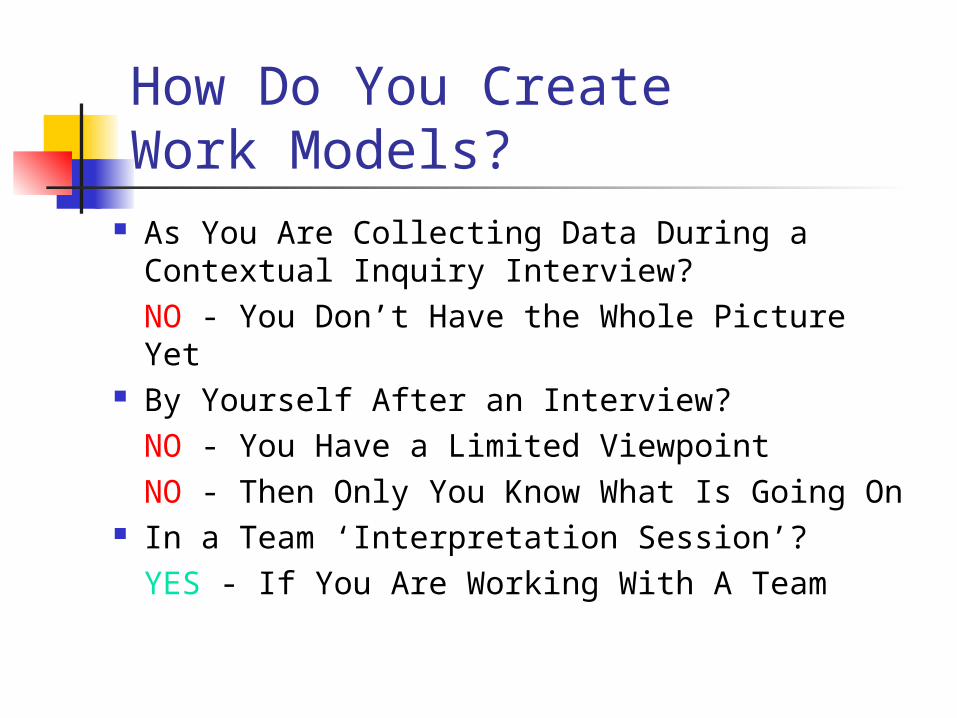
How Do You CreateWork Models?
As You Are Collecting Data During a Contextual Inquiry Interview?NO - You Don’t Have the Whole Picture Yet
By Yourself After an Interview?NO - You Have a Limited ViewpointNO - Then Only You Know What Is Going On
In a Team ‘Interpretation Session’?YES - If You Are Working With A Team
Why Do It Together? Better Data Creates Written Record Effective Cross-Function Cooperation Multiple Perspectives Development of a Shared Perspective True Involvement In The Data Better Use of Time
Running an Interpretation Session
Assign Roles: The Interviewer Work Modelers The Recorder The Moderator Participants & Rat Hole Watchers
Consolidating Your Models
Chapters 8 - 10
So Where Are We Now? We Know How To Gather Data
(Contextual Inquiry) We Know How To Represent Data
From Individuals(Individual Work Models)
How Do We Model the User Population As a Whole!?
Purpose of Design Design for an Entire Customer
Population…
… Meeting Needs of (Most of) the Individuals!
Requires Models of Individual’s Work(Which We Have)
Requires Consolidated Models of Population(Where We Are Now)
Things to Look for in Consolidation How Much Do Users Vary?
Are These ‘Surface’ Differences?Are These ‘Fundamental’ Differences?
Is There a Common Pattern of Work?A Common Mechanism?A Common Artifact?A Common Problem?
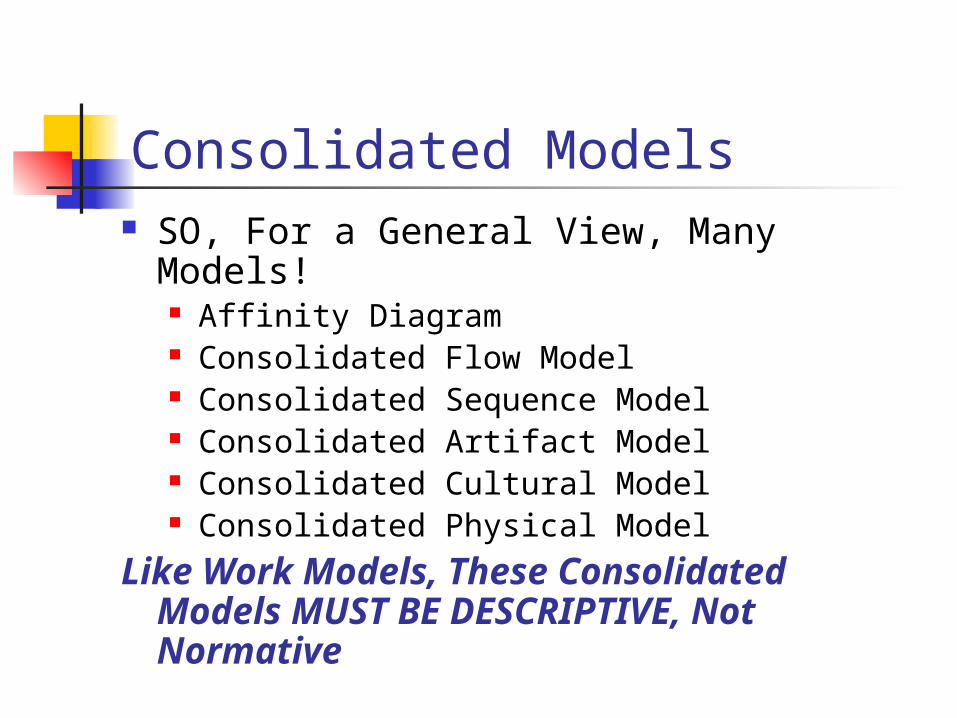
Consolidated Models SO, For a General View, Many Models!
Affinity Diagram Consolidated Flow Model Consolidated Sequence Model Consolidated Artifact Model Consolidated Cultural Model Consolidated Physical Model
Like Work Models, These Consolidated Models MUST BE DESCRIPTIVE, Not Normative

Affinity Diagrams First Step in Consolidation Organizes Individual ‘Notes’ From
Interpretation Sessions Into a Hierarchy Intended to Show Common Issues and
Themes Starts ‘Bottom-Up’ From Data
Allows a Quick Survey of Both Issues and Underlying Data
In Industry, Can Be Huge! Starts at 200 Notes, Up To 1500 and More!
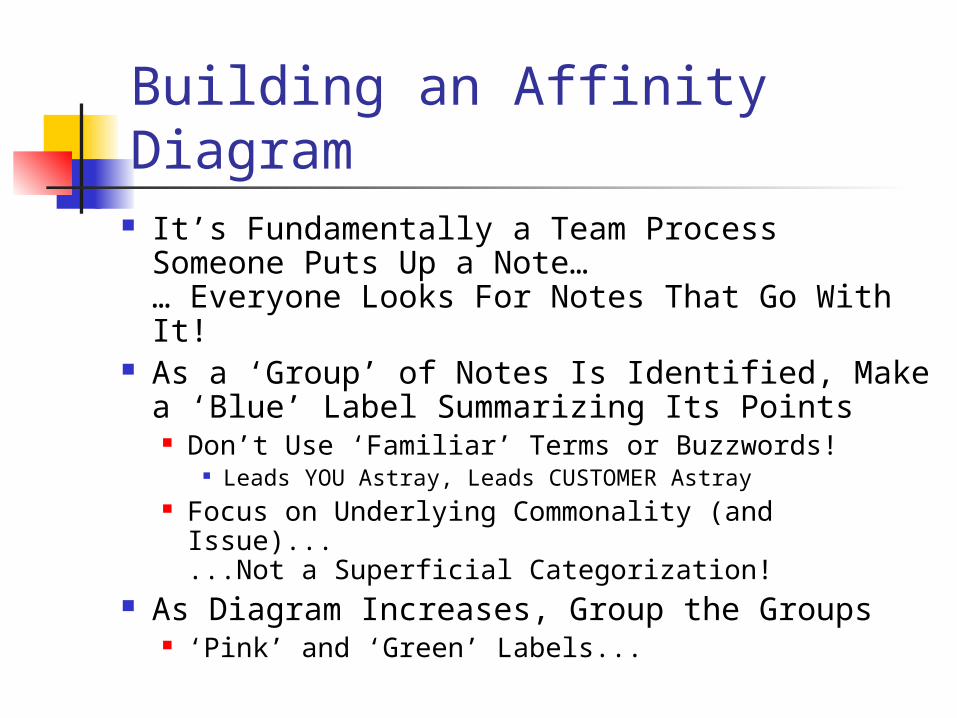
Building an Affinity Diagram It’s Fundamentally a Team Process
Someone Puts Up a Note…… Everyone Looks For Notes That Go With It!
As a ‘Group’ of Notes Is Identified, Make a ‘Blue’ Label Summarizing Its Points Don’t Use ‘Familiar’ Terms or Buzzwords!
Leads YOU Astray, Leads CUSTOMER Astray Focus on Underlying Commonality (and Issue)...
...Not a Superficial Categorization! As Diagram Increases, Group the Groups
‘Pink’ and ‘Green’ Labels...
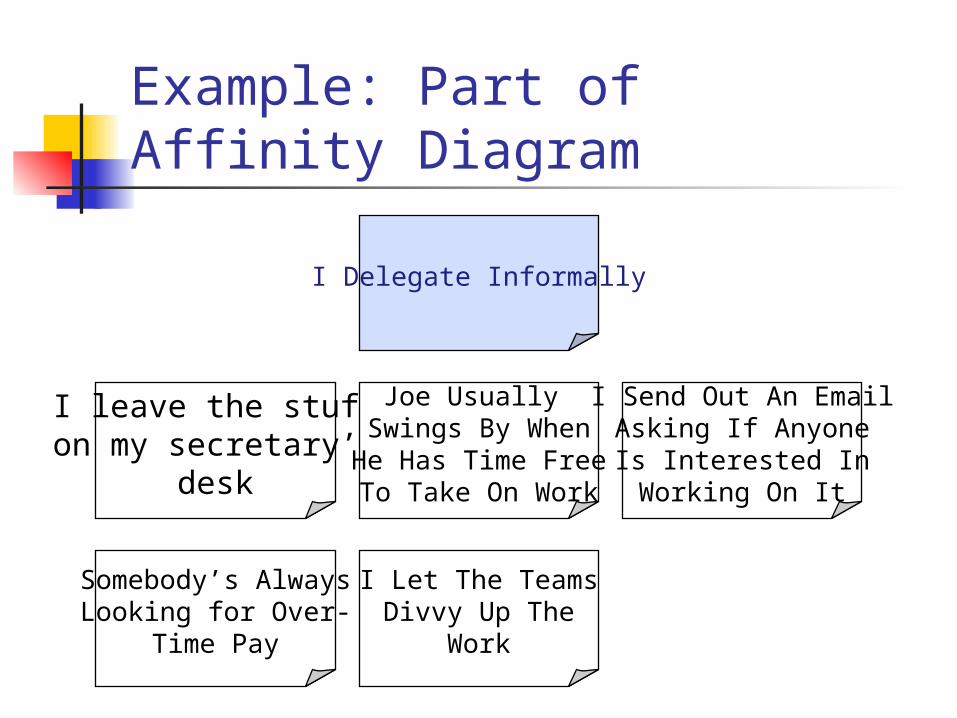
Example: Part of Affinity Diagram
I leave the stuffon my secretary’s
desk
Joe Usually Swings By WhenHe Has Time FreeTo Take On Work
I Send Out An EmailAsking If Anyone
Is Interested InWorking On It
I Let The TeamsDivvy Up The
Work
Somebody’s AlwaysLooking for Over-
Time Pay
I Delegate Informally
We Delegate Our WorkWhy We Delegate
I Don’t Want to Deal With It
I Have Too Much Work
How I Choose WhoWhoever Is Available
The Person With the Job
How I Go About DelegatingI Delegate, But Am Still Responsible
I Give It Away at Meetings
I Delegate Informally
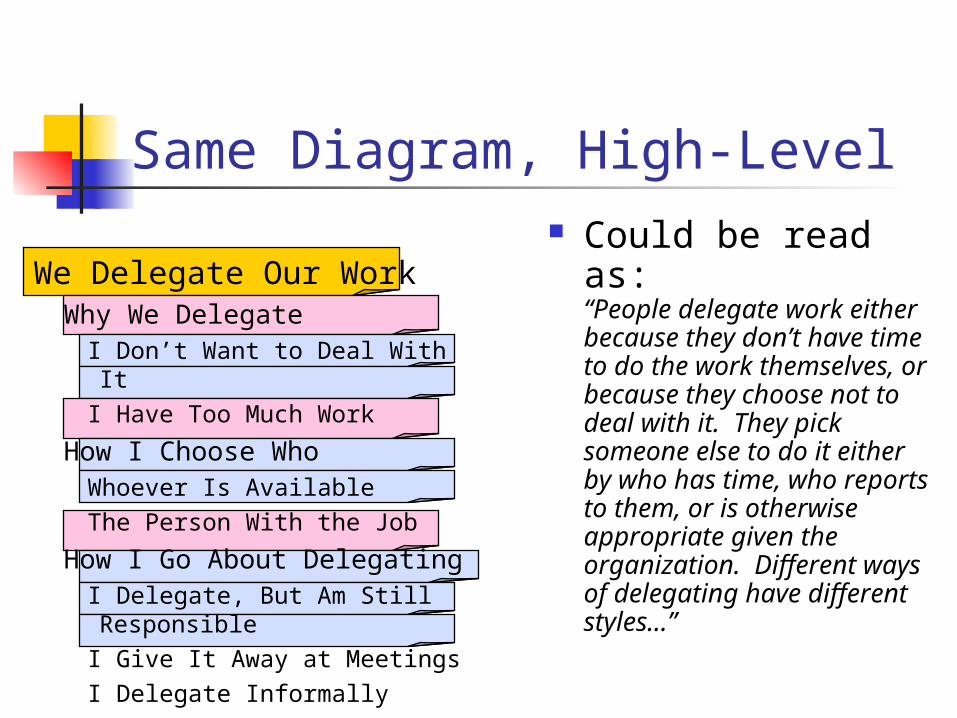
Same Diagram, High-Level Could be read as:
“People delegate work either because they don’t have time to do the work themselves, or because they choose not to deal with it. They pick someone else to do it either by who has time, who reports to them, or is otherwise appropriate given the organization. Different ways of delegating have different styles…”
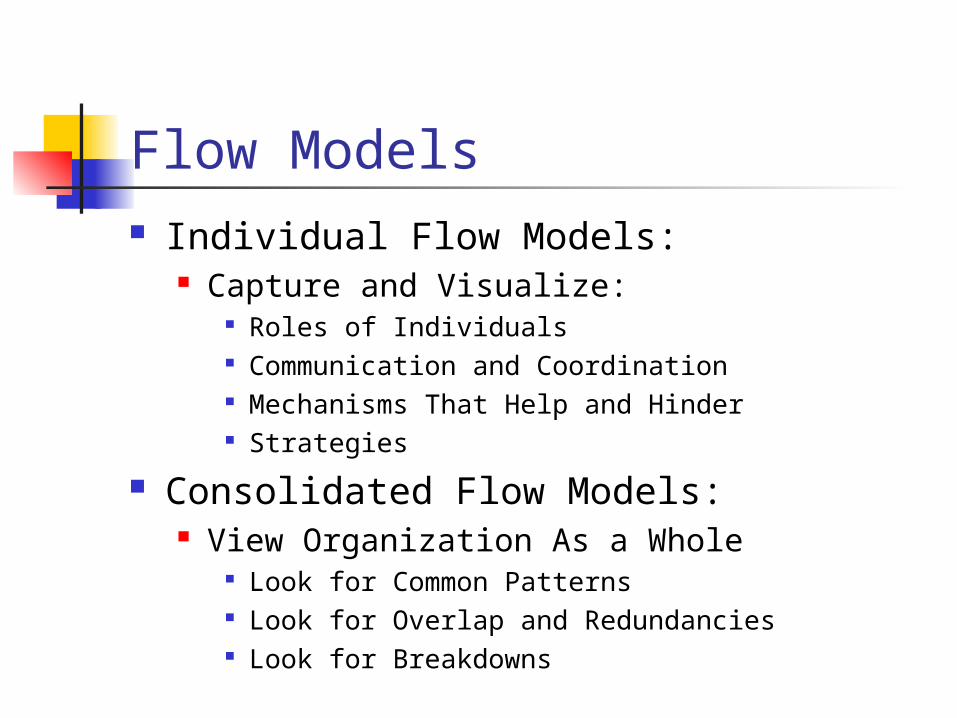
Flow Models Individual Flow Models:
Capture and Visualize: Roles of Individuals Communication and Coordination Mechanisms That Help and Hinder Strategies
Consolidated Flow Models: View Organization As a Whole
Look for Common Patterns Look for Overlap and Redundancies Look for Breakdowns
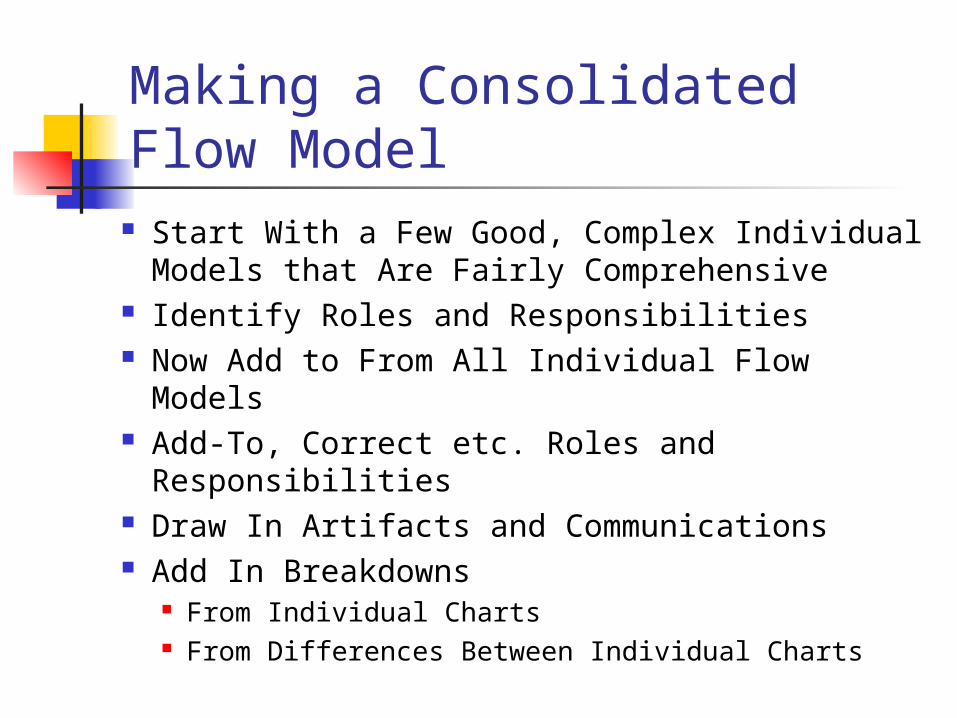
Making a Consolidated Flow Model
Start With a Few Good, Complex Individual Models that Are Fairly Comprehensive
Identify Roles and Responsibilities Now Add to From All Individual Flow Models Add-To, Correct etc. Roles and
Responsibilities Draw In Artifacts and Communications Add In Breakdowns
From Individual Charts From Differences Between Individual Charts
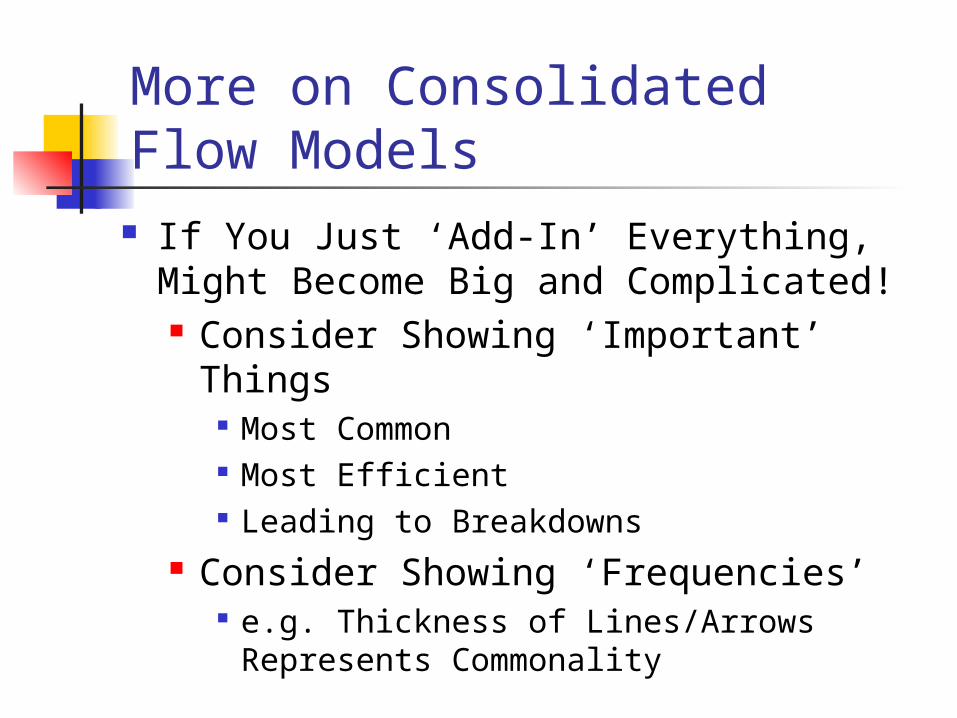
More on Consolidated Flow Models
If You Just ‘Add-In’ Everything, Might Become Big and Complicated! Consider Showing ‘Important’ Things
Most Common Most Efficient Leading to Breakdowns
Consider Showing ‘Frequencies’ e.g. Thickness of Lines/Arrows
Represents Commonality
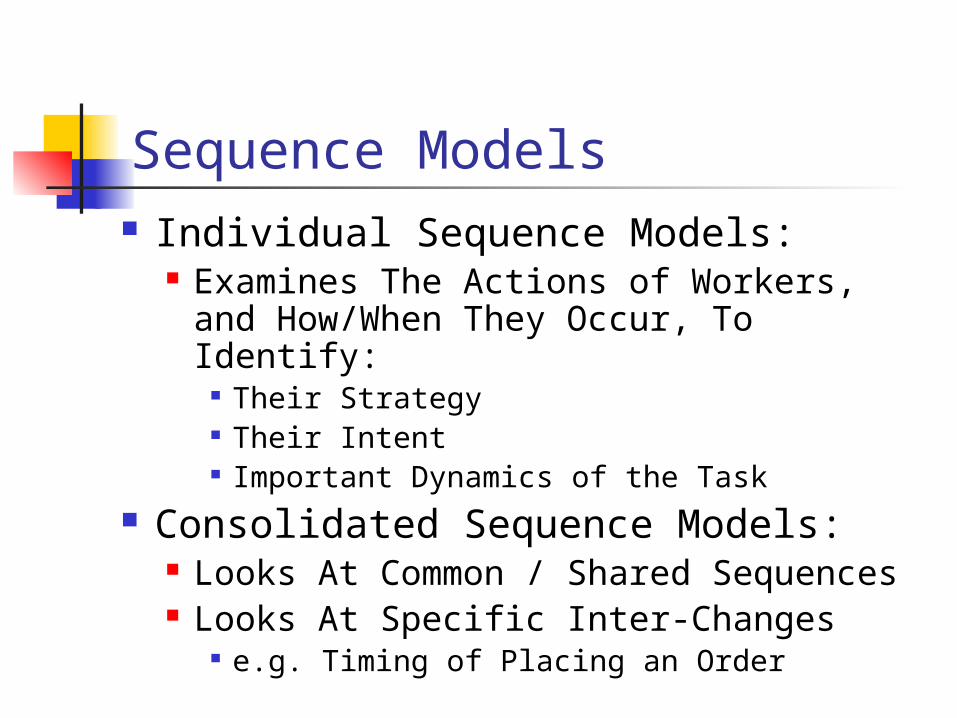
Sequence Models Individual Sequence Models:
Examines The Actions of Workers, and How/When They Occur, To Identify:
Their Strategy Their Intent Important Dynamics of the Task
Consolidated Sequence Models: Looks At Common / Shared Sequences Looks At Specific Inter-Changes
e.g. Timing of Placing an Order
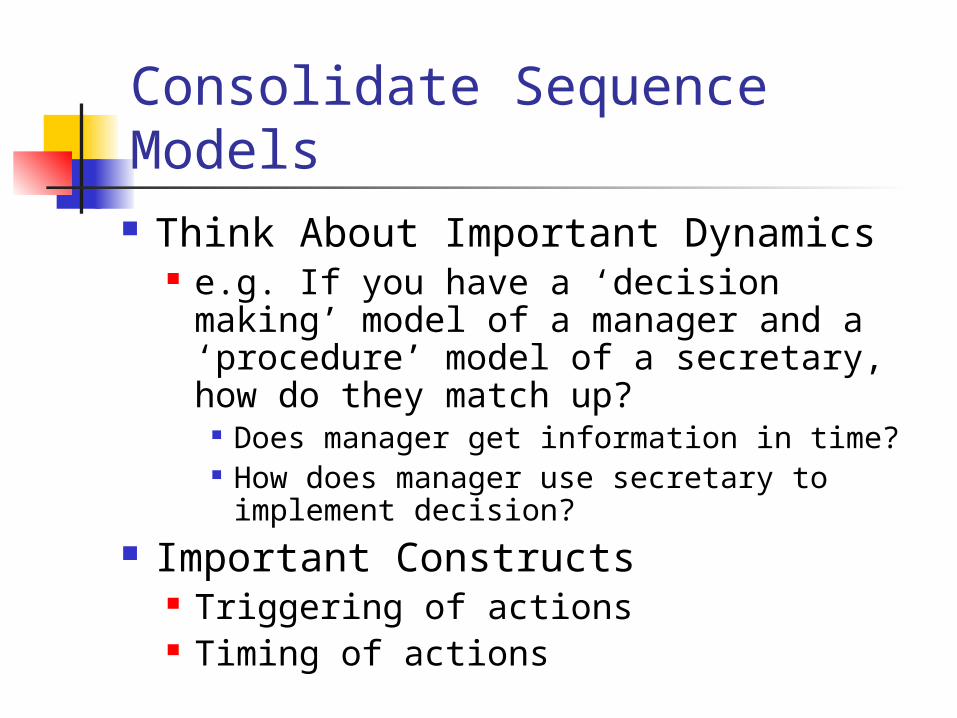
Consolidate Sequence Models Think About Important Dynamics
e.g. If you have a ‘decision making’ model of a manager and a ‘procedure’ model of a secretary, how do they match up?
Does manager get information in time? How does manager use secretary to
implement decision? Important Constructs
Triggering of actions Timing of actions
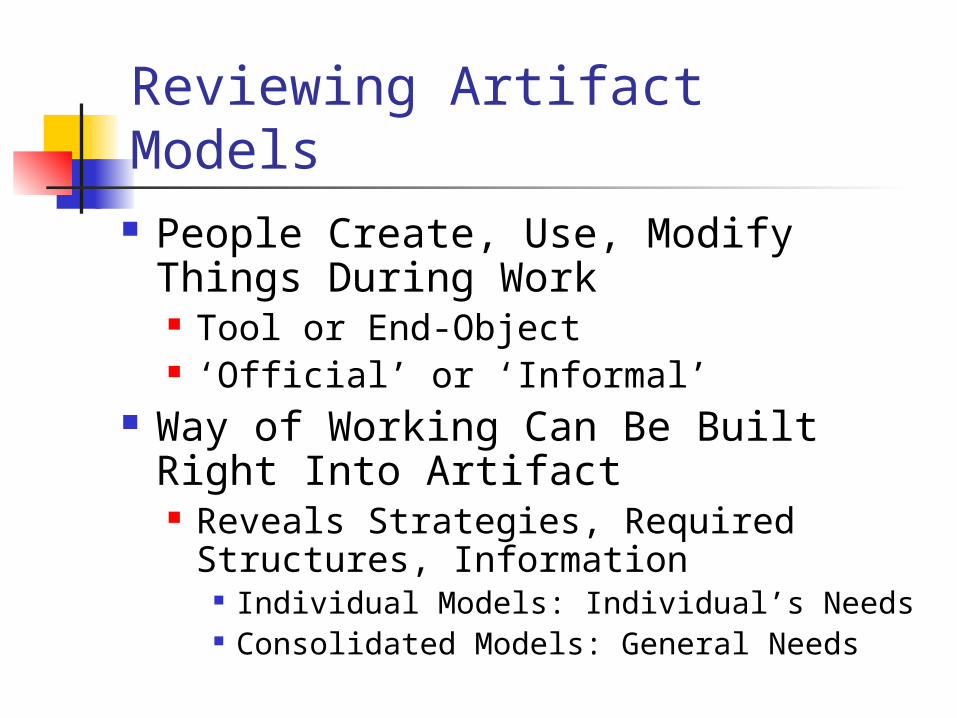
Reviewing Artifact Models People Create, Use, Modify Things
During Work Tool or End-Object ‘Official’ or ‘Informal’
Way of Working Can Be Built Right Into Artifact Reveals Strategies, Required
Structures, Information Individual Models: Individual’s Needs Consolidated Models: General Needs
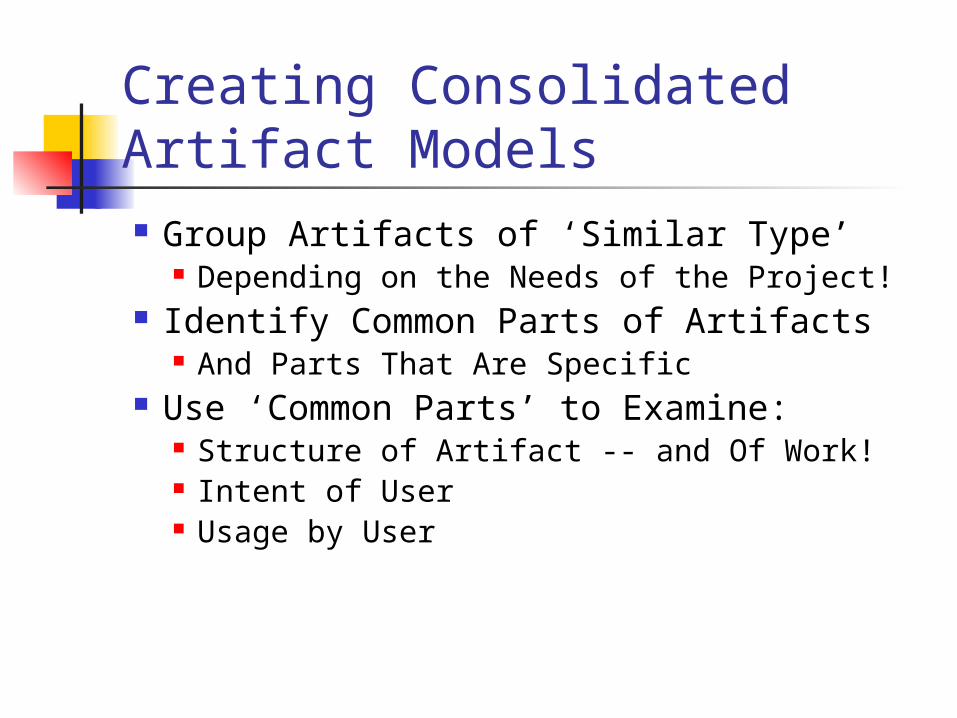
Creating ConsolidatedArtifact Models Group Artifacts of ‘Similar Type’
Depending on the Needs of the Project! Identify Common Parts of Artifacts
And Parts That Are Specific Use ‘Common Parts’ to Examine:
Structure of Artifact -- and Of Work! Intent of User Usage by User
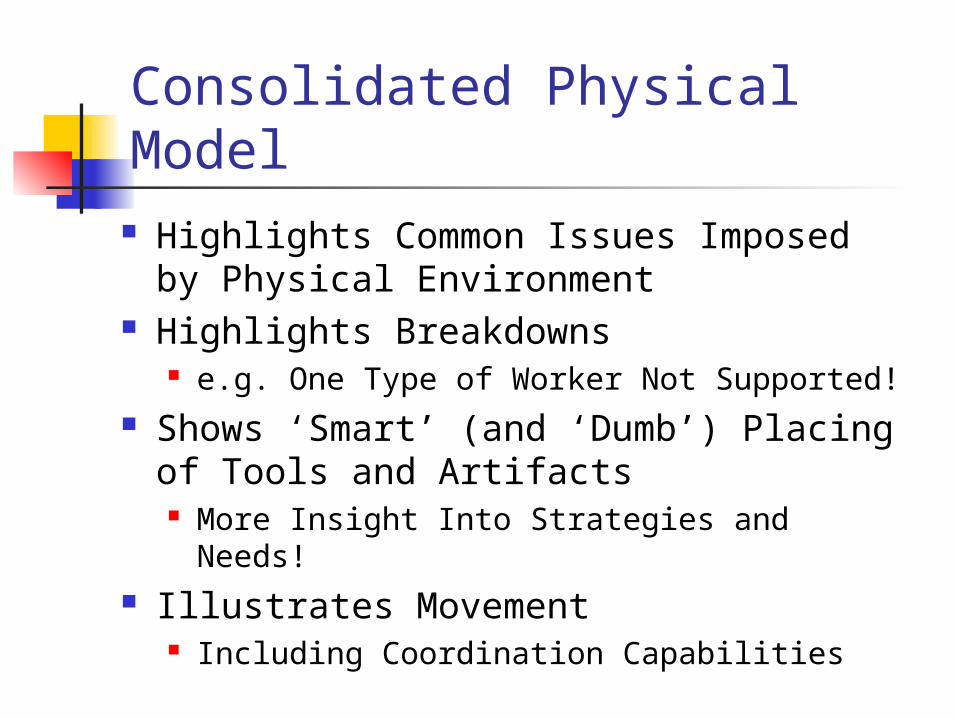
Consolidated Physical Model Highlights Common Issues Imposed by
Physical Environment Highlights Breakdowns
e.g. One Type of Worker Not Supported! Shows ‘Smart’ (and ‘Dumb’) Placing of
Tools and Artifacts More Insight Into Strategies and Needs!
Illustrates Movement Including Coordination Capabilities
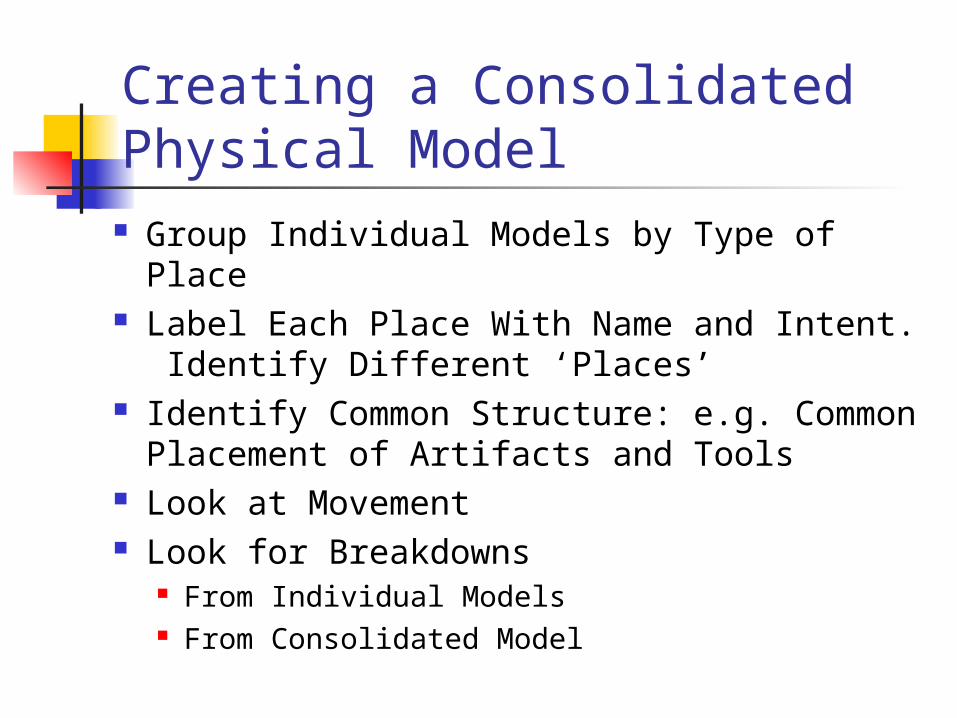
Creating a ConsolidatedPhysical Model
Group Individual Models by Type of Place Label Each Place With Name and Intent.
Identify Different ‘Places’ Identify Common Structure: e.g. Common
Placement of Artifacts and Tools Look at Movement Look for Breakdowns
From Individual Models From Consolidated Model
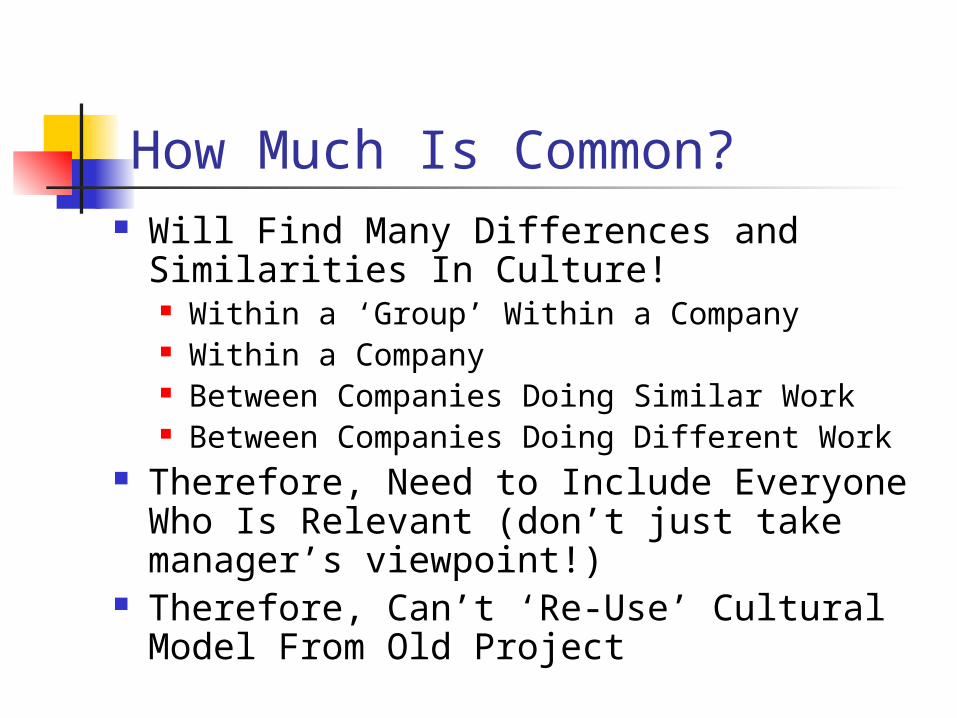
How Much Is Common? Will Find Many Differences and
Similarities In Culture! Within a ‘Group’ Within a Company Within a Company Between Companies Doing Similar Work Between Companies Doing Different Work
Therefore, Need to Include Everyone Who Is Relevant (don’t just take manager’s viewpoint!)
Therefore, Can’t ‘Re-Use’ Cultural Model From Old Project
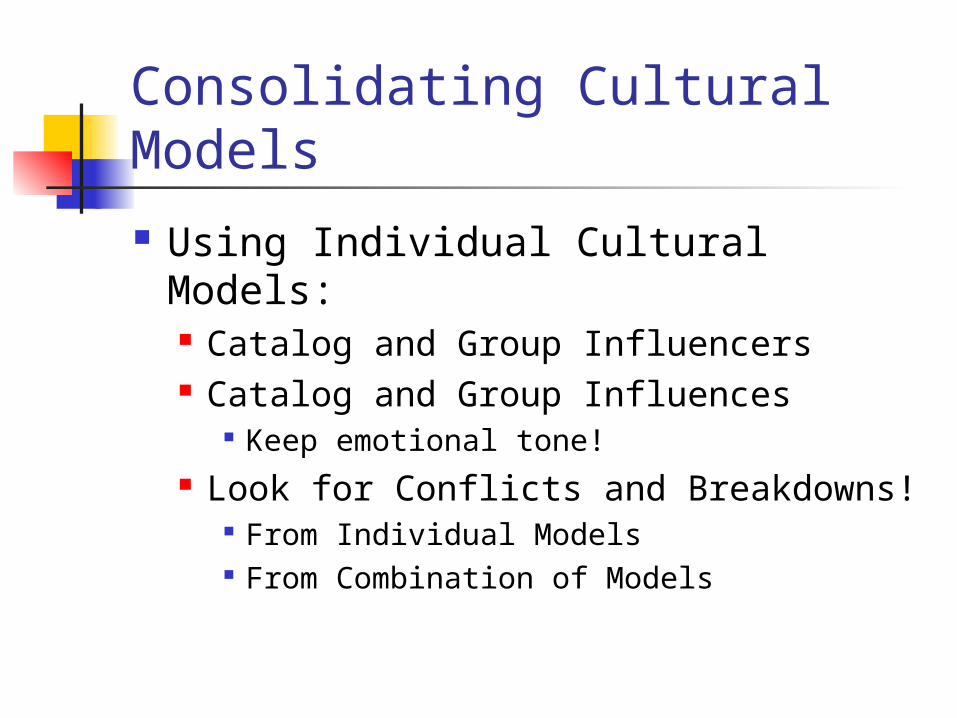
Consolidating Cultural Models
Using Individual Cultural Models: Catalog and Group Influencers Catalog and Group Influences
Keep emotional tone! Look for Conflicts and Breakdowns!
From Individual Models From Combination of Models
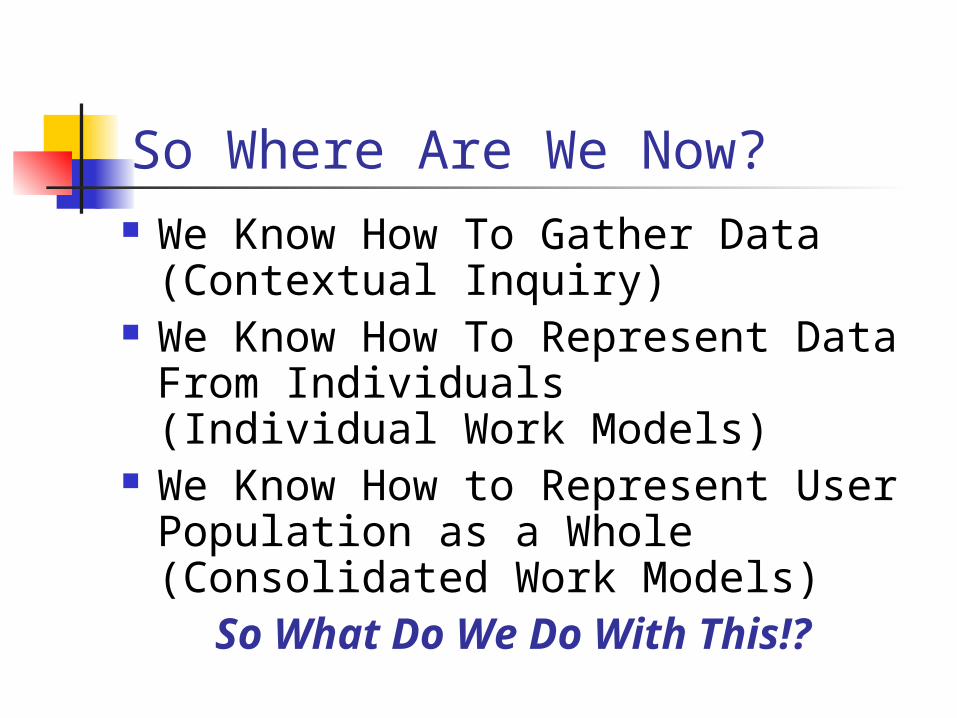
So Where Are We Now? We Know How To Gather Data
(Contextual Inquiry) We Know How To Represent Data
From Individuals(Individual Work Models)
We Know How to Represent User Population as a Whole(Consolidated Work Models)So What Do We Do With This!?
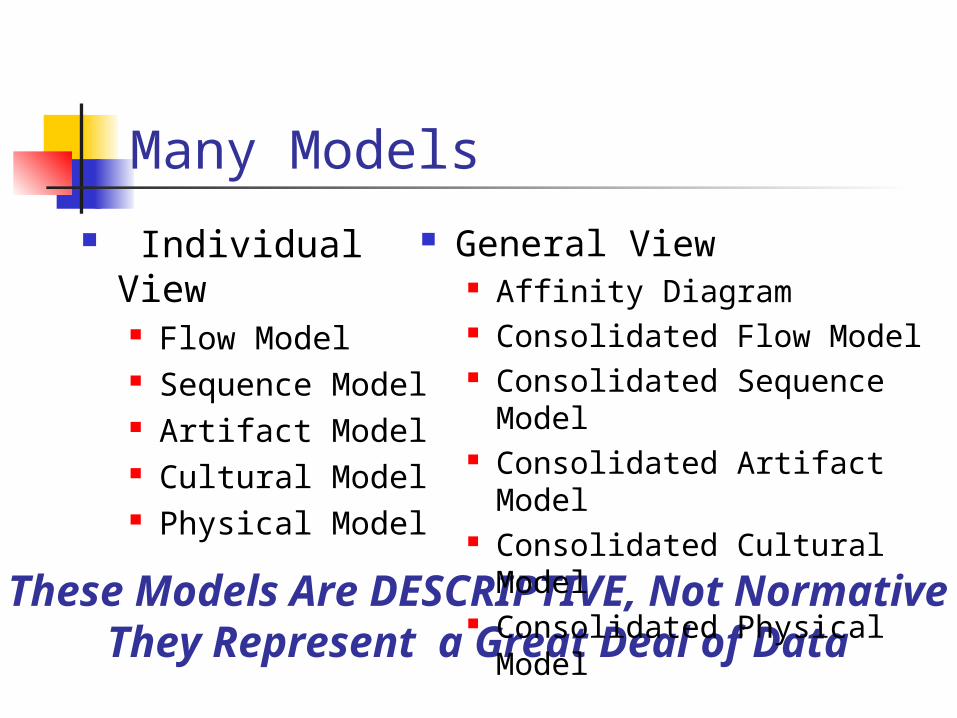
Many Models
Individual View Flow Model Sequence Model Artifact Model Cultural Model Physical Model
These Models Are DESCRIPTIVE, Not NormativeThey Represent a Great Deal of Data
General View Affinity Diagram Consolidated Flow Model Consolidated Sequence
Model Consolidated Artifact
Model Consolidated Cultural
Model Consolidated Physical
Model
So What Do We Do With Them?!
Understanding the Work Communicating With Others Redesigning… Work! (Re)Designing Technology
Comes Later...
‘Understanding’ From Work Models
We Can Infer Several Critical Things Once We Have Laid Out Good Work Models: Intent Strategies Structure Concepts Mindset
These Should Be Included In Our Re-Design of Work.
These Should Be Communicated.
Ultimately, These Should Be Included In Our Technology.
Communicating With Others With Whom Will You Need to Communicate?
Your Boss Your Customer Marketing Sales Software / Hardware Developers
What Is Your Role In These Communications? To Be The Data-Driven Voice of Truth! To Be The Authority on Work Practices and Its
Implications
More on Communication The Data-Driven Voice of Truth…
Others Will Have Different Viewpoints Others Will Tend to Jump to Conclusions!
e.g. We Must Have a Wearable Computer… If You Don’t Have ‘Data’ To Back Up Your
Opinion, All You Have Is an Argument… How To Present Data?
It Depends! Some Can Be Led Through the Work Models Others Need Different Representation...
Last Bit on Communication Different Portrayals Depending on
Audience Same Underlying Message!
Understanding of Work Processes Places Where Improvements Are Needed Places Where Improvements Are Possible Impact of Improvements
These Message-Bits Come From Work Models! Sometimes Can Be Shown Directly...
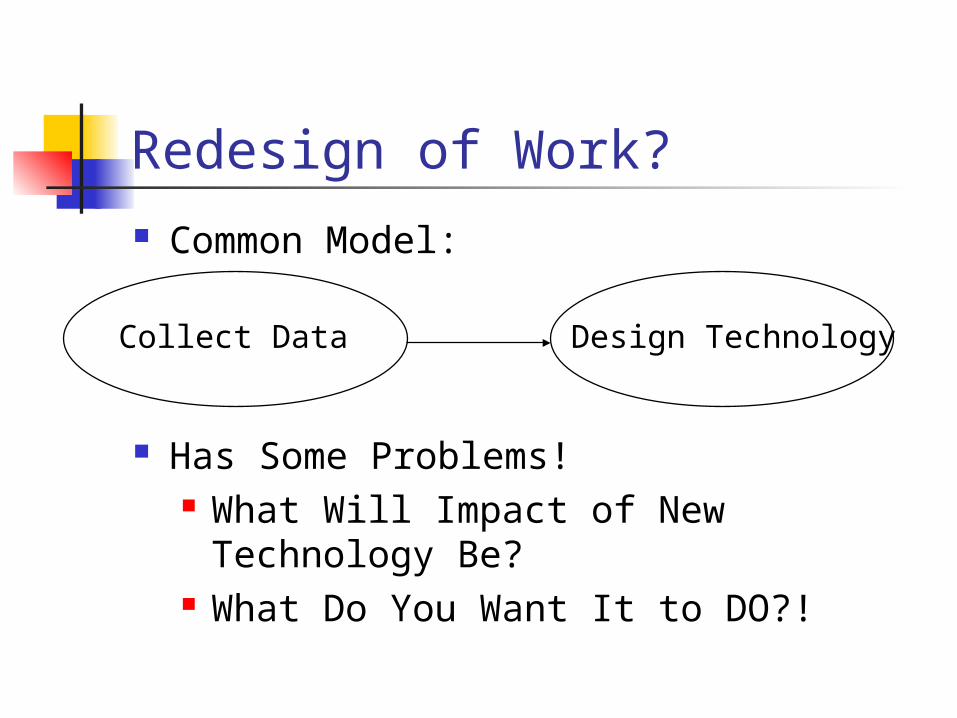
Redesign of Work? Common Model:
Has Some Problems! What Will Impact of New Technology
Be? What Do You Want It to DO?!
Collect Data Design Technology
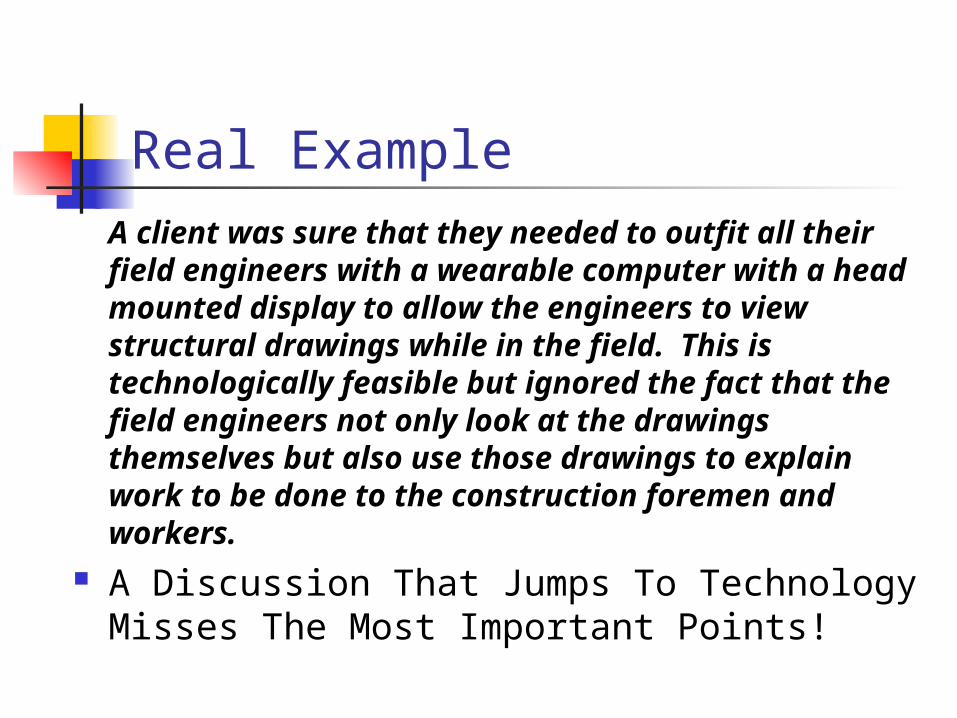
Real ExampleA client was sure that they needed to outfit all their field engineers with a wearable computer with a head mounted display to allow the engineers to view structural drawings while in the field. This is technologically feasible but ignored the fact that the field engineers not only look at the drawings themselves but also use those drawings to explain work to be done to the construction foremen and workers.
A Discussion That Jumps To Technology Misses The Most Important Points!
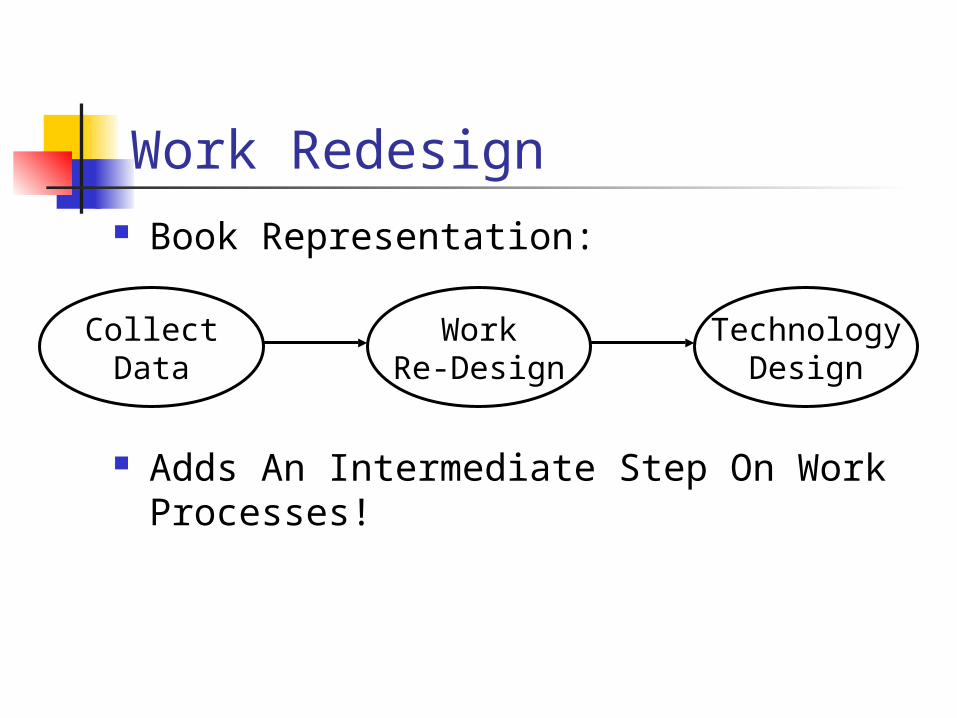
Work Redesign Book Representation:
Adds An Intermediate Step On Work Processes!
CollectData
WorkRe-Design
TechnologyDesign
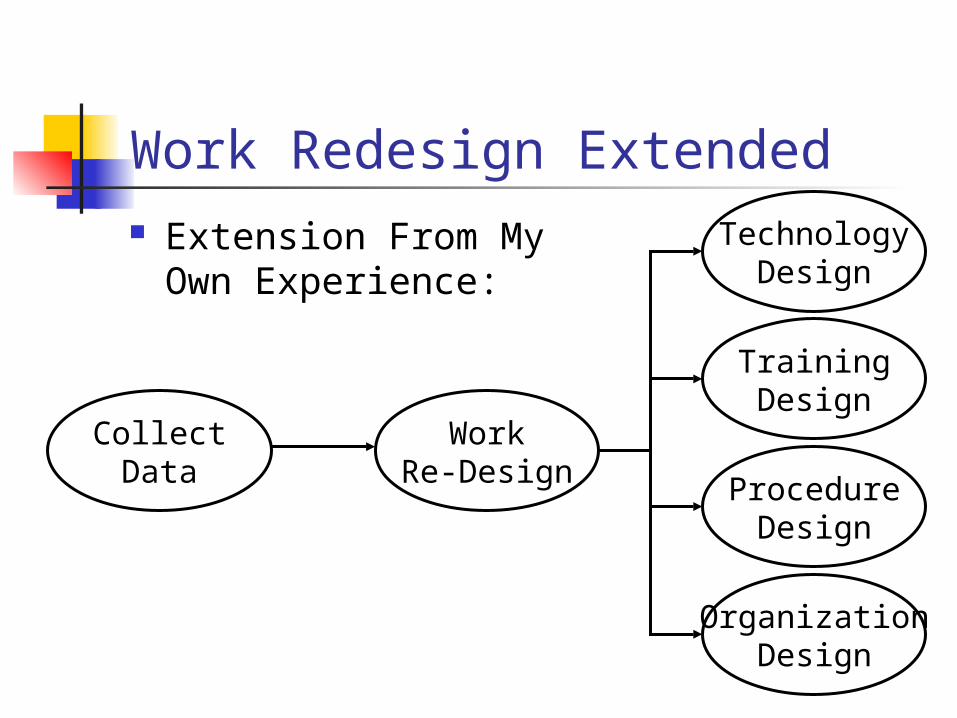
Work Redesign Extended Extension From My
Own Experience:
CollectData
WorkRe-Design
TrainingDesign
TechnologyDesign
ProcedureDesign
OrganizationDesign
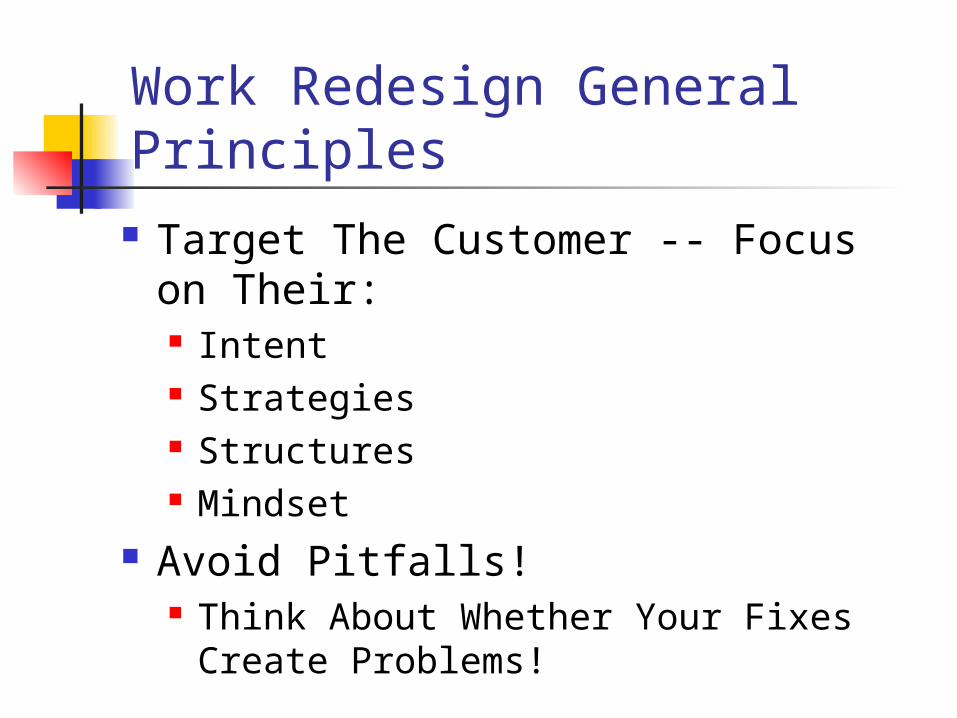
Work Redesign General Principles Target The Customer -- Focus on
Their: Intent Strategies Structures Mindset
Avoid Pitfalls! Think About Whether Your Fixes
Create Problems!
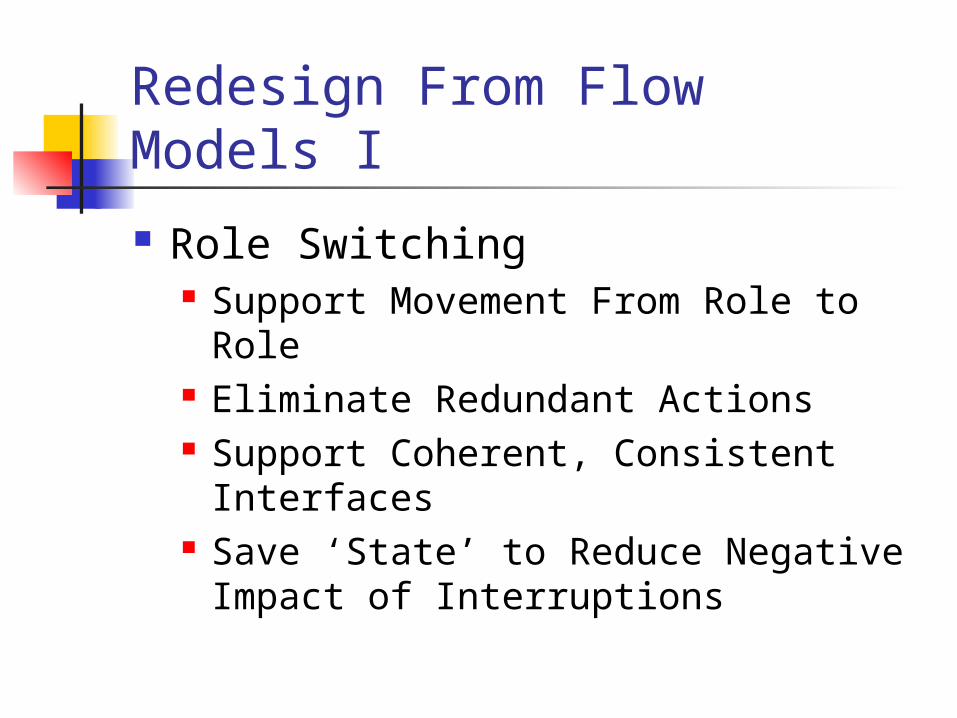
Redesign From Flow Models I
Role Switching Support Movement From Role to Role Eliminate Redundant Actions Support Coherent, Consistent
Interfaces Save ‘State’ to Reduce Negative
Impact of Interruptions
Redesign From Flow Models II
Role Strain Move Roles Onto Other People Automate, Eliminate or Combine
Roles Support and Organize Roles Make Roles Inter-Supporting
Redesign From Flow Models III
Role Sharing Support Communication Between
Sharers Allow for Tailored Interfaces and Fit
With the Rest of the Roles Each Person Plays
Redesign From Flow Models IV
Role Isolation Communicate Context and Reasoning Support Communication Present The Information Each Role
Needs Reduce Blocks and Unnecessary
Steps in Communication
Redesign From Flow Models V
Process Fixes Remember You May Need to (re)Design
the Organization! Look at Changes in Process and
Procedures Look At New Roles and Responsibilities Include Business Designers on Team Think of Automation as Filling Roles...
Redesign From Cultural Models I
Interpersonal Give-and-Take Alleviate Problems With Role
Allocation Alleviate Problems With Role Conflicts Increase Communication Address Immediate Complaint
Redesign From Cultural Models II Pervasive Values
Look At Pervasive Values (Are They Good?) Look For Ways to Encourage Individuals
To: Attain Positive Values and Required Constraints Not Achieve Negative Values
See If You Can Align Individual’s Values Structures With The Organizations...
Redesign From Physical Models I Reality Check
Take Advantage of What Is There Don’t Depend on What Isn’t There Account for Movement and Multiple Task
Locations Overcome Communication Problems

Redesign From Physical Models II Work Structure Made Real
Have Physical Environment Complement Task Needs
e.g. Frequently Used Things Close e.g. Things Used In Order Placed In Order e.g. Communicators ‘Close’
Match the Intent of the Place, Not Detailed Appearance
Redesign From Physical Models III Movement and Access
Match or Improve Flow of Artifacts Maintain Conceptual Separation
Between Tasks Support Implicit Intent
Redesign From Sequence Models I
What The User Is Up To If Primary Intent Is Wrong, Fix It! Support ‘Good’ Intents Account For and Support Secondary
Intents
Redesign From Sequence Models II
How Users Approach a Task Identify and Support ‘Good’ Strategies Eliminate ‘Bad’ Strategies -- Carefully!
Redesign From Sequence Models III
Unnecessary Steps Identify Unnecessary Steps and Eliminate
Them Automate Tedious, Mundane, Harmful Steps Eliminate Breakdowns Facilitate Transition Between Roles Don’t Create Work No One Wants To Do Pick Best, Most Efficient, Safest Path to
Intent
Redesign From Sequence Models IV What Gets Them Started
Identify Triggers for Tasks Display Trigger Appropriately
What Keeps Them Going Identify Coordination and Information
Requirements Support Them! Identify and Display Important Constraints
e.g. Time Constraints
Redesign From Artifact Models I Why The Artifact Matters
Identify What Artifact Use Implies About Intent Support Intent Directly! Remember There May Be Multiple Intents…
What It Says Support Communication Created by Artifact Support Data Storage Created by Artifact Share Context and Data Between Roles -
Directly!
Redesign From Artifact Models II How It ‘Chunks’
Identify What Parts of Artifact’s Grouping Are Important
Use Structure to Highlight Structure of Work Maintain Distinctions That Matter
What It Looks Like Determine Which Parts of Appearance
Matter Mimic The Parts That Matter Match the Intent of the Presentation
Summary: Using Models to Redesign Work Through Contextual Inquiry and
Development of Work Models, Have Captured Current Work Practices
This Knowledge Is Powerful Asset in Developing New Work Practices Look for What’s Important
Keep It Improve It
Look for What’s Bad Eliminate It
‘System’ Design
Chapters 13 - 16
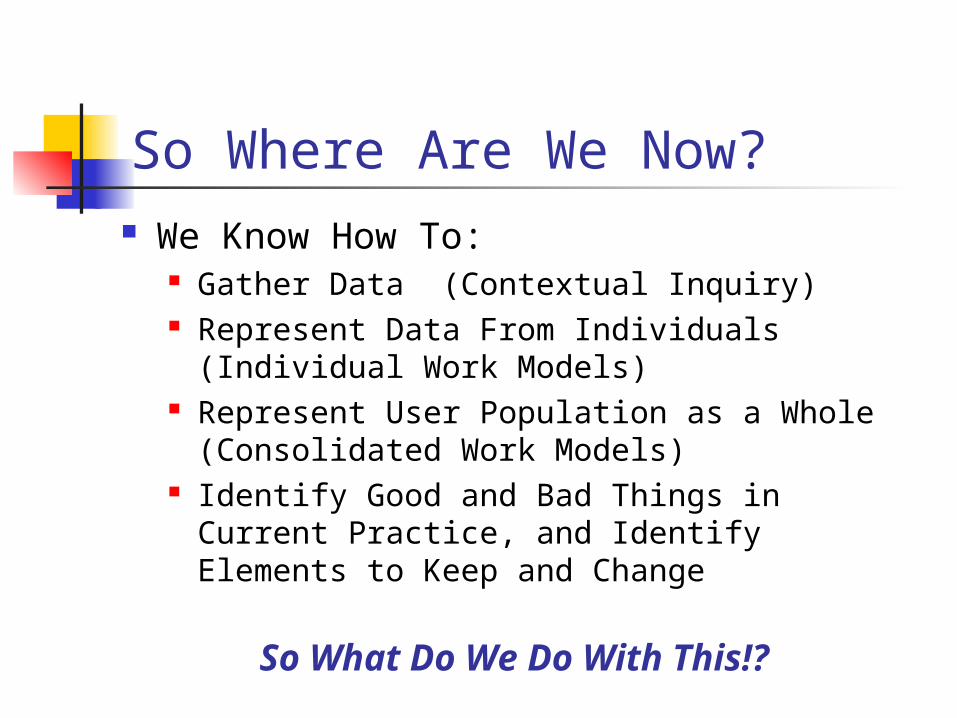
So Where Are We Now? We Know How To:
Gather Data (Contextual Inquiry) Represent Data From Individuals
(Individual Work Models) Represent User Population as a Whole
(Consolidated Work Models) Identify Good and Bad Things in Current
Practice, and Identify Elements to Keep and Change
So What Do We Do With This!?
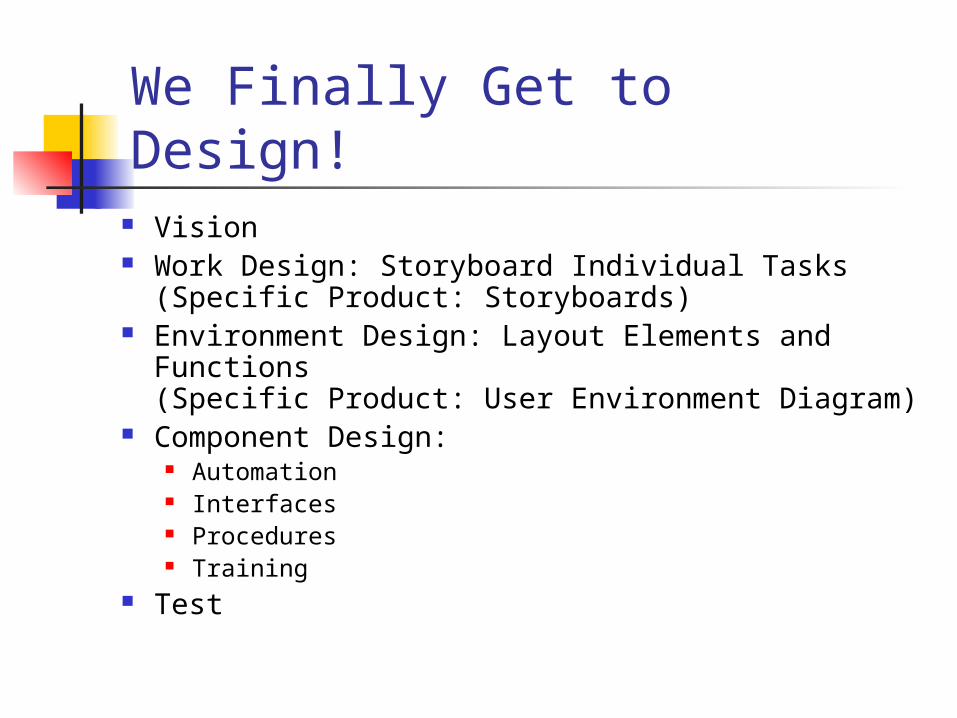
We Finally Get to Design! Vision Work Design: Storyboard Individual Tasks
(Specific Product: Storyboards) Environment Design: Layout Elements and
Functions(Specific Product: User Environment Diagram)
Component Design: Automation Interfaces Procedures Training
Test
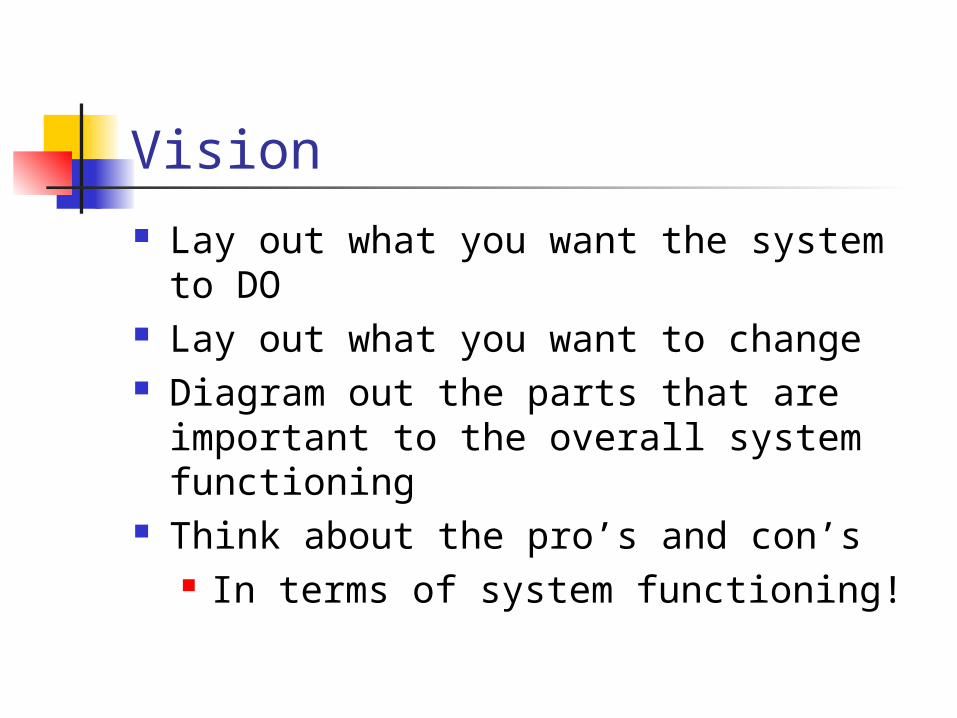
Vision Lay out what you want the system to
DO Lay out what you want to change Diagram out the parts that are
important to the overall system functioning
Think about the pro’s and con’s In terms of system functioning!
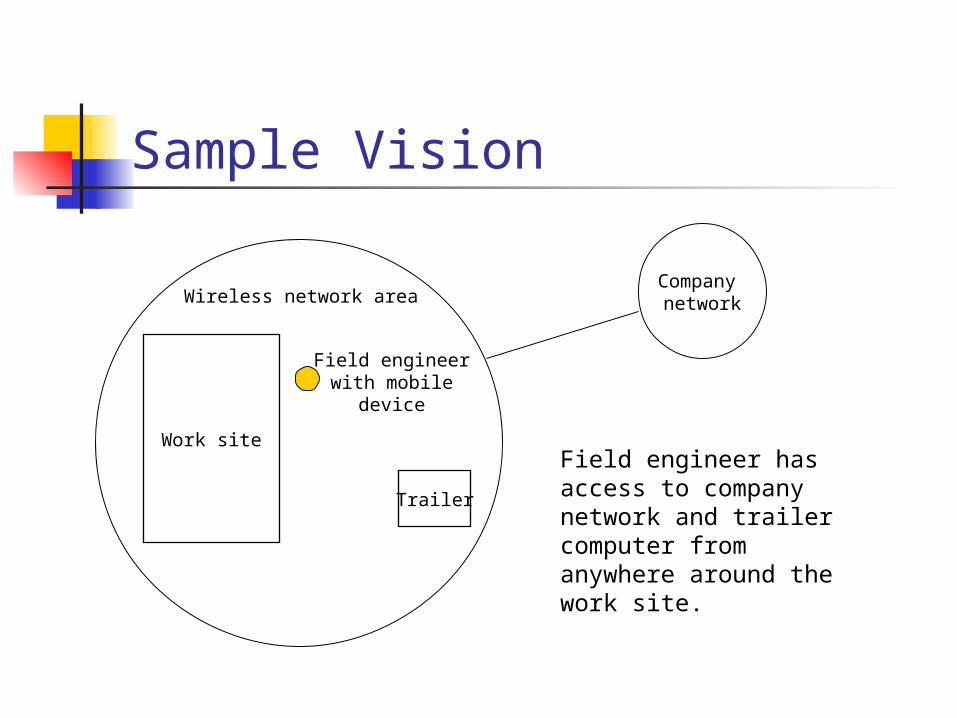
Sample Vision
Wireless network area
Work site
Trailer
Field engineer with mobile device
Company network
Field engineer has access to company network and trailer computer from anywhere around the work site.
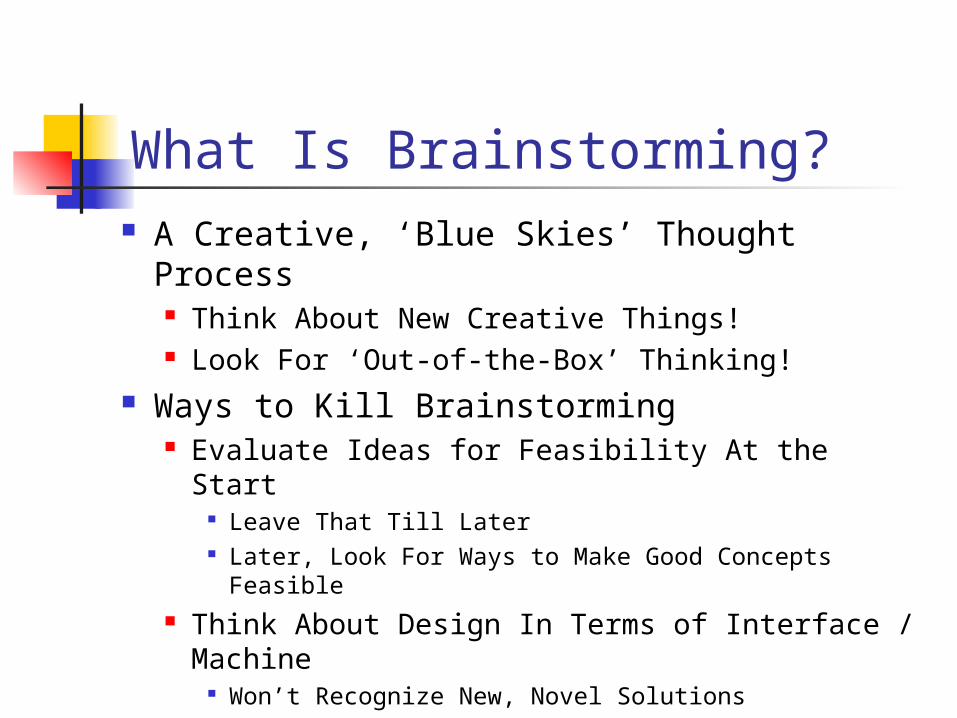
What Is Brainstorming? A Creative, ‘Blue Skies’ Thought Process
Think About New Creative Things! Look For ‘Out-of-the-Box’ Thinking!
Ways to Kill Brainstorming Evaluate Ideas for Feasibility At the Start
Leave That Till Later Later, Look For Ways to Make Good Concepts
Feasible Think About Design In Terms of Interface /
Machine Won’t Recognize New, Novel Solutions

Storyboarding Individual Tasks Purpose: Shows How Specific Tasks Will
Be Accomplished in the ‘New World’(A Technique Stolen From Movie Industry!)
Product: A Storyboard! Uses:
Help Create User Environment Diagram Good Communication Mechanism
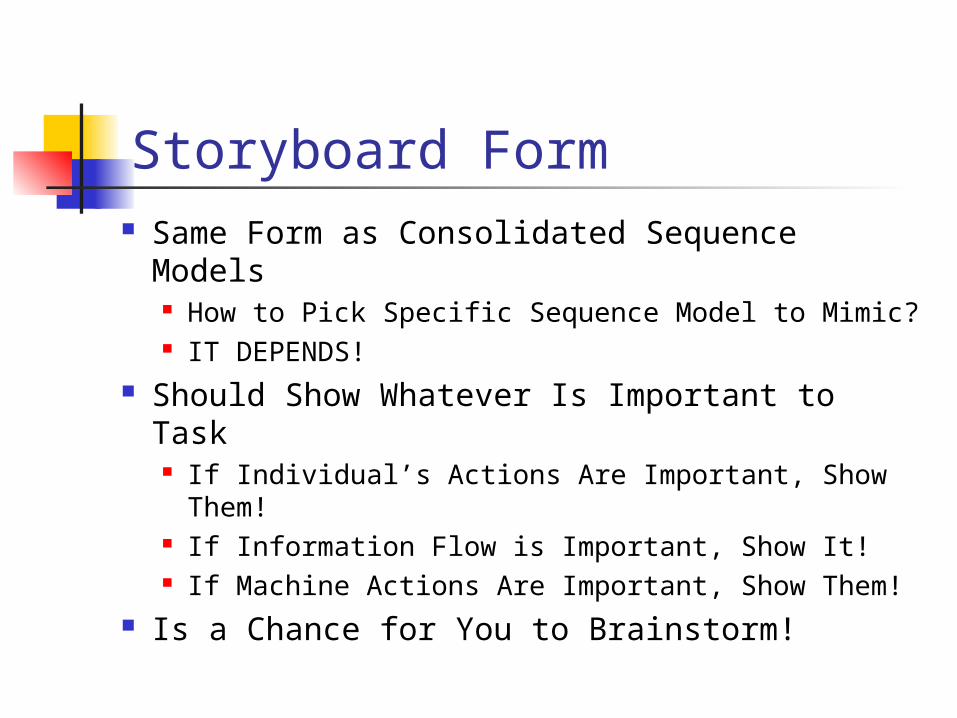
Storyboard Form Same Form as Consolidated Sequence Models
How to Pick Specific Sequence Model to Mimic? IT DEPENDS!
Should Show Whatever Is Important to Task If Individual’s Actions Are Important, Show Them! If Information Flow is Important, Show It! If Machine Actions Are Important, Show Them!
Is a Chance for You to Brainstorm!
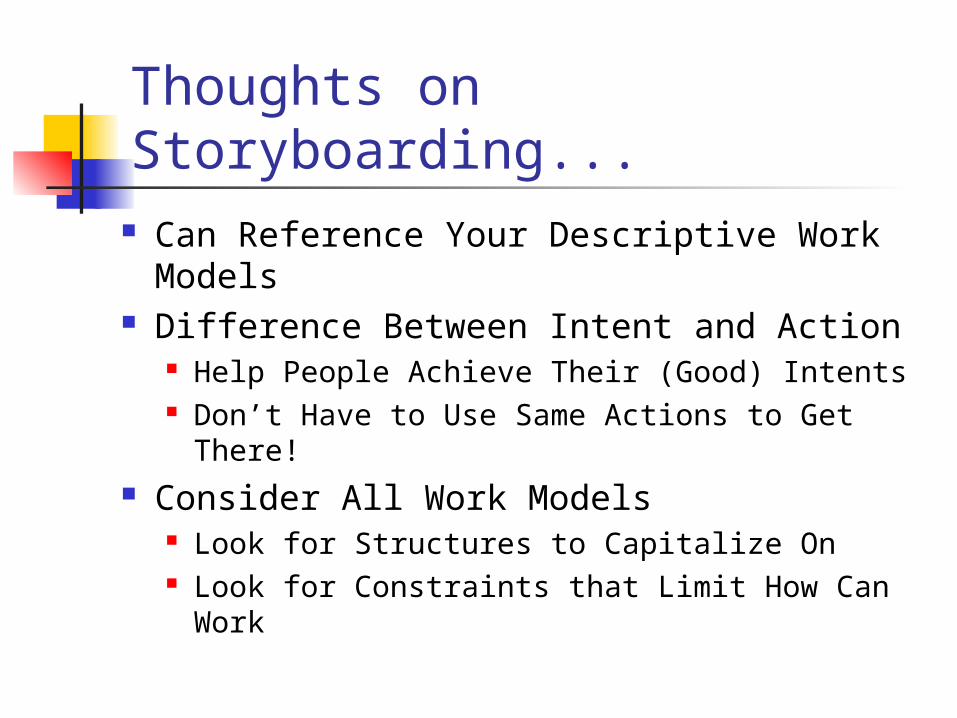
Thoughts on Storyboarding... Can Reference Your Descriptive Work
Models Difference Between Intent and Action
Help People Achieve Their (Good) Intents Don’t Have to Use Same Actions to Get
There! Consider All Work Models
Look for Structures to Capitalize On Look for Constraints that Limit How Can
Work
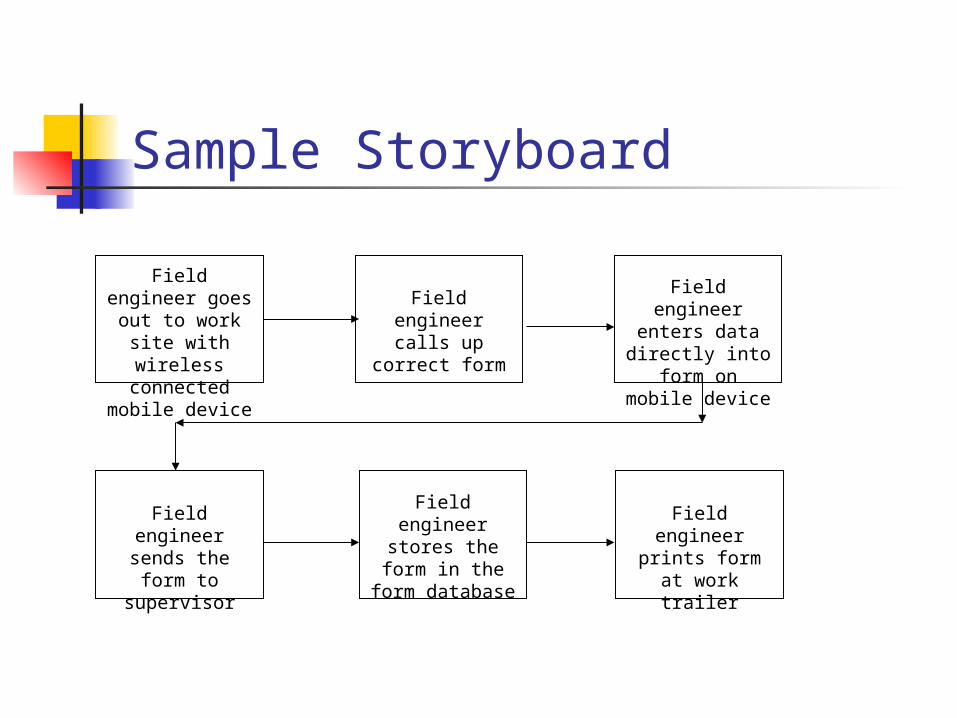
Sample Storyboard
Field engineer goes out to work site with wireless connected mobile
device
Field engineer calls up correct
form
Field engineer enters data
directly into form on mobile device
Field engineer sends the form to
supervisor
Field engineer stores the form in
the form database
Field engineer prints form at work trailer
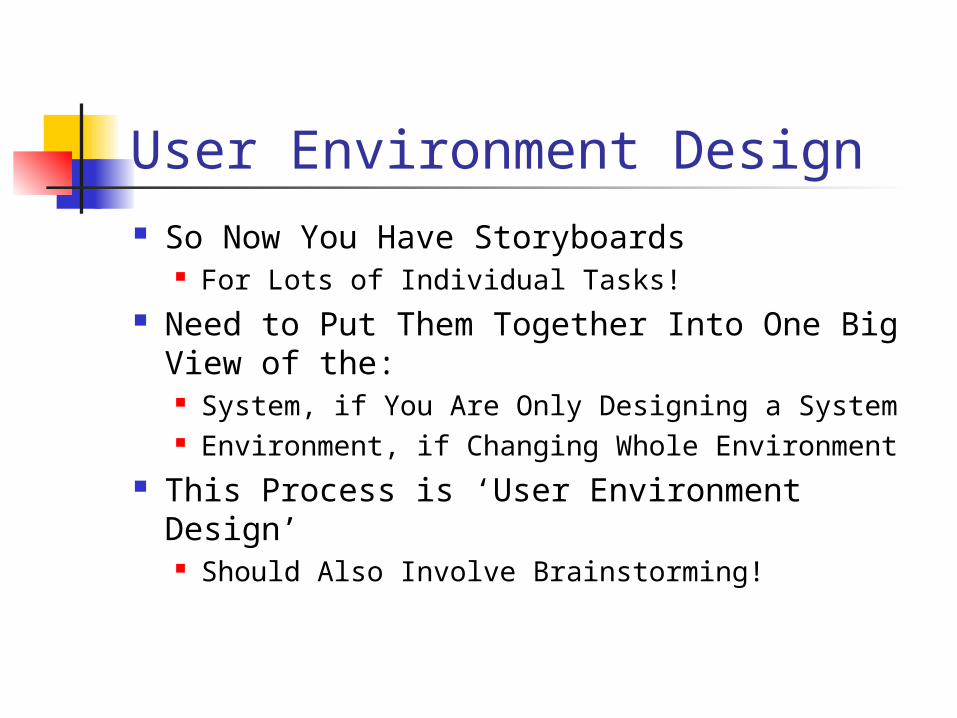
User Environment Design So Now You Have Storyboards
For Lots of Individual Tasks! Need to Put Them Together Into One Big
View of the: System, if You Are Only Designing a System Environment, if Changing Whole Environment
This Process is ‘User Environment Design’ Should Also Involve Brainstorming!
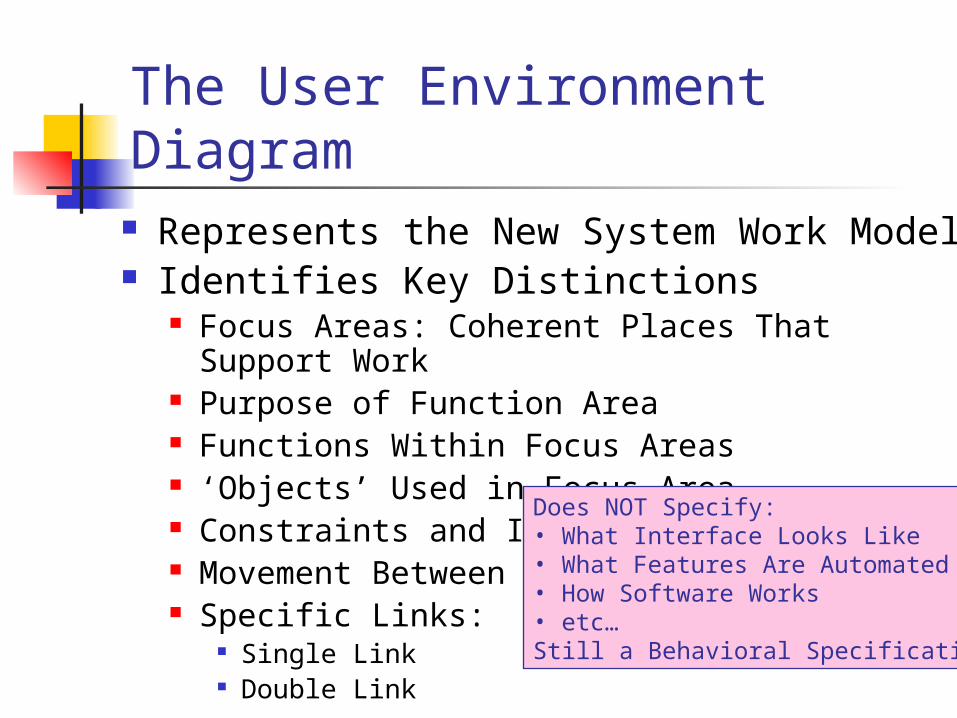
The User Environment Diagram
Represents the New System Work Model Identifies Key Distinctions
Focus Areas: Coherent Places That Support Work
Purpose of Function Area Functions Within Focus Areas ‘Objects’ Used in Focus Area Constraints and Issues Movement Between Areas Specific Links:
Single Link Double Link
Does NOT Specify:• What Interface Looks Like• What Features Are Automated• How Software Works• etc…Still a Behavioral Specification
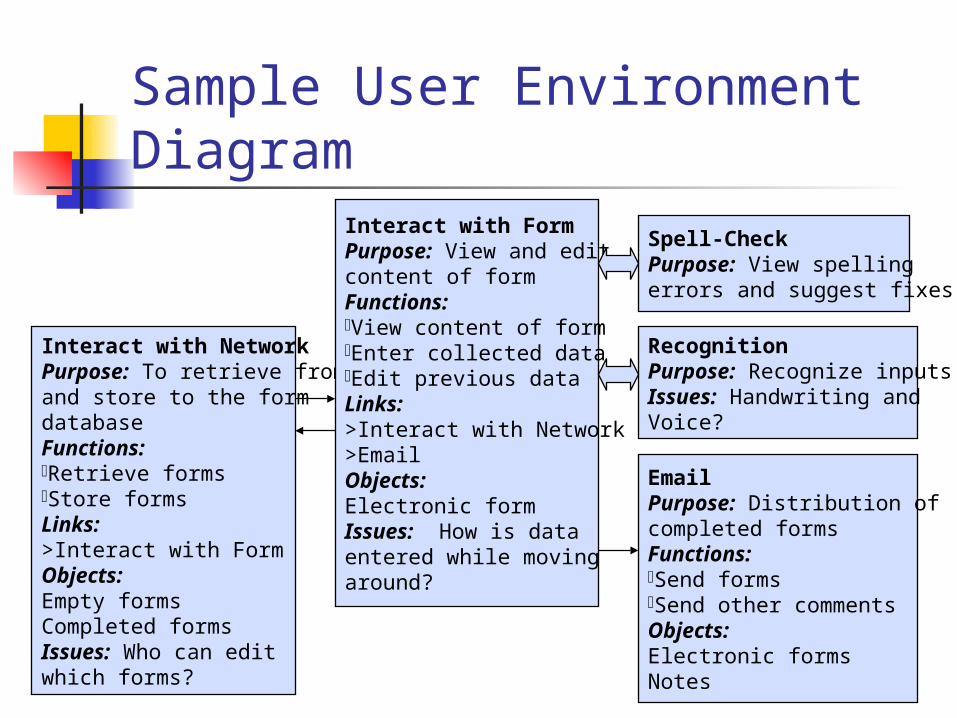
Sample User Environment Diagram
Interact with NetworkPurpose: To retrieve fromand store to the formdatabase Functions: Retrieve formsStore formsLinks:>Interact with FormObjects:Empty formsCompleted formsIssues: Who can edit which forms?
Interact with FormPurpose: View and edit content of formFunctions: View content of formEnter collected dataEdit previous dataLinks:>Interact with Network>EmailObjects:Electronic formIssues: How is dataentered while moving around?
EmailPurpose: Distribution of completed forms Functions: Send formsSend other commentsObjects:Electronic formsNotes
Spell-CheckPurpose: View spellingerrors and suggest fixes
RecognitionPurpose: Recognize inputsIssues: Handwriting and Voice?

Building From Storyboards Can Create UED By Looking at Storyboards
What Are Common Focus Areas? What Are Required Functions? What Are Likely Transitions
Just Remember that UED Must Account for ALL Tasks Either Need Storyboard for All Tasks OR Fill In the Gaps
The Two Models Serve Different Purposes...
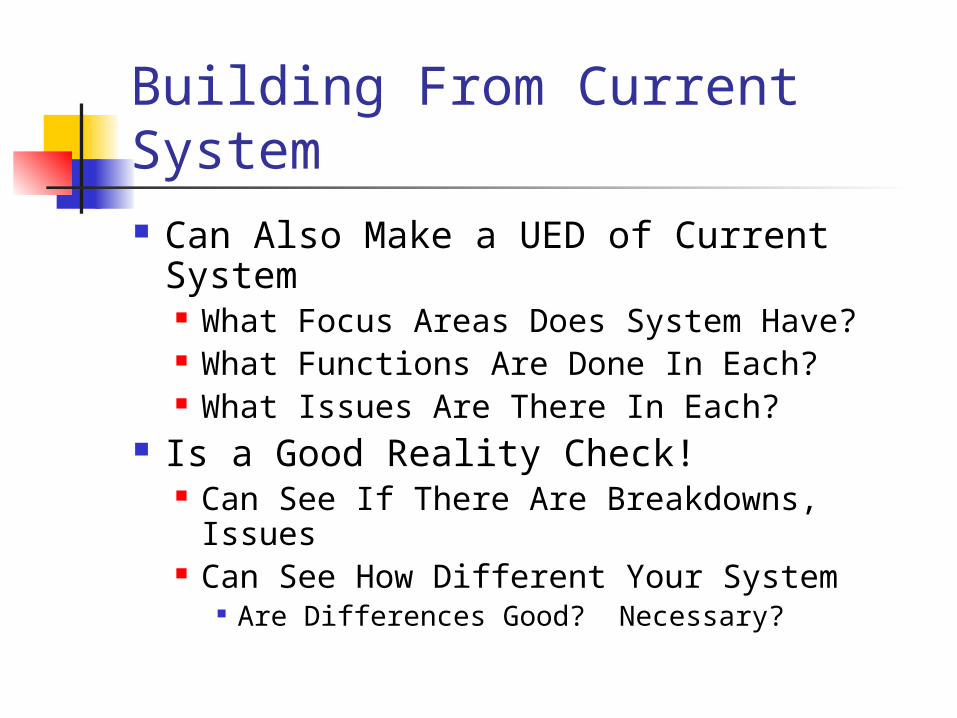
Building From Current System Can Also Make a UED of Current
System What Focus Areas Does System Have? What Functions Are Done In Each? What Issues Are There In Each?
Is a Good Reality Check! Can See If There Are Breakdowns, Issues Can See How Different Your System
Are Differences Good? Necessary?
Traits of Good UED Focus Areas Make Sense
Few Unnecessary Transitions ‘Like’ Functions Grouped Together
No Unneeded Distinctions Between Focus Areas e.g. Can’t Edit Slide Contents on Slide
Notes Page Minimize Multi-Step Transitions! Coherence!
Coherency: A Guiding Principle Coherence Is So Important It Deserves
It’s Own Viewgraph A Coherent Environments Means:
Similar Functions Are Done in Similar Ways
Even In Different Focus Areas! Arbitrary Distinctions Between Functions
and Between Focus Areas Are Eliminated! Is Good To Keep Number of Focus Areas
Reasonably Low...
Partitioning the Work Coherence Is Good…
And Dividing the Design Work Up Means Parts of Design Will Not Be Coherent
But for Practicality’s Sake, Need to Partition Work
There Are Some (Partial) Solutions Look For Focus Areas Serving ‘Like’
Purposes e.g. Edit Slides, Edit Slide Notes, Edit Slide
Outline…
And Have Same Team Work On Those!
What To Do With UED? I Go Design Things Yourself
Figure Out Who Does What: Roles of People vis-à-vis Functions and Focus
Areas Automated Roles
Design Hardware / Software Underneath Design Interfaces Design Procedures Design Training
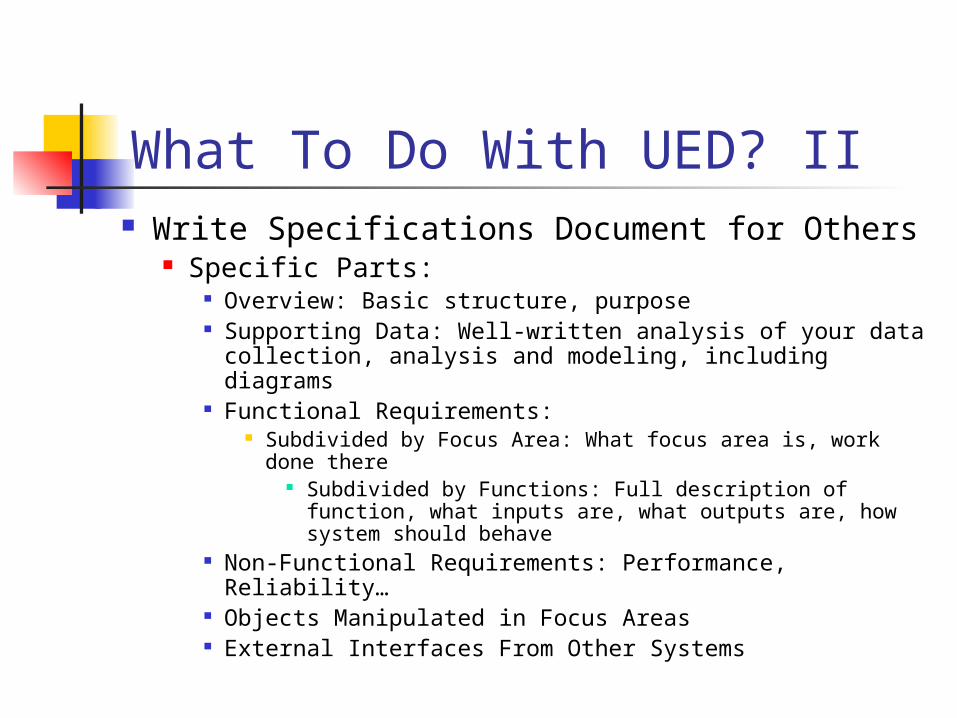
What To Do With UED? II Write Specifications Document for Others
Specific Parts: Overview: Basic structure, purpose Supporting Data: Well-written analysis of your data
collection, analysis and modeling, including diagrams Functional Requirements:
Subdivided by Focus Area: What focus area is, work done there
Subdivided by Functions: Full description of function, what inputs are, what outputs are, how system should behave
Non-Functional Requirements: Performance, Reliability…
Objects Manipulated in Focus Areas External Interfaces From Other Systems
Measuring Usability
Chapter 19
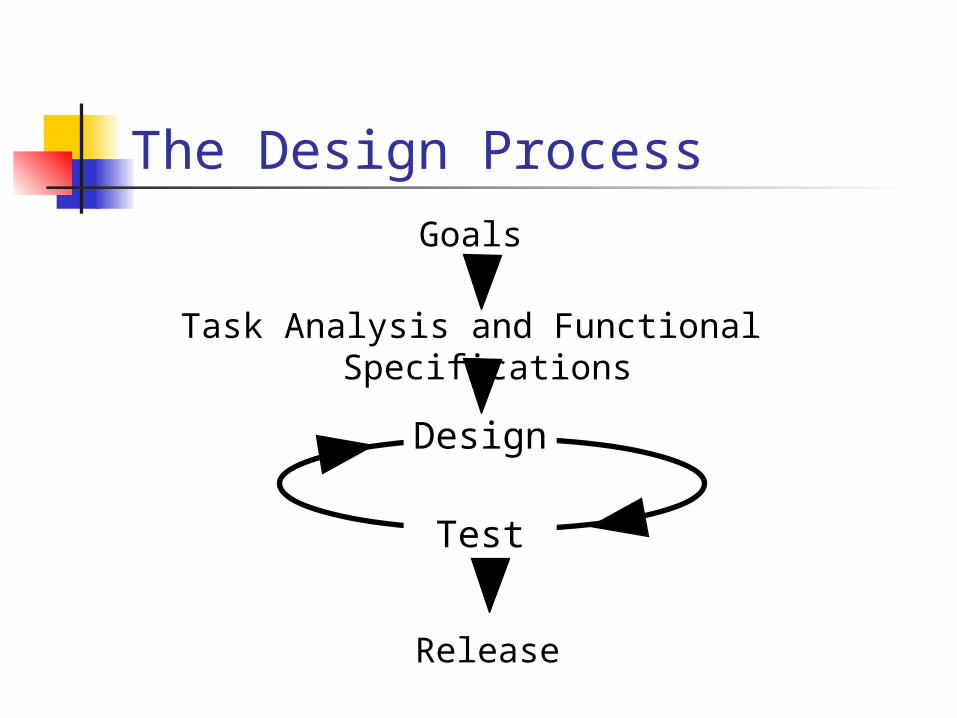
Goals
Task Analysis and Functional Specifications
Release
The Design Process
Design
Test
Time Line With every iteration,
Fewer changes should be required Smaller changes should be required More subjects may be required in
testing for significant results Iteration stopped when:
System is perfect No time is left No money is left
What is Usability? “How Easily and Effectively the
System Can Be Used by the Intended User” Note: The System Must Be Easy to Use
ANDThe User Must Be Able to Use It To Do the Task
AND‘Usability’ Must Be From the Point of View of the Intended User, Not the Designer
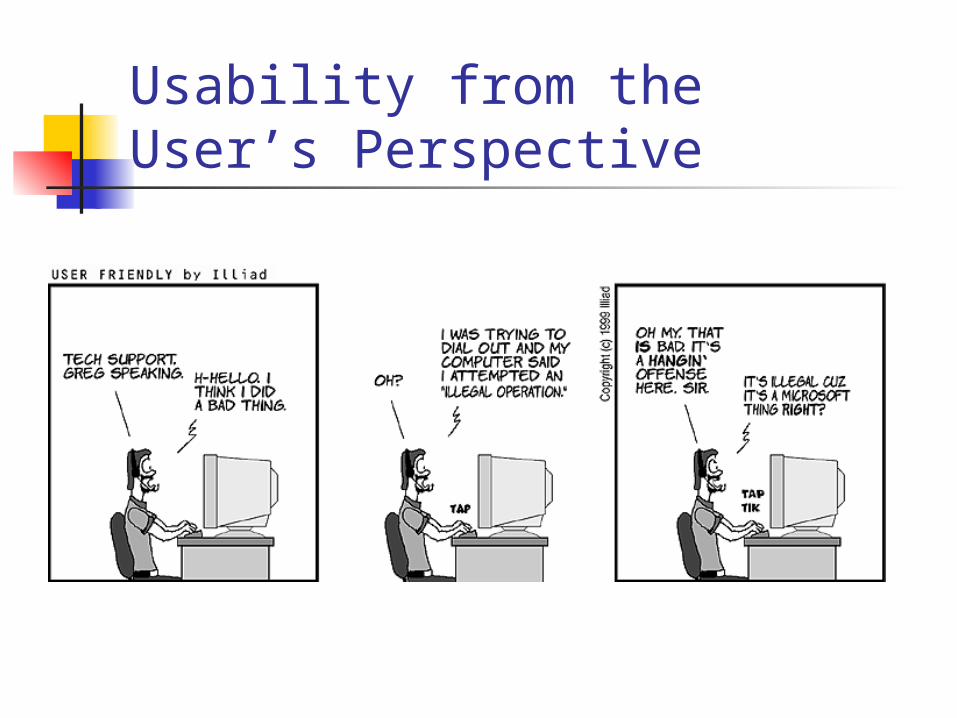
Usability from the User’s Perspective
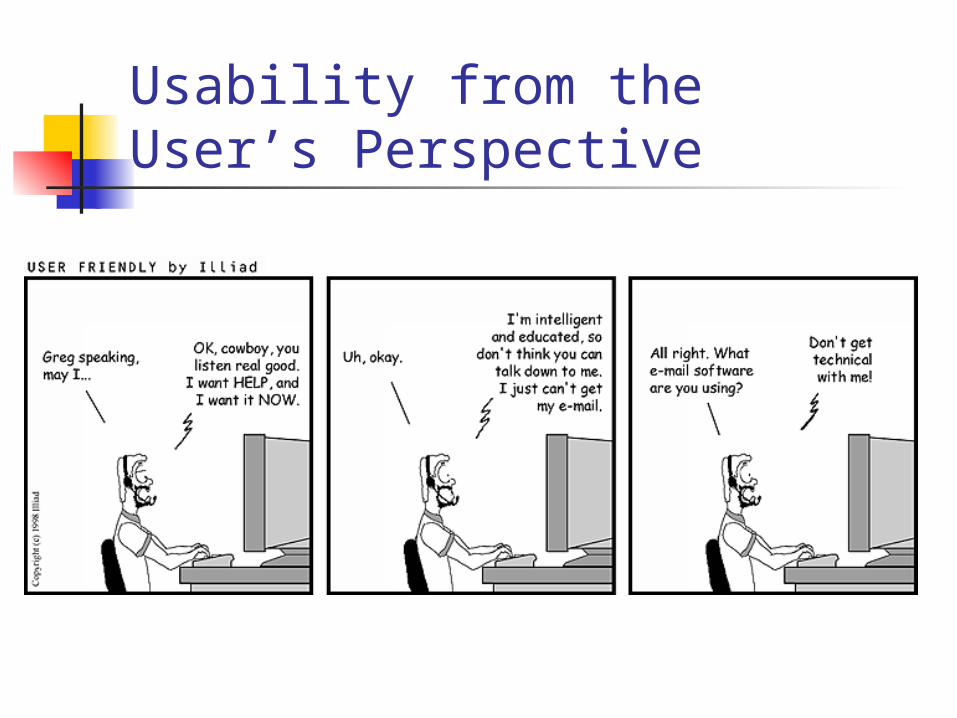
Usability from the User’s Perspective
Measuring Usability (In General)
Your Results Will Only Be as Comprehensive as Your Measures of Usability!
Your Results Will Only Have as Much Depth as Your Measures of Usability!
MORAL: Think Your Test Through Well! Consider the Possible GOOD Things About Your
System Consider the Possible BAD Things About Your
System Leave Space for the Unexpected
Starting to Measure Usability Definite Starting Point:
Know the Functional Specifications of Your System (What You Want it to Do; What Tasks the System Should Make Possible for the User )
Think About Possible Problems With the System Start Early
Informal Interviews With Paper Prototypes Cognitive Walkthroughs Heuristic evaluation by usability expert
What/How to Measure Quantitative - Objective
Speed - reaction time Accuracy - number and types of errors Learning Curve - change over time Process - how they did task
Qualitative - Subjective Attitude - like/dislike Opinions - what is good/bad?
Bias in Measures Quantitative
Bias from experimenter what tasks examined what measurements used how measurements taken what subjects covered
Qualitative Bias from experimenter AND subjects
Difficulties with Quantitative/Objective Measures
Measures Actions But Not Thoughts – Thoughts Must Be Inferred
Time spent on task Time spent looking at displays Errors made
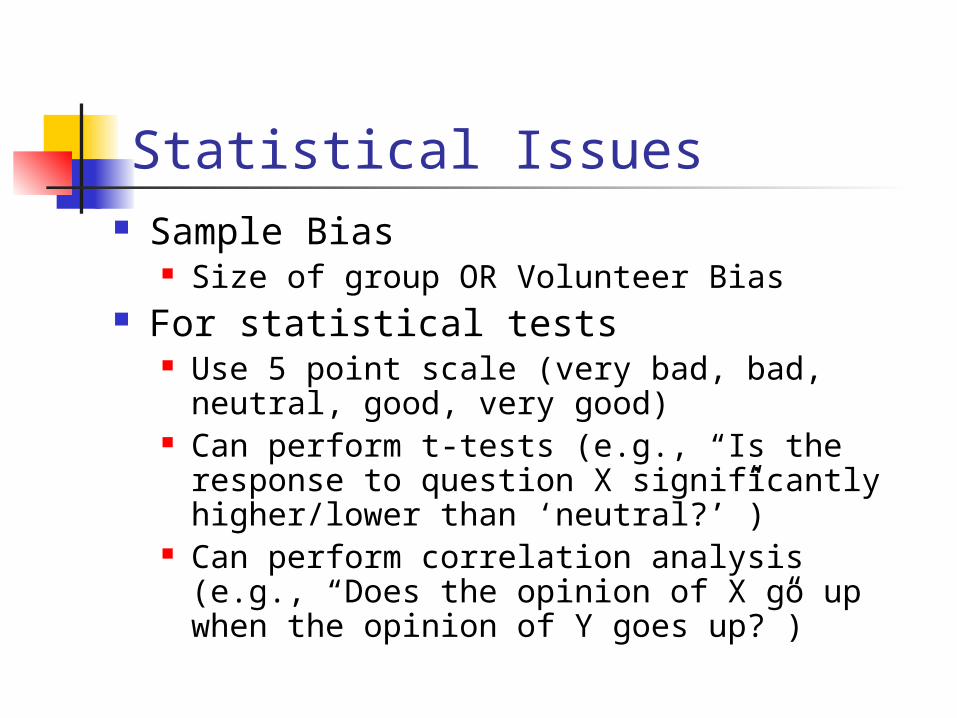
Statistical Issues Sample Bias
Size of group OR Volunteer Bias For statistical tests
Use 5 point scale (very bad, bad, neutral, good, very good)
Can perform t-tests (e.g., “Is the response to question X significantly higher/lower than ‘neutral?’”)
Can perform correlation analysis (e.g., “Does the opinion of X go up when the opinion of Y goes up?”)
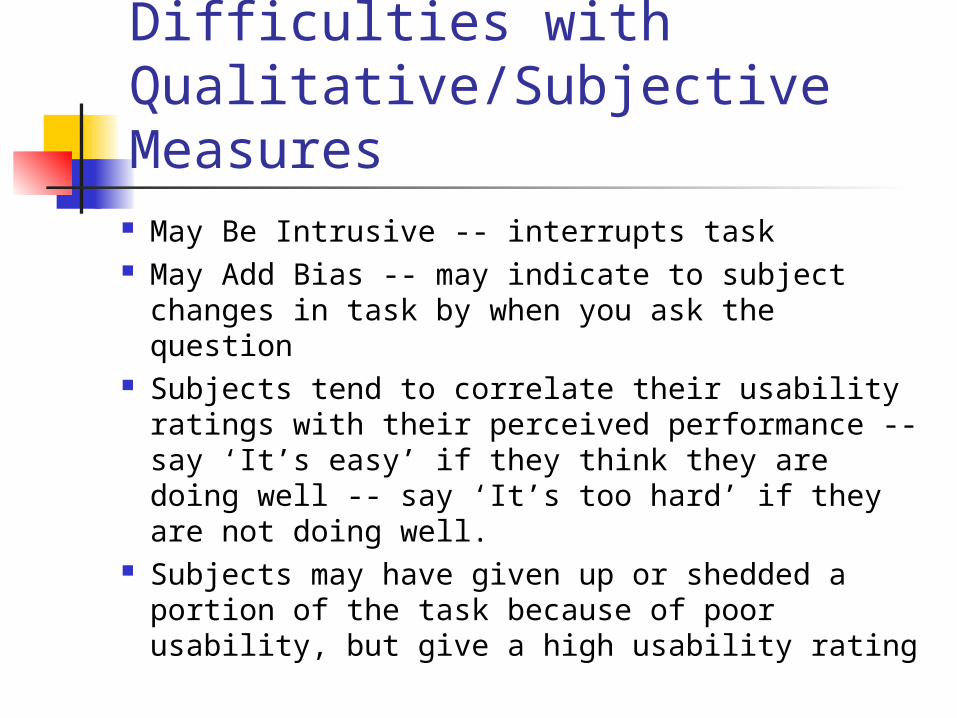
Difficulties with Qualitative/Subjective Measures
May Be Intrusive -- interrupts task May Add Bias -- may indicate to subject
changes in task by when you ask the question Subjects tend to correlate their usability
ratings with their perceived performance -- say ‘It’s easy’ if they think they are doing well -- say ‘It’s too hard’ if they are not doing well.
Subjects may have given up or shedded a portion of the task because of poor usability, but give a high usability rating
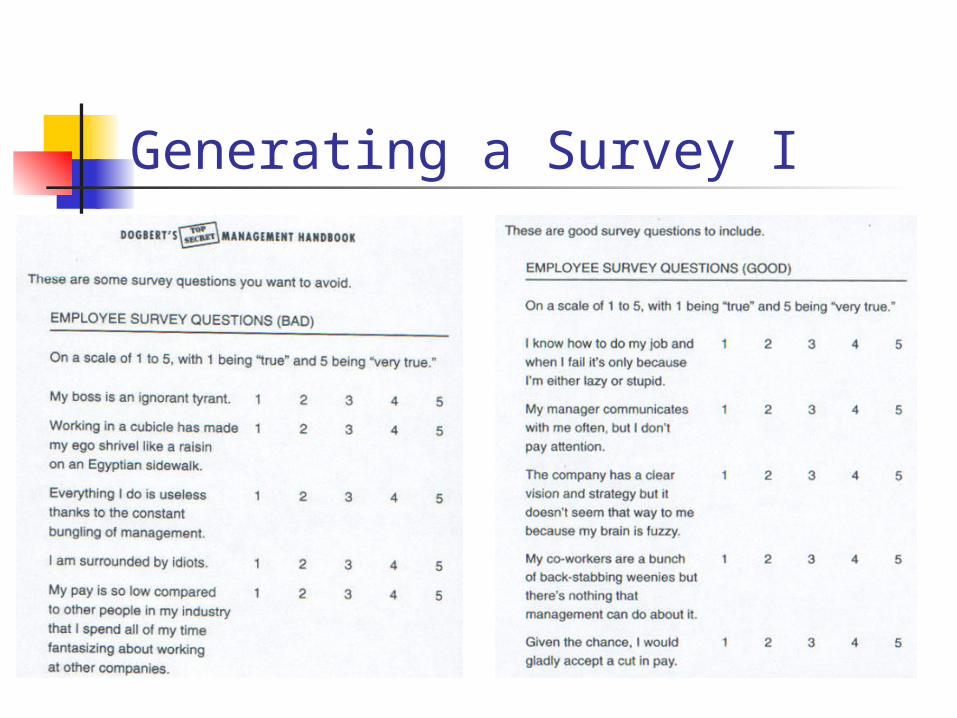
Generating a Survey I
Generating a Survey II Numeric Answers
Gives You Data You Can Tabulate, Analyze, Test for Statistical Significance, Compare Features
Allows You To Get Specific Answers to Specific Questions
Free-Response Questions Gives You Answers You Might Not Have
Thought To Ask For
Considerations in Questioning and Surveying Some People Tend to Answer ‘Yes’ to
Everything -- Others Answer ‘No’ to Everything
Use Unbiased Wording -- Don’t Lead Your Subjects to an Answer
Consider Your Wording VERY CLOSELY -- Does It Ask What You Want To Know?
For Rating Scales, Allow Both Good, Neutral and Bad Ratings.
Don’t Waste Space on Lots of Demographics
Phases of Evaluation
Formative Evaluation During design phase (e.g. with paper
prototypes) Informal Done with designers, don’t involve users
necessarily Checks against usability knowledge
Summative Evaluation During test phase Formal Must involve users
Formative Evaluation: Check Heuristics Simple and Natural Dialogue Speak the User’s Language Minimize the User’s Memory Load Be Consistent Provide Feedback Provide Clearly Marked Exits Provide Shortcuts Provide Good Error Messages Error Prevention (from Molich & Nielsen, 1990, p. 339)
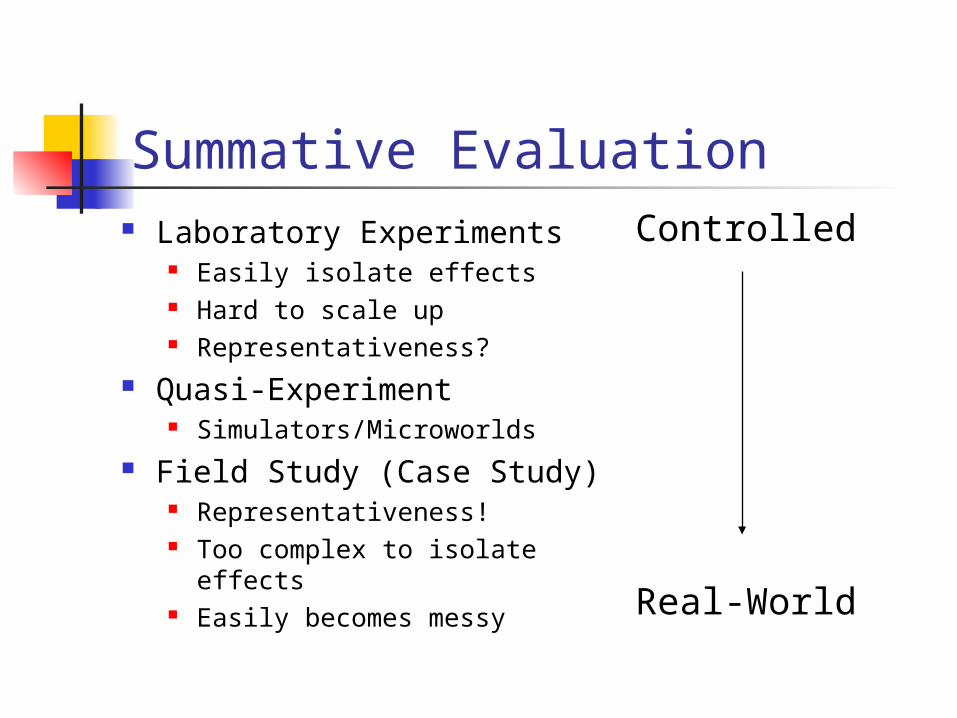
Summative Evaluation Laboratory Experiments
Easily isolate effects Hard to scale up Representativeness?
Quasi-Experiment Simulators/Microworlds
Field Study (Case Study) Representativeness! Too complex to isolate effects Easily becomes messy
Controlled
Real-World
Comparison Evaluation Want to compare:
New vs. Old system or method Two different new designs Two different groups of users Interface characteristics (vary semantics
and syntax): menu structure color coding organization of information direct manipulation vs. keyboard input
Moral: Measuring Usability Concepts Can Be Hard!
Subjective Measures May Add Bias or Be Intrusive
Objective Measures Don’t Necessarily Measure Amount of Thought Required to Use Interface
There are Trade-Offs With Each Type -- These Trade-Offs Must Be Considered in the Selection of Measurements, and in Data Analysis