continuous runtime profiling of openmp applications - vi-hps
TRANSCRIPT

Continuous Runtime Profiling of OpenMP Applications
Karl Fuerlinger, Shirley Moore
{karl,shirley}@cs.utk.edu

Continuous Runtime Profiling| 2Parco 2007, Juelich, Aachen
Outline
Motivation–
OpenMP and tools support
ompP: a profiling tool for OpenMP–
Flat profiles, callgraph
profiles, data model–
Performance properties–
Overhead classification
Continuous runtime profiling–
Adding temporal dimension to profiling-type performance data–
New performance data views:•
Overheads, properties over time•
Performance counter heat-maps–
Examples from the SPEC OpenMP benchmark suite
Conclusion and Future work–
Integration and extension

Continuous Runtime Profiling| 3Parco 2007, Juelich, Aachen
Motivation (1)
OpenMP–
Threads-based and fork/join-oriented programming model–
Worksharing
constructs
Parallel Regions
Master Thread
Characteristics–
Directive based (compiler pragmas, comments)–
Incremental parallelization approach–
Well suited for loop-based parallel programming –
Less well suited for irregular parallelism (task/taskpool concepts to be included in upcoming version 3.0 of the OpenMP specification).
–
One of the contending programming paradigms for the “mutlicore
era”–
Traditional roots in the scientific computing community, but:–
Microsoft Visual C and gcc now support OpenMP

Continuous Runtime Profiling| 4Parco 2007, Juelich, Aachen
Motivation (2)
Tool support for OpenMP is limited–
No standardized tools interface yet, cf. PMPI interface for MPI–
Proposal for interface from SUN for version 3.0 of the OpenMP standard
Vendor specific tools–
SUN Studio, Intel Thread Profiler, Intel Thread Checker–
Limited to the particular platform–
Sampling-based approach–
Work on system-
not user level
Research tools–
Most tools use the POMP proposal for a performance interface for OpenMP developed by Bernd Mohr et al. (FZ Juelich)
–
Accompanying Source-to-source instrumenter
called Opari–
Successful tools for automatic and manual performance analysis have been developed based on this approach
–
TAU (Univ. of Oregon)–
KOJAK (Univ. of Tennessee and FZ Juelich)–
ompP: Pure profiling tool with text-based output
Continuous Runtime Profiling| 5Parco 2007, Juelich, Aachen
Outline
Motivation–
OpenMP and tools support
ompP: a profiling tool for OpenMP–
Flat profiles, callgraph
profiles, data model–
Performance properties–
Overhead classification
Continuous runtime profiling–
Adding temporal dimension to profiling-type performance data–
New performance data views:•
Overheads, properties over time•
Performance counter heat-maps–
Examples from the SPEC OpenMP benchmark suite
Conclusion and Future work–
Integration and extension

Continuous Runtime Profiling| 6Parco 2007, Juelich, Aachen
ompP (1)
ompP is a profiling tool for OpenMP–
Available with user guide and manual under GPL license from http://www.ompp-tool.com
–
Works with all Unix-like OS and OpenMP compiler combinations–
Tested and supported: Linux, Solaris, AIX and Intel, Pathscale, PGI, IBM, gcc
compilers
Source Code Instrumentation: OpenMP constructs, manual region instrumentation
Executable
Execution onparallel machine
Profiling Report
Settings (env. Vars) HW Counters,
output format,…

Continuous Runtime Profiling| 7Parco 2007, Juelich, Aachen
ompP (2)
Characteristics:–
Target application can be written in FORTRAN or C/C++–
ompP
is implemented as a static library linked to the target application–
Source-code instrumentation with Opari–
Simple usage with wrapper script, e.g., kinst-ompp icc –o test test.c–
Setting options as environment variables, e.g., export OMPP_OUTFORMAT=csv–
Reports execution times and counts for various OpenMP constructs–
Data is presented in terms of the user model of execution, not the system model–
Supports HW counters using PAPI–
ASCII based profiling report is delivered at program end

Continuous Runtime Profiling| 8Parco 2007, Juelich, Aachen
ompP (3)
Advanced productivity features–
Evaluators •
Compute expressions involving HW counters directly•
Ex: OMPP_EVAL1=1-L2_MISSES/L2_REFERENCES–
Mid-run dumping of the profiling report is supported•
Useful for long-running applications–
Overhead Analysis•
Four well defined overhead categories of parallel execution•
Analysis for individual parallel region and whole program–
Scalability Analysis•
Analyze overheads for increasing thread counts –
Performance Properties•
Detect common inefficiency situations–
Continuous runtime profiling•
Profiling-over-time adds temporal dimension

Continuous Runtime Profiling| 9Parco 2007, Juelich, Aachen
ompP’s Profiling Report
General Information–
Date, time, duration of the run, number of threads, used hardware counters,…
Region Overview–
Number of regions and their source-code locations
Flat Region Profile–
Inclusive times, counts, hardware counter data
Callgraph (-tree)
Callgraph Profiles–
Inclusive and exclusive data
Overhead Analysis Report–
Four overhead categories, per-parallel region breakdown, absolute times and percentages
Performance Property Detection Report–
Points out common inefficiency situations

Continuous Runtime Profiling| 10Parco 2007, Juelich, Aachen
R00002 main.c (34-37) (default) CRITICALTID execT execC bodyT enterT exitT PAPI_TOT_INS
0 3.00 1 1.00 2.00 0.00 15951 1.00 1 1.00 0.00 0.00 63472 2.00 1 1.00 1.00 0.00 15953 4.00 1 1.00 3.00 0.00 1595
SUM 10.01 4 4.00 6.00 0.00 11132
Flat Region Profile (1)
Example:
Components:–
Region Number–
Source code location and region type–
Timing data and execution counts, depending on the particular construct–
One line per thread, last line sums over all threads–
Hardware counter data (if PAPI is available and HW counters are selected)

Continuous Runtime Profiling| 11Parco 2007, Juelich, Aachen
Flat Region Profile (2)
Times and counts reported by ompP for various OpenMP constructs
____T: time
____C: count
Main = enter + body + barr + exit

Continuous Runtime Profiling| 12Parco 2007, Juelich, Aachen
Overhead Analysis (1)
Certain timing categories reported by ompP can be classified as overheads:
–
Example: exitBarT: Time wasted by threads idling at the exit barrier of work-
sharing constructs. Reason is most likely an imbalanced amount of work
Four overhead categories are defined in ompP:
–
Imbalance: waiting time incurred due to an imbalanced amount of work in a
worksharing
or parallel region
–
Synchronization: overhead that arises due to threads having to synchronize their activity, e.g. barrier call
–
Limited Parallelism: idle threads due not enough parallelism being exposed by the program
–
Thread management: overhead for the creation and destruction of threads, and for signaling critical sections, locks as available
Continuous Runtime Profiling| 13Parco 2007, Juelich, Aachen
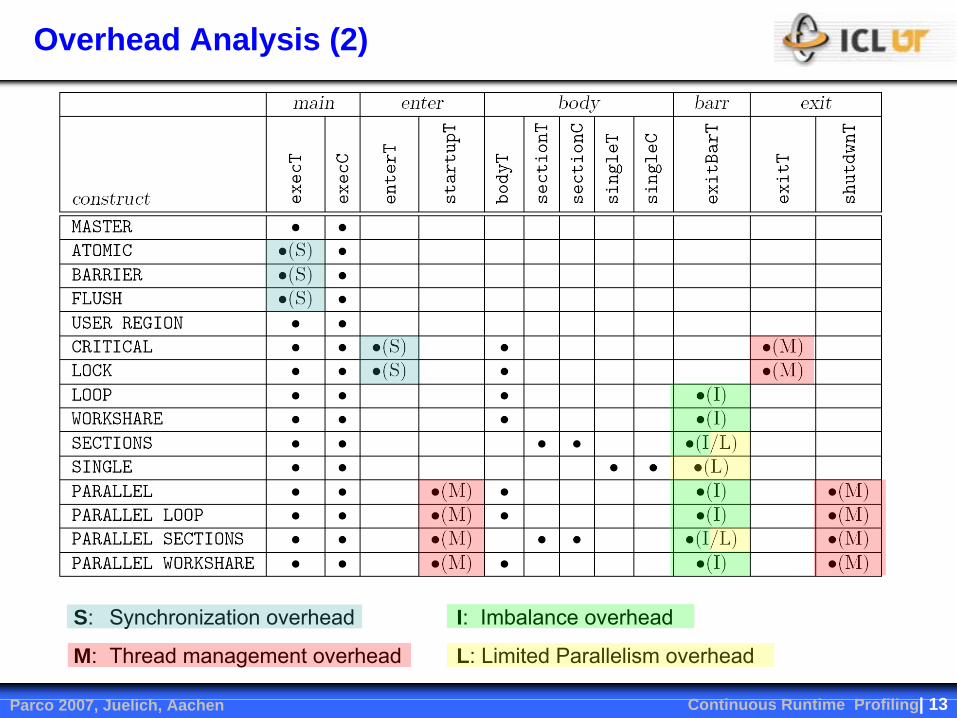
Overhead Analysis (2)
S:
Synchronization overhead
I: Imbalance overhead
M:
Thread management overhead
L: Limited Parallelism overhead

Continuous Runtime Profiling| 14Parco 2007, Juelich, Aachen
OpenMP Scalability Analysis
Methodology–
Classify execution time into “Work”
and four overhead categories: “Thread Management”, “Limited Parallelism”, “Imbalance”, “Synchronization”
–
Analyze how overheads behave for increasing thread counts–
Graphs show accumulated runtime over all threads for fixed workload (strong scaling)
–
Application example: 314.mgrid_m from the SPEC OpenMP benchmark suite
Scaling from 2 to 32 processors on an SGI Altix machine
Markedly smaller load imbalance for thread counts of 32 and 16. Only three parallel loops show this behavior
In all three cases, the iteration count is always a power of two (2 to 256), hence thread counts which are not a power of two exhibit larerload imbalance

Continuous Runtime Profiling| 15Parco 2007, Juelich, Aachen
Property ImabalanceInParallelRegion{let
}
Performance Properties (1)
Other way to look at overheads–
Example: parallel region with 4 threads, load is imbalanced
exitBarT[i] time that thread i spends in the “exit barrier”, quantifies load imbalance
0 1 2 3
imbal=exitBarT[0]+…+exitBarT[N-1];
Condition: (region.type)==PARALLEL && (imbal>0.0);
Severity: imbal/(total runtime * number of threads);
ASL formalism to specify properties

Continuous Runtime Profiling| 16Parco 2007, Juelich, Aachen
Performance Properties (2)
Detection of common inefficiency situations:–
Severity is fraction of total runtime lost due to the inefficiency–
Supported performance properties:•
WaitAtBarrier•
ImbalanceInParallelRegion•
ImbalanceInParallelLoop, -Workshare
,-Sections•
ImbalanceDueToNotEnoughSections•
ImbalanceDueToUnevenSectionDistribution•
CriticalSectionContention, LockContention•
FrequentAtomic•
InsufficienWorkInParallelLoop•
UnparallelizedInMasterRegion, -SingleRegion
-------------------------------------------------------------------------- ompP Performance Properties Report ---------------------------------------------------------------------------------------------
PROPERTY 'ImbalanceInParallelRegion' holds for'PARALLEL zaxpy.F (48-81)', with a severity of 0.041476
PROPERTY 'ImbalanceInParallelLoop' holds for'LOOP zaxpy.F (55-59)', with a severity of 0.035408
...
Continuous Runtime Profiling| 17Parco 2007, Juelich, Aachen
Outline
Motivation–
OpenMP and tools support
ompP: a profiling tool for OpenMP–
Flat profiles, callgraph
profiles, data model–
Performance properties–
Overhead classification
Continuous runtime profiling–
Adding temporal dimension to profiling-type performance data–
New performance data views:•
Overheads, properties over time•
Performance counter heat-maps–
Examples from the SPEC OpenMP benchmark suite
Conclusion and Future work–
Integration and extension

Continuous Runtime Profiling| 18Parco 2007, Juelich, Aachen
Continuous Runtime Profiling
Profiling vs. Tracing–
Profiling: •
Low overhead, smaller amounts of data•
Easier to comprehend, textual interpretation possible–
Tracing: •
Large quantities of data, hard to comprehend manually•
Can explain temporal phenomena, causal relationships of events are preserved
Continuous runtime profiling: try to combine advantages of profiling and tracing–
Add a temporal dimension to profiling-type performance data–
See what happens during the execution without capturing full traces–
Manual interpretation becomes harder since a new dimension is added to the performance data
“One-shot”
Profiling
Continuous Profiling
Implementation:–
Capture and dump profiling reports not only at the end of the execution but several times while the application executes
–
Analyze how profiling reports change over time
time

Continuous Runtime Profiling| 19Parco 2007, Juelich, Aachen
Continuous Runtime Profiling
Triggers for capturing profiles:–
Timer-based, fixed: capture profiles in regular, uniform intervals: predictable storage requirements (depends only on duration of program run, size of dataset).
–
Timer-based, adaptive: Adapt the capture rate to the behavior of the application: dump often if application behavior changes, decrease rate if application behavior stays the same
–
Overflow-based: Dump a profile if a hardware counter overflows. Interesting for floating point intensive application
–
User-added: Expose API for dumping profiles to the user aligned to outer loop iterations or phase boundaries

Continuous Runtime Profiling| 20Parco 2007, Juelich, Aachen
Continuous Runtime Profiling
Trigger currently implemented in ompP:–
Capture profiles in regular intervals (selectable, 1 sec used in
the experiments)–
Timer signal is registered and delivered to profiler–
Profiling data up to capture point stored to memory buffer–
Dumped as individual profiling reports at the end of program execution–
Perl scripts to analyze reports and generate graphs
Experiments–
SPEC OpenMP benchmark suite•
Medium variant, 11 applications
–
32 CPU SGI Altix
machine•
Itanium-2 processors with 1.6 GHz and 6 MB L3 cache•
Used in batch mode

Continuous Runtime Profiling| 21Parco 2007, Juelich, Aachen
Continous Profiling: Data Views (1)
1. Region invocations over Time–
See which OpenMP region was executed how often and when during the execution of the application
–
Either for a particular thread or summed over all threads–
Two most time-consuming regions of application 328.fma3d:
2: Region execution time over time–
same as invocations but use time instead of execution count

Continuous Runtime Profiling| 22Parco 2007, Juelich, Aachen
Continuous Profiling: Data Views (2)
3. Overheads over time–
See how overheads develop over the application run–
How is each Δt (1sec) spent for work or for one of the overhead classes–
Either for whole program or for a specific parallel region–
Total incurred overhead=integral under this function
Application: 328.fma3d_m
Initialization in a critical section, effectively serializing the execution for approx. 15 seconds. Overhead=31/32=96%

Continuous Runtime Profiling| 23Parco 2007, Juelich, Aachen
Continuous Profiling: Data Views (3)
4. Performance Properties over time–
Severity: negative impact on performance up to the capture point: percentage of CPU time lost due to inefficiency situation

Continuous Runtime Profiling| 24Parco 2007, Juelich, Aachen
Continuous Profiling: Data Views (4)
4. Performance Properties over time (contd.)–
318.galgel–
324.equake

Continuous Runtime Profiling| 25Parco 2007, Juelich, Aachen
Continuous Profiling
Performance counter heatmaps–
x-axis: Time, y-axis: Thread-ID–
Color: number of hardware counter events observed during sampling period–
Application “applu”, medium-sized variant, counter: LOADS_RETIRED–
Visible phenomena: iterative behavior, thread grouping (pairs)

Continuous Runtime Profiling| 26Parco 2007, Juelich, Aachen
Continuous Profiling
Performance counter heatmaps (contd.)–
Application “apsi”, medium-sized variant, counter: FP_OPS_RETIRED–
Visible phenomena: difference in thread behavior. Maybe related to placement of threads on processors

Continuous Runtime Profiling| 27Parco 2007, Juelich, Aachen
Continuous Profiling
Performance counter heatmaps contd.–
Application “galgel”, medium-sized variant, counter: DATA_EAR_CACHE_LAT1024–
Visible phenomena: iterative behavior, stagger-pattern –
Middle of the timeline cut-out
Continuous Runtime Profiling| 28Parco 2007, Juelich, Aachen
Outline
Motivation–
OpenMP and tools support
ompP: a profiling tool for OpenMP–
Flat profiles, callgraph
profiles, data model–
Performance properties–
Overhead classification
Continuous runtime profiling–
Adding temporal dimension to profiling-type performance data–
New performance data views:•
Overheads, properties over time•
Performance counter heat-maps–
Examples from the SPEC OpenMP benchmark suite
Conclusion and future work–
Integration and extension

Continuous Runtime Profiling| 29Parco 2007, Juelich, Aachen
Conclusion
Continuous runtime profiling –
Add temporal dimension to profiling type performance data–
Good balance between simplicity of profiling and insight of tracing
Phenomena that can be identified–
Temporal location of contention for resources–
When constructs get executed–
Grouping of threads–
Iterative behavior

Continuous Runtime Profiling| 30Parco 2007, Juelich, Aachen
Future Work
Integration with MPI profiler mpiP–
Profiling for mixed-parallel codes–
Different models of combined usage of OpenMP and MPI–
MPI-time as communication overhead in ompP’s
overhead analysis
Support for nested OpenMP parallelism–
Increasing interest in this model due to hierarchical organization
of processing elelements
Further investigation of continuous profiling–
Other triggers (API, hardware-counter based)–
Analyze and explain visible patterns, starting from application kernels.
http://www.ompp-tool.com
Thank you for your attention!

Continuous Runtime Profiling| 31Parco 2007, Juelich, Aachen
Backup Slides
Continuous Runtime Profiling| 32Parco 2007, Juelich, Aachen
Overhead Analysis Report
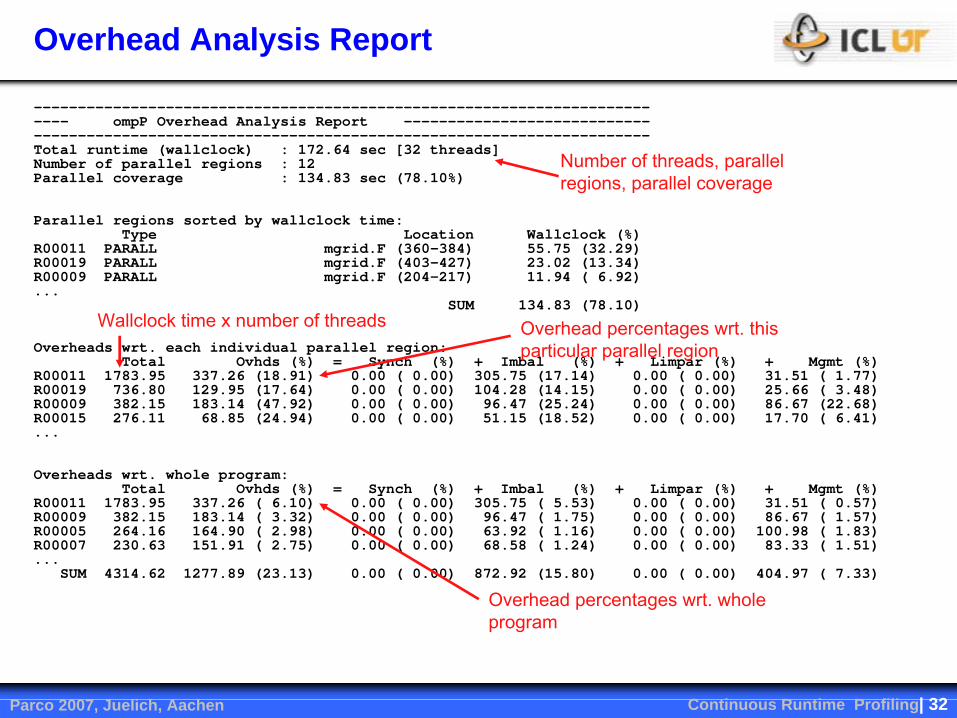
-------------------------------------------------------------------------- ompP Overhead Analysis Report --------------------------------------------------------------------------------------------------Total runtime (wallclock) : 172.64 sec [32 threads]Number of parallel regions : 12Parallel coverage : 134.83 sec (78.10%)
Parallel regions sorted by wallclock time:Type Location Wallclock (%)
R00011 PARALL mgrid.F (360-384) 55.75 (32.29)R00019 PARALL mgrid.F (403-427) 23.02 (13.34)R00009 PARALL mgrid.F (204-217) 11.94 ( 6.92)...
SUM 134.83 (78.10)
Overheads wrt. each individual parallel region:Total Ovhds (%) = Synch (%) + Imbal (%) + Limpar (%) + Mgmt (%)
R00011 1783.95 337.26 (18.91) 0.00 ( 0.00) 305.75 (17.14) 0.00 ( 0.00) 31.51 ( 1.77)R00019 736.80 129.95 (17.64) 0.00 ( 0.00) 104.28 (14.15) 0.00 ( 0.00) 25.66 ( 3.48)R00009 382.15 183.14 (47.92) 0.00 ( 0.00) 96.47 (25.24) 0.00 ( 0.00) 86.67 (22.68)R00015 276.11 68.85 (24.94) 0.00 ( 0.00) 51.15 (18.52) 0.00 ( 0.00) 17.70 ( 6.41)...
Overheads wrt. whole program:Total Ovhds (%) = Synch (%) + Imbal (%) + Limpar (%) + Mgmt (%)
R00011 1783.95 337.26 ( 6.10) 0.00 ( 0.00) 305.75 ( 5.53) 0.00 ( 0.00) 31.51 ( 0.57)R00009 382.15 183.14 ( 3.32) 0.00 ( 0.00) 96.47 ( 1.75) 0.00 ( 0.00) 86.67 ( 1.57)R00005 264.16 164.90 ( 2.98) 0.00 ( 0.00) 63.92 ( 1.16) 0.00 ( 0.00) 100.98 ( 1.83)R00007 230.63 151.91 ( 2.75) 0.00 ( 0.00) 68.58 ( 1.24) 0.00 ( 0.00) 83.33 ( 1.51)...
SUM 4314.62 1277.89 (23.13) 0.00 ( 0.00) 872.92 (15.80) 0.00 ( 0.00) 404.97 ( 7.33)
Number of threads, parallel regions, parallel coverage
Wallclock
time x number of threads Overhead percentages wrt. this particular parallel region
Overhead percentages wrt. whole program