hps weekly report - documents.hps.scot.nhs.uk · hps weekly report correspondence to: the editor,...
TRANSCRIPT

HPS Weekly Report
Correspondence to:The Editor, HPS Weekly ReportHPS, Clifton House, Clifton Place Glasgow, G3 7LNScotland
T 0141-300 1100 F 0141-300 1172
E [email protected] http://www.ewr.hps.scot.nhs.uk/
Printed in the UKHPS is a division of the NHS National Services Scotland Registered as a newspaper at the Post Office © HPS 2009
14 January 2009Volume 43 No. 2009/02ISSN 1753-4224 (Online)
Contents
CURRENT NOTES
• HPSfiguresshowprogressagainstHAIs
• HepatitisC–testinganddiagnosisinprimarycare
• Wildlifecentretracesvolunteersfollowingrabiesdeath
• Mortalityandcancerrisksforradiationworkers
• HSEcampaignonRespirableCrystallineSilica
• Influenzatable
pages 12 - 13
SURVEILLANCE REPORTS
• AnnualReportontheSurveillanceofClostridiumdifficileAssociatedDisease(CDAD)inScotland,October2007-September2008
pages 14 - 23
• ScottishSurveillanceofHealthcareAssociatedInfectionProgrammeQuarterlyreportonStaphylococcus aureusbacteraemiasinScotland,January2003–September2008
pages 24 - 29
NOTIFIABLE TABLES
to 2/1/2009
pages 30 - 31
CURRENT NOTES
HPS figures show progress against HAIs43/0201 HPS is today publishing the latest quarterly reports for Staphylococcus aureus bacteraemia (including MRSA and MSSA) and hand hygiene compliance. HPS is also publishing the second Annual Report on the Surveillance of Clostridium difficile Associated Diseases (CDAD) in Scotland, which also incorporates the latest quarterly figures on CDAD.The latest figures from mandatory surveillance for 1 July 2008 to 30 September 2008, show that the number of S. aureus bacteraemia was 522, the lowest reported quarterly total in the previous eighteen months. Our surveillance of S. aureus now shows a year on year decrease of 7% in the number of cases. For MRSA bacteraemia the number (149 cases) and rate (0.126 per 1000 acute occupied bed days) was the lowest quarter reported since the initiation of this surveillance programme in 2001.The latest figures from the mandatory surveillance of CDAD in persons aged 65 and over show no significant difference in the overall annual incidence rate (2007/08 - 1.29 cases per 1000 occupied bed days; 2006/07 - 1.26 cases per 1000 occupied bed days). For the quarter 1 July 2008 to 30 September 2008, a total of 1433 cases were reported, with an overall rate of 1.15 cases per 1000 occupied bed days, corresponding to a 14% decrease in the overall rate relative to the previous quarter. The reduction in the overall rate (and the total number of cases) could be partly due to seasonality and partly to successful interventions such as improved infection control practices and antimicrobial prescribing.The latest quarterly report from the National Hand Hygiene Campaign indicates that NHS Scotland exceeded the 90% target set by the Cabinet Secretary for Health and Wellbeing in November 2007 with a national compliance figure of 93%. The results of this latest audit, undertaken in November 2008, represent the highest compliance achieved so far in the National Hand Hygiene Campaign. Since the first audit report was published in December 2007 healthcare staff have demonstrated a high level of commitment to improving hand hygiene, and this is reflected in the audit results, collated from February 2007 onwards, which show continued improvement within all staff groups.The CDAD report appears in full in this issue of the HPS Weekly Report which also features an abridged version of the Staphylococcus aureus bacteraemia report (the full report can be accessed at http://www.hps.scot.nhs.uk/haiic/sshaip/publicationsdetail.aspx?id=30248). The hand hygiene report can be accessed at http://www.hps.scot.nhs.uk/haiic/ic/nationalhandhygienecampaign.aspx.
Hepatitis C – testing and diagnosis in primary care43/0202 In May 2008 the Scottish Government launched its Phase II Hepatitis C Action Plan (http://www.scotland.gov.uk/Publications/2008/05/13103055/0). On 5 January, the Scottish Chief Medical Officer wrote to general practitioners to stress the good clinical reasons and the need for considering and testing for hepatitis C in primary care.Hepatitis C is difficult to diagnose clinically as it can mimic other conditions. People can also have the virus for up to 30 years without developing any symptoms. There is therefore a need to increase the number of people with hepatitis C being treated. This needs increased awareness of the possibility of hepatitis C infection and, in turn, increased levels of testing and diagnosis across Scotland.The CMO’s letter appends for ease of reference an extract from the SIGN guidelines on hepatitis C, highlighting the type of patients that should be considered for hepatitis C testing. The full SIGN guidelines can be accessed on the hepatitis C website at: http://www.hepcscotland.co.uk/health-care-professionals/the-sign-guideline/about-the-guideline/index.html. Further, the Royal College of General Practitioners Guidance for the Prevention,Testing, Treatment and Management of Hepatitis C in Primary Care can be accessed at: http://www.smmgp.org.uk/download/guidance/guidance003.pdf. The Hepatitis C Action Plan has an overarching aim of increasing the numbers of people being treated with antiviral therapy from less than 500 a year to 2,000 a year. At this higher rate of treatment over the next two decades, 2,500 cases of hepatitis C related cirrhosis without liver failure and 2,700 cases of cirrhosis with liver failure would be prevented. [Source: CMO Letter CMO(2009)01, 5 January 2009. http://www.sehd.scot.nhs.uk/cmo/CMO(2009)01.pdf]
Wildlife centre traces volunteers following rabies death43/0203 The Health Protection Agency is working with colleagues in South Africa and Northern Ireland to trace volunteers who have worked at the Riverside Wildlife Rehabilitation and

HP
S W
EE
KLY R
EP
OR
T Volum
e 43 No.2009/02
14 January 2009
13
Environmental Education Centre in Limpopo, South Africa. This follows the recent death from rabies of a young woman in Northern Ireland who had worked at the centre in December 2006.The woman is thought to have acquired rabies following a bite from a dog whilst working at the animal sanctuary. The Centre has written to all those who have volunteered there since July 2006 as a precautionary measure. It is understood that approximately 230 UK citizens have worked at the centre since July 2006. However, the number who have had direct contact with a dog or mongoose may be very small. Aside from dog bites, rabies can occasionally be transmitted by scratches or licks on the face or cuts. However simply touching or stroking a dog does not constitute a risk. Volunteers are being advised that if they have been bitten, scratched or licked on the face or on an open wound by a dog or mongoose either within the Centre or in the surrounding area, they should seek medical advice from a health professional to determine whether they require preventive treatment with rabies vaccine. For UK citizens this should be from their GP or NHS Direct (in Scotland, NHS 24). Rabies vaccine is extremely effective at preventing rabies even when this is given some time after an exposure. [Source: HPA Press Release, 13 January 2009. http://www.hpa.nhs.uk/webw/HPAweb&HPAwebStandard/HPAweb_C/1231836544247?p=1231252394302]
Mortality and cancer risks for radiation workers43/0204 The risk of developing cancer among radiation workers increases with the dose of ionising radiation they are exposed to, according to a study by the Health Protection Agency published last week in the British Journal of Cancer. The observed cancer risks are consistent with the international scientific consensus on radiation protection.This study provides the most precise estimates to date of mortality and cancer risks following occupational radiation exposure and strengthens the scientific evidence for raised risks from these exposures. The cancer risk estimates are consistent with international radiation protection standards, both for leukaemia and for all other cancers combined. Continued follow-up of these workers will be valuable in determining whether radiation-associated risks vary over time or by age, and enables the study of specific cancers and causes of death in more detail. It is hoped that the research will also make a useful contribution to wider national and international studies on the effects of occupational exposures to ionising radiation.In a separate paper published at the same time, researchers at the Childhood Cancer Research Group at the University of Oxford and the Health Protection Agency have studied cancer in the children of female radiation workers. This study does not support an earlier finding of a raised risk of cancer. In a subgroup of women who worked with radiation during pregnancy, a weak statistical association was found between maternal radiation work and childhood cancer, but the evidence is limited by the small numbers involved and the result may be due to chance.The articles can be accessed at http://www.nature.com/bjc/journal/v100/n1/abs/6604825a.html (mortality and cancer incidence) and http://www.nature.com/bjc/journal/v100/n1/abs/6604841a.html (Cancer in the offspring of female radiation workers).
HSE campaign on Respirable Crystalline Silica43/0205 In 2004, more than 500 construction workers lost their lives to lung cancer and even more were suffering from silicosis as a result of inhaling a dangerous substance called Respirable Crystalline Silica, (known as ‘silica dust’ or ‘RCS’). These striking estimates are based on HSE-funded research.Found in stone dust, RCS is easily inhaled if unprotected construction workers are involved in cutting stone and concrete such as kerbs or paving blocks. The effects of silicosis can leave sufferers breathless and unable to do sport, or daily activities normally taken for granted. Sufferers can be rendered housebound and dependent upon bottled oxygen. HSE’s ‘Clear The Air!’ multimedia campaign was produced in collaboration with the construction industry. A DVD, leaflets and online forums show construction workers how to protect themselves from inhaling RCS. More than 240,000 leaflets and 3,000 copies of the DVD have been requested by industry.HSE has three top requests for the construction industry and their suppliers:• To use methods, materials and equipment to meet the legal requirements. • To ensure standards are being achieved. • Inform colleagues, employees and others of the risk.
Copies of the DVD and leaflets are available by calling 0151 951 5828 or accessing the specially-devised website on kerb cutting safety: http://webcommunities.hse.gov.uk/inovem/inovem.ti/kerbcutting.community. [Source: HSE Press Release, 6 January 2009. http://www.hse.gov.uk/press/2009/e09067.htm]
Influenza Table
Further details on current influenza rates and serology are available in the HPS Influenza Update Scotland at http://www.hps.scot.nhs.uk/resp/influenzareports.aspx.
INFLUENZA TABLE: Reports from GP spotter practices of consultations for flu-like illness, rates per 100,000
WEEK No. WEEK ENDING AA BR DG FF FV GG GR HG LN LO OR TY WI SCOTLAND
52 26/12/08 185 22 133 23 82 63 N/R 55 35 126 N/R 116 71 73
1 2/01/09 208 79 117 48 180 51 152 36 0 30 29 136 178 79
2 9/01/09 241 57 25 66 108 72 134 43 33 126 29 163 195 92
N/R no return

HP
S W
EE
KLY R
EP
OR
T Volum
e 43 No.2009/02
14 January 2009
14
Surveillance Reports
Annual Report on the Surveillance of Clostridium difficile Associated Disease (CDAD) in Scotland, October 2007-September 2008
Prepared by: The HPS C. difficile working Group
Executive Summary
• This is the second annual report of the CDAD mandatory surveillance programme for Scotland.
• This report covers the total number of cases and incidence rates of CDAD during the period October 2007-September 2008 in patients aged 65 and older. In addition, the report includes data for the third quarter of 2008 (July-September 2008) and replaces the quarterly report.
• The rate of CDAD (per occupied bed days (OCBDs) is a more accurate measure of the relative burden of infection than the total number of cases, as it takes into account the population at risk (i.e. the persons in hospital).
• The total number of cases reported during October 2007-September 2008 was 6631 for the whole of Scotland for an overall annual incidence rate of 1.29 cases of CDAD per 1000 total OCBDs.
• While the total number of cases has increased between 2006/7 and 2007/8 (from 6035 to 6631), the change in the overall incidence rate is not statistically significant (1.26 in 2007 compared to 1.29 in 2008).
• In the third quarter of 2008 there were 1433 cases in persons aged 65 and over; a 17% decrease from the previous quarter where 1732 cases were reported. The overall quarterly rate was 1.15 cases of CDAD per 1000 total OCBDs, which corresponds to a 14% decrease compared to the previous quarter where a rate of 1.33 per 1000 total OCBDs was reported.
• There was no significant difference in the overall quarterly rate between the third quarter of 2007 (1.16 cases of CDAD per 1000 total OCBDs) and the third quarter of 2008 (1.15 cases of CDAD per 1000 total OCBDs).
• Further statistical analysis is presented on trends in each NHS board (and Scotland) including the first two years of data collection. The statistical analysis suggests seasonal variation in CDAD rates in all NHS boards.
• Ribotype 106 remains the most common type reported in Scotland followed by ribotype 001. Ribotypes 027 and 078 have emerged. All ribotypes isolated were sensitive to metronidazole and vancomycin.
• The National Surveillance Programme is retrospective (i.e. three months in arrears) and does not replace the need for local monitoring of cases of CDAD.
1. Introduction
The Scottish surveillance programme monitors the occurrence of CDAD in all patients aged 65 and over, with diarrhoea, and who have been in contact with the healthcare system, including acute and non-acute hospitals and primary care.
This report covers the second year of data collection (October 2007-September 2008), (2007/8) under the mandatory CDAD surveillance programme. Data from 14 NHS boards are presented and compared to the data from the first year of the data collection (October 2006-September 2007), (2006/7). Cases have been reported from NHS Golden Jubilee National Hospital since the second quarter of 2008, but these are not included in the analysis of the Scottish CDAD data as the healthcare provision in this board differs considerably from the other 14 NHS boards.
In addition, the report includes the latest quarterly data from the third quarter of 2008 (July-September 2008). No separate quarterly report is produced for this quarter.
2. Methods
2.1 Laboratory testing
Diarrhoeal stools from patients, aged 65 and older, were tested for toxin A and B using either an immunoassay or a cytotoxicity assay. A diarrhoeal stool is defined as a specimen that takes
the shape of its container. A case of CDAD is someone in whose stool C. difficile toxin has been identified at the same time as they have diarrhoea not attributable to any other cause, or from patients from whose stool C. difficile has been cultured at the same time as they have been diagnosed with pseudomembranous colitis (PMC).
A reference laboratory for C. difficile was established in Scotland in November 2007. All local diagnostic laboratories submit isolates from severe cases of CDAD and suspected outbreaks to the reference laboratory for typing and susceptibility testing.
Isolates of C. difficile were typed using PCR ribotyping according to the method described by O’Neill et al.1 Variable-length intragenic spacer regions of the rRNA complex were amplified by PCR, and ribotype patterns were compared directly with those of reference strains obtained from the UK national reference laboratory for C. difficile in Cardiff. The Minimum Inhibitory Concentration (MIC) was determined against nine antibiotics using Etest (AB Biodisk, Solna, Sweden). Resistance breakpoints were derived from the Clinical and Laboratory Standards Institute (CLSI) criteria and aligned with those used in England and Wales: cefotaxime, (CEFO), (64μg/ml), clindamycin, (CLIN), (≥8μg/ml), erythromycin, (ERYT), (≥8μg/ml), levofloxacin, (LEVO), (≥8μg/ml), meropenem, (MERO), (≥16μg/ml), metronidazole, (METR) (≥32μg/ml), moxifloxacin, (MOXI), (≥8μg/ml), piperacillin-tazobactam (PIP/T), (≥128μg/ml), and vancomycin (VANC), (≥16μg/ml).
Please note CDI rates in this report have been updated due to a subsequent revision of the national figures of hospital activity. Please go to http://www.hps.scot.nhs.uk/haiic/sshaip/publicationsdetail.aspx?id=50174 for the newest revised data.

HP
S W
EE
KLY R
EP
OR
T Volum
e 43 No.2009/02
14 January 2009
15
2.2 Reporting
Rates of CDAD are presented by NHS board. Each case is allocated to an NHS board based on the location of the diagnostic laboratory where the specimen was tested. The surveillance does not distinguish between cases from acute, non-acute hospitals, and the community. It is currently assumed that all cases have been in contact with the healthcare system within 12 weeks of acquiring CDAD and therefore can be classified healthcare associated cases. Duplicates have been removed. If a case is diagnosed twice within a 28-day period the second toxin positive test is considered a duplicate.
Approximately 80% of the case reports were received by HPS via the electronic reporting system ECOSS. Where available, de-duplicated ECOSS data are used for calculating the total number of cases for the national dataset. For those laboratories that are not yet using ECOSS, data from weekly paper-based reports sent to HPS are used.
Because it is frequently not available, the date of onset of illness is not reported; the date of collection of the specimen from the patient is instead taken as a proxy for the onset of illness for the ECOSS reports. When this date is not available the date of receiving the specimen or date of reporting is used. Before entering the data into the dataset, each diagnostic laboratory reviews the data originating from themselves to confirm the validity of the data received by HPS.
The current NHS boards for Scotland are used for generating the national dataset. Cases from the previous Argyll & Clyde NHS board laboratories, including Vale of Leven, Inverclyde and Paisley, are now counted under the new Greater Glasgow & Clyde NHS board, while cases from Oban are counted under the Highland NHS board.
2.3 Data analysis
Calculation of ratesThe incidence of CDAD per NHS board area was calculated as follows:
Rate per 1000 occupied bed days = number of CDAD cases * 1000
occupied bed days ≥ 65 y.o. in NHS board area
The number of total occupied bed days (total OCBDs) includes patients in acute hospitals and patients in non-acute geriatric medicine and geriatric long-term stay wards except for psychiatry and obstetrics. The bed day data, used to analyse the 2007/8 data, were from the period October 2006-September 2007.
Overall rates (per quarter or per year) were calculated by dividing the sum of all cases by the sum of all occupied bed days reported in that specific period (quarter or year) and normalising the rate to cases per 1000 total OCBDs (as above).
In contrast to previous reports, this and future reports do not contain rates for acute beds only, as these rates are unsuitable for monitoring CDAD in Scotland.2
Denominators for the new NHS board, Greater Glasgow & Clyde, were calculated as the sum of the two former boards, Greater Glasgow and Argyll & Clyde.
In addition to the rates per occupied bed days, the rate of disease was also calculated per 100,000 inhabitants ≥ 65 years old for each NHS board. The population data used is the mid-2005 population data.
Rate per 100,000 inhabitants = number of CDAD cases * 100,000
inhabitants ≥ 65 in NHS Board area
Identification of outliers A funnel plot was produced for the incidence of CDAD in 14 NHS boards in the period July-September 2008. The statistical analysis was based on an over-dispersed Poisson regression model with the logarithm of the total occupied bed days as an offset. In the funnel plot, the incidence rates of CDAD per 1000 total OCBDs were plotted against the number of occupied bed days in 100,000s along with 95% confidence limits. Incidence rates outside the 95% confidence limits are considered outliers.
Analysis of trendsAnalysis of the trends in the rates of CDAD was carried out within the same statistical model, including terms for Health Board, Year and Quarter. Hypothesis tests were carried out using F tests based upon the large sample approximation to the normal distribution. Model checking was accomplished using residual plots and these demonstrated that the model assumptions were reasonable. The trends analysis includes the first eight quarters of data collection.
3. Results
3.1 Surveillance data
Annual data for October 2007-September 2008 In 2007/8, HPS received case reports from 25 diagnostic laboratories in 14 NHS boards.
The total number of cases identified in 2007/8 was 6631. In addition four cases were reported from the Golden Jubilee National Hospital (these are not included in the further analysis).
In total, 99.2 % of cases in this report were confirmed by the laboratories that reported them. The total numbers of cases by NHS board are listed in Table A1.
The total number of cases has increased 10% compared to 2006/7, the first year of the surveillance, when 6035 cases were reported.
The annual overall rate for Scotland per 1000 total OCBDs in patients ≥ 65 years old was 1.29 (95% CI 1.26, 1.32) in 2007/8, compared to 1.26 (95% CI 1.23, 1.29) in 2006/7. Quarterly rates of CDAD for the 14 NHS boards per 1000 total OCBDs are presented in Figure 1, and listed together with overall annual rates in Table A2. Comparisons with cases and rates in the first year of the surveillance (2006/7) can be found in table A3.
NHS Highland had decreasing rates throughout the four quarters, while Dumfries & Galloway, Fife, Greater Glasgow & Clyde, and Lanarkshire had decreasing rates throughout the last three quarters of reporting (from January 2008-Septemer 2008). NHS Ayrshire & Arran had increasing rates throughout the four quarters while the remaining boards had fluctuating rates.
Please note CDI rates in this report have been updated due to a subsequent revision of the national figures of hospital activity. Please go to http://www.hps.scot.nhs.uk/haiic/sshaip/publicationsdetail.aspx?id=50174 for the newest revised data.
HP
S W
EE
KLY R
EP
OR
T Volum
e 43 No.2009/02
14 January 2009
16
Retrospective data on occupied bed days used for calculating the incidence rates are listed in Table A4. Overall, the number of occupied bed days in acute and non-acute hospitals used to estimate the CDAD incidence rates has increased 7% from the first year of reporting to the second year of reporting. In most NHS boards the changes in OCBDs were minor. Notable changes were observed in Dumfries & Galloway (+35%), Forth Valley (+15%), Greater Glasgow & Clyde (+14%), Lanarkshire (+11%) and Western Isles (-19%).FIGURE 1: Quarterly rates of CDAD per 1000 total occupied bed days in acute and non-acute hospitals in 14 NHS boards in Scotland.
0.00
0.50
1.00
1.50
2.00
2.50
3.00
Rat
e pe
r 10
00 to
tal O
CB
Ds
QT4 2007
QT1 2008
QT2 2008
QT3 2008
Ayrsh
ire a
nd A
rran
Borde
rs
Dumfri
es a
nd G
allow
ay Fife
Forth
Vall
ey
Gram
pian
Great
er G
lasgo
w (inc
l A&C)
Highlan
d
Lana
rksh
ire
Loth
ian
Orkne
y Isla
nds
Shetla
nd Is
lands
Tays
ide
Wes
tern
Isles
Rates of CDAD were also calculated using the population ≥ 65 years old per NHS board area as the denominator. The quarterly rates for the 14 NHS boards are given in Figure 2.
In 2007/8 the annual rate for the Scotland was 796 cases per 100,000 inhabitants ≥ 65 years old (95% CI 777, 816) while the average quarterly overall rate was 199 cases per 100,000 persons ≥ 65 years old (95% CI 194, 204) (the annual rate is four times greater than the quarterly rates because the size of the population is assumed constant over time). In comparison with 2006/7, this is a 7% increase for the annual overall rate (from 724 to 796 cases per 100,000 inhabitants ≥ 65 years old), and a 10% increase for the quarterly overall rate (from 181 to 199 cases per 100,000 inhabitants ≥ 65 years old)*. FIGURE 2: Rates of CDAD per 100,000 inhabitants ≥ 65 years old in 14 NHS boards in Scotland.
QT4 2007
QT1 2008
QT2 2008
QT3 2008
Ayrsh
ire a
nd A
rran
Borde
rs
Dumfri
es a
nd G
allow
ay Fife
Forth
Vall
ey
Gram
pian
Great
er G
lasgo
w (inc
l A&C)
Highlan
d
Lana
rksh
ire
Loth
ian
Orkne
y Isla
nds
Shetla
nd Is
lands
Tays
ide
Wes
tern
Isles
0
50
100
150
200
250
300
350
Qua
rter
ly r
ates
per
100
000
inha
bita
nts
Quarterly data for July 2008 – September 2008 In the period July-September 2008, HPS received case reports from 25 diagnostic laboratories in 14 NHS boards. In total, 100% of cases in this report were confirmed by the laboratories that reported them.
The total number of cases identified was 1433, a 17% decrease from the previous quarter (April-June 2008) where 1729 cases were recorded (this is a revised figure and previous rates are unaffected). In addition two cases were reported from the Golden Jubilee National Hospital (these are not included in the further analysis).
The total number of cases and rates by NHS board are listed in Table A1 and A2 in the Appendix (incidence rates for this and previous quarters are also depicted in Figure 1).
The overall rate of CDAD for this quarter was 1.15 per 1000 total OCBDs (95% CI 1.09, 1.21). This corresponds to a 14% decrease compared to the previous quarter where a rate of 1.33 per 1000 total OCBDs was reported. There was no significant difference when compared to the overall rate for the third quarter of 2007 (1.16 per 1000 total OCBDs (95% CI 1.11, 1.23)).
The overall rate per 100,000 inhabitants ≥ 65 years old was 172 (95% CI 164, 181). Population rates by NHS board are presented in Figure 2.
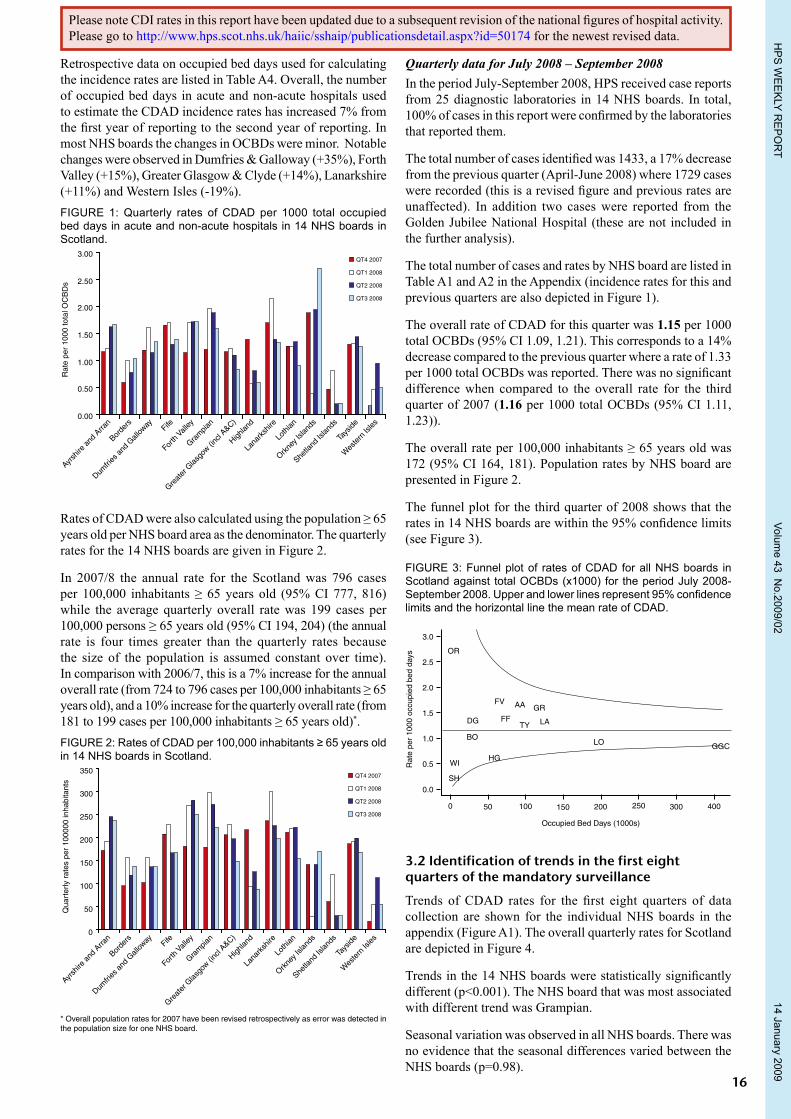
The funnel plot for the third quarter of 2008 shows that the rates in 14 NHS boards are within the 95% confidence limits (see Figure 3).
FIGURE 3: Funnel plot of rates of CDAD for all NHS boards in Scotland against total OCBDs (x1000) for the period July 2008-September 2008. Upper and lower lines represent 95% confidence limits and the horizontal line the mean rate of CDAD.
0 50 100 150 200 250 300 400
Occupied Bed Days (1000s)
0.0
0.5
1.0
1.5
2.0
2.5
3.0
Rat
e pe
r 10
00 o
ccup
ied
bed
days
SH
WIHG
BO
DG FF
FV AA GR
LATY
OR
LO GGC
3.2 Identification of trends in the first eight quarters of the mandatory surveillance
Trends of CDAD rates for the first eight quarters of data collection are shown for the individual NHS boards in the appendix (Figure A1). The overall quarterly rates for Scotland are depicted in Figure 4.
Trends in the 14 NHS boards were statistically significantly different (p<0.001). The NHS board that was most associated with different trend was Grampian.
Seasonal variation was observed in all NHS boards. There was no evidence that the seasonal differences varied between the NHS boards (p=0.98).
* Overall population rates for 2007 have been revised retrospectively as error was detected in the population size for one NHS board.
Please note CDI rates in this report have been updated due to a subsequent revision of the national figures of hospital activity. Please go to http://www.hps.scot.nhs.uk/haiic/sshaip/publicationsdetail.aspx?id=50174 for the newest revised data.

HP
S W
EE
KLY R
EP
OR
T Volum
e 43 No.2009/02
14 January 2009
17
CDAD rates in the first half of the year (Quarters 1 and 2) were higher than those in the second half of the year (Quarters 3 and 4) (in the first two years of the data collection). It was estimated that the rates in Quarter 3 and 4 were 17.5% lower than the rates of Quarter 1 and 2, p=0.0001 (95% CI 10.5%, 23.9%).FIGURE 4: Trends of overall quarterly CDAD rates for Scotland (per 1000 total OCBDs) for eight quarters of mandatory surveillance covering the period October 2006-September 2008.
2006QT4
2007QT1
2007QT2
2007QT3
2007QT4
2008QT1
2008QT2
2008QT3
Rat
e pe
r 10
00 to
tal O
CB
Ds
0
0.2
0.4
0.6
0.8
1
1.2
1.4
1.6
3.3 Typing and susceptibility data
Ribotype dataIsolates have been submitted by 28 hospitals representing 14 NHS boards (see Figure 5). Of the 583 specimens received in the period November 2007-September 2008, most were ribotype 106 (37.6%), 001 (24.5%), 027 (12%), 002 (3.4 %), 078 (2.7%) and 015 (2.7%).
Seventy isolates of the hypervirulent ribotype 027, corresponding to 12% of the isolates, were also reported in this period.
Eight isolates are awaiting confirmation. In total, 27 different ribotypes were reported. FIGURE 5: C. difficile PCR ribotypes in Scotland. Specimens were submitted in the period November 2007-September 2008.
0
50
100
150
200
106 001 027 002 078 015 Other
Ribotypes
Num
ber
of is
olat
es
37.6%
24.5%
12%
3.4% 2.7% 2.7%
17%
Antibiotic susceptibilityThe susceptibilities of the 583 isolates were determined for the nine antibiotics previously listed. Figure 6 shows the resistance profiles for the nine antibiotics. All isolates were sensitive to metronidazole (MIC range 0.032-2.0 µg/ml) and vancomycin (MIC range 0.25-2.0 µg/ml). Furthermore, all the isolates were sensitive to piperacillin-tazobactam (MIC range 0.5-20 µg/ml) and meropenem (MIC range 0.19-4.0 µg/ml).
Of these isolates 72% were resistant to cefotaxime, (MIC range 1.5 to ≥256 µg/ml), 75% to moxifloxacin (range 0.25 to
≥32 µg/ml), 76% to levofloxacin (range 0.75 to ≥32 µg/ml), 78% to erythromycin (range 0.094 to ≥256 µg/ml), and 92% to clindamycin (range 1.0 to ≥256 µg/ ml). FIGURE 6: Resistance profiles among Scottish isolates for nine antibiotics (November 2007-September 2008).
0.0
10.0
20.0
30.0
40.0
50.0
60.0
70.0
80.0
90.0
100.0
METR MERO PIP/T VANC CEFO MOXI LEVO ERYT CLIN
Per
cent
age
of is
olat
es r
esis
tant
to a
ntib
iotic
s
Antibiotic susceptibility in ribotypes 106, 001 and 027For the period November 2007-September 2008, cefotaxime resistance was observed in 93% of ribotype 106, 90% of ribotype 001 and 67% of ribotype 027 (see Table 1). Almost all isolates were resistant to erythromycin, levofloxacin and moxifloxacin (range 97-100%), with ribotype 027 being 100% resistant to all three antibiotics. Clindamycin resistance was observed in 93% of ribotype 106, 92% of ribotype 001 and 97% of ribotype 027.TABLE 1: Resistance profiles in ribotypes 106, 001 and 027 (November 2007-September 2008).
Antibiotic
Ribotypes
001 (n=143) 027 (n=70) 106 (n=219)
No. isolates (%)
No. isolates (%)
No. isolates (%)
Cefotaxime 129 (90.2) 47 (67.1) 204 (93.2)
Moxifloxacin 139 (97.2) 70 (100) 217 (99.1)
Levofloxacin 139 (97.2) 70 (100) 216 (98.6)
Erythromycin 141 (98.6) 70 (100) 217 (99.1)
Clindamycin 131 (91.6) 68 (97.1) 204 (93.2)
4. Discussion
Introduction of the mandatory surveillance programme for CDAD has facilitated harmonisation of sampling, testing and reporting procedures in hospitals and healthcare facilities (including general practices) in all NHS boards. Due to the introduction of a case definition and sampling, testing and reporting criteria, the data collected under the mandatory surveillance programme are not comparable with the data previously collected by HPS in the period 1996-2005.
As in the previous annual and quarterly reports, a number of important caveats must be highlighted. Firstly, full compliance with the national testing and reporting criteria has only been obtained gradually. In a recent internal survey of all diagnostic laboratories in Scotland, 100% of the respondents replied that they were aware of the national surveillance protocol. Moreover, previous validation studies showed that between 9-35% of reported cases had no documented clinical symptoms. The reason for the many false positive cases is possibly due to collection of specimens from patients with no (or only vague) symptoms, but this may also reflect on the lack of documentation of symptoms in the wards.
Please note CDI rates in this report have been updated due to a subsequent revision of the national figures of hospital activity. Please go to http://www.hps.scot.nhs.uk/haiic/sshaip/publicationsdetail.aspx?id=50174 for the newest revised data.

HP
S W
EE
KLY R
EP
OR
T Volum
e 43 No.2009/02
14 January 2009
18
Contribution of CDAD acquired in the community is another factor that potentially affects the accuracy of the collected data. The frequency of community acquired disease is likely to vary across NHS boards. Case review studies (previously published in annual and quarterly CDAD reports) carried out in two NHS boards showed rates of community acquired CDAD of 0% and 26%, respectively. The NHS board with the highest rate of community acquired CDAD also had the highest rates of testing and reporting activity among general practitioners.
In addition to the above mentioned caveats, regional differences (between NHS boards) in healthcare provision, organisation, and age distribution of the population are factors that are likely to affect the number of persons at risk acquiring CDAD in each board area. The quarterly data should therefore primarily be used for monitoring and comparing trends within each NHS board rather than for inter-NHS board comparisons.
In conclusion, the data presented in this report represent an estimate of the number of cases and rates of disease rather than the true values. Furthermore, the National Surveillance Programme is retrospective (i.e. three months in arrears) and does not replace the need for local monitoring of cases of CDAD.
In total, 6631 cases of CDAD were identified in the second year of the mandatory surveillance, a 10% increase relative to the first year of the surveillance. However, when hospital activity was taken into account there was no significant difference in the overall incidence rate for Scotland (1.29 in 2008 vs. 1.26 in 2007 with overlapping confidence intervals). The rate of CDAD (per occupied bed days) is a more accurate measure of infection than the total number of cases, as it takes into account the population at risk of acquiring CDAD (the majority of whom are persons in hospital).
The overall rate estimated for 2006/7 is potentially confounded by the lack of compliance with the national surveillance protocol, especially in the first quarters of data collection in some healthcare facilities. Therefore comparisons with 2006/7 figures should be made with caution.
The observed 7% increase in the overall population rate (from 724 to 796 per 100,000 inhabitants ≥ 65) is a direct consequence of the increase in the total number of cases, as the population sizes of the 14 NHS board areas are assumed to be constant (i.e. the denominator does not change as mid-2005 population data are used for calculating rates for both 2007 and 2008. Therefore, population changes since 2005 have not been taken into account when calculating these rates).
Furthermore, the retrospective bed day data used for estimating the incidence rates suggest a 7% increase in healthcare activity from 2006/7 to 2007/8 (Table A4). As recent bed data are not available at the time the annual CDAD reports are produced, one-year old bed data have to be used for estimating the incidence rates. This may introduce error into the estimated incidence rates (especially in rates for NHS boards which have undergone recent reorganisations). The extent to which the increased healthcare activity can account for the increase in total number of cases (and the increases in the population rates) is uncertain. However, the overall increases in hospital activity (i.e. bed days) and in total number of cases are within the same range (7-10%).
The latest quarterly data (for the period July 2008-September 2008) were reported in this report as well. Substantial decreases were observed in both the total number of cases (-17%) and in the rates of CDAD (-14%) relative to the previous quarter. This quarter’s figures are the lowest in the second year of the surveillance. The corresponding third quarter in 2007 also had the lowest figures for 2007. This suggests seasonal variation between all four quarters, and this was confirmed by statistical analysis.
By analysing the trends over the first eight quarters of data collection it was estimated that the incidence rates in general are lower in quarters 3 and 4 than in quarters 1 and 2. A major caveat to the trend analysis is the short data collection period of 24 months. More reliable results will be obtained as more quarters of data are accumulated.
Thus, observed decreases in CDAD rates between quarters should be interpreted with caution and viewed in context of the overall annual trends. Part of the reduction may also be due to a genuine reduction as a result of improved antimicrobial prescribing and infection control in the healthcare facilities. This suggests that the recent decline in CDAD between quarters 2 and 3 of 2008 may be partly due to seasonal variation and partly to interventions.
NHS Highland was the only board which had decreasing rates throughout the four quarters of the second year of the surveillance. Dumfries & Galloway, Fife, Greater Glasgow & Clyde, Lanarkshire had decreasing rates throughout three quarters of 2008. The downward trend for these NHS boards over 3-4 consecutive quarters suggests that sustained reductions in rates have been obtained.
In the UK, the autumn and winter months are usually associated with elevated rates of respiratory tract infections and increased hospital activity for various reasons, which together could lead to increased use of antibiotics. The seasonal variation observed in the Scottish CDAD data suggest a delayed effect of the increased use of antibiotics as the increase in rates begins in January-March compared to a rise in antibiotic consumption in October-December.
A reference laboratory for C. difficile has been in service since November 2007. The laboratory has examined 583 isolates of C. difficile by PCR ribotyping and susceptibility testing.
Ribotypes are not reported by NHS boards or hospital in this report.
Ribotype 106 remains the most common type (38%) reported in Scotland followed by ribotype 001 (25%). During the period April-June 2008 outbreaks of the hypervirulent ribotype 027 were reported from hospitals in Grampian and Greater Glasgow & Clyde. Ribotype 027 has also become more frequent among single submissions to the reference laboratory. The accumulated frequency of ribotype 027 was 12%. A new ribotype referred to as 078, which has been associated with infections in animals, has also emerged in Scotland this year.
As isolates only are submitted to the reference laboratory in the case of severe manifestations of CDAD and when outbreaks are suspected, the data collected are biased towards severe disease and may also contain clusters of related isolates from outbreaks. To get a more representative picture of the
Please note CDI rates in this report have been updated due to a subsequent revision of the national figures of hospital activity. Please go to http://www.hps.scot.nhs.uk/haiic/sshaip/publicationsdetail.aspx?id=50174 for the newest revised data.

HP
S W
EE
KLY R
EP
OR
T Volum
e 43 No.2009/02
14 January 2009
19
distribution of ribotypes in Scotland a C. difficile ribotyping snapshot programme will commence in January 2009. In this programme, isolates are to be submitted from a defined number of patients in designated periods in each NHS board. This will capture isolates from a broader range of patients with mild, moderate and severe disease.
All isolates tested were susceptible to metronidazole and vancomycin, which are the two recommended drugs for treatment of CDAD. High resistance rates to fluoroquinolones, cefotaxime, erythromycin and clindamycin were observed among the majority of the Scottish isolates. The use of these antibiotics is very likely to play a role in the spread and persistence of C. difficile in Scotland.
Current recommendations on how to control and reduce the occurrence and transmission of CDAD includes antimicrobial stewardship, high standard of prevention and infection control and early detection of disease and local real-time surveillance.
HPS has produced a number guidance documents to support the implementation of these recommendations. These include:
Guidance on prevention and control of Clostridium difficile associated disease (CDAD) in healthcare settings in Scotland: http://www.hps.scot.nhs.uk/haiic/sshaip/guidelinedetail.aspx?id=39295
Clostridium difficile associated disease (CDAD) Cross-transmission minimisation bundle: http://www.hps.scot.nhs.uk/haiic/ic/CDADCareBundle.aspxChecklists for Preventing and Controlling Clostridium difficile Associated Disease (CDAD): http://www.hps.scot.nhs.uk/pubs/Publication_Detail.aspxGuidance to optimise antibiotic use and reduce C. difficile associated disease (CDAD) in Scottish Hospitals: http://www.hps.scot.nhs.uk/haiic/sshaip/guidelinedetail.aspx?id=38553
Acknowledgement
We would like to thank all the microbiologists and biomedical scientists who have provided and reviewed data for the CDAD surveillance programme and the Scottish C. difficile reference service for providing ribotyping data. Information Services Division of the NHS in Scotland is thanked for providing the hospital activity denominator data for this report.
References1. O’Neill GL, Ogunsola FT, Brazier JS, Duerden BI. Modification of a PCR ribotyping
method for application as a routine typing scheme for Clostridium difficile. Anaerobe 1996; 2; 205-209.
2 Quarterly report on the surveillance of Clostridium difficile associated disease (CDAD) in Scotland, January 2008-March 2008. HPS Weekly Report. 2 July 2008. http://www.documents.hps.scot.nhs.uk/ewr/pdf2008/0827.pdf
Please note CDI rates in this report have been updated due to a subsequent revision of the national figures of hospital activity. Please go to http://www.hps.scot.nhs.uk/haiic/sshaip/publicationsdetail.aspx?id=50174 for the newest revised data.

HP
S W
EE
KLY R
EP
OR
T Volum
e 43 No.2009/02
14 January 2009
20
AppendixTABLE A1: Total number of CDAD cases by NHS board
NHS board Quarter 4(Oct 07-Dec 07)
Quarter 1(Jan 08-Mar 08)
Quarter 2(Apr 08-Jun 08)
Quarter 3(Jul 08-Sep 08)
Annual(Oct 07-Sep 08)
Total number of cases in Scotland 1608 1861 1729 1433 6631
Ayrshire & Arran 113 125 160 154 552
Borders 20 33 25 29 107
Dumfries & Galloway 31 47 41 41 160
Fife 123 134 95 98 450
Forth Valley 81 120 126 112 439
Grampian 149 247 226 185 807
GG&C 421 463 402 301 1587
Highland 81 35 47 33 196
Lanarkshire 198 251 189 166 804
Lothian 248 259 261 181 949
Orkney Islands 5 1 5 6 17
Shetland Islands 2 4 1 1 8
Tayside 135 139 145 123 542
Western Isles 1 3 6 3 13
TABLE A2: Incidence rates of CDAD by NHS board
NHS board Quarter 4(Oct 07-Dec 07)
Quarter 1(Jan 08-Mar 08)
Quarter 2(Apr 08-Jun 08)
Quarter 3(Jul 08-Sep 08)
Annual(Oct 07-Sep 08)
Over all rates 1.26 1.41 1.33 1.15 1.29
Ayrshire & Arran 1.16 1.23 1.62 1.66 1.41
Borders 0.60 0.99 0.78 1.03 0.84
Dumfries & Galloway 1.19 1.60 1.16 1.35 1.32
Fife 1.66 1.70 1.30 1.38 1.52
Forth Valley 1.15 1.70 1.71 1.72 1.57
Grampian 1.21 1.96 1.88 1.60 1.66
GG&C 1.16 1.22 1.10 0.84 1.08
Highland 1.40 0.59 0.81 0.60 0.85
Lanarkshire 1.71 2.14 1.39 1.33 1.62
Lothian 1.27 1.26 1.35 0.92 1.20
Orkney Islands 1.88 0.40 1.94 2.71 1.71
Shetland Islands 0.47 0.82 0.19 0.22 0.42
Tayside 1.30 1.32 1.43 1.25 1.33
Western Isles 0.17 0.46 0.95 0.51 0.53

HP
S W
EE
KLY R
EP
OR
T Volum
e 43 No.2009/02
14 January 2009
21
TABLE A3: Comparison of annual rates of CDAD by NHS board
NHS boardTotal number of CDAD cases Annual rates per 1000 total occupied bed
days ≥ 65 years old
2006/7 2007/8 2006/7 2007/8
Ayrshire & Arran 550 552 1.37 1.41
Borders 60 107 0.46 0.84
Dumfries & Galloway 157 160 1.75 1.32
Fife 301 450 1.04 1.52
Forth Valley 290 439 1.19 1.57
Grampian 489 807 1.01 1.66
GG&C 1600 1587 1.25 1.08
Highland 258 196 1.09 0.85
Lanarkshire 730 804 1.64 1.62
Lothian 973 949 1.31 1.20
Orkney Islands 8 17 0.87 1.71
Shetland Islands 14 8 0.77 0.42
Tayside 580 542 1.46 1.33
Western Isles 25 13 0.82 0.53
Total cases/Annual overall rates for Scotland 6035 6631 1.26
(95% CI 1.23, 1.29)1.29
(95% CI 1.26, 1.32)
Table A4: Number of total occupied bed days used for analysis of CDAD data obtained in 2006/7 and 2007/8.
NHS BoardTotal Occupied Bed Days
2006/7 2007/8 Difference % change
Ayrshire & Arran 402656 390424 -12232 -3
Borders 130725 126849 -3876 -3
Dumfries & Galloway 89905 121156 31251 35
Fife 289290 296780 7490 3
Forth Valley 242938 280032 37094 15
Grampian 485669 484918 -751 -0.2
GG&C 1281968 1466913 184945 15
Highland 237326 230728 -6598 -3
Lanarkshire 446387 494809 48422 11
Lothian 740948 789834 48886 7
Orkney Islands 9218 9952 734 8
Shetland Islands 18283 18855 572 3
Tayside 397300 408769 11469 3
Western Isles 30350 24735 -5615 -19
Total 4802963 5144754 341791 7
Please note that the bed day data, used to analyse the 2006/7 data were from October 2005-September 2006, and the bed day data used to analyse 2007/8 were from October 2006 to September 2007.

HP
S W
EE
KLY R
EP
OR
T Volum
e 43 No.2009/02
14 January 2009
22
FIGURE A1: Annual rates of CDAD by NHS board
3.0
2.0
1.0
0.0
Rat
e pe
r 10
00 O
CB
D
Quarter
AA
0 1 2 3 4 5 6 7
3.0
2.0
1.0
0.0
Rat
e pe
r 10
00 O
CB
D
Quarter
BO
0 1 2 3 4 5 6 7
3.0
2.0
1.0
0.0
Rat
e pe
r 10
00 O
CB
D
Quarter
DG
0 1 2 3 4 5 6 7
3.0
2.0
1.0
0.0R
ate
per
1000
OC
BD
Quarter
FF
0 1 2 3 4 5 6 7
3.0
2.0
1.0
0.0
Rat
e pe
r 10
00 O
CB
D
Quarter
FV
0 1 2 3 4 5 6 7
3.0
2.0
1.0
0.0
Rat
e pe
r 10
00 O
CB
D
Quarter
GGC
0 1 2 3 4 5 6 7
3.0
2.0
1.0
0.0
Rat
e pe
r 10
00 O
CB
D
Quarter
GR
0 1 2 3 4 5 6 7
3.0
2.0
1.0
0.0
Rat
e pe
r 10
00 O
CB
D
Quarter
HG
0 1 2 3 4 5 6 7
3.0
2.0
1.0
0.0
Rat
e pe
r 10
00 O
CB
D
Quarter
LA
0 1 2 3 4 5 6 7
3.0
2.0
1.0
0.0
Rat
e pe
r 10
00 O
CB
D
Quarter
LO
0 1 2 3 4 5 6 7
3.0
2.0
1.0
0.0
Rat
e pe
r 10
00 O
CB
D
Quarter
SH
0 1 2 3 4 5 6 7
3.0
2.0
1.0
0.0
Rat
e pe
r 10
00 O
CB
D
Quarter
OR
0 1 2 3 4 5 6 7
3.0
2.0
1.0
0.0
Rat
e pe
r 10
00 O
CB
D
Quarter
TY
0 1 2 3 4 5 6 7
3.0
2.0
1.0
0.0
Rat
e pe
r 10
00 O
CB
D
Quarter
WI
0 1 2 3 4 5 6 7

HP
S W
EE
KLY R
EP
OR
T Volum
e 43 No.2009/02
14 January 2009
23
3.0
2.0
1.0
0.0
Rat
e pe
r 10
00 O
CB
D
Quarter
AA
0 1 2 3 4 5 6 7
3.0
2.0
1.0
0.0
Rat
e pe
r 10
00 O
CB
D
Quarter
BO
0 1 2 3 4 5 6 7
3.0
2.0
1.0
0.0
Rat
e pe
r 10
00 O
CB
D
Quarter
DG
0 1 2 3 4 5 6 7
3.0
2.0
1.0
0.0
Rat
e pe
r 10
00 O
CB
D
Quarter
FF
0 1 2 3 4 5 6 7
3.0
2.0
1.0
0.0
Rat
e pe
r 10
00 O
CB
D
Quarter
FV
0 1 2 3 4 5 6 7
3.0
2.0
1.0
0.0
Rat
e pe
r 10
00 O
CB
D
Quarter
GGC
0 1 2 3 4 5 6 7
3.0
2.0
1.0
0.0
Rat
e pe
r 10
00 O
CB
D
Quarter
GR
0 1 2 3 4 5 6 7
3.0
2.0
1.0
0.0
Rat
e pe
r 10
00 O
CB
D
Quarter
HG
0 1 2 3 4 5 6 7
3.0
2.0
1.0
0.0
Rat
e pe
r 10
00 O
CB
D
Quarter
LA
0 1 2 3 4 5 6 7
3.0
2.0
1.0
0.0
Rat
e pe
r 10
00 O
CB
D
Quarter
LO
0 1 2 3 4 5 6 7
3.0
2.0
1.0
0.0
Rat
e pe
r 10
00 O
CB
D
Quarter
SH
0 1 2 3 4 5 6 7
3.0
2.0
1.0
0.0
Rat
e pe
r 10
00 O
CB
D
Quarter
OR
0 1 2 3 4 5 6 7
3.0
2.0
1.0
0.0
Rat
e pe
r 10
00 O
CB
D
Quarter
TY
0 1 2 3 4 5 6 7
3.0
2.0
1.0
0.0
Rat
e pe
r 10
00 O
CB
DQuarter
WI
0 1 2 3 4 5 6 7
Key to boardsAA Ayrshire & Arran BR Borders DG Dumfries & Galloway FF FifeFV Forth Valley GGC Greater Glasgow & Clyde GR Grampian HG HighlandLA Lanarkshire LO Lothian OR Orkney SH ShetlandTY Tayside WI Western Isles
The last Annual CDAD in Scotland Report was in Issue 08/01; the last quarterly CDAD report was in issue 0841The next quarterly CDAD in Scotland Report will be in Issue 09/14

HP
S W
EE
KLY R
EP
OR
T Volum
e 43 No.2009/02
14 January 2009
24
Scottish Surveillance of Healthcare Associated Infection Programme Quarterly report on Staphylococcus aureus bacteraemias in Scotland,
January 2003 - September 2008Prepared by: Scottish Surveillance of HAI Programme
Introduction
The S. aureus bacteraemia report will be presented as follows:
• National data on S. aureus bacteraemia, both meticillin resistant S. aureus (MRSA) and meticillin sensitive S. aureus (MSSA).
• National data on S. aureus antimicrobial resistance provided by the Scottish MRSA Reference Laboratory (SMRSARL) using isolates submitted to the European Antimicrobial Resistance Surveillance System (EARSS). Infections recorded as being associated with a device will also be reported at a national level.
S. aureus is a gram positive bacterium that colonises the anterior nares of about 30% of the healthy population. Although mainly a harmless coloniser, S. aureus can be a major cause of serious infection and both meticillin sensitive and meticillin resistant S. aureus (MSSA and MRSA) remain endemic in many UK hospitals. In addition, new and more virulent clones are arising in the community.
The EARSS programme, funded by the European Centre for Disease Prevention and Control (ECDC), is an international network of national surveillance systems which collects comparable and validated antimicrobial susceptibility data for public health action.
EARSS performs on-going surveillance of antimicrobial susceptibility for S. aureus causing invasive infections and monitors variations of antimicrobial resistance over time and place. Over 800 microbiological laboratories serving more than 1300 hospitals from 31 countries provide S. aureus susceptibility data.1 According to EARSS (2006) the United Kingdom MRSA bacteraemia prevalence, as a proportion of all S. aureus bacteraemia, is one of the highest in Europe.1
MRSA is the most important cause of antibiotic-resistant healthcare associated infection worldwide.2 Within 2 years of the introduction of meticillin for clinical use, the first meticillin resistant S. aureus was detected in the United Kingdom in 1961. Since then, the emergence and spread of MRSA has been documented on every continent.3-5 The use of specific antimicrobial drugs (fluoroquinolones, macrolides and cephalosporins) are associated with nosocomial MRSA,6,7 and a dose dependent association has been observed between
exposure to antimicrobial drugs and nosocomial MRSA (patient and hospital level).8 Glycopeptide standard therapy has been associated with clinical failures (particularly with Glycopeptide Intermediate S. aureus (GISA) and/or isolates with ≥ 1.5 mg/l MIC)9,10 and resistance to new effective therapies (linezolid, daptomycin, tigecycline) has also been reported.11
Antimicrobial resistance (AMR) threatens the effectiveness of successful treatment of infections and is a public health issue with local, national, and global dimensions. Antimicrobial resistance can result in increased morbidity, disease burden, and mortality.
It is therefore important that surveillance of meticillin sensitive and meticillin resistant S. aureus should be undertaken in a systematic way, results fed back routinely to healthcare staff and the inappropriate or unnecessary use of antimicrobials avoided.12
This is the third report in which we present AMR data. In time we propose identifying trends in resistance and looking at associated strain types to assist stakeholders in developing a better understanding of the evolving epidemiology of this organism.
This report also includes information on device associated S. aureus bacteraemia. This information is obtained from the EARSS form submitted to the SMRSARL by diagnostic laboratories with each S. aureus blood isolate. One of the recommendations of the NHS Scotland National HAI Prevalence Survey was that there should be targeted incidence surveillance for vascular catheter infections and S. aureus bacteraemia.13 The insertion of vascular catheters has been well documented as being a risk factor for bacteraemia.14-16
National data on S. aureus bacteraemia
Data reporting periods (See Table 1 below).
Additional data in this reportAll S. aureus bacteraemia reported to HPS from 1 July 2008 to 30 September 2008.
Antimicrobial resistance data from 1 July 2008 to 30 September 2008.
Device associated infections from 1 July 2008 to 30 September 2008.
Table 1: Reporting periods for S. aureus
S. aureus bacteraemia Data available from 1 April 2005 to 30 September 2008
MSSA bacteraemia Data available from 1 April 2005 to 30 September 2008
MRSA bacteraemia Data available from 1 January 2003 to 30 September 2008
Antimicrobial resistance Data available from 1 July 2008 to 30 September 2008
Device associated infections Data available from 1 July 2008 to 30 September 2008

HP
S W
EE
KLY R
EP
OR
T Volum
e 43 No.2009/02
14 January 2009
25
Data sources
All 14 NHS boards in Scotland report the first isolate of MSSA and the first isolate of MRSA from a blood culture within a two week period to HPS from routine laboratory data.
All 14 NHS boards in Scotland submit the first S. aureus blood isolated from a patient to the SMRSARL for typing and antimicrobial susceptibility testing as part of the EARSS programme.
Episodes of S. aureus bacteraemia are included in this report if we receive a report from either of the above surveillance systems.
(On occasion an NHS board will not submit a S. aureus blood isolate to the SMRSARL and therefore typing and antimicrobial susceptibility will not be performed. As a result the total numbers in the two surveillance systems will not always be equal. Health Protection Scotland will continue to monitor submission of isolates to the SMRSARL in order to ensure compliance with HDL(2006) 38.17
Definitions
In the United Kingdom an episode of S. aureus bacteraemia (MSSA and MRSA) is defined as a person from whose blood MRSA or MSSA has been isolated and reported by an accredited diagnostic microbiology laboratory in the absence of a positive blood culture in the previous two weeks.18
This definition has been applied to the EARSS isolates in order that the two datasets are aligned. This enables consistency in reporting.
One acute occupied bed day (AOBD) is an acute bed occupied for one night. An acute bed is any bed other than a Care of the Elderly Long Stay or Psychiatric bed.18
HEAT target
There is a national HEAT target for NHS boards in Scotland to achieve an overall 30% reduction of S. aureus bacteraemia by 2010 against a validated base line data period of April 2005 to March 2006. Each NHS Board has an individual target ranging from a reduction of 25% to 40%.
Methods
All S. aureus bacteraemia data sent to HPS are defined in terms of episodes and validated. Methods are detailed in the S. aureus bacteraemia protocol.18
AOBDs come from the Information Services Division (ISD) of National Services Scotland (NSS) (http://www.isd.org).
Antimicrobial resistance data is supplied by the SMRSARL as part of the EARSS programme.
Statistical methods
Quarterly S. aureus bacteraemia rates were analysed through negative binomial regression and rates predicted to the end of the HEAT target period (31 March 2010). Analysis was performed in Intercooled Stata for Windows 9.1.
Analysis of S. aureus bacteraemia rate and numerator data
S. aureus bacteraemia data are expressed as rates using acute occupied bed days (AOBDs) as the denominator and, where appropriate, by numerator alone, e.g. within the Pareto charts where the number of episodes is more informative.
S. aureus bacteraemia trend analysis is presented as predicted estimates of future S. aureus bacteraemia rates with 95% prediction intervals and by overlaying HEAT trajectory figures.
MRSA bacteraemia analysis is by Statistical Process Control (SPC) Chart.19 MSSA data (and therefore data on all S. aureus bacteraemia) are not presented as an SPC chart because there are insufficient data points.
The number of MSSA and MRSA bacteraemia are shown by specialty in separate Pareto charts. This method shows the frequency of events in descending order along with the cumulative proportion and is often used to identify areas for improvement.
The numbers of S. aureus bacteraemia (MSSA and MRSA) are presented in a run chart showing the quarterly number against time.
S. aureus antimicrobial susceptibility data are provided at a National level in tabular form along with information on numbers of device associated infections.
Data presentation and interpretation
Details of the data, figure types and interpretation are provided with each graphic within the main report.
Antimicrobial resistance and device associated data for Scotland is shown in table form for all isolates submitted to SMRSARL during the period 1 July 2008 to 30 September 2008.
Local use of this report
To achieve the HEAT target of 30% reduction in S. aureus bacteraemia by 2010 NHS Boards will have to ensure they undertake significant and sustained system changes targeted at the primary infections that cause S. aureus bacteraemia. Anything less than this is unlikely to result in a successful achievement of the HEAT target. To optimise progress towards achieving the S. aureus bacteraemia HEAT target, NHS boards should:
• Be aware of the locations in which most S. aureus bacteraemia occur in their NHS board
• Be aware of the primary infections causing S. aureus bacteraemia in these areas
• Deploy the HPS bundles designed to reduce specific primary infections in the areas with the greatest incidence of S. aureus bacteraemia.
HPS are currently devising tools to further assist infection control teams to direct their activities where they are likely to yield the greatest benefits in reducing S. aureus bacteraemia. These tools include a device days reduction estimate tool, and the use of SBAR (Situation, Background,

HP
S W
EE
KLY R
EP
OR
T Volum
e 43 No.2009/02
14 January 2009
26
Assessment, Recommendation)20 templates to optimise effective communication within individual NHS boards.
National policy documents related to this work
This S. aureus bacteraemia report is produced in compliance with:
HDL(2006) 38. A revised framework for national surveillance of healthcare associated infection in Scotland, SGHD.17
HDL(2001) 57. A framework for national surveillance of hospital acquired infection in Scotland, SEHD.21
Results
Table 2 represents the quarterly number of validated episodes of MRSA bacteraemia from 1 January 2003 to 30 September 2008, the validated number of MSSA bacteraemia from 1 April 2005 to 30 September 2008 and the total number of S. aureus bacteraemia from 1 April 2005 to 30 September 2008 along with rates per 1000 AOBDs for all NHS boards in Scotland.
The most recent quarter, 1 July 2008 to 30 September 2008, has the lowest number and rate of MRSA bacteraemia of any quarter reported to this surveillance programme.
The rate and number of S. aureus bacteraemia is lower than the same quarter, 1 July to 30 September, of any year of the surveillance. The rate and number of S. aureus bacteraemia is the lowest reported in any quarter since 1 January to 31 March 2007.
Figure 1 shows the quarterly number of S. aureus bacteraemia in Scotland from 1 April 2005 to 30 September 2008 as a run chart with the HEAT trajectory line from 1 April 2005 to HEAT target end of 31 March 2010.
The annual number of S. aureus bacteraemia reported in Scotland has fallen by 6.9% per year (95% CI 3.1% to 10.6%) since the HEAT baseline of 1 April 2005 to 31 March 2006. As the confidence interval contains the HEAT target of a 7% per year decrease there is no evidence that the target will not be met.
Table 2: Quarterly No. of S. aureus bacteraemia (MRSA and MSSA) in Scotland,
Quarter
No.
of M
RSA
ba
cter
aem
ia
No.
of M
SSA
bact
erae
mia
No.
of S
. au
reus
ba
cter
aem
ia
Acu
te
Occ
upie
d B
ed
Day
s (A
OB
Ds)
MR
SA
bact
erae
mia
pe
r 100
0 A
OB
Ds
MSS
A ba
cter
aem
ia
per 1
000
AO
BD
s
S. a
ureu
s ba
cter
aem
iape
r 100
0 A
OB
Ds
Jan 03-Mar 03 255 1306371 0.195
Apr 03-Jun 03 227 1269416 0.179
Jul 03-Sep 03 176 1261838 0.139
Oct 03-Dec 03 217 1277360 0.170
Jan 04-Mar 04 267 1303814 0.205
Apr 04-Jun 04 259 1241546 0.209
Jul 04-Sep 04 201 1245799 0.161
Oct 04-Dec 04 247 1259193 0.196
Jan 05-Mar 05 253 1299434 0.195
Apr 05-Jun 05* 221 375 596 1247816 0.177 0.301 0.478
Jul 05-Sep 05 247 511 758 1247136 0.198 0.410 0.608
Oct 05-Dec 05 264 422 686 1259126 0.210 0.335 0.545
Jan 06-Mar 06 274 460 734 1297157 0.211 0.355 0.566
Apr 06-Jun 06 252 358 610 1282329 0.197 0.279 0.476
Jul 06-Sep 06 212 389 601 1243355 0.171 0.313 0.483
Oct 06-Dec 06 227 280 507 1252014 0.181 0.224 0.405
Jan 07-Mar 07 249 359 608 1294344 0.192 0.277 0.470
Apr 07-Jun 07 215 415 630 1248276 0.172 0.332 0.505
Jul 07-Sep 07 210 459 669 1234589 0.170 0.372 0.542
Oct 07-Dec 07 207 417 624 1235570 0.168 0.337 0.505
Jan 08-Mar 08 197 390 587 1236015 0.156 0.316 0.475
Apr 08-Jun 08 185 392 577 1247905 0.148 0.314 0.462
Jul 08-Sep 08 149 373 522 1213613 0.123 0.307 0.430
* Mandatory reporting of MSSA bacteraemia was introduced in July 2006 and MSSA data was validated back to 1 April 2005.

HP
S W
EE
KLY R
EP
OR
T Volum
e 43 No.2009/02
14 January 2009
27
Figure 2 shows the quarterly S. aureus bacteraemia rate per 1000 AOBDs from 1 April 2005 to 30 September 2008 with a trend line of a ‘Model Prediction’ taking account of seasonal variations.
The confidence limits of the predicted model represent the range of values where we are 95% confident the true value will fall. This figure therefore presents a more accurate indication of the progress towards the HEAT target, because it takes account of seasonal variation in S. aureus bacteraemia. Note that the prediction intervals get wider the further into the future projected. As more data become available these confidence intervals will narrow.
Figure 2 indicates that if current trends are at least maintained, Scotland could achieve the level required in the HEAT target by early 2010. However, local interventions at NHS board level are required to ensure this target is met.
Figure 3 represents the MRSA bacteraemia rate per 1000 AOBDs for Scotland as a Statistical Process Control (p) chart. This chart has control limits set at 3 standard deviations (sd) from the mean, warning limits set at 2 sd from the mean and highlight limits set at 1 sd from the mean. The centre line is the mean of all results to date.
In Figure 3 the latest quarterly MRSA bacteraemia rate is below the lower control limit indicating that a change has occurred and suggesting that a reduction in the MRSA bacteraemia rate for Scotland has been achieved.
Figure 4 shows a Pareto chart of the number of MRSA bacteraemia by specialty with the number of MRSA bacteraemia for each specialty represented by a bar and the cumulative proportion of MRSA bacteraemia represented by a line.
The highest number of MRSA bacteraemia were detected in General Medicine (Figure 4). Over 70% of all MRSA bacteraemia were found in General Medicine, General Surgery, Renal, HDU/ICU and Care of the Elderly. Targeting these areas in infection prevention initiatives is likely to have the biggest impact in reducing S. aureus bacteraemia.
Figure 5 shows a Pareto chart of the number of MSSA bacteraemia by specialty with the number of MSSA bacteraemia for each specialty represented by a bar and the cumulative proportion of MSSA bacteraemia represented by a line.
The highest number of MSSA bacteraemia were detected in General Medicine, approximately 70% of all MSSA bacteraemia were found in General Medicine, unspecified specialties, Renal, General Surgery, Accident and Emergency and ICU/HDU (Figure 5).
Figure 1: Run chart of quarterly number of S. aureus bacteraemia in Scotland, 1 April 2005 to 30 September 2008 with HEAT target trajectory to 31 March 2010.
Figure 2: S. aureus bacteraemia per 1000 AOBDs in Scotland showing HEAT target and predicted rates with prediction limits.
Figure 3: SPC chart of quarterly MRSA bacteraemia per 1000 AOBDs in Scotland, 1 January 2003 to 30 September 2008.
Figure 4: Pareto chart of the number of MRSA bacteraemia by specialty, 1 January 2003 to 30 September 2008.

HP
S W
EE
KLY R
EP
OR
T Volum
e 43 No.2009/02
14 January 2009
28
Figures 4 and 5 indicate that the specialties General Medicine, Renal, General Surgery and ICU/HDU are the specialties where
Figure 5: Pareto chart of the number of MSSA bacteraemia by specialty, 1 April 2005 to 30 September 2008.
both MSSA and MRSA bacteraemia are most often detected in NHS Scotland and are therefore the areas where the largest impact could be achieved.
Cases detected in Accident and Emergency may, in some instances, be community acquired cases, although the number of true community acquired S. aureus bacteraemia is considered to be low.22,23
A community acquired S. aureus bacteraemia is defined by a positive blood culture for patients hospitalised for less than 48 hours and for whom infection was not incubating at the time of admission.24
Table 3 indicates that the proportion of S. aureus isolates which were meticillin resistant during the period 1 July 2008 to 30 September 2008 was 30% (129 of 431 isolates). Twenty five isolates were recorded on the EARSS form as being device associated, 58 were not, this was recorded as ‘not known’ for 154 isolates and for 194 isolates this was not stated.
Table 3: Antibiotic susceptibility of S. aureus isolates (MSSA and MRSA) from Scotland, 1 July 2008 to 30 September 2008.
Antibiotic
MSSA n = 302 MRSA n = 129Total n = 431
Number of isolates that were: Number of isolates that were:
S I R N
Res
ista
nce
rate
(%)
S I R N
Res
ista
nce
rate
(%)
Tota
l num
ber o
f no
n-su
scep
tible
st
rain
s
Tota
l res
ista
nce
rate
(%)
Chloramphenicol 300 2 0 0 0.7% 129 0 0 0 0.0% 2 0.5%
Ciprofloxacin 281 2 19 0 7.0% 3 0 126 0 97.7% 147 34.1%
Clindamycin 299 1 2 0 1.0% 79 0 50 0 38.8% 53 12.3%
Erythromycin 269 9 24 0 10.9% 24 2 103 0 81.4% 138 32.0%
FusidicAcid 266 9 27 0 11.9% 120 5 4 0 7.0% 45 10.4%
Gentamicin 296 3 3 0 2.0% 112 2 15 0 13.2% 23 5.3%
Kanamycin 292 0 10 0 3.3% 91 0 38 0 29.5% 48 11.1%
Levofloxacin 297 1 2 2 1.0% 124 2 3 0 3.9% 8 1.9%
Linezolid 300 0 0 2 0.0% 129 0 0 0 0.0% 0 0.0%
Mupirocin 301 0 1 0 0.3% 116 4 9 0 10.1% 14 3.2%
Oxacillin 302 0 0 0 0.0% 0 0 129 0 100.0% 129 29.9%
Rifampicin 302 0 0 0 0.0% 125 0 4 0 3.1% 4 0.9%
Streptomycin 302 0 0 0 0.0% 129 0 0 0 0.0% 0 0.0%
Synercid 300 0 0 2 0.0% 129 0 0 0 0.0% 0 0.0%
Teicoplanin 300 0 0 2 0.0% 129 0 0 0 0.0% 0 0.0%
Tetracycline 287 1 14 0 5.0% 115 1 13 0 10.9% 29 6.7%
Tobramycin 295 0 7 0 2.3% 91 0 38 0 29.5% 45 10.4%
Trimethoprim 250 0 52 0 17.2% 87 0 42 0 32.6% 94 21.8%
Vancomycin 302 0 0 0 0.0% 129 0 0 0 0.0% 0 0.0%

HP
S W
EE
KLY R
EP
OR
T Volum
e 43 No.2009/02
14 January 2009
29
References1. EARSS Annual Report 2007. Available at http://www.rivm.nl/earss/result/Monitoring_reports/
Annual_reports.jsp
2. Karchmer, A.W., Nosocomial bloodstream infections: organisms, risk factors, and implica-tions. Clin Infect Dis, 2000. 31 Suppl 4: p. S139-43.
3. Boyce, J.M., Cookson, B. Christiansen, K. Hori, S. Vuopio-Varkila, J. Kocagoz, S. et al, Meticillin-resistant Staphylococcus aureus. Lancet Infect Dis, 2005. 5(10): p. 653-63.
4. Zinn, C.S., Westh, H. and Rosdahl, V.T.An international multicenter study of antimicrobial resistance and typing of hospital Staphylococcus aureus isolates from 21 laboratories in 19 countries or states. Microb Drug Resist, 2004. 10(2): p. 160-8.
5. Kesah, C., Ben Redjeb, S. Odugbemi, T.O. Boye, C.S. Dosso, M. Ndinya Achola, J.O. et al, Prevalence of methicillin-resistant Staphylococcus aureus in eight African hospitals and Malta. Clin Microbiol Infect, 2003. 9(2): p. 153-6.
6. Graffunder, E.M. and Venezia, R.A. Risk factors associated with nosocomial methicillin-resistant Staphylococcus aureus (MRSA) infection including previous use of antimicrobials. J Antimicrob Chemother, 2002. 49(6): p. 999-1005.
7. Weber, S.G..Gold, H.S. Hooper, D.C. Karchmer A.W. and Carmeli, Y. Fluoroquinolones and the risk for methicillin-resistant Staphylococcus aureus in hospitalized patients. Emerg Infect Dis, 2003. 9(11): p. 1415-22.
8. Monnet, D.L., Methicillin-resistant Staphylococcus aureus and its relationship to antimicrobial use: possible implications for control. Infect Control Hosp Epidemiol, 1998. 19(8): p. 552-9.
9. Sakoulas, G., Rose, W. Rybak, M.J. Pillai, S. Alder, J. Moellering, R.C. Jr. et al, Evaluation of endocarditis caused by methicillin-susceptible Staphylococcus aureus developing nonsusceptibility to daptomycin. J Clin Microbiol, 2008. 46(1): p. 220-4.
10. Soriano, A., Marco, F. Martinez, J.A. Pisos, E. Almela, M. Dimova, V.P. et al, Influence of vancomycin minimum inhibitory concentration on the treatment of methicillin-resistant Staphylococcus aureus bacteraemia. Clin Infect Dis, 2008. 46(2): p. 193-200.
11. Moreillon, P., New and emerging treatment of Staphylococcus aureus infections in the hospital setting. Clin Microbiol Infect, 2008. 14 Suppl 3: p. 32-41.
12. Coia, J.E., Duckworth, G.J. Edwards, D.I Farrington, M. Fry, C. Humphreys, H. et al Guidelines for the control and prevention of meticillin-resistant Staphylococcus aureus (MRSA) in healthcare facilities. J Hosp Infect, 2006. 63 Suppl 1: p. S1-44.
13. Reilly, J., Stewart, S. Allardice, G.A. Noone, A. Robertson, C. Walker A. et al, Results from the Scottish National HAI Prevalence Survey. J Hosp Infect, 2008. 69(1): p. 62-8.
14. Edgeworth, JD., Yadegarfar, G., Pathak, S., Batra, R., Cockfield, J.D., Wyncoll, D., et al. An outbreak in an intensive care unit of a strain of methicillin-resistant Staphylococcus aureus sequence type 239 associated with an increased rate of vascular access device-related bacteraemia. Clin Infec Dis, 2007. 44:493-501.
15. Hawkins, C., Huang, J., Jun, N., Noskin, G.A., Zembower, T.R., Bolon, M., Persistent Staphylococcus aureus bacteraemia: an analysis of risk factors and outcomes. Arch Intern Med, 2007. 167(17):1861-7.
16. Heo, S.T., Peck, K.R., Ryu, S.Y., Kwon, K.T., Ko, K.S., Oh, W.S. et al. Analysis of methicillin resistance among Staphylococcus aureus blood isolates in an emergency department. J Korean Med Sci, 2007. 22(4):682-6.
17. HDL(2006) 38. A revised framework for national surveillance of healthcare associated infection in Scotland, SGHD.
18. Protocol for the Scottish mandatory surveillance programme for Staphylococcus aureus bacteraemia found at http://www.documents.hps.scot.nhs.uk/hai/sshaip/guidelines/MRSA/MRSA-bacteramia-protocol-v3-2007-09.pdf
19. Benneyan J.C., Statistical quality control methods in infection control and hospital epidemiology, Part I: Introduction and basic theory. Infect Control Hosp Epidemiol 1998; 19:194-214.
20. Leonard, M., Graham, S., Bonacum, D., The human factor: the critical importance of effective teamwork and communication in providing safe care. Qual Saf Health Care 2004; 13 (Suppl 1): i85-i90.
21. HDL(2001) 57. A framework for national surveillance of hospital acquired infection in Scotland, SEHD.
22. Garner, J.S., Jarvis, W.R., Emori, T.G., Horan, T.C., Hughes, J.M., CDC definitions for nosocomial infections. Am J Infect Control 1988; 16: 128-140.
23. Wyllie, D.H., Peto T.E.A., Crook D, MRSA bacteraemia in patients on arrival in hospital: a cohort study in Oxfordshire 1997-2003. BMJ 2005; 331: 992-5.
24. Duckworth, G. Improving surveillance of MRSA bacteraemia. BMJ 2005; 331: 976-977.
Acknowledgements
Health Protection Scotland is grateful to all the microbiologists throughout Scotland who provided the S. aureus bacteraemia data for this report and helped in its preparation, staff at the Scottish MRSA Reference Laboratory who provided the EARSS data and the Information Services Division of National Services Scotland who provided the hospital activity data.
Key Summary Points
The data within this report includes data on episodes of MRSA bacteraemia during the period 1 January 2003 to 30 September 2008, episodes of MSSA bacteraemia during the period 1 April 2005 to 30 September 2008 and antimicrobial resistance data during the period 1 July 2008 to 30 September 2008.
The number and rate of MRSA bacteraemia reported in the period 1 July 2008 to 30 September 2008 was the lowest yet reported since the initiation of this surveillance programme.
The MRSA bacteraemia rate per 1000 AOBDs in Scotland has shown a decrease in this quarter compared to the period 1 January 2003 to 30 June 2008.
The number of S. aureus bacteraemia has shown a year on year decrease of 6.9%, 95% confidence interval (3.1%, 10.6%), and there is no evidence that this decrease is lower than that set in the HEAT target over the period 1 April 2005 to 30 September 2008.
The rate and number of S. aureus bacteraemia is lower than the same quarter of any year of the surveillance and is the lowest reported since the quarter 1 January to 31 March 2007.
The specialties where both MSSA and MRSA bacteraemia are found most often within the national dataset are General Medicine, Renal, General Surgery and HDU/ICU. Infection prevention interventions focussed on these specialties are likely to have the greatest benefit in reducing S. aureus bacteraemias.
The proportion of S. aureus isolates submitted to the SMRSARL which were meticillin resistant during the period 1 July 2008 to 30 September 2008 was 30%.
There were 431 isolates submitted to the SMRSARL during the period 1 July 2008 to 30 September 2008. Twenty five isolates were recorded on the EARSS form as being device associated, 58 were not, this was recorded as ‘not known’ for 154 isolates and for 194 isolates this was not stated.
The last bacteraemias and MRSA Surveillance Report was in Issue 08/41The next bacteraemias and MRSA Surveillance Report will be in Issue 09/14
For information on the data included in this report contact the SSHAIP team at [email protected].
For information on infection prevention and control please contact the Infection Control Team at [email protected].
For information on the antimicrobial resistance data included in this report please contact the AMR team at [email protected].

HP
S W
EE
KLY R
EP
OR
T Volum
e 43 No.2009/02
14 January 2009
30
Statutory Notification of Infectious Diseases (by age) Week ended 2 January 2009
A National Statistics release
Age Group
Infectious Disease All ages Under 1 1 - 4 5 - 14 15 - 24 25 - 34 35 - 44 45 - 64 65 & over Not known M F M F M F M F M F M F M F M F M F M FAnthrax - - - - - - - - - - - - - - - - - - - -Bacillary dysentery - 1 - - - - - - - - - - - - - 1 - - - -Chickenpox 32 50 1 5 22 32 7 8 - 1 1 2 1 2 - - - - - -Cholera - - - - - - - - - - - - - - - - - - - -Diphtheria - - - - - - - - - - - - - - - - - - - -Erysipelas - - - - - - - - - - - - - - - - - - - -Food poisoning 28 31 1 - 1 2 - 2 4 4 4 1 5 4 7 9 6 9 - -Legionellosis - - - - - - - - - - - - - - - - - - - -Leptospirosis - - - - - - - - - - - - - - - - - - - -Lyme Disease 2 1 - - - - - - 1 - - - - - 1 1 - - - -Malaria - - - - - - - - - - - - - - - - - - - -Measles 1 - - - 1 - - - - - - - - - - - - - - -Meningococcal infection 1 2 - - 1 - - 1 - - - 1 - - - - - - - -Mumps 3 2 - - - - 1 - 1 1 - - - - 1 1 - - - -Paratyphoid fever - - - - - - - - - - - - - - - - - - - -Plague - - - - - - - - - - - - - - - - - - - -Poliomyelitis - - - - - - - - - - - - - - - - - - - -Puerperal fever - - - - - - - - - - - - - - - - - - - -Rabies - - - - - - - - - - - - - - - - - - - -Relapsing fever - - - - - - - - - - - - - - - - - - - -Rubella - 1 - - - - - 1 - - - - - - - - - - - -Scarlet fever 2 1 - - 2 - - - - 1 - - - - - - - - - -Smallpox - - - - - - - - - - - - - - - - - - - -Tetanus - - - - - - - - - - - - - - - - - - - -Toxoplasmosis - - - - - - - - - - - - - - - - - - - -Tuberculosis: respiratory - - - - - - - - - - - - - - - - - - - -Tuberculosis: non-respiratory - 1 - - - - - - - 1 - - - - - - - - - -Typhoid fever - - - - - - - - - - - - - - - - - - - -Typhus fever - - - - - - - - - - - - - - - - - - - -Viral haemorrhagic fevers - - - - - - - - - - - - - - - - - - - -Viral hepatitis 3 3 - - - - - - - 1 - 1 2 1 - - - - 1 -Whooping cough - - - - - - - - - - - - - - - - - - - -TOTAL 72 93 2 5 27 34 8 12 6 9 5 5 8 7 9 12 6 9 1 0

HP
S W
EE
KLY R
EP
OR
T Volum
e 43 No.2009/02
14 January 2009
31
Source: Health Protection Scotland, NHS National Services Scotland
NHS BOARD ABBREVIATIONSAA Ayrshire & Arran GG Greater Glasgow & Clyde LN Lanarkshire SH Shetland TY TaysideBR Borders FF Fife GR Grampian LO Lothian WI Western IslesDG Dumfries & Galloway FV Forth Valley HG Highland OR Orkney
Statutory Notification of Infectious Diseases (by NHS board) Week ended 2 January 2009
Amendments: add Chickenpox (FV 1 x wk 51 2008, GR 1 x wk 52 2008); Food poisoning (GR 2 x wk 52 2008); Lyme disease (GR 4 x wk 52 2008); Menigococcal infextion (GR 3 x wk 52 2008); Scarlet fever (LO 1 x wk 51 2008); Viral hepatitis (GG 1 x wk 23 2008, GR 16 x wk 52 2008) delete Food poisoning (TY 1 x wk 51 2008, GR 1 x wk 52 2008); Lyme disease (GR 2 x wk 51 2008); Mumps (GR 2 x wk 52 2008)
NHS BOARD AREA Infectious Disease AA BR DG FF FV GR GG HG LN LO OR SH TY WI
Currentweek
Previousweek
Total from1st week of year
Currentweek
last year 2008 2009Anthrax - - - - - - - - - - - - - - - - - - -
Bacillary dysentery - - - - - - - - - 1 - - - - 1 - 1 1 1
Chickenpox 1 1 7 13 10 - 14 6 12 - 3 1 14 - 82 98 99 99 82
Cholera - - - - - - - - - - - - - - - - - - -
Continued fever - - - - - - - - - - - - - - - - - - -
Diphtheria - - - - - - - - - - - - - - - - - - -
Erysipelas - - - - - - - - - - - - - - - - - - -
Food poisoning 8 - 1 3 1 12 13 2 5 10 - - 4 - 59 65 63 63 59
Legionellosis - - - - - - - - - - - - - - - - 1 1 -
Leptospirosis - - - - - - - - - - - - - - - - - - -
Lyme Disease - - - - - - - 2 - - - - 1 - 3 1 2 2 3
Malaria - - - - - - - - - - - - - - - - - - -
Measles - - - - - - - - 1 - - - - - 1 1 1 1 1
Meningococcal infection - - - - - - 1 - 2 - - - - - 3 1 1 1 3
Mumps - - - 1 - - - 2 1 1 - - - - 5 7 11 11 5
Paratyphoid fever - - - - - - - - - - - - - - - - - - -
Plague - - - - - - - - - - - - - - - - - - -
Poliomyelitis - - - - - - - - - - - - - - - - - - -
Puerperal fever - - - - - - - - - - - - - - - - - - -
Rabies - - - - - - - - - - - - - - - - - - -
Relapsing fever - - - - - - - - - - - - - - - - - - -
Rubella - - - 1 - - - - - - - - - - 1 1 - - 1
Scarlet fever - - - 1 - - - 1 - 1 - - - - 3 10 2 2 3
Smallpox - - - - - - - - - - - - - - - - - - -
Tetanus - - - - - - - - - - - - - - - - - - -
Toxoplasmosis - - - - - - - - - - - - - - - - - - -
Tuberculosis : resp. - - - - - - - - - - - - - - - 1 3 3 -
Tuberculosis : non-resp. - - - - - - - - - - - - 1 - 1 - - - 1
Typhoid fever - - - - - - - - - - - - - - - - - - -
Typhus fever - - - - - - - - - - - - - - - - - - -
Viral haemorrhagic fevers - - - - - - - - - - - - - - - - - - -
Viral hepatitis - - - 1 - - - - - - - - 5 - 6 27 7 7 6
Whooping cough - - - - - - - - - - - - - - - 1 2 2 -
TOTAL 9 1 8 20 11 12 28 13 21 13 3 1 25 - 165 213 193 193 165