control structure selection of a deethanizer column with ... · control structure selection of a...
TRANSCRIPT
Control structure selection of a deethanizer column with partial condenser Proceedings of European Congress of Chemical Engineering (ECCE-6) Copenhagen, 16-20 September 2007
Control structure selection of a deethanizer column with partial condenser
A. Eduardo Shigueo Hori, B. Sigurd Skogestad
Department of Chemical Engineering, Norwegian University of Science and Technology , N-7491 Trondheim, Norway
Abstract
The selection of a good control structure for a distillation column is important for the plant operation. In this work, it is studied the control structure selection of a deethanizer column with partial condenser. The column separates ethane (C2) from propane (C3). This is a multicomponent column with a partial condenser and vapor distillate flow. It has 36 trays and is fed in tray 26. As the feed is already low concentrated in ethane (2.1%), the distillate flow rate is small (around 1% of feed flow). Although this could cause some difficulties for pressure control, the results show that this is not a problem if a temperature loop is also closed. The simulations are done in ASPEN Plus and ASPEN Dynamics. The main objective is to find a structure that minimizes the effect of disturbances and implementation error (noise and bias) in both top and bottom compositions (indirect control). The results show that it is better to control temperatures in top section where the gains are higher. The structure selected was successfully implemented in the real column. Keywords: deethanizer, partial condenser, control structure selection, indirect control
1. Introduction
Partial condensers are used when there are very light components in the column feed that would require a high column pressure or a low condenser temperature, so the use of a partial condenser can avoid the use of costly refrigeration (Luyben, 2004). Luyben (2004) compares alternative control structures for distillation columns with partial condensers. He cites some characteristics of columns with partial condensers that should be taken into consideration while choosing the control structure to be used: • There is no effect of vapor flow rate on reflux drum level, so the distillate flow rate
cannot be used to control directly the reflux drum level • Besides condenser duty, pressure is also affected by distillate flow rate, resulting in
interactions between the control loops that manipulate these two variables
A. Hori et al.
• There is a strong interaction among the pressure, temperature and level loops, so the pairing and tuning of these loops are much more difficult than in a total-condenser column
Ralston et al. (1985) presented an indirect dual composition control of a deethanizer. They used a combination of feedforward and feedback algorithms. The control structure used was: • bottom level is controlled by bottom flow rate (B) • reflux drum level is controlled by condenser duty (Qc) • pressure is controlled by distillate flow rate (D) • a temperature is controlled by reboiler duty (Qb) To complete their control structure, Ralston et al. (1985) applied a feedforward algorithm where they measured the feed flow rate and a composition and manipulate reflux flow rate (L). Except for the feed forward part, this control strategy is similar to control structure 2 (see Section 3.2). Differently from our case, this deethanizer has a high distillate flow rate, so it probably does not have the saturation problems that we found for structure 2. In this work, a real deethanizer distillation column is simulated in ASPEN Plus and ASPEN Dynamics. This column has operational problems and our objective is to find a good control structure for it. The column has 36 trays and a partial condenser. The top product is vapour and the bottom product is liquid. The column separates ethane (C2) from propane (C3). The concentration set point is 15% (mol fraction) of C3 in distillate and 1% of C2 in bottom. The feed composition is (% mol): 2.1% ethane (C2), 59.8% propane (C3), 12.5% isobutane (i-C4), 25% butane (n-C4), and 0.6% propane (n-C5). The total feed flow rate is 150 ton/h. The column is fed in tray 26 (stages are counted from bottom to top). As the feed is already very low concentrated in ethane, the distillate flow rate will be very small (around 1% of feed flow rate). Although this could cause some difficulties for pressure control, the results show that this is not a big problem if we consider that a temperature loop is also closed. The most important disturbance in this column is feed flow rate, which can vary from 75 ton/h to 150 ton/h during the operation in a period of few hours. The objective of this work is to find a good control structure that keeps, indirectly, the top and bottom compositions close to their desired set points. In the simulations presented we added noise and bias in all measurements.
2. Temperature profile
The first step is a steady-state simulation in ASPEN Plus based in data from process and instrument diagrams (P&ID). We can see from Figure 1 that the temperature profile is flat in bottom section. It implies that the temperature slope (temperature difference between neighbouring stages) is small (see Figure 2), so we shouldn't control a temperature in this region (Luyben, 2005; Hori and Skogestad, 2007a). This happens because the initial (high frequency) gain, which corresponds to the desired closed-loop time constant, is of

Control structure selection for a deethanizer column with partial condenser 3
primary importance (Skogestad, 1997) and directly proportional to temperature difference. For dynamic control purpose it is better a large dynamic gain, and then it is better to control a temperature at a stage where the slope is large (Hori and Skogestad, 2007a).
Reboiler 5 10 15 20 Feed 30 Top−10
0
10
20
30
40
50
60
70
80
Tem
pera
ture
Stage Number
Temperature profile
Figure 1: Temperature profile for the deethanizer column.
Reboiler 5 10 15 20 Feed 30 Top0
2
4
6
8
10
12
Tem
pera
ture
slo
pe
Stage Number
Temperature Slope
Figure 2: Temperature slope for the deethanizer column.
3. Control structures
In this section several different control structures are compared using ASPEN Dynamics. The difference among the stabilizing control structures studied here is how to control the top pressure and the reflux drum level. The only stabilizing loop that does not change is the bottom level control loop. Bottom level is controlled by bottom flow rate (B) in all structures. Besides, bottom flow rate and reflux flow rate (L) are both flow controlled. For each stabilizing control structure, we have 5 possible different ways to control the temperatures: 1. Open loop - in this structure, both temperature control loops are opened, i.e., just
pressure and level loops are closed 2. Control temperature on tray 36 (T36) or, for structure 1, condenser output
temperature (T37) 3. Control temperature on tray 4 (T4)
A. Hori et al.
4. Control the temperature with highest gain (usually tray 36). Structure 3 (see Section 3.3) is the only where we are controlling temperature on tray 31. The main difference here item 2 is the manipulated variable
5. Two point temperature control - both temperatures T36 and T4 are controlled Temperatures in trays 4 and 36 (condenser output temperature for structure 1) are controlled in simulations because these temperatures have been controlled in the normal operation of the column. For the simulations presented below, disturbance in feed flow rate (valve opening change from 50% to 55%) was applied at time t = 0. Noise and bias are added to all measurements.
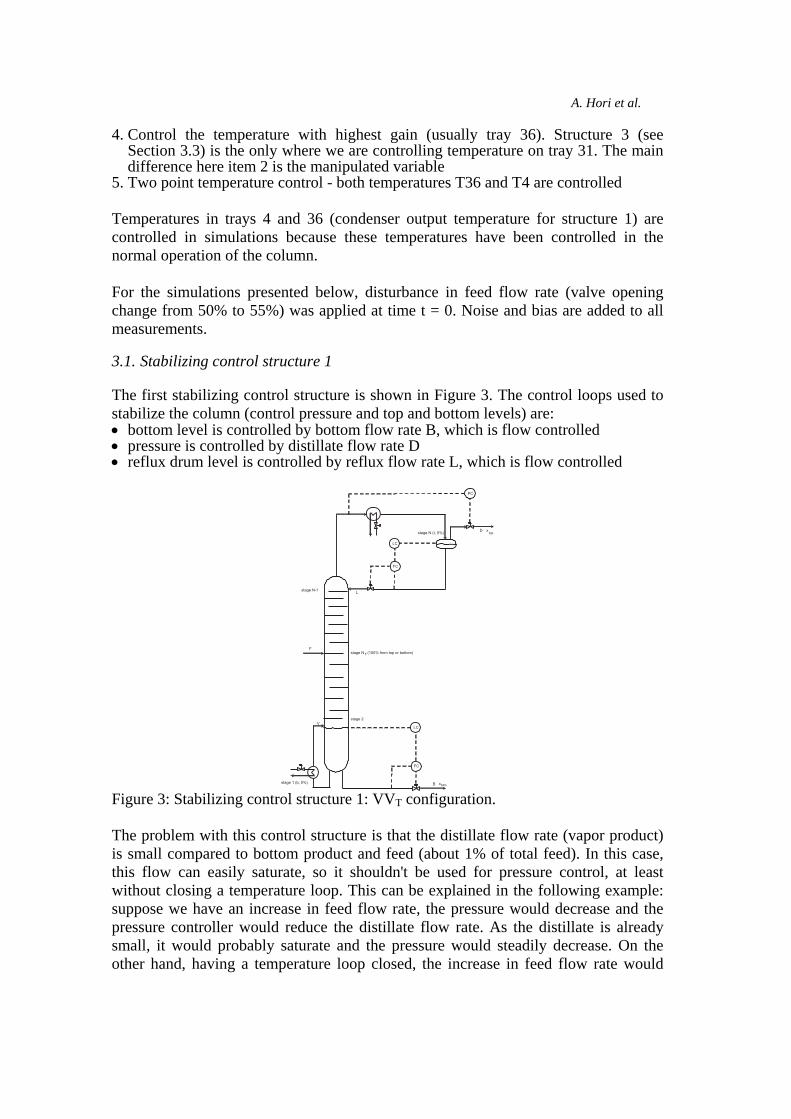
3.1. Stabilizing control structure 1
The first stabilizing control structure is shown in Figure 3. The control loops used to stabilize the column (control pressure and top and bottom levels) are: • bottom level is controlled by bottom flow rate B, which is flow controlled • pressure is controlled by distillate flow rate D • reflux drum level is controlled by reflux flow rate L, which is flow controlled
F
stage N-1L
Dstage N (t, 0%)
xtop
stage 2
LC
V
stage N (100% from top or bottom)F
FC
PC
stage 1 (b, 0%)
LC
B xbtm
FC
Figure 3: Stabilizing control structure 1: VVT configuration. The problem with this control structure is that the distillate flow rate (vapor product) is small compared to bottom product and feed (about 1% of total feed). In this case, this flow can easily saturate, so it shouldn't be used for pressure control, at least without closing a temperature loop. This can be explained in the following example: suppose we have an increase in feed flow rate, the pressure would decrease and the pressure controller would reduce the distillate flow rate. As the distillate is already small, it would probably saturate and the pressure would steadily decrease. On the other hand, having a temperature loop closed, the increase in feed flow rate would

Control structure selection for a deethanizer column with partial condenser 5
decrease the column temperature and the controller would increase the vapor flow rate (if reboiler duty is manipulated), increasing the pressure again. As we have two degrees of freedom available (condenser Qc and reboiler Qb duties), we can control up to two temperatures to improve the system response. So, including the temperature loops, the following three control structures can be considered: 1. Qc-T37: manipulate condenser duty (Qc) to control condenser output temperature,
keeping the second temperature loop opened 2. Qb-T4: manipulate reboiler duty (Qb) to control temperature in tray 4, keeping the
other temperature loop opened 3. Qb-T36: manipulate reboiler duty (Qb) to control temperature in tray with highest
gain (most sensitive tray), keeping the other temperature loop opened Two-point temperature control (closing both temperature loops Qc-T37 and Qb-T4) was not included because its response was too poor. By the same reason, the open loop approach (keeping both temperature loops opened) was excluded. To choose the most sensitive tray, a step change in reboiler duty (Qb) was applied (Figure 4). In this figure we just show the response for the temperatures that are measured in the real column (bottom, trays 4, 13, 31, 36 and condenser output). As can be seen, the temperature with highest gain (most sensitive) is in tray 36. It means that this temperature is the best to be controlled (Hori and Skogestad, 2007b). It is possible to see also that the temperatures in the bottom section are very low sensitive, i.e., they shouldn't be used for control. This result confirms that we shouldn't control a temperature where we have small temperature slope (temperature change from tray to tray) l (Luyben, 2005), i.e., where the temperature profile is flat (see Section 2).
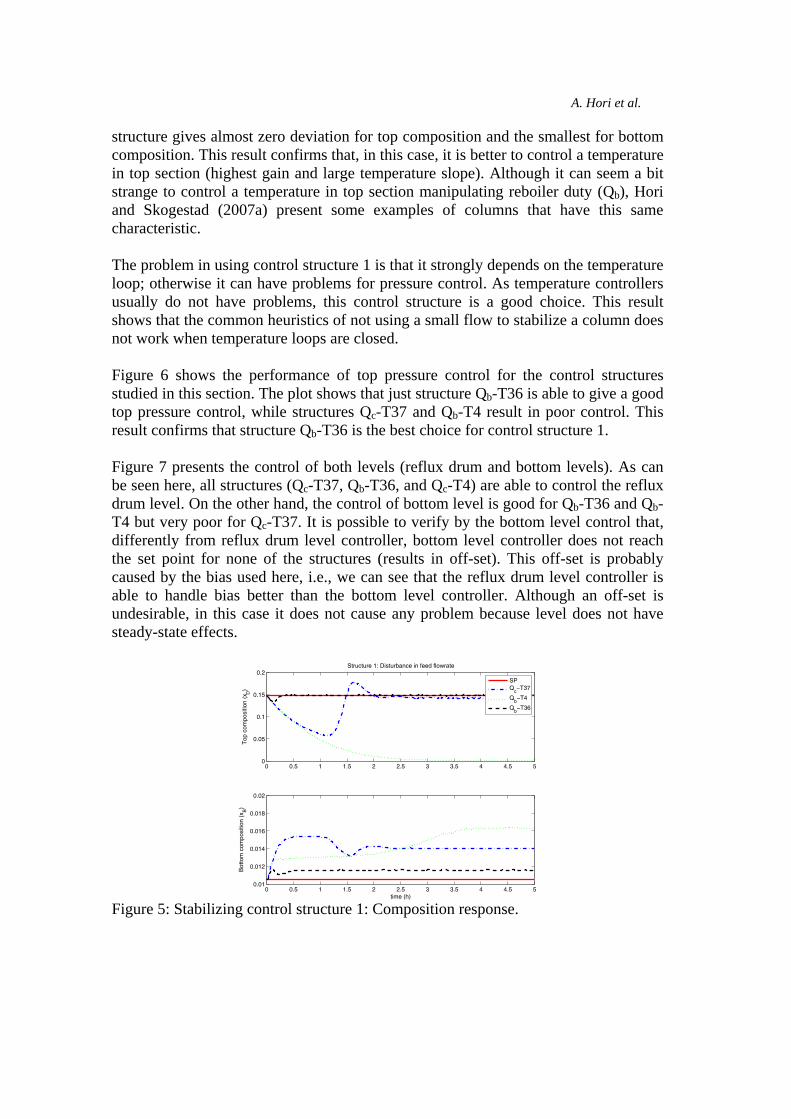
Figure 4: Stabilizing control structure 1: step test to select the most sensitive temperature. The control structures are compared in Figure 5 for a disturbance in feed flow rate. In this plot, we compare the indirect control of top and bottom compositions, i.e., we check how much top and bottom compositions deviate from their desired set points in presence of disturbances and implementation error (noise and bias). The objective is to choose the control structure that gives the smallest composition deviation (smallest “loss”). From this figure, it is possible to see that the best structure is Qb-T36. This
A. Hori et al.
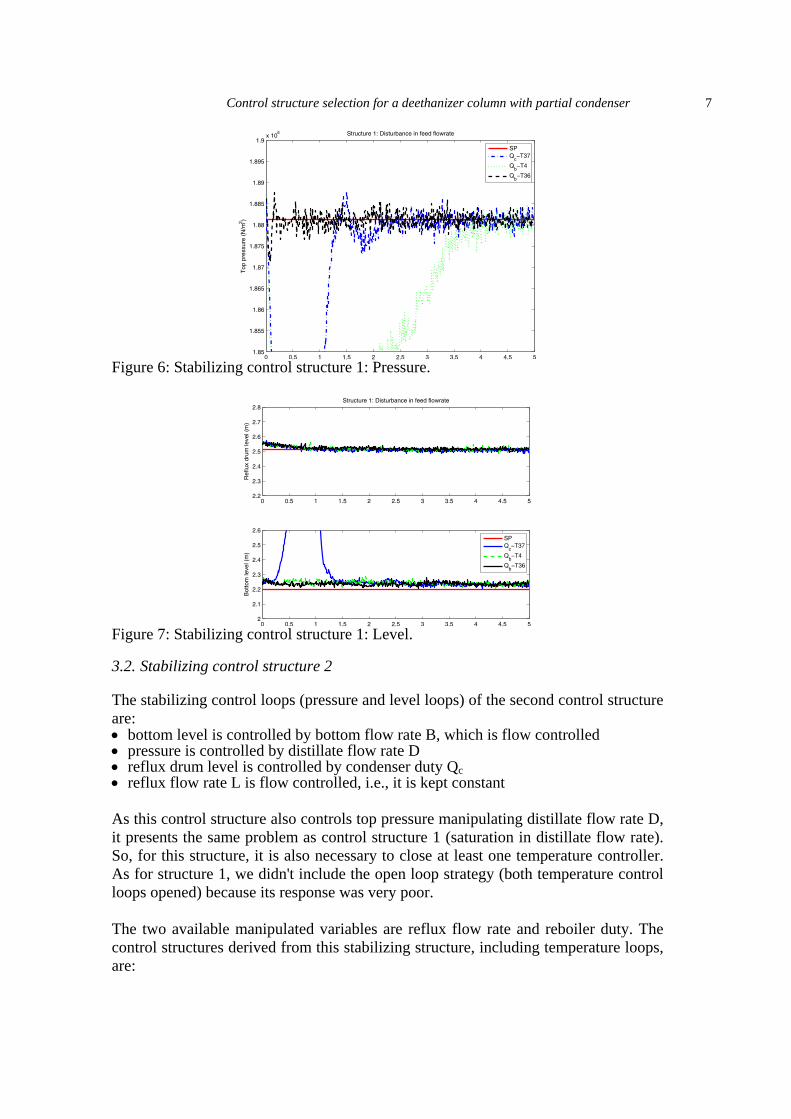
structure gives almost zero deviation for top composition and the smallest for bottom composition. This result confirms that, in this case, it is better to control a temperature in top section (highest gain and large temperature slope). Although it can seem a bit strange to control a temperature in top section manipulating reboiler duty (Qb), Hori and Skogestad (2007a) present some examples of columns that have this same characteristic. The problem in using control structure 1 is that it strongly depends on the temperature loop; otherwise it can have problems for pressure control. As temperature controllers usually do not have problems, this control structure is a good choice. This result shows that the common heuristics of not using a small flow to stabilize a column does not work when temperature loops are closed. Figure 6 shows the performance of top pressure control for the control structures studied in this section. The plot shows that just structure Qb-T36 is able to give a good top pressure control, while structures Qc-T37 and Qb-T4 result in poor control. This result confirms that structure Qb-T36 is the best choice for control structure 1. Figure 7 presents the control of both levels (reflux drum and bottom levels). As can be seen here, all structures (Qc-T37, Qb-T36, and Qc-T4) are able to control the reflux drum level. On the other hand, the control of bottom level is good for Qb-T36 and Qb-T4 but very poor for Qc-T37. It is possible to verify by the bottom level control that, differently from reflux drum level controller, bottom level controller does not reach the set point for none of the structures (results in off-set). This off-set is probably caused by the bias used here, i.e., we can see that the reflux drum level controller is able to handle bias better than the bottom level controller. Although an off-set is undesirable, in this case it does not cause any problem because level does not have steady-state effects.
0 0.5 1 1.5 2 2.5 3 3.5 4 4.5 50
0.05
0.1
0.15
0.2
Top
com
posi
tion
(xD
)
Structure 1: Disturbance in feed flowrate
SPQ
c−T37
Qb−T4
Qb−T36
0 0.5 1 1.5 2 2.5 3 3.5 4 4.5 50.01
0.012
0.014
0.016
0.018
0.02
Bot
tom
com
posi
tion
(xB)
time (h) Figure 5: Stabilizing control structure 1: Composition response.
Control structure selection for a deethanizer column with partial condenser 7
0 0.5 1 1.5 2 2.5 3 3.5 4 4.5 51.85
1.855
1.86
1.865
1.87
1.875
1.88
1.885
1.89
1.895
1.9x 10
6
Top
pre
ssur
e (N
/m2 )
Structure 1: Disturbance in feed flowrate
SPQ
c−T37
Qb−T4
Qb−T36
Figure 6: Stabilizing control structure 1: Pressure.
0 0.5 1 1.5 2 2.5 3 3.5 4 4.5 52.2
2.3
2.4
2.5
2.6
2.7
2.8
Ref
lux
drum
leve
l (m
)
Structure 1: Disturbance in feed flowrate
0 0.5 1 1.5 2 2.5 3 3.5 4 4.5 52
2.1
2.2
2.3
2.4
2.5
2.6
Bot
tom
leve
l (m
)
SPQ
c−T37
Qb−T4
Qb−T36
Figure 7: Stabilizing control structure 1: Level.
3.2. Stabilizing control structure 2
The stabilizing control loops (pressure and level loops) of the second control structure are: • bottom level is controlled by bottom flow rate B, which is flow controlled • pressure is controlled by distillate flow rate D • reflux drum level is controlled by condenser duty Qc • reflux flow rate L is flow controlled, i.e., it is kept constant As this control structure also controls top pressure manipulating distillate flow rate D, it presents the same problem as control structure 1 (saturation in distillate flow rate). So, for this structure, it is also necessary to close at least one temperature controller. As for structure 1, we didn't include the open loop strategy (both temperature control loops opened) because its response was very poor. The two available manipulated variables are reflux flow rate and reboiler duty. The control structures derived from this stabilizing structure, including temperature loops, are:

A. Hori et al.
1. L-T36: manipulate reflux flow rate to control temperature in tray 36, keeping the second temperature control loop opened
2. Qb-T4: manipulate reboiler duty to control temperature in tray 4, keeping the other temperature control loop opened
3. Qb-T36: manipulate reboiler duty to control temperature in tray with highest gain (most sensitive tray), keeping the other temperature loop opened
4. L-T36 and Qb-T4: two-point temperature control, i.e., manipulate reflux flow rate to control temperature in tray 36 (L-T36) and reboiler duty to control temperature in tray 4 (Qb-T4).
The control structures are compared in Figure 8, where top and bottom compositions are plotted. As we want to choose a control structure that minimizes the effect of disturbances and implementation error (noise and bias) in top and bottom compositions (indirect control), we can see that the best control structure is Qb-T36, confirming that, in this case, it is better to control a temperature in the top section. These results confirm that the two-point temperature control strategy (closing L-T36 and Qb-T4) does not improve the control system for multicomponent columns (Hori and Skogestad, 2007a). Figure 9 compares the top pressure control response for the control structures analysed in this section. The pressure control using structure L-T36 results in a poor performance, confirming that this structure it is not a good choice. The other structures (Qb-T4, Qb-T36, and two-point temperature control) result in good top pressure control. Figure 10 compares the control performance of reflux drum and bottom levels. Again we can see that control structure L-T36 gives the worse response (at least for bottom level control). The control performance of reflux drum level is good for all structures, been similar to the results obtained for control structure 1 (see Section 3.1). The control of bottom level, on the other hand, is good for most structures (Qb-T4, Qb-T36, and two-point temperature control), except for control structure L-T36.
0 0.5 1 1.5 2 2.5 3 3.5 4 4.5 50
0.05
0.1
0.15
0.2
Top
com
posi
tion
(xD
)
Structure 2: Disturbance in feed flowrate
SPL−T36Q
b−T4
Qb−T36
L−T36 and Qb−T4
0 0.5 1 1.5 2 2.5 3 3.5 4 4.5 50.01
0.012
0.014
0.016
0.018
0.02
Bot
tom
com
posi
tion
(xB)
time (h)
Figure 8: Stabilizing control structure 2: Composition response.

Control structure selection for a deethanizer column with partial condenser 9
0 0.5 1 1.5 2 2.5 3 3.5 4 4.5 51.85
1.855
1.86
1.865
1.87
1.875
1.88
1.885
1.89
1.895
1.9x 10
6
Top
pre
ssur
e (N
/m2 )
Structure 2: Disturbance in feed flowrate
SPL−T36Q
b−T4
Qb−T36
L−T36 and Qb−T4
Figure 9: Stabilizing control structure 2: Pressure.
0 0.5 1 1.5 2 2.5 3 3.5 4 4.5 52.4
2.5
2.6
2.7
2.8
2.9
Ref
lux
drum
leve
l (m
)
Structure 2: Disturbance in feed flowrate
SPL−T36Q
b−T4
Qb−T36
L−T36 and Qb−T4
0 0.5 1 1.5 2 2.5 3 3.5 4 4.5 52
2.1
2.2
2.3
2.4
2.5
2.6
Bot
tom
leve
l (m
)
Figure 10: Stabilizing control structure 2: Level.
3.3. Stabilizing control structure 3
The stabilizing control structure 3 is: • bottom level is controlled by bottom flow rate B, which is flow controlled • pressure is controlled by condenser duty Qc • reflux drum level is controlled by reflux flow rate L , which is flow controlled This structure does not have the saturation problem that we found in the first two structures because the distillate flow rate is not used to control neither level nor pressure. So, supposing that the feed flow rate increases, the pressure will decrease and the control loop will decrease the condenser duty and, consequently, the pressure will increase again. The available degrees of freedom here are distillate flow rate the reboiler duty. So, the control structures, including temperature loops, considered were: 1. Open loop: here just the stabilizing control loops (pressure and levels) are closed,
i.e., the temperature control loops are kept opened

A. Hori et al.
2. D-T36: manipulate distillate flow rate to control temperature in tray 36, keeping the second temperature control loop opened
3. Qb-T4: manipulate reboiler duty to control temperature in tray 4, keeping the other temperature control loop opened
4. Qb-T31: manipulate reboiler duty to control temperature in tray with highest gain (most sensitive), keeping the other temperature control loop opened. This is the only stabilizing control structure that has tray 31 as the most sensitive
5. D-T36 and Qb-T4: manipulate distillate flow rate to control temperature in tray 36 (D-T36) and manipulate reboiler duty to control temperature in tray 4 (Qb-T4) (two-point temperature control)
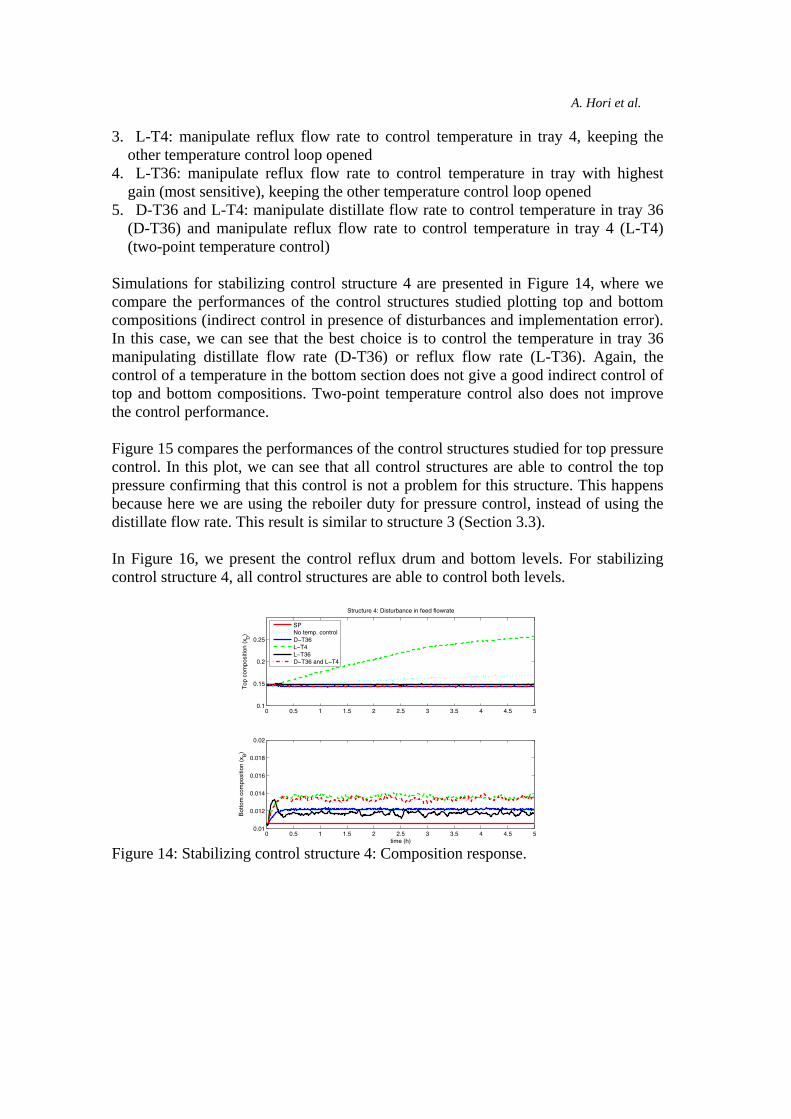
Simulations for stabilizing control structure 3 are presented in Figure 11, where we compare the different control structures studied in this section plotting top and bottom compositions. It is possible to see that the control structure that gives the smallest composition deviation is Qb-T31 (control temperature in tray 31 manipulating reboiler duty). This result is very similar to the previous stabilizing structures. Figure 12 compares the performance of the control structures studied to control the top pressure. For this stabilizing control structure, all control structures are able to control the top pressure confirming that this control is not a problem for this structure, differently from structures 1 (Section 3.1) and 2 (Section 3.2). This happens because here we are using condenser duty for pressure control, instead of using distillate flow rate. The performances of the control structures to control reflux drum and bottom levels are presented in Figure 13. Control structures D-T36 and Qb-T31 are able to control well the reflux drum, but control structures Qb-T4 and the two-point temperature control result in poor control. The control of bottom level, on the other hand, is good for all structures.
0 0.5 1 1.5 2 2.5 3 3.5 4 4.5 50
0.05
0.1
0.15
0.2
Top
com
posi
tion
(xD
)
Structure 3: Disturbance in feed flowrate
SPNo temp. controlD−T36Q
b−T4
Qb−T31
D−T36 and Qb−T36
0 0.5 1 1.5 2 2.5 3 3.5 4 4.5 50.005
0.01
0.015
Bot
tom
com
posi
tion
(xB)
time (h) Figure 11: Stabilizing control structure 3: Composition response.
Control structure selection for a deethanizer column with partial condenser 11
0 0.5 1 1.5 2 2.5 3 3.5 4 4.5 51.85
1.855
1.86
1.865
1.87
1.875
1.88
1.885
1.89
1.895
1.9x 10
6
Top
pre
ssur
e (N
/m2 )
Structure 3: Disturbance in feed flowrate
SPNo temp. controlD−T36Q
b−T4
Qb−T31
D−T36 and Qb−T4
Figure 12: Stabilizing control structure 3: Pressure.
0 0.5 1 1.5 2 2.5 3 3.5 4 4.5 52.4
2.5
2.6
2.7
2.8
2.9
Ref
lux
drum
leve
l (m
)
Structure 3: Disturbance in feed flowrate
SPNo temp. controlD−T36Q
b−T4
Qb−T31
D−T36 and Qb−T4
0 0.5 1 1.5 2 2.5 3 3.5 4 4.5 52
2.1
2.2
2.3
2.4
2.5
2.6
Bot
tom
leve
l (m
)
Figure 13: Stabilizing control structure 3: Level.
3.4. Stabilizing control structure 4
The fourth stabilizing control structure is: • bottom level is controlled by bottom flow rate, which is flow controlled • pressure is controlled by reboiler duty • reflux drum level is controlled by condenser duty • reflux flow rate is flow controlled As for structure 3 (see Section 3.3), this structure also does not present saturation problem because it does not use the distillate flow rate to control neither levels nor pressure. The available degrees of freedom here are distillate flow rate and reflux flow rate. So, the control structures considered were: 1. Open loop: here just the stabilizing control loops (pressure and levels) are closed,
i.e., the temperature control loops are kept opened 2. D-T36: manipulate distillate flow rate to control temperature in tray 36, keeping
the second temperature control loop opened
A. Hori et al.
3. L-T4: manipulate reflux flow rate to control temperature in tray 4, keeping the other temperature control loop opened
4. L-T36: manipulate reflux flow rate to control temperature in tray with highest gain (most sensitive), keeping the other temperature control loop opened
5. D-T36 and L-T4: manipulate distillate flow rate to control temperature in tray 36 (D-T36) and manipulate reflux flow rate to control temperature in tray 4 (L-T4) (two-point temperature control)
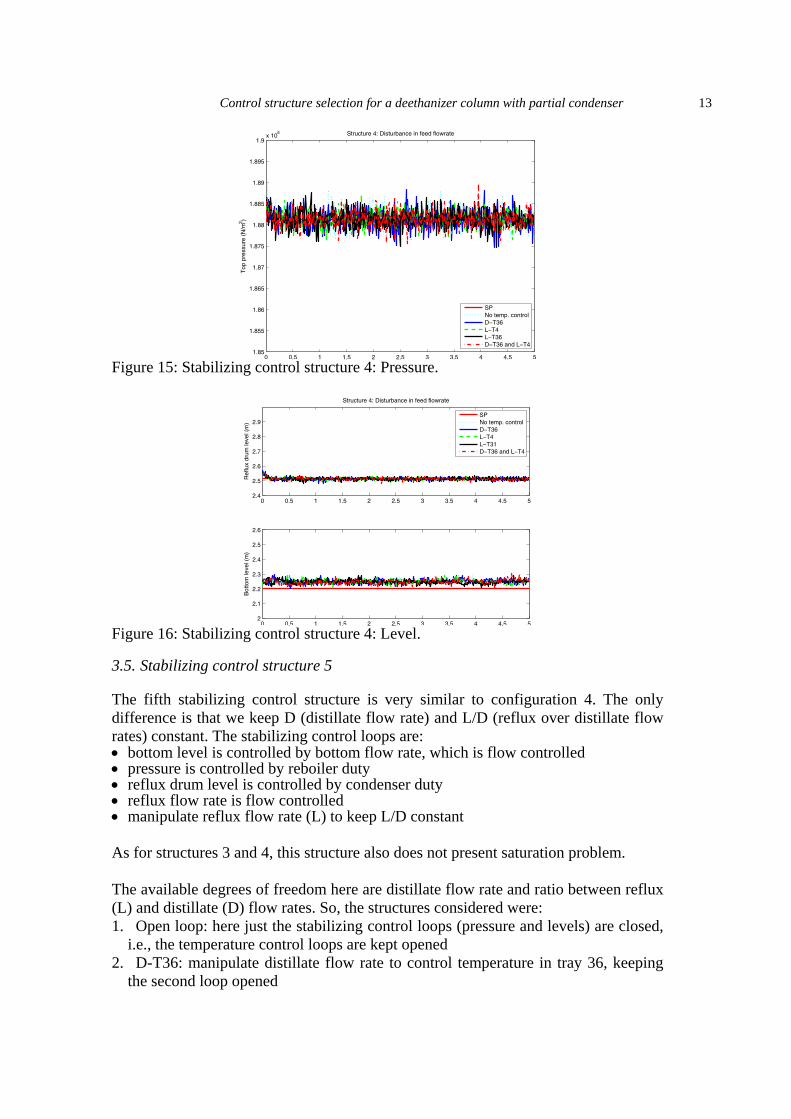
Simulations for stabilizing control structure 4 are presented in Figure 14, where we compare the performances of the control structures studied plotting top and bottom compositions (indirect control in presence of disturbances and implementation error). In this case, we can see that the best choice is to control the temperature in tray 36 manipulating distillate flow rate (D-T36) or reflux flow rate (L-T36). Again, the control of a temperature in the bottom section does not give a good indirect control of top and bottom compositions. Two-point temperature control also does not improve the control performance. Figure 15 compares the performances of the control structures studied for top pressure control. In this plot, we can see that all control structures are able to control the top pressure confirming that this control is not a problem for this structure. This happens because here we are using the reboiler duty for pressure control, instead of using the distillate flow rate. This result is similar to structure 3 (Section 3.3). In Figure 16, we present the control reflux drum and bottom levels. For stabilizing control structure 4, all control structures are able to control both levels.
0 0.5 1 1.5 2 2.5 3 3.5 4 4.5 50.1
0.15
0.2
0.25
Top
com
posi
tion
(xD
)
Structure 4: Disturbance in feed flowrate
SPNo temp. controlD−T36L−T4L−T36D−T36 and L−T4
0 0.5 1 1.5 2 2.5 3 3.5 4 4.5 50.01
0.012
0.014
0.016
0.018
0.02
Bot
tom
com
posi
tion
(xB)
time (h) Figure 14: Stabilizing control structure 4: Composition response.
Control structure selection for a deethanizer column with partial condenser 13
0 0.5 1 1.5 2 2.5 3 3.5 4 4.5 51.85
1.855
1.86
1.865
1.87
1.875
1.88
1.885
1.89
1.895
1.9x 10
6
Top
pre
ssur
e (N
/m2 )
Structure 4: Disturbance in feed flowrate
SPNo temp. controlD−T36L−T4L−T36D−T36 and L−T4
Figure 15: Stabilizing control structure 4: Pressure.
0 0.5 1 1.5 2 2.5 3 3.5 4 4.5 52.4
2.5
2.6
2.7
2.8
2.9
Ref
lux
drum
leve
l (m
)
Structure 4: Disturbance in feed flowrate
SPNo temp. controlD−T36L−T4L−T31D−T36 and L−T4
0 0.5 1 1.5 2 2.5 3 3.5 4 4.5 52
2.1
2.2
2.3
2.4
2.5
2.6
Bot
tom
leve
l (m
)
Figure 16: Stabilizing control structure 4: Level.
3.5. Stabilizing control structure 5
The fifth stabilizing control structure is very similar to configuration 4. The only difference is that we keep D (distillate flow rate) and L/D (reflux over distillate flow rates) constant. The stabilizing control loops are: • bottom level is controlled by bottom flow rate, which is flow controlled • pressure is controlled by reboiler duty • reflux drum level is controlled by condenser duty • reflux flow rate is flow controlled • manipulate reflux flow rate (L) to keep L/D constant As for structures 3 and 4, this structure also does not present saturation problem. The available degrees of freedom here are distillate flow rate and ratio between reflux (L) and distillate (D) flow rates. So, the structures considered were: 1. Open loop: here just the stabilizing control loops (pressure and levels) are closed,
i.e., the temperature control loops are kept opened 2. D-T36: manipulate distillate flow rate to control temperature in tray 36, keeping
the second loop opened
A. Hori et al.
3. L/D-T4: manipulate ratio L/D to control temperature in tray 4, keeping the other loop opened
4. L/D-T36: manipulate ratio L/D to control temperature in tray with highest gain (most sensitive), keeping the other loop opened
5. D-T36 and L/D-T4: manipulate distillate flow rate to control temperature in tray 36 (D-T36) and manipulate ratio L/D to control temperature in tray 4 (L/D-T4)
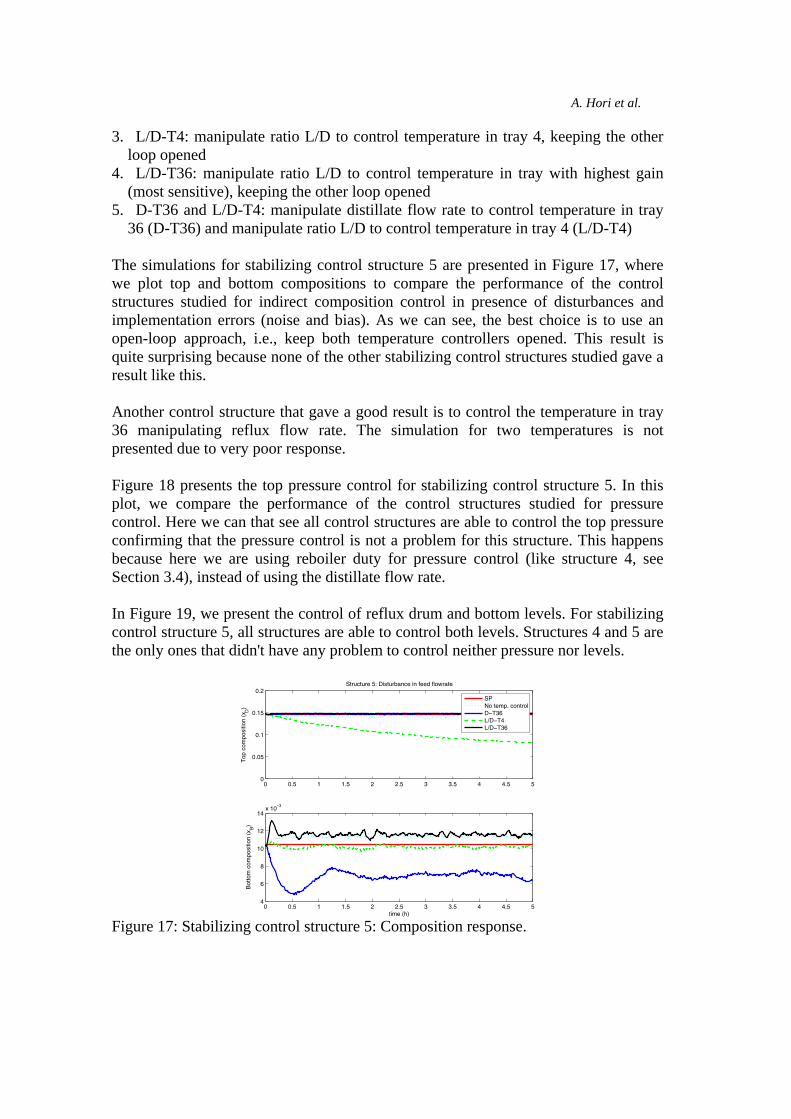
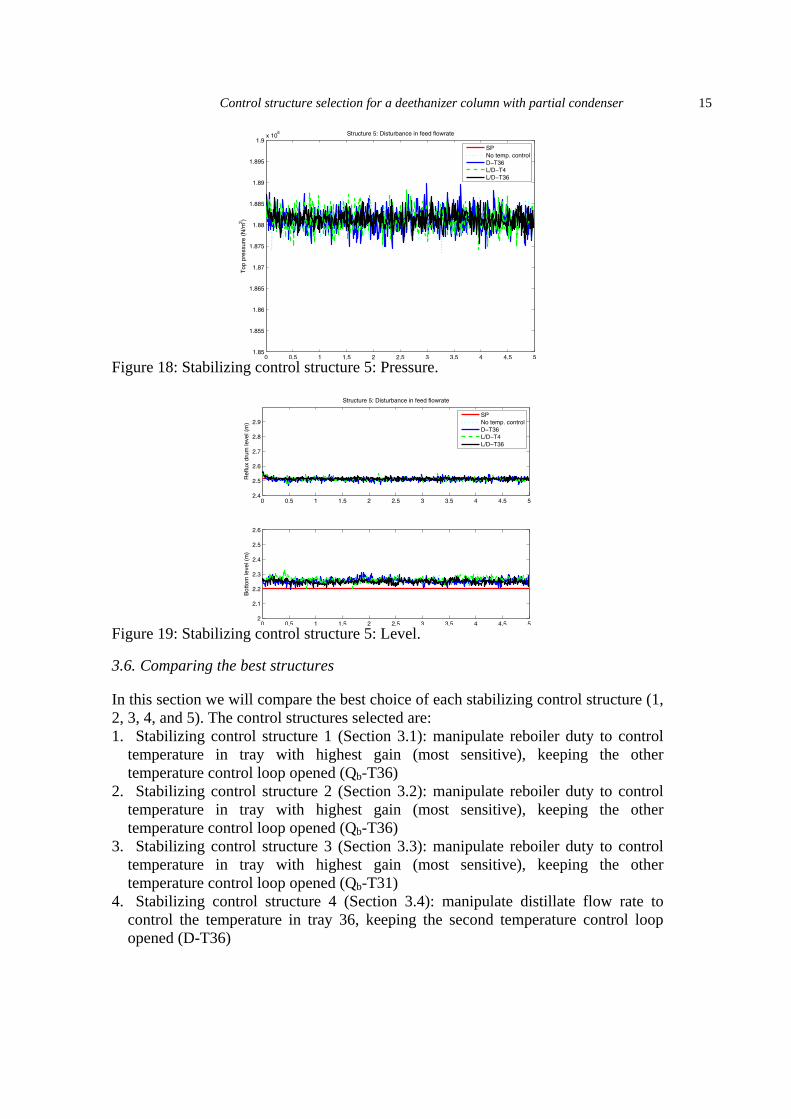
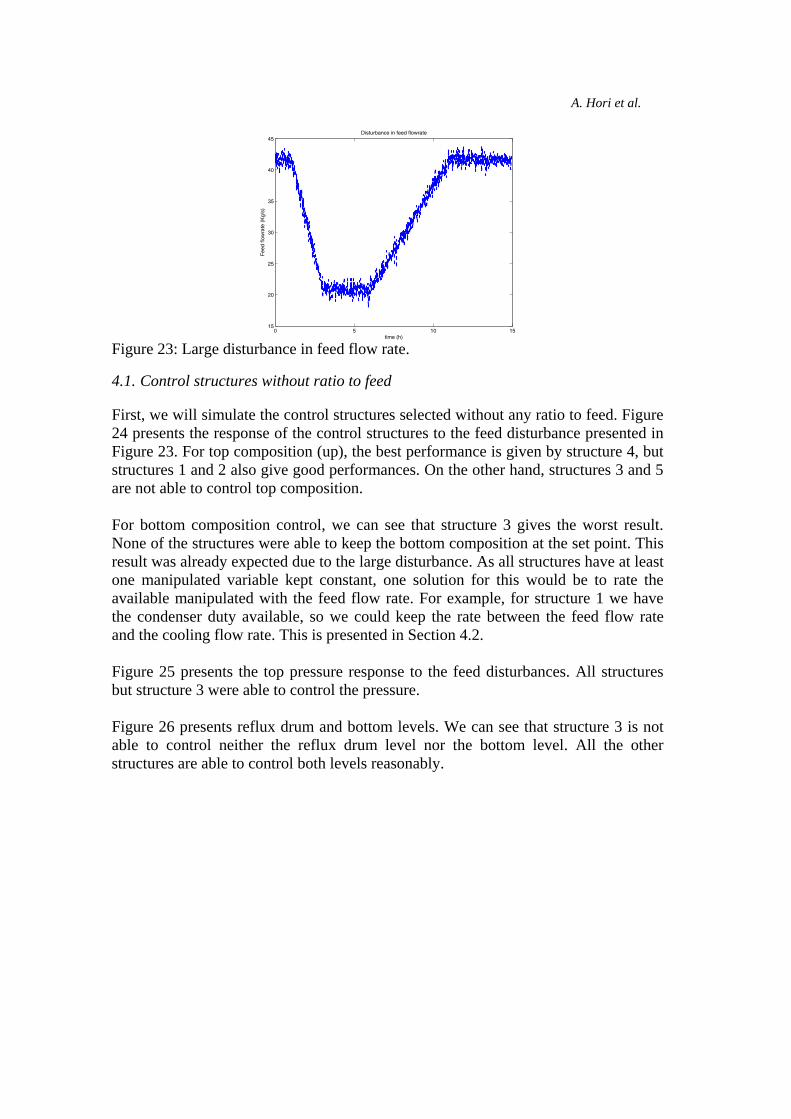
The simulations for stabilizing control structure 5 are presented in Figure 17, where we plot top and bottom compositions to compare the performance of the control structures studied for indirect composition control in presence of disturbances and implementation errors (noise and bias). As we can see, the best choice is to use an open-loop approach, i.e., keep both temperature controllers opened. This result is quite surprising because none of the other stabilizing control structures studied gave a result like this. Another control structure that gave a good result is to control the temperature in tray 36 manipulating reflux flow rate. The simulation for two temperatures is not presented due to very poor response. Figure 18 presents the top pressure control for stabilizing control structure 5. In this plot, we compare the performance of the control structures studied for pressure control. Here we can that see all control structures are able to control the top pressure confirming that the pressure control is not a problem for this structure. This happens because here we are using reboiler duty for pressure control (like structure 4, see Section 3.4), instead of using the distillate flow rate. In Figure 19, we present the control of reflux drum and bottom levels. For stabilizing control structure 5, all structures are able to control both levels. Structures 4 and 5 are the only ones that didn't have any problem to control neither pressure nor levels.
0 0.5 1 1.5 2 2.5 3 3.5 4 4.5 50
0.05
0.1
0.15
0.2
Top
com
posi
tion
(xD
)
Structure 5: Disturbance in feed flowrate
SPNo temp. controlD−T36L/D−T4L/D−T36
0 0.5 1 1.5 2 2.5 3 3.5 4 4.5 54
6
8
10
12
14x 10
−3
Bot
tom
com
posi
tion
(xB)
time (h) Figure 17: Stabilizing control structure 5: Composition response.
Control structure selection for a deethanizer column with partial condenser 15
0 0.5 1 1.5 2 2.5 3 3.5 4 4.5 51.85
1.855
1.86
1.865
1.87
1.875
1.88
1.885
1.89
1.895
1.9x 10
6
Top
pre
ssur
e (N
/m2 )
Structure 5: Disturbance in feed flowrate
SPNo temp. controlD−T36L/D−T4L/D−T36
Figure 18: Stabilizing control structure 5: Pressure.
0 0.5 1 1.5 2 2.5 3 3.5 4 4.5 52.4
2.5
2.6
2.7
2.8
2.9
Ref
lux
drum
leve
l (m
)
Structure 5: Disturbance in feed flowrate
SPNo temp. controlD−T36L/D−T4L/D−T36
0 0.5 1 1.5 2 2.5 3 3.5 4 4.5 52
2.1
2.2
2.3
2.4
2.5
2.6
Bot
tom
leve
l (m
)
Figure 19: Stabilizing control structure 5: Level.
3.6. Comparing the best structures
In this section we will compare the best choice of each stabilizing control structure (1, 2, 3, 4, and 5). The control structures selected are: 1. Stabilizing control structure 1 (Section 3.1): manipulate reboiler duty to control
temperature in tray with highest gain (most sensitive), keeping the other temperature control loop opened (Qb-T36)
2. Stabilizing control structure 2 (Section 3.2): manipulate reboiler duty to control temperature in tray with highest gain (most sensitive), keeping the other temperature control loop opened (Qb-T36)
3. Stabilizing control structure 3 (Section 3.3): manipulate reboiler duty to control temperature in tray with highest gain (most sensitive), keeping the other temperature control loop opened (Qb-T31)
4. Stabilizing control structure 4 (Section 3.4): manipulate distillate flow rate to control the temperature in tray 36, keeping the second temperature control loop opened (D-T36)

A. Hori et al.
5. Stabilizing control structure 5 (Section 3.5): use open loop approach, i.e., keep both temperature controllers opened and closing just the stabilizing controllers for pressure and levels
As can be seen, for most stabilizing control structures, the best control strategy is to control a temperature in top section manipulating reboiler duty. Figure 20 compares the control structures above plotting top and bottom compositions. The control structures that give the best indirect control composition (minimizes the composition deviation in the presence of disturbances and implementation errors) are stabilizing control structures 1 and 5. Also, structure 3 gives a reasonable response in steady state, but its dynamic response is too slow. The problem in structure 1 is its dependence on the temperature controller which must be working well the whole time; otherwise it has difficulties to control the pressure. For structure 5, the problem is that its performance is very dependent on distillate flow rate measurement error. If this measurement is not accurate enough, its results can be very poor. We can also verify from the results that the control of two temperatures is not optimum for this column. This confirms the results from Hori and Skogestad (2007a), which concluded that the control of two temperatures does not give any improvement for multicomponent columns. Figure 21 compares the pressure control for the selected control structures. We can see that the pressure control is good for all structures. The same comparison was done for both levels (reflux drum and bottom) in Figure 22. We can see that all structures are similar for bottom level control.
0 0.5 1 1.5 2 2.5 3 3.5 4 4.5 50.12
0.13
0.14
0.15
0.16
0.17
0.18
Top
com
posi
tion
(xD
)
Disturbance in feed flowrate
0 0.5 1 1.5 2 2.5 3 3.5 4 4.5 50.01
0.011
0.012
0.013
0.014
0.015
time (h)
Bot
tom
com
posi
tion
(xB)
SPStructure 1Structure 2Structure 3Structure 4Structure 5
Figure 20: Comparing different control structures: Composition response.

Control structure selection for a deethanizer column with partial condenser 17
0 0.5 1 1.5 2 2.5 3 3.5 4 4.5 51.85
1.855
1.86
1.865
1.87
1.875
1.88
1.885
1.89
1.895
1.9x 10
6
Top
pre
ssur
e
Disturbance in feed flowrate
SPStructure 1Structure 2Structure 3Structure 4Structure 5
Figure 21: Comparing different control structures: pressure.
0 0.5 1 1.5 2 2.5 3 3.5 4 4.5 52.4
2.45
2.5
2.55
Ref
lux
drum
leve
l
Disturbance in feed flowrate
0 0.5 1 1.5 2 2.5 3 3.5 4 4.5 52.1
2.15
2.2
2.25
time (h)
Bot
tom
leve
l
SPStructure 1Structure 2Structure 3Structure 4Structure 5
Figure 22: Comparing different control structures: level.
4. Large feed disturbance
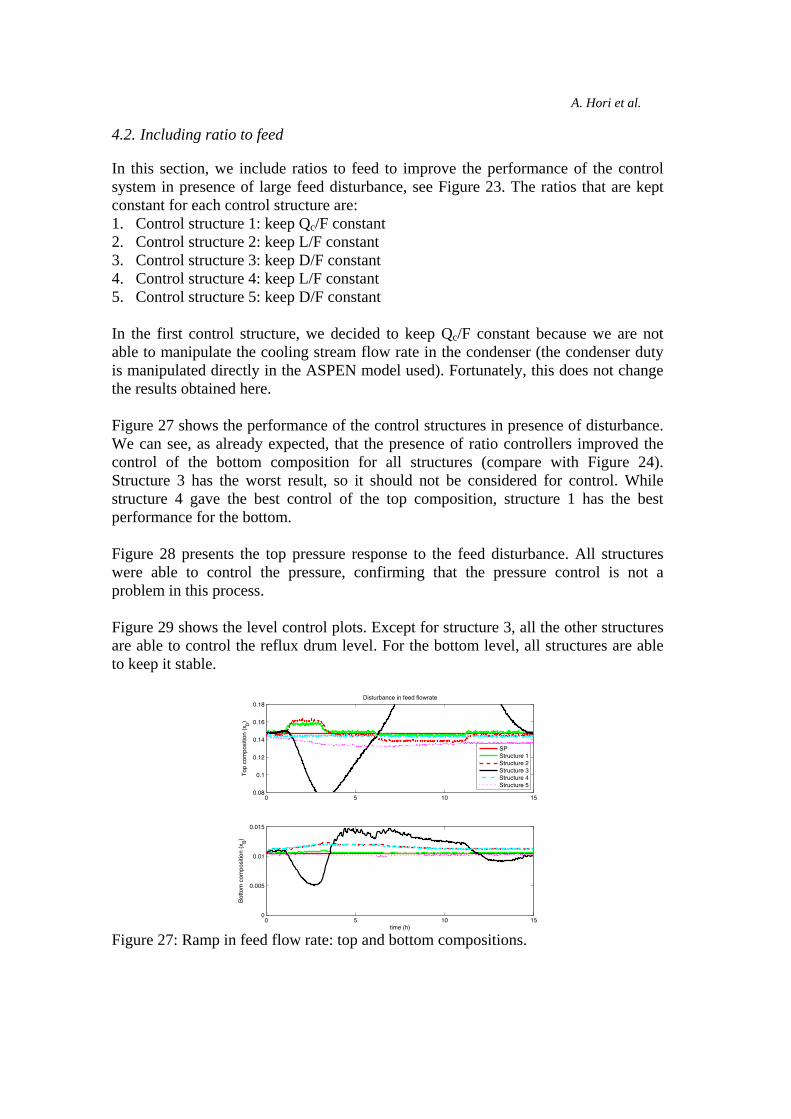
In this section, we compare the structures selected in Section 3 with an even larger feed disturbance. As the column feed comes by pipeline from another plant far away, it is common to have large changes in the feed flow rate. The decrease is usually faster than the increase, since the decrease often is a cause of a trip and increase is when they start up again in a controlled way. To compare the performance of the control structures selected in the previous section, we will apply ramp disturbances in feed flow rate from 150 t/h to 75 t/h in a 2-hour interval (from t = 1h to t = 3h) and another ramp change from 75 t/h to 150 t/h in a 5-hour interval (from t = 6h to t = 11h). Figure 23 presents the feed flow rate used in the simulation.
A. Hori et al.
0 5 10 1515
20
25
30
35
40
45
Fee
d flo
wra
te (
Kg/
s)
time (h)
Disturbance in feed flowrate
Figure 23: Large disturbance in feed flow rate.
4.1. Control structures without ratio to feed
First, we will simulate the control structures selected without any ratio to feed. Figure 24 presents the response of the control structures to the feed disturbance presented in Figure 23. For top composition (up), the best performance is given by structure 4, but structures 1 and 2 also give good performances. On the other hand, structures 3 and 5 are not able to control top composition. For bottom composition control, we can see that structure 3 gives the worst result. None of the structures were able to keep the bottom composition at the set point. This result was already expected due to the large disturbance. As all structures have at least one manipulated variable kept constant, one solution for this would be to rate the available manipulated with the feed flow rate. For example, for structure 1 we have the condenser duty available, so we could keep the rate between the feed flow rate and the cooling flow rate. This is presented in Section 4.2. Figure 25 presents the top pressure response to the feed disturbances. All structures but structure 3 were able to control the pressure. Figure 26 presents reflux drum and bottom levels. We can see that structure 3 is not able to control neither the reflux drum level nor the bottom level. All the other structures are able to control both levels reasonably.

Control structure selection for a deethanizer column with partial condenser 19
0 5 10 150.08
0.1
0.12
0.14
0.16
0.18
Top
com
posi
tion
(xD
)
Disturbance in feed flowrate
SPStructure 1Structure 2Structure 3Structure 4Structure 5
0 5 10 150
0.005
0.01
0.015
Bot
tom
com
posi
tion
(xB)
time (h) Figure 24: Ramp in feed flow rate: top and bottom compositions.
0 5 10 151.85
1.855
1.86
1.865
1.87
1.875
1.88
1.885
1.89
1.895
1.9x 10
6
Top
pre
ssur
e
Disturbance in feed flowrate
SPStructure 1Structure 2Structure 3Structure 4Structure 5
Figure 25: Ramp in feed flow rate: pressure.
0 5 10 152.4
2.45
2.5
2.55
2.6
2.65
2.7
Ref
lux
drum
leve
l)
Disturbance in feed flowrate
SPStructure 1Structure 2Structure 3Structure 4Structure 5
0 5 10 152
2.05
2.1
2.15
2.2
2.25
2.3
Bot
tom
leve
l
time (h) Figure 26: Ramp in feed flow rate: level.
A. Hori et al.
4.2. Including ratio to feed
In this section, we include ratios to feed to improve the performance of the control system in presence of large feed disturbance, see Figure 23. The ratios that are kept constant for each control structure are: 1. Control structure 1: keep Qc/F constant 2. Control structure 2: keep L/F constant 3. Control structure 3: keep D/F constant 4. Control structure 4: keep L/F constant 5. Control structure 5: keep D/F constant In the first control structure, we decided to keep Qc/F constant because we are not able to manipulate the cooling stream flow rate in the condenser (the condenser duty is manipulated directly in the ASPEN model used). Fortunately, this does not change the results obtained here. Figure 27 shows the performance of the control structures in presence of disturbance. We can see, as already expected, that the presence of ratio controllers improved the control of the bottom composition for all structures (compare with Figure 24). Structure 3 has the worst result, so it should not be considered for control. While structure 4 gave the best control of the top composition, structure 1 has the best performance for the bottom. Figure 28 presents the top pressure response to the feed disturbance. All structures were able to control the pressure, confirming that the pressure control is not a problem in this process. Figure 29 shows the level control plots. Except for structure 3, all the other structures are able to control the reflux drum level. For the bottom level, all structures are able to keep it stable.
0 5 10 150.08
0.1
0.12
0.14
0.16
0.18
Top
com
posi
tion
(xD
)
Disturbance in feed flowrate
SPStructure 1Structure 2Structure 3Structure 4Structure 5
0 5 10 150
0.005
0.01
0.015
Bot
tom
com
posi
tion
(xB)
time (h) Figure 27: Ramp in feed flow rate: top and bottom compositions.

Control structure selection for a deethanizer column with partial condenser 21
0 5 10 151.85
1.855
1.86
1.865
1.87
1.875
1.88
1.885
1.89
1.895
1.9x 10
6
Top
pre
ssur
e
Disturbance in feed flowrate
SPStructure 1Structure 2Structure 3Structure 4Structure 5
Figure 28: Ramp in feed flow rate: pressure.
0 5 10 152.4
2.45
2.5
2.55
2.6
2.65
2.7
Ref
lux
drum
leve
l)
Disturbance in feed flowrate
SPStructure 1Structure 2Structure 3Structure 4Structure 5
0 5 10 152
2.05
2.1
2.15
2.2
2.25
2.3
Bot
tom
leve
l
time (h) Figure 29: Ramp in feed flow rate: level.
5. Implementation in the real deethanizer
The control structure selected to be implemented in the real distillation column was Structure 1 (see Figure 30) without ratio to feed. This structure has the following loops: • bottom level is controlled by bottom flow rate, which is flow controlled • pressure is controlled by distillate flow rate D • reflux drum level is controlled by reflux flow rate L, which is flow controlled • temperature T36 is controlled by reboiler duty • condenser duty is kept constant Although the structure with ratio to feed (Qc/F) gave the best result (see Section 4.2), it was decided by the company to implement without it because the cooler feed flow rate is not measured. The initial results show that the new control structure is able to improve the column operation. The operator’s impression is that the column is now easier to control. The figures presented below are for two weeks data before and after the implementation

A. Hori et al.
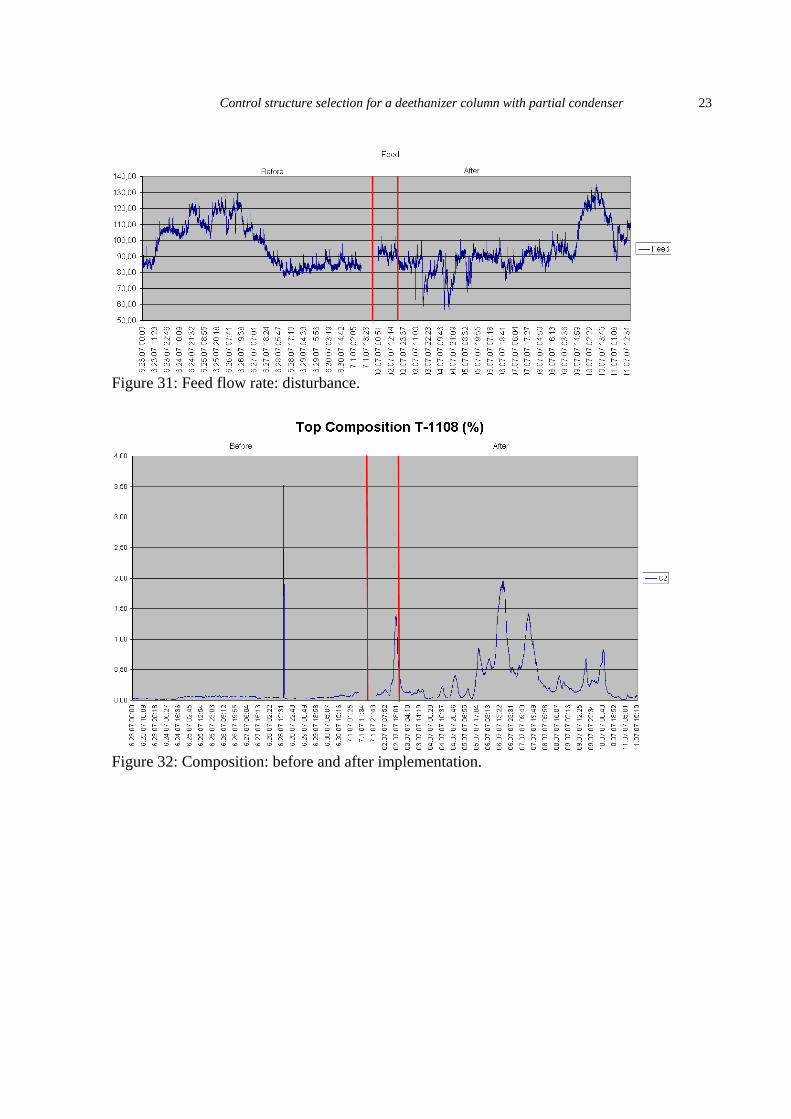
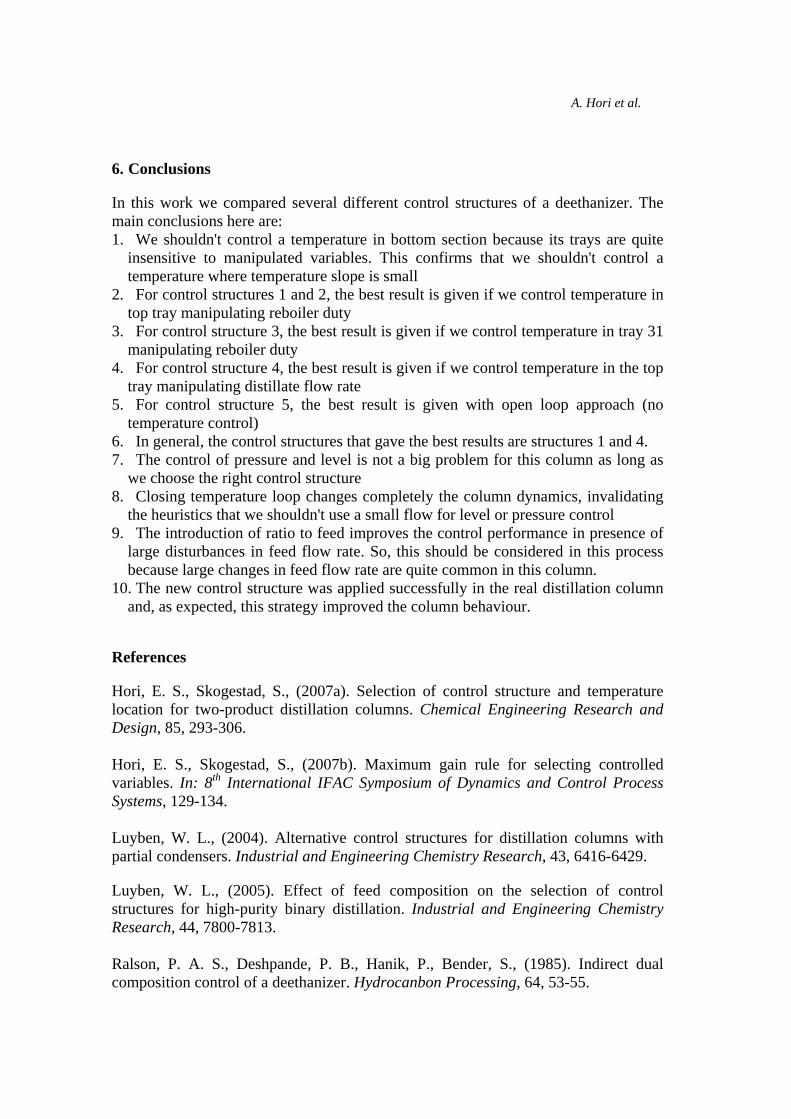
(02-jul-2007). The feed flow rate is shown in Figure 31, where we can see that it has large changes during short periods. Although the plant does not have an analyser in the deethanizer, the bottom flow rate is fed to the next column (depropanizer, T-1108), which has an analyser in the top product. The results are shown in Figure 32, where we can see that C2 has been over-fractionated in the deethanizer before the implementation of the new structure. As shown by Figure 37, after the implementation, the reboiler duty reduced, i.e. the column is using less energy. Figure 33 shows the column temperatures. It is possible to observe that the variability of the top temperature reduced. Also, although we are not controlling a temperature in the bottom section, the temperatures in this section are still well controlled, confirming that it is not necessary to control a temperature there. We can also see in this figure that there were large changes in the temperature from 04/07 to 05/07. In this case, according to operators, the pressure loop was put in manual (see Figure 36) because they had some butane loading, leading to variations and high pressure in propane upstream top cooler. Figure 34 shows the column pressure confirming that the pressure is well controlled for this control structure. In Figure 35 are presented both reflux drum and bottom levels. We can see that the bottom level control almost didn’t change but the reflux drum level control improved significantly. According to the operators, the distillate flow rate should be very stable (it should have low variability). Figure 36 shows the distillate flow rate, where we can see that its variability improved significantly after the implementation of the new control strategy.
xtop
D
F
stage N-1L
stage N (t, 0%)
stage 2V
stage N (100% from top or bottom)F
PIC195
stage 1 (b, 0%) B xbtm
LIC115
FIC117
LIC114
FIC115
TIC194
Figure 30: Control structure implemented in the real distillation column
Control structure selection for a deethanizer column with partial condenser 23
Figure 31: Feed flow rate: disturbance.
Figure 32: Composition: before and after implementation.

A. Hori et al.
Figure 33: Column temperatures: before and after implementation.
Figure 34: Column pressure: before and after implementation.

Control structure selection for a deethanizer column with partial condenser 25
Figure 35: Column levels: before and after implementation.
Figure 36: Distillate flow rate: before and after implementation.
Figure 37: Qb/F: before and after implementation.
A. Hori et al.
6. Conclusions
In this work we compared several different control structures of a deethanizer. The main conclusions here are: 1. We shouldn't control a temperature in bottom section because its trays are quite
insensitive to manipulated variables. This confirms that we shouldn't control a temperature where temperature slope is small
2. For control structures 1 and 2, the best result is given if we control temperature in top tray manipulating reboiler duty
3. For control structure 3, the best result is given if we control temperature in tray 31 manipulating reboiler duty
4. For control structure 4, the best result is given if we control temperature in the top tray manipulating distillate flow rate
5. For control structure 5, the best result is given with open loop approach (no temperature control)
6. In general, the control structures that gave the best results are structures 1 and 4. 7. The control of pressure and level is not a big problem for this column as long as
we choose the right control structure 8. Closing temperature loop changes completely the column dynamics, invalidating
the heuristics that we shouldn't use a small flow for level or pressure control 9. The introduction of ratio to feed improves the control performance in presence of
large disturbances in feed flow rate. So, this should be considered in this process because large changes in feed flow rate are quite common in this column.
10. The new control structure was applied successfully in the real distillation column and, as expected, this strategy improved the column behaviour.
References
Hori, E. S., Skogestad, S., (2007a). Selection of control structure and temperature location for two-product distillation columns. Chemical Engineering Research and Design, 85, 293-306. Hori, E. S., Skogestad, S., (2007b). Maximum gain rule for selecting controlled variables. In: 8th International IFAC Symposium of Dynamics and Control Process Systems, 129-134. Luyben, W. L., (2004). Alternative control structures for distillation columns with partial condensers. Industrial and Engineering Chemistry Research, 43, 6416-6429. Luyben, W. L., (2005). Effect of feed composition on the selection of control structures for high-purity binary distillation. Industrial and Engineering Chemistry Research, 44, 7800-7813. Ralson, P. A. S., Deshpande, P. B., Hanik, P., Bender, S., (1985). Indirect dual composition control of a deethanizer. Hydrocanbon Processing, 64, 53-55.

Control structure selection for a deethanizer column with partial condenser 27
Skogestad, S., (1997). Dynamics and control of distillation columns: a tutorial introduction. Chemical Engineering Research and Design, 75, 539-562.