control structure selection for the deethanizer...
TRANSCRIPT

Control structure selection for the deethanizer column from
Mongstad/Statoil
Eduardo Shigueo Hori, Sigurd Skogestad
April 27, 2007
Abstract
The selection of a good control structure for a distillation column is important for the plantoperation because it can affect its operability. In this work, it is studied the control structureselection of a deethanizer distillation column from Mongstad/Statoil. This is a multicomponentdistillation column with a partial condenser and a vapor distillate flow. Having a very smalldistillate flow rate (1% of the feed flow rate), this column presents some difficulties for pressurecontrol. The simulations are done in ASPEN Plus and ASPEN Dynamics. The main objectiveis to find a structure that minimizes the effect of the disturbances and implementation error(noise and bias) in the top and bottom compositions (indirect composition control). The resultsshow that it is better to control temperatures in the top section where the gains are higher and,as this is a multicomponent column, the two-point temperature control does not improve thecontrol system performance, confirming the results obtained by Hori and Skogestad (2007b).As the most important disturbance for this column is the feed flow rate, the results also showthat we should ratio the available manipulated variables with feed flow to improve the controlperformance. Also, the simulations show that it is possible to control the pressure using thedistillate flow rate if we also close a temperature loop.
1 Introduction
In this work, we want to simulate, in ASPEN Plus and ASPEN Dynamics, the deethanizer distillationcolumn from Mongstad/Statoil. This column has operational problems and our objective is to finda good control structure for it. The column has 36 trays and a partial condenser. The top productis vapor and the bottom product is liquid.
Partial condensers are used when there are very light components in the feed to the columnthat would require a high column pressure or a low condenser temperature, so the use of a partialcondenser can avoid the use of costly refrigeration (Luyben, 2004).
The objective of the column is to separate ethane (C2) from propane (C3). Although the maxi-mum allowed concentrations of C3 in the distillate is 10% (mol fraction) and the maximum concen-trations of C2 in the bottom flow is 1% mol, we are running the simulations in a operation pointcloser to the operation point used in the real plant. So, in this case, the top composition is around15%. This difference is not significant enough to invalidate the results obtained in this work, i.e.,the same conclusions can be extended to the desired objective of the column (maximum of 10% ofC3 in the distillate, D).
The feed composition is (in % mol): 2.1% of ethane (C2), 59.8% of propane (C3), 12.5% ofisobutane (I � C4), 25% of butane (N � C4), and 0.6% of propane (N � C5). The total feed flow
1

Reboiler 5 10 15 20 Feed 30 Top−10
0
10
20
30
40
50
60
70
80
Stage Number
Te
mp
era
ture
Temperature profile
Optimal
Operation
Figure 1: Temperature profile (oC).
rate is 150 ton=h. The column is fed in tray 26. As the feed is already very low concentrated inethane, the distillate flow rate will be very small (around 1% of the feed flow rate). Although thiscould cause some difficulties for pressure control, the results show that this is not a big problem ifwe consider that a temperature loop is also closed.
The most important disturbance in this column is the feed flow rate. It can change from 75ton=h to 150 ton=h during the operation in few hours, as is shown in Figure 41, where the feed flowrate decreases about 45 ton=h in less than 1 hour.
Ralston et al. (1985) presented an indirect dual composition control of a deethanizer. They usea combination of a feedforward and a feedback algorithms. The control structure used was:
- The bottom level is controlled by bottom flow rate (B)
- The reflux drum level is controlled by condenser duty (Qc)
- The pressure is controlled by distillate flow rate (D)
- A temperature is controlled by reboiler duty (Qb)
To complete their control structure, Ralston et al. (1985) applied a feedforward algorithm wherethey measure the feed flow rate e composition and manipulate the reflux flow rate (L). Exceptfor the feed forward part, this control strategy is similar to control structure 2 (see section 3.2).Differently from our case, this deethanizer has a high distillate flow rate, so it probably does nothave the saturation problems that we found for structure 2 shown below.
The objective of this work is to find a good control structure that keeps, indirectly, the topand bottom compositions of the deethanizer close to their desired set points. In the simulationspresented we added noise and bias in all measurements.
2 Profiles
The first step in this project is to do a steady-state simulation. This simulation was done in ASPENPlus. The data used came from the process and instrument diagrams (P&ID) provided by Statoil.
Figure 1 compares the temperature profile obtained by the simulations. Here we compare thetemperatures of the desired top and bottom compositions (“optimal”) with the temperatures of
2

Reboiler 5 10 15 20 Feed 30 Top0
2
4
6
8
10
12
Te
mp
era
ture
slo
pe
Stage Number
Temperature Slope
Figure 2: Temperature slope (oC).
Reboiler 5 10 15 20 Feed 30 Top0
0.1
0.2
0.3
0.4
0.5
0.6
0.7
0.8
0.9
1
Stage Number
Pro
pa
ne
co
mp
ositio
n (
mo
l/m
ol)
Vapor Composition Profile
Optimal
Operation
Figure 3: C3 composition profile (mol/mol).
3

Reboiler 5 10 15 20 Feed 30 Top0
0.1
0.2
0.3
0.4
0.5
0.6
0.7
0.8
0.9
1
Stage Number
Co
mp
ositio
n (
mo
l/m
ol)
Liquid Composition Profile
C2
C3
n−C4
i−C4
C5
Figure 4: Composition profile (mol/mol).
the actual operational point (“operation”). We can see that there is a slight difference in the toptemperature. The desired temperature should be around -0.8 oC, but the column actually works ata bit higher temperature of around +2.5 oC. The result is that the composition of C3 obtained inthe distillate flow rate (15%) is higher than the desired specification (maximum of 10%), see Figure3.
The operational temperature in the reboiler should be higher than presented in the plot (around75 oC), but ASPEN Plus was not able to converge at that temperature for the reboiler. Thetemperature that ASPEN reached was around 70oC (see Figure 1), which is the same temperaturefound in the ”Process Flow Diagram” provided by Statoil.
We can see from Figure 1 that the temperature profile is very flat in the bottom section. It impliesthat the temperature slope (temperature difference between neighbouring stages) is very small (seeFigure 2), so we shouldn’t control a temperature in this region (Hori and Skogestad, 2007b; Luyben,2005). This happens because the initial (high frequency) gain, which corresponds to the desiredclosed-loop time constant, is of primary importance (Skogestad, 1997) and is directly proportionalto the temperature difference. For dynamic control purpose it is better a large dynamic gain, andthen good to control temperature at a stage where the slope is large (Hori and Skogestad, 2007b).
The compositions are also quite flat in the bottom section (see Figures 3 and 4).The simulation results presented in Section 3 confirm that the best location for a temperature
measurement is in the upper part of the column.
3 Control structures
In this section we will test several different control structures. Luyben (2004) cites some character-istics of columns with partial condensers that should be taken into consideration while choosing thecontrol structure to be used:
� There is no effect of vapor flow rate on reflux drum level, so the distillate flow rate cannot beused to control directly the reflux drum level
� Besides the condenser duty, the pressure is affected by the distillate flow rate, resulting ininteractions between the control loops that manipulate these two variables
4

� There is a strong interaction among the pressure, temperature and level loops, so the pairingand tuning of these loops are much more difficult than in a total-condenser column
The difference among the stabilizing control structures is how to control the top pressure andthe reflux drum level. The only stabilizing loop that does not change is the bottom level controlloop. The bottom level is always controlled by the bottom flow rate (B). Besides, the bottom flowrate and the reflux flow rate (L) are flow controlled, as is done by Statoil (see Figures 6 and 13).
For each one of these 6 stabilizing control structures, we will have 5 different ways to control thetemperatures:
1. Open loop - in this structure, we keep both temperature control loops opened, i.e., we justclose the pressure and level loops
2. Control temperature T36 (or T37 for structure 1)
3. Control temperature T4
4. Control the temperature with highest gain (usually tray 36). Structure 3 (see Section 3.3) isthe only one where we are controlling tray 31. The main difference here from item 2 is themanipulated variable
5. Two point temperature control - in this structure we control temperatures T36 and T4
So, it means that we have, in total, 30 different control structures (including pressure, level andtemperature loops).
We decided to control the temperatures in trays 4 and 36 (temperature 37 for structure 1) becausethese temperatures have been controlled in the normal operation of the column (see Figures 6 and13).
For the simulations presented below, we applied a disturbance in the feed flow rate (valve openingchange from 50% to 55%) at time t D 0. We also included noise and bias in all measurements.Another important disturbance that should be considered is the feed composition.
3.1 Stabilizing control structure 1
The first control structure is shown in Figure 5. In this structure, we used the following controlloops to stabilize the column, i.e., to control pressure and top and bottom levels:
- the bottom level is controlled by the bottom flow rate B , which is flow controlled
- the pressure is controlled by the distillate flow rate D
- the reflux drum level is controlled by the reflux flow rate L, which is flow controlled
This stabilizing control structure has been used by Statoil (see Figure 6) to control the deetha-nizer.
The problem with this control structure is that the distillate flow rate (vapor product) is verysmall compared to the bottom product and the feed (about 1% of the total feed). In this case, thisflow can easily saturate (see Figure 7), so it shouldn’t be used for pressure control, at least withoutclosing a temperature loop. This can be explained in the following example: suppose we have anincrease in the feed flow rate, the pressure will decrease and the pressure controller will close thedistillate flow rate. As this the distillate is small, it will probably saturate, i.e., the pressure willsteadily decrease. On the other hand, if we have a temperature loop closed, the increase in the feed
5

xtop
D
F
stage N-1L
stage N (t, 0%)
stage 2V
stage N (100% from top or bottom)F
PIC195
stage 1 (b, 0%) B xbtm
TIC198
LIC115
FIC117
LIC114
FIC115
TIC194
Figure 5: Stabilizing control structure 1: V VT configuration.
Figure 6: Stabilizing control structure 1 - Operation screen from Mongstad/Statoil (21/01/2005).
6

Figure 7: With a 5% change in valve V1, the distillate flow rate (vapor product) stream saturates.
flow rate will decrease the column temperature and the controller will increase the vapor flow rate(if we manipulate the reboiler duty), increasing the pressure again. This conclusion is confirmed byFigures 9, 10, and 11) and by Luyben (2004).
As we have two degrees of freedom available (condenser duty (Qc) and reboiler duty (Qb)), wedecided to control two temperatures to improve the system response.
So, after adding the temperature loops, we considered the following three control structures:
1. Qc-T37: manipulate the condenser duty (Qc) to control the temperature of the condenseroutput, keeping the second temperature loop opened
2. Qb-T4: manipulate the reboiler duty (Qb) to control the temperature in tray 4, keeping theother temperature loop opened
3. Qb-T36: manipulate the reboiler duty (Qb) to control the tray which has the highest gain(most sensitive tray), keeping the other temperature loop opened
Here we didn’t include the two-point temperature control (closing both temperature loops Qc -T37 and Qb-T4) because its response was too poor. By the same reason, we excluded the open loopapproach (keeping both temperature loops opened).
To choose the most sensitive tray, we applied a step change in the reboiler duty (Qb), see Figure8. In this figure we just show the response for the temperatures that are measured in the real column(bottom, trays 4, 13, 31, 36 and condenser output). As can be seen, the temperature with highestgain (most sensitive) is in tray 36. It means that, according to Hori and Skogestad (2007b), thistemperature is the best to be controlled. It is possible to see also that the temperatures in the bottomsection are very low sensitive, i.e., they shouldn’t be used for control (Hori and Skogestad, 2007a).This result confirms that we shouldn’t control a temperature where we have small temperature slope(temperature change from tray to tray) is small (Luyben, 2005), i.e., where the temperature profileis flat (see Section 2).
The control structures are compared in Figure 9 for a disturbance in feed flow rate. In this plot,we compare the indirect control of the top and bottom compositions, i.e., we check how much the
7

Figure 8: Stabilizing control structure 1 - Step test to choose the most sensitive temperature.
0 0.5 1 1.5 2 2.5 3 3.5 4 4.5 50
0.05
0.1
0.15
0.2
Top c
om
positio
n (
x D)
Structure 1: Disturbance in feed flowrate
SP
Qc−T37
Qb−T4
Qb−T36
0 0.5 1 1.5 2 2.5 3 3.5 4 4.5 50.01
0.012
0.014
0.016
0.018
0.02
Bottom
com
positio
n (
xB)
time (h)
Figure 9: Stabilizing control structure 1 - Composition response.
8

0 0.5 1 1.5 2 2.5 3 3.5 4 4.5 51.85
1.855
1.86
1.865
1.87
1.875
1.88
1.885
1.89
1.895
1.9x 10
6
To
p p
ressu
re (
N/m
2)
Structure 1: Disturbance in feed flowrate
SP
Qc−T37
Qb−T4
Qb−T36
Figure 10: Stabilizing control structure 1 - Pressure.
top and bottom compositions deviate from their desired setpoints in the presence of disturbancesand implementation error (noise and bias). The objective is to choose the control structure thatgives the smallest composition deviation (smallest “loss”). From this figure, it is possible to see thatthe best structure is Qb-T36. This structure gives almost zero deviation for top composition andthe smallest for bottom composition. This result confirms that, in this case, it is better to controla temperature in the top section (highest gain and large temperature slope). Although it can seema bit strange to control a temperature in the top section manipulating the reboiler duty (Qb), Horiand Skogestad (2007b) present some examples of columns that have this same characteristic.
The problem in using control structure 1 is that it strongly depends on the temperature loop,otherwise it can have problems to control the pressure (Figure 7). As temperature controllersusually do not have problems, than this control structure is a good choice. This result shows thatthe common heuristics of not using a small flow to stabilize a column does not work when we closethe temperature loops.
Figure 10 shows the performances of the top pressure control for the control structures studiedin this section. The plot shows that just structure Qb-T36 is able to give a good control of thetop pressure, while structures Qc-T37 and Qb-T4 result in poor control. This result confirms thatstructure Qb-T36 is the best choice for control structure 1.
Figure 11 presents the control of both levels (reflux drum and bottom levels). As can be seenhere, all structures (Qc -T37, Qb-T36, and Qc-T4) are able to control the reflux drum level. On theother hand, the control of the bottom level is good for Qb-T36 and Qb -T4 but very poor for Qc -T37. It is possible to verify in the control of the bottom level that, differently from the reflux drumlevel controller, the bottom level controller does not reach the set point for none of the structures(results in off-set). This off-set is caused by the bias used here, i.e., we can see that the reflux drumlevel controller is able to handle bias better than the bottom level controller. Although an off-setis undesirable, in this case it does not cause any problem in the process because the level does notaffect the steady-state.
9

0 0.5 1 1.5 2 2.5 3 3.5 4 4.5 52.2
2.3
2.4
2.5
2.6
2.7
2.8
Reflux d
rum
level (m
)
Structure 1: Disturbance in feed flowrate
0 0.5 1 1.5 2 2.5 3 3.5 4 4.5 52
2.1
2.2
2.3
2.4
2.5
2.6
Bottom
level (m
)
SP
Qc−T37
Qb−T4
Qb−T36
Figure 11: Stabilizing control structure 1 - Level.
F
stage N-1L
Dstage N (t, 0%)
xtop
stage 2V
stage N (100% from top or bottom)F
B xbtmstage 1 (b, 0%)
LIC114
FIC115
TIC194
FIC117
TIC198
LIC115
PIC195
Figure 12: Stabilizing control structure 2: LV configuration.
10
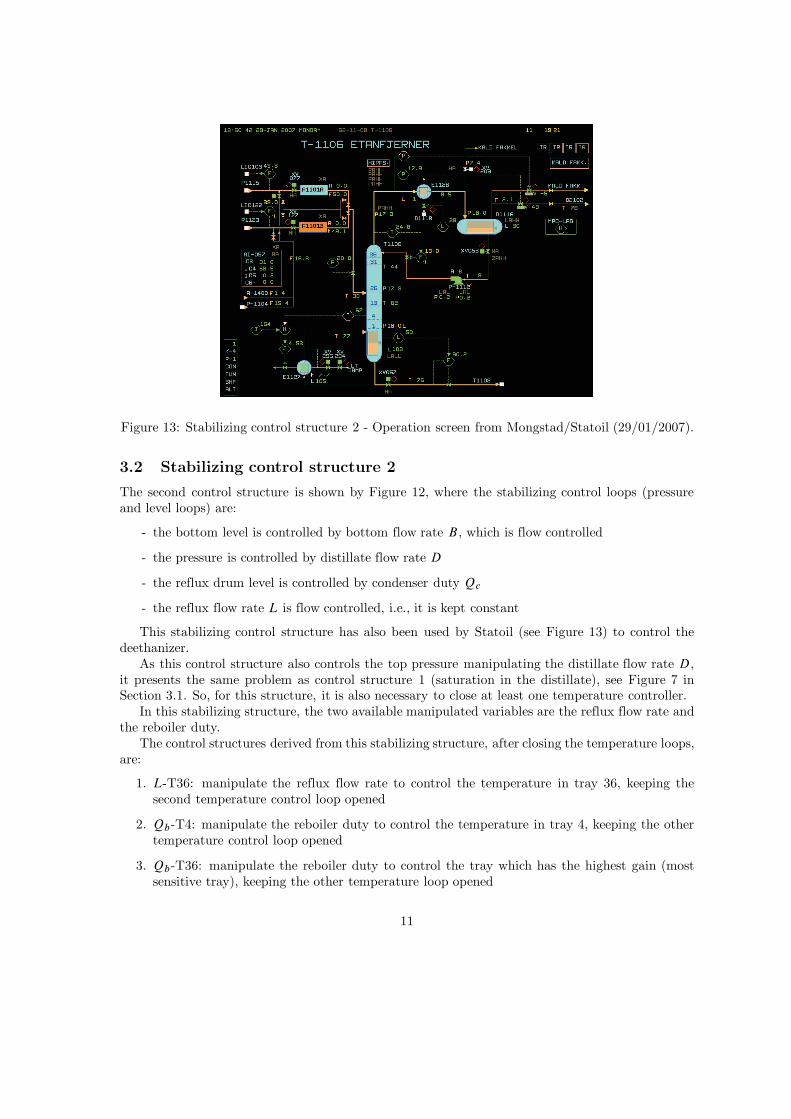
Figure 13: Stabilizing control structure 2 - Operation screen from Mongstad/Statoil (29/01/2007).
3.2 Stabilizing control structure 2
The second control structure is shown by Figure 12, where the stabilizing control loops (pressureand level loops) are:
- the bottom level is controlled by bottom flow rate B, which is flow controlled
- the pressure is controlled by distillate flow rate D
- the reflux drum level is controlled by condenser duty Qc
- the reflux flow rate L is flow controlled, i.e., it is kept constant
This stabilizing control structure has also been used by Statoil (see Figure 13) to control thedeethanizer.
As this control structure also controls the top pressure manipulating the distillate flow rate D,it presents the same problem as control structure 1 (saturation in the distillate), see Figure 7 inSection 3.1. So, for this structure, it is also necessary to close at least one temperature controller.
In this stabilizing structure, the two available manipulated variables are the reflux flow rate andthe reboiler duty.
The control structures derived from this stabilizing structure, after closing the temperature loops,are:
1. L-T36: manipulate the reflux flow rate to control the temperature in tray 36, keeping thesecond temperature control loop opened
2. Qb-T4: manipulate the reboiler duty to control the temperature in tray 4, keeping the othertemperature control loop opened
3. Qb-T36: manipulate the reboiler duty to control the tray which has the highest gain (mostsensitive tray), keeping the other temperature loop opened
11

Figure 14: Stabilizing control structure 2 - Step test to choose the most sensitive temperature.
4. L-T36 and Qb-T4: manipulate the reflux flow rate to control the temperature in tray 36 (L-T36) and manipulate the reboiler duty to control the temperature in tray 4 (Qb-T4). This isthe two-point temperature contol strategy
As for structure 1 (see Section 3.1), we didn’t include the open loop strategy (both temperaturecontrol loops opened) because its response was very poor.
The most sensitive temperature (tray with highest gain) was chosen applying a step change inthe reboiler duty. Figure 14 shows that the most sensitive temperature is in tray 36, confirming thatthe bottom section is quite insensitive to the manipulated variables.
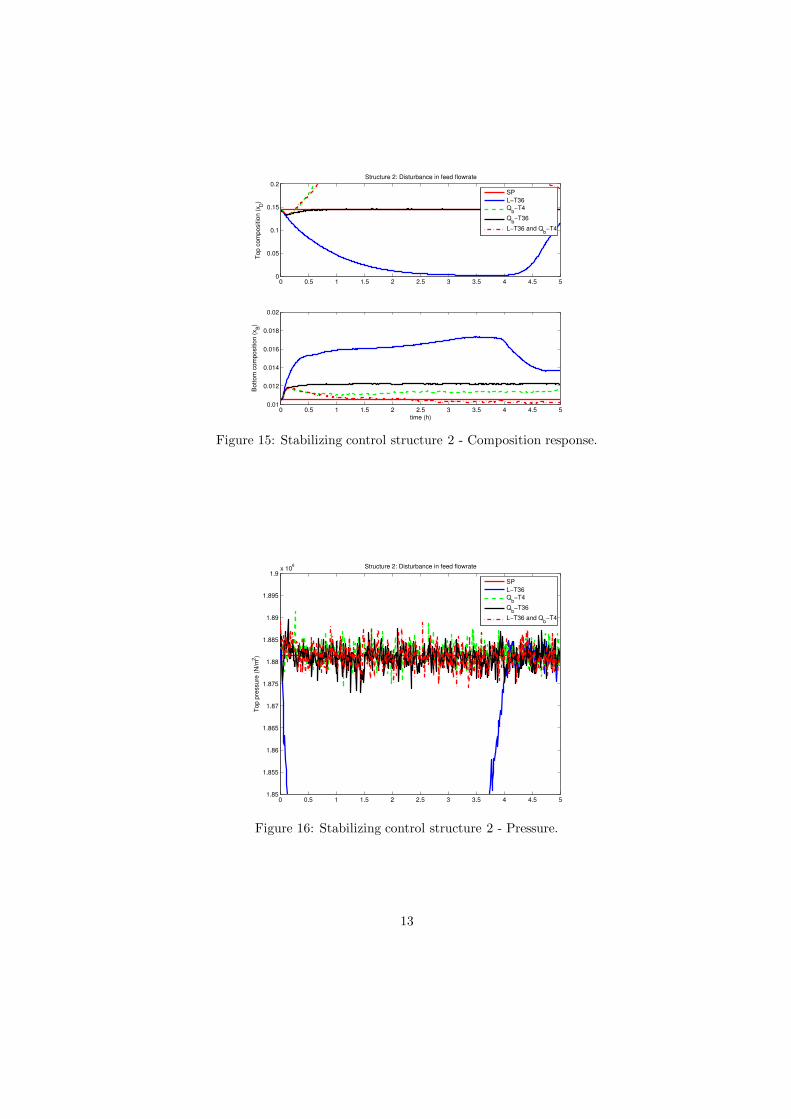
The control structures are compared in Figure 15, where we plot the top and bottom compo-sitions. As we want to choose a control structure that minimizes the effect of disturbances andimplementation error (noise and bias) in the top and bottom compositions (indirect control), we cansee that the best control structure is Qb-T36, confirming that, in this case, it is better to control atemperature in the top section. These results confirm that the two-point temperature control strat-egy (closing L-T36 and Qb-T4) does not improve the control system for multicomponent columns(Hori and Skogestad, 2007b).
The problem in using control structure 2 is that it strongly depends on the temperature loop, asfor structure 1.
Figure 16 compares the top pressure control response for the control structures analysed in thissection. The pressure control using control structure L-T36 results in a poor performance, confirmingthat this structure it is not a good choice. The other structures (Qb-T4, Qb -T36, and two-pointtemperature control) result in good top pressure control.
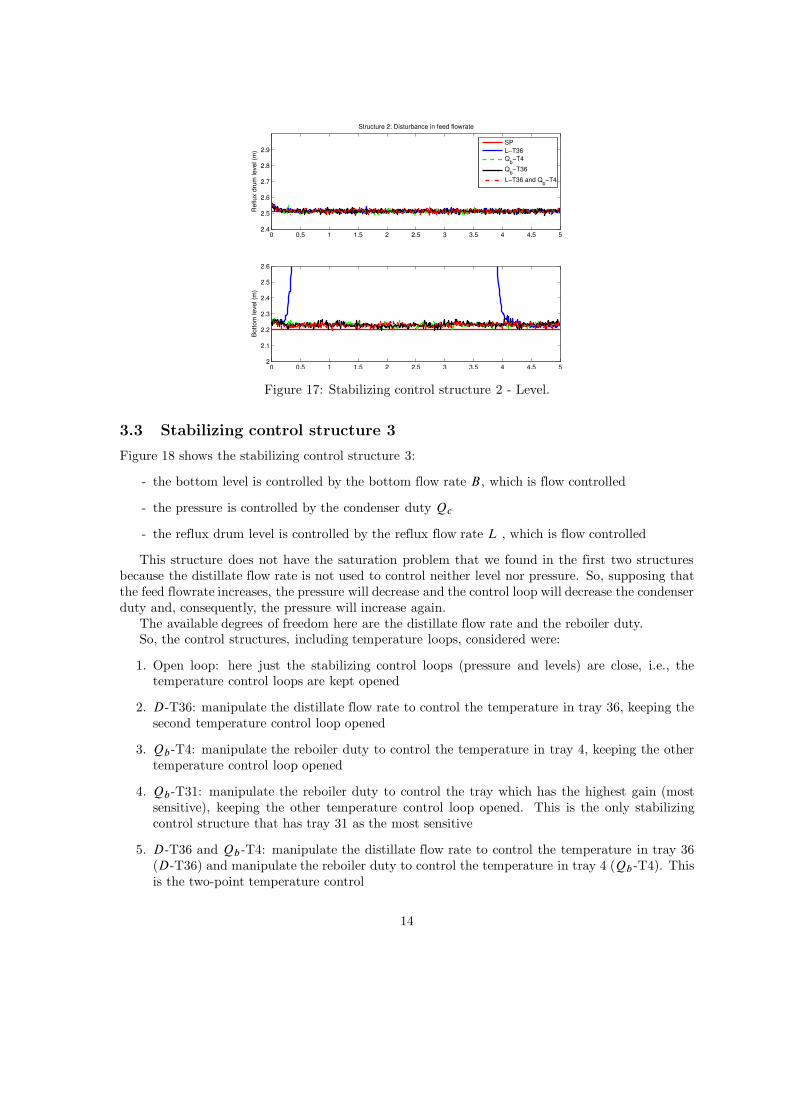
Figure 17 compares the control performance of the reflux drum level and the bottom level. Againwe can see that control structure L-T36 gives the worse response (at least for the bottom level). Thecontrol performance of the reflux drum level is good for all structures, been similar to the resultsobtained for control structure 1 (see Section 3.1).
The control of bottom level, on the other hand, is good for most structures (Qb -T4, Qb-T36,and two-point temperature control), except for control structure L-T36.
12
0 0.5 1 1.5 2 2.5 3 3.5 4 4.5 50
0.05
0.1
0.15
0.2
Top c
om
positio
n (
x D)
Structure 2: Disturbance in feed flowrate
SP
L−T36
Qb−T4
Qb−T36
L−T36 and Qb−T4
0 0.5 1 1.5 2 2.5 3 3.5 4 4.5 50.01
0.012
0.014
0.016
0.018
0.02
Bottom
com
positio
n (
xB)
time (h)
Figure 15: Stabilizing control structure 2 - Composition response.
0 0.5 1 1.5 2 2.5 3 3.5 4 4.5 51.85
1.855
1.86
1.865
1.87
1.875
1.88
1.885
1.89
1.895
1.9x 10
6
To
p p
ressu
re (
N/m
2)
Structure 2: Disturbance in feed flowrate
SP
L−T36
Qb−T4
Qb−T36
L−T36 and Qb−T4
Figure 16: Stabilizing control structure 2 - Pressure.
13
0 0.5 1 1.5 2 2.5 3 3.5 4 4.5 52.4
2.5
2.6
2.7
2.8
2.9
Reflux d
rum
level (m
)
Structure 2: Disturbance in feed flowrate
SP
L−T36
Qb−T4
Qb−T36
L−T36 and Qb−T4
0 0.5 1 1.5 2 2.5 3 3.5 4 4.5 52
2.1
2.2
2.3
2.4
2.5
2.6
Bottom
level (m
)
Figure 17: Stabilizing control structure 2 - Level.
3.3 Stabilizing control structure 3
Figure 18 shows the stabilizing control structure 3:
- the bottom level is controlled by the bottom flow rate B, which is flow controlled
- the pressure is controlled by the condenser duty Qc
- the reflux drum level is controlled by the reflux flow rate L , which is flow controlled
This structure does not have the saturation problem that we found in the first two structuresbecause the distillate flow rate is not used to control neither level nor pressure. So, supposing thatthe feed flowrate increases, the pressure will decrease and the control loop will decrease the condenserduty and, consequently, the pressure will increase again.
The available degrees of freedom here are the distillate flow rate and the reboiler duty.So, the control structures, including temperature loops, considered were:
1. Open loop: here just the stabilizing control loops (pressure and levels) are close, i.e., thetemperature control loops are kept opened
2. D-T36: manipulate the distillate flow rate to control the temperature in tray 36, keeping thesecond temperature control loop opened
3. Qb-T4: manipulate the reboiler duty to control the temperature in tray 4, keeping the othertemperature control loop opened
4. Qb-T31: manipulate the reboiler duty to control the tray which has the highest gain (mostsensitive), keeping the other temperature control loop opened. This is the only stabilizingcontrol structure that has tray 31 as the most sensitive
5. D-T36 and Qb -T4: manipulate the distillate flow rate to control the temperature in tray 36(D-T36) and manipulate the reboiler duty to control the temperature in tray 4 (Qb -T4). Thisis the two-point temperature control
14

F
stage N-1L
D
stage N (t, 0%)
xtop
stage 2V
stage 1 (b, 0%)
stage N (100% from top or bottom)F
B xbtm
LIC114
FIC115
TIC194
FIC117
LIC115
PIC195
TIC198
Figure 18: Stabilizing control structure 3: DV configuration.
Figure 19: Stabilizing control structure 3 - Step test to choose the most sensitive temperature.
15

0 0.5 1 1.5 2 2.5 3 3.5 4 4.5 50
0.05
0.1
0.15
0.2
Top c
om
positio
n (
x D)
Structure 3: Disturbance in feed flowrate
SP
No temp. control
D−T36
Qb−T4
Qb−T31
D−T36 and Qb−T36
0 0.5 1 1.5 2 2.5 3 3.5 4 4.5 50.005
0.01
0.015
Bottom
com
positio
n (
xB)
time (h)
Figure 20: Stabilizing control structure 3 - Composition response.
In Figure 19 is presented a step test in the reboiler boilup to select the most sensitive tray tem-perature. As can be seen by the results, the temperatures in the top section are much more sensitivethan the temperatures in the bottom, confirming the results obtained by the stabilizing controlstructures 1 (Section 3.1) and 2 (Section 3.1). Specifically for this stabilizing control structure, tray31 is the most sensitive so we controlled the temperature of this tray manipulating the vapor boilup(Qb-T31).
The simulations for stabilizing control structure 3 are presented in Figure 20, where we comparethe different control structures studied in this section plotting the top and bottom compositions. Itis possible to see that the control structure that gives the smallest composition deviation is Qb -T31(control the temperature in tray 31 manipulating the reboiler duty). This result is very similar tothe previsous stabilizing structures.
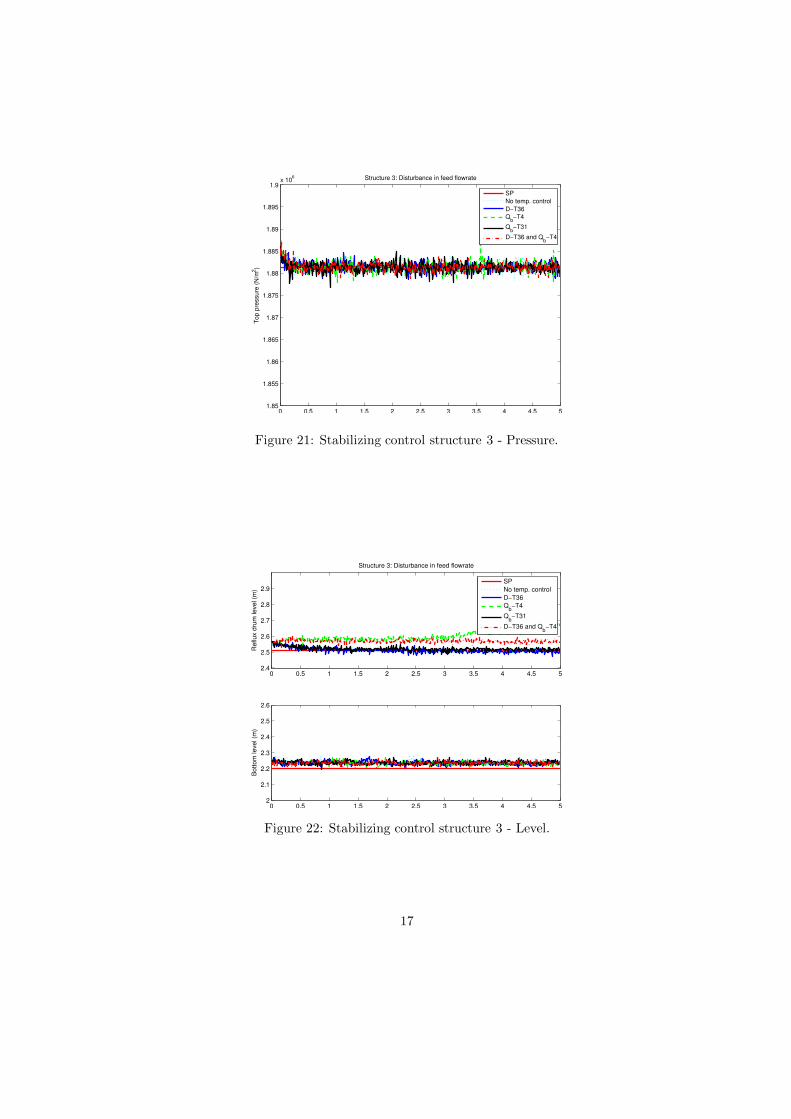
Figure 21 compares the performance of the control structures studied to control the top pressure.For this stabilizing control structure, all control structures are able to control the top pressureconfirming that the pressure control is not a problem for this structure, differently from structures1 (Section 3.1) and 2 (Section 3.2). This happens because here we are using the condenser duty forpressure control, instead of using the distillate flow rate.
The performances of the control structures to control the reflux drum level and the bottom levelare presented in Figure 22. Control structures D-T36 and Qb-T31 are able to control well thereflux drum level, but control structures Qb-T4 and the two-point temperature control result inpoor control.
The control of bottom level, on the other hand, is good for all structures.
3.4 Stabilizing control structure 4
The fourth stabilizing control structure is shown by Figure 23:
- the bottom level is controlled by the bottom flow rate, which is flow controlled
- the pressure is controlled by the reboiler duty
16
0 0.5 1 1.5 2 2.5 3 3.5 4 4.5 51.85
1.855
1.86
1.865
1.87
1.875
1.88
1.885
1.89
1.895
1.9x 10
6
To
p p
ressu
re (
N/m
2)
Structure 3: Disturbance in feed flowrate
SP
No temp. control
D−T36
Qb−T4
Qb−T31
D−T36 and Qb−T4
Figure 21: Stabilizing control structure 3 - Pressure.
0 0.5 1 1.5 2 2.5 3 3.5 4 4.5 52.4
2.5
2.6
2.7
2.8
2.9
Reflux d
rum
level (m
)
Structure 3: Disturbance in feed flowrate
SP
No temp. control
D−T36
Qb−T4
Qb−T31
D−T36 and Qb−T4
0 0.5 1 1.5 2 2.5 3 3.5 4 4.5 52
2.1
2.2
2.3
2.4
2.5
2.6
Bottom
level (m
)
Figure 22: Stabilizing control structure 3 - Level.
17

F
stage N-1L
Dstage N (t, 0%)
xtop
stage 2V
stage N (100% from top or bottom)F
B xbtmstage 1 (b, 0%)
LIC114
FIC115
FIC117
LIC115
PIC195
TIC198
TIC194
Figure 23: Stabilizing control structure 4: LD configuration.
18
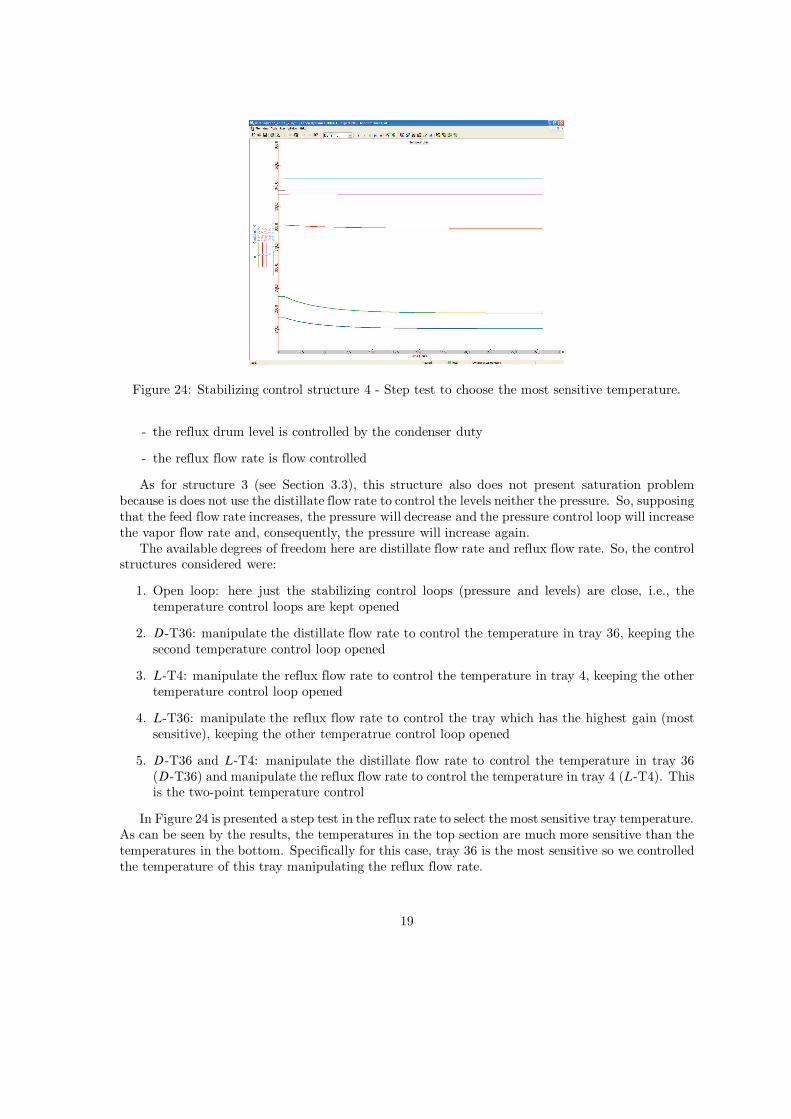
Figure 24: Stabilizing control structure 4 - Step test to choose the most sensitive temperature.
- the reflux drum level is controlled by the condenser duty
- the reflux flow rate is flow controlled
As for structure 3 (see Section 3.3), this structure also does not present saturation problembecause is does not use the distillate flow rate to control the levels neither the pressure. So, supposingthat the feed flow rate increases, the pressure will decrease and the pressure control loop will increasethe vapor flow rate and, consequently, the pressure will increase again.
The available degrees of freedom here are distillate flow rate and reflux flow rate. So, the controlstructures considered were:
1. Open loop: here just the stabilizing control loops (pressure and levels) are close, i.e., thetemperature control loops are kept opened
2. D-T36: manipulate the distillate flow rate to control the temperature in tray 36, keeping thesecond temperature control loop opened
3. L-T4: manipulate the reflux flow rate to control the temperature in tray 4, keeping the othertemperature control loop opened
4. L-T36: manipulate the reflux flow rate to control the tray which has the highest gain (mostsensitive), keeping the other temperatrue control loop opened
5. D-T36 and L-T4: manipulate the distillate flow rate to control the temperature in tray 36(D-T36) and manipulate the reflux flow rate to control the temperature in tray 4 (L-T4). Thisis the two-point temperature control
In Figure 24 is presented a step test in the reflux rate to select the most sensitive tray temperature.As can be seen by the results, the temperatures in the top section are much more sensitive than thetemperatures in the bottom. Specifically for this case, tray 36 is the most sensitive so we controlledthe temperature of this tray manipulating the reflux flow rate.
19

0 0.5 1 1.5 2 2.5 3 3.5 4 4.5 50.1
0.15
0.2
0.25
Top c
om
positio
n (
x D)
Structure 4: Disturbance in feed flowrate
SP
No temp. control
D−T36
L−T4
L−T36
D−T36 and L−T4
0 0.5 1 1.5 2 2.5 3 3.5 4 4.5 50.01
0.012
0.014
0.016
0.018
0.02
Bottom
com
positio
n (
xB)
time (h)
Figure 25: Stabilizing control structure 4 - Composition response.
The simulations for the stabilizing control structure 4 are presented in Figure 25, where wecompare the control performances of the control structures studied plotting the top and bottomcompositions (indirect control in the presence of disturbances and implementation error). In thiscase, we can see that the best choice is to control the temperature in tray 36 manipulating thedistillate flow rate (D-T36) or the reflux flow rate (D-T36). Again, the control of a temperature inthe bottom section does not give a good indirect control of the top and bottom compositions. Thetwo-point temperature control also does not improves the control performance.
Figure 26 compares the control performances of the control structures studied for controlling thetop pressure. In this plot, we can see that all control structures are able to control the top pressureconfirming that the pressure control is not a problem for this structure, differently from structures1 (Section 3.1) and 2 (Section 3.2). This happens because here we are using the reboiler duty forpressure control, instead of using the distillate flow rate. This result is similar to structure 3 (Section3.3).
In Figure 27, we present the control of the reflux drum level and the bottom level. For stabilizingcontrol structure 4, all control structures are able to control both levels.
3.5 Stabilizing control structure 5
The fifth stabilizing control structure, shown by Figure 28, is very similar to configuration 4. Theonly difference is that we keep D (distillate flow rate) and L=D (reflux over distillate flow rates)constant. The stabilizing control loops are:
- the bottom level is controlled by the bottom flow rate, which is flow controlled
- the pressure is controlled by the reboiler duty
- the reflux drum level is controlled by the condenser duty
- the reflux flow rate is flow controlled
- manipulate the reflux flow rate (L) to keep L=D constant
20

0 0.5 1 1.5 2 2.5 3 3.5 4 4.5 51.85
1.855
1.86
1.865
1.87
1.875
1.88
1.885
1.89
1.895
1.9x 10
6
To
p p
ressu
re (
N/m
2)
Structure 4: Disturbance in feed flowrate
SP
No temp. control
D−T36
L−T4
L−T36
D−T36 and L−T4
Figure 26: Stabilizing control structure 4 - Pressure.
0 0.5 1 1.5 2 2.5 3 3.5 4 4.5 52.4
2.5
2.6
2.7
2.8
2.9
Reflux d
rum
level (m
)
Structure 4: Disturbance in feed flowrate
SP
No temp. control
D−T36
L−T4
L−T31
D−T36 and L−T4
0 0.5 1 1.5 2 2.5 3 3.5 4 4.5 52
2.1
2.2
2.3
2.4
2.5
2.6
Bottom
level (m
)
Figure 27: Stabilizing control structure 4 - Level.
21

X
(L/D)s
F
stage N-1L
Dstage N (t, 0%)
xtop
stage 2V
stage N (100% from top or bottom)F
B xbtmstage 1 (b, 0%)
LIC114
FIC115
FIC117
LIC115
PIC195
TIC198
TIC194
Figure 28: Stabilizing control structure 5: D � L=D configuration.
For the same reason as for structures 3 and 4 (it does not use distillate flow rate to controlpressure and level), this structure also does not present saturation problem.
The available degrees of freedom here are distillate flow rate and ratio between reflux (L) anddistillate (D) flow rates.
So, the structures considered were:
1. Open loop: here just the stabilizing control loops (pressure and levels) are close, i.e., thetemperature control loops are kept opened
2. D-T36: manipulate the distillate flow rate to control the temperature in tray 36, keeping thesecond loop opened
3. L=D-T4: manipulate the ratio to control the temperature in tray 4, keeping the other loopopened
4. L=D-T36: manipulate the ratio to control the tray which has the highest gain (most sensitive),keeping the other loop opened
5. D-T36 and L=D-T4: manipulate the distillate flow rate to control the temperature in tray 36(D-T36) and manipulate the ratio to control the temperature in tray 4 (L=D-T4)
In Figure 29 is presented a step test in the reflux rate to select the most sensitive tray temperature(tray with highest gain). As can be seen by the results, the temperatures in the top section are muchmore sensitive than the temperatures in the bottom. Specifically for this case, tray 36 is the mostsensitive so we controlled the temperature of this tray manipulating the ratio between the refluxand distillate flow rates (L=D).
22

Figure 29: Stabilizing control structure 5 - Step test to choose the most sensitive temperature.
0 0.5 1 1.5 2 2.5 3 3.5 4 4.5 50
0.05
0.1
0.15
0.2
To
p c
om
po
sitio
n (
x D)
Structure 5: Disturbance in feed flowrate
SP
No temp. control
D−T36
L/D−T4
L/D−T36
0 0.5 1 1.5 2 2.5 3 3.5 4 4.5 54
6
8
10
12
14x 10
−3
Bo
tto
m c
om
po
sitio
n (
xB)
time (h)
Figure 30: Stabilizing control structure 5 - Composition response.
23
0 0.5 1 1.5 2 2.5 3 3.5 4 4.5 51.85
1.855
1.86
1.865
1.87
1.875
1.88
1.885
1.89
1.895
1.9x 10
6
To
p p
ressu
re (
N/m
2)
Structure 5: Disturbance in feed flowrate
SP
No temp. control
D−T36
L/D−T4
L/D−T36
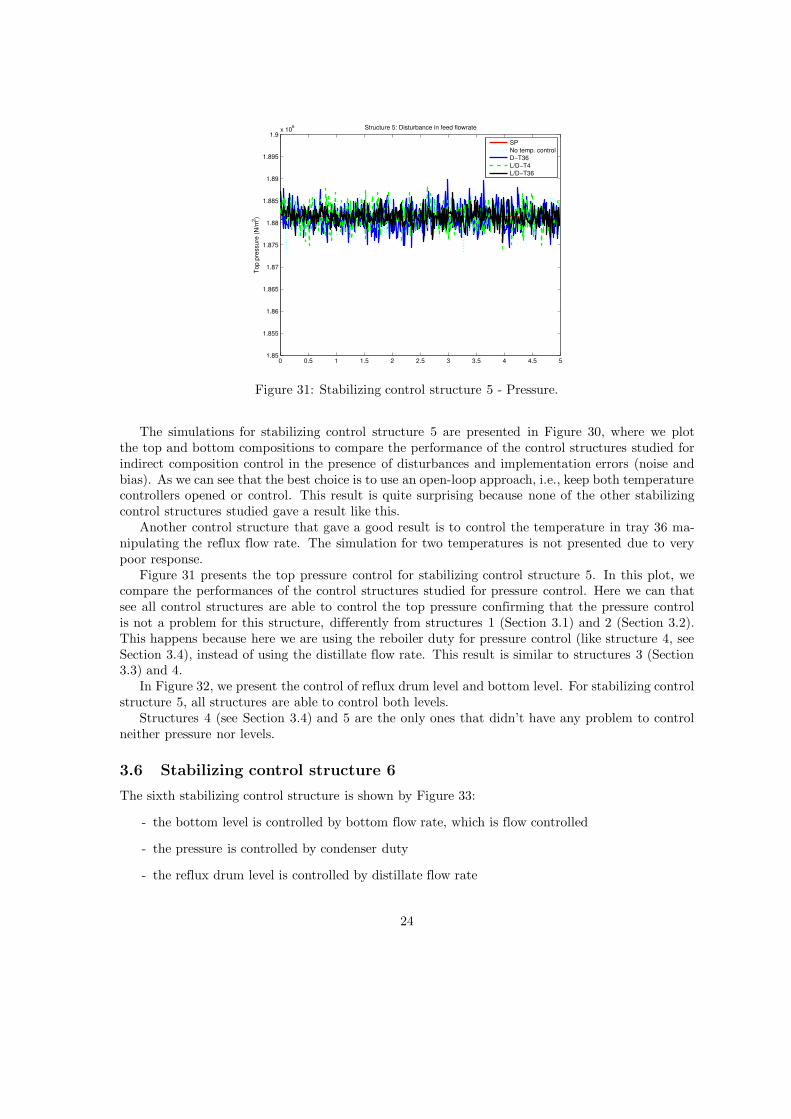
Figure 31: Stabilizing control structure 5 - Pressure.
The simulations for stabilizing control structure 5 are presented in Figure 30, where we plotthe top and bottom compositions to compare the performance of the control structures studied forindirect composition control in the presence of disturbances and implementation errors (noise andbias). As we can see that the best choice is to use an open-loop approach, i.e., keep both temperaturecontrollers opened or control. This result is quite surprising because none of the other stabilizingcontrol structures studied gave a result like this.
Another control structure that gave a good result is to control the temperature in tray 36 ma-nipulating the reflux flow rate. The simulation for two temperatures is not presented due to verypoor response.
Figure 31 presents the top pressure control for stabilizing control structure 5. In this plot, wecompare the performances of the control structures studied for pressure control. Here we can thatsee all control structures are able to control the top pressure confirming that the pressure controlis not a problem for this structure, differently from structures 1 (Section 3.1) and 2 (Section 3.2).This happens because here we are using the reboiler duty for pressure control (like structure 4, seeSection 3.4), instead of using the distillate flow rate. This result is similar to structures 3 (Section3.3) and 4.
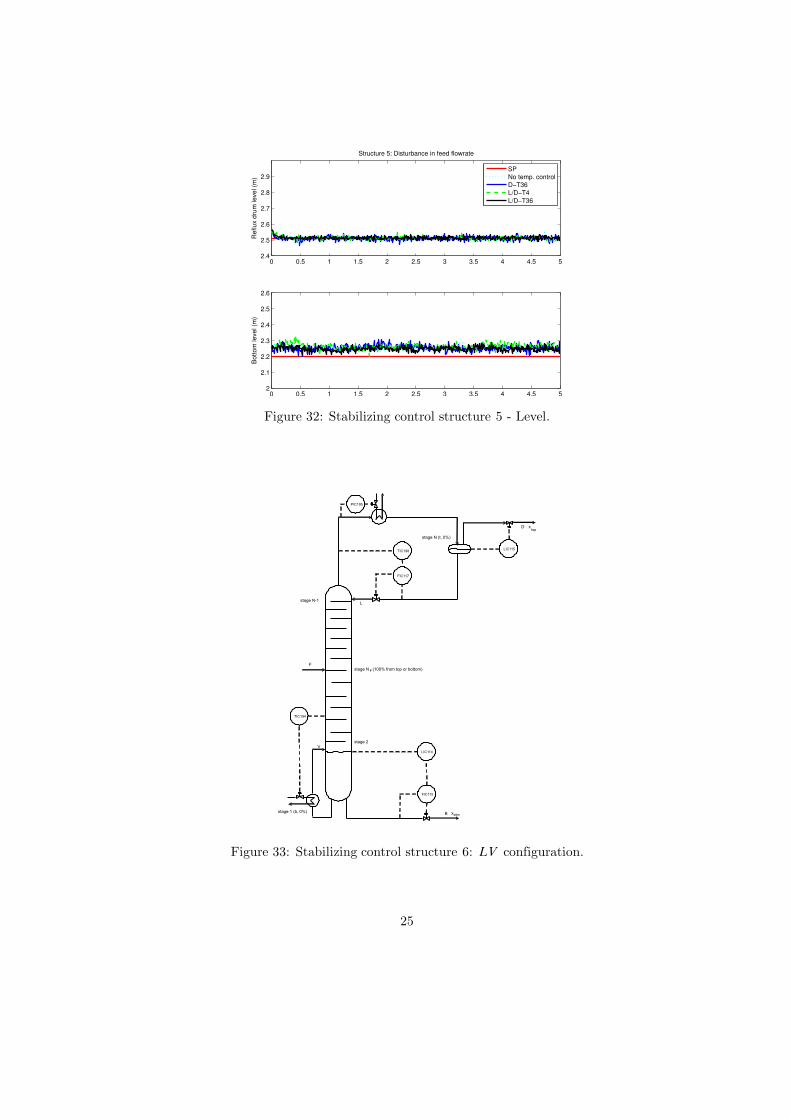
In Figure 32, we present the control of reflux drum level and bottom level. For stabilizing controlstructure 5, all structures are able to control both levels.
Structures 4 (see Section 3.4) and 5 are the only ones that didn’t have any problem to controlneither pressure nor levels.
3.6 Stabilizing control structure 6
The sixth stabilizing control structure is shown by Figure 33:
- the bottom level is controlled by bottom flow rate, which is flow controlled
- the pressure is controlled by condenser duty
- the reflux drum level is controlled by distillate flow rate
24
0 0.5 1 1.5 2 2.5 3 3.5 4 4.5 52.4
2.5
2.6
2.7
2.8
2.9
Reflux d
rum
level (m
)
Structure 5: Disturbance in feed flowrate
SP
No temp. control
D−T36
L/D−T4
L/D−T36
0 0.5 1 1.5 2 2.5 3 3.5 4 4.5 52
2.1
2.2
2.3
2.4
2.5
2.6
Bottom
level (m
)
Figure 32: Stabilizing control structure 5 - Level.
F
stage N-1L
D
stage N (t, 0%)
xtop
stage 2V
stage 1 (b, 0%)
stage N (100% from top or bottom)F
B xbtm
LIC114
FIC115
TIC194
FIC117
TIC198LIC115
PIC195
Figure 33: Stabilizing control structure 6: LV configuration.
25

Figure 34: Stabilizing control structure 6 - Step test to choose the most sensitive temperature.
- the reflux flow rate is flow controlled
The problem of this structure is its dependence on the temperature control loop. It happensbecause we use the distillate flow rate to control the reflux drum level. If the the temperature loopfails, the system becomes unstable. This happens because the distillate flow rate (D) is does nothave direct effect in the reflux drum level, confirming that it cannot be directly used to controlreflux drum level (Luyben, 2004).
The available degrees of freedom here are reflux flow rate and reboiler duty. So, the controlstructures considered are:
1. L-T36: manipulate the reflux flow rate to control the temperature in tray 36, keeping thesecond temperature control loop opened
2. Qb-T4: manipulate the reboiler duty to control the temperature in tray 4, keeping the othertemperature control loop opened
3. Qb-T36: manipulate the reboiler duty to control the tray which has the highest gain (mostsensitive), keeping the other temperature control loop opened
4. L-T36 and Qb-T4: manipulate the reflux flow rate to control the temperature in tray 36 (L-T36) and manipulate the reboiler duty to control the temperature in tray 4 (Qb-T4). This isthe two-point temperature control
In Figure 34 is presented a step test in the reflux rate to select the most sensitive tray temperature.As can be seen by the results, the temperatures in the top section are much more sensitive than thetemperatures in the bottom, confirming the results from all previous stabilizing control structures.Specifically for this case, tray 36 is the most sensitive so we controlled the temperature of this traymanipulating the reflux flow rate.
The simulations for structure 6 are presented in Figure 35, where we compare the performance ofthe control structures plotting the top and bottom compositions. As we can see, the control structurethat gives the smallest indirect control composition deviation in the presence of disturbances andimplementation errors (noise and bias) is Qb -T36, where we control the temperature in tray 36manipulating the reboiler duty. The simulation for open loop strategy (with temperature loopsopened) is not presented due to very poor response.
26

0 0.5 1 1.5 2 2.5 3 3.5 4 4.5 5
0.1
0.15
0.2
0.25
Top c
om
positio
n (
x D)
Structure 6: Disturbance in feed flowrate
SP
L−T36
Qb−T4
Qb−T36
L−T36 and Qb−T4
0 0.5 1 1.5 2 2.5 3 3.5 4 4.5 50.005
0.01
0.015
Bottom
com
positio
n (
xB)
time (h)
Figure 35: Stabilizing control structure 6 - Composition response.
0 0.5 1 1.5 2 2.5 3 3.5 4 4.5 51.85
1.855
1.86
1.865
1.87
1.875
1.88
1.885
1.89
1.895
1.9x 10
6
To
p p
ressu
re (
N/m
2)
Structure 6: Disturbance in feed flowrate
SP
L−T36
Qb−T4
Qb−T36
L−T36 and Qb−T4
Figure 36: Stabilizing control structure 6 - Pressure.
27

0 0.5 1 1.5 2 2.5 3 3.5 4 4.5 52.2
2.3
2.4
2.5
2.6
2.7
2.8
Reflux d
rum
level (m
)
Structure 6: Disturbance in feed flowrate
0 0.5 1 1.5 2 2.5 3 3.5 4 4.5 52
2.1
2.2
2.3
2.4
2.5
2.6
Bottom
level (m
)
SP
L−T36
Qb−T4
Qb−T36
L−T36 and Qb−T4
Figure 37: Stabilizing control structure 6 - Level.
Figure 36 shows the performance of the control structures studied to control the top pressure.Here we can see that all control structures are able to control the top pressure confirming that thepressure control is not a problem for this structure, differently from structures 1 (Section 3.1) and2 (Section 3.2). This happens because here we are using the condenser duty for pressure control(like structure 3, see Section 3.3), instead of using the distillate flow rate. This result is similar tostructures 3, 4 (Section 3.4), and 5 (Section 3.5).
In Figure 37, we present the control of reflux drum level and bottom level. The only structurethat shows a good control of the reflux drum is the two-point temperature control. Structures L-T36and Qb-T36 give reasonable results and Qb-T4 is very poor. This result confirms that, as thereis no effect of vapor flow rate on reflux drum level, distillate flow rate cannot be directly used tocontrol reflux drum level (Luyben, 2004).
The control of bottom level, on the other hand, is good for all structures.
3.7 Comparing the best structures
In this section we will compare the best choice of each stabilizing control structure (1, 2, 3, 4, 5, and6). The control structures selected are:
1. Stabilizing control structure 1 (Section 3.1): manipulate the reboiler duty to control the traywhich has the highest gain (most sensitive), keeping the other temperature control loop opened(Qb-T36)
2. Stabilizing control structure 2 (Section 3.2): manipulate the reboiler duty to control the traywhich has the highest gain (most sensitive), keeping the other temperature control loop opened(Qb-T36)
3. Stabilizing control structure 3 (Section 3.3): manipulate the reboiler duty to control the traywhich has the highest gain (most sensitive), keeping the other temperature control loop opened(Qb-T31)
28

0 0.5 1 1.5 2 2.5 3 3.5 4 4.5 50.08
0.1
0.12
0.14
0.16
0.18
Top c
om
positio
n (
x D)
Disturbance in feed flowrate
0 0.5 1 1.5 2 2.5 3 3.5 4 4.5 50.01
0.011
0.012
0.013
0.014
0.015
time (h)
Bottom
com
positio
n (
xB)
SP
Structure 1
Structure 2
Structure 3
Structure 4
Structure 5
Structure 6
Figure 38: Comparing different control structures: Composition response.
4. Stabilizing control structure 4 (Section 3.4): manipulate the distillate flow rate to control thetemperature in tray 36, keeping the second temperature control loop opened (D-T36)
5. Stabilizing control structure 5 (Section 3.5): use the open loop approach, i.e., keep bothtemperature controllers opened and closing just the stabilizing controllers for pressure andlevels
6. Stabilizing control structure 6 (Section 3.6): manipulate the reboiler duty to control the traywhich has the highest gain (most sensitive), keeping the other temperature control loop opened(Qb-T36)
As can be seen, for most stabilizing control structures, the best control strategy is to control atmeperature in the top section manipulating the reboiler duty.
Figure 38 compares the control structures above plotting the top and bottom compositions.The control structures that give the best indirect control composition (minimizes the compositiondeviation in the presence of disturbances and implementation errors) are stabilizing control structures1 and 5. Also, structure 3 gives a reasonable response in steady state, but its dynamic response istoo slow.
The problem in structure 1 is its dependence on the temperature controller which must meworking well the whole time, otherwise it an have difficulties to control the pressure (see Figure 7).
For structure 5, the problem is that its performance is very dependent on the distillate flow ratemeasurement error. If this measurement is not accurate enough, its results can be very poor.
We can also verify from the results that the control of two temperatures is not optimum for thiscolumn. This confirm the results from Hori and Skogestad (2007b), which concluded that the controlof two temperatures does not give any improvement for multicomponent columns.
It is important to note that these conclusions apply for a disturbance in feed flow rate. The samestudy should be done for disturbance in feed composition.
Figure 39 compares the pressure control for the selected control structures. We can see that thepressure control is good for all structures.
29

0 0.5 1 1.5 2 2.5 3 3.5 4 4.5 51.87
1.872
1.874
1.876
1.878
1.88
1.882
1.884
1.886
1.888
1.89x 10
6
Top p
ressure
Disturbance in feed flowrate
SP
Structure 1
Structure 2
Structure 3
Structure 4
Structure 5
Structure 6
Figure 39: Comparing different control structures: Pressure.
0 0.5 1 1.5 2 2.5 3 3.5 4 4.5 52.2
2.3
2.4
2.5
2.6
Reflux d
rum
level)
Disturbance in feed flowrate
0 0.5 1 1.5 2 2.5 3 3.5 4 4.5 52.1
2.2
2.3
2.4
2.5
time (h)
Bottom
level
SP
Structure 1
Structure 2
Structure 3
Structure 4
Structure 5
Structure 6
Figure 40: Comparing different control structures: Level.
30

Figure 41: Mongstad: change in feed flow rate
The same comparison was done for both levels (reflux drum and bottom) in Figure 40. We cansee that all structures are similar in the bottom level control, but control structure 6 fails to controlthe reflux drum level, as already seen in Section 3.6. This result confirms that structure 6 is theworst choice among the structures studied.
4 Large feed disturbance
In this section, we compare the structures selected in Section 3.7 with an even larger feed disturbance.In the normal operation of the plant, it is normal to have large changes in the feed flow rate due todifficulties in keeping the feed rate stable in the previous unit. The decrease is usually faster thanthe increase, since the decrease often is a cause of a trip and increase is when they start up again ina controlled way. Figure 41 shows an 8-hour plot where we can see that the feed drops 45 T/h in50 minutes.
To compare the performance of the control structures selected in the previous section (Section3), we will apply ramp disturbances in the feed flow rate from 150 t/h to 75 t/h in a 2-hour interval(from t D 1h to t D 3h) and another ramp change from 75 t/h to 150 t/h in a 5-hour interval (fromt D 6h to t D 11h). Figure 42 presents the feed flow rate used in the simulation.
As structure 6 gave the worst result in the precious section, it was not included in the plotsbecause, as already expected, its results didn’t give good results.
4.1 Without ratio to feed
First, we will simulate the control structures selected in Section 3 without any ratio to feed. Figure43 presents the response of the 5 control structures to the feed disturbance. For the top composition(up), the best performance is given by structure 4, but structures 1 and 2 also give good performances.On the other hand, structures 3 and 5 are not able to control the top composition.
For the control of the bottom composition, we can see that structure 3 gives the worst result. Ithappens because this structure is not able to control the pressure neither the levels due to saturation
31

0 5 10 1515
20
25
30
35
40
45
Feed flo
wra
te (
Kg/s
)
time (h)
Disturbance in feed flowrate
Figure 42: Feed flow rate
(see Figures 44 and 45). None of the structures were able to keep the bottom composition at theset point. This result was already expected due to the large disturbance. As all structures have atleast one manipulated variable kept constant, one solution for this would be to rate the availablemanipulated with the feed flow rate. For example, for structure 1 we have the condenser dutyavailable, so we could keep the rate between the feed flow rate and the cooling flow rate. This willbe presented in Section 4.2.
Figure 44 presents the top pressure response to the feed disturbances. All structures but structure1 were able to control the pressure, confirming that the pressure control is not a problem in thisprocess.
Figure 45 presents the reflux drum and bottom levels. We can see that structure 3 is not ableto control neither the reflux drum level nor the bottom level. All the other structures are able tocontrol both levels at least reasonably.
4.2 Including ratio to feed
In this section, we will include ratios to feed to improve the performance of the control system inthe presence of the large feed disturbance shown in Figure 41.
The ratios that we keep constant for each control structure are:
1. Control structure 1: keep Qc=F constant
2. Control structure 2: keep L=F constant
3. Control structure 3: keep D=F constant
4. Control structure 4: keep L=F constant
5. Control structure 5: keep D=F constant
In the first control structure, we decided to keep Qc=F constant because we are not able tomanipulate the cooling stream flow rate in the condenser (the condenser duty is manipulated directly
32

0 5 10 150.08
0.1
0.12
0.14
0.16
0.18
Top c
om
positio
n (
x D)
Disturbance in feed flowrate
SP
Structure 1
Structure 2
Structure 3
Structure 4
Structure 5
0 5 10 150
0.005
0.01
0.015
Bottom
com
positio
n (
xB)
time (h)
Figure 43: Ramp in feed flow rate: top and bottom compositions.
0 5 10 151.87
1.872
1.874
1.876
1.878
1.88
1.882
1.884
1.886
1.888
1.89x 10
6
To
p p
ressu
re
Disturbance in feed flowrate
SP
Structure 1
Structure 2
Structure 3
Structure 4
Structure 5
Figure 44: Ramp in feed flow rate: pressure.
33

0 5 10 152.4
2.45
2.5
2.55
2.6
2.65
2.7
Re
flu
x d
rum
le
ve
l)
Disturbance in feed flowrate
SP
Structure 1
Structure 2
Structure 3
Structure 4
Structure 5
0 5 10 152
2.05
2.1
2.15
2.2
2.25
2.3
Bo
tto
m le
ve
l
time (h)
Figure 45: Ramp in feed flow rate: level.
in the ASPEN model used). Fortunately, this does not change the conclusions that we take in thisreport.
Figure 46 shows the performance of the control structures in the presence of disturbance. We cansee, as already expected, that the presence of ratio controllers improved the control of the bottomcomposition for all structures (compare with Figure 43). Structure 3 has the worst result, so itshould not be considered for control. While structure 4 gave the best control of the top composition,structure 1 has the best performance for the bottom.
Figure 47 presents the top pressure response to the feed disturbances. All structures were ableto control the pressure, confirming that the pressure control is not a problem in this process.
Figure 48 shows the level control plots. Except for structure 3, all the other structures are ableto control the reflux drum level. For the bottom level, all structures are able to keep it stable.
5 Conclusions
In this work we compared several different control structures of the deethanizer from Mongstad/Statoil.The main conclusions here are:
1. We shouldn’t control a temperature in the bottom section because its trays are quite insensitiveto the manipulated variables. This confirms that we shouldn’t control a temperature wherethe temperature slope is small
2. For control structures 1, 2 and 6, the best result is given if we control the temperature in thetop tray manipulating the reboiler duty
3. For control structure 3, the best result is given if we control the temperature in tray 31manipulating the reboiler duty
4. For control structure 4, the best result is given if we control the temperature in the top traymanipulating the distillate flow rate
34

0 5 10 150.08
0.1
0.12
0.14
0.16
0.18
Top c
om
positio
n (
x D)
Disturbance in feed flowrate
SP
Structure 1
Structure 2
Structure 3
Structure 4
Structure 5
0 5 10 150
0.005
0.01
0.015
Bottom
com
positio
n (
xB)
time (h)
Figure 46: Ramp in feed flow rate: top and bottom compositions (including ratio to feed).
0 5 10 151.87
1.872
1.874
1.876
1.878
1.88
1.882
1.884
1.886
1.888
1.89x 10
6
To
p p
ressu
re
Disturbance in feed flowrate
SP
Structure 1
Structure 2
Structure 3
Structure 4
Structure 5
Figure 47: Ramp in feed flow rate: pressure (including ratio to feed).
35

0 5 10 152.4
2.45
2.5
2.55
2.6
2.65
2.7
Re
flu
x d
rum
le
ve
l)
Disturbance in feed flowrate
SP
Structure 1
Structure 2
Structure 3
Structure 4
Structure 5
0 5 10 152
2.05
2.1
2.15
2.2
2.25
2.3
Bo
tto
m le
ve
l
time (h)
Figure 48: Ramp in feed flow rate: level (including ratio to feed).
5. For control structure 5, the best result is given with the open loop approach (no temperaturecontrol)
6. Structures 1 and 5 give the best results
7. The control of pressure and level is not a big problem for this column as soon we choose theright control structure
8. Closing the temperature loop changes completely the dynamics of the column, then is invali-dates the heuristics that we shouldn’t use a small flow for level or pressure control
9. The introduction of ratio to feed improves the control performance in the presence of largedisturbances in the feed flow rate. So, this should be considered in this process because largechanges in feed flow rate are quite common in this column
10. The control structures that gave the best results are structures 1 and 4 with ratio to feed
References
Hori, E.S. and S. Skogestad (2007a). Maximum gain rule for selecting controlled variables. Acceptedto be presented in Dycops/2007.
Hori, E.S. and S. Skogestad (2007b). Selection of control structure and temperature location fortwo-product distillation columns. Chem. Eng. Res. Des. 85(A3), 293–306.
Luyben, W.L. (2004). Alternative control structures for distillation columns with partial condensers.Ind. Eng. Chem. Res. 43, 6416–6429.
Luyben, W.L. (2005). Effect of feed composition on the selection of control structures for high-puritybinary distillation. Ind. Eng. Chem. Res. 44(20), 7800–7813.
36

Ralston, P.A.S., P.B. Deshpande, P. Hanik and S. Bender (1985). Indirect dual composition controlof a deethanizer. Hydrocarbon Proc. 64(June), 53–55.
Skogestad, S. (1997). Dynamics and control of distillation columns: a tutorial introduction. Chem.Eng. Res. Des. 75(A6), 539–562.
37