tracerco news v1 e4 · a deethanizer column with 26 trays had experienced severe surge problems and...
TRANSCRIPT

A leading manufacturer of low-densitypolyethylene (LDPE) recently upgradedtheir process plant. As a result of theupgrade production in this high pressuresystem had increased by approximately50%. The upgrade had been achieved with-out increasing the size of major vessels.
However, after the upgrade four separa-tor vessels at this plant were experiencinghigher flow velocities through the separa-tors which had resulted in them becominghighly susceptible to significant level fluc-tuations. The vessels are used to disengage
unconverted ethylene gas from molten liquid polyethylene product. They operateat a pressure of around 300 bar. The previous capacitance probe based polyeth-ylene interface level control systemsworked in conjunction with radioisotopebased high level trips. It was found that theinstruments simply could not cope with thenew demands being placed on them. Afterupgrading, the vessels frequently sufferedliquid polyethylene carryover into the ethyl-ene gas exit lines. This resulted in liquidsolidifying in the gas lines leading to
unacceptable down time and product loss.Tracerco was approached by plant
management to install a reliable interfacemeasurement system. They required a system that could be trusted to indicate theexact position of the interface between therelatively high-density gas and the relatively low-density liquid. The gas density was about 0.2 g/cc. The liquid wasabout 0.5 g/cc. After a thorough investigation and detailed evaluation, plantmanagement decided to install the
Continued on page 5
Flooding in distillation columns has beendefined as “excessive accumulation of liq-uid inside the column,” (1) “inoperabilitydue to excessive retention of liquid insidethe column,” (2) and even a point where “itis difficult to obtain net downward flow ofliquid, and any liquid fed to the column iscarried out with the overhead gas.” (3)While these descriptions appear to be similar at first glance, they actually describedifferent stages or degrees of flooding.Excessive accumulation of liquid may ormay not cause inoperability, and inoperabil-ity may or may not carry the feed liquid outwith the overhead gas.
However, when existing columns requiretroubleshooting or debottlenecking, incon-sistent definitions of the flooding initiationpoint may lead to different – sometimeseven wrong – revamp designs, due to lackof understanding about the cause and location of the flooding condition.
Tracerco’s TRU-SCAN® gamma scanapplication has proven to be a reliable toolfor determining the location and extent of
flooding in trayed towers, because they canmeasure the liquid holdup in a columndirectly. This is accomplished by simultane-ously lowering a gamma-ray source and adetector down the sides of a column. Thegamma-ray transmission through the column is affected by column internals, theprocess fluids, and possibly by externalinfluences, such as manways or stiffeningrings. Any external influences are documented during the scan and arelabelled as comments on the data results.
In addition to solving flooding problems,insightful analysis of the dynamic floodingmechanism will benefit the development ofan advanced control system and improveoperating procedures for pushing a columnto its maximum capacity.
The following case study investigates theflooding phenomena in a trayed tower. Theincipient-flood-point (IFP) data on a column must answer two questions – when(at what throughput) and where (at whatlocation) the column starts to flood.Traditional measurements of pressure
Gamma Scans Indicate Where and Why Flooding OccursBy Lowell Pless – Operations/Business Development Mgr. – Scanning, Pasadena, Texas USA
News
TRACERCO™ Interface gauge – Solves ExpensivePolyethylene Overflow Problem By Bram Beinart – Regional Mgr., Perth, Australia
Volume 1 Edition 4 Delivering diagnostic services and measurement solutions worldwide.
[email protected] www.tracerco.com 1
Figure 1 - Blue scanline shows abnormallydense tray-vapor spaces, indicating tray spacesthat are full of liquid or a flooded column. TheRed scanline shows the tower at normal operat-ing conditions
Continued on page 3

................. ı [email protected] [email protected] www.tracerco.com
Some distillation operationsare greatly enhanced or onlypossible under vacuum condi-tions. The most commonlyknown vacuum columns are inrefinery crude units. The bot-toms product from the atmos-pheric column is further refinedby the vacuum column toremove more light fractions andseparate the heavier crude oilfractions. Several chemicalplant separations are also bestconducted at pressures belowatmospheric.
Vacuums are achieved by useof steam aspirators and vacuumpumps. The operation of thesedevices to produce a vacuum isa cost to the distillation opera-tion, just as is the use of steamfor reboilers. If there is airingress into the process, thesedevices have to be pushed togreater effort to maintain appro-priate vacuums, which increasesthe cost of operation.Sometimes, the devices cannotmeet the demands and appropri-ate vacuums cannot be main-tained, reducing the efficiencyof the separation process.
Air ingress can occur inmany places. Every gasketflange, threaded fitting, sightglass, block valve, and valvestem is a potential point for anair leak. Identifying these leaksis a daunting task. The mosteffective approach is to performa TRACERCO Diagnostics™Helium Leak study.
MethodA mass spectrometer is used
to analyze the exhaust from thesteam ejectors. The arrange-ment of the sampling processvaries according to the piping ofthe exhaust, but the mass spec isarranged to continuously drawvapor in from the steam ejectorexhaust. One crew member ismonitoring the readout from themass spec during the testing.The second crew member of the
team is equipped with a smallbottle of helium, mounted witha trigger valve and piece of tubing.
This crew member starts nearthe bottom of the vessel andsquirts a small amount of heli-um near a flange, valve, or otheritem where air could possiblybe drawn into the system. Ashe does this, he marks the itemto indicate that it has been test-ed. Depending on the size ofthe vessel and the distance fromthe leak point to the mass specsampling point, several minutesmay be required for helium topass through the vessel and bedetected by the mass spec.When the technician monitoringthe mass spec identifies a posi-tive indication, he will have theother crew member backtrackthe tested items until they canidentify the location of the leak.
Case StudyThe plant management of an
asphalt unit called with a con-cern about a vacuum column.When feed rates were at normalconditions, there was a loss ofvacuum. There was concernthat either air was leaking intothe column or that excess lightends was leaking into one of therecycle streams. The feed to thecrude column passed throughone heat exchanger with LightVacuum Gas Oil (LVGO) on
the other side. TheCrude feed alsopassed through apair of exchangerswith Heavy VacuumGas Oil (HVGO).There was a suspi-cion that the crudewas leaking into theLVGO and/or theHVGO and enteringthe Vacuum columnwith the recycledLVGO or HVGO.
The plant management askedfor leak tests to be performed onthe exchangers. A radioactivetracer was injected into thecrude inlets to the exchangers.The LVGO and HVGO outletlines from each exchanger weremonitored for the presence ofthe radiotracer. None of theexchangers indicated a leak.
The remaining task was toperform an air ingress test usinghelium. The mass spec was setup to sample the exhaust of thesteam ejectors and helium wassprayed around the possibleleak points.
The first leak was found atthe top of the bottoms levelsight glass. The second leakwas on a blind flange where thegasket had aged and cracked.The third leak was a valve stemleak on an open valve. The lastleak was on the overhead linewhere the insulation sheath had
been damaged and the insula-tion stayed wet. The heliumwas sprayed under the insula-tion. When the insulation wasremoved, the pipe wall wasfound to have corroded and pinhole leaks were present.
ConclusionThe plant personnel were
able to make repairs or fabricatesealing boxes around the leakswhile keeping the column online. The instability of the vacuum column disappearedand product quality returned tonormal.
If you would like addi-tional information on our TRACERCO Diagnostics™Helium study services pleasecontact one of our Tracercooffices in your area or visit ourwebsite at www.tracerco.com.
Air Ingress into Vacuum Column Located with HeliumBy Dave Ferguson – Business Development Mgr. – Tracers, Pasadena, Texas USA
TRACERCO Diagnostics™ Helium studyservices can be provided on the followingequipment:
• Off-line exchangers (tube leak check) • On-line liquid /vapor exchangers• On-line vacuum units• Isolated vessels• Cold boxes (access permitting)• Blocked in reactors

................. ı [email protected] [email protected] www.tracerco.com
drops, temperature profiles, and liquid levels usually cannot tell exactly where flooding has originated in a column, particularly with alarge number of trays.
Case Study illustrating a Fully Flooded Column
A deethanizer column with26 trays had experienced severesurge problems and poor sepa-ration. The column was scannedfrom its top to its bottom. Thetray vapor spaces in the columnwere extraordinarily dense asthe raw gamma-ray “counts”(Fig 1, page 1 - Solid blue line)transmitted through the trayvapor spaces were only 150-200 counts, instead of theexpected range of 1,000 counts.Thus, the column must be fullof liquid or fully flooded.
In an operating column,unloading or reducing feed ratesis the most commonly appliedmethod to relieve the floodingproblems(1). And, for a fullyflooded column, the accumulat-ed liquid must be drawn offfrom the bottom until the liquidlevel is below the reboilerreturn nozzle. Unfortunately,
there was not a functional bot-toms liquid level gauge avail-able on this deethanizer. Inorder to monitor the process ofunloading the column, Tracercoused a stationary monitoringtechnique. A gamma-ray sourceand detector were set up justbelow the return nozzle, whileoperations tried to unload thecolumn.
In this stationary monitoringtechnique (See Ref A, page 4)the gamma transmission countswill have a sudden increase
when the liquid levelis lowered below themonitoring spot.Once the bottoms liq-uid level is detectedbelow the reboilerreturn nozzle, thecolumn can be slow-ly returned to fullrates.
As suggested inthe deethanizer case,the bottoms liquidlevel should continueto be monitored tomake sure it staysbelow the reboilerreturn nozzle. Ourexperience hasshown that a signifi-cant number ofcolumns flood due to
lack of control of, or lack of acorrect indication of, bottomsliquid levels.
The measurement of a tow-er’s base liquid level is one ofthe most problematic causes oftower malfunctions. In anindustry survey problems withthe tower base and the reboilerreturn was the number 2 causeof tower malfunctions (4). Ofthese malfunctions the measure-ment of the base liquid levelwas half of all the problems.Tracerco, relying on its devel-oped expertise in radiationdetection instruments has a lineof reliable nuclear instrumentsincluding liquid level instru-ments. If you have a particular-ly challenging or troublesomebase liquid measurement appli-cation, contact your friendlyTracerco Technical Advisor.
Once the deethanizer columnwas stabilized, a second scanwas performed to check theintegrity and operating condi-tion of the trays. The secondscan showed that the liquidholdups on all 26 trays were atthe proper elevations and thatthe trays were holding aeratedliquid (Fig 1, page 1 - RedScanline) The deethanizer traysappeared to be operating withslight to moderate entrainment.
Case Study – Catching theIncipient-Flood-Point (IFP)
When we wish to push anoperating column to its maxi-mum, or to de-bottleneck a col-umn, we need to know whereflooding starts, what starts it,and the liquid load or vaporload when it starts. When evalu-ating the IFP in a large column,one needs to follow a systemat-ic, logical approach. This casestudy involves a company thatwas increasing the capacity of anatural-gas treatment plant.Simulations showed that thedeethanizer column was goingto be a capacity bottleneck. Theengineers wished to know, inmore detail, the conditionswhere and when the deethanizerbecame limited; that is, the IFPof the deethanizer.
The first step was to establisha baseline set of data on the column. At the existing plantcapacity there were no knownproblems with the operation ofthe deethanizer. A baseline scanof the 2-pass trayed deethanizer,was made on tray active areasand center downcomers to doc-ument the deethanizer operatingcondition at this given set of testconditions. In this particularcase the baseline results (Fig 2)
Flooding(Continued from page 1)
Figure 3 - The scans of the deethanizershowed the top three trays flooding with refluxcarried overhead.
Figure 2 - Baseline scans showed center downcomers in the bottom of the deethanizer nearly full of froth.
Continued on page 4
showed a hint of where the IFPmight be. All of the tray activeareas looked good; none hadany severe entrainment. Thecenter downcomers of all thetrays, except the bottom twotrays, appeared normal.However, the center downcom-ers of the bottom two trays,Trays 49 and 51, appeared to befull of aerated froth.
To simulate the operation atthe proposed increased rates,the reflux was increased 15%with an appropriate increase inreboiler rates to maintain thedeethanizer heat balance. Thedeethanizer was scanned againfor both active areas and centerdowncomers. The resultsshowed flooding at the top ofthe deethanizer (Fig 3, page 3).The top three trays were flood-ed with reflux being carriedoverhead from the deethanizer.The flooding gradually sub-sided until the 8th and 9th traysmatched the baseline profile.
In the bottom of the deetha-
nizer (Fig 4), the tray activeareas still appeared the same asthey had on the baseline but thecenter downcomers had filled tocapacity with froth. The scan atthe higher rates showed twoproblem areas, but it wasunclear which had happenedfirst. It would have been a logi-cal conclusion to believe thatthe bottom trays would floodfirst, since their downcomershad been full at the baselineconditions. But since the toptrays unexpectedly flooded atthe increased rates, it was possi-ble that the top trays were thestarting flood point.
To confirm exactly where theflooding started first, the operat-ing rates were returned to thebaseline conditions. Threepoints were selected for station-ary monitoring - between thetop two trays, above the bottomtray, and below the feed point.As rates were slowly and gradu-ally increased, these points werecontinuously monitored to seewhich would flood first.
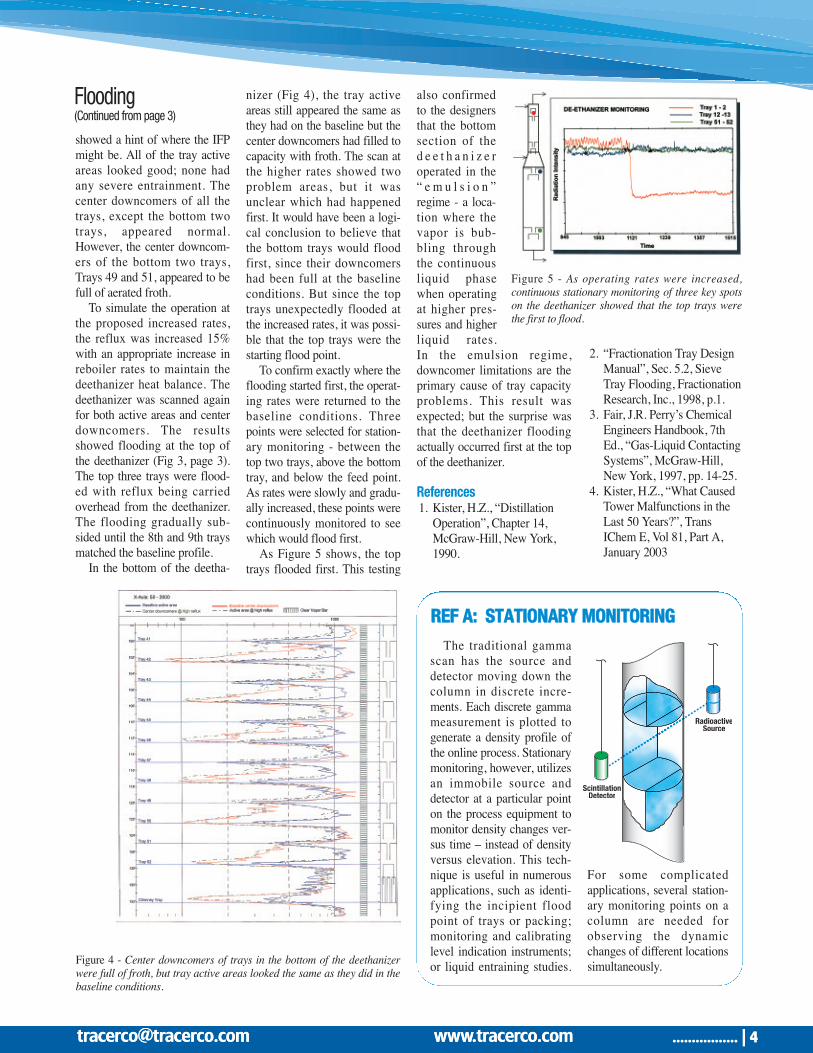
As Figure 5 shows, the toptrays flooded first. This testing
also confirmedto the designersthat the bottomsection of thed e e t h a n i z e roperated in the“ e m u l s i o n ”regime - a loca-tion where thevapor is bub-bling throughthe continuousliquid phasewhen operatingat higher pres-sures and higherliquid rates. In the emulsion regime, downcomer limitations are theprimary cause of tray capacityproblems. This result wasexpected; but the surprise wasthat the deethanizer floodingactually occurred first at the topof the deethanizer.
References1. Kister, H.Z., “Distillation
Operation”, Chapter 14,McGraw-Hill, New York,1990.
2. “Fractionation Tray DesignManual”, Sec. 5.2, SieveTray Flooding, FractionationResearch, Inc., 1998, p.1.
3. Fair, J.R. Perry’s ChemicalEngineers Handbook, 7thEd., “Gas-Liquid ContactingSystems”, McGraw-Hill,New York, 1997, pp. 14-25.
4. Kister, H.Z., “What CausedTower Malfunctions in theLast 50 Years?”, TransIChem E, Vol 81, Part A,January 2003
................. ı [email protected] [email protected] www.tracerco.com
Flooding(Continued from page 3)
Figure 4 - Center downcomers of trays in the bottom of the deethanizerwere full of froth, but tray active areas looked the same as they did in thebaseline conditions.
Figure 5 - As operating rates were increased, continuous stationary monitoring of three key spotson the deethanizer showed that the top trays werethe first to flood.
The traditional gammascan has the source anddetector moving down thecolumn in discrete incre-ments. Each discrete gammameasurement is plotted togenerate a density profile ofthe online process. Stationarymonitoring, however, utilizesan immobile source anddetector at a particular pointon the process equipment tomonitor density changes ver-sus time – instead of densityversus elevation. This tech-nique is useful in numerousapplications, such as identi-fying the incipient floodpoint of trays or packing;monitoring and calibratinglevel indication instruments;or liquid entraining studies.
For some complicated applications, several station-ary monitoring points on acolumn are needed forobserving the dynamicchanges of different locationssimultaneously.
T=2
RadioactiveSource
ScintillationDetector
RREEFF AA:: SSTTAATTIIOONNAARRYY MMOONNIITTOORRIINNGG

TRACERCO™ Interface gaugeon all four of the Separators.There were several reasonsplant personnel selected thistype of measurement system. • Safety - was the main
concern. Disastrous fires hadoccurred on the plant site inthe past. Tracerco suppliesthe only non-invasive level orinterface gauge that is intrin-sically safe for zones 0, 1 and2 use. It is therefore designednot to initiate any fires orcause highly flammable ethylene gas to explode.
• System Reliability - had to be assured. The TRACERCO™ Interfacegauge has an independentlyassessed Mean Time betweenfailure rating of 14 years.
• Accuracy and Speed - Dueto the random nature ofradioactive decay, long timeconstants are desirable forhigh accuracy when usingnucleonic systems. However,
the system had to be bothaccurate and fast. Fastresponse requires a shorttime constant.
The Tracerco gauges aredesigned with dual dyna-mically selectable time constants. While the controlunits automatically choose along time constant understeady state conditions theychoose a short time constantunder fluctuating conditions.This ensures no compromisebetween the two key perfor-mance areas of accuracy andresponse time.
• Pressure Effects - TheTracerco systems have pres-sure compensation built in.The density of the ethylenegas can fluctuate dramatical-ly due to system pressureswings. A sudden drop inpressure could cause dis-solved gas in the melt tobegin escaping. This causesfoam to begin to rise fromthe level of the melt.However, the immediateeffect is for more radiation to
pass through the lower den-sity gas. This results in theanomalous situation thatcompeting nucleonic gaugesnot corrected for gas pres-sure would initially indicatethe level moving in theopposite direction i.e. fallingas a result of increased radia-tion at the detector.Competing systems wouldtherefore begin to drive con-trol systems in the wrongdirection.
• Accuracy of Measurements -TRACERCO™ Level gaugeor TRACERCO™ Interfacegauge detectors use GeigerMuller tube technology.These do not operate tooclose to background radia-tion levels, as do some com-peting scintillator detectors.They are therefore less susceptible to minor disturbances to the radiationfield due to e.g. processinflows. They will allow fora build-up of a polyethylene‘skin’ on the walls to be“calibrated out”.
Each TRACERCO™Interface gauge had the samedesign. (Fig 6) Four radioactivesources were strung togetherusing a stainless steel cable. Aswith most interfaces gauges,these were inserted into a pocket(or well or dip-pipe) that hadbeen inserted into the bottom of
................. ı [email protected] [email protected] www.tracerco.com
Interface gauge(Continued from page 1)
Figure 6 - The TRACERCO™Interface gauge fitted to the polyethylene separator vessel
Do you want an installedmethod of regularly assessingthe operation of your distilla-tion tower, reducing operatingcosts and shutdown time?
Tracerco would like to introduce our next generationscanning system for repeatablescans and towers with limitedor no access to the top.Tracerco’s team of experts hasengineered an alternative technique to scanning trayedand packed columns. TheTRACERCO Diagnostics™RapidScan system is perma-nently installed on a column toprovide process engineers the
option of on-line repeat scansor scanning multiple times atdifferent rates to evaluatemechanical, rate or processrelated problems. Costs tobuild scaffolding or cranerentals to work from a basketcan now be eliminated.
Tracerco’s TRU-SCAN® orTru-Grid™ Scans generatedensity profiles of distillationcolumns that are used to identi-fy damaged trays and packing,liquid maldistribution, raterelated problems such as weep-ing or entrainment, and processproblems such as fouling orfoaming.
A few of the benefits youwill receive when installing theTRACERCO Diagnostics™RapidScan system in yourplant are:• Eliminate the costs of scaf-
folding or cranes forcolumns that do not haveaccess for scan set-up
• Alternative scanning tech-nique for frequentlyscanned towers or multiple
scans at different rates• Fixed orientations for
repeatable scans increasingthe reliability of scan data
• Wireless detection systemfor rapid data acquisition
If you would like to learnmore about the TRACERCODiagnostics™ RapidScan system please contact a techni-cal advisor in your area.
Tracerco Featured ProductTRACERCO Diagnostics™ RapidScan
Continued on page 6

North American Headquarters:4106 New West DrivePasadena, TX 77507 USATel: 281 291 7769Fax: 281 291 7709Toll Free: 800 288 8970
Field Office Locations:Corpus Christi, TX 78409 USATel: 361 888 8233
Newark, DE 19702 USATel: 302 454 1109
Merrillville, IN 46410 USATel: 219 945 0400Toll Free: 877 994 0400
Baton Rouge, LA 70820 USATel: 225 761 0621
Fresno, CA 93727 USATel: 559 455 0230
West Valley City, UT 84119 USATel: 801 478 0736
Edmonton, AB, T6E 6A6 CANADATel: 780 469 0055
Sarnia, ON, N7S 5G5 CANADATel: 519 332 6160
Rio de Janerio, RJ, Brasil, CEP 21040-232Tel: +55 21 3865 0098
www.tracerco.com [email protected]
XM0237/0/0
the vessel. The reasons for thisare twofold:1. It avoids the need to radiate
through two thick vesselwalls and through twosteam jacket walls.
2. It ensures that the radiationactually passes througheven the densest phase andarrives at the detector. Thisis different to a normallevel system where the bulkprocess contents of a fullvessel will usually cut theradiation at the detector tobackground levels.
On a simple application suchas indicating the interface levelon an oil/water separator onewould firstly obtain purely oilbetween the sources and thedetector. The pulses received bythe control unit under such acondition would be made torepresent 4 mA.
The next step would be toensure that there was only waterbetween the sources and thedetector. The input to the con-trol unit under this condition isset to represent 20 mA. Thecontrol unit will then give a 4 to20 mA output that representsexactly where the level of theinterface between the oil andthe water is located. However
the plant management did notwant the vessels filled to the topof the measuring range withpolyethylene. The management-team was very concerned aboutthe possibility of carry-over orover-flows. Therefore not onlysystem design but also commis-sioning had to be completedpartly by calculation.
The previously installednuclear gauge was a high-levelswitch with a Co-60 isotope asits source of radiation. TheTracerco team selected Cs-137.The Cs-137 has a much longerhalf-life at 30.0 years than Co-60 at 5.26 years. This wasnot the most significant reasonfor choosing the Cs-137 as theTracerco control unit automati-cally compensates for sourcedecay no matter whether it isCs-137 or Co-60 or indeedAmericium 241. The most com-pelling reason for choosing theCs-137 was it’s lower Gammaenergy at 662 keV as opposedto the Co-60 Gamma energybeing as high as 1330 keV. Thiswould make the system farmore sensitive to the presenceof low-density gas or liquid.Whereas the Co-60 gamma raywould tend to penetrate theprocess medium with very littleattenuation the Cs-137 gammaray would fluctuate more readilywith changes in its’ density.
Commissioning: After instrument design and
source activity sizing was completed the various methodsof commissioning that Tracercohad used on similar plantsaround the world werereviewed in conjunction withplant management. The calcula-tion method that most suited thesituation was adopted.
The radiation arriving at thedetector causes square wave(digital) pulses to be fed into thecontrol unit. As the density ofthe product between the sourcesand the detector increases, thedose rate at the detectorreduces. This results in a con-comitant reduction in the pulserate. The equation that governsthis reduction is:
I = Ioe-µρx
Where ‘I’ is the attenuatedradiation due to the ethylene gasor polyethylene product, ‘µ’ is aGamma ray constant forCesium. ‘ρ’ is the density ofeither the gas or the melt and‘x’ is the path length of theproduct that the radiation travels through. Io is the initialmaximum pulse rate when thevessel is brought to operatingtemperature but kept empty andde-pressurized. The ‘I’ value forthe ethylene gas was calculated.
The plant instrumentation specialist then arranged for the vessel to be charged withethylene gas.
It was noticed that the pulserate fell to a similar level to thatwhich had been calculated. Thepolyethylene melt pulse ratewas also calculated and the twovalues were then entered intothe control unit.
Operational experience:The plant was operated
under various extremes ofprocess conditions (such asmaximum output and suddenshutdown) for a period of ninemonths with the Tracercoequipment. Not a singlemoment of production was lostduring this period due to separa-tor vessel overflow. The invest-ment in the TRACERCO™Interface gauge equipment wasrecovered within the first monthafter commissioning.
TRACERCO™ Interfacegauge instruments offer reliabil-ity and accuracy even when anapplication is particularly ardu-ous. If you would like to learnmore about Tracerco’s specialistmeasurement instrumentsplease contact a representativein your area or visit our websiteat www.tracerco.com.
Interface gauge(Continued from page 5)

TR
AC
ER
CO
P.O
. BO
X 6
41LA
PO
RT
E T
X 7
7572
-064
1 U
SA
BU
SIN
ES
S R
EP
LY M
AIL
FIR
ST
-CLA
SS
MA
ILLA
PO
RT
E T
X
P
ER
MIT
NO
9
PO
ST
AG
E W
ILL
BE
PA
ID B
Y A
DD
RE
SS
EE
NO
PO
ST
AG
EN
EC
ES
SA
RY
IF M
AIL
ED
IN T
HE
UN
ITE
D S
TA
TE
S
TR
AC
ER
CO
P.O
. BO
X 6
41LA
PO
RT
E T
X 7
7572
-064
1 U
SA
BU
SIN
ES
S R
EP
LY M
AIL
FIR
ST
-CLA
SS
MA
ILLA
PO
RT
E T
X
P
ER
MIT
NO
9
PO
ST
AG
E W
ILL
BE
PA
ID B
Y A
DD
RE
SS
EE
NO
PO
ST
AG
EN
EC
ES
SA
RY
IF M
AIL
ED
IN T
HE
UN
ITE
D S
TA
TE
S
Ple
ase
sen
d m
e a
dd
ition
al
info
rmatio
n o
n Tra
cerco
’s Sp
ecia
listM
easu
rem
en
t Instru
me
nts:
Name:
Job Title:
Company Nam
e:
Address:
City:State:
Zip Code:
Phone:Em
ail:
❏Th
e TR
AC
ER
CO
Pro
filer™
❏TR
AC
ER
CO
™D
ensity gau
ge❏
TRA
CE
RC
O™
Leve
l gauge
❏TR
AC
ER
CO
™In
terface
gauge
❏TR
AC
ER
CO
™P
hase
Gau
ge❏
TRA
CE
RC
O™
Rad
iation m
onito
r❏
TRA
CE
RC
O D
iagnostics ™
Rap
idS
can
❏Th
e TR
AC
ER
CO
™S
martG
auge
❏TR
AC
ER
CO
™Le
vel alarm
❏TR
AC
ER
CO
™C
ontam
inatio
n m
onito
r
Name:
Job Title:
Company Nam
e:
Address:
City:State:
Zip Code:
Phone:Em
ail:
Tracerco
would
like to
up
date
our d
atabase
for 2
00
7. P
lease
co
mp
lete
the in
form
ation b
elo
w to
registe
r for co
pie
s of th
eTrace
rco N
ew
s.
oTR
U-S
CA
N®
oTru
-Grid ™
Scan
oTru
-CA
T ™S
can
oTru
Tec ™
Pip
e S
cano
TruTe
c ™N
eutro
n B
ackscatter
oTru
Tec To
werV
ision ™
oTR
AC
ER
CO
Diagn
ostics ™
Rap
idS
cano
TRA
CE
RC
O D
iagnostics ™
FC
CU
stud
yo
TRA
CE
RC
O D
iagnostics ™
Leak stu
dy
oTR
AC
ER
CO
Diagn
ostics ™
Flo
w stu
dy
oI w
ould
ow
ould
not like
to co
ntin
ue re
ceivin
g futu
re issu
es o
f Tracerco
New
s.
oI w
ould
like to
sched
ule
an o
n-site
pre
sentatio
n.
I am in
tere
sted
in ad
ditio
nal in
form
ation o
n th
e fo
llow
ing:
Vol 1
Ed
4V
ol 1
Ed
4
TRA
CE
RC
O41
06 N
EW
WE
ST
DR
IVE
PAS
AD
EN
A T
X 7
7507
US
A
PLA
CE
STA
MP
HE
RE
TRA
CE
RC
O41
06 N
EW
WE
ST
DR
IVE
PAS
AD
EN
A T
X 7
7507
US
A
PLA
CE
STA
MP
HE
RE