converting cad drawings to product models - diva...
TRANSCRIPT

Robert Noack
Converting CAD Drawings
to Product Models
�
'RRU� VLQJOH SDQHO
• Object ID #277• Classification NCS.2• Left panel 800 mm• Opening in wall #31
5R\DO�,QVWLWXWH�RI�7HFKQRORJ\Construction Management and Economics

Robert Noack
Converting CAD Drawings
to Product Models
�
�
�
�
�
�
�
�
�
�
�
�
�/LFHQWLDWH�7KHVLV�Division of Construction Management and Economics Department of Real Estate and Construction Management Royal Institute of Technology Stockholm, Sweden 2001 ISBN 91-7283-067-0

i
$%675$&7�
The fundamental aim of this study is to examine whether it is possible to auto-matically convert vector-based drawings to product models. The reason for do-ing this is that the new object-based systems cannot make use of the information stored in CAD drawings, which limits the usability of these systems.
Converting paper drawings to vector-format is used today and provides recogni-tion of lines and text, but does not interpret what the shapes represent. A lan-guage for describing the geometrical representations that could be processed di-rectly into a recognition program for building elements is missing. It is easier to describe how to recognize a line as a series of dots in a raster image, than it is to describe how a complex symbol of a building element looks like.
The approach in this research work has been to test different shape recognition algorithms. The proposed method can be divided into four processes: grouping of geometrical primitives, classifying these groups, interpreting the content and analyzing the relationships between the groups. The algorithms developed here are based on research within related domains, such as pattern recognition and artificial intelligence.
The algorithms have been developed in a prototype implementation and were tested with three layer-structured drawings used in practice. The results of the tests show that there are no crucial obstacles to recognizing a large part of the symbols of building elements in a CAD drawing. The requirement is that the recognition system is able to differentiate one from another and be tolerant of errors and variations in the shapes.
.H\ZRUGV: Shape recognition, shape interpretation, product models

ii

iii
6$00$1)$771,1*�
Det övergripande syftet med denna studie är att undersöka om det är möjligt att automatiskt konvertera vektorbaserade ritningar till produktmodeller. Anled-ningen är att de nya objektbaserade systemen inte kan hantera information som lagras i CAD-ritningar, något som starkt begränsar nyttan av dessa system.
Konvertering av pappersritningar till vektorformat används idag och medger igenkänning av linjer och text, men inte tolkning av vad de föreställer. Det sak-nas en beskrivningsform för geometriska representationer som man ska kunna mata in i ett igenkänningsprogram för byggnadselement. Det är lättare att be-skriva hur man kan känna igen en linje genom att följa en serie punkter i en ras-terbild, än att beskriva hur en komplex symbol för ett byggnadselement ser ut.
Angreppssättet i detta arbete har varit att testa olika algoritmer för figur-igenkänning. Den föreslagna metoden kan indelas i fyra processer: att gruppera geometriska primitiver, att klassificera dessa grupper, att tolka innehållet samt att undersöka gruppernas inbördes relationer. De algoritmer som utvecklats är baserade på forskning inom angränsande områden, såsom mönsterigenkänning och artificiell intelligens.
Algoritmerna har testats i en prototyp med tre autentiska lagerindelade ritningar. Resultatet av testerna visar att det inte finns några principiella hinder att känna igen merparten av de förekommande symbolerna för byggnadselement i en CAD ritning. Det som krävs är att igenkänningsprogrammet kan skilja dem åt och vara feltolerant.
1\NHORUG: Figurigenkänning, figurtolkning, produktmodeller

iv

v
35()$&(�
This study was carried out at the Division of Construction Management and Economics at the Royal Institute of Technology in Stockholm, Sweden, and was supervised by Professor Bo-Christer Björk and later, Professor Örjan Wikforss. I wish to thank them both for giving me the chance to start on this research, en-couragement while conducting it and for all the help in completing it.
The ideas for this research comes from the department’s earlier involvement in research projects focused on product models and CAD layering. The algorithm design and software implementation has been done by the author, to a large ex-tent during extended evenings. Although the source code has not yet been final-ized with comments and requires third-party software licenses to execute, it may be found interesting for other projects and can be used as an example when de-signing similar systems.
Funding has come from the Swedish research program “IT in Construction and Facility Management 2002”, with joint governmental and industrial partners. Many fruitful contacts and opportunities for exchanging ideas have been pro-vided within this program, both inside and outside seminars.
I also wish to thank Professor Chuck Eastman and Olubi Babalola for their hos-pitality and interesting discussions during my stay at the College of Architec-ture, Georgia Tech, Atlanta. I sincerely wish them good luck in developing this research subject further.
The members of the reference group, consisting of Ingert Appelqvist (CadITma), Thord Backe (CADPOINT), J-O Edgar (Digital Design Develop-ment) and Sven-Eric Norén (Pythagoras) have all been very supportive and have made valuable comments throughout.
Finally, my dear colleagues at the division, former and present, are worth a big ring on the coffee-bell for making daily life enjoyable.
Stockholm, March 2001
Robert Noack

vi

vii
&217(176�
$%675$&7BBBBBBBBBBBBBBBBBBBBBBBBBBBBBBBBBBBBBBBBBBBBBBB ,
6$00$1)$771,1* BBBBBBBBBBBBBBBBBBBBBBBBBBBBBBBBBBBBBB ,,,
35()$&( BBBBBBBBBBBBBBBBBBBBBBBBBBBBBBBBBBBBBBBBBBBBBBB 9
&217(176BBBBBBBBBBBBBBBBBBBBBBBBBBBBBBBBBBBBBBBBBBBBB 9,,
$%%5(9,$7,216BBBBBBBBBBBBBBBBBBBBBBBBBBBBBBBBBBBBBBBB 9,,,
� ,1752'8&7,21BBBBBBBBBBBBBBBBBBBBBBBBBBBBBBBBBBBBBBBB�
1.1 Background ________________________________________________________ 1
1.2 From vector drawings to product models _________________________________ 2
1.3 Scope and objectivities _______________________________________________ 4
1.4 Methodology _______________________________________________________ 5
1.5 Structure of the thesis ________________________________________________ 6
� 5(/$7('�5(6($5&+ BBBBBBBBBBBBBBBBBBBBBBBBBBBBBBBBBB�
2.1 Construction drawings________________________________________________ 7
2.2 Product models _____________________________________________________ 8
2.3 Shape recognition ___________________________________________________ 9
2.4 Architectural drawing interpretation ____________________________________ 11
� 5(&2*1,7,21�0(7+2'6 BBBBBBBBBBBBBBBBBBBBBBBBBBBBBB��
3.1 Overview _________________________________________________________ 13
3.2 Shape Identification_________________________________________________ 13
3.3 Shape Classification ________________________________________________ 15
3.4 Shape Interpretation ________________________________________________ 17
3.5 Create relationships _________________________________________________ 24
3.6 Finalizing the product model__________________________________________ 25
� 7+(�352727<3( BBBBBBBBBBBBBBBBBBBBBBBBBBBBBBBBBBBBB��
4.1 Introduction _______________________________________________________ 27
4.2 Software components _______________________________________________ 27
4.3 Software modeling and programming languages __________________________ 30
4.4 System architecture _________________________________________________ 32
4.5 User interface _____________________________________________________ 36

viii
� 5(68/76BBBBBBBBBBBBBBBBBBBBBBBBBBBBBBBBBBBBBBBBBBBB ��
5.1 Implementing the methods ___________________________________________ 39
5.2 Validation of the methods____________________________________________ 43
� ',6&866,21BBBBBBBBBBBBBBBBBBBBBBBBBBBBBBBBBBBBBBBBB ��
6.1 Summary of the findings_____________________________________________ 49
6.2 Discussion________________________________________________________ 51
6.3 Final conclusions __________________________________________________ 52
6.4 Further research ___________________________________________________ 52
5()(5(1&(6BBBBBBBBBBBBBBBBBBBBBBBBBBBBBBBBBBBBBBBBBBB ��
$33(1',;�$ /$<(5�0$7&+,1*�7$%/( BBBBBBBBBBBBBBBBBBBB ��
$33(1',;�% (;$03/(�,)&�),/( BBBBBBBBBBBBBBBBBBBBBBBBBB ��
$%%5(9,$7,216�
The list contains most of the acronyms used in this thesis.
AEC Architecture, Engineering and Construction
AMA Allmänna Material- och Arbetsbeskrivning [General Material and Workmanship Specification]
ANN Artificial Neural Network
BSAB Byggandets Samordning AB [Building Coordination Center]
CAD Computer Aided Design
IAI International Alliance for Interoperability
IFC Industrial Foundation Classes
ISO International Organization for Standardization
STEP Standard for the Exchange of Product Model Data
UML Unified Modeling Language

1
�� ,1752'8&7,21�
7KLV� FKDSWHU� GHWDLOV� WKH� QHHG� IRU� FRQYHUWLQJ� D� YHFWRU� GUDZLQJ� LQWR� D� SURGXFW�PRGHO�E\�SURYLGLQJ�D�VKRUW�KLVWRULFDO�EDFNJURXQG��D�WHFKQLFDO�GHVFULSWLRQ�DQG�GHILQLWLRQV�� ,W� DOVR� VSHFLILHV� WKH� VFRSH� RI� WKH� UHVHDUFK� DQG� WKH� JRDOV� WR� EH�DFKLHYHG��
���� %DFNJURXQG�
In the 1980s architects in Sweden started to use CAD almost exclusively, and this has produced a large set of drawings that are used today in facility manage-ment etc. The main problem now is that modern CAD systems are not able to read and understand paper drawings or even drawings in vector format produced by earlier CAD tools. When designing a major change to a building or undertak-ing space planning in facility management, the information in earlier CAD drawings are not machine interpretable, they were primarily produced for hu-mans to read.
Design information has been communicated in drawings since the renaissance (Wikforss, 1999). The drawing language is an accepted standard representation for building design, which follows the logic of architecture (Mitchell, 1990). However, this language was designed for humans to interpret, or more precisely it requires a trained expert to fully understand every detail of the drawing (Cherneff et al, 1992). This is because of the tremendous speed, compared with a computer, with which a human can process an image on the retina in the eye, and the inductive and associative ability of learning and understanding symbolic language. The image itself contains nothing but a set of colors organized in pat-terns, thus is just raw unstructured data. This is beyond the capacity of any exist-ing machine of today (Russell and Norvig, 1995); computers require the infor-mation to be expressed in a semantically rich format.
There are plenty of facility managers and architects who have been forced to re-produce their drawings manually when using a new CAD system, a very costly and time-consuming process. Although there are tools for scanning and recog-nizing lines and other graphics in paper drawings (also known as vectorization), there is no conversion from a vector drawing to a product model (Dori and Tombre, 1995), (Ablameyko et al, 1997). One reason for this is that vectoriza-tion is a general-purpose technique compared with object recognition which has to be specialized to interpret the semantics in every drawing domain it is applied to.
The question of whether it is enough to use scanned paper drawings within facil-ity management is studied by Svensson et al (1994). An efficient hybrid editing method coupled to a relational database system is presented, which require lim-ited manual actions for overlaying the scanned image with vector-based infor-

2
mation, supported by a tool for finding intersection points. They argue that vec-torization without object recognition results in unstructured vector data with many interpretation errors, and also conclude that such a recognizer would be desirable for a selected set of object types.
���� )URP�YHFWRU�GUDZLQJV�WR�SURGXFW�PRGHOV�
The evolution of CAD depicted in Fig. 1 shows the major steps of technological changes. Each step significantly increases the semantic information level that a drawing can contain, although the main difference between a paper and vector-based drawing is the medium. The level of semantic information is used here to measure the medium’s ability to represent building elements in a way that is meaningful to a computer program. A CAD system is typically backward com-patible, meaning that it can produce a lower level drawing (certainly for plotting on paper), but very few systems, if any, can automatically understand drawings produced by an earlier system.
The technology of optically scanning a paper drawing to produce a digital raster image is well developed, and such products can be bought off the shelves. They include the basic tools for error correction, such as noise reduction and geomet-ric transformation. The resulting quality is dependent on the paper’s condition, but is, in general, very good after enhancements are made.
Vector drawings range from 2D drafting to 3D models from which any desired projection can be generated and printed. The underlying format is totally differ-ent compared to a raster image, which is just a matrix of pixels with a color. A vector drawing consists of basic primitives such as lines, arcs and text. There are specialized tools for vectorization of raster images, as well as for recognizing alphanumeric characters in images, and they are frequently used today to store drawings and documents in a more useful format for editing and searching.
Rasterimages
Vector drawings
Layered drawings
3D modelleddrawings
Level of semanticinformation
Time
Paper drawings
Product models
)LJ�����0DMRU�FKDQJHV�RI�GUDZLQJ�IRUPDWV�

3
There is currently no system that can automatically classify primitives in a vec-torized drawing, e.g. to say that a line is the contour line of a wall. This would require a complete semantic analysis of the object types that may be represented in the drawing. The data format as such may well be able to store this informa-tion; it is the vectorization process that lacks this complicated functionality. Of course it would have to be specialized for every type of drawing while vectori-zation can be carried out on any type of image.
Layering is a method to classify the information content of a vector drawing, such as walls or annotations, and is heavily used by today’s CAD systems. This method is implemented by marking each graphical primitive (manually or when creating the primitive) with a code that can be used to filter information that is for the moment irrelevant. Another usage of layers is to control consistency, al-lowing different actors to edit certain layers separated from the core drawing da-tabase and merge them back, since nobody else can draw on those layers. The naming conventions used typically derive from classification systems, but not until recently have there been any standard codes for layers, such as “Bygghan-dlingar 90”1 (Löwnertz et al (eds.), 1996). The release of ISO 13567 (Björk et al, 1997) provides a framework for structuring layer names but has only just been implemented in CAD systems.
Although layers can help classify what a line represents, the problem remains of identifying the rest of the geometry representing the object. The CAD systems have functionality to group primitives, but this is mostly used for symbols cop-ied from template libraries, and not so much for free-form shapes like borders, walls or duct pipes. Also, due to the fact that a user can manually draw, for ex-ample, connections between symbols, and that not all drawing formats are able to store the groups correctly, there is no guarantee that the information is grouped so that it corresponds to the object it represents.
Product models, or object models, can carry the highest level of semantic infor-mation currently. This type of model can contain information not only related to geometry, but also regarding material, time schedules, construction methods, cost plans etc. A product model is a logical representation of a building, as op-posed to geometric or shape driven representation (Eastman, 1999). This is illus-trated in Fig. 2, where a door is described with its attributes and relations to other objects, compared to the explicit geometrical representation of a CAD drawing.
1 Construction Documentation

4
Line (4.45, 3.00,…), A046 Line (2.45, 3.00,…), A046 Arc(5.30, 2,50, …), A046…
Door (ID=Door004,Type=External D2, Framewidth=0.900,Swing=Left,Position=x,yParent=Wall001)
Door004 Wall001
)LJ�����7KH�UHSUHVHQWDWLRQ�RI�D�GRRU�LV�LOOXVWUDWHG�WR�WKH�OHIW�DV�LQ�D�OD\HUHG�&$'�GUDZLQJ�DQG�WR�WKH�ULJKW�DV�DQ�LQVWDQFH�LQ�D�SURGXFW�PRGHO��
Product models have been implemented at various levels, from very simple ones, with very few different basic object types, to the very complicated PDM (Product Data Management) systems used in the automotive and aerospace in-dustries. These have built-in support for life-cycle management and manufactur-ing information (Al-Timimi et al, 1996). Pioneers in the construction domain began working maybe as early as at the beginning of the 1980s when the object-oriented programming paradigm had its break-through, and today all of the lead-ing CAD vendors have support for objects in their systems. There has also re-cently been formed an organization called IAI (International Alliance for Inter-operability) with the aim of producing an agreed neutral exchange model that could store an entire construction project (IAI, 2000).
���� 6FRSH�DQG�REMHFWLYLWLHV�
The overall aim of this study is to determine whether it is possible to convert CAD drawings to product models And also, to try to identify any problems that would reduce the potential for a successful translation and, if possible, to sug-gest ways round these obstacles.
To limit the problem only layered 2D vector drawings of floor plans are used. This is the typical drawing produced during the 1990s, although an estimated 90% of the drawings stored in Sweden are paper or scanned paper drawings, de-signed manually or by simply using only the printed versions of CAD drawings. It is assumed that the advantage of using drawings with structured and precise geometry produced by a computer program will result in a very good recogni-tion performance. Nevertheless, it is also believed that the same recognition methods can also be applied to unstructured vector drawings, but such a system would require many more resources in order to develop.

5
The CAD drawings often contain additional information that can be used to guide the recognition process, e.g. grouped geometry or application-specific ex-tensions. This kind of information was not used in the proposed methods, which should be designed independently of the CAD system used to produce the draw-ings. Also, as we will see later, the algorithms must be able to accept situations where the geometry is fragmented, since groups and polygons are not always kept together.
Converting a drawing to a product model is very much a shape recognition prob-lem, in the sense that symbolic or schematic shapes represent the building ele-ments. It is also a semantic interpretation of domain specific objects that has to be based on knowledge of how those shapes are formed. It can be considered to consist of the following processes:
1) 6KDSH� ,GHQWLILFDWLRQ. The aim is to find the geometric primitives that compose the shape. This can be difficult since shapes may be intersecting or one shape may be totally inside another shape. The approach in this thesis is to use layers to make the search space smaller.
2) 6KDSH�&ODVVLILFDWLRQ is made to determine the type of object the shape represents. It is not always certain what kind of object it represents even if the shape is marked with a layer code. A problem is that the shape can be rotated and scaled which makes it difficult to describe the shape. In this thesis an artificial neural net is applied to classify the symbols in draw-ings.
3) 6KDSH�,QWHUSUHWDWLRQ is were the properties of an object is analyzed based on knowledge of how it is represented. For example, if a shape is classi-fied as a window, we might be looking for its length and thickness or the number of glass panes. Recognition algorithms for walls and opening elements are presented here.
4) &UHDWH�5HODWLRQVKLSV. The final step is to examine the relationships be-tween the objects, such as enclosing or connecting objects. One of the key features of an object model is to be able to analyze the structure that the objects are organized in. A method for searching for rooms enclosed by building elements is tested in this thesis.
���� 0HWKRGRORJ\�
Some of the above processes are used for other purposes with different methods and technology. The approach in this thesis is to gather such methods and test them in prototype implementations applied to architectural floor plans. Prototyp-ing is commonly used for developing software products where the prototype is gradually expanded into a full-scale system. It involves a definition of the prob-lem domain, identifying the possible technical solutions, development of the prototype, and finally, validation (Lundequist, 1995).

6
The distinction between research and development as described by Eriksson (1996) is that research results only in theoretical knowledge, while development work is aimed for designing new products, processes or systems that will help solving practical problems. The kind of scientific development used here is pro-viding the research necessary for solving the practical problems found in the in-dustry. The prototype is used here as a tool for testing the algorithms, and is not part of a commercial system.
Experiments on the methods were conducted in a laboratory environment on drawings with a limited set of graphics and few errors. Each method was itera-tively enhanced in the prototype until it performed satisfactorily. The methods were finally validated by testing them on three commercial drawings. The crite-ria for a successful method are a combination of factors, such as ease of imple-mentation, stability and sensitivity to noise, and how specialized the algorithm has to be to recognize a certain type of symbol.
���� 6WUXFWXUH�RI�WKH�WKHVLV�
The first chapter provides the framework within which this research is con-ducted by introducing the background problems, the aims and scope of the re-search and the methodology used.
The second chapter presents related research and approaches to shape recogni-tion. The intention is to give an overview of the technology used as a basis in this study and also to show some alternative solutions.
In the third chapter the shape recognition methods developed here are described in detail. Each method is presented with an algorithm that is designed to solve the problems listed in the first chapter.
The fourth chapter gives an overview of the implementation of the algorithms in a prototype called CADPRO. The system architecture is presented in diagram form together with screen shots of the usage of the program.
The fifth chapter presents the results of implementing and testing the methods. Both small samples and larger commercial drawings were used here to identify the weaknesses of the methods.
In the sixth chapter the results are summarized and discussed, together with con-clusions and topics for further research.

7
�� 5(/$7('�5(6($5&+�
7KLV�FKDSWHU�SUHVHQWV�WKH�UHODWHG�UHVHDUFK�DQG�DSSURDFKHV�WR�VKDSH�UHFRJQLWLRQ��7KH� LQWHQWLRQ� LV� WR�JLYH�DQ�RYHUYLHZ�RI� WKH� WHFKQRORJ\�XVHG�DV�D�EDVLV� LQ� WKLV�VWXG\��DQG�DOVR�WR�VKRZ�VRPH�DOWHUQDWLYH�VROXWLRQV��
���� &RQVWUXFWLRQ�GUDZLQJV�
The documentation of a construction project is not only in the form of drawings. Certain information is better expressed in the form of text, such as material de-scriptions or requirements in production. Other information is not explicitly specified, but can be found in references and standards (Herzell (ed), 1993), such as the Swedish AMA. In fact, only the information that needs to be graphi-cally illustrated and described is included in the drawings.
Drawings are used in many ways at different stages of the lifetime of a building; each has its own focus and level of detail. In the feasibility study and early con-ceptual design the essential thing is the layout of the building in relation to the surrounding environment. The detailed design requires coordination of the sys-tems in the building, while accurate dimensioning and quantities are needed at the planning and production stage; and, finally, the spatial and operational sys-tems are the focus in facility management.
The scope of this project restricts the type of drawings to floor plans, which are used in facility management. One could imagine that the information base would be very exhaustive and detailed when the building has been produced and all documentation is completed. This is, however, not the case in practice, accord-ing to a study published by Haugen (1990), where almost 60% of the drawings were never transferred to this phase. This is partly due to the fact that the draw-ings must be updated to reflect how the building actually turned out, but also to the different focus at this stage. Most information in this type of drawing is schematically outlined on the scale 1:100.
There are no rules for the contents of a drawing, it depends on the facility being described, but since the drawings are treated as legal document there are regula-tions for how they should be represented and interpreted. Besides the basics of how mechanical engineering drawings are composed, e.g. three-view (usually top and two side projections) and section, there are also construction-specific recommendations, like the Swedish “Bygghandlingar 90” with the recent addi-tion of “CAD-lager”2 (Svensk Byggtjänst, 1999), which is an application of the ISO layering standard.
2 CAD Layering

8
What makes architectural drawings special is highlighted by Cherneff et al (1992) where they point out that floor plan drawings include both schematic symbol representations and approximate scaled shapes. As described in a paper by Ablameyko (1997) the main drawing entities consist of contour lines, sym-metry axes, hidden contour lines, matter areas and dimensions. These are con-structed by basic geometric primitives such as lines, arcs and circles.
���� 3URGXFW�PRGHOV�
Product models have been researched for almost twenty-five years, including the COMBINE project that integrated energy simulation tools using a building model for communication (Augenbroe, 1995), the CIMsteel project for struc-tural steelworks (Crowley and Watson, 2000) and the RATAS project that de-fined a framework for such models (Björk, 1995). A comprehensive review of these and other product models is given by Eastman (1999) and Tarandi (1998). Common to all of the approaches is the goal of developing a semantically rich logical model to be able to communicate with well-defined and structured data.
Many of the ideas have been adopted by the ISO STEP (Standard for the Ex-change of Product Model Data) organization, formally TC184/SC4, which has recently produced a standard for the construction industry called Part 225: Building Elements Using Explicit Shape Representation (Haas, 1997). It is mainly focused on the geometrical aspects of a building in 3D, and was up-graded to Draft International Standard in 1999.
There is also an attempt at defining a framework model (Part 106, Building Construction Core Model) within STEP to integrate other building models (ISO 1996). It has taken a lot of time for the involved actors to agree upon this type of core model, which is one of the reasons that the leading CAD vendors formed the IAI to produce the IFC (Industry Foundation Classes) (IAI, 2000). The ap-proach is similar to that of STEP, and IFC reuses the same resource models to some extent, such as geometry and measurements. There is now a letter of un-derstanding between the IAI and STEP to ensure future compatibility.
The IFC has a much broader scope than AP 225; it tries to span the entire life cycle of a building. The current release (2x) is still focused on the design stages, but there is already support for facility management, and future releases will in-clude thermal analysis etc. A subset of IFC 2.0, the version used in this project, is shown in Fig. 3. It illustrates some of the entity definitions and relationships related to building elements, such as the decomposition structure, sub-types and associations to other objects.

9
IfcBuildingStoreyIfcBuildingIfcProjectIfcBeam
IfcBuiltIn
IfcColumn
IfcCovering
IfcFloor
IfcDoor
IfcRoofSlab
IfcWall
IfcWindow
IfcShapeRepresentation
IfcClassification
IfcOpeningElement
IfcLocalPlacement
classifications
openings
filled_by
representations
placement
connects
containscontains
containsIfcSpace IfcSpaceBoundary
bounded_by
IfcBuildingElement
provides
IfcBuildingStoreyIfcBuildingIfcProjectIfcBeam
IfcBuiltIn
IfcColumn
IfcCovering
IfcFloor
IfcDoor
IfcRoofSlab
IfcWall
IfcWindow
IfcBeam
IfcBuiltIn
IfcColumn
IfcCovering
IfcFloor
IfcDoor
IfcRoofSlab
IfcWall
IfcWindow
IfcShapeRepresentation
IfcClassification
IfcOpeningElement
IfcLocalPlacement
classifications
openings
filled_by
representations
placement
connects
containscontains
containsIfcSpace IfcSpaceBoundary
bounded_by
IfcBuildingElement
provides
)LJ�����$Q�LQWHUSUHWDWLRQ�RI�,)&������VKRZLQJ�D�VXEVHW�ZLWK�IRFXV�RQ�WKH�,IF%XLOG�LQJ(OHPHQW��
Current research on product models is mainly focused on their practical use. For example, the European Concur project (Concurrent Design and Engineering in Building and Civil Engineering) uses IFC in a client-server system. An informa-tion management system allows multiple users to access the model-files, and when a file is updated it can be merged back into the project database through a rule-based mapping language (van de Belt, 2000).
���� 6KDSH�UHFRJQLWLRQ�
The purpose for shape recognition can be anything from character recognition, tracking objects in real time video, to counting volcanoes on planets. There are numerous methods for recognizing an object from its graphical representation in different formats, such as images, stereo images, diagrams, charts and movies.
Many shape recognizers use some form of language that makes it possible to de-scribe the shape. These languages capture the logical compositions of shapes (Mitchell, 1990), and include shape grammar that can express the spatial rela-tionships between different types of shapes as an attributed string that can be parsed by a genetic algorithm (Ozcan and Mohan, 1996), (Myers and Hancock, 1997). This approach is well suited for polygon-formed shapes since the algo-rithm can find patterns in strings of any length.
Some machine-learning approaches in computer science use a feature vector, i.e. a list of attributes, that describes the characteristics of a shape or pattern in a uni-form way. A raster image is easily represented as a vector with light intensity as

10
a feature value for every pixel. The vector is then used to optimize an adoptable solver such as an artificial neural network. Others use what is known as a tem-plate-matching technique, where the (Euclidean) distance is used as a measure of how well an image can be fitted onto the input image (Brunelli and Poggio, 1993). This becomes more complicated if the shapes are not isolated and can be rotated, unlike in the case of recognizing characters in text, where this technique performs well.
2.3.1 Artificial Neural Networks
The research in the machine-learning field is closely related to the study of hu-man perception and cognitive capabilities. An artificial neural network (ANN) acts in a way similar to the human brain in that it can process in a parallel fash-ion, unlike traditional serial computer programs. It is less dependent on reliable data, thus more fault-tolerant, and can learn from examples (Russell and Norvig, 1995).
The basic model for an ANN consists of processing units connected by links (seen in Fig. 4), similar to nerve cells connected by axons and synapses in the brain. The flow of data from the input to the output units is controlled by weights on the links, which will activate some units more than others. The nu-merical values of the weights are adjusted for every example presented to the net so that the output corresponds to the desired result.
There are a number of approaches for designing the structure of the network, the algorithms used by the processing units, and the methods for updating the weights. One efficient learning strategy is called back-propagation and is found in multi-layer feed-forward networks. The name comes from the way the error of the output signal is calculated and distributed backwards to the weights be-tween the units that are organized in several layers. Feed-forward refers to the
U1
U2
O1
O2
I1
I2
I3
W11
W12
W32
W211
W212
W222
W221
W31
W21
W22
)LJ�����$� VFKHPDWLF� YLHZ�RI�D�QHXUDO�QHWZRUN�ZLWK� WKUHH� LQSXW�XQLWV�� WKH� OLQNV�ZLWK�ZHLJKWV�FRQQHFWLQJ�SURFHVVLQJ�XQLWV�DQG�WZR�RXWSXW�XQLWV��

11
fact that the links only go in one direction between the layers, unlike the brain where neurons can be connected in cycles. It has been used successfully to solve several linguistic problems such as pronunciation and handwritten character rec-ognition.
Another approach is described by Holst (1997), where Bayesian learning using probabilistic functions, useful if there is uncertainty about the quality of the data, is applied to classification tasks. Classification is performed in the same way as for plant species by asking a number of questions about the appearance of the object, which finally results in a name that corresponds to the sequence of an-swers. One of the tasks he describes is the classification faults in a telephone ex-change computer by examining the memory dump, resulting in an input feature vector with 122 bits that is fed into the network in order to be able to identify which of the 32 circuit boards has failed. This system was able to classify about 80% of the errors correctly, thus outperforming the real diagnostics program that is right in about 50% of the cases. The approach shows that it can be efficient to use ANNs to solve classification problems when the amount of data to analyze is extensive and the possible combinations are many.
Recent research in artificial intelligence tries to combine another useful method for uncertain data, called fuzzy logic, with neural nets in what is called “adap-tive neuro-fuzzy systems” (Jeng et al, 1997). The aim is to make use of both the learning abilities of ANN and the knowledge representation and inferring capa-bilities of fuzzy logic, which is a way to specify how well something satisfies a vague description.
���� $UFKLWHFWXUDO�GUDZLQJ�LQWHUSUHWDWLRQ�
Although there is much research being carried out on the fundamental technolo-gies for shape recognition, there are not many studies of their application to the interpretation of drawings in the architectural domain. Current research in the mechanical domain is mainly focused on combining scanned images to produce a 3D vector model and on recognition of shape features in solid models. Exam-ples can be found in Langrana et al (1997) and Devaux et al (1999).
However, a very extensive research on the subject can be found in a paper by Cherneff et al (1992). They have built a system called “Knowledge Based Inter-pretation of Architectural Drawings” that is based on syntactic pattern recogni-tion, which is closely related to shape grammars. The system consists of four parts:
1) Semantics. An interpretation hierarchy is defined as the decomposition of systems, composites, components and primitives. These are then special-ized for a particular view of the drawing contents; for example “a room is a subtype of a system” and “a line is a subtype of a primitive”. This part corresponds in large to what a product model describes, but it also in-

12
cludes references between the semantic concept and its graphical repre-sentation.
2) Syntax. The drawing grammar used here is made up of rules or recogni-tion patterns that express complex geometrical relationships. It also in-cludes routines for navigating both in semantic space and geometric space in order to be able to create queries concerning both building elements and their shape representations.
3) Geometry. Spatial models are used to represent the relationships (parallel, containment etc.) between the geometrical primitives, and also topological networks used for searching for enclosed spaces.
4) Context. Knowledge for controlling the sequence of interpretation proc-esses is derived from the dependencies between the rules defined in 2).
They have defined a very thorough system that seems to work, at least on their test drawing, although they make a comment on its robustness when used on commercial drawings. The system does not expect layered vector drawings, so the question is: how well does it perform on drawings with much more geometry and noise? The system architecture as described indicates that it is highly cus-tomizable, and they also point out that they will test it in other problem domains.
A library of geometric manipulation functions for querying a vector database is being developed at Georgia Tech (Babalola and Eastman, 2000). The approach resembles a relational database language by making queries on the data set and using segmentation filters for sorting out, for example, parallel line segments. Subsequent queries can then be made on the result of the initial query. It has several advantages in describing geometrical shapes as a sequence of queries, building up a context sensitive grammar. This language is now being further de-veloped to identify the lexical entities in a system for understanding semantic architectural drawings .
Finally, a way to generate a 3D surface model from a 2D floor plan drawing for later use in a walk-through program is described in a paper by Lewis and Sequin (1998). It includes an uncomplicated algorithm for generating rooms bounded by walls, although it has some limitations as described in 3.5. The algorithm starts by shooting a ray from a room label and follows the closest intersection with the contour line of a wall around the room, while taking care of openings in the walls by finding symbols for doors and windows. The tool expects a layered vector drawing but has a tolerance for drawing mistakes like imperfect line con-nections.

13
�� 5(&2*1,7,21�0(7+2'6�
7KLV�FKDSWHU�GHVFULEHV�WKH�VKDSH�UHFRJQLWLRQ�PHWKRGV�GHYHORSHG�LQ�WKLV�VWXG\�LQ�GHWDLO��(DFK�PHWKRG�LV�SUHVHQWHG�ZLWK�DQ�DOJRULWKP�RU�VLPLODU�WKDW�LV�GHVLJQHG�WR�VROYH�WKH�SUREOHPV�OLVWHG�LQ�WKH�ILUVW�FKDSWHU��
���� 2YHUYLHZ�
The recognition process illustrated in Fig. 5 is to identify and classify the shape, interpret it and finally analyze the relationships between the shapes.
1. Identify shape:Lines: 9, Arcs: 1
2. Classify shape: Door (Single panel)
4. Create Relationships: Wall > Opening > Door
3. Interpret shape: Swing radius=900 mm
1. Identify shape:Lines: 9, Arcs: 1
2. Classify shape: Door (Single panel)
4. Create Relationships: Wall > Opening > Door
3. Interpret shape: Swing radius=900 mm
)LJ�����7KH�IRXU�PDLQ�SURFHVVHV�IRU�VKDSH�UHFRJQLWLRQ�
Not all steps may be necessary, depending on the prerequisites. It may be obvi-ous what type of building element a shape represents, or it can also be enough to find the symbol for a bathtub in order to be able to classify a space as a bath-room.
���� 6KDSH�,GHQWLILFDWLRQ�
In order to recognize an object in a drawing, its shape representation first has to be found. The problem is to identify the group of geometric primitives that com-pose the shape, which can be difficult if the shapes are overlapping. In general, a shape representation is a set of lines and curves most usually connected together. Furthermore, a symbol can consist of a combination of smaller shapes. An anal-ogy with a word can be used to describe this, where a number of characters that are formed with different shapes make up a meaningful word. To recognize the word in a text document the characters have to be grouped together in a way that is based on their position and distance from other characters.

14
NSC.11.001 NSC.11.002
NSC.2.001NSC.2.004 NSC.2.002 NSC.2.003
PUB.11.001PUC.1.001PUE.11.001 PUB.41.001
PUF.1.001XKC.11.001
)LJ�����6KDSHV�SDUW�RI�WKH�V\PERO�OLEUDU\�XVHG�LQ�WKLV�VWXG\��KHUH�ZLWK�QDPHV�DF�FRUGLQJ�WR�WKH�%6$%����FODVVLILFDWLRQ�V\VWHP��
Symbols are usually drawn with a tool that inserts a copy from a template li-brary, but it is very common for them to be manually edited afterwards, and thus lose their grouping. This means that the algorithm must search for geometry that is connected in some way. To find intersecting or touching lines and curves, the only way is to test every geometric primitive against each other. Using layers that separate the object types reduces the search space.
Fig. 6 illustrates the shapes that were used in this study, a number of commonly used symbols. They are named with a code, which is the class they belong to, and a serial number (the last three digits).
There are also cases where some details are inside the shape without connec-tions, for example the flush handle of a toilet. A simple algorithm, called parity testing, for determining if a point is inside a closed polygon can be helpful for this purpose.
3.2.1 Parity Testing
A line drawn from one of the vertices (v) of the polygon to the point (p) called (vp), and the angles from the previous line segment to (vp) and to the next seg-ment (α and β, respectively) are calculated. The number (n) of times the line (vp) intersects the polygon is counted.

15
v
p
β
α
v
β
α
p
a) b)
Y
c)
a2a1
)LJ�����3DULW\�WHVW�IRU�GHWHUPLQLQJ�LI�D�SRLQW�LV�LQVLGH�D�SRO\JRQ��
The point p is inside if:
� α < β and n = 0 or even (see Fig. 7a), or
� α > β and n is odd (see Fig. 7b).
The direction of the polygon is important to know, i.e. whether it is drawn clockwise or counter-clockwise, to ensure that the angles are measured within the polygon. This can be determined by comparing the angles from the Y-axis to the previous and next line segments at one of the leftmost vertices (see Fig. 7c), where the polygon is drawn clockwise if a2 > a1.
���� 6KDSH�&ODVVLILFDWLRQ��
When a shape’s components have been identified, it has to be classified so that a building element of that type can be created. This process is very similar to pat-tern recognition: to classify the shape as belonging to some category of a build-ing element by looking at some specific features in the geometry. A feature is an attribute of the shape that characterizes it, for example door symbols usually have rectangular frames at the sides. It is the combination of features that makes the shape unique, and since window symbols also have frames it may require some additional description for them to be able to be distinguished from door symbols.
This means that the features of all shapes that the system is to handle first have to be described in some way in a database. The program must then be able to match the features belonging to a shape in a drawing with the ones in the data-base.
Many shapes of the same type are usually placed on the same layer, e.g. all types of door symbols, but this is not always the case. Most of the sanitary equipment of different kinds is placed on a single layer. This means that using the layer code alone may not be enough to classify the shape, but it can be a great help.

16
3.3.1 Matching layer codes with building element types
To be able to find out what building elements are represented on what layers, a matching or mapping table has to be made. This table can consist of two col-umns: one with the building element name and one with the layer code, as seen in Table 1.
7DEOH����([WUDFW�IURP�WKH�OD\HU�PDWFKLQJ�WDEOH�XVHG�LQ�WKH�VWXG\�
%XLOGLQJ�HOHPHQW� /D\HU�FRGH�
IfcWall A005
IfcWall A030
IfcWall A035
IfcWall A040
IfcWindow A045
The whole table (which can be found in Appendix A) was created in this study and it matches layer codes to building elements found in IFC. Some, but not many, building elements and layer codes could not be matched. Users are al-lowed to create new layers in a drawing that can be named non-restrictive, which also lead to unmatched layers. The table was used in the prototype to find out what type of building element a shape represents, but also the other way around, looking up which layers to search for a specific building element.
3.3.2 Shape classifier using an artificial neural network
Since the layer code alone may not be enough information to unambiguously classify the shape, other features have to be examined too. In this study an artifi-cial neural network was used for this purpose.
There are a number of different types of networks that can be selected for differ-ent problems, but the approach adopted in this research utilizes the basic multi-layer perception, which uses a back propagation algorithm. Then, given a num-ber of input signals, corresponding to the features of a shape, it can calculate the probability for each class that the shape belongs to by analyzing the output sig-nals produced by the weights. Furthermore, the neural net will accept imperfect data and still be able to calculate the likelihood with the other shapes.
A major problem is to define a set of features that any shape can have. It can be difficult to obtain these features from the shape since it can be rotated and scaled in the drawing. This means that a feature cannot be a high level concept, such as ‘has two frames at the sides’ which only applies to a few shapes, neither has ‘an arc above the base line’ any meaning if the shape happens to be upside-down.
The number of input signals must be equal for all shapes, but the value can be zero if the shape does not have that feature. The proposed method utilizes a vec-

17
7DEOH����([DPSOH�RI�WKH�IHDWXUH�YHFWRUV�IRU�WKH�V\PERO�VKDSHV��
/LQH� 3RO\JRQ� $UF� &LUFOH� 2YHUODS� &ROOLQHDU� ,QWHUVHFW� 3HUSHQG� &ODVV�
4 2 1 0 3 0 11 0 NSC.2 1 2 1 0 0 0 3 0 NSC.2 2 2 2 0 0 0 5 0 NSC.2 9 0 1 0 11 3 12 9 NSC.2 2 2 0 0 1 0 4 0 NSC.11 4 3 0 0 2 2 8 0 NSC.11 4 3 0 0 2 2 8 0 NSC.11 6 0 10 0 6 0 12 0 PUB.11 6 0 0 0 0 0 3 2 PUB.41 4 0 10 0 1 0 5 0 PUC.1 5 0 11 1 2 0 3 0 PUE.11 7 0 0 0 7 2 8 8 PUF.1 5 0 0 0 3 0 4 2 XKC.11
tor with 8 features: the number of the geometric primitive types and their spatial relationships. These are all quite easy to determine, they are low-level concepts that can be applied to all shapes and are not dependent on the transformation of the shape.
The feature vectors shown in Table 2 describe the symbol shapes in Fig. 6, where each row represents a symbol. The values have been automatically calcu-lated for each shape found in a template library. Some of the spatial relation-ships are therefore not correct, i.e. the number is affected by errors in the ge-ometry. The last column defines the class that the shape belongs to, and is only provided when training the net. A class can have more then one representation. There are, for example, four types of door symbols (the first four rows in the ta-ble).
The values of the features must be normalized so that they can be compared with each other, which is done by dividing every value with the largest occurrence within each feature.
This method cannot classify shapes that are shaped as nets, such as walls. Fortu-nately, these kinds of shapes are most often placed on separate layers, therefore the need for classifying them is not so big. If needed, they can be further catego-rized according to their properties that are discovered when the shape is inter-preted.
���� 6KDSH�,QWHUSUHWDWLRQ�
The interpretation of a shape can be considered as the process that lifts the se-mantic content of the drawing to a higher level. This is where the different as-pects of an object are analyzed and stored as parametric values.

18
7DEOH����([DPSOH�RI�WKH�DWWULEXWHV�GHILQHG�IRU�D�GRRU�ZLWK�D�VLQJOH�SDQHO��
$WWULEXWH� 'HILQLWLRQ� 'DWD�7\SH�
DoorPanel Reference to a shared Pset defining a panel. Pset_DoorPanel
SwingDirectionIndex Integer index into the enumeration:
� LeftHand
� RightHand
� TopHinged
� NoSwing
IfcInteger
SwingStartAngle As viewed in the ’YZ’ plane of the Door’s LCS, where zero angle is aligned to the positive ’Y’ axis
IfcAngleMeasure
The objects are conceptually defined in a product model, such as the IFC, which means that these definitions will steer the design of the interpretation algorithms. This can only be done manually by understanding what the concept of an attrib-ute of an object is, how it is represented in the shape and finding a way to calcu-late it. The result is, for example, a method to calculate the approximate swing radius of a door panel based on the inner distance between the frames.
3.4.1 Interpreting symbolic building element shapes
Symbolic shapes have in common that they are a group of geometric primitives placed at a specific distance from each other. The detail level of a symbol is de-pendent on the scale used in the drawing, but they are only schematically de-scribing the shape of the building element. They are most usually copied from a symbol template library and can be rotated and scaled. An example of how to design a door symbol recognizer is outlined here.
The definition of a door in the product model is examined first. Table 3 lists just a few of the approximately 50 attributes that can be assigned to a door in IFC 2.0. They are organized into sets of properties, of which some can be shared among several doors, and others are unique to a certain type of door or to one specific instance. The first attribute in the table is a relation to a nested set of properties common in door panels.
Then a study of the available variations of the symbol is made. As can be seen in Fig. 8 the features common to all doors are that they have at least two rectangu-lar frames or jambs, although not always closed. Most have a line representing the door panel starting from one of the innermost corners of a jamb, and some show the panel swing radius as an arc.
)LJ�����$�VHW�RI�V\PEROV�IRU�VLQJOH�SDQHO�GRRUV�

19
A comparison between the information that can be extracted from the drawing and what the product model is able to hold can then be used for determining what concepts the recognition algorithm should search for. In this example a door is defined as an object with two frames that can have a panel, as can be seen in Fig. 9.
Different ways to find these concepts can now be detailed by making observa-tions of the shapes. For example, the centerline can be calculated from a jamb couple, which always consists of a set of short connected lines. A jamb couple can be found by examining the direction of the door panel, which always starts from the inside of one of the frames and has the same length as the distance be-tween the couple. This direction and start point determines the two possible places the other jamb can be located at. The algorithm (depicted in Fig. 10) is then designed.
Door
• Centerline• Startpoint, Endpoint
• Frames (2)• Width• Thickness• Panel (optional)
• Startpoint• Swing radius Centerline Frame
Thickness
Width
Swin
g ra
dius
Panel
)LJ�����7KH�UHSUHVHQWDWLRQ�RI�D�GRRU�XVHG�E\�WKH�GRRU�UHFRJQLWLRQ�DOJRULWKP�
Find all short lines
Geometric type?
Objects in door-layer
Create door representation
ArcsLines
Rectangular polygons
Create frame
Find line starting from corner
Calculate search coordinate
Find closest frame
Find frame?
Yes
No
)LJ������7KH�GRRU�UHFRJQLWLRQ�DOJRULWKP�

20
a) b) c)
)LJ������2WKHU�V\PEROV�WKDW�WKH�GRRU�UHFRJQLWLRQ�DOJRULWKP�FDQ�EH�XVHG�IRU�DUH�GRXEOH�SDQHO�GRRUV�DQG�ZLQGRZV��
The algorithm must be modified slightly to support doors with two panels, seen in Fig. 11a, where the distance between the frames can be calculated as the sum of the length of the door panel lines. It can also be adapted for recognizing the window symbols seen in Fig. 11b and c, where the lines representing the glass panels can be treated as the threshold lines in a door symbol. Unlike doors, win-dows may have more than two frames, which makes it necessary to calculate multiple search coordinates to be able to connect all of them.
3.4.2 Interpreting free form shapes
Walls and other free form shapes, such as pipes and ducts, can be very difficult to recognize. This is mainly due to the fact that they are represented as parallel contour lines with many interruptions, as can be seen in Fig. 12. It is easier to make use of the centerlines when analyzing a net-like structure, but these are seldom given in drawings.
It is also difficult to define where a wall starts and ends, it can have different thicknesses, bend, and be interrupted by other building elements such as inte-grated columns. The definition of a wall segment in this study is the shortest centerline between two points, which can be either a connection to another wall or a termination point.
There are a number of possible ways for walls to terminate and be connected to-gether, which illustrated in Fig. 13. All examples here have perpendicular inter-sections, but it is not rare for walls to meet at any angle.
)LJ������$Q�H[DPSOH�RI�WKH�QHW�OLNH�ZDOO�VWUXFWXUH�LQWHUUXSWHG�E\�RSHQLQJV��

21
a) b) c) d) e) f) g)
)LJ������:DOOV�ZKHUH�WKH�FRQWRXU�OLQHV�WHUPLQDWH�LQ�D��D�GHDG�HQG��E��D�FRQQHF�WLRQ�DQG�F��D�MRLQ��PDNH�D�EHQG��G��DQG�LQWHUVHFW�ZLWK�RWKHU�ZDOOV��H�J����
The algorithm used here is designed to trace wall segments in a number of steps, as can be seen in Fig. 14. The steps can be described as:
a) Begin with the starting points of two overlapping contour lines, calculate the search direction (parallel to the lines) and find all intersections posi-tioned linearly in that direction.
b) Create a temporary centerline from the start points, and find the closest in-tersecting line in the search direction.
c) Find the endpoints, which are the two closest intersections in the search direction. All the different ways in which a wall can terminate or be con-nected have to be considered when calculating the termination of the cen-terline.
d) Construct a wall segment up to the centerline of the connecting wall (or termination point) by creating two connection points between the contour lines.
e) Find pairs of intersections between the start and end points.
f) Create a new connection and repeat the process from a) starting from the pairs, or if the connecting segment has already been recognized, attach an existing wall connection.
The algorithm is outlined in Fig. 15. It can be started either from a corner of the building or from a centerline of a door or window. It will recursively search for other walls that are connected to that segment.
This process must run in parallel with the one of linking meeting-wall segments together to avoid creating duplicate connection points. The decision where to start searching for a new wall segment must take into account that another seg-ment may already be defined at that position. This makes it necessary to keep track of what contour lines and intersections are already in use and what connec-tions are available. One way to do this is by having bi-directional pointers be-tween the connections and the intersections, which in turn have pointers to the contour lines.

22
a)
b)
c)
d)
e)
f)
)LJ������$Q�H[DPSOH�RI�FUHDWLQJ�ZDOO�VHJPHQWV�LV�VKRZQ�VWHS�E\�VWHS���7KLQ�OLQHV�DQG�FLUFOHV�GHQRWH�H[LVWLQJ�FRQWRXU�OLQHV�ZLWK�LQWHUVHFWLRQV��DQG�WKLFN�OLQHV�DQG�FLUFOHV�UHSUHVHQW�WKH�FUHDWHG�ZDOO�VHJPHQWV�DQG�FRQQHFWLRQ�SRLQWV��
Corner of building
Find start points
No
Yes
Create centerline In search direction
Create segment to termination
point
Find first line intersecting with
centerline
Create termination point
• Dead end• Bend • Connect • Join
Calculate search direction
Find all intersections in search direction
Intersection pairs between start and termination points
Already a connection?
Create connection at centerline
Attach connecting segment
Examine termination
Bend
Centerline of door or window
)LJ������7KH�ZDOO�UHFRJQLWLRQ�DOJRULWKP��

23
The algorithm described above does not support walls with variable thickness, but the implementation of it in the prototype described later, does handle cases where the contour lines are not all collinear. This is done for error tolerance rea-sons, and will produce results like those in the first case here. There are other examples of unsupported types of walls, like curved walls and walls with Y-junctions, but the focus here has been to deal with net-like structures.
Walls can have variable thickness, which causes trouble when using a centerline to represent them. If the centerline is drawn between the midpoints of the end-points, as can be seen in Fig. 16a, it can become sloping. If, on the other hand, it is constructed as in Fig. 16b, parallel and between the endpoints of the wall, it may become non-centered or even stretch to the outside of the wall. The best way is probably to divide the wall into segments, as illustrated in Fig. 16c and connect them with a logical relationship.
There are several approaches to finding the pair of parallel contour lines that be-long together, which may not be obvious. One is to start with a door symbol since it can be expected to be located near the termination line of two wall seg-ments. Another is to use the exterior walls as a basis and then search on the in-side for the first pair of intersections. It should be safe to say that a wall is exte-rior if it is, for example, the left-most of all walls. And as soon as a wall that does not stop in a dead end is found, its connections can be used for searching for more segments in other directions.
The representation of openings for doors and windows is also related to wall recognition. They can be illustrated in several different ways, shown in Fig. 17. The point is that there is a wall around the hole that should be connected to the other segments. There is almost always a piece of wall above a door, and also under a window, although there is no height information in the floor plan draw-ings. One way is to let the wall have the same height as the other walls, and later, when the geometry of the thing placed in the opening is found, the opening can cut a hole in it.
a) b) c)
)LJ������:DOO�ZLWK�YDULDEOH�WKLFNQHVV��ZD\V�WR�UHSUHVHQW�WKH�FHQWHUOLQH���
a) b) c)
)LJ������&RPPRQ�ZD\V�GR�GHVFULEH�RSHQLQJV�LQ�ZDOOV��D��ZLWK�EURNHQ�FRQWRXU�OLQHV��E��ZLWK�VROLG�FRQWRXUV�DQG�F��ZLWKRXW�FRQWRXU�OLQHV���

24
Based on experience of the errors that can be found in the wall layers, i.e. lines that are not completely parallel, are poorly connected or are simply garbage, there has to be a decision as to when to stop searching for more wall segments. The errors are mainly due to human mistakes when the walls were created in the drawing; it is not always possible for the CAD system to create such complex systems of walls.
���� &UHDWH�UHODWLRQVKLSV�
When all objects that have a graphical representation are recognized their rela-tionships can be analyzed. Other, logical or implicit objects are then created linking the structure together. These can be openings that are not explicitly drawn but indicated by a door positioned in a wall.
Rooms and spaces are not usually indicated other than with a room label, but can be derived from the surrounding walls. An algorithm such as the one de-scribed in Chapter 2.4 can be used for this purpose; furthermore, it can be im-proved by taking advantage of the walls’ centerlines (created by the method de-scribed in 3.4.1) that form a closed net of polygons. Or even better, it can be used for cross-checking that the walls are recognized correctly. It has a few other weaknesses since it assumes that every room has exactly one label, but this is not always the case in practice. It is common practice to place a label with a connection line outside a room if it is very small and so the room would appear to have no label. On the other hand, if the rooms are divided by a virtual bound-ary and not by a physical wall, there would appear to be two labels in the same room.
3.5.1 Recognizing rooms
The method used in this study for recognizing rooms is based on the idea that every room in the building has at least one opening. It is the doors that connect two rooms together, which means that for every door there is a room, or the out-side, behind it.
However, some rooms may have several doors leading to it. The concept of opened and closed doors is therefore used to protect the algorithm from finding the same room twice or from exiting the building. All doors are marked as closed at the beginning and are opened before the algorithm passes through them. Only closed doors are then used to search for new rooms.

25
Trace wall centerlines clockwise
Find closed doors
Open every door
Go inside every door
Create room
)LJ�� ���� $Q� LOOXVWUDWLRQ� RI� KRZ� WKH� URRP� UHFRJQLWLRQ� DOJRULWKP� JRHV� WKURXJK�HYHU\�GRRU�LW�FDQ�ILQG�LQ�WKH�EXLOGLQJ��VWDUWLQJ�IURP�WKH�RXWVLGH��
The algorithm starts searching for doors from the outside of the building, goes through every door it finds and traces the wall centerlines clockwise, creating a closed polygon. For every door on these walls the algorithm is repeated recur-sively, as can be seen in Fig. 18. Some floors above the ground may not have doors to the outside; the algorithm can then be started in two directions from any door on the inside.
If a wall terminates in a dead end the algorithm must trace back one or more steps until it finds a connecting wall that leads away from the end. This requires a well designed program since there is a risk that it goes into an endless loop, or traces all the way back to the starting point.
There are a few exceptions where this algorithm would not work, for example where the only access to a room is through a vertical opening such as a staircase. Also, there may not be access to atriums above the first floor.
���� )LQDOL]LQJ�WKH�SURGXFW�PRGHO�
A floor plan drawing usually contains other information besides building ele-ments, such as grid lines. Columns, for example, are usually placed at gridline intersections and can be used too for cross-checking that the recognition process has been successful. Cross-checking would, however, mean that any differences found would have to be analyzed and force the whole object model to be up-
26
dated, a task that should be implemented in a full-scale system but was consid-ered outside the scope of this study.
Other examples are dimensioning measure symbols that can be used for check-ing the drawing unit, which is useful since most CAD systems store the geome-try without units, and also the north direction arrow determining the rotation of the building.
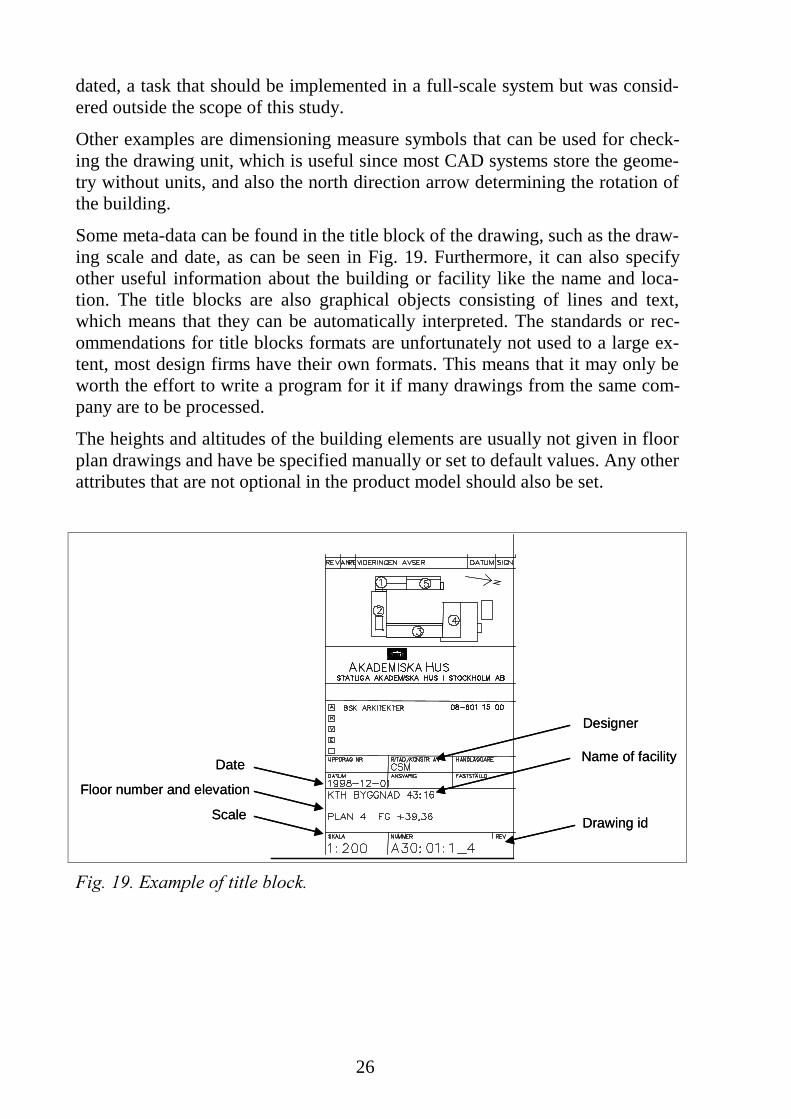
Some meta-data can be found in the title block of the drawing, such as the draw-ing scale and date, as can be seen in Fig. 19. Furthermore, it can also specify other useful information about the building or facility like the name and loca-tion. The title blocks are also graphical objects consisting of lines and text, which means that they can be automatically interpreted. The standards or rec-ommendations for title blocks formats are unfortunately not used to a large ex-tent, most design firms have their own formats. This means that it may only be worth the effort to write a program for it if many drawings from the same com-pany are to be processed.
The heights and altitudes of the building elements are usually not given in floor plan drawings and have be specified manually or set to default values. Any other attributes that are not optional in the product model should also be set.
ScaleDrawing id
Date
Floor number and elevation
Designer
Name of facility
ScaleDrawing id
Date
Floor number and elevation
Designer
Name of facility
)LJ������([DPSOH�RI�WLWOH�EORFN���

27
�� 7+(�352727<3(�
7KLV�FKDSWHU�JLYHV�DQ�RYHUYLHZ�RI�WKH�LPSOHPHQWDWLRQ�RI�WKH�DOJRULWKPV�LQ�D�SUR�WRW\SH�FDOOHG�&$'352��$�GHVFULSWLRQ�RI�WKH�PRGHOLQJ�ODQJXDJHV��WKH�VRIWZDUH�FRPSRQHQWV�DQG�V\VWHP�DUFKLWHFWXUH��DQG�ILQDOO\�WKH�SURJUDP�IORZ�VKRZV�KRZ�LW�LV�RSHUDWHG��
���� ,QWURGXFWLRQ�
The prototype has been developed and redesigned several times during this pro-ject. The code base consists today of approximately 5000 manually written lines of code and uses four other commercial software libraries. The prototype has lit-tle user interaction, but there are extensive debugging and error tracing functions in the form of logs and messages.
���� 6RIWZDUH�FRPSRQHQWV�
An overview of the software components used in the prototype can be seen in Fig. 20, and are described in more detail below. The geometric entities in the CAD drawings are read through AutoCAD and processed further in the proto-type. The result is stored in an IFC 2.0 compatible product data model.
AutoCAD CADPRO
Layermatchingdatabase
NeuroSolutions
Symbol feature
database
IFC Toolbox IFC 2.0model
CADdrawing
)LJ������6FKHPDWLF�YLHZ�RI�WKH�VRIWZDUH�FRPSRQHQWV�XVHG�LQ�WKH�SURWRW\SH��7KH�IRXU�DSSOLFDWLRQV�DQG�GDWDEDVHV�DUH�UHSUHVHQWHG�E\�ER[HV�DQG�EDUUHOV�UHVSHF�WLYHO\��

28
The flow of processes used in the prototype for recognizing information in a floor plan drawing can be outlined as:
1. Read the CAD drawing, retrieve geometric entities in each layer
2. Gather general drawing information, such as scale, base altitude and layering convention
3. Recognize symbols
a. Identify geometry composing the symbol
b. Classify symbol as one building element type
c. Recognize the attributes of the building element
4. Recognize walls from the doors and windows
5. Connect walls, join straight segments and openings
6. Recognize rooms by tracing wall centerlines clockwise to closed polygons
7. Place building elements in opening or room
8. Check and store product model
4.2.1 AutoCAD 2000 and ObjectARX
AutoCAD 2000 by Autodesk Inc come with an object-oriented API called Ob-jectARX, which gives access to the drawing database, geometry library and tools for building user interfaces. It is mainly used by other software companies to build third-party components and solutions to AutoCAD.
An alternative could have been to use the OpenDWG Toolkit for reading DXF (Drawing Exchange Format) and DWG (Drawing) files. It does not require AutoCAD to be present. However it was only provided as C libraries. Some geometric library other than ObjectARX had to be usedinstead, such as Java 3D by Sun Microsystems or the Heidi Toolkit from AutoDesk. However, linking different libraries can be problematic, especially if different programming lan-guages are used.
4.2.2 Layer matching database
The layer matching database contains both the layer codes used by the POINT 4 application suite (from the Swedish CADPOINT AB) and the building element types in IFC 2.0 (IAI, 2000). A full listing of the mapping table can be found in Appendix A. Only layers from the architecture domain, matched against 15 types of building element, were used in the prototype.
The POINT 4 layer convention has dominated for about 10 years in Sweden, and is closely related to the national classification system BSAB 83. The encoding

29
format is a letter, representing the domain, followed by three digits for the type of building element. Optionally, letters specifying the material, the projection or special meaning can be appended. There are about 500 layer codes, making a total of just under 900, including the different variations.
4.2.3 NeuroSolutions 3
NeuroSolutions 3 is a product from NeuroDimensions Inc. in Florida, US. It supports a range of neural networks, including modular and recurrent networks and the basic multi-layer perception. The software provides an easy to use GUI and a tool for generating code in C++ that can be used in external programs.
An example of how a symbol is classified can be seen in Fig. 21. The test data is read and processed by clicking a few buttons and the training process can be watched in the small window titled “Active cost” as a graph of the error. By go-ing through the samples in the training set, both the input signals (representing the features of a symbol) in the window “Activity of inputAxon” to the left, and the output signals (how much the symbol resembles one of the shapes in the class) in the diagram “Activity of outputAxon” to the right can be viewed.
)LJ�� ���� $� VFUHHQ� GXPS� VKRZLQJ�1HXUR6ROXWLRQV�PDLQ� ZLQGRZ�� ,W� FRQWDLQV� D�JUDSKLFDO�UHSUHVHQWDWLRQ�RI�WKH�QHXUDO�QHW�ZLWK�V\PEROV�VKRZLQJ�V\QDSVHV��WKH�FRQQHFWLQJ� OLQHV�� DQG� D[RPV� �VSKHUHV�� DQG� VHYHUDO� GLIIHUHQW� W\SHV� RI� FRQWUROV�DQG�LQVSHFWRUV�IRU�YLHZLQJ�GDWD��

30
4.2.4 Eurostep IFC Toolbox 2.0
A software library for generating IFC 2.0 compliant files was provided by Eu-rostep AB. This toolbox contains the functionality for creating and accessing the instances of the EXPRESS schema directly using a so-called early bound tech-nique, which means that the library has classes with attributes that correspond to every type in the schema (Eurostep, 2000).
Other EXPRESS databases include ST-Developer (STEPTools Inc) and the Ex-press Data Manager (EPM Technology AS). Both use the late binding approach, which adds an abstraction level between the software and the database. This makes it possible to replace the database and easier maintenance of the underly-ing schema, but requires more advanced programming.
���� 6RIWZDUH�PRGHOLQJ�DQG�SURJUDPPLQJ�ODQJXDJHV�
4.3.1 Programming Language
The programming language for implementing the prototype had several re-quirements, including fast execution and good memory management, but also to be compatible with the other software components. C++ has these features and supports, in addition to ANSI C, object-oriented design (Lippman, 1995).
There are several supplementary components that add to the functionality of standard C++. These include the Standard Template Library (STL) and Micro-soft Foundation Classes (MFC). Both MFC and STL have classes for file han-dling, vector manipulation (strings, lists and hash tables) and exception han-dling, but MFC has also components for user interface and database connec-tions.
Unfortunately, there is no formal graphical specification counterpart for C++, such as diagraming, although there are several proposed. Instead, the specifica-tion of the system architecture and classes are shown here in the Unified Model-ing Language (UML).
4.3.2 Software Modeling Language
The Unified Modeling Language is a combination and extension of several other methods to describe software analysis and design (Booch et al, 1999). It follows the object-oriented paradigm and has support for the entire life cycle of a soft-ware program. The information is specified in a few different types of diagrams and views; only class diagrams are used here since the prototype has a rather simple structure where most of the functionality is embedded in the code itself rather than in the structure. Fig. 22 provides an explanation for the symbols used to describe the prototype.

31
ClassName
attribute : type
operation( )
Package Name
Subclass
Class OtherClass
1..*1..*
a) b) c)
)LJ������7KH�V\PEROV�XVHG�LQ�WKH�FODVV�GLDJUDPV�DUH��D��WKH�FODVV�LWVHOI�ZLWK�DW�WULEXWHV�DQG�RSHUDWLRQV��E��WKH�FODVV�UHODWLRQVKLSV�LQKHULWDQFH��WULDQJOH��DQG�DJ�JUHJDWLRQ��GLDPRQG��DQG�F��WKH�SDFNDJH�V\PERO��7KH�SDFNDJH�LV�D�FRQWDLQHU�IRU�FODVVHV�DQG�LV�XVHG�WR�RUJDQL]H�WKH�FRGH�LQWR�ORJLFDO�XQLWV��
4.3.3 Data Modeling Language
IFC is defined with the EXPRESS language, which is a part of the suite of stan-dards developed within the ISO STEP (ISO, 1992). It is a conceptual language where entities and their relationships as well as rule clauses for the possible states of a model can be defined. Currently, only a static view of a model can be defined, i.e. modeling the dynamic behavior is not supported by EXPRESS (Schenck and Wilson, 1994).
EXPRESS-G is the graphical representation of EXPRESS. An overview of data types and relationships used in the EXPRESS-G notation can be seen in Fig. 23.
One other part of STEP that is related to EXPRESS is the exchange file format used in this project, defined in Part 21 (ISO, 1993). It is an early bound ASCII format for which parsers can be automatically generated based on the EXPRESS schema. An example IFC file can be found in Appendix B.
Basic Type
Subtype
relation >
•NUMBER•INTEGER•REAL•STRING•BINARY•BOOLEAN•LOGICAL
optional
aggregate [0:?]Enumeration Type
(< inverse)
List of applicable values
underlying
one of [1:?]Entity Type any type
Defined Type
Select Type
•SET•LIST•BAG•ARRAY
Basic Type Basic Type
Subtype
relation >
•NUMBER•INTEGER•REAL•STRING•BINARY•BOOLEAN•LOGICAL
optional
aggregate [0:?]Enumeration Type Enumeration Type
(< inverse)
List of applicable values
underlying
one of [1:?]Entity Type any type
Defined Type
Select TypeSelect Type
•SET•LIST•BAG•ARRAY
)LJ������2YHUYLHZ�RI�WKH�(;35(66�*�QRWDWLRQ�

32
���� 6\VWHP�DUFKLWHFWXUH�
4.4.1 System overview
The CADPRO prototype uses the system architecture composed of the five packages seen in Fig. 24, described in detail below.
CAD ConvertingTools ProductModel
Application
GeometricUtility
)LJ�� ���� 2YHUYLHZ� RI� SURWRW\SH� LPSOHPHQWDWLRQ�� 'HSHQGHQFLHV� EHWZHHQ� SDFN�DJHV�DUH�VKRZQ�DV�DUURZV��
4.4.2 Application Package
The application package exposes the following commands to a user:
� Extract Features: executes a symbol recognizer that will identify and store the features found in a symbol currently open in AutoCAD.
� Match Layers: enables the user to browse the layers.
� Recognize Drawing: starts the main recognition process of a drawing.
� Store Product Model: saves the objects that have been recognized on disk.
The package (shown in Fig. 25) also provides links to the external applications through &1HXUDO1HW (to NeuroSolutions) and &3URGXFW0RGHO�(to IFC Toolbox).

33
CDrawing
(from CAD)
CProductModel
Store( )AddObject( )
CLayerMatch
(from ConvertingTools)
CSymbolRecognizer
(from ConvertingTools)
CShapeRecognizer
(from ConvertingTools)CNeuralNet
Classify( )Connect( )Disconnect( )
CCadproApp
ExtractFeatures( )MatchLayers( )RecognizeDrawing( )StoreProductModel( )
)LJ������7KH�$SSOLFDWLRQ�3DFNDJH�H[SRVHV�WKH�FRPPDQGV�WKDW�FRQWURO�WKH�UHFRJ�QLWLRQ�SURFHVV��7KH�DSSOLFDWLRQ�REMHFW�DOVR�PDLQWDLQV�OLQNV�WR�WKH�GDWDEDVHV�DQG�H[WHUQDO�SURJUDPV��
4.4.3 CAD Package
The CAD Package, illustrated in Fig. 26, describes the prototype’s view of a drawing database. It contains basic functionality for reading the geometric and layer tables, and supports four types of geometric primitives: arcs, bounded line segments, polygons and text.
CArc
m_center : Pointm_radius : doublem_startAng : doublem_endAng : double
CText
m_position : Pointm_text : CString
CPolyline
m_vertices : Point[]m_closed : bool
Close( )
0..*
CDrawing
m_scale : int
Read( )ReadLayerTable( )ReadGeometry( )FindScale( )
0..*
CGeometricEntity
m_id : longm_checked : bool
transformBy( )IsIntersecting( )IsColinear( )IsOverlapping( )GetClosestColinear( )GetClosestOverlap( )
CLayer
m_name : CStringm_id : long
0..* 0..*
CLine
m_start : Pointm_end : Point
)LJ������7KH�&$'�3DFNDJH��ZKHUH�D�GUDZLQJ�FRQWDLQV� OD\HUV��ZKLFK�FRQWDLQV�JHRPHWULF�HQWLWLHV��DUFV��OLQHV��SRO\�OLQHV�DQG�WH[W���

34
4.4.4 Converting Tools Package
The main functionality of the prototype is built into the Converting Tools Pack-age, seen in Fig. 27. It contains the recognizer classes, which are components that generate objects found in the Product Model package: one each for rooms, walls, windows and doors. There is also a symbol recognizer that can identify and extract the features of a symbol. A layer matching component provides the functionality to parse a layer name, query it in classification tables and discover what building element it corresponds to.
CWall
(from ProductModel)CWallRecognizer
CRoom
(from ProductModel)CRoomRecognizer
CDoor
(from ProductModel)CFrameRecognizer
CWindow
(from ProductModel)CWindowRecognizer
CShapeRecognizer
Recognize( )CreateRelationships( )
CNeuralNet
(from Application)
CSymbolRecognizer
ExtractFeatures( )StoreFeatures( )IdentifySymbol( )
CFeatureVector
nLines : integernPolys : integernArcs : integernCircles : integernCollinears : integernIntersections : integernParallels : integer
CBuildingElement
(from ProductModel)
CLayerMatch
m_matchingtable : HashTable
MatchLayers( )LookupBuildingElement( )LookupLayer( )
CDoorRecognizer
CLayer
(from CAD)
CSpatialRelationship
(from GeometricUtility)
CSymbol CGeometricEntity
(from CAD)
CSymbolClassifier
ClassifySymbol( )
)LJ�� ���� 7KH�&RQYHUWLQJ� 7RROV�3DFNDJH��ZLWK� WKH� UHFRJQL]HU� FRPSRQHQWV�� WKH�V\PERO�FODVVLILHU�DQG�WKH�OD\HU�PDWFKHU��

35
4.4.5 Geometric Utility Package
Mechanisms for geometric analysis are implemented in the Geometric Utility Package, seen in Fig. 28, such as convex hulls (bounding polygons) and polygon tracers.
CIntersectingm_connection_typem_point : Pointm_angle : double
CParallel
CPolylineTracer
Trace( )
CConvexHull
CreateHull( )
CParityTest
IsPointInside( )
CPolyline(from CAD)
CColinearhorizontal_distance
COverlapvertical_distance
CGeometricEntity
(from CAD)CSpatialRelationship
)LJ������7KH�*HRPHWULF�8WLOLW\�3DFNDJH�FRQWDLQV�VSDWLDO�UHODWLRQVKLSV�DQG�WRROV�IRU�ZRUNLQJ�ZLWK�SRO\JRQV��
Two kinds of spatial relationships between two line segments are defined: paral-lelism and intersection. A parallel relationship is created with the perpendicular distance between the lines (which becomes zero if the lines are collinear) and the overlapping length, see Fig. 29a. Intersection relationships are created hold-ing the intersection point and the angle between the lines, which can be used for checking for perpendicular lines, see Fig. 29b. The lengths l1 and l2 are defined as the shortest parts of the line from the intersection point, and are used to de-termine the type of connection (intersection, touching or joining).
distance angle
l1
l2
a) b)
overlap
distance angle
l1
l2
a) b)
overlap
)LJ������7KH�VSDWLDO�UHODWLRQVKLSV�D��SDUDOOHO�DQG�E��LQWHUVHFWLRQ��

36
4.4.6 Product Model Package
The Product Model Package seen in Fig. 30 specifies each of the supported enti-ties in IFC 2.0. The class CProductModel acts as a container for all the building elements and also makes sure that the model stored is correct, including generat-ing information that is given implicitly in the drawing, e.g. the floor plan in a building.
0..*CProductModel
Store( )AddObject( )
(from Application)
0..*
CBuildingElementclassification
Store( )Show( )
1..*
CBuildingStoreyaltitude
0..*
0..*
CRoomarea
1..*
CWallConnectionconnection_point
CWallcenterline
CWindowframesglass_panels
COpening
CDoorframesswing_radiusisClosed
)LJ�� ����7KH�3URGXFW�0RGHO�3DFNDJH��$�SURGXFW�PRGHO� FRQWDLQV�D�QXPEHU�RI�EXLOGLQJ�HOHPHQWV��
���� 8VHU�LQWHUIDFH�
A graphical user interface was developed for demonstrating the prototype. It in-teracts with the components defined in the system architecture above through four simple dialogs shown in Fig. 31.
The first dialog is gathering general drawing information such as name and scale, next is the layer matching tool that the user can use to browse and show groups of layers. After that comes the dialog for identifying and classifying symbolic shapes, which are displayed as groups of shape types and the result of the classification. Finally there is a dialog for recognizing building elements, displaying them in the drawing window and exporting them to an IFC file.

37
There is little user interaction besides browsing capabilities in the interface. It is more a way to go through the process and see the results.
a) b)
c) d)
)LJ������7KH�IRXU�GLDORJV�LQ�WKH�JUDSKLFDO�XVHU�LQWHUIDFH��

38

39
�� 5(68/76�
7KLV�FKDSWHU�SUHVHQWV�WKH�UHVXOWV�RI�LPSOHPHQWLQJ�DQG�WHVWLQJ�WKH�PHWKRGV��%RWK�VPDOO�VDPSOHV�DQG�ODUJHU�FRPPHUFLDO�GUDZLQJV�ZHUH�XVHG�KHUH� WR�LGHQWLI\�WKH�ZHDNQHVVHV�RI�WKH�PHWKRGV��
���� ,PSOHPHQWLQJ�WKH�PHWKRGV�
The algorithms were implemented in the prototype while developing them on a small sample drawing. They had to be continuously updated and improved to cover all the different variations of the shapes that were discovered, until they finally performed satisfactory.
5.1.1 Developing shape identification
The shape identification program is very time consuming since it checks every geometric entity for a certain spatial relationship to any other entity in the cur-rent layer. The prototype implementation was tested to search for four types of spatial relationships, seen in Fig. 32.
Simple symbols could be identified if the geometry was connected end to end, but is the method was too restrictive for more complicated symbols, such as the toilet representation. The touching relationship method was found the most use-ful, since it includes the end-to-end relationship and also any entities along the geometry, although it makes it necessary to do the checks twice, once for each entity. Intersections in general resulted in too many entities that actually be-longed to different shapes. An example of the result of using touching relation-ship for shape identification can be seen in Fig. 33.
The containment relationship was used in parallel to the other relationships to combine shapes that were totally inside each other. This was implemented by creating convex hulls around the shapes and using the parity test described in 3.2.1, and was found useful when the shapes consisted of many entities. The convex hull described the bounding polygon around a shape, and required at least two entities (arcs were treated as lines).
a) b) c) d)
)LJ������6SDWLDO�UHODWLRQVKLSV��D��&RQQHFW��E��7RXFK��F��,QWHUVHFWLRQ�DQG�G��&RQ�WDLQPHQW�

40
)LJ������6KDSH�LGHQWLILFDWLRQ�E\�ILQGLQJ�WRXFKLQJ�UHODWLRQVKLSV��GDUNHU�OLQHV�UHS�UHVHQW�WKH�UHVXOWLQJ�FRQYH[�KXOOV�DURXQG�WKH�V\PEROV��
There is a possibility of adjusting a global tolerance setting in the prototype, which will affect every query as to whether two points are in the same position. The default setting is 1-10, which is the maximum distance between two points such that they can be considered as the same. In the same way there is a setting for deciding whether vectors are equal, parallel or perpendicular.
Since the drawings used here did not contain many arcs, which may need a lower tolerance to be able to find the approximate intersections, the default set-ting was used. There were a few errors in the test drawings regarding lines that apparently was supposed to be connected, but had a five millimeters gap be-tween them. However, setting the tolerance to such a value would in turn give many intersections that were not intended.
5.1.2 Developing shape classification
The drawings used for developing the method contained a lot of symbols but only a few different types. This fact was used for speeding up the process by re-ducing the number of queries to the neural network. A simple hash table indexed the different types uniquely, and each of these was then classified.

41
)LJ������7KH�6\PERO&ODVVLILFDWLRQ�FRPSRQHQW�H[WUDFWV�WKH�IHDWXUHV�RI�D�V\PERO�DQG�FRPPXQLFDWHV�WKURXJK�DQ�2/(�LQWHUIDFH�WR�1HXUR6ROXWLRQ�DQG�GLVSOD\V�WKH�UHVXOW�LQ�D�PHVVDJH�ER[���
As can be seen in Fig. 34 the component has successfully classified a toilet symbol by communicating with the NeuroSolutions applications OLE interface. The data sent through this interface will pass through the network and result in a vector containing the probability for what type of building element the symbol represents. The most plausible class of these (if any) is then displayed in the message box; in this case it is a PUE.11 (Floor-mounted toilet).
The question of what probability is required to safely say what class a shape be-longs to depends on the number and the similarity of shapes the network can dif-ferentiate between. A reasonably high probability, 0.7, was used in the prototype since there were few shape types.
5.1.3 Developing shape interpretation
Interpreting the building elements involves a lot of line and polygon tracing, which was found error prone and hard to debug. The whole set of algorithm de-signs was rewritten a number of times before they performed satisfactorily. This

42
)LJ������7KH�FHQWHUOLQHV�LQVLGH�WKH�ZDOOV�DUH�WKH�UHVXOW�RI�WKH�ZDOO�UHFRJQLWLRQ�DOJRULWKP��6PDOO�FLUFOHV�UHSUHVHQW�FRQQHFWLRQ�UHODWLRQVKLSV�EHWZHHQ�WKH�ZDOOV��
was due to the many different shape variations and that the drawing contained some errors in the form of floating point approximations. An example of a suc-cessful recognition can be seen in Fig. 35.
5.1.4 Developing creation of relationships
Logical relationships were created after each step of the shape interpretation al-gorithms. The room recognition algorithm then used them for deriving the shape of the areas. The result is heavily depending on the correctness of the relation-ships and that no building elements are missing. But if the walls have been rec-ognized accurately the result is a set of completely closed polygons. Fig. 36 shows the room polygons traced from the walls in the example above.
)LJ������+DWFKHG�DUHDV�LQVLGH�SRO\JRQV�LOOXVWUDWH�WKH�UHVXOW�RI�WKH�URRP�UHFRJQL�WLRQ�DOJRULWKP��7KH�KDWFKLQJ�ZDV�GRQH�PDQXDOO\�DIWHUZDUGV�IRU�FODULILFDWLRQ��

43
���� 9DOLGDWLRQ�RI�WKH�PHWKRGV�
Three typical floor plan drawings were used to validate the methods. The draw-ings were provided by the reference group and are of varying degrees of com-plexity and size.
All building elements in the drawings had to be counted manually in order to check what the correct result should be. The errors, including both unrecognized and falsely recognized objects, were identified by visualizing the result of each test overlaid on the original drawing.
The result of the tests is summarized in Table 4. It should be noted that the room recognition program failed in every test drawing to complete a loop around the external walls, since not all walls could be found. There was therefore no point in continuing with the walls inside since this would lead to the trace disappear-ing on the outside. Only the first drawing contained symbols other than doors and windows on layers that were matched.
The tests were conducted on a PC with a 300MHz processor and 50 MB free RAM memory. As can be seen in Table 5, the performance deteriorates if the drawing contains many geometric primitives. This is mostly because the symbol identification has to examine every primitive against each other. Even so, the processing times can be considered moderate, although the implementation of the algorithms has not been optimized and contains a lot of debugging code.
The result from the tests is displayed in the figures below as the 3D representa-tion of the recognized walls, with holes for doors and windows, overlaying the original drawing. All heights are set manually to a default value. An error num-ber over a vertical line is also shown here whenever the algorithm finds an unre-coverable exception or cannot determine how to continue, which can be looked up in a log file for analysis.
7DEOH����2EMHFWV�UHFRJQL]HG�LQ�WKH�WHVW�GUDZLQJV�
5HFRJQL]HG�REMHFWV� 'UDZLQJ��� 'UDZLQJ��� 'UDZLQJ��� $YHUDJH�
Doors 26 (84%) 52 (83%) 25 (81%) 82%
Windows 13 (100%) 51 (96%) 191 (88%) 95%
Symbols 50 (83%) - - 83%
Walls 113 (84%) 271 (63%) 310 (65%) 71%
Rooms - - - -
7DEOH����3URFHVVLQJ�SHUIRUPDQFH�
� 'UDZLQJ��� 'UDZLQJ��� 'UDZLQJ���
Processing Time (sec) 3,1 32 178
Processed Primitives 1120 2602 8341
Performance (primitive/sec) 361 81 47

44
5.2.1 Test drawing 1
The first test drawing is from an apartment building that contained about 104 symbols of which 80 were successfully identified, 10 were incorrectly grouped together and the remaining symbols consisted of unconnected geometry. The re-sult can be seen in Fig. 37 as the darker lines around the symbols. The convex hull algorithm used for displaying the identified symbols had problems with finding the correct vertices in the group due to floating point approximations, but this has no direct effect on the classification or interpretation.
It was discovered that the symbols for cabinets were drawn without lines near walls, this is why some cabinets are not shown as rectangles here, but with some kind of polygon. They were not classified correctly, since they were grouped to-gether.
)LJ�����7HVW�GUDZLQJ����6\PERO�LGHQWLILFDWLRQ���

45
One of the major difficulties in the drawing is that some of the walls are of vari-able thickness. This leads the wall recognition algorithm to assume that the wall bends, but to fail to find the right continuation of that bend. There are also a few types of wall connections that were not expected. This can be seen in Fig. 38 at error 47 close to the lower left corner, where a thicker wall is connected to the end of a thinner wall, which produces a situation where two intersecting rela-tionships are placed at the same location connecting different lines.
The small balconies were also found to be confusing since they were interpreted as the walls that the doors leading out of the room were connected to. The walls inside the larger balconies look as if they are broken, which is a result of thein-ability of the algorithm to calculate the centerline correctly where the door and window meet.
)LJ������7HVW�GUDZLQJ����5HVXOW�RI�VKDSH�LQWHUSUHWDWLRQ�

46
5.2.2 Test drawing 2
The second test drawing, seen in Fig. 39, is part of an office building complex. The reason for dividing the complex into several drawings can be to fit the drawings within a certain paper size when they are printed. The problem is that the building will not be completely surrounded by walls, and the room recogni-tion algorithm will not find the rooms.
The door interpretation failed to connect frame pairs of certain types of double panel doors, where the panels were of different lengths. The algorithm only finds frames which are apart by distance of a known single or double panel length. This can be adjusted by finding the closest frame within those distances.
The wall recognition had similar problems to test drawing 1, where some con-nections actually are intersections of three (or more) walls. The algorithm was designed to handle cases where only two walls meet at a point.
)LJ������7HVW�GUDZLQJ����

47
5.2.3 Test drawing 3
Test drawing 3, seen in Fig. 40, is a larger office building with over 100 rooms. Three new types of wall representations were found here:
� External walls were drawn in detail with frames and inside material
� Circular walls around staircases were represented by arcs and not parallel lines
� Internal walls of glass in structural steel frames were drawn on the win-dow layer, together with the doors.
The walls over and under all of the windows in the façade are not shown here because they have zero thickness, which is normally assigned to the thickness of the walls on the side of the window. In this case no external walls were found because of their unexpected representation.
)LJ������7HVW�GUDZLQJ�����

48

49
�� ',6&866,21�
7KLV�FKDSWHU�FRQFOXGHV�WKH�VWXG\�E\�GLVFXVVLQJ�WKH�ILQGLQJV�DQG�WKH�SRWHQWLDO�RI�WKLV�W\SH�RI�VKDSH�UHFRJQLWLRQ��)LQDOO\��VRPH�WRSLFV�IRU�IXWXUH�UHVHDUFK�DUH�SUH�VHQWHG��
���� 6XPPDU\�RI�WKH�ILQGLQJV�
The tests show that the algorithms performed with an average success rate of be-tween 71% and 95%, except for the room recognizer, which could not be tested. It was, however, successful when applied to the sample drawing used when im-plementing the prototype.
Most of the faults found were due to unexpected variations in the shape repre-sentations, but also to errors in the drawings. There were also many examples where geometry had been drawn on layers other than on those defined in the layer-matching table used here.
6.1.1 Shape identification
If two separate shapes are positioned adjacently, which was the case with many windows and cabinets found in the test drawings, there is always a risk that they will be identified together as one shape. Also, if the geometric entities of a shape are not intersecting at all, like the shower symbol used here, there is no way of knowing that they belong together. There is therefore a balance between group-ing too many primitives and too few.
The objectified intersection-relationship between two lines was found difficult to use if more than two lines met at a point. This situation will produce three re-lationships at that point, which confuses algorithms that search for the closest intersections from a point on one of those lines. It can be solved by allowing the relationship to be between more than two geometrical entities, or by introducing a container that holds the actual relationships.
The conclusion is that the shape identification method as described in this study should be adjusted to handle more complex geometry, and that it should be able to selectively use different spatial relationships as appropriate.
6.1.2 Shape classification
The shape classification method was found very useful, but only if the shape was identified correctly. To rule out most of the garbage symbols, the minimum number of geometric primitives identified as a symbol should therefore be set to be higher than two.
It could also be beneficial to use more high-level concepts as features for de-scribing shapes in the neural network. Here the geometrical primitives and their

50
spatial relationships were only separately tested, although with good results, but more high-level concepts may be required in a system with many more shapes. The primitives could then be combined with the relationships, for example, to differentiate squares and boxes from other rectangles.
The neural network approach used here is very flexible to update with new sym-bols, since the feature vectors are very easy to extract. Furthermore, there is the potential to let the net automatically learn new samples during the classification process, but it requires user interaction.
6.1.3 Shape Interpretation
There were many situations where the interpretation algorithms failed to trace correctly, which had consequences for the following objects in the trace stack. They became corrupt, since the algorithm could not calculate the start points or search direction, or completely unrecognized. The list below describes some of these situations:
� If a door was connected directly to the side of a wall, and not to the end as expected, then the wall was traced perpendicular to the correct direction.
� Some windows and doors were connected directly to each other, while the recognition algorithm assumed that they were connected to a wall.
� There were also examples where columns were integrated with walls. The algorithm was not aware of this fact and failed to find the termination line of those walls.
In some cases, for example when searching for doorjambs, it is desirable to search for things with a certain size or distance from something else. It was found to be difficult to use real world measures, since most building elements can be of any size. Walls, for example, are not necessarily longer than they are thick (since they can be over one meter thick at the foundation). The door sym-bol recognition algorithm worked for both single and double panel doors, al-though it failed to recognize sliding doors and when the panels were of different lengths, when the setting for maximum line length for the jambs was 500 mm.
It requires a great deal of work to design the interpretation algorithms so that they will behave as expected, which is a drawback for these kinds of recogniz-ers. It could be solved by a shape description language that could be used to automatically generate some kind of shape parser.
6.1.4 Creation of relationships
The relationships that were validated in the testing were found to work with few exceptions. The only serious fault was that the relationships could not cope with more than one wall being connected at the same point.

51
Unfortunately, the room recognition algorithm was found to be very sensitive to errors in the wall recognition process. Every room had to be completely sur-rounded by walls, or else the trace would either incorrectly go into the next room or disappear to the outside. The conclusion is that the algorithm has to be made more robust. This can be done by defining the extent of the floor plan as the convex hull around the external walls, which would provide a boundary that the trace would never leave. Also, to prevent the program to loop endless it should keep track of how many times each wall is processed. Each wall should only be processed twice, one for each room it separates.
Since rooms are easy to visualize as bounded surfaces, it is relatively simple to manually detect errors. Therefore, provided that the recognition algorithm is sta-ble enough to process all closed rooms, it should be possible to be used in prac-tice.
���� 'LVFXVVLRQ�
The most important finding in this study is perhaps the idea of using a shape classifier for symbols. Depending on the usage of the resulting object model, an appropriate recognizer can then interpret certain objects of interest, or it could even be enough to know what type of building element is located in a certain room without having to identify its properties.
The ultimate recognition system would never go wrong, just point the user to the things it didn’t recognize. Unfortunately, the only way to recognize something is to distinguish it from everything else, which means that a recognizer can never tell if it has found the right shape or one that is very similar that it doesn’t know about. This leads to the conclusion that the more shapes the system can differen-tiate between the better, and that fewer errors will occur if the shapes are de-scribed in greater detail. It is unrealistic to hope that a drawing recognizer can produce a perfect result, since errors can be expected in the drawings. What would make these kind of recognizers still useful is if they were able to ask the user if they became insecure, e.g. when choosing what line to trace next. Cross-validation or examination by a user is required for avoiding errors when the recognizer is incorrectly confident.
The errors found in the test drawings come mainly from rounding of floating-point numbers and the designer. It may seem surprising that machines that can calculate with such great precision still cannot exactly join two arcs. The reason is probably that the drawing file format allows too few decimals to be stored which is worsened when the arcs are rotated and moved in the drawing. The use of symbol templates contained in groups adds to this problem since the geome-try has to be transformed when it is inserted into the drawing. The errors made by the designer has a lot to do with the use of the drawing, i.e. if the drawing looks good when it is printed it doesn’t matter if a few lines are on the wrong

52
layer. This should be seen as a contrast to the logical relationships in a product model, which creates a more robust model of the building.
It was an exhaustive process to develop a shape recognizer, such as one for wall representations, since it includes a detailed understanding of how the shape can be formed and be connected to others. It also requires testing on several case drawings to make sure that the algorithm behaves as expected even in cases where there is noise or errors in the drawing. Since the primary usage of older CAD drawings within facility management concerns spaces and rooms, the key is to recognize the building elements surrounding these spaces. Unfortunately, walls are difficult to recognize with their net-like structure and broken lines to illustrate openings, not to mention that walls can have varying thickness or that curved walls are surprisingly popular. Still, a good wall recognizer is probably worth the effort to program.
There are several benefits from using a neutral product model such as an IFC in-stead of going directly to the target CAD or facility management system. One is that there are and will be many tools that support the data structures, which is excellent for visualizing the result of the recognition. Another is that the pro-gram becomes independent of the target system, if and when it changes.
���� )LQDO�FRQFOXVLRQV�
The result of this study has shown that by applying technology from other do-mains of shape representation and recognition it is possible to convert a layered vector floor plan drawing into a product model.
The final conclusion is that the key to designing a working CAD drawing con-verter for use in practice is above of all robustness, i.e. a high level of error tol-erance. It should also be able to detect an error and either ask the user for guid-ance or select another method for getting around that obstacle. Cross-validation of the results should also be carried out by alternative algorithms to ensure that it can be used for further processing and to improve the quality of the results.
���� )XUWKHU�UHVHDUFK�
The industry’s obvious need for recognizing scanned paper drawings is a chal-lenging task. Poorer results can be expected from such recognition since the ge-ometries can be expected to be less precise and they are not separated by layers. It would be interesting to see how much the shape identifiers and classifiers could filter out, leaving the other recognizers to work more undisturbed.
The language to describe shapes should also be developed. This could mean that interpreters could be automatically configured to parse certain types of building elements, based on the description of a shape in such a language. The use of ge-neric algorithms for doing object recognition in photographs, where the object

53
may be only partially visible, could perhaps also be applied to tracing building elements in floor plan drawings.
If the product model should be stored in 3D geometry the altitudes and heights must be specified some way. One method is by combining the floor plan draw-ings with elevation or façade drawings, which requires that the same object can be identified from two perspectives. There has already been a lot of work carried out for the 3-view mechanical engineering drawings used in the mechanical do-mains, described by Devaux (1995) and others, that could be used for this pur-pose.

54

55
5()(5(1&(6�
Ablameyko, S., Bereishik, V. and Foyer, P. (1997), Recognizing engineering drawing entities: Technology and results, IEE, ,3$��, Conference Publi-cation No. 443, pp 736-740
Al-Timimi, K. and MacKrell, J. (1996), 67(3��7RZDUGV�RSHQ�V\VWHPV, CIMdata Inc.
Augenbroe, G. (ed.) (1995), &20%,1(���)LQDO�5HSRUW, Technical Report, Delft University of Technology, Faculty of Civil Engineering, The Netherlands
Belt, van de, H. (ed.) (2000), ,)&�����0RGHO�0HUJLQJ, Technical Report, Brite Euram Concur project BE96-3016, TNO, Holland
Björk, B-C. (1995), 5HTXLUHPHQWV� DQG� ,QIRUPDWLRQ� 6WUXFWXUHV� IRU� %XLOGLQJ�3URGXFW�'DWD�0RGHOV, PhD thesis, VTT Publication 245, Technical Re-search Centre of Finland, Espoo
Björk, B-C., Löwnertz, K. and Kiviniemi, A. (1997), ,62�',6���������7KH�SUR�SRVHG�LQWHUQDWLRQDO�VWDQGDUG�IRU�VWUXFWXULQJ�LQ�FRPSXWHU�DLGHG�EXLOGLQJ�GHVLJQ, Electronic Journal of Information Technology in Construction, (http://itcon.org), Vol. 2, No. 2 (accessed February 2001)
Babalola, O. and Eastman, M. C. (2000), Working draft paper and discussions at the College of Architecture, Georgia Tech, Atlanta, U.S.A
Booch, G., Rumbaugh, J. and Jacobson, I. (1999), 7KH�8QLILHG�0RGHOLQJ�/DQ�JXDJH�8VHU�*XLGH, Addison Wesley Longman Inc.
Brunelli, R. and Poggio, T. (1993), Face Recognition - Features versus Tem-plates, ,(((�WUDQVDFWLRQV�RQ�3DWWHUQ�$QDO\VLV�DQG�0DFKLQH�,QWHOOLJHQFH, IEEE, Vol. 15, No. 10, pp 1042 – 1052
Cherneff, J., Logcher, M., Connor, J. and Patrikalakis, N. (1992), Knowledge Bases Interpretation of Architectural Drawings, 5HVHDUFK�LQ�(QJLQHHULQJ�'HVLJQ, Springer-Verlag, New York
Crawley, A.J. and Watson, A.S. (eds.) (2000), &,0VWHHO�,QWHJUDWLRQ�6WDQGDUGV��5HOHDVH���The Steel Construction Institute, SCI Publication P265, UK
Devaux, P. M., Lysak, D. B. Jr., Lai, C. P. and Kasturi, R. (1995), A Complete System for Recovery of 3D Shapes from Engineering Drawings, Proceedings from the International Symposium on,� &RPSXWHU� 9LVLRQ, IEEE, pp 145-150
Dori, D. and Tombre, K. (1997), From engineering drawings to 3D CAD mod-els: are we ready now?, &RPSXWHU�$LGHG�'HVLJQ, Elsevier Science Ltd., Vol. 27, No. 4, pp 243-254

56
Haas, W. (1997), 6FRSH�RI�$3����� International Organization for Standardiza-tion, http://www.haspar.de/ap225/scope225.htm (accessed February 2001)
Haugen, T. (1990), %\JQLQJVIRUYDOWQLQJ���NRQRPLVN�GULIW�RJ�YHGOLNHKDOG�±�RU�JDQLVDVMRQ��LQIRUPDWLRQ�RJ�V\VWHP (Facility management: Economic op-eration and maintenance - organization, information and system), Norges Tekniska Høgskole, Trondheim
Herzell, T. (ed) (1993), Redovisning av byggproject (Documentation of con-struction projects), %\JJKDQGOLQJDU� ��, Byggstandardiseringen, Stock-holm
Holst, A. (1997), 7KH�8VH�RI�D�%D\HVLDQ�1HXUDO�1HWZRUN�0RGHO�IRU�&ODVVLILFD�WLRQ�7DVNV, PhD thesis, Dept of Numerical Analysis and Computing Sci-ence, KTH, Sweden
Eastman, M. C. (1999), %XLOGLQJ�3URGXFW�0RGHOV�±�&RPSXWHU�HQYLURQPHQW�VXS�SRUWLQJ�GHVLJQ�DQG�FRQVWUXFWLRQ, CRC Press LLC
Eriksson, J (1996), )RUNVQLQJ�� XWYHFNOLQJ�� Q\WWD� ±�2P� Q\WWR�� RFK� UHOHYDQVEH�G|PQLQJDU� DY� %5�VW|GG� IRUVNQLQJV� RFK� XWYHFNOLQJVYHUNVDPKHW, Bygg-forskningsrådet, G19:1996
Eurostep (2000), 7KH� ,)&�67(3�7RROER[����, Programmers Manual, Eurostep AB, Sweden
IAI (2000), Official website and documentation of IFC 2.0, http://iaiweb.lbl.gov (accessed February 2001)
ISO (1992), ISO 10303-11: 'HVFULSWLRQ�PHWKRGV��WKH�(;35(66�ODQJXDJH�UHIHU�HQFH�PDQXDO, ISO/TC184/SC4, Geneva
ISO (1993), ISO 10303-21: &OHDU�WH[W�HQFRGLQJ�RI�WKH�H[FKDQJH�VWUXFWXUH, ISO/ TC184/SC4, Geneva
ISO (1996), ISO 10303-106: %XLOGLQJ�&RQVWUXFWLRQ�&RUH�0RGHO, ISO/TC184/ SC4/WG3, N496, Geneva
Jang, J.S.R., Sun, C.T. and Mizutani, E. (1997), 1HXUR�IX]]\�DQG�VRIW�FRPSXW�LQJ�� D� FRPSXWDWLRQDO� DSSURDFK� WR� OHDUQLQJ� DQG� PDFKLQH� LQWHOOLJHQFH, Prentice-Hall International Inc.
Lewis, R. and Séquin, C. (1998), Generation of 3D building models from 2D ar-chitectural plans, &RPSXWHU�$LGHG� 'HVLJQ, Elsevier Science Ltd., Vol. 30, No. 10, pp. 765–779
Lundequist, J. (1995), 'HVLJQ� RFK� SURGXNWXWYHFNOLQJ� �� 0HWRGHU� RFK� EHJUHSS (Design and Product Development - Methods and Concepts), Studentlit-teratur, Lund, Sweden
Löwnertz, K., Tarandi, V. and Eckerberg, K. (eds.) (1996), Del 8 - Redovisning med CAD, %\JJKDQGOLQJDU���, Byggstandardiseringen, Stockholm

57
Lippman, S. B. (1995), &���3ULPHU��QG�(GLWLRQ, AT&T Bell Laboratories, Ad-dison Wesley Publishing Company, MA
Mitchell, J. M. (1990), 7KH� /RJLF� RI� $UFKLWHFWXUH�� 'HVLJQ�� &RPSXWDWLRQ� DQG�&RJQLWLRQ, MIT Press, Cambridge
Myers, R. and Hancock, R.E. (1997), Genetic algorithm parameter sets for line labeling, 3DWWHUQ�5HFRJQLWLRQ�/HWWHUV, Elsevier Science Ltd., Vol. 11, No. 13, pp. 1363-1371
Langrana, A. N., Chen, Y. and Das, A. K. (1997), Feature Identification from Vectorized Mechanical Drawings, &RPSXWHU� 9LVLRQ� DQG� ,PDJH�8QGHU�VWDQGLQJ, Academic Press, Vol. 68, No. 2, pp. 127-145
Ozcan, E. and Mohan, K. C. (1996), Shape recognition using genetic algorithms, 3URFHHGLQJV�RI�,(((�,QWHUQDWLRQDO�&RQIHUHQFH�RQ�(YROXWLRQDU\�&RPSX�WDWLRQ, pp 411-416
Russell, J. S. and Norvig, P. (1995), $UWLILFLDO� ,QWHOOLJHQFH� �� $� 0RGHUQ� $S�SURDFK, Prentice-Hall International Inc.
Schenck, D. A., and P. R. Wilson (1994), ,QIRUPDWLRQ�0RGHOOLQJ��7KH�(;35(66�:D\, Oxford University Press, New York
Svensk Byggtjänst (1999), CAD-lager, 6%�UHNRPPHQGDWLRQHU� ��, ISBN 91-7332-907-X, Stockholm
Svensson, K., Hunhammar, M. and Zabielski, L. (1994), Are scanned drawings sufficient for facility management work?, &,%�:���:RUNVKRS�RQ�&RP�SXWHU�,QWHJUDWHG�&RQVWUXFWLRQ, Helsinki
Tarandi, V. (1998), 1HXWUDO�,QWHOOLJHQW�&$'�&RPPXQLFDWLRQ, PhD thesis, Royal institute of Technology, Stockholm
Wikforss, Ö. (1999), Byggnadskonst med och utan hus, %\JJLQGXVWULQ, No. 38, Sweden

58

59
$33(1',;�$� /$<(5�0$7&+,1*�7$%/(�
The following table matches several layers according to POINT 4 to one entity in the IFC 2.0 schema. It is implemented in a Microsoft Access database for eas-ily querying what layers a certain building element is represented on.
(QWLW\� /D\HU�
IfcReferenceCurve A030M
IfcReferenceCurve A030MS
IfcReferenceCurve A035M
IfcReferenceCurve A03SMS
IfcReferenceCurve A040M
IfcReferenceCurve A040MS
IfcReferenceCurve A041M
IfcReferenceCurve A041MS
IfcSite A010L
IfcSite A010T
IfcSite A011
IfcSite A012
IfcSite A013
IfcSite A014
IfcSite A015
IfcSpace A120
IfcSpace A121
IfcOpeningElement A030H
IfcOpeningElement A030HS
IfcOpeningElement A035HS
IfcOpeningElement A036
IfcOpeningElement A036-S
IfcOpeningElement A040H
IfcOpeningElement A040HS
IfcOpeningElement A041H
IfcOpeningElement A041HS
IfcBeam A037
IfcBeam A037-3
IfcBeam A037-S
IfcBuiltIn A050
IfcBuiltIn A050-3
IfcBuiltIn A050-S
IfcBuiltIn A050L
IfcBuiltIn A050T
IfcBuiltIn A059
IfcBuiltIn A100
IfcBuiltIn A100-S
IfcColumn A032
IfcColumn A032-3
IfcColumn A032-F
IfcColumn A032-S
IfcCovering A080
IfcCovering A080L
IfcCovering A080T
IfcCovering A085
IfcCovering A085L
IfcCovering A085T
IfcCovering A089
IfcDoor A046
IfcDoor A046-3
IfcDoor A046-F
IfcDoor A046-S
IfcDoorLining A046G3
IfcDoorPanel A046K3
IfcFurniture A055
IfcFurniture A055-3
IfcFurniture A055-S
IfcRailing A036R3
IfcRoof A038
IfcRoof A038-3
IfcRoof A038-F
IfcRoof A038-S
IfcStair A036-3
IfcStair A036S3
IfcStair A042
IfcStair A042-S
IfcWall A005
IfcWall A030
IfcWall A030-3
IfcWall A030-F
IfcWall A030-S
IfcWall A035
IfcWall A035-S
IfcWall A040
IfcWall A040-3
IfcWall A040-S
IfcWall A041
IfcWall A041-S
IfcWall A081
IfcWall A081T
IfcWall A081L
IfcWindow A045
IfcWindow A045-3
IfcWindow A045-F
IfcWindow A045-S
IfcWindowLining A045G3
IfcWindowPanel A045K3
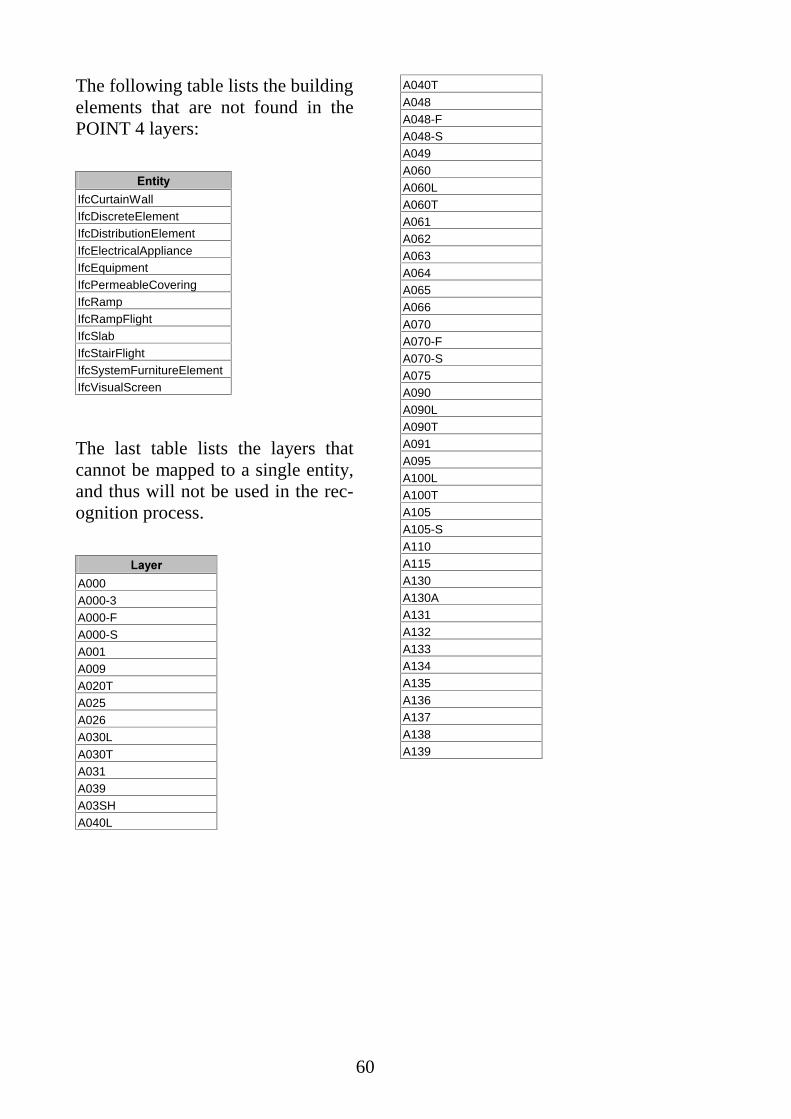
60
The following table lists the building elements that are not found in the POINT 4 layers:
(QWLW\�
IfcCurtainWall IfcDiscreteElement IfcDistributionElement IfcElectricalAppliance IfcEquipment IfcPermeableCovering IfcRamp IfcRampFlight IfcSlab IfcStairFlight IfcSystemFurnitureElement IfcVisualScreen
The last table lists the layers that cannot be mapped to a single entity, and thus will not be used in the rec-ognition process.
/D\HU�
A000 A000-3 A000-F A000-S A001 A009 A020T A025 A026 A030L A030T A031 A039 A03SH A040L
A040T A048 A048-F A048-S A049 A060 A060L A060T A061 A062 A063 A064 A065 A066 A070 A070-F A070-S A075 A090 A090L A090T A091 A095 A100L A100T A105 A105-S A110 A115 A130 A130A A131 A132 A133 A134 A135 A136 A137 A138 A139
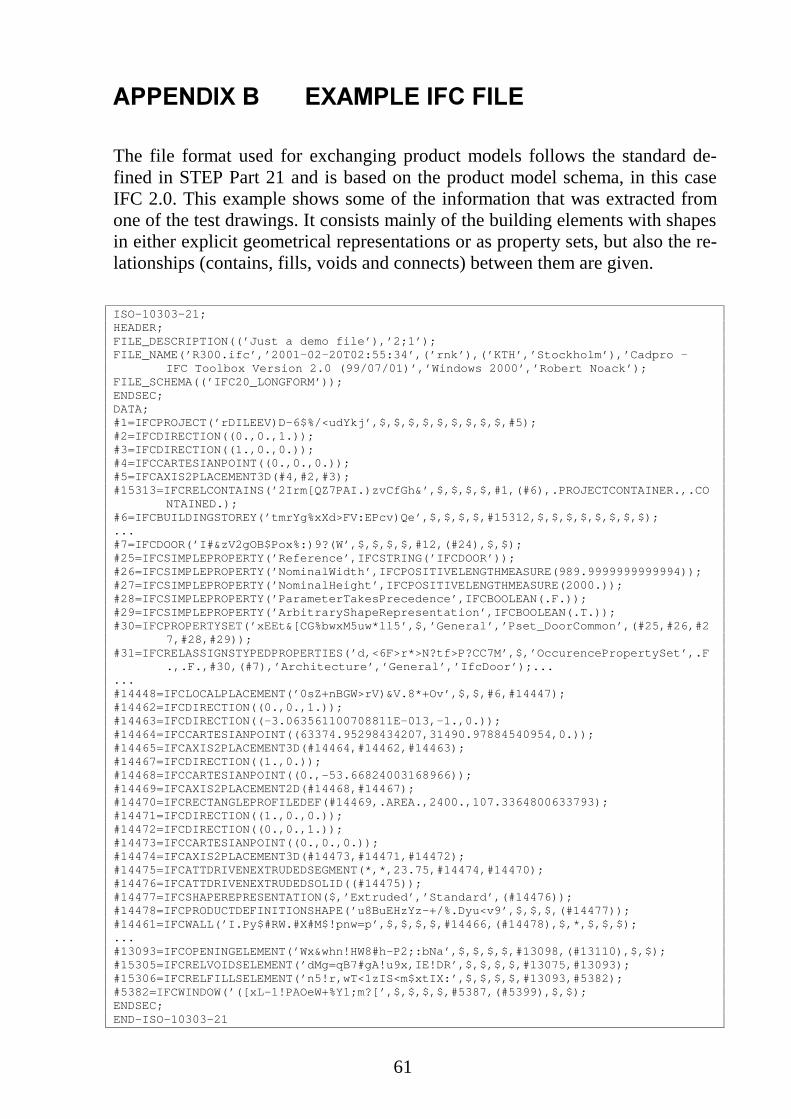
61
$33(1',;�%� (;$03/(�,)&�),/(�
The file format used for exchanging product models follows the standard de-fined in STEP Part 21 and is based on the product model schema, in this case IFC 2.0. This example shows some of the information that was extracted from one of the test drawings. It consists mainly of the building elements with shapes in either explicit geometrical representations or as property sets, but also the re-lationships (contains, fills, voids and connects) between them are given.
ISO-10303-21; HEADER; FILE_DESCRIPTION((’Just a demo file’),’2;1’); FILE_NAME(’R300.ifc’,’2001-02-20T02:55:34’,(’rnk’),(’KTH’,’Stockholm’),’Cadpro -
IFC Toolbox Version 2.0 (99/07/01)’,’Windows 2000’,’Robert Noack’); FILE_SCHEMA((’IFC20_LONGFORM’)); ENDSEC; DATA; #1=IFCPROJECT(’rDILEEV)D-6$%/<udYkj’,$,$,$,$,$,$,$,$,$,#5); #2=IFCDIRECTION((0.,0.,1.)); #3=IFCDIRECTION((1.,0.,0.)); #4=IFCCARTESIANPOINT((0.,0.,0.)); #5=IFCAXIS2PLACEMENT3D(#4,#2,#3); #15313=IFCRELCONTAINS(’2Irm[QZ7PAI.)zvCfGh&’,$,$,$,$,#1,(#6),.PROJECTCONTAINER.,.CO
NTAINED.); #6=IFCBUILDINGSTOREY(’tmrYg%xXd>FV:EPcv)Qe’,$,$,$,$,#15312,$,$,$,$,$,$,$,$); ... #7=IFCDOOR(’I#&zV2gOB$Pox%:)9?(W’,$,$,$,$,#12,(#24),$,$); #25=IFCSIMPLEPROPERTY(’Reference’,IFCSTRING(’IFCDOOR’)); #26=IFCSIMPLEPROPERTY(’NominalWidth’,IFCPOSITIVELENGTHMEASURE(989.9999999999994)); #27=IFCSIMPLEPROPERTY(’NominalHeight’,IFCPOSITIVELENGTHMEASURE(2000.)); #28=IFCSIMPLEPROPERTY(’ParameterTakesPrecedence’,IFCBOOLEAN(.F.)); #29=IFCSIMPLEPROPERTY(’ArbitraryShapeRepresentation’,IFCBOOLEAN(.T.)); #30=IFCPROPERTYSET(’xEEt&[CG%bwxM5uw*ll5’,$,’General’,’Pset_DoorCommon’,(#25,#26,#2
7,#28,#29)); #31=IFCRELASSIGNSTYPEDPROPERTIES(’d,<6F>r*>N?tf>P?CC7M’,$,’OccurencePropertySet’,.F
.,.F.,#30,(#7),’Architecture’,’General’,’IfcDoor’);... ... #14448=IFCLOCALPLACEMENT(’0sZ+nBGW>rV)&V.8*+Ov’,$,$,#6,#14447); #14462=IFCDIRECTION((0.,0.,1.)); #14463=IFCDIRECTION((-3.063561100708811E-013,-1.,0.)); #14464=IFCCARTESIANPOINT((63374.95298434207,31490.97884540954,0.)); #14465=IFCAXIS2PLACEMENT3D(#14464,#14462,#14463); #14467=IFCDIRECTION((1.,0.)); #14468=IFCCARTESIANPOINT((0.,-53.66824003168966)); #14469=IFCAXIS2PLACEMENT2D(#14468,#14467); #14470=IFCRECTANGLEPROFILEDEF(#14469,.AREA.,2400.,107.3364800633793); #14471=IFCDIRECTION((1.,0.,0.)); #14472=IFCDIRECTION((0.,0.,1.)); #14473=IFCCARTESIANPOINT((0.,0.,0.)); #14474=IFCAXIS2PLACEMENT3D(#14473,#14471,#14472); #14475=IFCATTDRIVENEXTRUDEDSEGMENT(*,*,23.75,#14474,#14470); #14476=IFCATTDRIVENEXTRUDEDSOLID((#14475)); #14477=IFCSHAPEREPRESENTATION($,’Extruded’,’Standard’,(#14476)); #14478=IFCPRODUCTDEFINITIONSHAPE(’u8BuEHzYz-+/%.Dyu<v9’,$,$,$,(#14477)); #14461=IFCWALL(’I.Py$#RW.#X#M$!pnw=p’,$,$,$,$,#14466,(#14478),$,*,$,$,$); ... #13093=IFCOPENINGELEMENT(’Wx&whn!HW8#h-P2;:bNa’,$,$,$,$,#13098,(#13110),$,$); #15305=IFCRELVOIDSELEMENT(’dMg=qB7#gA!u9x,IE!DR’,$,$,$,$,#13075,#13093); #15306=IFCRELFILLSELEMENT(’n5!r,wT<1zIS<m$xtIX:’,$,$,$,$,#13093,#5382); #5382=IFCWINDOW(’([xL-1!PAOeW+%Y1;m?[’,$,$,$,$,#5387,(#5399),$,$); ENDSEC; END-ISO-10303-21