coordinate algebra study guide 2014.2015 (2) -...
TRANSCRIPT

Coordinate Algebra Study Guide
Unit One: Relationships Between Quantities
You should be able to:
• interpret units in the context of the problem. • convert units of measure in order to solve problems. • when solving a multi-step problem, use units to evaluate the appropriateness of the solution. • choose the appropriate units for a specific formula and interpret the meaning of the unit in that
context. • choose and interpret both the scale and the origin in graphs and data displays. • determine and interpret appropriate quantities when using descriptive modeling. • determine the accuracy of values based on their limitations in the context of the situation. • identify the different parts of the expression and explain their meaning within the context of a
problem. • decompose expressions and make sense of the multiple factors and terms by explaining the
meaning of the individual parts. • create linear and exponential equations and inequalities in one variable and use them in a
contextual situation to solve problems. • create equations in two or more variables to represent relationships between quantities. • graph equations in two variables on a coordinate plane and label the axes and scales. • recognize that the equations and inequalities represent the constraints of the problem. • solve multi-variable formulas or literal equations, for a specific variable.
Vocabulary:
� Coefficient: A number multiplied by a variable.
� Domain: The set of x-coordinates of the set of points on a graph; the set of x-coordinates of a
given set of ordered pairs. The value that is the input in a function or relation.
� Equation: A number sentence that contains an equals symbol.
� Expression: A mathematical phrase involving at least one variable and sometimes numbers and operation symbols.
� Function: A rule of matching elements of two sets of numbers in which an input value from the first set has only one output value in the second set.
� Inequality: Any mathematical sentence that contains the symbols > (greater than), < (less than), ≤ (less than or equal to), or ≥ (greater than or equal to).
� Ordered Pair: A pair of numbers, (x, y), that indicate the position of a point on a Cartesian plane.
� Perimeter: The sum of the lengths of the sides of a polygon.
� Pythagorean Theorem: It is a theorem that states a relationship that exists in any right triangle. If the lengths of the legs in the right triangle are a and b and the length of the hypotenuse is c, we can write the theorem as the following equation: a 2 + b 2 = c 2
� Range: The y-coordinates of the set of points on a graph. Also, the y-coordinates of a given set of ordered pairs. The range is the output in a function or a relation.
� Substitution: To replace one element of a mathematical equation or expression with another.
� Variable: A letter or symbol used to represent a number.

Coordinate Algebra Study Guide
Web Resources
• Note on Dimensional Analysis
o Dimensional Analysis
http://www.alysion.org/dimensional/fun.htm
• Unit One Weebly
o http://hcbemath9.weebly.com/unit-1.html
• Math Bits Structure of Expressions
o http://mathbitsnotebook.com/Algebra1/AlgebraicExpressions/AEoutline.html
Practice Items
1) Bruce owns a business that produces widgets. He must bring in more in revenue than he pays out in costs in order to turn a profit.
• It costs $10 in labor and materials to make each of his widgets.
• His rent each month for his factory is $4000.
• He sells each widget for $25.
How many widgets does Bruce need to sell each month to make the minimum profit?
A. 160
B. 260
C. 267
D. 400
[Key: C]
2) The formula for density � is � =�
� where m is mass and v is volume. If mass is measured in kilograms
and volume is measured in cubic meters, what if the unit rate for density?
[Key: kg/��]
3) The total daily expenses to operate Sheila’s pie bakery are the cost of salaries and ingredients. Sheila
has four employees, and she pays each worker a daily rate. On average, it costs the same amount of money to make each pie. This expression shows the total daily expenses for Sheila’s bakery to make x pies.
4(75)+$0.50� What does the term 4(75) represent? A Each of the 4 employees earns $75 per day. B Sheila must sell 600 pies per day. C The total daily expenses are $300. D Customers pay $4.50 per pie.
[Key: A] 4) A rectangular prism has a volume of 2 ��, a length of 40 cm, and a width of 50 cm. What is the height
of the prism?
[Key: 100 cm or 1 m]

Coordinate Algebra Study Guide
5) Information about the costs of three catering companies is shown in this table.
Gavin can spend no more than $300 on catering. What is the greatest number of people he can invite using one of the three caterers? A 30
B 32
C 33 D 37
[Key: C]
6) Emily is jogging at a rate of 10 feet per second. Monica is jogging at a rate of 5 miles per hour. If 1 mile equals 5,280 feet, about how many miles per hour faster is Emily’s rate than Monica’s rate? Round your answer to the nearest tenth.
[Key: 1.8]
7) Bailee wants to fill a 60-gallon tub with water. She states that the best unit rate for measuring how
quickly the tub fills is gallons per hour. Explain whether or not you agree with her.
[Key: I disagree with Bailee. Gallons per minute would be more appropriate, because when we measure
how long it takes to fill a bathtub, we use minutes not hours.] 8) Explain which situation would require the greatest degree of accuracy.
• building a dog house
• measuring the amount of water in a pool
• tracking the number of steps a person takes in a day
[Key: Building a doghouse because each piece needs to be precise to fit with other pieces]
9) The formula can be used to determine the height, h, of a triangle. Write the formula in terms of h.
[Key: � =
�]
10) The weekly earnings, w, of an employee at a company can be determined using the equation
where s represents the amount of sales that week, in dollars. Solve the equation for s to determine the amount of sales needed to earn w dollars.
[Key: =�����
�.�]

Coordinate Algebra Study Guide
11) The tension caused by a wave moving along a string is found using the formula
If m is the mass of the string in grams, L is the length of the string in centimeters, and v is the velocity of the wave in centimeters per second, what is the unit of the tension of the string, T?
a. gram-centimeters per second squared c. grams per centimeter-second squared
b. centimeters per second squared
d. centimeters squared per second
[Key: �
12) For 2 minutes, Maggie runs at a constant speed. Then she gradually increases her speed. Which of the following graphs could show how her speed changed over time?
a. c.
b. d.
[Key:C] 13) Two bicycle shops rent bikes by the hour. The cost to rent a bike for h hours from Shop 1 costs $3 plus $4 per hour, and
the cost to rent a bike for h hours from Shop 2 is $7 to start with, but then it is a dollar less per hour to rent from Shop 2 than from Shop 1.
Ellen rented a bike from Shop 1. Roger rented a bike from Shop 2. They rented their bikes for the same number of hours and paid the same rental costs. For how many hours did Ellen and Roger each rent their bike?
a. 3 hours b. 5 hours c. 4 hours d. 25 hours
[Key: C]

Coordinate Algebra Study Guide
14)
a.
b.
c.
d. [Key: B]
15) A company uses two different-sized trucks to deliver sand. The first truck can transport x cubic yards, and the second y
cubic yards. The first truck makes S trips to a job site, while the second makes T trips. What does mean in
practical terms?
a. The total amount of sand transported to the job site by both trucks, in a single trip. b. The total amount of sand transported to the job site by both trucks. c. The total number of trips taken by both trucks to the job site. d. The average amount of sand taken to the job site per truck trip.
[Key: D]
16) Convert 60 miles per hour to feet per minute.
[Key: 5280 feet per minute]
17) When Justin goes to work, he drives at an average speed of 65 miles per hour. It takes about 1 hour and 30 minutes for Justin to arrive at work. His car travels about 25 miles per gallon of gas. If gas costs $3.65 per gallon, how much money does Justin spend to travel each mile to work?
{Key: About $0.15 per mile]

Coordinate Algebra Study Guide
18) Katya wants to earn $1500 this summer by doing yard work. She plans on working 125 hours over the summer.
A. Based on her plan, what is the rate, in dollars per hour, that Katya must charge customers for doing yard work to earn $1500 over the summer? Show or explain how you got your answer.
Katya also wants to enroll in a summer class at a local college. As a result, she will have to work 50 hours less than the total number of hours she had originally planned.
B. What is the rate, in dollars per hour that Katya must charge customers for doing yard work to still earn
$1500? Show or explain how you got your answer. C. Write an equation that represents the relationship between x, the number of hours Katya will have to work,
and y, the rate she must charge customers to earn $1500. D. Explain how a change in x, the number of hours Katya will have to work, affects y, the rate she will have to
charge customers to earn $1500, in your equation from part (c). [KEY}

Coordinate Algebra Study Guide
Unit Two: Reasoning with Equations and Inequalities
You should be able to:
• justify the solution of a linear equation and inequality in one variable. • the solution to a system of 2 equations in two variables. • solve a system of linear equations in 2 variables by graphing. • graph a linear inequality in 2 variables. • graph a system of linear inequalities in 2 variables
Vocabulary and Properties
� Algebra: The branch of mathematics that deals with relationships between numbers, utilizing letters and other
symbols to represent specific sets of numbers, or to describe a pattern of relationships between numbers. � Coefficient: A number multiplied by a variable. � Equation: A number sentence that contains an equals symbol. � Expression: A mathematical phrase involving at least one variable and sometimes numbers and operation symbols. � Inequality: Any mathematical sentence that contains the symbols > (greater than), < (less than), ≤ (less than or
equal to), or ≥ (greater than or equal to). � Ordered Pair: A pair of numbers, (x, y), that indicate the position of a point on a Cartesian plane. � Substitution: To replace one element of a mathematical equation or expression with another. � Variable: A letter or symbol used to represent a number.
The Properties of Operations
Here a, b and c stand for arbitrary numbers in a given number system. The properties of operations apply to the rational number system, the real number system, and the complex number system.
Associative property of addition (a + b) + c = a + (b + c) Commutative property of addition a + b = b + a
Additive identity property of 0 a + 0 = 0 + a = a Existence of additive inverses For every a there exists –a so that a + (–a) = (–a) + a = 0.
Associative property of multiplication (a × b) × c = a × (b × c) Commutative property of multiplication a × b = b × a
Multiplicative identity property of 1 a × 1 = 1 × a = a Existence of multiplicative inverses For every a ≠ 0 there exists 1/a so that a × 1/a = 1/a × a = 1.
Distributive property of multiplication over addition a × (b + c) = a × b + a × c
The Properties of Equality
Here a, b and c stand for arbitrary numbers in the rational, real, or complex number systems.
Reflexive property of equality a = a Symmetric property of equality If a = b, then b = a. Transitive property of equality If a = b and b = c, then a = c. Addition property of equality If a = b, then a + c = b + c.
Subtraction property of equality If a = b, then a – c = b – c. Multiplication property of equality If a = b, then a × c = b × c.
Division property of equality If a = b and c ≠ 0, then a ÷ c = b ÷ c. Substitution property of equality If a = b, then b may be substituted for a in any expression containing a.
Web Resources:
• Math 9 Weebly Unit 2: http://hcbemath9.weebly.com/unit-2.html
• Balancing Equations Applet http://nlvm.usu.edu/en/nav/frames_asid_324_g_3_t_2.html
• Virtual Nerd; Algebra Topics http://www.virtualnerd.com/algebra-1/all

Coordinate Algebra Study Guide
Practice Items:
1) Are the algebraic expressions 4� � 2�and 6� � 2�� � �)equivalent?
[Key: No, the expressions are not equivalent because, when simplified 6� � 2�� � �)� 4� � 2�, not 4� � 2�]
2) Solve this inequality for y: 6! � 2" # 4?
[Key: " $ 3! � 2]
3) Karla wants to save up for a prom dress. She figures she can save $9 each week from the money she earns babysitting. If she plans to spend up to $150 for the dress, how many weeks will it take her to save enough money?
[Key: 17 weeks]
4) Two cars, the first traveling 15 miles per hour faster than the second, start at the same point and travel in opposite directions. In 4 hours, they are 300 miles apart. We can use the formula below to determine the rate of the second car.
4�& � 15� � 4& � 300
What is the rate, r, of the second car?
[Key: r = 30]
5) Rebecca has five coins worth 65 cents in her pocket. If she only has quarters and nickels, how many quarters does she have?
[Key: Rebecca has 2 quarters and 3 nickels]
6) Peg and Larry purchased “no contract” cell phones. Peg’s phone cost $25 and she pays $0.25 a minute for calls in
the United States. Larry’s phone cost $35 and he pays $0.20 per minute for calls in the United States. After how many minutes of use will Peg’s phone cost more than Larry’s?
[Key: After 200 phone calls, Peg’s phone will cost more than Larry’s]
7) Is (3,-1) a solution to this system? " � 2 � �
3 � 2" � 2�
[Key: The coordinates of the give point do not satisfy both equations. Therefore (3,-1) is not a solution of the system]
8) Use a number line to display the solution to 3� � 8 # 14.
[Key: ]
9) Graph the solution : " � 2 ) �.
[Key: ]

Coordinate Algebra Study Guide
10) In each of the four parts:
• state the property or explain the process performed on the first equation to arrive at the second equation
• and solve each equation for x.
Show your work for each solution. Part A
Part B
Part C
Part D
[Key:

Coordinate Algebra Study Guide
11) To solve the equation a student correctly changed the equation to Which method did the student use to obtain the second equation?
A.
B.
C.
D.
[Key: C]
12) Annabel is saving money to attend a summer camp that costs $273. She has already saved $56 and will save an
additional $8 each week. Which inequality solution represents the fewest number of weeks, w , Annabel will have to save to be able to attend the summer camp?
A.
B.
C.
D.
[Key: B]
13) Mandy is asked to solve the system shown.
Mandy multiplies the first equation by This process results in a new system. Mandy states that is a solution to the new system. Explain why Mandy's solution is also a solution to the original system.
[Key: Substiuting (1,-4) into the original system results in a true equations]
14) Evelyn is solving a system of linear equations for x .
Her first step is to multiply the terms in the equation, by 2.
Explain what steps Evelyn can perform next to get the solution of
Coordinate Algebra Study Guide
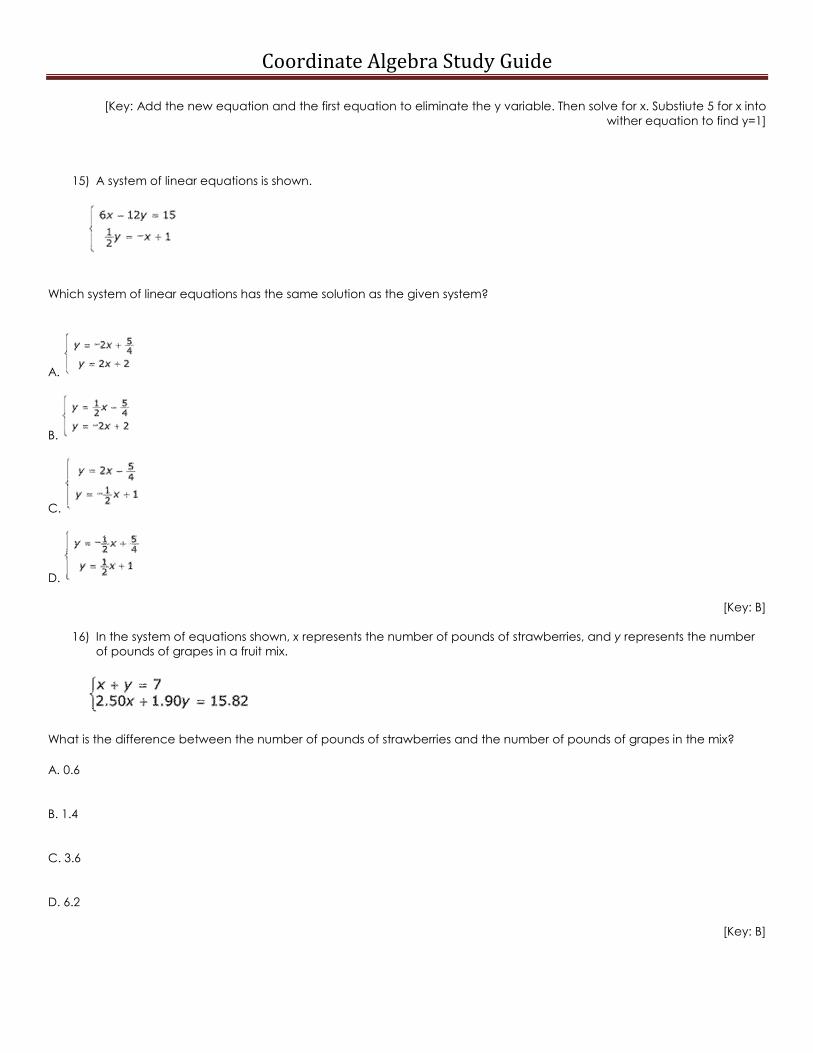
[Key: Add the new equation and the first equation to eliminate the y variable. Then solve for x. Substiute 5 for x into
wither equation to find y=1]
15) A system of linear equations is shown.
Which system of linear equations has the same solution as the given system?
A.
B.
C.
D.
[Key: B]
16) In the system of equations shown, x represents the number of pounds of strawberries, and y represents the number of pounds of grapes in a fruit mix.
What is the difference between the number of pounds of strawberries and the number of pounds of grapes in the mix?
A. 0.6 B. 1.4 C. 3.6 D. 6.2
[Key: B]

Coordinate Algebra Study Guide
17) The solution set of a system of inequalities is shown in the coordinate grid.
What inequality represents the lower boundary of the system?
[Key: " # � � 3]
18) Bethany is solving a system of linear equations. The original system and her first two steps in solving the problem are shown below.
Part A
What did Bethany do to transform the original system to the system shown in Step 1? Explain why that is a correct procedure. Part B
What did Bethany do to transform the system shown in Step 1 to the system shown in Step 2? Explain why that is a correct procedure. Part C
Bethany graphed the original system on one coordinate system and the system shown in Step 2 on another coordinate system. How do her graphs compare? Explain your answer. Part D
Describe a procedure to continue Bethany’s work to get to Step 3. Justify why your procedure will lead to the correct solution to the original system.
Key

Coordinate Algebra Study Guide
Unit 3: Linear and Exponential Functions
You should be able to:
• Explain what it means when two curves {y = f(x) and y = g(x)} intersect.
• Define and use function notation, evaluate functions at any point in the domain, give general statements about how f(x) behaves at different regions in the domain (as x gets very large or very negative, close to 0 etc.), and interpret statements that use function notation.
• Explain the difference and relationship between domain and range and find the domain and range of a function from a function equation, table or graph.
• Examine data (from a table, graph, or set of points) and determine if the data is a function and explain any conclusions that can be drawn.
• Write a function from a sequence or a sequence from a function.
• Explain how an arithmetic or geometric sequence is related to its algebraic function notation.
• Interpret x and y intercepts, where the function is increasing or decreasing, where it is positive or negative, its end behaviors, given the graph, table or algebraic representation of a linear or exponential function in terms of the context of the function.
• Find and/or interpret appropriate domains and ranges for authentic linear or exponential functions.
• Calculate and interpret the average rate of change over a given interval of a function from a function equation, graph or table, and explain what that means in terms of the context of the function.
• Estimate the rate of change of a function from its graph at any point in its domain.
• Explain the relationship between the domain of a function and its graph in general and/or to the context of the function.
• Accurately graph a linear function by hand by identifying key features of the function such as the x- and y-intercepts and slope.
• Graph a linear or exponential function using technology.
• Sketch the graph of an exponential function accurately identifying x- and y-intercepts and asymptotes.
• Describe the end behavior of an exponential function (what happens as x goes to positive or negative infinity).
• Discuss and compare two different functions (linear and/or exponential) represented in different ways (tables, graphs or equations). Discussion and comparisons should include: identifying differences in rates of change, intercepts, and/or where each function is greater or less than the other.
• Write a function that describes a linear or exponential relationship between two quantities and combine different functions using addition, subtraction, multiplication, division and composition of functions to create a new function.
• Write recursively and an explicit formula for arithmetic and geometric sequences.
• Construct and compare linear and exponential models and solve problems. • Recognize situations with a constant rate of change as well as those in which a quantity either grows or decays by a
constant percent rate.

Coordinate Algebra Study Guide
Vocabulary
� Arithmetic Sequence. A sequence of numbers in which the difference between any two consecutive terms is the
same.
� Average Rate of Change. The change in the value of a quantity by the elapsed time. For a function, this is the change in the y-value divided by the change in the x-value for two distinct points on the graph.
� Coefficient. A number multiplied by a variable in an algebraic expression.
� Constant Rate of Change. With respect to the variable x of a linear function y = f(x), the constant rate of change is the slope of its graph.
� Continuous. Describes a connected set of numbers, such as an interval.
� Discrete. A set with elements that are disconnected.
� Domain. The set of x-coordinates of the set of points on a graph; the set of x-coordinates of a given set of ordered pairs. The value that is the input in a function or relation.
� End Behaviors. The appearance of a graph as it is followed farther and farther in either direction.
� Explicit Expression. A formula that allows direct computation of any term for a sequence a1, a2, a3, . . . , an, . . . .
� Exponential Function. A nonlinear function in which the independent value is an exponent in the function, as in y =
abx.
� Exponential Model. An exponential function representing real-world phenomena. The model also represents patterns found in graphs and/or data.
� Expression. Any mathematical calculation or formula combining numbers and/or variables using sums, differences, products, quotients including fractions, exponents, roots, logarithms, functions, or other mathematical operations.
� Even Function. A function with a graph that is symmetric with respect to the y-axis. A function is only even if and only if f(–x) = f(x).
� Factor. For any number x, the numbers that can be evenly divided into x are called factors of x. For example, the number 20 has the factors 1, 2, 4, 5, 10, and 20.
� Geometric Sequence. A sequence of numbers in which the ratio between any two consecutive terms is the same. In other words, you multiply by the same number each time to get the next term in the sequence. This fixed number is called the common ratio for the sequence.
� Interval Notation. A notation representing an interval as a pair of numbers. The numbers are the endpoints of the interval. Parentheses and/or brackets are used to show whether the endpoints are excluded or included.
� Linear Function. A function with a constant rate of change and a straight line graph.
� Linear Model. A linear function representing real-world phenomena. The model also represents patterns found in graphs and/or data.
� Odd Function. A function with a graph that is symmetric with respect to the origin. A function is odd if and only if f(–x) = –f(x).
� Parameter. The independent variable or variables in a system of equations with more than one dependent variable.
� Range. The set of all possible outputs of a function.
� Recursive Formula. A formula that requires the computation of all previous terms to find the value of an.

Coordinate Algebra Study Guide
� Slope. The ratio of the vertical and horizontal changes between two points on a surface or a line.
� Term. A value in a sequence--the first value in a sequence is the 1st term, the second value is the 2nd term, and so on; a term is also any of the monomials that make up a polynomial.
� Vertical Translation. A shift in which a plane figure moves vertically.
� X-intercept. The point where a line meets or crosses the x-axis
� Y-intercept. The point where a line meets or crosses the y-axis
Web Resources
• Linear & Exponential Growth http://learnzillion.com/lessonsets/40-proving-how-linear-functions-grow This webpage includes short videos comparing linear and exponential functions.
• Distinguishing between Linear & Exponential http://learnzillion.com/lessonsets/35-distinguishing-between-linear-functions-and-exponential-functions Further video resources for exponential & linear functions.
• Virtual Nerd; Algebra Topics http://www.virtualnerd.com/algebra-1/all
• Unit 3 Weebly: http://hcbemath9.weebly.com/unit-3.html Practice Items
1) A manufacturer keeps track of her monthly costs by using a “cost function” that assigns a total cost for a given
number of manufactured items, x. The function is C(x) = 5,000 + 1.3x. a. What is the domain of the function? b. What is the cost of 2,000 items?
c. If costs must be kept below $10,000 this month, what is the greatest number of items she can manufacture?
[Key: A. Whole numbers, B. $7,600, C. 3,846 items]
2) Consider the first six terms of this sequence: 5, 7, 11, 19, 35, 67, . . . a. What is !�? What is !�? b. If the sequence defines a function, what is the range?
[Key: A. 5 and 11, B. {5,7,11,19,35,67,…}]
3) The amount accumulated in a bank account over a time period t and based on an initial deposit of $200 is found
using the formula��*) =)200�1.025�+, * , 0. Time, t, is represented on the horizontal axis. The accumulated amount, A(t), is represented on the vertical axis.
a. What are the intercepts of the function? b. What is the domain of the function? c. Why are all the t values non-negative? d. What is the range of the function? e. Does the function have a maximum or minimum value?

Coordinate Algebra Study Guide
[Key: a. There is no t-intercept. The function crosses the vertical axis at 200.
b. The domain is t ,0. c. The t values are all non-negative because they represent time, and time cannot be negative.
d. A(t) ≥ 200.
e. The function has no maximum value. Its minimum value is 200.]
4) The terms of a sequence increase by a constant amount. If the first term is 7 and the fourth term is 16: a. List the first six terms of the sequence. b. What is the explicit formula for the sequence? c. What is the recursive rule for the sequence?
[Key: A. 7, 10, 13, 16, 19, 22, ..B. -�.) = 3. � 4, -/&. # 0, C. !0 = !0�� �31�*�!� = 7. 3
5) For the function f(x) = 3x:
a. Find the function that represents a 5 unit translation upward of the function. b. Is the function even, odd, or neither even nor odd?
[Key: A. -��) = 34 =5, B. Neither]
6) Alice finds her flower bulbs multiply each year. She started with just 24 tulip plants. After one year she had 72 plants. Two years later she had 120. Find a linear function to model the growth of Alice’s bulbs.
[Key: 5�6) = 486 � 24
7) Suppose Alice discovers she counted wrong the second year and she actually had 216 tulip plants. She realizes the growth is not linear because the rate of change was not the same. She must use an exponential model for the growth of her tulip bulbs. Find the exponential function to model the growth.
{Key: 5�6� � 24�3�7]
8) The function represents the value of Gale’s investment, V dollars, at the end of t years. Part A
Write a recursive rule to represent this function for Explain your function. Part B
What are the values of the function when Show your work. Round your answer to the nearest cent. Part C
Graph the function for the domain Remember to title your graph and label your axes.
[Key:

Coordinate Algebra Study Guide
9) A function g is an odd function. If g(–3) = 4, which other point lies on the graph of g?
A. (3, –4) B. (–3, –4) C. (4, –3) D. (–4, 3)
[Key: A]
10) The varsity basketball team started selling team T-shirts in 1994. The average number of team T-shirts sold, s , is
modeled by the graph shown, where represents the year 2000.
What is the average rate of change of T-shirts sold between years 2000 and 2005?
[Key: 1000 T-shirts per year]
11) Mariah's art project is a square plaque made from smaller square pieces of glass tiles. She completes the plaque in stages to allow glue to dry. The diagram shows the stages of the plaque on the first four days.
Day 1 shows 1 glass tile on the plaque. Day 2 shows a total of 3 glass tiles on the plaque. Write a function indicating the
recursive formula used to determine the number of glass tiles on any day, when
[Key: f(d) = f(d-1) + d]
12) The graph of an exponential function - passes through �0,1�and�2.4) as shown. What is the value of-�6)?
[Key: 64]

Coordinate Algebra Study Guide
13) The figure shows the graphs of the functions " = -��)!.�" = ;��). If ;��) = < ∙ -��), what is the value of <?
[Key: k = -3]
14) Lauren keeps records of the distances she travels in a taxi and what she pays:
a. If you graph the ordered pairs (d, F) from the table, they lie on a line. How can you tell this without graphing
them?
b. Write a function for the given data.
c. Explain what the values stand for in the context of the problem.
[Key: ]
15) A certain type of lily plant is growing in a pond in such a way that the number of plants is growing exponentially. The number of plants is growing exponentially. The number of plants >in the pond at time * is modeled by the function. >�*) = !?+, where !and ? are constants and * is measured in months. The table shows two values of the functions. Complete the equation.
[Key: >�*) = 150�3�+]
16) Which function has the greatest value as t approaches positive infinity?
A.
B.
C.
D. [Key: D]

Coordinate Algebra Study Guide
17) A steel factory produces a wide variety of products. One particular product travels along a multiple-part assembly
line. There are times when the assembly line stops for the product to cool. The graph shows the distance the product travels (in meters) from the beginning of the assembly line and the time (in minutes) to complete the process.
Mike supervised the production of this product starting at 7:00 AM, represented by point A . Identify the time the cooling period occurs in terms of the graph.
[Key: The cooling period is 7:40 to 7:50 AM]
18) Which domain could represent the number of minutes it takes to put together n puzzles?
A.
B.
C.
D.
[Key: D]
19) A specific arithmetic sequence is defined by the function When what is the
value of A. 1406.25 B. 562.5 C. 225 D. 90
[Key: A]

Coordinate Algebra Study Guide
20) A college student buys a meal plan where she pays a membership fee and a fixed price for each meal. The meal
plan is defined by the function represents the cost of the plan and x represents the number of meals.
If the point is a solution to the function then what is the cost of the membership fee?
[Key; $65]
21) The two functions shown are graphed on the same coordinate grid.
Describe the similarities and differences in the graphs of the two functions.
[Key: Both functions have a y-intercept at 512. The first function, f(x), is exponential, showing decay. The second function, g(x), is linear and is increasing.]
22) The function is changed from the function through a specific transformation.
Name the transformation and describe its effect on
[Key: The function g(x) is a translation of 7 units up from the function f(x).OR The function g(x) is a translation of f(x) by (x, y+7).]
23) Two scientists are studying the growth of bacteria. Scientist A graphs the results of her study on the coordinate grid shown.
Scientist B shows the results of his study as the function where t is time in hours. Explain how the results for Scientist A compare to the results for Scientist B.
[Key: They started with the same number of bacteria. Scientist B studied bacteria that grows at a slower rate than the bacteria Scientist A studied.]

Coordinate Algebra Study Guide
Unit 4: Describing Data
You should be able to:
• Construct appropriate graphical displays (dot plots, histogram, and box plot) to describe sets of data values.
• Select the appropriate measures to describe and compare the center and spread of two or more data sets in context.
• Use the context of the data to explain why its distribution takes on a particular shape (e.g. are there real-life limits to the
values of the data that force skewedness?)
• Explain the effect of any outliers on the shape, center, and spread of the data sets.
• Create a two-way frequency table from a set of data on two categorical variables.
• Calculate joint, marginal, and conditional relative frequencies and interpret in context.
• Recognize associations and trends in data from a two-way table.
• Create a scatter plot from two quantitative variables and describe the form, strength, and direction of the relationship between the two variables in context.
• Determine which type of function best models a set of data.
• Interpret constants and coefficients in the context of the data (e.g. slope and y-intercept of linear models, base/growth or decay rate and y-intercept of exponential models) and use the fitted function to make predictions and solve problems in the context of the data.
• Calculate the residuals for the data points fitted to a function and create and analyze a residual plot.
• Use algebraic methods and technology to fit a linear function to the data for data sets that appear to be linear.
• Interpret the slope and y-intercept in the context of the data.
• Compute the correlation coefficient and show that it is a measure of the strength and direction of a linear relationship between two quantities in a set of data.
• Determine if the association between two variables is a result of a cause and effect relationship.
Vocabulary
• Association. A connection between data values.
• Bivariate data. Pairs of linked numerical observations. Example: a list of heights and weights for each player on a football team.
• Box Plot. A method of visually displaying a distribution of data values by using the median, quartiles, and extremes of the data set. A box shows the middle 50% of the data.
• Box-and-Whisker Plot. A diagram that shows the five-number summary of a distribution. (Five-number summary includes the minimum, lower quartile (25th percentile), median (50th percentile), upper quartile (75th percentile), and the maximum. In a modified box plot, the presence of outliers can also be illustrated.
• Categorical Variables. Categorical variables take on values that are names or labels. The color of a ball (e.g., red, green, blue), gender (male or female), year in school (freshmen, sophomore, junior, senior). These are data that cannot be averaged or represented by a scatter plot as they have no numerical meaning.
• Center. Measures of center refer to the summary measures used to describe the most “typical” value in a set of data. The two most common measures of center are median and the mean.

Coordinate Algebra Study Guide
• Conditional Frequencies. The relative frequencies in the body of a two-way frequency table.
• Correlation Coefficient. A measure of the strength of the linear relationship between two variables that is defined in
terms of the (sample) covariance of the variables divided by their (sample) standard deviations.
• Dot plot. A method of visually displaying a distribution of data values where each data value is shown as a dot or mark above a number line.
• First Quartile (Q1). The “middle value” in the lower half of the rank-ordered data
• Five-Number Summary. Minimum, lower quartile, median, upper quartile, maximum.
• Histogram- Graphical display that subdivides the data into class intervals and uses a rectangle to show the
frequency of observations in those intervals—for example you might do intervals of 0-3, 4-7, 8-11, and 12-15
• Interquartile Range. A measure of variation in a set of numerical data. The interquartile range is the distance between the first and third quartiles of the data set. Example: For the data set {1, 3, 6, 7, 10, 12, 14, 15, 22, 120}, the interquartile range is 15 – 6 = 9.
• Joint Frequencies. Entries in the body of a two-way frequency table.
• Line of Best Fit (trend or regression line). A straight line that best represents the data on a scatter plot. This line may pass through some of the points, none of the points, or all of the points. Remind students that an exponential model will produce a curved fit.
• Marginal Frequencies. Entries in the "Total" row and "Total" column of a two-way frequency table.
• Mean Absolute Deviation. A measure of variation in a set of numerical data, computed by adding the distances between each data value and the mean, then dividing by the number of data values. Example: For the data set {2, 3, 6, 7, 10, 12, 14, 15, 22, 120}, the mean absolute deviation is 20.
• Outlier. Sometimes, distributions are characterized by extreme values that differ greatly from the other observations. These extreme values are called outliers. As a rule, an extreme value is considered to be an outlier if it is at least 1.5 interquartile ranges below the lower quartile (Q1), or at least 1.5 interquartile ranges above the upper quartile (Q3).
OUTLIER if the values lie outside these specific ranges: Q1 – 1.5 • IQR Q3 + 1.5 • IQR
• Quantitative Variables. Numerical variables that represent a measurable quantity. For example, when we speak of
the population of a city, we are talking about the number of people in the city – a measurable attribute of the city. Therefore, population would be a quantitative variable. Other examples: scores on a set of tests, height and weight, temperature at the top of each hour.
• Residuals (error). Represents unexplained (or residual) variation after fitting a regression model. residual = observed value – predicted value e = y – ŷ. A residual plot is a graph that shows the residual values on the vertical axis and
the independent (x) variable on the horizontal axis.
• Scatter plot. A graph in the coordinate plane representing a set of bivariate data. For example, the heights and weights of a group of people could be displayed on a scatter plot. If you are looking for values that fall within the range of values plotted on the scatter plot, you are interpolating. If you are looking for values that fall beyond the range of those values plotted on the scatter plot, you are extrapolating.
• Second Quartile (Q2). The median value in the data set.
• Shape. The shape of a distribution is described by symmetry, number of peaks, direction of skew, or uniformity.
• Symmetry- A symmetric distribution can be divided at the center so that each half is a mirror image of the other.
Coordinate Algebra Study Guide
• Number of Peaks- Distributions can have few or many peaks. Distributions with one clear peak are called
unimodal and distributions with two clear peaks are called bimodal. Unimodal distributions are sometimes called bell-shaped.
• Direction of Skew- Some distributions have many more observations on one side of graph than the other. Distributions with a tail on the right toward the higher values are said to be skewed right; and distributions with a tail on the left toward the lower values are said to be skewed left.
• Uniformity- When observations in a set of data are equally spread across the range of the distribution, the distribution is called uniform distribution. A uniform distribution has no clear peaks.
• Spread. The spread of a distribution refers to the variability of the data. If the data cluster around a single central
value, the spread is smaller. The further the observations fall from the center, the greater the spread or variability of the set. (range, interquartile range, Mean Absolute Deviation, and Standard Deviation measure the spread of data)
• Third quartile. For a data set with median M, the third quartile is the median of the data values greater than M.
Example: For the data set {2, 3, 6, 7, 10, 12, 14, 15, 22, 120}, the third quartile is 15.
• Trend. A change (either positive, negative or constant) in data values over time.
• Two-Frequency Table. A useful tool for examining relationships between categorical variables. The entries in the cells of a two-way table can be frequency counts or relative frequencies.
Web Resources
• http://www.virtualnerd.com/common-core/all Go to HS; Statistics and Probability: First two topics. • http://hcbemath9.weebly.com/unit-4.html Unit 4 Weebly • https://www.khanacademy.org/math/probability/regression Khan Academy- Linear Regression • https://www.khanacademy.org/math/probability/statistical-studies/categorical-data/e/trends-in-categorical-data
Two-Way Tables
Practice Items:
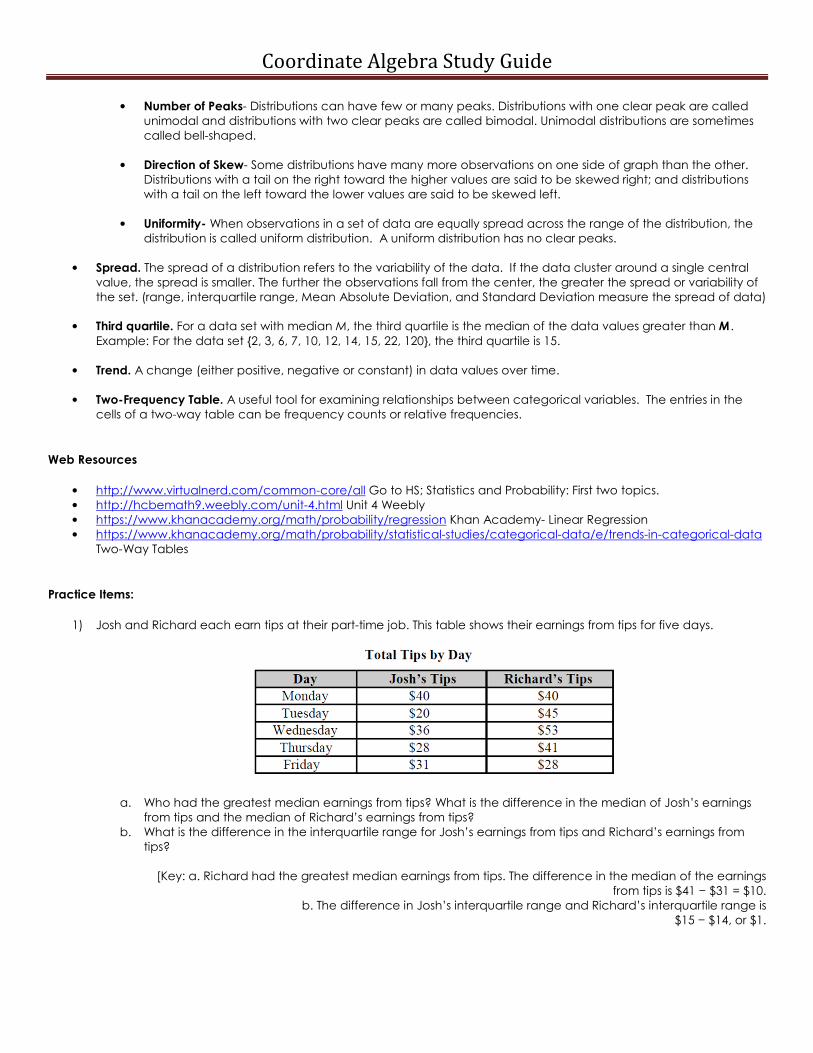
1) Josh and Richard each earn tips at their part-time job. This table shows their earnings from tips for five days.
a. Who had the greatest median earnings from tips? What is the difference in the median of Josh’s earnings from tips and the median of Richard’s earnings from tips?
b. What is the difference in the interquartile range for Josh’s earnings from tips and Richard’s earnings from tips? [Key: a. Richard had the greatest median earnings from tips. The difference in the median of the earnings
from tips is $41 − $31 = $10. b. The difference in Josh’s interquartile range and Richard’s interquartile range is
$15 − $14, or $1.

Coordinate Algebra Study Guide
2) Old Faithful, a geyser in Yellowstone National park, is renowned for erupting fairly regularly. In more recent times, it
has become less predictable. It was observed that the time interval between eruptions was related to the duration of the most recent eruption. The distribution of its interval times for 2011 is shown below.
a. Does the Year-to-Date distribution seem normal, skewed, or uniform? b. Compare Last Week’s distribution to Last Month’s. c. What does the Year-to-Date distribution tell you about the interval of time between Old Faithful’s eruptions?
[Key: a. The Year-to-Date distribution appears to be skewed to the left (negative). Most of the intervals
approach 90 minutes. In a normal distribution, the peak would be in the middle. b. Last Week’s distribution seems more skewed to the left than Last Month’s. It is also more asymmetric. Last
Month’s distribution appears to have the highest percent of intervals longer than 1 hour 30 minutes between eruptions.
c. The Year-to-Date distribution shows Old Faithful rarely erupts an hour after its previous eruption. Most visitors will have to wait more than 90 minutes to see two eruptions.]
3) A fast food restaurant wants to determine if the season of the year affects the choice of soft drink size purchased. They surveyed 278 customers and the table below shows their results. The drink sizes were small, medium, large, and jumbo. The seasons of the year were spring, summer, and fall. In the body of the table, the cells list the number of customers that fit both row and column titles. On the bottom and in the right margin are the totals.
a. In which season did the most customers prefer jumbo drinks? b. What percent of those surveyed purchased the small drinks? c. What percent of those surveyed purchased medium drinks in the summer? d. What do you think the fast-food restaurant learned from their survey?

Coordinate Algebra Study Guide
[Key: ]
4) This scatter plot suggests a relationship between the variables age and income. Answer the questions below based on the pictured scatter plot.
a. What type of a relationship is suggested by the scatter plot (positive/negative, weak/strong)? b. What is the domain of ages considered by the researchers? c. What is the range of incomes? d. Do you think age causes income level to increase? Why or why not?
[Key: ]
5) Consider the residual plot below. Each vertical segment represents the difference between an observed weight and a predicted weight of a person, based on height.
a. Do you think the regression line is a good predictor of weight? b. Why do the residuals appear to be getting longer for greater heights?

Coordinate Algebra Study Guide
[Key; ]
6) Dana’s scores on her six math tests are 80, 86, 83, 79, 84, and 80. She scored a 46 on her seventh test. Which values will be the most affected by this score? A. mean and median B. mean and mean absolute deviation C. median and interquartile range D. interquartile range and mean absolute deviation
[Key: B]
7) The two-way frequency table represents the opinions of 160 adults about a current political issue.
The percent of women who disagree with the political issue is greater than the percent of men who disagree. Explain whether this statement is correct or incorrect.
[Key: ]
8) Three hundred seventy-five adults answered a survey about their car preference. The results are summarized in the two-way frequency table shown below.
What is the joint probability, rounded to the nearest tenth, of the age group over 40 and the color red? A. 4.8% B. 14.4% C. 19.8% D. 34.2%
[Key; A]

Coordinate Algebra Study Guide
9) A factory explored the production process by relating the number of units produced per hour to the number of
employees who assembled the product. The scatter plot shows the relationship between the two quantities.
Which equation best describes this data?
A.
B.
C.
D.
[Key; B]
10) The table shows the relationship between the average monthly low temperature and the average daily sales of snow shovels at a hardware store each month.
Part A
The line of best fit for this data has a correlation coefficient of Explain what this means in the context of the problem.
Part B
Janet says the correlation coefficient shows causation. Do you agree or disagree with her? Explain why you agree or disagree.
[Key: ]
Coordinate Algebra Study Guide
Unit 5: Transformations in the Coordinate Plane
You should be able to:
• describe and compare function transformations on a set of points as inputs to produce another set of points as outputs, including translations and horizontal or vertical stretching
• represent and compare rigid and size transformations of figures in a coordinate plane using various tools such as transparencies, geometry software, interactive whiteboards, waxed paper, tracing paper, mirrors and digital visual presenters.
• compare transformations that preserve size and shape versus those that do not.
• describe rotations and reflections of parallelograms, trapezoids or regular polygons that map each figure onto itself.
• develop and understand the meanings of rotation, reflection and translation based on angles, circles, perpendicular lines, parallel lines and line segments.
• transform a figure given a rotation, reflection or translation using graph paper, tracing paper, geometric software or other tools.
Vocabulary
• Angle: A figure created by two distinct rays that share a common endpoint (also known as a vertex). ∠ABC or ∠B or ∠CBA
indicate the same angle with vertex B.
• Angle of Rotation: The amount of rotation (in degrees) of a figure about a fixed point such as the origin.
• Bisector: A point, line or line segment that divides a segment or angle into two equal parts.
• Circle: The set of all points equidistant from a point in a plane.
• Congruent: Having the same size, shape and measure. ∠A ≅ ∠B indicates that angle A is congruent to angle B.
• Corresponding angles: Angles that have the same relative position in geometric figures.
• Corresponding sides: Sides that have the same relative position in geometric figures.
• Endpoint: The point at each end of a line segment or at the beginning of a ray.
• Image: The result of a transformation.
• Intersection: The point at which two or more lines intersect or cross.
• Isometry: a distance preserving map of a geometric figure to another location using a reflection, rotation or translation.
indicates an isometry of the figure M to a new location M’. M and M’ remain congruent.
• Line: One of the undefined terms of geometry that represents an infinite set of points with no thickness and its length continues in
two opposite directions indefinitely. indicates a line that passes through points A and B.
• Line segment: A part of a line between two points on the line. indicates the line segment between points A and B.
• Parallel lines: Two lines are parallel if they lie in the same plane and do not intersect. indicates that line AB is parallel
to line CD.
• Perpendicular lines: Two lines are perpendicular if they intersect to form right angles. indicates that line AB is
perpendicular to line CD.
• Point: One of the basic undefined terms of geometry that represents a location. A dot is used to symbolize it and it is thought of as having no length, width or thickness.
• Pre-image: A figure before a transformation has taken place.

Coordinate Algebra Study Guide
• Ray: A part of a line that begins at a point and continues forever in one direction. indicates a ray that begins at point A and
continues in the direction of point B indefinitely.
• Reflection: A transformation of a figure that creates a mirror image, “flips,” over a line.
• Reflection Line (or line of reflection): A line that acts as a mirror so that corresponding points are the same distance from the mirror.
• Rotation: A transformation that turns a figure about a fixed point through a given angle and a given direction, such as 90°
clockwise.
• Segment: See line segment.
• Transformation: The mapping, or movement, of all points of a figure in a plane according to a common operation, such as translation, reflection or rotation.
• Translation: A transformation that slides each point of a figure the same distance in the same direction.
• Vertex: The location at which two lines, line segments or rays intersect.
Web Resources:
• Unit 5 Weebly: http://hcbemath9.weebly.com/unit-5.html
• Transformational Geometry Applet http://www.howe-two.com/nctm/index.html This page contains animations helpful for presenting and visualizing transformations. For some of the applets on this page you may need a minute to familiarize yourself.
• Transformations in the Coordinate Planehttp://www.virtualnerd.com/middle-math/integers-coordinate-plane/transformations This link has helpful short videos on the different rigid motion transformations.
• Learnist http://learni.st/users/S33572/boards/2623-transformations-in-the-coordinate-plane-common-core-standard-9-12-g-co-2 This website links to many other helpful websites with notes on transformations.
Practice Items
1) Specify a sequence of transformations that will map ABCD to PQRS in each case.
[Key: ]

Coordinate Algebra Study Guide
2) Describe every transformation that maps the given figure to itself.
[Key: ]
3) A rectangle, GHKL , and its image, are shown on the graph below.
Which choice best describes the transformation of GHKL to
A.
B.
C.
D.
[Key: C]

Coordinate Algebra Study Guide
4) Regular pentagon JKLMN is shown with the center located at point H .
Which rotation, about the center, would produce an image that would map directly onto pentagon JKLMN ?
A.
B.
C.
D.
[Key; D]
5) Triangle RST is graphed on the coordinate grid shown below.
Part A
Carlos first translated 3 units to the left to become What are the coordinates of the vertices of Show your work or explain your answer. Part B
He then reflects across the x -axis to become What are the coordinates of the vertices of Show your work or explain your answer. Part C
Carlos then performs two different transformations on The coordinate grid shows the result of the two transformations. What could
be the two transformations he performed on in the correct order, to produce shown below? Show the coordinates of both of the transformations.

Coordinate Algebra Study Guide
[Key:
6) Triangles ABC and are graphed below. Triangle rotation of triangle ABC about point
Beth wrote the following statements about the two graphed triangles.
I. The corresponding sides are parallel to each other. II. The angles of the original and rotated triangles are congruent. III. The areas of the original triangle and rotated triangle are equal.
Which statements are true? A. Statement II only B. Statements I and III only C. Statements II and III only D. Statements I, II, and III
[Key; C]

Coordinate Algebra Study Guide
Unit 6: Coordinate Algebra through Coordinates
You should be able to:
• find the point that partitions a directed segment into a given ratio.
• determine if a given pair of lines are parallel, perpendicular, or neither.
• determine the equation of the line parallel or perpendicular to a given line and passing through a given point.
• use distance and slope concepts to prove geometric theorems algebraically.
• find perimeter of polygons and area of triangles and quadrilaterals.
Vocabulary:
• Distance Formula: d = 2
12
2
12 )()( yyxx −+−
• Formula for finding the point that partitions a directed segment AB at the ratio of a : b from A(x1, y1) to B(x2, y2):
−
++−
++ )(),( 121121 yy
ba
ayxx
ba
ax
or
+−
++−
+112112 )(,)( yyy
ba
axxx
ba
a
or
+
+
+
+
ab
ayby
ab
axbx 2121 , ���� weighted average approach
Web Resources:
• Unit 6 Weebly: http://hcbemath9.weebly.com/unit-6.html
• Distance Formula Applet
http://www.mathwarehouse.com/algebra/distance_formula/interactive-distance-formula.php
This applet shows the distance formula in action based on different points on grid. This resource is helpful for an introduction on
the distance formula.
• Quadrilaterals Overview
http://www.cut-the-knot.org/Curriculum/Geometry/Quadrilaterals.shtml
This page has a helpful overview of quadrilaterals and an applet that names a quadrilateral as you move its vertices. The page
includes a flow chart of quadrilaterals with inclusive definition of trapezoid.
Practice Items:
1) The line p is represented by the equation y = 4x + 1. What is the equation of the line that is perpendicular to line p and passes through
the point (8, 5)?
[Key; " = ��
�� � 7]
2) Juan graphs the equation of line n as On the same coordinate grid, Sara graphs the equation of line p as
Explain how Juan can justify that lines n and p are parallel.
[Key: Both lines have a slope of ��
so they are parallel]
Coordinate Algebra Study Guide
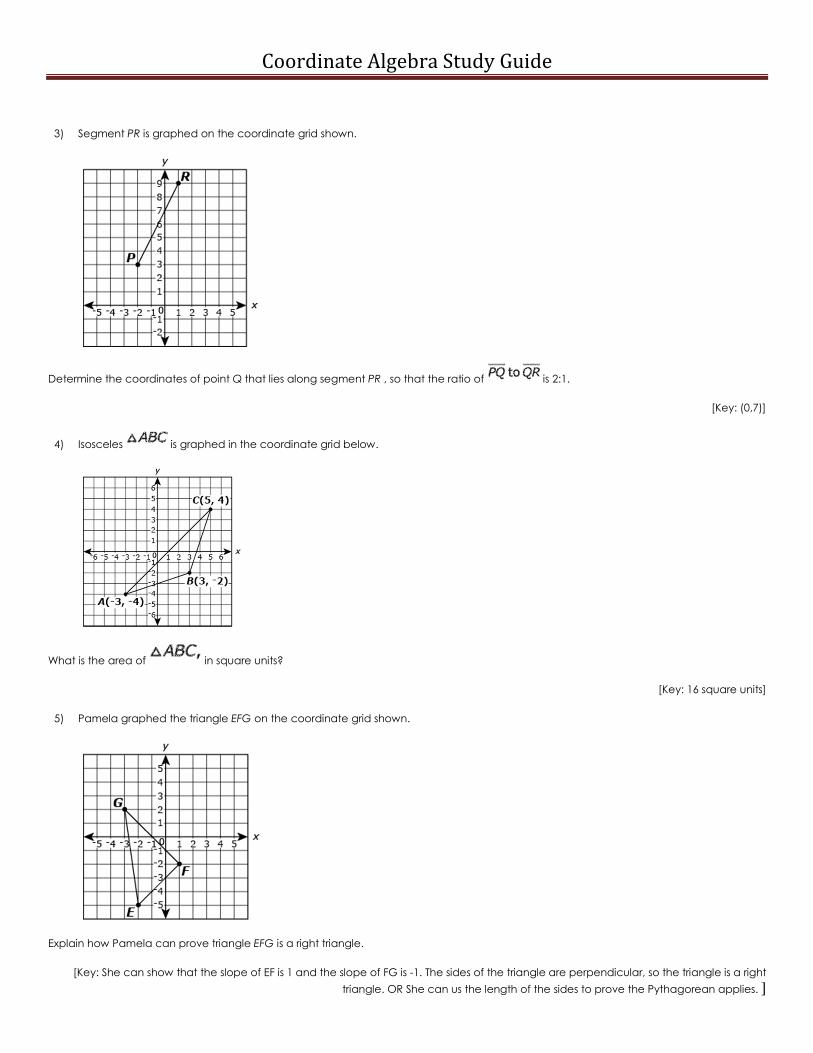
3) Segment PR is graphed on the coordinate grid shown.
Determine the coordinates of point Q that lies along segment PR , so that the ratio of is 2:1.
[Key: (0,7)]
4) Isosceles is graphed in the coordinate grid below.
What is the area of in square units?
[Key: 16 square units]
5) Pamela graphed the triangle EFG on the coordinate grid shown.
Explain how Pamela can prove triangle EFG is a right triangle.
[Key: She can show that the slope of EF is 1 and the slope of FG is -1. The sides of the triangle are perpendicular, so the triangle is a right
triangle. OR She can us the length of the sides to prove the Pythagorean applies. ]

Coordinate Algebra Study Guide
6) The diagram shows
N is the midpoint of and M is the midpoint of Part A
If is drawn, what is its length? How does that length compare to the length of What conclusion can you make from these results? Part B
If is drawn, what is its slope? How does that slope compare to the slope of What conclusion can you make from these results?
[Key: ]