copyright© 2015 the bank of saga ltd. all rights reserved ... · the bank of saga is a regional...
TRANSCRIPT

Copyright© 2015 THE BANK OF SAGA LTD. All rights reserved.A NN U A LR E P O R T 2 0 1 7
P r o f i l e
A Mes sage f r om t he Managemen t
Managemen t Po l i cy
Rev iew o f Oper a t i ons
F inanc ia l H igh l igh t s
F inanc ia l S ec t i on
C or po r a te Da t a

Back to Cover THE BANK OF SAGA _ ANNUAL REPORT 2017
Profile
The Bank of Saga is a regional bank with its base of operations in Saga and Fukuoka prefectures in northern Kyushu, the westernmost of Japan’s four main islands. The region’s advantageous location at Japan's western edge and its proximity to other Asian countries, as well as Fukuoka Prefecture’s leadership in the Kyushu economy made it one of Japan’s most vital regions.
The Bank of Saga’s history dates back over 130 years to the establishment in 1882 of its earliest forerunner, the Imari Bank. The following decades saw a series of mergers with other banks based mainly in Saga Prefecture, a process that eventually led to the establishment of the Bank of Saga in 1955. Today, the Bank handles a significant share of the banking business in Saga Prefecture.
The Bank of Saga’s management policy centers on a commitment to “maintaining close relationships with regional customers and ensuring sound manage-ment.” This policy underlies all the Bank’s efforts to promote industrial development and growth throughout the region and to secure affluent lives for its residents by providing high-quality services that assure full customer satisfaction.
As of March 31, 2017, the Bank of Saga’s balance of deposits (including negotiable certificates of deposit) amounted to ¥2,163,545 million (US$19,284 million) on a non-consolidated basis and its total assets amounted to ¥2,334,983 million (US$20,812 million). A total of 1,500 employees were serving customers in the Bank’s network of 103 branch offices.
A Message from the Management
Management Policy Review of Operations Financial Highlights Financial Section Corporate Data
A Message from the Management
I would like to take this opportunity to express our heartfelt gratitude for your continuous patronage and support for the Bank of Saga.
We are pleased to present you our “Annual Report 2017” that summarizes We are pleased to present you our “Annual Report 2017” that summarizes the Bank’s management policies, as well as its business performance for fiscal 2016.the Bank’s management policies, as well as its business performance for fiscal 2016.
With the aim of establishing the “Bank of Saga brand” in order to remain an With the aim of establishing the “Bank of Saga brand” in order to remain an indispensable bank for our customers and shareholders, as well as for the region as a indispensable bank for our customers and shareholders, as well as for the region as a whole, the Bank’s directors and general employees will join forces in concerted efforts whole, the Bank’s directors and general employees will join forces in concerted efforts to further enhance our business performance and improve our services.to further enhance our business performance and improve our services.
We hope that we can count on your never-ending patronage and kind We hope that we can count on your never-ending patronage and kind support as we pursue these endeavors going forward.support as we pursue these endeavors going forward.
July 2017July 2017Yoshihiro Jinnouchi, PresidentYoshihiro Jinnouchi, President
Profile / A Message from the Management
Management Policy Review of Operations Financial Highlights Financial Section Corporate Data

Back to Cover THE BANK OF SAGA _ ANNUAL REPORT 2017
A Clear Perspective on the Future witha View to Regional Development
Management Policy
Medium-Term Management Plan
With the environment surrounding financial institutions facing changes of unprecedented scaleand intensity, the Bank has formulated a three-year medium-term management plan
to reinforce its management base and strengthen its management culture.
Basic Management Principles
As a regional bank with its roots deeply embedded in the community, the Bank promotes the development of local industries and dedicates itself to assuring a high standard of living for regional residents and enriching the regional culture.
The Bank seeks to enhance its services to assure continued customer satisfaction. It satisfies the expectations of its shareholders as well by pursuing management that responds quickly and accurately to changes in the times.
The Bank seeks to ensure that every employee enjoys an affluent life by providing an optimal working environment and cultivating a corporate climate that emphasizes respect for others.
The Bank’s Fundamental Thinking
Shaping the region’s future together15th Medium-Term Management Plan
Contributing to localcommunity development
Responding to the trust of customers and shareholders
Improving employeewelfare
SPECIFIC INITIATIVES
BASIC PRINCIPLES
This fiscal year, the Bank launched its 15th Medium-Term Management Plan (April 1, 2016 to March 31, 2019). The management will continue to exert their maximum concerted efforts to make the Bank of Saga an entity that “shapes the region’s future together with customers,” by constantly coming up with flexible and new ideas, and by building up a Bank-wide readiness to cope with the diverse needs and expectations of customers.
We are committed to contributing to regional revitalization by helping customers grow their business through services such as assessment of business feasibility, and thus expanding the circle of growth in the whole region.
We are committed to spending more time with customers and providing them high-quality services tailored to their needs both as a lifestyle and business partner.
Rapidimprovement of
productivity
Strengthening of personnel and
enhancement of specialized capabilities
In its commitment to maintaining “close relationships with the citizens of its region and sound, stable management,” the Bank of Saga provides
high-quality financial services and contributes to local community development through its operations as a regional financial institution.
Furtherimprovement of
CS & ES
Profile / A Message from the Management
Management Policy Review of Operations Financial Highlights Financial Section Corporate Data

Back to Cover THE BANK OF SAGA _ ANNUAL REPORT 2017
0
5
10
0200400600800
1,0001,2001,4001,6001,8002,0002,200
Balance of deposits/Balance of loans and bills discounted
(Unit: Billion yen)
Balance of deposits Balance of loans and bills discounted
March 2017March 2013 March 2014 March 2015 March 2016
1,34
5
1,45
6
1,24
5
1,28
8
2,08
3
2,15
8
1,41
42,
099
1,96
0
2,01
8
Net business profit(Unit: Billion yen) (Unit: Billion yen) (Unit: Billion yen) (Unit: Billion yen)
Current net income Ordinary profit Net core business profit
March2013
March2014
March2015
March2016
March2017 2013 2014 2015 2016 2017 2013 2014 2015 2016 2017 2013 2014 2015 2016 2017
0
5
10
March March March March March0
5
10
March March March March March0
7.5
15
March March March March March
8.4
6.45.4
3.74.4
2.1
4.9
3.2 2.83.2
5.5
7.4
5.4
3.3
5.6 8.3 8.3
11.913.0
6.0
Net business profitNet business profit is an indicator of profit particular to banks that shows the results for their basic banking services. It is calculated by subtracting “expenses” and “transferred general provisions for loan losses” from the total of four items: “profit from funds” generated through management and procurement of deposits, loans and bills accounted for and marketable securities; “profit from service transactions, etc.” denoting income and expenditures associated with various service charges; “profit from particular transactions” indicating income and expenditures associated with short-term trading of government bonds, etc.; and “other operating profit” showing profits and losses from bond trading, foreign currency exchange and other such operations.
Net core business profitNet core business profit comprises net business profit before general provisions for loan losses are transferred after adjusting the results of the final calculation of five bond accounts. It is associated with the Bank’s fundamental ability to achieve profitability.
Financial and economic environmentDuring the 2016 fiscal year, Japanese economy has benefited from improvements of corporate earnings as in addition to recovery of personal consumption, there has also been a perceivable increase in exports, driven forth by a number of factors including the fair wind of a weak yen rate. In the meanwhile, the Cabinet Office and the Bank of Japan raised their assessments of the economy at the end of the year, and the trend of moderate recovery has been continuing from that time on also.
Overseas, although there were such turbulent events as the withdrawal of the United Kingdom from the European Union and the presidential election in the U.S., on the whole, the economy continued on a firm path as can be seen for example in the decision of the U.S. to raise interest rate twice within the year. However, we need to watch carefully whether the situation continues to be favorable against the backdrop of diminished expectations towards the policy operation in the U.S., political situation in Europe, and the expected slowdown of the economy in China.
The economy in the northern Kyushu area, around which the Bank of Saga operations primarily revolve, has been recovering. Although the area had to deal with the adverse impact of the Kumamoto earthquake, which happened in the beginning of the fiscal year, amidst recovery efforts, personal consumption improved driven forth by improvements in the employment conditions, and business activities are also on the road to recovery.
In the financial industry, even after the Bank of Japan launched a new framework for monetary easing, the financial market has more or less settled down, and against the backdrop of the continuing new investment management environment with its negative interest rate policy, in the market of loans for both business enterprises and individuals, interest rates continue at very low levels.
Results of operations for fiscal 2016Operating under these challenging conditions, the Group's directors and general employees have joined forces in concerted efforts to improve the Bank's business results and optimize its operating efficiency.
These and other efforts produced the following results of operations for the fiscal year under review:
+ Deposits and loansThe total balance of deposits as of March 31, 2017 had grown by ¥58,200 million from the previous fiscal-end to ¥2,158,200 million thanks to an increase of personal deposits by ¥20,900 million and general corporate deposits by ¥34,400 million. On a regional basis, deposits increased to ¥52,200 in Saga Prefecture and to ¥4,400 million in Fukuoka Prefecture.
The total balance of loans and bills discounted recorded an increase by ¥42,200 million from the previous fiscal-end to ¥1,456,500 million. This is attributable to the fact that although loans for municipal corporations decreased from the previous fiscal-end by ¥17,800 million, feasibility loans mainly to small and medium-sized enterprises recorded an increase from the previous fiscal-end by ¥45 billion. On a regional basis, deposits increased to ¥9,900 million in Saga Prefecture and to ¥39,800 million in Fukuoka Prefecture.
In the area of securities, the Bank implemented efficient fund management in response to a perceived risk of future interest-rate fluctuations. As a result, securities rose by ¥31,300 million from the previous fiscal-end, to ¥667,800 million.
Furthermore, the capital adequacy ratio (domestic standard) was 7.68%, down 1.22% from the previous fiscal-end. Although we accumulated more profits than in
the previous fiscal-end, there was also an increase of the previous fiscal-end, there was also an increase of adjustment amount of the shareholders' equity made in adjustment amount of the shareholders' equity made in connection with the application of Basel III and return of connection with the application of Basel III and return of subordinated borrowings, which both resulted in a subordinated borrowings, which both resulted in a decrease of the core capital sum, and at the same time decrease of the core capital sum, and at the same time there was an increase in the risk assets following an there was an increase in the risk assets following an increase of loans.
Nonperforming loans ratio (ratio of receivables for Nonperforming loans ratio (ratio of receivables for which disclosure is mandatory under the Financial Reconstruction Law) stood at 2.46% on March 31, Reconstruction Law) stood at 2.46% on March 31, 2017, down from 2.54% as of March 31, 2016.2017, down from 2.54% as of March 31, 2016.
+ Profit conditionsIn the area of ordinary income, against the backdrop of In the area of ordinary income, against the backdrop of investment management environment with its very low interest rates, the Bank made revisions to the form of transactions to adapt to the market environment changes of the second half of the fiscal year. As a result, due to a decrease of gains on sales of bonds by ¥4,644 million from the previous fiscal year and other reasons, ordinary income was ¥43,508 million, down ¥4,812 million from the previous fiscal year.
In the area of ordinary expenses, although the Bank
recorded a decrease in interest expenses and non-personnel expenses of general and administrative expenses, with an increase in amortization of actuarial gains and losses on retirement benefit and a loss on sales gains and losses on retirement benefit and a loss on sales of bonds resulting from a revision of securities portfolio, of bonds resulting from a revision of securities portfolio, ordinary expenses decreased by ¥2,754 million from the ordinary expenses decreased by ¥2,754 million from the previous fiscal year, while ordinary profit decreased by previous fiscal year, while ordinary profit decreased by ¥2,059 million to ¥3,394 million. ¥2,059 million to ¥3,394 million.
Furthermore, current net income decreased by ¥359 Furthermore, current net income decreased by ¥359 million from the previous fiscal year to ¥2,859 million. million from the previous fiscal year to ¥2,859 million.
In the area of interest income, which serves as the In the area of interest income, which serves as the foundation of the Bank's revenue, interest and dividends foundation of the Bank's revenue, interest and dividends on securities was ¥7,932 million, up ¥289 million from on securities was ¥7,932 million, up ¥289 million from the previous fiscal year as a result of management of the previous fiscal year as a result of management of securities. On the other hand, although as the Bank has securities. On the other hand, although as the Bank has been operating in the negative interest rate policy been operating in the negative interest rate policy environment, there has been a decrease in the interest rate environment, there has been a decrease in the interest rate on loans, the balance satisfactorily exceeded that of the on loans, the balance satisfactorily exceeded that of the previous fiscal year, and the interest on loans and discounts at ¥18,343 million recorded is a mere ¥405 million decrease from the previous fiscal year, and a decrease of interest income by ¥101 million to ¥26,504 million.
Business Environment and Results of Operations
Profile / A Message from the Management
Management Policy Review of Operations Financial Highlights Financial Section Corporate Data

Back to Cover THE BANK OF SAGA _ ANNUAL REPORT 2017
Status of nonperforming loans as of end March 2017
Total receivables¥1,471.7 billion
Performing loans¥1,435.5 billion
Amount of nonperforming loans if partial direct write-offs had been conducted¥32.2 billion (2.20% of total)
Nonperforming loans¥36.2 billion
Amount corresponding to partial direct write-offs¥3.9 billion
* Nonperforming loans are receivables for which disclosure is mandatory under the Financial Reconstruction Law.* Because the Bank does not conduct partial direct write-offs, the corresponding amount is recorded as provisions for loan losses.
Nonperforming loans¥36.2 billion (2.46% of total)
End March2017
Change from previous year
Receivables for which disclosure is mandatoReceivables for which disclosure is mandatory under y under the Financial Reconstruction Law (A)
Amount equivalent to partial direct write-offs (B) (Note)fs (B) (Note)
Difference (C) = (A) – (B)
Total loan amount (including ordinaTotal loan amount (including ordinaT ry loans) (D)
(A) / (D) x 100
(C) / ((D) – (B)) x 100
End March2016
36.2
3.9
32.2
1,471.7
2.46%2.46%
2.20%
36.4
5.1
31.3
1,428.8
2.54%2.54%
2.20%
–0.2
–1.2
0.9
42.9
–0.08% point–0.08% point
0.00% point
(Status of receivables for which disclosure is mandato(Status of receivables for which disclosure is mandatory under the Financial Reconstruction Law)
Note:Because the Bank does not conduct partial direct write-offs, it records an equivalent amount as a provision for loan losses.
(Units: Billion yen, percentage)
+ Results of Group OperationsCompared to the previous consolidated fiscal-end, the results of the Bank's Group operations showed a growth of ¥57,100 million in the total balance of deposits to ¥2,150,900 million, a rise of ¥42,200 million in the total balance of loans and bills discounted to ¥1,456,500 million, and an increase in the securities of ¥30,800 million to ¥668,900 million as of March 31, 2017.
Compared to the previous accounting period, the Bank recorded decreases on a consolidated basis as follows: ordinary income down ¥4,911 million to ¥44,106 million, ordinary profit down ¥2,109 million to ¥4,057 million, and current net income also down ¥344 million to ¥2,898 million.
Status of Nonperforming LoansThe Bank’s ratio of loan assets for which disclosure is mandatory under the Financial Reconstruction Law (nonperforming loans) to total receivables stood at 2.46% on March 31, 2017, down from 2.54% as of March 31, 2016.The Bank of Saga does not conduct partial direct write-offs. Had it conducted partial direct write-offs, however, the ratio as of March 31, 2017 would have been 2.20% (as compared with 2.20% as of March 31, 2016).
Business Environment and Results of Operations
Profile / A Message from the Management
Management Policy Review of Operations Financial Highlights Financial Section Corporate Data

Back to Cover THE BANK OF SAGA _ ANNUAL REPORT 2017
Explanation of tef tef rms (Note 1) Tier 1 (core capital): The basic portion of equity capital, such as capital, capital reserves and earned reserves
Capital adequacy ratio (domestic standard) Capital equity (domestic standard)(Unit: %)
0
2
4
6
8
10
12
14
(Unit: billion yen)
0
120
End March 2017End March 2016 End March 2017End March 2016
Capitaladequacy
ratio8.90
Capitaladequacy
ratio7.68
Capitalequity102.5
Domesticstandard 4%
100
80
60
40
20
Capitalequity94.3
Capital adequacy ratioThe capital adequacy ratio (domestic standard) was 7.68%, down 1.22% from the previous fiscal-end. Although we accumulated more profits than in the previous fiscal-end, there was also an increase of adjustment amount of the shareholders' equity made in connection with the application of Basel III and return of
subordinated borrowings, which both resulted in a decrease of the core capital sum, and at the same time there was an increase in the risk assets following an increase of loans.
Furthermore, on a consolidated basis, the capital adequacy ratio (domestic standard) was 8.07%, down 1.25% from the previous fiscal-end.
Business Environment and Results of Operations
Profile / A Message from the Management
Management Policy Review of Operations Financial Highlights Financial Section Corporate Data

Back to Cover THE BANK OF SAGA _ ANNUAL REPORT 2017
Fundamental thinkingThe Bank of Saga is striving to achieve sustainable growth, enhance medium- to long-term corporate value, and realize the best possible corporate governance in order to remain an indispensable bank for our customers and shareholders. Based on the following basic concepts, it is implementing measures to achieve good corporate governance and appropriate management systems to sustain it.(Ⅰ) Respect the rights of shareholders, and secure impartiality.(Ⅱ) Consider the interests of stakeholders (including
local communities, customers, shareholders and employees), and collaborate with them appropri-ately.
(Ⅲ) Disclose properly and secure transparency of corporate information.(Ⅳ) Endeavor to strengthen the supervisory functions
over the Board of Directors through Independent Outside Directors, Independent Outside Auditors, and the Audit & Supervisory Board.
(Ⅴ) Hold constructive dialogue with shareholders who possess investment views that correspond with their medium- to long-term benefits.
Current corporate governance systemsThe Bank’s Board of Directors, which comprises 13 members, determines the Bank’s business execution and supervises the performance of the Directors. The Bank elected two external members to the Board of Directors as part of its efforts to strengthen the Board’s supervisory function, ensure the fairness of its decision-making and enhance its objectivity.
The Bank has adopted an auditor system, under which a Board of Auditors comprising four members, three of them external auditors, is responsible for auditing the execution of duties by Directors and providing appropriate advice.
In an effort to ensure the effectiveness and soundness of its corporate governance, moreover, the Bank has instituted a system under which its execution of business is audited and supervised from an
independent perspective by external directors and external auditors who have no experience of employment by the Bank or any member of its Group.
The Bank’s Articles of Incorporation stipulate that the Board of Directors shall comprise up to 14 members and the Board of Auditors up to 4 members.
The Bank of Saga is working to achieve greater depth and breadth in the deliberations of its Board of Directors and other governing bodies and to accelerate the decision-making process to facilitate quick, appropriate responses to the rapid changes occurring in its operating environment as well as to ensure proper execution of operations reflecting these changes.
The Board of Directors meets once a month, in principle, to consider matters prescribed by laws and regulations as well as to make decisions concerning important management issues. The Bank has also taken steps to reinforce the Board’s functions by clarifying the responsibilities of the Bank’s executive officers and determining the sphere of content of their reports to the Board of Directors.
The Executive Committee, comprising the President, Chairman and managing directors, meets once a week, in principle, to deliberate matters regarding the Bank’s regular operations at the request of the Board of Directors as a means of facilitating prompt decision-making. The Management Meeting and the Compliance Committee, moreover, a pair of bodies organized to augment corporate governance through discussions and examinations concerning the implementation status of operations and Bank-wide risk management, hold monthly and bimonthly meetings, respectively, with the President, Chairman, managing directors and external directors concerned in attendance. The Bank’s auditors also attend important management meetings, including Executive Committee, Board of Directors’ and Compliance Committee meetings, thus reinforcing the Bank’s “dynamic auditing function.”
Pursuant to the provisions of Article 427, Paragraph 1 of the Company Law, the Bank has entered into agreements with external directors and
Corporate Governance
external auditors, which provide that, in the event that external auditors, which provide that, in the event that an external director or external auditor causes damage an external director or external auditor causes damage to the Bank due to negligence of his/her duties, the to the Bank due to negligence of his/her duties, the liability of such external director or external auditor liability of such external director or external auditor shall be limited to the total amount specified in each shall be limited to the total amount specified in each item of Article 425, Paragraph 1 of the Company Law, item of Article 425, Paragraph 1 of the Company Law, only in case he/she has performed his/her duties in only in case he/she has performed his/her duties in good faith and without gross negligence.
Profile / A Message from the Management
Management Policy Review of Operations Financial Highlights Financial Section Corporate Data

Back to Cover THE BANK OF SAGA _ ANNUAL REPORT 2017
Today’s ongoing diversification and advancement of financial operations are generating increasingly varied and complex risks for the banking business. It is an important issue for bank management to understand and manage these risks properly. The Bank has established the Risk Integration and Compliance Group in its Corporate Management and Coordination Department and the Profit Management Office in its General Planning Department as part of efforts to develop structures for compliance with laws and regulations and an integrated risk management structure for each category of risks.
Structure for compliance with laws and regulationsThe Corporate Management and CoordinationDepartment acts as a s as a s supervisory body with responsibility for overseeing the Bank’s systems for compliance with laws and regulations, and the Board of Directors has formulateda set ot ot f Basic Compliance Objectives and ComplianceStandards. WeWeW have also instituted the ComplianceCommittee with the President adent adent s chairman, moreover,r,r aspart of efforts to establish a structure that assurescompliance with laws and regulations.
Our er er fforts to reinforce the law-abiding spirit of ourdirectors and regular er er mployees include such measures asensuring that theyt theyt all keep the Compliance Guidecovering the Bank’s standards for comor comor pliance in dailyoperations on hand as a means of strengthening theircommitment tnt tnt o compliance with laws and regulations.In addition, we conducted a reexamination of ourevaluation system and, as a specific measure targeting our directors and key employees, introduced a “360-degreeevaluation” system in fiscal 2004 under which subordi-nates evaluate their bosses. We We W have also introducedevaluation procedures that place greater emphasis on matters concerning compliance with laws and regulationsinto our personnel and branch performance evaluation systems.
In these and other ways, we are making the most ofevery opportunityityit to create a climate of compliance.
Personal information managementSince the enforcement of the Act on the Protection of Personal Information in April 2005, and of the Act on the Use of Numbers to Identify a Specific Individual in the Administrative Procedure (My Number Act), in October 2015, and in accordance with our Personal Information Protection Declaration (Privacy Policy) and the Basic Policy Regarding the Handling of Specific Personal Information, we have placed the highest priority on earning the trust of customers (business partners, shareholders and regional residents), complying with the two aforementioned acts and related legislation, and protecting customers’ personal information.
In addition to making every effort to ensure proper handling of personal information by all our employees, we are introducing a variety of organizational, human and technological security measures to attain these goals. These include clarification of management responsibili-ties, enforcement of rules, introduction of IC card-based building entry/exit control systems, promotion of paperless documentation, and limitation of the use of recording media.
The Bank is particularly committed to strict management of the collection, use, provision and control of specific personal information, as prescribed separately.
Steps to reinforce internal auditingWith respect to internal auditing, the Bank has prepared auditing systems in response to revisions of the financial inspections manual and changes in laws and regulations, including the Financial Instruments and Exchange Law. WeWeW are reinforcing the auditing of ourmanagement systems, including those concerned withcustomer protection, our cr cr ompliance systems and our riskmanagement systems. WeWeW are placing a greater stresson process checking in our auditing operations,moreover, r, r to acquire a deeper unr unr derstanding of actual conditions. WeWeW are also upgrading our iing our iing our nternal auditing mechanisms as part of efforts to establish a moretransparent cort cort porate culture.
Structures for Compliance with Laws and Regulations and for Risk Management
Risk ManagementThe Bank has established a Risk Management Policy in The Bank has established a Risk Management Policy in accordance with strategic objectives deteaccordance with strategic objectives determined by the Board of Directors to ensure appropriate risk manageBoard of Directors to ensure appropriate risk manage-ment in an environment of increasingly varied and ment in an environment of increasingly varied and complex risks stemming from the ongoing diversification complex risks stemming from the ongoing diversification and advancement of financial operations.and advancement of financial operations.
Based on our Risk Management Policy and Risk Based on our Risk Management Policy and Risk
Management Regulations, moreover, we have not only r, we have not only rattained a grasp of currently existing risks with respect to those indicated in the accompanying risk manage-ment structure diagram, but we have also identified ment structure diagram, but we have also identified risks that may potentially occurisks that may potentially occur. We are introducing We are introducing Wmeasures to protect against these risks, and to respond measures to protect against these risks, and to respond appropriately in the event of their emergence.appropriately in the event of their emergence.
Integrated risk managementThe Bank has classified risks into the four categories of liquidity risk, market risk, credit risk and operational risk and designated one or more risk supervision departments for each with responsibility for conducting appropriate risk management according to the respective risk characteristics. The Corporate Management and Coordination Department conducts integrated management of all
these risks. This means that the Department controls risks within managerially permissible parameters by such means as measuring the level of risk through statistical methods and allocating risk capital with regard to market risk, credit risk and operational risk. The status of the integrated risks is reported at the monthly Management Conference, ALM meetings and other forums to realize prompt implementation of any requisite measures.
Appointment/dismissal Appointment/dismissalAppointment/dismissal
Board ofAuditors
InspectionDepartment
Internal Auditing
Board of Directors
ExecutiveDirectors’Meeting
Management ConferenceIssues regarding risks
ComplianceCommittee
Operations Adjustment Committee
AccountingAuditor
External Auditing
Liquidity risk
Corporate Management& Coordination Department
General Planning Department
(Supervision Departments)Market risk
Corporate Management& Coordination Department
General Planning Department
(Supervision Departments)Credit risk
Loan AdministrationDepartment
(Supervision Department)
Integrated Risk Management Group Corporate Management and Coordination Department
(Risk Integration and Compliance Group)
Integrated ALM Group General Planning Department (Profit Management Office)
Event risk
Corporate Management andCoordination Department
(Supervision Department)Reputation risk
General PlanningDepartment
(Supervision Department)Personal risk
Personnel PlanningDepartment
(Supervision Department)Operations Risk
Operations Administration& Support Department
(Supervision Department)Systems risk
System Department(Supervision Department)
Legal risk
Corporate Management andCoordination Department
(Supervision Department)
Operational RisksOverall administration:
Corporate Management andCoordination Department
General Meeting of Shareholders
Profile / A Message from the Management
Management Policy Review of Operations Financial Highlights Financial Section Corporate Data

Back to Cover THE BANK OF SAGA _ ANNUAL REPORT 2017
Financial Highlights
Millions of yen
Millions of yen
Thousands of U.S. dollars
Thousands of U.S. dollars
Consolidated 2017 2016 2015 2014 2017
Non-Consolidated 2017 2016 2015 2014 2013 2017
¥ 2,334,955
2,163,545
1,456,516
667,850
43,508
40,170
3,337
2,859
1,168
17.12
7
¥
¥
¥
¥
¥
¥ 2,292,796
2,100,229
1,414,305
638,161
49,017
42,907
6,109
3,242
1,251
¥
¥¥ 2,223,361
2,019,807 2,019,807
1,288,715 1,288,715
635,929
42,714
34,869
7,845
4,983
1,001
¥
¥ 2,304,264
2,083,432
1,345,089
680,800
42,063
35,393
6,670
3,316
1,168
¥
¥ 2,291,624
2,106,381
1,414,305
636,537
48,320
42,924
5,396
3,218
1,251
19.28
7
2,303,267
2,089,382
1,345,089
679,080
41,023
35,390
5,632
3,266
1,168
19.57
7
2,222,830
2,025,307
1,288,715
634,219
¥42,092
34,804
7,288
4,954
1,001
29.68
7
2,124,515
1,964,751
1,245,846
598,821
41,833
36,658
5,174
2,182
1,002
13.07
6
¥
¥
¥
¥
¥
¥
¥
¥
¥
¥
$ 20,815,628
19,220,000
12,982,588
5,962,911
393,144
357,494
35,650
25,832
10,419
$
$ 20,812,505
19,284,655
12,982,588
5,952,850
387,811
358,061
29,750
25,491
10,419
0.152
0.062
$
$
U.S. dollar amounts are converted, solely for convenience, at ¥112.19=US$1, the prevailing rate on March 31, 2017
U.S. dollar amounts are converted, solely for convenience, at ¥112.19=US$1, the prevailing rate on March 31, 2017
YenYenY U.S. dollars
2,335,305
2,156,291
1,456,516
668,978
44,106
40,107
3,999
2,898
1,168
Total Assets
Deposits (including NCDs)
Loans and Bills Discounted
Securities
Total Income
Total Expenses
Income (Loss) before Income Taxes
Net Income (Loss)
Cash Dividends
Total Assets
Deposits (including NCDs)
Loans and Bills Discounted
Securities
Total Income
Total Expenses
Income (Loss) before Income Taxes
Net Income (Loss)
Cash Dividends
Net Income (Loss) per Share
Cash Dividends per Share
Profile / A Message from the Management
Management Policy Review of Operations Financial Highlights Financial Section Corporate Data

Back to Cover THE BANK OF SAGA _ ANNUAL REPORT 2017
Consolidated Balance SheetsThe Bank of Saga Ltd. and its consolidated subsidiariesMarch 31, 2017 and 2016
Consolidated Statements of Operations and Retained EarningsThe Bank of Saga Ltd. and its consolidated subsidiariesYears ended March 31, 2017 and 2016
Assets
Liabilities
Net Assets
IncomeInterest Income: Loans and Discounts Securities OthersFees and CommissionsOther Operating IncomeOther Income Total IncomeExpensesInterest Expenses: Deposits Borrowings and Call Money OthersFees and CommissionsOther Operating ExpensesGeneral and Administrative ExpensesOther Expenses Total ExpensesIncome (Loss) before Income TaxesIncome Taxes: Current DeferredMinority Interests Net Income (Loss)
Per Share of Common Stock:Net Income (Loss)
2017
¥ 169,874 —
3,534 —
398 668,978
1,456,516 2,990 6,956
24,952 2,081
797 12,401
(14,177)2,335,305
1,514,167 —
31,504 —
3,553 5,962,911
12,982,588 26,651 62,009
222,409 18,555
7,106 110,538
(126,367)20,815,628
¥
¥ 2,156,291 5,048 2,144 2,775
59 20,379
686 8,053
12 328
2,389 4,047
12,401 2,214,617
19,220,000 45,000 19,114 24,734
528 181,647
6,119 71,780
115 2,925
21,300 36,077
110,538 19,739,883
16,062 11,375 62,195 (1,191)88,441 20,554
—8,307
(1,522)27,339
201 4,705
120,687 2,335,305
143,169 101,391 554,379 (10,619)788,320 183,210
—74,047
(13,568)243,689
1,794 41,940
1,075,744 20,815,628
¥
2017
¥
¥
¥
2016
¥ 180,446 —
3,421 —
400 638,161
1,414,305 3,198
27,255 24,859
2,530 860
12,253 (14,896)
2,292,796
¥
¥ 2,100,229 6,760
—15,370
144 21,717
681 8,622
11 281
3,354 4,049
12,253 2,173,477
16,062 11,375 60,838 (1,211)
86,609 21,879
—8,297 (1,932)
28,244 161
4,303 119,319
2,292,796
¥
2016
¥
¥
¥
2017
$ $
$
$
2017
$ 163,502 70,788
2,040 58,326 88,187 10,298
393,144
5,560 1,107
65 29,160 99,050
215,414 7,135
357,494 35,650
6,855 (668)
3,630 25,832
0.153
$
$
Thousands of Millions of yen (Note 2) U.S. dollars (Note 2)
Thousands of Millions of yen (Note 2) U.S. dollars (Note 2)
U.S. dollarsYen
The accompanying notes are an integral part of these financial statements.
The accompanying notes are an integral part of these financial statements.
Cash and Due from BanksCall LoansCommercial Paper and Other Debt PurchasedTrading AssetsMoney Held in TrustSecuritiesLoans and Bills Discounted (Note 4)Foreign ExchangesOther AssetsTangible Fixed AssetsIntangible Fixed AssetsDeferred Tax AssetsCustomers’ Liabilities for Acceptances and GuaranteesReserve for Possible Loan Losses
Total Assets
DepositsCall MoneyPayables under Securities Lending TransactionsBorrowed MoneyForeign ExchangesOther LiabilitiesAccrued Employees' BonusesAccrued Retirement BenefitsReserve for Directors' Retirement BenefitsReserve for Reimbursement of DepositsDeferred Tax LiabilitiesDeferred Tax Liabilities for Land Revaluation (Note 7)Acceptances and Guarantees
Total Liabiilities
Common Stock (Note 8)Capital SurplusRetained EarningsLess: Treasury Stock, at Cost
Total Shareholders’ EquityValuation difference on available-for-sale securitiesDeferred gains on hedgesLand Revaluation Reserve, Net of Tax (Note 7)Remeasurements of Defined Benefit Plans
Total Accumulated Other Comprehensive IncomeSubscription Rights to ShareMinority Interests
Total Net AssetsTotal Liabilities and Net Assets
18,343 7,941
228 6,543 9,893 1,155
44,106
623 124
7 3,271
11,112 24,167
800 40,107
3,999
769 (74)407
2,898
17.26
18,748 7,653
214 6,730
13,887 1,783
49,017
1,010 287
19 3,047
13,014 24,029
1,498 42,907
6,109
1,952 497 417
3,242
19.34
Consolidated Statements of Comprehensive IncomeThe Bank of Saga Ltd. and its consolidated subsidiariesMarch 31, 2017 and 2016
Net Income before minority interestsOther comprehensive income Valuation difference on available-for-sale securities Deferred gains on hedges Land Revaluation Reserve Defined benefit plans
Share of Other Comprehensive Income of Associates accounted for using Equity Method
Comprehensive Income(Breakdown) Comprehensive Income Attributable to Owners of the Parent Comprehensive Income Attributable to Minority Interests
2017¥ 3,305
(914)(1,324)
— —
410
0 2,391
1,983 407
29,462 (8,150)
(11,808)— —
3,657
0 21,312
2016¥ 3,660
(2,227)676
—213
(3,117)
(0)1,432
1,014 417
2017$
Thousands of Millions of yen (Note 2) U.S. dollars (Note 2)
The accompanying notes are an integral part of these financial statements.
Profile / A Message from the Management
Management Policy Review of Operations Financial Highlights Financial Section Corporate Data
Back to Cover THE BANK OF SAGA _ ANNUAL REPORT 2017
Balances at March 31,2016
Changes during the fiscal year
reflecting changes in accounting policies
Balance at the beginning of current period after
Cumulative effect of change in accounting policies
reflecting changes in accounting policies
Balance at the beginning of current period after
Cumulative effect of change in accounting policies
Dividends from surplus
Net income
Repurchase of treasury stock
Disposition of treasury stock
Cancellation of Treasury share
Transfer from revaluation
reserve for land, net of taxes
Change other than stockholders’equity(net)
Total changes during the fiscal year
Balance as of March 31,2017
Balances at March 31,2016
Changes during the fiscal year
Cumulative effect of change in accounting policies
Balance at the beginning of current period after
reflecting changes in accounting policies
Cumulative effect of change in accounting policies
Balance at the beginning of current period after
reflecting changes in accounting policies
Dividends from surplus
Net income
Repurchase of treasury stock
Disposition of treasury stock
Cancellation of Treasury share
Transfer from revaluation
reserve for land, net of taxes
Change other than stockholders’equity(net)
Total changes during the fiscal year
Balance as of March 31,2017
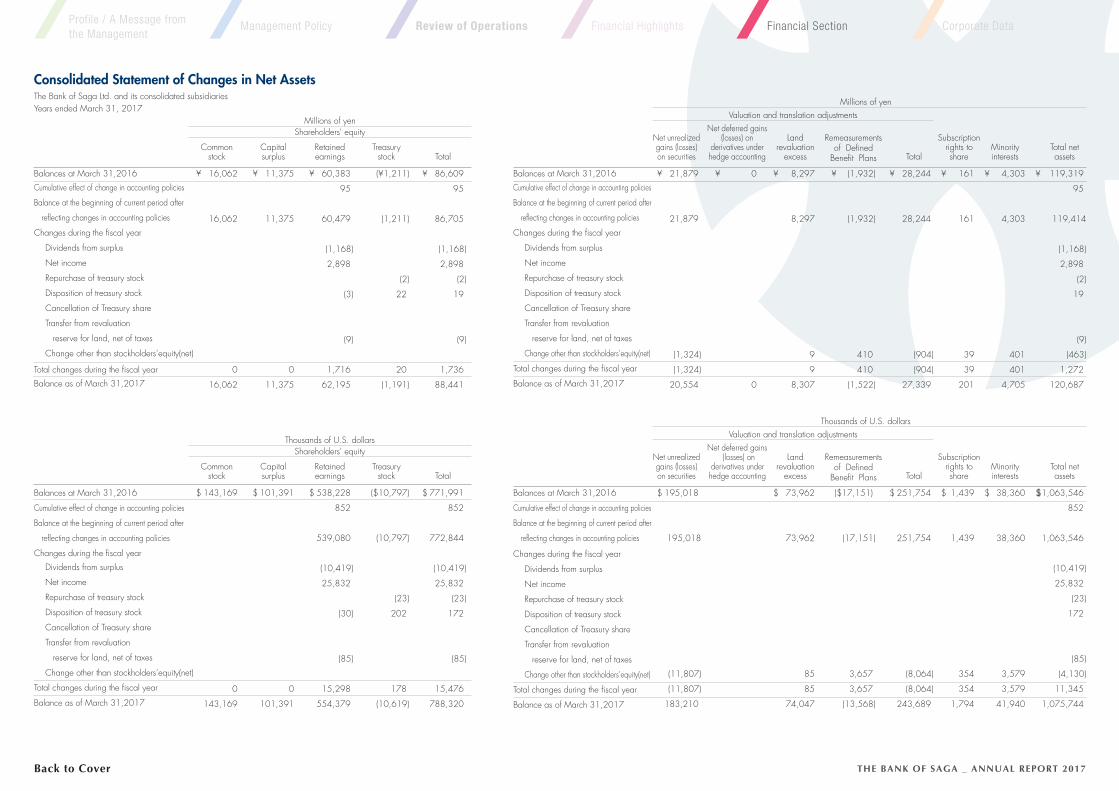
Consolidated Statement of Changes in Net AssetsThe Bank of Saga Ltd. and its consolidated subsidiariesYears ended March 31, 2017
Balances at March 31,2016
Changes during the fiscal year
Dividends from surplus
Net income
Repurchase of treasury stock
Disposition of treasury stock
Cancellation of Treasury share
Transfer from revaluation
reserve for land, net of taxes
Change other than stockholders’equity(net)
Total changes during the fiscal year
Balance as of March 31,2017
Commonstock
Commonstock
Net unrealizedgains (losses)on securities
Net unrealizedgains (losses)on securities
Capitalsurplus
Capitalsurplus
Net deferred gains(losses) on
derivatives underhedge accounting
Net deferred gains(losses) on
derivatives underhedge accounting
Treasurystock
Treasurystock
Total
Total
Retainedearnings
Retainedearnings
Remeasurementsof Defined
Benefit Plans
Remeasurementsof Defined
Benefit Plans
Landrevaluation
excess
Landrevaluation
excess
Total
Total
Subscriptionrights toshare
Subscriptionrights toshare
Minorityinterests
Minorityinterests
Total netassets
Total netassets
Millions of yenShareholders' equity
Thousands of U.S. dollarsShareholders' equity
Millions of yen
Thousands of U.S. dollars
Valuation and translation adjustments
Valuation and translation adjustments
¥ 16,062
16,062
0
16,062
143,169
0
143,169
101,391
0
101,391
538,228
852
539,080
(10,419)
25,832
(30)
(85)
15,298
554,379
($10,797)
(10,797)
(23)
202
178
(10,619)
771,991
852
772,844
(10,419)
25,832
(23)
172
(85)
15,476
788,320
$
¥
$
¥
$
¥
$
¥ 21,879
21,879
(1,324)
(1,324)
20,554
195,018
195,018
(11,807)
(11,807)
183,210
73,962
73,962
85
85
74,047
($17,151)
(17,151)
3,657
3,657
(13,568)
251,754
251,754
(8,064)
(8,064)
243,689
1,439
1,439
354
354
1,794
38,360
38,360
3,579
3,579
41,940
$1,063,546
852
1,063,546
(10,419)
25,832
(23)
172
(85)
(4,130)
11,345
1,075,744
8,297
8,297
9
9
8,307
(1,932)
(1,932)
410
410
(1,522)
28,244
28,244
(904)
(904)
27,339
161
161
39
39
201
4,303
4,303
401
401
4,705
119,319
95
119,414
(1,168)
2,898
(2)
19
(9)
(463)
1,272
120,687
0
0
$
¥
¥
¥
$ $
¥
$
¥
¥
$
¥
$
11,375
11,375
0
11,375
60,383
95
60,479
(1,168)
2,898
(3)
(9)
1,716
62,195
(¥1,211)
(1,211)
(2)
22
20
(1,191)
86,609
95
86,705
(1,168)
2,898
(2)
19
(9)
1,736
88,441
Profile / A Message from the Management
Management Policy Review of Operations Financial Highlights Financial Section Corporate Data

Back to Cover THE BANK OF SAGA _ ANNUAL REPORT 2017
Consolidated Statements of Cash FlowsThe Bank of Saga Ltd. and its consolidated subsidiariesYears ended March 31, 2017 and 2016
Cash Flows from Operating Activities: Cash Flows from Investing Activities:
2017
¥ 3,999
1,531
6
(9)
(719)
4
—
20
—
1
46
(26,514)
755
9,156
1
0
16
—
(42,211)
57,112
(1,049)
(95)
321
(112)
(1,712)
2,144
208
(85)
27,562
(849)
207
29,738
(2,184)
2
27,555
35,650
13,647
62
(81)
(6,408)
40
—
182
—
13
412
(236,331)
6,733
81,616
14
1
149
—
(376)
509,068
(9,356)
(853)
2,867
(1,001)
(15,262)
19,114
1,857
(760)
245,672
(7,571)
1,846
265,072
(19,474)
18
245,615
6,109
1,585
2
(12)
(129)
(26)
—
(7,116)
—
2
112
(26,616)
1,318
6,793
20
0
36
7
(69,216)
16,190
606
(121)
(281)
593
(12,466)
(4,309)
595
20
27,798
(1,464)
(830)
(60,797)
(1,211)
199
(61,809)
2017
(609,016)
516,433
69,651
—
—
(1,053)
(177)
32
—
(24,129)
—
(12,500)
(1,167)
(5)
(2)
0
(13,676)
(0)
(10,250)
179,638
169,387
(5,428,440)
4,603,205
620,839
—
—
(9,390)
(1,583)
289
—
(215,080)
—
(111,418)
(10,410)
(50)
(23)
0
(121,902)
(0)
(91,368)
1,601,195
1,509,826
¥
2016
¥
2016
(594,370)
540,721
62,276
—
—
(1,004)
(1,150)
0
—
6,472
—
—
(1,250)
(5)
(3)
0
(1,259)
(0)
(56,597)
236,234
179,638
¥
2017
$
2017
$
Thousands of Millions of yen (Note 2) U.S. dollars (Note 2)
Thousands of Millions of yen (Note 2) U.S. dollars (Note 2)
The accompanying notes are an integral part of these financial statements.
Income (Loss) before Income Taxes and Minority Interests
Depreciation
Impairment Losses
Income on Equity Method
(Decrease) Increase in Reserve for Possible Loan Losses
(Decrease) Increase in Accrued Bonuses
(Decrease) Increase in Accrued Retirement Benefits
(Decrease) Increase in Net Defined Benefit Liability
(Increase) Decrease in Net Defined Benefit Asset
(Decrease) Reserve for directors retirement benefits
(Decrease)Increase in Reserve for Reimbursement of Deposits
Interest and Dividend Income
Interest Expenses
(Income) Loss on Securities Transaction
(Income) Loss on Money Trust
Net exchange (gain) loss
(Income) Loss on Disposal of Properties
Net (Increase) Decrease in Trading Assets
Net (Increase) Decrease in Loans and Bills Discounted
Net Increase (Decrease) in Deposits
Net Increase (Decrease) in Negotiable Certificates of Deposits
Net Increase (Decrease) in Borrowed Money
Net (Increase) Decrease in Due from Banks (other than The Bank of Japan)
Net (Increase) Decrease in Call Loans
Net Increase (Decrease) in Call Money
Net Increase (Decrease) in Payables under Securities Lending Transactions
Net (Increase) Decrease in Foreign Exchange Assets
Net Increase (Decrease) in Foreign Exchange Liabilities
Revenues from Fund Operations
Expenditures on Fund Procurement
Others
Sub-total
Payment of Income Taxes
Refund of Income Taxes
Net Cash Provided by (Used in) Operating Activities
Purchase of Securities
Sales of Securities
Redemption of Securities
Increase in Money Held in Trust
Decrease in Money Held in Trust
Purchases of Tangible fixed Assets
Purchases of Intangible Fixed Assets
Proceeds from Sales of Tangible Fixed Assets
Proceeds from Sales of Intangible Fixed Assets
Net Cash Provided by (Used in) Investing Activities
Cash Flows from Financing Activities:
Increase in Subordinated Loans
Repayment of Subordinated Loans
Payment of Cash Dividends
Payment of Cash Dividends to Minority Interests
Purchases of Treasury Stock
Proceeds from execution of stock options
Net Cash Used in Financing Activities
Translation Adjustment of Cash and Cash Equivalents
Net Increase (Decrease) in Cash and Cash Equivalents
Cash and Cash Equivalents at Beginning of the Year
Cash and Cash Equivalents at End of the Year
Profile / A Message from the Management
Management Policy Review of Operations Financial Highlights Financial Section Corporate Data

Back to Cover THE BANK OF SAGA _ ANNUAL REPORT 2017
1. The Scope of Consolidated Financial Reporting and Application of The Equity Method
(a) The Scope of Consolidated Financial Reporting ・SAGIN BUSINESS SERVICE CO.,LTD. ・SAGIN COMPUTER SERVICE CO.,LTD. ・SAGIN CREDIT GUARANTEE CO.,LTD.(b) Application of the Equity Method ・SAGIN CAPITAL AND CONSUL CO.,LTD. ・SAGIN LEASE CO.,LTD.
2. Japanese Yen and U.S. Dollar AmountsYen amounts of less than ¥1 million have been disregarded. Accordingly, the sum of each account may in fact not be equal to the combined sum of the individual items. All U.S. dollar amounts included herein are presented solely for the convenience of readers, and are nothing more than arithmetical computations.
They are converted at the rate of¥112.19=US$1, the prevailing rate on the Tokyo foreign exchange market on March 31, 2017.
3. Significant Accounting Policies(a) Financial InstrumentsThe Bank and its consolidated subsidiaries apply the Accounting Standards for Financial Instruments to valuation of trading account securities, securities and derivative transactions, and hedge accounting.
(b) Transactions for Trading PurposesTransactions for “Trading Purposes” (purposes of seeking to capture gains arising from short-term changes in interest rates, currency exchange rates or market prices of securities and other market-related indices or from arbitrage between markets) are valued at market or fair value as of the balance sheet dates, and included in “Trading Assets” on a tradedate basis. Profits and losses on trading
Notes to Consolidated Financial StatementsThe Bank of Saga Ltd. (the “Bank”) and its consolidated subsidiaries
transactions are included in other operating income or expenses.
(c) Securitiesi. In conformity with the Accounting Standards for
Financial Instruments, securities are stated as follows:
Held-to-maturity debt securities are stated at amortized cost using the straight-line method, cost being determined by the moving-average method.
“Securities Available for Sale” defined by the standards are stated at fair market value when having market price and are stated at movingav-erage cost or amortized cost when having no market price. Unrealized valuation gains or losses on securities available for sale, net of applicable income taxes, are stated as a separate item in the consolidated balance sheets. Cost of the securities sold, in principle, is computed by the moving-average method.
ii. In accordance with the Uniform Rules for Bank Accounting, securities included in “Money Held in Trust,” which are designated for investments in securities and separately managed from other beneficiaries are valued by the same method as in (i.) above.
(d) DerivativesUnder the Accounting Standards for Financial Instruments, derivative transactions except for trading purposes transactions are stated at fair value.
Derivative transactions are executed and managed under the internal check system of the Bank in accordance with the established policies.
(e) DepreciationDepreciation of premises and equipment of the Bank
is calculated using the declining-balance method except for the buildings acquired after April 1, 1998 and accompanying facilities and structures acquired after April 1, 2016, which are depreciated using the straight-line method. Main useful lives of premises and equipment are as follows:
Buildings 3 to 60 years Equipment 2 to 20 years Premises and equipment held by the consoli-
dated subsidiaries are depreciated over the useful lives of the respective assets principally using the declining balance method.
Software for internal use held by the Bank is amortized over the useful lives of 5 years using the straight-line method. Software for internal use held by the consolidated subsidiaries is amortized over the useful lives of 5 years.
(f) Foreign Currency TranslationThe financial statements of the Bank and itsconsolidated subsidiaries are maintained in ortranslated into Japanese yen. Foreign currency assets and liabilities are translated into yen at the prevailing rates on the Tokyo foreign exchange market as of the uncollectible based on individual fair value assessment of collateral.
(g) Reserve for Possible Loan LossesThe Bank makes provision for possible loan losses in accordance with predetermined standards for write-offs and reserves. In line with the Guidelines for Governance on Asset Self-Assessment of Financial Institutions and Audits on Write-Offs and Reserves for Possible Loan Losses (JICPA Bank Auditing Special Committee Report No.4), the Bank has implemented a self-assessment rule for the credit quality of assets subject to disclosure under the Financial Reconstruction Law, and has classified them into four
risk categories: bankrupted, doubtful, substandard and normal.
The Bank provides a non-specific reserve for assets classified under “substandard” or “normal,” based on historical default rates. For assets classified under “doubtful,” the Bank provides a specific reserve in an amount deemed necessary after deduction of the estimated recoverable portion through disposition of collateral or implementation of guarantees. For assets classified under “bankrupted,” the Bank provides a specific reserve in an amount equivalent to the remaining portion of the assets after deduction of the estimated recoverable amounts through disposition of collateral or implementation of guarantees.
The consolidated subsidiaries provide a non-specific reserve in an amount deemed necessary based on historical default rates and a specific reserve for loans to potentially bankrupt borrowers and other specific loans in the amount deemed uncollectible based on individual fair value assessment of collateral.
(h) Reserve for Employees' Bonuses The reserve for bonuses is provided for payment of bonuses to employees, in the amount of estimated bonuses, which are attributable to the current fiscal year.
(i) Reserve for Directors' Retirement BenefitsThe reserve for directors’ retirement benefits is provided for payment of retirement benefits to directors, corporate auditors and other executive officers, in the amount deemed accrued at the fiscal year-end.
(j) Reserve for withdrawals of dormant depositsThe Bank provides a reserve for withdrawals of
dormant deposits on which it has previously recognized a profit. The Bank recognizes an amount that it estimates will be withdrawn in the future based on its past experience with such withdrawals.
Profile / A Message from the Management
Management Policy Review of Operations Financial Highlights Financial Section Corporate Data

Back to Cover THE BANK OF SAGA _ ANNUAL REPORT 2017
dormant deposits on which it has previously recognized a profit. The Bank recognizes an amount that it estimates will be withdrawn in the future based on its past experience with such withdrawals.
(k) Methods for Accounting Treatment of Retirement Benefits Payments
A method of attributing projected retirement benefits from a fixed amount standard due by the current fiscal year-end is applied for calculating the retirement benefit obligations. In addition, the amortization methods for prior service costs and actuarial gain (loss) are as follows:
Prior service costs is amortized using the straight-line method over a specified period (5 years) within the employees' average remaining service period at incurrence.
Actuarial gain (loss) is amortized using the straight-line method over a specified period (5 years) within the employee’s average remaining service period commencing from the next fiscal year of incurrence.
Our consolidated subsidiaries adopted a simplified method in calculating liabilities for retirement benefits and retirement benefit expenses by assuming the pension benefit obligation of the subsidiaries to be equal to the amount payable for voluntary retirement of all employees at fiscal year-end.
(l) Lease TransactionsAs for finance lease transactions that do not transfer rights of ownership, whose effective date preceded the start of the first fiscal year (on April 1, 2008) of application of the accounting standard for lease transactions, the Bank of Saga continues to apply the same method that uses to account for ordinary lease transactions.
(m) Methods of Significant Hedge Accountingi.Hedging Against Interest Rate Risk
The Bank of Saga applies deferred hedge accounting pursuant to the “Treatment for Accounting and Auditing of Application of Accounting Standard for Financial Instruments in Banking Industry” (issued by JICPA Industry Audit Committee Report No. 24) to manage interest rate risk arising from interest-earning assets and interest-bearing liabilities. As for the hedges to offset market fluctuation, the Bank of Saga assesses the effectiveness of such hedges by classifying the hedged items (such as loans) and the hedging instruments (such as interest rate swaps) by their respective maturity
ii.Hedging Against Exchange Fluctuation RiskThe Bank of Saga applies deferred hedge accounting pursuant to the “Treatment for Accounting and Auditing of Application of Accounting Standard for Financial Instruments in Banking Industry” (issued by JICPA Industry Audit Committee Report No. 25) to manage exchange fluctuation risk arising from lending or borrowing funds in different currencies. The Bank of Saga assesses the effectiveness of currency swap and foreign exchange swap transactions (the hedging instruments) executed for the purpose of offsetting the risk of changes in currency exchange rates by verifying that there are foreign-currency monetary claims and debts (the hedged items) corresponding to the foreigncur-rency positions.
(n) Accounting Treatment of Consumption TaxNational and local consumption taxes of the Bank of Saga and its consolidated subsidiaries are accounted for using the tax-excluded method.
(o) Statement of Cash FlowsThe balances of cash and due from banks on the balance sheet as of March 31, 2017 and 2016 were reconciled with cash and cash equivalents at end of year on the statements of cash flows as follows: Millions of yen 2017 2016Cash and Due from BanksDeposits with Banks(other than The Bank of Japan)Cash and Cash Equivalents
at End of Year
¥
¥
169,874
(486)
169,387
¥
¥
180,446
(808)
179,638
4. Loans and Bills Discounted Millions of yen 2017 2016Bills DiscountedLoans on NotesLoans on DeedsOverdrafts
Total
¥
¥
8,02173,007
1,209,214166,273
1,456,516
¥
¥
9,29558,846
1,186,814159,348
1,414,305
5. Non-Performing Loans Millions of yen 2017 2016Loans in BankruptcyPast due LoansRestructured Loans
Total
¥
¥
1,84727,1176,112
35,077
¥
¥
2,11328,696
4,67635,486
6. Land Revaluation ReserveIn accordance with the Law concerning the Revaluation of Land, the Bank revalued land held for its operations on March 31, 1998. Net unrealized gain was stated in net assets, net of applicable income taxes, as “Land Revaluation Reserve, Net of Tax,” amounting to ¥8,876 million as of March 31, 2017.
7. Common StockAs of March 31, 2017, Common Stock of the Bank consisted of 171,359 thousand shares issued. The authorized number of shares was 499,142 thousand.
8. Securities Millions of yen 2017 2016Government Bonds Municipal BondsShort-term Corporate
BondsCorporate Bonds
and DebenturesStocksOther Securities
Total
¥
¥
72,087249,587
—
121,41445,104
180,789668,978
¥
¥
70,475275,778
—
128,49438,122
125,291638,161
9. Foreign Exchange (Assets and Liabilities) Millions of yen
2017 2016(Assets)Due from Foreign
Correspondents Foreign Bills of
Exchange Bought Foreign Bills of
Exchange ReceivableTotal
¥
¥
2,741
32
2162,990
¥
¥
2,886
83
2273,198
Millions of yen2017 2016
(Liabilities)Foreign Exchange
Bills SoldForeign Bills Payable
Total
¥
¥
144459
¥
¥
21123144
Profile / A Message from the Management
Management Policy Review of Operations Financial Highlights Financial Section Corporate Data

Back to Cover THE BANK OF SAGA _ ANNUAL REPORT 2017
10. Other AssetsMillions of yen
2017 2016Prepaid ExpensesAccrued IncomeDerivative AssetsOthers
Total
¥
¥
532,4261,5602,9166,956
¥
¥
721,8312,905
22,44427,255
11. DepositsMillions of yen
2017 2016Current DepositsOrdinary Deposits Savings DepositsDeposits at NoticeTime DepositsOther DepositsNegotiable Certificates
of DepositTotal
¥
¥
100,8241,225,536
4,0814,595
796,97118,941
5,3422,156,291
¥
¥
109,0701,136,931
4,3744,877
819,03319,549
6,3912,100,229
12. Borrowed MoneyBorrowed money consisted of loans from other banks, including a subordinated loan in the amount of ¥2,775 million as of March 31, 2017.
13. Other Liabilities Millions of yen 2017 2016Income Taxes PayableAccrued ExpensesUnearned IncomeDerivative LiabilitiesOthers
Total
¥
¥
239919
2,4331,824
14,96120,379
¥
¥
9511,0232,4681,434
15,83921,717
14. Other Operating IncomeMillions of yen
2017 2016Gain on Foreign Exchange
TransactionsGain on Trading Purpose
TransactionsGain on Sales of BondsGain on Derivative InstrumentsOther
Total
¥
¥
—
411,7228,129
—
9,893
¥
¥
—
876,3667,411
2213,887
15. Other IncomeMillions of yen
2017 2016Gain on Sales of Stocks and
Other SecuritiesGain on Money Held in TrustReversal of Reserve for
Possible Loan LossesOthers
Total
¥
¥
103—
195855
1,153
¥
¥
451—
— 1,3321,783
16. Other Operating ExpensesMillions of yen
2017 2016Losses on Foreign Exchange
TransactionsLosses on Sales
of BondsLosses on Redemption
of BondsLosses on write-down
of BondsTotal
¥
¥
100
10,968
—
4311,112
¥
¥
58
12,918
—
3813,014
17. Other ExpensesMillions of yen
2017 2016Provision for Reserve for PossibleLoan LossesWritten-off LoansLosses on Sales of Stocks
and Other SecuritiesLosses on Devaluation of Stocks
and Other SecuritiesLoss from Management
of Money TrustOthers
Total
¥
¥
—
—
9
—
1788799
¥
¥
301—
24
646
20506
1,498
18. Subsequent EventThe following distribution of retained earnings for the year ended March 31, 2017 was resolved at the General Meeting of the Shareholders held on June 29, 2017.
Profile / A Message from the Management
Management Policy Review of Operations Financial Highlights Financial Section Corporate Data

Back to Cover THE BANK OF SAGA _ ANNUAL REPORT 2017
Organization Directors and Corporate Auditors
Corporate Data
Tokyo Branch
Fukuoka Headquarters
Head Office Business DepartmentOperations Support Department
Saga Prefecture61 branches
Fukuoka Prefecture38 branches
Nagasaki Prefecture3 branches
General Meeting of Shareholders
Board of Auditors
Corporate Auditors
Audit Office
Board of Directors
Directors Inspection Dept.
General Planning Dept.
General Affairs Dept.
Loan Administration Dept.
Operations Headquarters
Capital Markets Trading Dept.
Business Headquarters
Fukuoka Headquarters
Operations Administration & Support Department
Operations Support Dept.
Systems Dept.
Productivity Planning Dept.
Personnel Planning Dept.
Customer Service Office
Capital Markets Management Of�ce
Business Management Support Of�ce.
Business Planning Dept.
Centralized Operations Center
Financial Instruments & International Operations Center
Loan Center
Direct Sales Channel Of�ce
Business Support Dept.
Business Promotion Dept.
Promotion Of�ce
International Business Support Of�ce
Executive Directors' Meeting
Executive Director
Managing Directors
President
Secretariat
President
Yoshihiro Jinnouchi
Executive Director
Mitsunori Furukawa
Managing Directors
Akihisa Ueno
Hideaki Sakai
Sunao Imaizumi
Akira Tashiro
Bank Data
Head Office 7-20, Tojin 2-chome, Saga CitTojin 2-chome, Saga CitT yojin 2-chome, Saga Cityojin 2-chome, Saga Cit , Saga 840-0813, Japan, Saga 840-0813, Japan
Telephone: (0952) 24-5111Telephone: (0952) 24-5111T
Operations Support Dept. 3-35, Ohtakarakita-machi, Saga City, Saga 840-0802, Japan
Telephone: (0952) 25-4571Telephone: (0952) 25-4571T
Date of Incorporation July 1955
Capital ¥16 billion
Number of Offices 103
Number of Employees 1,500
Network
Directors
Tomio Nihei
Kingo Tominaga
Kazuyuki TsutsumiKazuyuki Tsutsumi
Hironao FurukawaHironao Furukawa
Shinzaburo NakamuraShinzaburo Nakamura
Tsutomu Kimura
Naoto Furutachi
Corporate Auditors
Kenji Tsuruta
(Standing Auditor)
Toshio Usui
Akinobu Onizaki
Syuichi Idera
Tokyo Representative Office
Corporate Management & Coordination Department
For “s” Project Team
Pro�ts Management Of�ce
Business Evaluation Of�ce
Profile / A Message from the Management
Management Policy Review of Operations Financial Highlights Financial Section Corporate Data