copyright by dan paapanyin kofi seedah 2014
TRANSCRIPT

Copyright
by
Dan Paapanyin Kofi Seedah
2014

The Dissertation Committee for Dan Paapanyin Kofi Seedah Certifies that this is
the approved version of the following dissertation:
RETRIEVING INFORMATION FROM HETEROGENEOUS
FREIGHT DATA SOURCES TO ANSWER NATURAL LANGUAGE
QUERIES
Committee:
Fernanda Leite, Supervisor
Carlos Caldas
Robert Harrison
Anu Pradhan
Randy Machemehl
C. Michael Walton
RETRIEVING INFORMATION FROM HETEROGENEOUS
FREIGHT DATA SOURCES TO ANSWER NATURAL LANGUAGE
QUERIES
by
Dan Paapanyin Kofi Seedah, B.S.C.E, M.S.E.
Dissertation
Presented to the Faculty of the Graduate School of
The University of Texas at Austin
in Partial Fulfillment
of the Requirements
for the Degree of
Doctor of Philosophy
The University of Texas at Austin
December, 2014

Dedication
I dedicate this dissertation to Him who gives me strength, my lovely wife, Edith, the boys
(David and Isaac), and my dad and mum, Dan (Sr.) and Mercy Seedah, whose desire was
to provide us with the best education and also get to know Him.
v
Acknowledgements
“For it is by grace you have been saved, through faith—and this is not from yourselves, it
is the gift of God— not by works, so that no one can boast.– Ephesians 2:8-9, NIV
The passage above describes how truly humbling this journey has been for Edith and me.
Going through this experience has definitely not been by our strength that we may boast,
but by His grace that we may acknowledge Him in all things. All praise be to the Lord
God Almighty through whom all things are possible. He gives strength to the weary and
increases the power of the weak (Genesis 1, Isaiah 40:29).
I will also like to express my sincere gratitude to the following individuals:
My academic supervisor, Dr. Fernanda Leite, who continually encouraged me to
pursue this degree and made it possible. I learned so much from you and I am very
grateful for the time and effort you invested in me. Thank you.
My research supervisor, Robert Harrison, who introduced me to freight planning and
guided me through the experience of understanding its core principles and concepts,
beyond what is found in the literature. You have been a great mentor.
Members of my committee, Dr. C. Michael Walton, Dr. Randy Machemehl, Dr.
Carlos Caldas and Dr. Anu Pradhan for sharing your vast knowledge in various areas
and guiding me through this process. I consider it an honor to have worked with you.
Dr. Duncan Stewart, for your encouraging words and assistance.
Edith, thank you for your love and support through these years. You are really
beautiful and you are a great inspiration for me.
David and Isaac, I desire that you grow up to know Him.
Dad, mum, Jennifer, Barbara, Harry, Alfred and Raymond, it is a great honor to have
you as family. You are the best.
vi
Retrieving Information from Heterogeneous Freight Data Sources to
Answer Natural Language Queries
Dan Paapanyin Kofi Seedah, Ph.D.
The University of Texas at Austin, 2014
Supervisor: Fernanda Leite
Abstract: The ability to retrieve accurate information from databases without an extensive
knowledge of the contents and organization of each database is extremely beneficial to
the dissemination and utilization of freight data. The challenges, however, are: 1)
correctly identifying only the relevant information and keywords from questions when
dealing with multiple sentence structures, and 2) automatically retrieving, preprocessing,
and understanding multiple data sources to determine the best answer to user’s query.
Current named entity recognition systems have the ability to identify entities but require
an annotated corpus for training which in the field of transportation planning does not
currently exist. A hybrid approach which combines multiple models to classify specific
named entities was therefore proposed as an alternative. The retrieval and classification
of freight related keywords facilitated the process of finding which databases are capable
of answering a question. Values in data dictionaries can be queried by mapping keywords
to data element fields in various freight databases using ontologies. A number of
challenges still arise as a result of different entities sharing the same names, the same
entity having multiple names, and differences in classification systems. Dealing with
ambiguities is required to accurately determine which database provides the best answer
from the list of applicable sources. This dissertation 1) develops an approach to identify

vii
and classifying keywords from freight related natural language queries, 2) develops a
standardized knowledge representation of freight data sources using an ontology that both
computer systems and domain experts can utilize to identify relevant freight data sources,
and 3) provides recommendations for addressing ambiguities in freight related named
entities. Finally, the use of knowledge base expert systems to intelligently sift through
data sources to determine which ones provide the best answer to a user’s question is
proposed.

viii
Table of Contents
List of Tables ...........................................................................................................x
List of Figures ........................................................................................................ xi
Chapter 1: Introduction ............................................................................................1
1.1 Motivation ..............................................................................................3
1.2 Research Questions And Overview of Research Approach ..................7
1.3 Scope and High Level Assumptions ....................................................10
1.4 Dissertation Overview .........................................................................12
Chapter 2: Capturing and Classifying Keywords from Freight Related Natural
Language Queries .........................................................................................13
2.1 Research Motivation ............................................................................13
2.2 Overview Of Research Approach ........................................................16
2.3 Background Research On Information Extraction And Named Entity
Recognition ..........................................................................................17
2.4 Research Approach For Capturing And Formalizing Keywords From
Freight Related Natural Language Queries ..........................................25
2.5 Comparison of Models .........................................................................38
2.6 Chapter Summary ................................................................................44
Chapter 3: Identifying Relevant Data Sources Using Freight Data Ontology .......47
3.1 Research Motivation ............................................................................47
3.2 Overview Of Research Approach ........................................................47
3.3 Background Research on Representing Multiple Freight Data Sources in a
Standardized Manner ...........................................................................48
3.4 Developing the Freight Data Ontology ................................................51
3.5 Querying the Ontologies ......................................................................59
3.6 Limitations of Current Approach .........................................................60
3.7 Validation .............................................................................................62
3.8 Chapter Summary ................................................................................68
ix
Chapter 4: Identifying and Addressing Ambiguities Between Named Entities and
Data Values ...................................................................................................71
4.1 Research Motivation ............................................................................71
4.2 Overview Of Research approach .........................................................73
4.3 Background on Named Entity Ambiguities for Freight Related Categories
..............................................................................................................74
4.4 Named Entity Disambiguation Strategies Amongst Freight Data Sources
..............................................................................................................81
4.5 Expert Systems – Moving Towards Intelligent Knowledge Based
Applications To Answer Freight Related Questions ...........................92
4.6 Chapter Summary ..............................................................................103
Chapter 5: Conclusion..........................................................................................106
5.1 Intellectual Contributions..............................................................107
5.2 Practical Implications....................................................................108
5.3 Limitations and Future Research Directions.................................109
Appendices ...........................................................................................................112
Appendix A - List of Freight Related Questions ........................................113
Appendix B - Annotated Freight Corpus ....................................................118
Appendix C - Freight Data Ontology Samples ...........................................136
Appendix D - Python Source Code Samples ..............................................137
References ............................................................................................................155

x
LIST OF TABLES
Table 1 Commonly Used Types of Named Entities (adapted from Bird 2009) ....18
Table 2: Named Entity Types for Freight-Related Natural Language Queries .....25
Table 3: Sample Queries Used in Testing and Comparing IE and NER Models ..28
Table 4: Prefixes and Suffixes Developed for Each Category ..............................36
Table 5: Quantitative Comparison of Models on Freight Queries .........................42
Table 6: Recommended hybrid sub-models ..........................................................43
Table 7: Sample Ontology Querying Result ..........................................................67
Table 8: Database Place Counts ............................................................................76
Table 9: Differences in Roadway Name Prefixes ..................................................77
Table 10: Differences in Commodity Code Classifications .................................79
Table 11: Addressing Roadway Name Ambiguity ...............................................86
Table 12: Results of commodity group search ....................................................90
Table 13: Search results based on the type of search performed. .........................91
Table 14: Validation of Querying Rules .............................................................101

xi
LIST OF FIGURES
Figure 1: Research Plan Overview ..........................................................................6
Figure 2: Research Approach...................................................................................7
Figure 3: IDEF0 Diagram for Capturing and Parsing Dynamic User Queries ......17
Figure 4: Pipeline architecture for IE and NER models ........................................26
Figure 5: A proposed architecture for Freight Related NER hybrid system..........44
Figure 6: IDEF0 diagram for identifying applicable freight data sources .............48
Figure 7: Schematic Representation of the RBCS .................................................54
Figure 8: Ontology for FAF3 Regional Database ..................................................55
Figure 9: An RDF graph with two nodes ...............................................................56
Figure 10: Expanding the Local Ontologies ..........................................................57
Figure 11: A data property can have multiple super-classes .................................59
Figure 12: An example of a single reference list for multiple local ontologies .....62
Figure 13: Sample RBCS mapping of query keywords .........................................63
Figure 14: Ontology Querying Results ..................................................................66
Figure 15: IDEF0 diagram for addressing ambiguities in keyword names ...........74
Figure 16: A combination of Mode of Transport names and sub-categories from
multiple sources ................................................................................78
Figure 17: Performance of Place Name Disambiguation Methods ......................85
Figure 18: Performance of Reduced Regex Method.............................................87
Figure 19: Performance of exact match with multi-search for addressing ambiguities
in mode of transport names ...............................................................88

1
CHAPTER 1: INTRODUCTION
Decision-makers benefit from access to accurate information to assess the
condition, performance and health of all systems (National Research Council 2003). In
the freight transport domain, information is required to understand the joint impacts of
transportation infrastructure on supply chains and commercial activities. Key information
sought by decision-makers includes: i) the amount and type of freight being moved on
the transportation network, ii) the location of bottlenecks and deteriorating infrastructure
on the network, iii) the adequacy of the network to support continued economic activity,
and iv) strategies to maintain and improve freight flow through the major trade gateways
and on national freight corridors (Figliozzi and Tufte 2009, Harrison et al. 2010, Federal
Highway Administration 2013).
Policy makers typically rely on analysts to answer questions relating to
infrastructure issues who, in turn, produce reports and models to provide the answers.
The setback with this approach is that data used in developing reports and models
becomes quickly outdated. Furthermore, in a domain such as transportation engineering
where large amounts of data are regularly collected, practitioners frequently find it
difficult to sift through the multiple data sources and find answers to questions.
Currently, while over forty freight related data sources are available, no single database
answers the range of user queries relating to freight movement or meets the changing
requirements for freight modeling (Mani and Prozzi 2004, Fischer et al. 2005, Cambridge
Systematics 2008, Chow et al. 2010, de Jong et al. 2012, Prozzi et al. 2012, Tavasszy et
al. 2012). While there are calls for additional data collection efforts through the use of
technology and data sharing partnerships (Cambridge Systematics et al. 2013, Seedah et
al. 2014), there still exists a need to effectively sift through the data sources to find the

2
best answers to a user’s query. The challenge is further complicated because data is
currently collected, stored, and disseminated by various agencies such as the U.S. Census
Bureau, Federal Highway Administration (FHWA), the Bureau of Transportation
Statistics (BTS), state departments of transportation, metropolitan planning organizations
(MPOs), and private sector agencies in a variety of formats, sampling frames and
frequencies. Retrieving, preprocessing, and understanding each data source requires
significant effort and time. The challenges in the literature can be categorized as follows
(Prozzi and Mani 2004, Tok et al. 2011, Seedah et al. 2014a, Walton et al. 2014):
● Differences in file storage formats such as tabulated text files, relational
databases, spreadsheets, geographic information system (GIS), web pages and
other web standard based file formats,
● Differences in data element definitions and scope for data elements with similar
names,
● Differences in commodity, industry and land use classifications systems,
● Differences in vehicle classification systems and modes of transport,
● Differences in the frequency at which data is collected and reported,
● Differences in sample sizes, data pre-processing and estimation techniques,
● Differences in data quality control, and
● Differences in the level of disaggregation and accuracy of the data being reported.
Providing individuals with the ability to retrieve accurate information from
database information systems without an extensive knowledge of the contents and
organization of each database is extremely beneficial to the accessibility and utilization of
data (Grosz 1983, Kangari 1987). Furthermore, providing decision-makers with the

3
ability to ask questions in conversational language and receive relevant answers is an
exciting prospect for many decision makers and stakeholders involved in policy
development, planning, management, and funding of infrastructure projects. Advances in
the artificial intelligence and information science domains provide an opportunity to
develop query capturing algorithms to retrieve information from multiple data sources
without the need for human interference or detailed background knowledge of each data
source.
1.1 MOTIVATION
Natural Language Processing (NLP) is an area of research that “explores how
computers can be used to understand and manipulate natural language text or speech to
[perform tasks]” (Chowdhury 2003). It is an active and growing research field (Liddy
2001, Google Scholar 2014) and its theories and technologies powers products such as
automatic language translation software, Google’s search engine (Google 2014), Apple’s
Siri (Apple 2014) and Microsoft’s Cortana personal assistant (Microsoft 2014). The
excitement in NLP applications lies in the ability for users to simply ask questions in
conversational language and receive answers — rather than trying to formulate a query
into sometimes unfriendly “unnatural” formats that machines can use to query a database
(Safranm 2014). The challenges, however, are:
1. Correctly identifying only the relevant information and keywords from questions
when dealing with multiple sentence structures, and
2. Automatically retrieving, preprocessing, and understanding multiple data sources
to determine which ones best answer a user’s query.

4
Off-the-shelf NLP systems can identify entities such as a person, a location, date,
time, and a geographical area, but are unable to perform freight related queries. Items
such as unit of measure, mode of transport, route names, and commodity names are not
built into existing systems. Furthermore, current systems were also found to incorrectly
classify freight-related entities—for example, distinguishing between point of origin and
point of destination. These systems need to be trained to perform freight-specific tasks
but that requires an annotated corpus of freight-related queries that currently do not exist.
In addition, navigating through heterogeneous data sources to determine which
ones provide the best answers to a user query is a challenge. As discussed in Seedah et al.
(2014b), freight data sources tend to be heterogeneous in terms of structure, syntax, and
semantics (Buccella et al. 2003). Structural or schematic heterogeneity deals with
differences in how the data is stored in the various databases (e.g., table schemas, primary
and foreign keys, etc.). Syntactic heterogeneity deals with differences in the
representation of the data, i.e., data types and formats (e.g., numeric, text, alpha-numeric
values, categorical, etc.). Semantic heterogeneity, which is the most challenging to
resolve, deals with differences in interpretation of the ‘meaning’ of the data (Merriam-
Webster 2014). Zhan and O’Brien (2000) classify the semantic heterogeneity as follows:
Semantically equivalent concepts: Different models use the same terms to refer to
the same concept, e.g., synonyms. However, there may be differences in property
types, e.g., the concept weight may be in tons or kilograms.
Semantically unrelated concepts: Data sources may use the same terms but with
different meanings, e.g., the concept channel may mean ship channel in the U.S.
Waterway database, and refer to a traffic channelization device in the Federal
Railroad Administration Safety Database.

5
Semantically related concepts refer to the generalization of different
classifications of concepts, e.g., the city Austin, Texas, in the Air Carrier Statistics
database will be referenced in the Commodity Flow Survey as Austin-Round
Rock, Texas.
Resolving freight data heterogeneity among multiple databases facilitates the integration
of data elements, enables interoperability between multiple systems, and simplifies the
exchange of data and information (Seedah et al. 2014b). Heterogeneity resolution first
involves identifying whether elements are related or independent. When dealing with
multiple databases and data elements, this process can be a challenging and time-
consuming task. Furthermore, there is currently no formalized approach used to address
data heterogeneity across multiple freight databases.
In summary, the three key motivations for this research work are illustrated in
Figure 1. The first motivation involves developing an approach to comprehend freight-
related natural language questions and classify keywords. Information gleaned from these
questions is then used to query a sample of available freight databases. However, a
standardized representation of the data sources is needed to query heterogeneous data
sources. The second motivation develops an approach which enables a single statement to
be utilized in querying multiple freight data sources. There are three possible outcomes
to querying multiple data sources i) only one database meets the search criteria, ii) two or
more databases meet the criteria, and iii) none of the databases meet the criteria. The first
outcome is quite straightforward, where the identified data source is queried using a
query rewriting algorithm and the output returned to the user. The second and third
outcomes are more complex as some queries may return multiple answers and the
challenge is determining which answer is the best amongst the possible options. The third

6
and final motivation for this research work examines ambiguities in named entities and
data values in order to develop approaches that automatically address these ambiguities.
The ultimate goal is that all the above described processes will not involve any human
interaction but rather infer from the information available to provide the best answer to a
user’s question.
Figure 1: Research Plan Overview

7
1.2 RESEARCH QUESTIONS AND OVERVIEW OF RESEARCH APPROACH
Three major research questions were developed to address information retrieval
from heterogeneous freight data sources to answer queries posed in natural language.
RQ 1: How can freight-related natural language queries be captured and classified to
retrieve information from heterogeneous databases?
RQ 2: How should heterogeneous freight data sources be represented and queried through
a shared vocabulary and knowledge base?
RQ 3: What strategies can be utilized to intelligently identify and address ambiguities
between classified keywords and values retrieved from the databases?
This dissertation proposes a three step research plan to examine the above
research questions. The research plan relies on advances made in the artificial
intelligence, information science and civil engineering domains. The overall research
approach is illustrated using an Integration DEFinition (IDEF0) diagram as shown in
Figure 2.
Figure 2: Research Approach

8
IDEF0 is an industry standard designed to model the decisions, actions, and
activities of a system. As a communication tool, it enables the representation of system
activities through simplified graphics for domain experts. As an analysis tool, it assists
modelers to identify the functions to be performed, their specific requirements, their
strengths and their weaknesses. Each function or activity is represented as a box with
input(s), control(s), reasoning mechanism(s) and output(s), which are constraints
represented as arrows (IDEF 2010, National Institute of Standards and Technology 1993,
Pradhan et al. 2011).
Research question 1 involves developing an approach to recognize and classify
freight related keywords using domain independent and domain dependent named entity
recognition techniques. The strengths and weaknesses of various methods are examined
and the best performing models are selected to classify each category.
Research question 2 involves developing a standardized knowledge representation
of freight data sources using an ontology that both computer systems and domain experts
can utilize to identify relevant freight data sources and answer user queries.
Research question 3 involves automatically identifying and addressing
ambiguities in named entities and data values using domain knowledge and rule-based
methods. Ambiguities arise as a result of different entities sharing the same names or
values, variants in entity names, and differences in definitions of entities with the same
name. Dealing with ambiguities is required to accurately query databases. Ambiguities
also result in non-responses to user queries despite the information being available in the
databases.

9
The final outcome of this dissertation are processes which computer systems can
utilize to intelligently recognize and sift through information to determine which
databases provide the best answers to a freight related question.

10
1.3 SCOPE AND HIGH LEVEL ASSUMPTIONS
The following sections describe the scope of work and high level assumptions of
this research work.
Types of User Queries
This dissertation seeks to advance the use of natural language recognition
techniques to accurately capture and formalize multiple freight-related questions. Upon
completion of research question 1, it was found that the structure and semantics of some
the questions were such that answers can only be provided either through surveys,
interviews or modeling approaches which are beyond the scope of this work. Thus in
Research Question 3 not all non-response queries will be addressed through the proposed
methodology.
Number of Freight Databases
As discussed earlier, there are over 40 freight related data sources identified in the
literature. This research work will limit the querying of databases to a subset of these data
sources for demonstration purposes. The proposed querying methodology involves
mapping data dictionaries to a commonly defined ontology. Chapter 3 – Identify Relevant
Data Sources Using a Freight Data Ontology – describes how the process is performed
and can be replicated across multiple freight data sources.
Size of the Selected Databases
Some of the databases were found to contain a large number of records requiring
significant computing time when performing queries. For demonstration purposes, this
research work will limit the content of these databases to only freight movement in
Texas. Examples of such databases include the Freight Analysis Framework Regional
database and highway traffic data. Other smaller national databases are included as some

11
of them can be queried directly from their data providers. Chapter 3 provides additional
information on which databases were selected and how their records are retrieved for this
research work.
Data Quality Control Procedures
This research work does not address freight data quality and assumes that the
quality control procedures followed by the reporting agencies are sufficient for the task to
be performed. Information on the methodology and limitations of the data sources
utilized in this research work are well documented and can be obtained through the data
providers’ website. Ongoing research work by Walton et al. (2014) also seeks to provide
a detailed description of differences in data collection methodologies inherent in
heterogeneous data sources and recommendations to address some of those differences.
Future research to advance this thesis work can incorporate the findings from Walton et
al. (2014) into the data integration and modeling workflows proposed in this thesis.
Use of Third Party Applications
This dissertation utilized a number of free third party applications to demonstrate
the research approach. The speed and efficiency of some of these applications limited the
processing time when querying multiple data sources. An example is the use of Dydra
which is a web-based SPARQL endpoint for querying ontologies. The ontologies
developed in this research work were uploaded unto the Dydra website to make them
accessible by a web-based user questionnaire form developed as part of this research
work. A SPARQL endpoint setup on a local machine was found to perform at a much
faster rate than Dydra. However, the local machine endpoint could not be accessed via
the web, therefore limiting its use. A more efficient approach is to setup the endpoint on

12
the same web server as the one being utilized to accept user queries. This prevents work
flow inefficiencies such as limited internet speeds and regulation of resources by third
party applications.
1.4 DISSERTATION OVERVIEW
This PhD dissertation is organized into five chapters. Chapter 1 presents the
introduction, motivating case, three research questions and an overview of the research
approach. Chapters 2, 3, 4 address Research Questions 1, 2, 3, respectively, with each of
these chapters written as stand-alone documents that contain an introduction, literature
review, a discussion of the research methods, results, and conclusion. Chapter 5
summarizes the dissertation findings and describes the contributions as well as limitations
and suggestions for future research.

13
CHAPTER 2: CAPTURING AND CLASSIFYING KEYWORDS FROM FREIGHT RELATED
NATURAL LANGUAGE QUERIES
2.1 RESEARCH MOTIVATION
Natural Language Processing (NLP) applications provide users with the
opportunity to ask questions in conversational language and receive relevant answers—
rather than formulating a query into possibly unfriendly (or “unnatural”) formats that
machines can understand (Safranm 2013) . It provides individuals who have no in-depth
knowledge of a particular area or domain to question and receive answers either by using
a search engine or, more popularly in recent times, through speech recognition.
Numerous advances in this area have been made over the years but challenges still
remain (Google 2014; Liddy 2001); particularly, in identifying domain specific keywords
from a multitude of questions.
Even as search engines and consumer electronic products become more
accessible. NLP applications will continue to have an increasing role in both our social
and work activities. This dissertation identified a limited number of NLP applications in
the civil engineering domain and an even smaller number in the transportation
engineering field. Policy makers making decisions about transportation infrastructure
improvements would benefit if they could ask questions such as “How many accidents
occurred on Interstate 35 [at Dallas] in 2013 compared to 2012?”, “How many trucks
crossed the border between the U.S. and Mexico in the first quarter of 2014?”, “Which
are the top commodities exported from the U.S. to Brazil in the last decade?” – and
receive answers instantaneously. Interestingly, the answers to the questions provided
above are stored in some of the available freight databases. A two stage process has to

14
function if various NLP advances offer decision makers this tool, specifically the
approach must:
1. Correctly identify only the relevant information and keywords when dealing with
multiple sentence structures; and retrieving, preprocessing, and
2. Understand multiple data sources to determine which ones best answer a user’s
query.
This chapter addresses the former challenge as off-the-shelf domain-independent
NLP systems can identify entities such as a person, a location, date, time, and a
geographical area but cannot extract information for specific questions in the freight
planning domain. In freight planning, entities such as unit of measurement, mode of
transport, route names, commodity names, and trip origin and destination are
predominant when performing information extraction tasks. The following chapter
discusses how these keywords are used in querying heterogeneous freight data sources.
A number of domain specific information extraction techniques have been
proposed by practitioners– with each having its pros and cons. These are categorized into
rule-based and machine/learning based approaches. Rule-based named entity detection
captures keywords using pattern matching. The main setback with this approach is that if
the exact phrase is not contained in the pattern, the application fails to recognize the
entity. The process is extremely tedious and almost impossible when developing patterns
to detect keywords from large datasets such as geographical areas, roadway names and
commodity names. Dictionary-based recognition, which is categorized under the rule-
based approach, utilizes reference lists to identify entities by searching the dictionary.
Though effective, there are issues of “recall” where keywords are wrongly categorized or
become difficult to distinguish between categories. For example the word, “freight”, can

15
be used in the following phrases: “Who is responsible for freight planning on Interstate
35?” or “How much freight is moved on Interstate 35?” The former phrase is seeking to
understand the agency or individual responsible for developing a plan or strategy to
adequately address freight movement (in this case assuming “truck movement”) on
Interstate 35. The latter phrase is seeking to know the amount of commodities moved via
by trucks on Interstate 35. The challenge with the dictionary-based approach is
determining if the word “freight” means “the type of traffic moving on Interstate 35” or
“the amount of commodities moved on Interstate 35”.
To improve upon the rule-based approaches, researchers have developed
statistical named entity classifiers using supervised learning. Though powerful, these
classifiers require an annotated corpus of named entities to train the models. With larger
training sets, the models become “smarter” and are able to better handle ambiguities in
assigning categories to keywords. Unfortunately, such an annotated corpus for the freight
planning domain does not currently exist.
This dissertation presents an approach for recognizing keywords in the freight
planning domain using a combination of the information extraction techniques discussed
earlier. Depending on the known scope or range of values of a category, a particular
technique is chosen to handle keywords for that category. For example, words which
identify a location or a place are handled with domain-independent statistical models and
words signifying commodity names are recognized using dictionary-based techniques.
Roadway names and units of measures which tend to vary tremendously and are domain
specific were found to be best handled using a handcrafted rule-based approach.

16
This chapter begins with an overview of the research vision followed by
background discussions on natural language applications in civil engineering and named
entity recognition methods. The proposed approach for developing and combining the
various methods to address freight specific queries is then described in the methodology
section. This includes a description of how multiple user queries were collected and the
minimum requirements for developing a freight-specific information extraction and
named entity recognition system. A comparison of model results and related discussion is
then presented.
2.2 OVERVIEW OF RESEARCH APPROACH
The objective of this research task, as illustrated in Figure 3, is to represent
multiple natural language queries into a format that a computer can understand and
process. This requires converting unstructured data from natural language sentences into
structured data, and identifying specific kinds of information relating to the freight
planning domain. As shown in the IDEF0 diagram in Figure 3, the input for this task is
any naturally formed question relating to freight planning. The control is the grammar for
the query language, which in this case is the English language. The reasoning mechanism
involves i) developing an information extraction (IE) and named entity recognition
(NER) approach that addresses freight-related queries, ii) ensuring ambiguity in names
are correctly handled, e.g., relevant roadways names are constrained to only places
specified in the query, and iii) resolving conflicting query items, e.g., pipelines move
only liquid and gas commodities. The expected output from this task is a list of data items
with very high categorization accuracy of named entities—ideally greater than 95%.

17
Figure 3: IDEF0 Diagram for Capturing and Parsing Dynamic User Queries
2.3 BACKGROUND RESEARCH ON INFORMATION EXTRACTION AND NAMED ENTITY
RECOGNITION
Information extraction (IE) is “the task of extracting specific kinds of information
from documents as opposed to the more general task of document understanding which
seeks to extract all of the information found in a document” (Borthwick 1999). A sub-
area of IE, named entity recognition (NER), is a form of IE in which words in a
document are classified in terms of person-name, organization, location, date, time,
monetary value, percentage, or “none of the above” (Borthwick 1999) as shown in Table
1. Despite their popularity and use in internet search engines, machine translation,
automatic document indexing, and consumer electronic products, examples of NLP, IE,
and NER usage in civil engineering are limited; the transportation engineering field
presents even fewer usage instances. Examples of NLP and IE applications found in the
civil engineering literature are discussed. This is followed by a review of advances made
in the field for developing domain specific IE and NER applications.

18
Named Entity Type Examples
ORGANIZATION Transportation Research Board, National Academy of
Engineering
PERSON Nelson Mandela, Albert Einstein
LOCATION U.S. National Park Service, Manaus Stadium, U.S.
Midwest, Latin America,
DATE & TIME July 4th, 1776, Three fifteen a m, 12:30 p.m.
MONEY 2 trillion US Dollars, GBP 10.40
PERCENT seventeen pct., 12.55 %
FACILITY Martin Luther King Memorial, Lincoln Memorial
Table 1 Commonly Used Types of Named Entities (adapted from Bird 2009)
IE and NER Applications in Civil Engineering
Examples of NLP and IE applications found in the civil engineering literature
include work performed by Pradhan et al. (2011), Liu et al. (2013), and Zhang and El-
Gohary (2013). Pradhan et al. (2011) formulated the capture of domain-specific user
queries to support data fusion for construction productivity monitoring. The query
capturing language involved identifying the various data items (e.g., payload and fog)
from user queries. The developed query capture language, made up of three main
components, captured information relating to 1) productivity type, description, and unit;
2) factors that can affect productivity, and 3) temporal and spatial query constraints
(Pradhan et al. 2011).
Liu et al. (2013) proposed an integrated performance analysis framework that
automatically collects, merges, and provides information to monitor the conditions of

19
heating, ventilation and air conditioning (HVAC) systems (e.g., fault detection and
diagnosis, fault tolerant control, and control strategy optimization). The characteristics of
the information requirements of these algorithms were identified and classified, then used
in developing a lexicon and syntax for a query language that contains the domain-specific
terminology and functional relationships of HVAC components.
Zhang and El-Gohary (2013) proposed a pattern-matching and conflict resolution
rules-based NLP approach to automate IE from construction regulatory documents such
as building codes, accessibility design standards, fire codes, and occupational safety
codes. Syntactic features of the text were captured using various NLP techniques such as
tokenization, sentence splitting, morphological analysis, part-of-speech tagging, and
phrase structure analysis. Semantic features (concepts and relations) of the text were
captured using an ontology that represents the domain knowledge. Phrase structured
grammar was used to reduce the large number of patterns needed in the IE rules, which is
a result of the compositional length and complexity of long sentences.
In transportation engineering, examples of NLP and IE applications include Cali
et al. (2011), Pereira et al. (2013), and Gao and Wu (2013). Cali et al. (2011) explored
accessing geographic information systems using natural language expressions and
queries. The authors compared two approaches to accessing geographic information
systems using 1) traditional visual interfaces, and 2) newer approaches that involve
natural language expressions and queries. Pereira et al. (2013) used topic modeling, a
text analysis technique, to extract accident information from incident reports to predict
the period between incident reporting and road clearance. Gao and Wu (2013) developed
a verb-based text mining method that identifies and extracts the main verbs representing

20
vehicle actions in a sentence. Using those verbs, the sequences of events leading to an
accident are extracted from traffic accident reports.
The idea of using NLP applications to query databases is not new, as it is utilized
in multiple disciplines (Bartolini et al. 2006, Nihalani et al. 2011). However, applications
in the transportation domain are quite limited. For example, Lathia et al. (2012) proposed
linking NLP queries with personalized mobile travel information services in an ongoing
study. NLP queries provided by travelers are to be mapped onto structured query
language (SQL) queries by a post-processor and parser using domain ontology, which
acts as a bridge between the syntactically analyzed natural language query and the
formation of the SQL query. Travelers’ implicit preferences, trip planning, and routing
based on explicit preferences are learned and only the relevant information pertaining to
the travelers’ surrounding environment and activities are displayed on a smart mobile
phone (Lathia et al. 2012).
As described in the literature, there are currently no IE or NER applications in the
freight planning domain. Furthermore, natural language query examples found in the civil
engineering literature followed a structured pattern such that the process of parsing and
correctly categorizing named entities is quite straightforward (Pradhan et al. 2011, Liu et
al. 2013). Most user queries relating to freight planning were found not to follow a
similar pattern or sentence structure. This study proposes an approach to fill this gap.
Literature on Developing Domain Specific IE and NER Systems
The literature review provides a background on the two main approaches to NER
classification – the rule-based approach and the machine learning approach.

21
The rule-based approach tends to be the most accurate, transparent and
explainable of all the techniques. However, it is highly domain dependent and the
adapting the rules to other domains is a time consuming process requiring highly skilled
personnel (Chiticariu et al. 2010, Srihari et al. 2000). Rule-based approaches utilize
pattern matching which can be enhanced through knowledge of the features or
characteristic attributes of words (Nadeau and Sekine 2007). Examples of features cited
used in crafting NER rules include: 1) word-level features which describe word case,
punctuation, numerical values and special characters, 2) digit patterns to express dates,
percentages, intervals, identifiers, etc. 3) morphological features related to word suffixes
and prefixes, amongst others (Nadeau and Sekine 2007). The challenge with handcrafted
rules is domain independence where rules have to be customized to address different
domains. This setback is somewhat addressed through complex rule development
techniques as described in (Chiticariu et al. 2010).
Dictionary based recognizers identify keywords using a reference document.
Dictionaries improve upon the performance of NER systems as they can be based on a
collection of words or phrases referring to a particular entity (Boldyrev et al. 2013). It is
commonly used in domains such as the biomedical field to identify genes, proteins, cell
types and drugs from other biomedical terms or English language texts using databases
(Bunescu et al. 2005, Hirschman et al. 2005, Kou et al. 2005, Liu et al. 2006, Tsuruoka
and Tsujii 2003) . The main limitations of the dictionary-based approach as identified in
the literature are i) coverage of the dictionary, and ii) the extraction method utilized. The
challenge with coverage is that should a word be modified or excluded by an update to
the dictionary, the system will fail to correctly identify the entity. The extraction method
utilized also affects the performance of the dictionary-based approach. Exact matching,

22
for example, does not recognize phrases in a text if it is written in a different word form
(“colour” and “color”). To address the exact matching problem, approaches such as
stemming (Willett 2006), Soundex (Raghavan and Allan 2004), and approximate
matching (Cohen and Sarawagi 2004, Tsuruoka and Tsujii 2003) have been utilized
(Nadeau and Sekine 2007).
Machine learning or statistical methods rely on knowledge gleaned from a trained
corpus to determine the correct classification of entities. There are three main approaches
for performing statistical classification: supervised learning, semi-supervised learning,
and unsupervised learning. The supervised learning approach automatically classifies
entities using a completely annotated corpus of training data. The main limitation with
this approach is the need for a trained corpus to be developed – a process which can be
painstaking and cost prohibitive. Examples of supervised learning approaches popularly
cited in the literature include Hidden Markov Models (Bickel et al. 1998), Decision Trees
(Sekine et al. 1998), Maximum Entropy Model (Borthwick 1999), Support Vector
Machines (Asahara and Matsumoto 2003), and Conditional Random Fields (Lafferty et
al. 2001). To address trained corpus limitation of supervised learning approaches, the
semi-supervised approach was proposed. It utilizes a technique called “bootstrapping”
where a small set of trained data is used to start the learning process (Nadeau and Sekine
2007). The iterative process then identifies entities from new text, then reapplies the
newly found examples on other new set of text (Nadeau et al. 2006). Other examples of
semi-supervised learning approaches cited in the literature include (Brin 1999, Thielen
1995, Zhou et al. 2005). Unsupervised learning approaches typically utilize clustering to
gather named entities into groups based on context similarity (Mansouri et al. 2008,
Nadeau et al. 2006, Shende et al. 2012). These techniques rely on lexical resources,

23
patterns and statistics computed over large amounts of corpus data. Though portable for
different domains, unsupervised learning is thought of not to be very popular in the NER
domain as it tends to combined with other approaches (Feldman and Rosenfeld 2006,
Mansouri et al. 2008, Shende et al. 2012).
A combination of the above techniques is called a Hybrid NER system. (Florian et
al. 2003) combined a robust risk minimization classifier model, a maximum entropy
model, a transformation-based learning model, and a hidden Markov mode to classify
locations, organizations and persons. This hybrid model showed improved classification
results for the English text when compared with results from the individual models but
minimal improvement when used with German text. (Fresko et al. 2005, Li et al. 2003,
Srihari et al. 2000) performed similar work by combining supervised machine learning
methods and rule-based approaches to classify locations, organizations, persons,
numerical and time expressions. The hybrid approach resulted in improved model
performances; however, the model becomes dependent on the strength of the handcrafted
rules which may not be portable to multiple domains (Mansouri et al. 2008). Rocktäschel
et al. (2012) combined a Conditional Random Field model with a dictionary to identify
classes of chemicals used in the biomedical domain. The challenge with Rocktäschel et
al.’s (2012) work was the high amount of possible synonyms for one chemical entity and
how small errors can change the meaning of a chemical’s name. Rocktäschel et al. (2012)
showed that by using the appropriate methods for recognizing entities in the main classes
of chemical structures in text, a high classification result can be achieved (Rocktäschel et
al. 2012). Similar observations in classification improvements were made by Srivastava
et al. (2011) and Oudah and Shaalan (2012) to classify entities in the Hindi and Arabic
languages, respectively. The advantage of the hybrid NER approach is that it draws on

24
the strengths of the individual models to correctly identify specific entities which may be
ignored should a single model be utilized.
For a new NER domain such as freight transport where no reference corpus
currently exists, developing an NER system will require an examination of the above
described approaches. The rule-based approach provides the ability to extract information
when training data is not available. However, it is limited by the number of rules
developed by the individual. The machine-learning approaches which tend to be more
popular also require an annotated corpus which currently does not exist. Developing a
sufficiently large annotated corpus will take significant time, effort and expertise (Marcus
et al. 1993, Tanabe et al. 2005). This research work proposes a combination of the rule-
based and machine/statistical learning approaches to correctly recognize the various
named entities that can be found in freight related questions. The rule-based approach is
required to identify domain specific entities such as units of measurement, mode of
transport, route names, commodity names, and trip origin and destination as shown in
Table 2. The machine learning approach is utilized in identifying domain-independent
entities such as location, time, percentage values, and money. This research work
presents two main contributions to NLP usage in the civil and transportation domains: 1)
a hybrid NER approach to correctly identify and classify keywords from freight-related
natural language queries, and 2) the initial development of an annotated freight transport
corpus to be utilized for future studies.

25
Named Entity Type Examples
Domain Dependent
ORIGIN & DESTINATION …. from Austin to Houston …,
COMMODITY sugar, milk, gravel, mixed freight
TRANSPORT MODE truck, rail, air, carload, vessel
LINK Interstate 35, Mississippi River, TRANSCON
Corridor
UNIT OF MEASURE number of truckloads, average travel time, number
of crossings
Domain Independent
DATE & TIME July 4th, 1776, Three fifteen a m, 12:30 p.m.
LOCATION … gross domestic product of Los Angeles-Long
Beach-Santa Ana, CA ….
MONEY 2 trillion US Dollars, GBP 10.40
PERCENT seventeen pct., 12.55%
ORGANIZATION Transportation Research Board, U.S. Department of
Transportation
Table 2: Named Entity Types for Freight-Related Natural Language Queries
2.4 RESEARCH APPROACH FOR CAPTURING AND FORMALIZING KEYWORDS FROM
FREIGHT RELATED NATURAL LANGUAGE QUERIES
In this section, the process of how IE and NER is performed in general is
described. This is followed by a description of how multiple user queries were collected
and the initial development of an annotated freight transport corpus. Two domain-
independent NER models selected for classifying keywords in freight queries are then
discussed. One of these models is later trained to examine their performance against the
manually annotated corpus. The development of a rule-based NER approach is also
described. This is followed by a hybrid approach which combines the different models to
determine if any improvements can be made when the models work together.

26
Description of the IE and NER Process
A pipeline architecture demonstrating how current NER models convert
unstructured user queries into a structure query is illustrated in Figure 4. User queries in
the form of questions are first split into individual words through a process called
tokenization. The tokenized words are then tagged using part-of-speech tagging, which is
a process of classifying words into their parts of speech (or word classes or lexical
categories) and labeling them accordingly.
Figure 4: Pipeline architecture for IE and NER models (adapted from Bird et al. 2009)

27
The next step involves the process of identifying phrases in sentences by
segmenting and labeling multi-token sequences using a set of rules, an n-gram chunker,
or classifier-based chunkers. Chunked sentences are usually represented using either tags
or trees as illustrated in Figure 4. Rule-based chunkers depend on chunk grammar, which
is a set of rules that indicate how sentences should be chunked. N-gram chunkers utilize a
statistical algorithm to assign the tag that is most likely for that particular n-number of
tokens. Trained classifier-based chunkers use machine-learning algorithms to learn
previously annotated syntactic or semantic sentence structures, and assign chunks from
the learned sentences to new sentences. Classifier-based chunkers are known to perform
better in identifying phrases than n-gram chunkers, which in turn perform better than
rule-based chunkers (Bird 2009). In this task, the process of searching for noun phrases
that refer to specific types of places, organizations, persons, dates, etc., is of interest.
The next step is correctly identifying named entities. This task is performed using
previously trained named entity corpora. These have been found to be limited in their
ability to recognize keywords in the freight data domain, as many named entity terms can
be ambiguous. A domain-specific NER system is thus required to improve the precision
of information retrieval of keywords from user queries. The final step, relation detection,
involves searching for likely relations between different entities in the text. Untrained
domain-independent models are found not to be adequate recognizing relations amongst
keywords in the freight data domain. An example is the use of the words “from” and “to”
in a freight query which tend to signify “… from origin to destination”.

28
Freight Data Query Collection
A sample collection of freight data queries shown in Table 3 (a complete list of a
100 questions is available in Appendix A) was generated by requesting questions from
researchers and colleagues at the Center for Transportation Research.
1. What is the truck traffic mix on IH-10 in Houston?
2. What are the top five commodities/industries utilizing IH-35 as a major freight
corridor?
3. What is the average travel time and level of service on major arterial roads
during peak hours?
4. What is the number of truck related accidents which occurred on IH-35 from
May 2013 to June 2013?
5. What are the top 3 most traveled roadways by AADT in Texas?
6. What is the total value of commodities transported during the Christmas season
on IH-35 from October 2012 to Jan 2013?
7. What is the total value of export from the Port of Houston for the month of
May 2013?
8. What is the total number of oversize/overweight vehicle permit fees collected
in Texas for FY 2013?
9. What is the number of parking facilities available on the Interstate 20 corridor
from El Paso to DFW?
10. What is the number of bridges along the IH-45 corridor requiring
improvements?
11. Where are Amazon shipping facilities?
12. Should freight be managed by DOTs
13. How has the focus on freight changed in the various highway trust fund bills?
14. Is there any spare freight capacity?
15. Where to find the freight flow information for a state, a district, a county, or a
route?
16. In your opinion, what technology will be have the greatest impact on the
freight industry?
17. With the expansion of the Panama Canal, what mode of freight will see the
greatest change within the US?
18. If $500 million was available for freight infrastructure nationally, where and
how would you suggest the money be spent?
19. How has the focus on freight changed in the various highway trust fund bills?
20. Who pays for freight?
Table 3: Sample Queries Used in Testing and Comparing IE and NER Models

29
Initially, a website was developed and the web address sent to a small sample of
individuals familiar with freight data queries. Users were encouraged to submit freight-
related questions. Freight related questions generated in a previous study by Seedah et al.
(2014a) were also included. The first version of a rule-based freight-specific IE and NER
application, named Eddi, sought to correctly classify keywords from these user queries.
Should Eddi incorrectly classify a keyword, users were asked to resubmit the keywords
with the correct category. The submitted questions were then reviewed and, when
necessary, corrections were made to the keywords classified by Eddi. This approach
resulted in an initial number of 70 questions being classified. The questions and correctly
classified keywords served as the initial benchmark for developing the rule-based model.
An additional 30 questions were then solicited from colleagues and this was included in
the earlier sample.
The order in which the questions were received was first randomized and using k-
fold cross validation, grouped into training and testing subsets. In k-fold cross validation,
the data is divided into k subsets and one of the k subsets is used as the test set and the
other k-1 subsets are put together to form a training set. The advantage of this method is
that each data point gets to be in a test set exactly once, and gets to be in a training set k-1
times. The variance of the resulting estimate is reduced as k is increased. The
disadvantage of this method is that the training algorithm has to be rerun from scratch k
times, which means it takes k times as much computation to make an evaluation (Kohavi
1995). K equals 10 was used in creating the training and test subsets in this research task
because of the small sample size.

30
Annotating the Questions
Corpus development involves assigning entity categories to keywords. This
process was performed manually as it requires identifying keywords. In this example,
keywords were annotated such that it can be utilized in training a domain independent
classifier. The keywords were annotated such that each word (or “token”) is listed in the
first line, followed by a tab and the named entity in the second line. This annotated
corpus will serve as the “gold standard” for reviewing all the models tested.
In this example, the word “2012” is tagged TIME and “gravel” is tagged
COMMODITY. The token “San Antonio” is tagged DESTINATION twice for “San” and
“Antonio”. Non-named entities were tagged with “O”. More expressive tagging schemas
such as IOB1, IOB2, IOE1, IOE2 exists; however, the impact of which tagging schema to
use is found to be insignificant with respect to the strength of the models themselves
(Krishnan and Ganapathy 2005). The small sample set also prevents the use of more
expressive tagging schemas as the desire is to improve upon the classification

31
performance of the machine learning model to adequately compare with the hand written
rule-based models.
The Domain-Independent Machine Learning Model
The Stanford NER 7 class model which is a Conditional Random Fields model is
trained on the MUC-7 dataset and addresses seven entities: Person, Location,
Organization, Time, Date, Percent, and Money (Finkel et al. 2005). Conditional Random
Fields are probabilistic, undirected graphical models which compute the probability,
, of a possible label sequence, , given the input sequence
. In NER, the input sequence corresponds to the tokenized text and the
label sequence, , are the entity tags. Text segmentation is performed based on the model
knowing beginning and ending of a phase and the corresponding tags for that phrase
(Klinger and Friedrich 2009). The Stanford NER 7 class model is selected to demonstrate
the strengths of domain independent models in correctly classifying some freight-related
keywords such as location and time.
Training A Domain Dependent Machine Learning Model
The Stanford CRF model was trained using the annotated corpus described
earlier. With the k equal 10 subsets, 1 subset is held for testing and the remaining 9
subsets for training. This process is repeated k times such that each question is included
in the test and training sets at least once.
Developing the Domain-Dependent “Dictionary-Based” NER models
Regular expressions and dictionaries are used here in developing a rule-based IE
and NER model. Regular expressions are a sequence of characters that form a search
pattern and are mainly used for pattern matching of text (Thompson 1968). Regular

32
expression patterns were developed in the Python programming language (Python
Foundation 2014) for each named entity category using external data sources and sample
text from the initial 70 questions collected. A summary of the dictionary data sources and
regular expression patterns developed for each of the eight categories are described in the
following sub-sections. The disadvantage of using regular expressions and dictionaries as
discussed earlier in the literature review is that, if the model does not recognize a pattern
the word is not tagged even though it may fall in a particular category.
Location
For “LOCATION” named entities, a combined list of U.S. states and the Census
Bureau’s rank of the largest 293 cities by population as of July 1, 2013 (Census Bureau
2013) was used. Whenever a question was submitted, the sentence was parsed through
this list of cities which are compiled as regular expression patterns. When a match is
found in a sentence, the matching city name (or phrase) is extracted. In Python, these
extracted words can be compiled into a list and each word is tagged as a “LOCATION”
entity. The pseudo code for iterating through the list of cities and finding the exact match
in a sentence is provided below:
Commodities
To develop the “COMMODITIES” regular expression patterns, 1,600 commodity
group names from the Standard Transportation Commodity Codes [STCC] (Surface

33
Transportation Board 2012) was compiled. Using a pseudo code similar to what was used
in finding “LOCATIONS”, a matching list of commodities was sought in given sentence.
The “referenceDocument” in this case was the list of STCC commodity group names.
Transport Mode
For transport modes, data values specified in various freight data dictionaries was
compiled. This list contained all modes of transport including the descriptive text such as
“loaded truck”, “empty truck”, “oversize\overweight”, “os\ow”, “commercial”, “long
haul” and “heavy”. The pseudo code for this category is provided as:
Examples of keywords which can be identified using the above pattern include:
To improve upon the query capturing algorithm it was found that in addition to finding
matches from compiledMatchingPattern, additional non-repetitive matches should be

34
sought in the modeOfTransport and descriptiveText variables as described by Bird
(2009b).
Link
An approach similar to was described in the “TRANSPORT MODE” category
was used in developing the “Link” category. Regular expression patterns were developed
from a list of roadway suffices and data dictionary values. Examples of keywords
identified this approach include:
Date and Time
The date and time regular expressions patterns were also developed by modifying
an existing temporal expressions pattern developed by Bird (2009b) to include terms such
as “peak”, “non-peak period”, and the four seasons. Examples of keywords identified
include:
Unit of Measure
This category was also developed using data values from the various freight data
dictionaries. An approach similar to the “TRANSPORT MODE” and “LINK” categories
was used. Examples of keywords identified include:

35
In addition to the above, descriptive texts such as “average”, “number of”, “top
five’, “most”, and “cheapest” are included into this category. In a later version of this
category’s matching patterns, sub-categories were created and broken down by mode of
transport units of measure, commodity units of measure, roadway units of measure, etc.
Iterating Through All Categories
The pseudo code for iterating through all the possible categories is shown below:
ϵ
Using the inbuilt findall regular expression method in Python, all (non-
overlapping) matches of the given regular expression in a sentence is found. Once a
keyword or phrase is matched, it is deleted from the sentence to prevent duplication of
the keyword in another category. Similar methods are available for other programming
languages like Java and C#.
Developing the Domain-Dependent “Feature-based” NER models
To address the limitations of the dictionary-based model, a feature-based model
was proposed. By examining the prefixes and suffixes relating to a named entity, further
refinement of the dictionary-based model can be made. For example, the route entity
name ‘CR 2222’ (i.e., County Road 2222) was found to be captured in the TIME
category as ‘2222’, (i.e., the year ‘2222’). However, by examining the explicit prefixes
and suffixes relating to each category, the model can determine the most likely category.
Examples of prefixes and suffixes developed from the test data are listed in Table 4.

36
TRANSPORT
MODE LINK DATE & TIME
ORIGIN,
DESTINATION &
LOCATION
many MODE …
e.g., how many
trucks …
EVENT occurred
on LINK
e.g., accident
occurred on IH-35
… in TIME
e.g., in 2007
… from ORIGIN to
DESTINATION
… UNIT of MODE
e.g., number of
trucks
… moved on LINK
e.g., trucks moved
on IH-35
… during the TIME
e.g., during the
Christmas season
… between
ORIGIN and
DESTINATION
… which
involved/involving
MODE …
e.g., accidents
involving trucks
… along LINK
e.g., along IH-35
… for TIME
e.g., for FY 2014
… in LOCATION
e.g. number of
registered
commercial trucks
in California
… moved by
MODE e.g., moved
by trucks
… LINK
connecting
LOCATION with
LOCATION
e.g., roadway
connecting Austin to
Dallas
… on TIME
e.g. on Saturday,
May 10, 2014?
… moved through
LOCATION
e.g., moved through
Dallas
Table 4: Prefixes and Suffixes Developed for Each Category
Enhancing Suffix and Prefix Recognition
The problem with the above defined prefixes and suffices to recognize freight
related a named entity is that they are defined with exact word phrases. For example “…
moved on…”, “… along…”, and “… moved by …”
What if these word phrases were replaced by other words such as “ … travelled
on …”, “…. moving in …” and “… carried by …”? It will mean that regular expressions
will have to be developed for each possible synonym for the above word phrases. An
approach to resolving the current NER limitation will be to utilize part-of-speech tagging.
Similar to the earlier defined rules, ambiguity handling is implemented only when

37
keywords exist in more than two categories or when trying to differentiate between points
of origin from points of destination. Tagging rules were developed for each category and
are shown subsequently.
Transport Mode
→
=
→
=
7. →
→
Link
→ → →
→
→
Date and Time
→

38
→ →
Origin, Destination & Location
→ →
→
→ →
Commodity
→
2.5 COMPARISON OF MODELS
The performance of an NER model is based on the model’s ability to correctly
identify the exact words in a sentence that belong to a specific named entity type or
category. For example, for the query “How many tons of gravel shipped from Austin to
San Antonio using IH-35 by truck?” the expected results are the following:
UNIT OF MEASURE tons
COMMODITY gravel
ORIGIN Austin

39
DESTINATION San Antonio
DATE 2013
TRANSPORT MODE truck
The commonly used metric for quantitative comparison of NER systems are Precision,
Recall, and F-measure. Given a tagging by an NER system (a “response”) and an answer
key that has the correct tagging, define the quantities:
True Positive – response equals key
False Positive – response is tagged but is not equal to the key
False Negative – response is not tagged, key is tagged
True Negative – response is not tagged, key is not tagged
Precision, Recall, and F-measure are calculated using Equations 1 to 3, where F-measure
is the harmonic mean of precision and recall. High Precision, Recall, and F-measure
metrics are preferred:
(Equation 1)
(Equation 2)
(Equation 3)

40
True positives are measured here as the number of predicted entity names in a
span which matches up exactly as the gold standard evaluation data. For example, where
the model predicted [DESTINATION SAN][O ANTONIO] instead of [DESTINATION SAN
ANTONIO] the model is penalized such that [DESTINATION SAN] equals a false positive
and [O ANTONIO] equals a false negative. The reason for doing this is such that selecting
nothing is found to be better than predicting wrongly (Manning 2012). Precision
therefore requires that an entity exactly matches the span of named entities in the gold
standard. Recall shows how many of the named entities were actually tagged. F-Measure
is the weighted harmonic mean of precision and recall, and attempts to smooth out the
related variation of the two measures (Bacastow and Turton 2014, Borthwick 1999).
Using the above defined metrics, the trained and untrained Stanford CRF models
and the dictionary-based and feature-based rules were tested with 100 questions collected
and used in developing the initial freight data corpus. The following categories were
examined: COMMODITY, LINK, MODE, TIME, UNIT, ORIGIN, DESTINATION, and
LOCATION.
Table 5 presents on the results of using the various models to classify freight
related keywords. Each shaded cell represents the highest F-measure values obtained for
each category. The trained and untrained CRF models record a high precision for the
categories they are familiar with – in this case the LOCATION and TIME. The trained
CRF recorded f-measures of 77.08 and 69.52 for the LOCATION and TIME categories
respectively. The untrained CRF performed comparatively well at 67.44 for the TIME
category. The trained CRF model also performs well with the UNIT OF MEASURE
category which recorded f-measure 59.65 when tested alone and 60.14 when combined
with the dictionary-based and feature-based handwritten rules. The reason for the high

41
performance can be attributed to the large number of the entities which fall in that
category. The dictionary-based rules perform best with the COMMODITY and MODE
categories recording 61.36 and 68.33 f-measures, respectively. The trained CRF category
is also a good alternative for the MODE category as it recorded an f-measure of 64.96.
Concerning ORIGIN and DESTINATION, the feature-based rules provided the best
opportunity to classify these categories though the current setup showed very low f-
values. With more robust rules the classification of these entities can be improved and
additional training of the CRF model may assist with better classification of this category.
The LINK category was equally classified by both the trained and the dictionary-based
rules which when combined record f-measures of 70.69.

42
CATEGORY Untrained CRF Trained CRF Dictionary-based Rules
Precision Recall F-measure Precision Recall F-measure Precision Recall F-measure
COMMODITY - - - 57.14 47.62 51.95 57.45 65.85 61.36
DESTINATION - - - - - - - - -
LINK - - - 76.60 56.25 64.86 78.72 59.68 67.89
LOCATION 72.73 48.48 58.18 68.42 70.65 69.52 72.88 42.16 53.42
MODE - - - 82.61 53.52 64.96 83.67 57.75 68.33
ORIGIN - - - - - - - - -
TIME 90.63 53.70 67.44 86.05 69.81 77.08 66.07 68.52 67.27
UNIT - - - 55.09 65.03 59.65 55.48 39.51 46.15
Untrained CRF & Dictionary-based Rules Trained CRF & Dictionary-based Rules Dictionary-based & Feature-based Rules
Precision Recall F-measure Precision Recall F-measure Precision Recall F-measure
COMMODITY 57.45 65.85 61.36 50.00 73.17 59.41 57.45 65.85 61.36
DESTINATION - - - - - - 5.13 40.00 9.09
LINK 78.72 59.68 67.89 74.55 67.21 70.69 78.72 59.68 67.89
LOCATION 74.03 57.00 64.41 67.71 68.42 68.06 73.33 10.28 18.03
MODE 83.67 57.75 68.33 86.96 55.56 67.80 83.67 57.75 68.33
ORIGIN - - - - - - 20.00 40.00 26.67
TIME 71.43 78.43 74.77 81.63 75.47 78.43 66.07 68.52 67.27
UNIT 55.48 39.51 46.15 52.28 70.00 59.86 55.86 39.51 46.29
Untrained CRF & Dictionary-based
& Feature-based Rules
Trained CRF & Dictionary-based Rules
& Feature-based Rules
Trained CRF & Untrained CRF
& Feature-based Rules
Precision Recall F-measure Precision Recall F-measure Precision Recall F-measure
COMMODITY 57.45 65.85 61.36 50.00 73.17 59.41 57.14 47.62 51.95
DESTINATION 6.12 100.00 11.54 3.57 40.00 6.56 3.57 40.00 6.56
LINK 74.47 53.85 62.50 70.91 61.90 66.10 74.47 53.85 62.50
LOCATION 75.00 17.14 27.91 60.53 22.77 33.09 59.46 22.22 32.35
MODE 83.67 57.75 68.33 86.96 55.56 67.80 82.61 53.52 64.96
ORIGIN 20.00 40.00 26.67 18.18 40.00 25.00 16.67 40.00 23.53
TIME 71.43 78.43 74.77 81.63 75.47 78.43 78.72 69.81 74.00
UNIT 55.86 39.51 46.29 52.72 70.00 60.14 55.09 65.03 59.65
Trained CRF & Untrained CRF
Trained CRF & Untrained CRF
& Dictionary-based Rules
Trained CRF & Untrained CRF
& Dictionary-based & Featured-based Rules
Precision Recall F-measure Precision Recall F-measure Precision Recall F-measure
COMMODITY 57.14 47.62 51.95 50.00 73.17 59.41 50.00 73.17 59.41
DESTINATION - - - - - - 5.17 100.00 9.84
LINK 76.60 56.25 64.86 74.55 67.21 70.69 70.37 59.38 64.41
LOCATION 66.33 70.65 68.42 66.33 68.42 67.36 60.53 22.77 33.09
MODE 82.61 53.52 64.96 86.96 55.56 67.80 86.96 55.56 67.80
ORIGIN - - - - - - 18.18 40.00 25.00
TIME 78.72 69.81 74.00 81.63 75.47 78.43 81.63 75.47 78.43
UNIT 55.09 65.03 59.65 52.28 70.00 59.86 52.72 70.00 60.14
Table 5: Quantitative Comparison of Models on Freight Queries

43
Based on the observations from the results, a hybrid model should utilize the
following sub-models for freight transport entity classification:
Dictionary-based rules for the COMMODITY and MODE categories
A combination of dictionary-based rules and a trained CRF for the LINK
category
A trained CRF model to handle TIME , UNIT OF MEASURE , and LOCATION
entities, and
Feature based-rules to handle ORIGIN and DESTINATION entities. It is
probable that should a larger corpus be eventually developed, the trained CRF
model may be able to better handle this category.
A summary of the above recommendations is provided in Table 6 and Figure 5.
Entity Model Precision Recall F-measure
COMMODITY Dictionary-
based rules 57.45 65.85 61.36
DESTINATION Feature
based-rules 5.17 100.00 9.84
LINK
Dictionary-
based rules +
trained CRF 74.55 67.21 70.69
LOCATION Trained CRF 68.42 70.65 69.52
MODE Dictionary-
based rules 83.67 57.75 68.33
ORIGIN Feature
based-rules 18.18 40.00 25.00
TIME Trained CRF 81.63 75.47 78.43
UNIT Trained CRF 55.09 65.03 59.65
Table 6: Recommended hybrid sub-models

44
Figure 5: Pipeline architecture for Freight Related NER hybrid system
2.6 CHAPTER SUMMARY
NLP applications provide users with the ability to ask questions in conversational
language and receive relevant answers, rather than trying to formulate a query into
sometimes unfriendly (or “unnatural”) formats that machines understand. The challenge,
however, is correctly identifying only the relevant information and keywords when
dealing with multiple sentence structures. Off-the-shelf NLP systems can easily identify
entities such as a person, a location, date, time, and a geographical area, but are
insufficient for performing freight-specific queries. Items such as unit of measurement,
mode of transport, route (or link), and commodity names are currently excluded from
available systems. Furthermore, current systems were found to incorrectly classify
entities when freight-related questions were tested—for example, distinguishing between
a point of origin and a destination point. These systems may need to be trained to perform
freight-specific tasks but that will require an annotated corpus of freight-related queries,
which currently does not exist.

45
Therefore, an alternative hybrid approach examining multiple models and their
performance against the various freight related categories is proposed to correctly extract
keywords from freight user queries. A trained model was able to handle entities relating
to time, unit of measurement and locations that are not origins or destinations. Feature-
based rules which utilize prefixes and suffixes were able to distinguish between origins
and destination entities. However, additional work is required to make these rules more
robust. The handwritten and dictionary-based rules provide an opportunity to better
classify commodity and mode of transport entities, and combination of a trained model
and the dictionary-based model are better suited for route names.
This dissertation presents two main contributions to NLP usage in the civil and
transport data domains. The first contribution is the development of an NER approach to
correctly identify and classify keywords from freight-related natural language
expressions and queries. Future research on freight database querying can utilize this
research to develop applications that do not require stakeholders to necessarily have in-
depth knowledge of each database to get answers to their questions. The second
contribution is the beginning of a collection of freight-related questions to develop a
freight specific corpus similar to what has been done in the bio-medical field. This can be
further expanded to the broader transportation planning domain. Through the use of the
“bootstrapping” techniques discussed in the literature, it may be possible to iteratively
build upon the annotated corpus sample from this research work. The proposed hybrid
approach described in this paper can serve as the initial “bootstrapping” model.
Keyword entity recognition will be useful in automating the process by which we
query databases. By mapping keywords from questions to data element fields in various
freight databases, it will be possible to automatically determine if current data sources are

46
sufficient to adequately answer questions. This research idea is further examined in the
next chapter, Identifying Relevant Data Sources Using Freight Data Ontology.

47
CHAPTER 3: IDENTIFYING RELEVANT DATA SOURCES USING FREIGHT DATA
ONTOLOGY
3.1 RESEARCH MOTIVATION
Navigating through multiple heterogeneous data sources to find which ones are
relevant to answering a question can be a challenging task when performed manually. As
discussed in the introduction section, the challenge is a result of multiple factors
including the data being provided in different formats by agencies with no commonly
agreed upon structure. In addition, deciding on which databases are relevant is highly
dependent on the individual’s knowledge of all available data sources and the information
contained in each one of them. Providing the ability to automatically identify relevant
databases without the need for an extensive knowledge of the contents and organization
of each database is extremely beneficial (Grosz 1983, Kangari 1987). However, to
perform this task, the structural, syntactical, and semantic heterogeneity (Buccella et al.
2003) that exists amongst the various sources need to be addressed. Resolving data
heterogeneity involves identifying which elements are related and which ones are not.
Representing this information from the different sources into a formal manner is required
to automate the querying process.
3.2 OVERVIEW OF RESEARCH APPROACH
The objective of this research task is to identify a set of relevant freight data
sources to answer user queries. The identification of relevant freight data sources requires
the development of freight data ontology and mapping tools as illustrated in Figure 6.
The domain specific ontology will deal with the semantic mapping of relational database
schemas, and enhance the mediation of multiple heterogeneous freight data sources. A
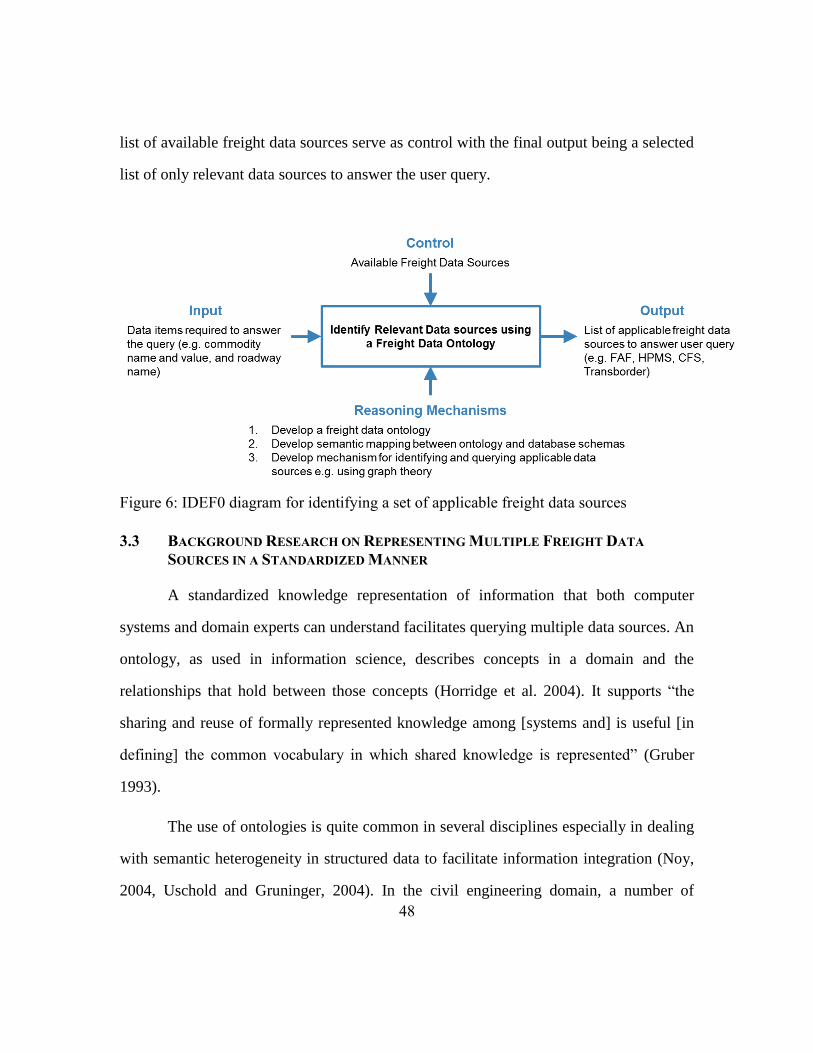
48
list of available freight data sources serve as control with the final output being a selected
list of only relevant data sources to answer the user query.
Figure 6: IDEF0 diagram for identifying a set of applicable freight data sources
3.3 BACKGROUND RESEARCH ON REPRESENTING MULTIPLE FREIGHT DATA
SOURCES IN A STANDARDIZED MANNER
A standardized knowledge representation of information that both computer
systems and domain experts can understand facilitates querying multiple data sources. An
ontology, as used in information science, describes concepts in a domain and the
relationships that hold between those concepts (Horridge et al. 2004). It supports “the
sharing and reuse of formally represented knowledge among [systems and] is useful [in
defining] the common vocabulary in which shared knowledge is represented” (Gruber
1993).
The use of ontologies is quite common in several disciplines especially in dealing
with semantic heterogeneity in structured data to facilitate information integration (Noy,
2004, Uschold and Gruninger, 2004). In the civil engineering domain, a number of

49
ontologies exist to facilitate communication between multiple systems, specifically, in
transitioning from human retrieval of information to machines understanding the
semantics of natural language (van Oosterom and Zlatanova 2008). Examples of
ontologies developed to facilitate civil infrastructure processes and activities include
LandXML (2000), Geographic Information Framework Data Standard (Federal
Geographic Data Committee 2008), and e-COGNOS (Lima et al. 2003). Pradhan et al.
(2011) used data fusion ontology to automatically identify applicable sets of data sources
from a set of available data sources to answer user queries. The data fusion ontology
facilitated the generation of data fusion steps and enabled the synchronization of spatial
and temporal data sources. El Gohary and El-Diraby (2009) developed an ontology
integrator for facilitating ontology interoperability within the architectural, engineering,
and construction domain, and later developed another domain ontology for supporting
knowledge-enabled process management and coordination across various stakeholders,
disciplines, and projects (El Gohary and El-Diraby 2010)
Ontologies developed in the transportation data domain have also mainly focused
on facilitating business processes among different systems. TransXML was developed to
facilitate data exchange across multiple functional areas of the transportation facility
development life cycle from planning to design to construction to maintenance and
operations (Ziering et al. 2007). International Organization for Standardization (ISO)
14825:2011 Geographic Data Files was developed for intelligent transportation systems
and focuses on road and road-related information for ITS applications and services such
as in-vehicle or portable navigation systems, traffic management centers, or services
linked with road management systems such as public transport systems (Oosterom and
Zlatanova 2008, ISO 2011). The Defense Advanced Research Projects Agency (DARPA)

50
Agent Markup Language (DAML) Transportation ontology was developed to represent
transportation-related information in the CIA World Fact Book (Li 2003). El-Diraby and
Kashif’s (2009) distributed ontology architecture was developed to facilitate the
exchange of knowledge among project stakeholders during the design and construction
processes in highway construction.
In the freight transport domain, there are few examples of ontology usage, most of
which focus on supply chain processes. For example, the eFreight ontology in Europe
was developed to solve communication and interoperability issues between different
message formats from different stakeholders in a large-scale distributed e-marketplace
(Bauereiss et al. 2012). Similarly, Bendriss (2009) developed a centralized database for
tracing transported goods from the point of production to the point of delivery. Ambite et
al. (2004) developed ontology for describing goods movement and classified data items
into geographic area, type of flow, type of product, time interval, value and unit.
Based on the literature, there is currently no existing standardized knowledge
representation of freight data to facilitate information exchange and retrieval from the
multiple databases being maintained by U.S. federal and state agencies. Due to the
relatively large number of freight data sources, there is a lack of consensus of how the
various databases relate to each other. This dissertation develops domain ontology for
supporting a standardized knowledge representation of freight data that computer systems
and domain experts can utilize in identifying relevant freight data sources to answer user
queries. It enables interoperability amongst multiple freight databases and facilitates
information retrieval.

51
3.4 DEVELOPING THE FREIGHT DATA ONTOLOGY
Freight data ontology was developed to resolve semantic heterogeneity among
freight databases and support the identification of applicable freight data sources to
answer a user query. As discussed in Pradhan et al. (2011), there are three primary
approaches for incorporating ontologies to identify applicable data from heterogeneous
data sources:
1. the single ontology approach which requires that heterogeneous data sources
comply with a common vocabulary as defined in the common ontology,
2. the multiple ontologies approach which requires the development of inter-
ontology mappings within multiple ontologies, and
3. the hybrid approach where multiple ontologies can be used with an upper-level
ontology that provides inter-ontology mapping).
Based on the large number of available freight databases identified in earlier
studies, the hybrid approach for ontology development which incorporates global and
local ontologies is chosen. The hybrid approach allows multiple ontologies (i.e., local
database ontologies) to be used with upper-level ontology (i.e., the global ontology) to
provide inter-ontology mapping (Buccella et al. 2003). The hybrid approach also
provides the desired support for working with multiple heterogeneous data sources, as it
enables inclusion of additional data sources in the future. Specifically, new information
sources can be added without the need for modification as only the terms and relations of
the new source that are not in the global ontology must be added, and the mappings
among the new added terms defined. This is particularly important in the freight data
domain because of frequent changes in database schemas by reporting agencies as
discussed earlier. In addition, the shared vocabulary and the mappings among the local

52
ontologies make them comparable to one another (Buccella et al. 2003) and a single
statement can be written to query all the available data sources.
Using the open-source ontology editor, Protégé (Horridge et al. 2004), a global
ontology is developed using the Role Base Classification Schema (RBCS) framework
RBCS is a formal representation of the thousands of data elements that were found to
exist in freight data sources (Seedah et al., 2014b). The framework is based on two levels
of classification: a primary grouping that characterizes data elements based on the type of
object they represent, and a secondary grouping that differentiates between elements that
specifically identify objects and those that describe features related to the objects. The
primary level groups are: Time, Place, Commodity, Industry, Link, Mode, Event, Human,
and Unclassified. Each of these groups, with the exception of Time and Unclassified, can
be further divided into two secondary-level groupings, Identifier and Feature. Therefore,
from the nine primary and two secondary classification groups identified and discussed,
the following classifications groups (or roles) were developed:
1. Time
o can be exact time (e.g., year, month, time, day) or duration time (e.g.,
seasons, quarter, biannual)
2. Place
o Place Identifier (e.g., city name, state, origin county name, destination
country name, accident location. For geospatial databases, this can either
be points or polygons)
o Place Feature (e.g., area, population)
3. Link
o Link Identifier (e.g., a roadway name, a waterway name)
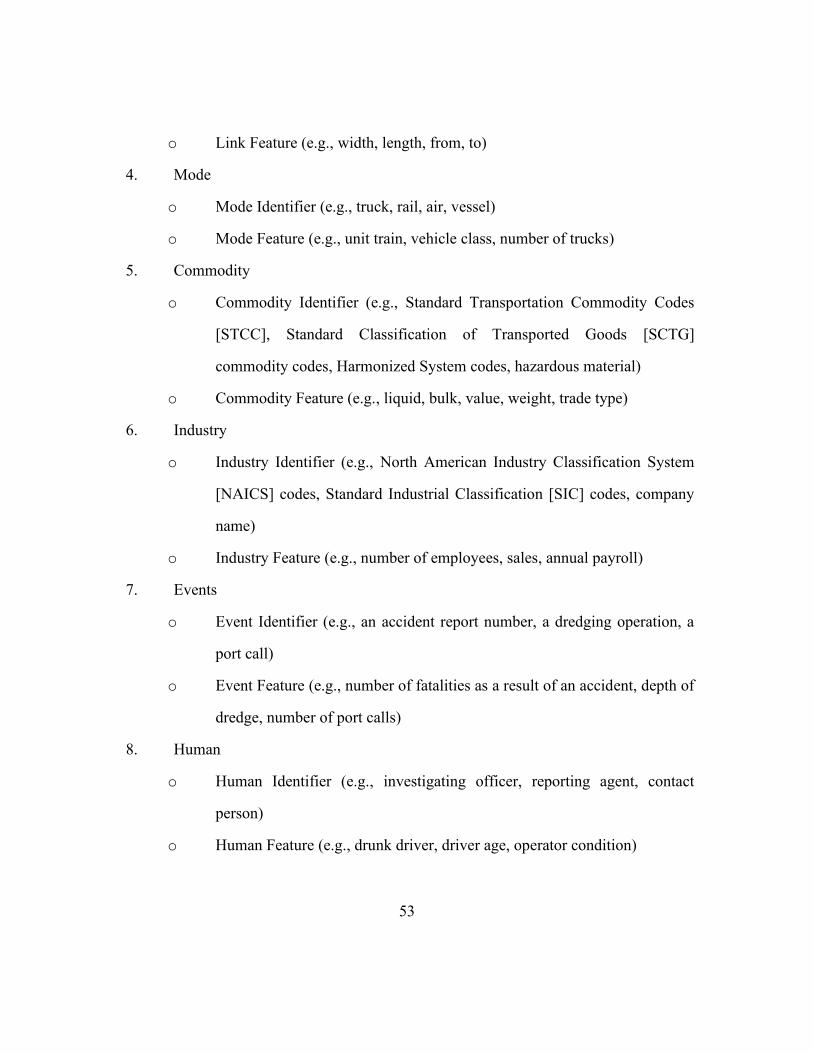
53
o Link Feature (e.g., width, length, from, to)
4. Mode
o Mode Identifier (e.g., truck, rail, air, vessel)
o Mode Feature (e.g., unit train, vehicle class, number of trucks)
5. Commodity
o Commodity Identifier (e.g., Standard Transportation Commodity Codes
[STCC], Standard Classification of Transported Goods [SCTG]
commodity codes, Harmonized System codes, hazardous material)
o Commodity Feature (e.g., liquid, bulk, value, weight, trade type)
6. Industry
o Industry Identifier (e.g., North American Industry Classification System
[NAICS] codes, Standard Industrial Classification [SIC] codes, company
name)
o Industry Feature (e.g., number of employees, sales, annual payroll)
7. Events
o Event Identifier (e.g., an accident report number, a dredging operation, a
port call)
o Event Feature (e.g., number of fatalities as a result of an accident, depth of
dredge, number of port calls)
8. Human
o Human Identifier (e.g., investigating officer, reporting agent, contact
person)
o Human Feature (e.g., drunk driver, driver age, operator condition)

54
9. Unclassified
o e.g., record ID, error flag, comment field, future field, record modification
dates
Figure 7: Schematic Representation of the RBCS (Seedah et al. 2014b)
Figure 7 illustrates the inherent relationships between the various data elements
despite their classification into different roles. Commodities (C) generated by the industry
(I) is moved by various transport modes (M) from one place (P) to another (P) along the
transportation network (L) within a time period (T). During the transport process, a chain
of possible events may occur (E) that involves various stakeholders or individuals (H).
The last category, Unclassified, forms part of a larger “virtual boundary” that contains
elements that do not fit under any of the aforementioned roles but need to be accounted
for to preserve data integrity.

55
Figure 8: Ontology for FAF3 Regional Database
As shown in Figure 8, the global ontology is developed by setting RBCS primary-
level groupings as sub-classes of Thing and the secondary-level groupings as sub-classes
of each of the corresponding primary groupings. The sub-class Mode would have two
sub-classes: ModeIdentifier and ModeFeature. Several object properties (not shown in
the diagram) are also defined to relate the different sub-classes. For example, the object
property “hasProduced” relates the sub-class Industry to Commodity, while the inverse of
it, “isProducedBy,” relates the sub-class Commodity to Industry. The local ontologies

56
were then created by expanding the global ontology for each specific database. The data
elements of each corresponding data dictionary are also classified based on RBCS and
mapped as data properties to the global ontology classes. Figure 8 illustrates this process
using the Freight Analysis Framework 3 (FAF3) data dictionary. The range of values for
each data element is then specified as each data property in the ontology and alternative
names of each data element are specified as labels. Additional custom annotations which
can be included with each data property are queryWith, i.e. if the field label is differs
from the actual field name, and regexName, for units of measure data elements labels if
regular expressions are to be used for searching.
The global and local ontologies are represented as Resource Description
Framework (RDF) Graph models (Wang et al. 2009). RDF describes things by making
statements about an entity's properties. It “is a general method to decompose any type of
knowledge into small pieces, with some rules about the semantics, or meaning, of those
pieces” (Tauberer 2005). It is simple enough that “it can express any fact, and yet so
structured that computer applications can do useful things with it” (Tauberer 2005). RDF
graphs are expressed as triples in the form (Subject, Predicate, Object), where Subject is
the resource being described, a Predicate is the property, and Object is the property
value. An RDF graph is visualized as a node and directed-arc diagram, in which each
triple is represented as a node-arc-node link as shown in Figure 9 (Klyne et al. 2014).
Figure 9: An RDF graph with two nodes (Subject and Object) and a triple connecting
them (Predicate) (Klyne et al. 2014)]

57
Examples of triples that exist in the defined freight ontologies include:
1. (data property, domain, RBCS class)
2. (data property, range, list of values)
3. (data property, annotation, labels)
Expanding the Ontology
The global and local ontologies can be further expanded to provide additional
granularity. As earlier describe in Chapter 2, there can be three kinds of places – place in
reference to a single LOCATION, and places which describe freight movement, i.e.,
ORIGIN and DESTINATION. The PlaceIdentifier class can therefore have the additional
subclasses of OriginPlaceIdentifier and DestinationPlaceIdentifieras as shown in Figure
10. Places which reference a single location can still be mapped to the PlaceIdentifier
class. The ontologies can also be further expanded to CityOriginPlaceIdentifier,
StateOriginPlaceIdentifier, ForeignDestinationPlaceIdentifier and so forth. The key here
though is that these sub-classes to be used uniformly across the various data sources.
Figure 10: Expanding the Local Ontologies

58
Expanding the Units of Measure Category
The units of measure category discussed in Chapter 2, is considered to be too
broad to be utilized in the freight data ontology. To address this, the category is broken
down in multiple subcategories that is then included in the Feature subclasses of the
global ontology. The subcategories of the Feature subclasses include the following with
examples:
1. CommodityUnitOfMeasure: value, weight, ton-mile, containers, shipments,
pallets
2. ModeUnitOfMeasure: carloads, truckload, vehicle permit fees, rail cars, tare
weight, load weight, cost, gross vehicle weight rating, single combination
vehicle, trailer, vehicle type, transport cost, annual average daily truck traffic
(AADTT)
3. LinkUnitOfMeasure: annual average daily traffic (AADT), AADTT, miles,
distance, accidents, speed, vehicle miles traveled (VMT), truck traffic, travel
cost, travel time
4. PlaceUnitOfMeasure: population, land area, income, gross domestic product
5. IndustryUnitOfMeasure: jobs, number of employees, number of establishments.
6. Time: travel time, daily, weekly, annual, yearly, per day, peak, present, past,
period, future
7. EventsUnitOfMeasure: number of accidents, type of accident, vehicle type
As shown above, some of the units of measurements overlap (e.g. vehicle type
and AADTT). One advantage of using ontologies is the ability of subclasses or data
properties to have multiple parent classes. This means, the vehicle type and AADTT data

59
properties that exist in a particular database can be called by both the LinkUnitOfMeasure
and ModeUnitOfMeasure subclasses as shown in Figure 11
Figure 11: In defining ontologies, a data property can have multiple super-classes
3.5 QUERYING THE ONTOLOGIES
RDF graphs are queried using the SPARQL query language similar to how SQL
is used in querying relational databases (Prud’hommeaux and Seaborne 2013). The main
advantage of RDF graph data over traditional relational databases is its interoperability
between multiple systems. RDF fosters a common standard across multiple systems so in
a well-defined domain, RDF graphs stored in multiple databases can be easily queried
and the data merged (Polikoff 2014). However, there are different standards for relational
databases for each organization (e.g. how primary keys are defined). RDF requires that
the same standards be followed across multiple systems and in this case, the global
freight data ontology.
To illustrate how SPARQL works, a query was constructed to find all data
properties (i.e., data element fields) in the FAF3 regional database that have been
classified as PlaceIdentifiers - in this case

60
The pseudo code for iterating through all the available databases and identifying
databases which satisfy keywords is as follows:
3.6 LIMITATIONS OF CURRENT APPROACH
The preliminary approach to identifying relevant data sources using freight data
ontology has two main limitations. The first is reliance on regular expressions (REGEX)
to find keywords in the retrieved range of values or the data property labels as shown in
the pseudo code. Regular expressions utilize pattern matching; if the exact keyword
match is not found, it can return a false negative. For example, if the word “trucks” is
specified as a keyword, but the range of values contains the word “truck,” then using the
REGEX search function will lead to the system not recognizing that the keyword exists in

61
the database. To resolve this limitation, an additional technique such as stemming can be
used. Stemming is a procedure to reduce all words with the same stem to a common form
(Lovins 1968). For example, “trucks”, “trucked”, and “trucking” is based on the common
form “truck”.
The second limitation deals with ensuring that the ontology contains all the
possible range of values and data property labels. For example, databases such as the
Fatality Analysis Reporting System (FARS) and Highway Performance Measurement
System (HPMS) (U.S. Department of Transportation 2012, 2013) contain a large number
of unique values (e.g., roadway names and city names) which cause Protégé to crash
because not all the possible values could be stored in a single ontology file. To resolve
this latter limitation, data elements found to have a large range of values are linked to a
separate reference system comprising of unique values. In addition, databases which
utilize similar data elements, e.g. state names, can all be linked to the same reference list
as shown in Figure 12.

62
Figure 12: An example of a single reference list for multiple local ontologies
3.7 VALIDATION
To validate the generality of the global and local ontologies to adequately
represent multiple freight databases, questions from Chapter 2 are used to query the
ontologies. For example, taking the keywords from the question “
”, the ontology querying
algorithm will seek to find those keywords from only the corresponding data properties
as illustrated in Figure 13 with the FAF3 database. The search space for the word
is limited to the data property and the search space for the word is limited to
the , , and data properties. The local ontology mapping
ensures that not every data element in the various databases be searched. Furthermore,
ambiguity in keyword names is better handled. For example, if the query involves a street

63
name such as ‘ ’ only data elements mapped to the LinkIdentifier role are
searched, and not elements with the PlaceIdentifier role, which can contain in their range
of values the word in reference to the city, Houston.
Keyword → Global Ontology → FAF3 Local Ontology Data Properties
gravel → CommodityIdentifier → sctg2
I-35 → LinkIdentifier → NULL
2013 → Time → year
truck → ModeIdentifier → fr_inmode, dms_mode, fr_outmode
tons → CommodityUnitOfMeasure→ tons
Austin → OriginPlaceIdentifier → dms_org, dms_orgst, dms_fr_orig
Dallas → DestinationPlaceIdentifier →dms_dest, dms_destst, dms_fr_dest
Figure 13: Sample RBCS mapping of query keywords
Data Source Selection
A variety of freight data sources with different granularities and geographical
scope are selected to demonstrate the generality of the proposed ontology. Some of these
databases will be queried online and others stored in non-relational databases. Two of the
databases contain geospatial information which will be utilized in demonstrating how
adequate substitute data can be identified should the required information not be
available. The databases selected for the validation task are:
1. Commodity Flow Survey (CFS) – CFS is the primary source of national and state-
level data on domestic freight shipments by American establishments in mining,
manufacturing, wholesale, auxiliaries, and selected retail industries. Data is
provided on import and export, origin and destination, value, weight, and ton-
miles of commodities shipped by mode (Bureau of Transportation Statistics
2014a). CFS data used in this research is for 2007. As the 2012 data is available

64
but not yet released, the data value ‘2012’ is included in the year data element
field for demonstration purposes.
2. Freight Analysis Framework 3 (FAF3) – FAF3 provides estimates of U.S.
domestic, import and export freight movement. Estimates of freight measures
available include value, tons, and domestic ton-miles by mode of transportation,
type of commodity, to and from FAF defined zones. The data is currently
available for 2007 and 2012 with forecasts for 2015, 2020, 2025, 2030, 2035, and
2040 (Federal Highway Administration 2014). In this validation task, only 2007
and 2012 data is used. The data is made available in the following formats:
a. FAF3 Regional Database: This contains tonnage, value, and domestic ton-
miles by FAF region of origin and destination, commodity type, and mode.
b. FAF 3 Network Database: this contains disaggregate interregional flows from
the regional database assigned to individual highways using average payloads
per truck, and truck counts on individual highway segments. Data elements
contained in this database include route number, milepost, and annual average
daily traffic (AADT), annual average daily truck traffic (AADTT), FAF and
non-FAF truck volumes, roadway capacity, speed, delay and total vehicle
miles traveled (VMT).
3. U.S. Border Port of Entry (POE) Crossing/Entry Data – This database provides
summary statistics for incoming crossings at the U.S.-Canadian and the U.S.-
Mexican border at the port level. Monthly data is available for truck, train,
container, bus, personal vehicle, passenger, and pedestrian crossings from 1995 to
2013 (Bureau of Transportation Statistics 2014b).
65
4. North American Transborder Freight Data – This database contains freight flow
data by commodity type and by mode of transportation for U.S. exports to and
imports from Canada and Mexico from April 1993 to July 2014 (Bureau of
Transportation Statistics 2014c).
5. Texas Truck Traffic data (on-system roadways only) – Texas truck traffic data
was provided by the Texas Department of Transportation (TXDOT)
Transportation Planning and Programming (TPP) Division. It contains truck
traffic data derived from traffic counts along major highway segments in the state.
The data is provided in GIS format and contains the following: roadway prefix
and number, city, county, AADT and AADTT from 2007 to 2011. The 2012 data
set can be retrieved via XML on the TXDOT Statewide Planning Map website.
Results from Sample Queries
One hundred of the manually annotated questions were submitted to test the
adequacy of the developed ontologies to be used in representing multiple heterogeneous
databases. The result of the ontology queries is shown in Figure 14. The commodity, link,
mode and places names are of interest because these categories resulted in very low
precision metrics as a result of high false positives. The false negatives, which are shown
by the recall metric, can be attributed to the algorithms inability to identify some of the
keywords from the databases.

66
Figure 14: Ontology Querying Results
The following is a summary of observations made and the reasons for the
outcome shown in Figure 14:
1. Correct matches are dependent on the data sources containing either the exact or
similar values to the keywords. To illustrate this example, see Table 7 which
shows the results from querying the sentence “
” Data values
containing a keyword are identified (e.g. in ,
and in ‘ . Keywords which do not match
database values are not identified resulting in the response not being entirely
accurate. For example, was identified in the Texas Truck Traffic database but
not in the FAF 3 Network which represents the same roadway as . In a similar
fashion, using the keyword ‘ will result in null values for both
databases. Differences in roadway names can be addressed by mapping the
various names to a common nomenclature.
0.0
0.2
0.4
0.6
0.8
1.0P
reci
sion
an
d R
ecall
Precision Recall

67
2. The current approach also results in derivatives of keywords being found. For
example, the keyword truck results in ‘ ’ , ‘
, ‘ ’, ‘ ' and ' from the
CFS Mode database in addition to the desired value ' ’.
3. Another key observation from Table 7 is that querying all the fields from a single
database as identified by the ontology will not necessarily give you an answer to
the question. An example is the FAF3 Regional database. Should this database be
queried using the identified values, the result will be null. Furthermore, the data
Database Data Property/Element Values
CFS Commodity
CFS Mode
FAF3 Regional
FAF3 Network
Transborder
U.S. Border POE
Crossing/Entry Data
Table 7: Sample Ontology Querying Result

68
element fields, and , represent foreign outbound and
inbound modes of transport to and from U.S. ports of entries/exits. These data
element fields have no relation to the question being asked about
movement originating from and destined for which is moved by
as provided in the domestic mode category .
4. Compound phrases such as ‘ and ‘ ’ (from Appendix
B) did not return any results as these keywords, in their current compound form,
do not exist in any of the databases. For example, if taken as two different
keywords, both and can be found in the Transborder and Border
Entry/Exit databases. Complex keywords such as ‘ ’ will require
additional post processing such as determining the current year and querying the
database for information 5 years from the current year.
5. Finally, some keywords returned wrong values. For example, the keyword
in the query “
” will return the values ‘ ’ from
the FAF3 Regional and CFS databases. Though somewhat correct, the question
is seeking the top five commodities and this cannot be derived from just the data
value ‘ ’.
Chapter 4 of this dissertation will seek to address these observations.
3.8 CHAPTER SUMMARY
Resolving freight data heterogeneity is required to facilitate efficient querying and
utilization of the information contained in the databases. A literature review found that no
formalized representation of freight data to address freight data heterogeneity, and current

69
data standards such as TransXML are limited in scope in terms of their representation of
freight data.
Using the hybrid approach to ontology development, multiple local ontologies
representing freight databases were mapped to upper-level ontology (the global
ontology). The ontologies are then queried using SPARQL to identify which databases
contained keywords identified from user questions. The algorithm developed in this
research task was successful in identifying which databases contained keywords.
However, a number of observations were made. These include:
1. The algorithm relies on exact pattern matches and ignores words which do not
satisfy the query pattern. For example, the word ‘ is not
identified if the keywords used in searching is either ‘ ’ or .
2. The algorithm returns values which may not be relevant for the query to be
performed. For example, a search for truck returns both ‘truck’ and ‘truck and
rail'
3. It cannot determine which values or fields can actually be used in performing the
final querying task to retrieve data.
4. It is unable to detect compound phrases such as ‘ ’ or ‘ ’
and
5. It sometimes returns values which match keywords but are inaccurate in respect
to the question being answered. For example, the search for ‘
’ returns ‘ ’ in some of the databases.
The next chapter of this dissertation will seek to address the above limitations of
the current algorithm through string matching metrics and word relations. In addition, an
70
automated approach to identify auxiliary or secondary data when queries result in non-
responses will be examined.
This dissertation presents two main contributions to ontology usage in the civil
and transport data domains. The first contribution is the development of freight data
ontology which is a standardized knowledge representation of information that computer
systems and domain experts can utilize in identifying relevant databases to answer user
queries. The ontology was developed using the role-based classification schema (RBCS)
that organizes and classifies data elements first within their respective parent databases,
and then across multiple databases. The ontology facilitates interoperability between
multiple freight data sources and addresses the semantic heterogeneity that currently
exists across data sources.
The second contribution is a querying algorithm for searching through and
determining relevant freight data sources for answering questions. The querying
algorithm can be utilized in identifying gaps in freight data. Based on the literature,
current methods rely heavily on a user’s familiarity with a particular data source, which is
a disadvantage to less experienced data analysts or modelers. Furthermore, not all
practitioners are aware of the types of information available in other data sources, which
is often used to fill gaps. The ontology and querying algorithm provides a formal
approach and tool that can assist researchers and data collectors to identify current gaps
based on freight data users’ needs and the data collected and recorded in the publically
available freight data sources.

71
CHAPTER 4: IDENTIFYING AND ADDRESSING AMBIGUITIES BETWEEN NAMED
ENTITIES AND DATA VALUES
4.1 RESEARCH MOTIVATION
In Chapter 3, a number of observations were identified as a result of querying
heterogeneous freight data sources. These observations include:
O1. The algorithm’s overreliance on exact pattern matches. For example, searching
for ‘ ’ using ‘ ’ or .
O2. The algorithm returns additional values not relevant to the query being
performed. For example searching for only ‘ ’ returns both ‘ ’ and
‘ '.
O3. It cannot determine which fields are actually required to perform the final
database querying task to retrieve the data. For example, querying domestic
freight movement returns the foreign mode of transport field (‘ ’) from
the FAF3 Regional database when only domestic mode of transport is required
(‘ ’).
O4. It is unable to detect compound phrases such as ‘ ’ or ‘ ’.
O5. It returns values which match keywords but are inaccurate in respect to the
question being answered. For example, the search for ‘
returns ‘ ’ in some of the databases. This needs to be
addressed through an understanding of not just keyword phrases but the context
within which a phrase is utilized.
In addition to the above, database querying can result in one of the following outcomes:
O6. The best case scenario where only one database is capable of answering the user
query,

72
O7. An alternative scenario where two or more databases are capable of answering
the user query, and
O8. The worst case scenario where none of the databases is capable of answering the
user query.
Ideally, observation O6 is preferred but the other two outcomes (O7 and O8) cannot be
ignored. In O7, there currently is no formal set of rules to determine the best data to
answer a query if multiple data sources meet the specified search criteria. For example,
the query “ ” can
be answered by both the CFS and FAF3 databases. In another example, the query “
” will result in two
possible data sources: the national Fatality Analysis Reporting System (FARS) and
TXDOT's Crash Records Information System (CRIS). As demonstrated in both
examples, despite the possibility that multiple freight databases can answer the query, the
level of detail being provided by each source may not necessarily be the same. For
example, the FAF3 and CRIS databases are much more disaggregated than the CFS and
FARS databases, respectively. To address this concern, users are provided with all the
answers from the various databases as ranking the databases can be subjective. For
example, despite FAF3 being more disaggregated than CFS, CFS forms the foundation of
FAF3. FAF3 supplements CFS data with a variety of other sources; however, CFS
provides greater commodity detail and additional shipment characteristics. It is therefore
best to provide users with all the possible options and enable them to compare and decide
which is best for the task at hand.
In O8, there are a number of reasons for queries to return non-responses. These
include:

73
O8.a Ambiguity in keyword and data value names
O8.b Questions may include actionable words such as “ ”, “ ”, and
“ ”,
O8.c Gaps may exist in the data e.g. level of disaggregation, reporting period, etc., and
O8.d Incorrect capturing and categorization of the natural language query.
4.2 OVERVIEW OF RESEARCH APPROACH
This dissertation provides recommendations for addressing ambiguities in
keyword and entity names (O8.a). Dealing with ambiguities also fixes observations O1,
O2, and O5. An initial approach for dealing with O3, O4, and O8.b using a rule-based
expert system is also presented. O8.c can be addressed through additional data gathering
and O8.d requires improvements to the hybrid named entity recognition model.
As shown in Figure 15, a review is first performed to determine the various
causes of named entity ambiguities. The discussions are limited to place names, roadway
names, mode of transport and commodities. Ambiguity handling methods are tested for
these four categories and their ability to effectively disambiguate entity names is
compared. Final query rewriting algorithms are also developed to retrieve answers from
the databases.

74
Figure 15: IDEF0 diagram for addressing ambiguities in keyword names before final
querying is performed. 0 0
4.3 BACKGROUND ON NAMED ENTITY AMBIGUITIES FOR FREIGHT RELATED
CATEGORIES
Based on results from querying multiple freight data sources using ontologies,
three main categories of named entity ambiguities are identified: 1) geographic name
ambiguity including place names and roadway names, 2) mode of transport ambiguity,
and 3) commodity name ambiguity.
Ambiguities in Geographic Names
According to (Volz et al. 2007), geographic named entity ambiguities exist in the
following forms:
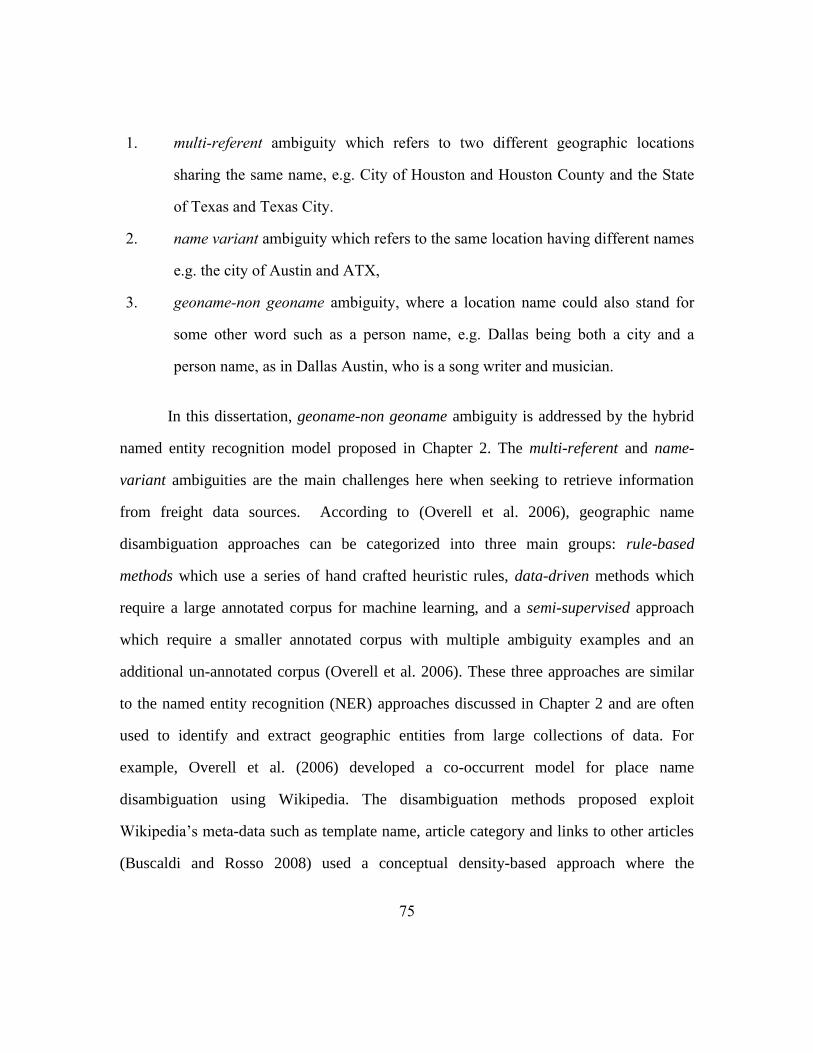
75
1. multi-referent ambiguity which refers to two different geographic locations
sharing the same name, e.g. City of Houston and Houston County and the State
of Texas and Texas City.
2. name variant ambiguity which refers to the same location having different names
e.g. the city of Austin and ATX,
3. geoname-non geoname ambiguity, where a location name could also stand for
some other word such as a person name, e.g. Dallas being both a city and a
person name, as in Dallas Austin, who is a song writer and musician.
In this dissertation, geoname-non geoname ambiguity is addressed by the hybrid
named entity recognition model proposed in Chapter 2. The multi-referent and name-
variant ambiguities are the main challenges here when seeking to retrieve information
from freight data sources. According to (Overell et al. 2006), geographic name
disambiguation approaches can be categorized into three main groups: rule-based
methods which use a series of hand crafted heuristic rules, data-driven methods which
require a large annotated corpus for machine learning, and a semi-supervised approach
which require a smaller annotated corpus with multiple ambiguity examples and an
additional un-annotated corpus (Overell et al. 2006). These three approaches are similar
to the named entity recognition (NER) approaches discussed in Chapter 2 and are often
used to identify and extract geographic entities from large collections of data. For
example, Overell et al. (2006) developed a co-occurrent model for place name
disambiguation using Wikipedia. The disambiguation methods proposed exploit
Wikipedia’s meta-data such as template name, article category and links to other articles
(Buscaldi and Rosso 2008) used a conceptual density-based approach where the

76
maximum correlation between the sense of a given word and its context is used to
address place name ambiguities. Zhang (2012) developed an exact-all-hop shortest path
approach to solve road name disambiguation in text descriptions which provide directions
from and to a location. The approach examines all possible roadways provided in the
description and seeks to minimize the sum of distances – thus ignoring the structured
sequence in which the information is provided. This approach addresses noisy data such
as obsolete or missing road names which popular shortest path algorithms such as
Dijkstra or Bellman-Ford do not address (Zhang 2012).
For freight related natural queries, the problem of geographic name ambiguity is
less complex because of the limited geographical scope of freight data sources. For
example, FAF3 includes 123 geographical regions, CFS contains 159 geographical
regions and the Transborder database contains 487 border ports of entries as shown in
Table 8. Each region in these data sources are also defined by an additional attribute such
as U.S. State name, thus making the disambiguation task less cumbersome.
Table 8: Database Place Counts
There are also multiple reasons for roadway name ambiguities. An example is the
different prefixes and suffices utilized in different data sources as shown in Table 9.
Database Place Count
CFS Commodity/Mode 158 place names including 50 U.S. states
FAF3 Regional 123 place names including 50 U.S. states
FAF3 Network Includes roadways from the 50 U.S. states
North American Transborder 487 port names, 99 states/provinces
and 5 countries/territories
U.S. Border POE Crossing/Entry 144 land border crossing POEs in 14 U.S. states
Texas Truck Traffic Counts Limited to Texas

77
Another example is the different names given to the same roadway. For example, in
Austin, a section of is also designated as and sections of
are given names such as and . The data
sources examined in this dissertation provide information only on the primary roadway
networks which tend to have similarly designated roadway numbers. However, the prefix
and suffix issues still exist. This dissertation only examines how to address prefixes in
roadway names and a similar methodology can be used to solve suffices issue as well.
Ambiguities in Mode of Transport Categories
Ambiguities in freight modes of transport names are mainly due to the different
names given to the same modes in different databases. For example, as shown in Figure
16, are sometimes referred to as or to differentiate
them from passenger pickup trucks. are also referred to as ,
or just mode of transport. Ambiguities also exist when single modes are used
Road Category Ambiguities
Interstate Interstate nn, I-nn, IH-nn, IH nn
US Route U.S. Highway nn, U.S. Route nn , US nn, US-nn
State State Highway nn, S.H. nn, SH nn, St. Hwy. nn
County road
County Road nn, County Route nn, CR nn, Co. Rd.
nn
Loop Loop nn
Spur Spur nn
Farm to Market Road Farm-to-Market Road nn, FM nn
Ranch to Market Road Ranch to Market Road nn, RM nn
Toll Road Toll nn, Toll Road nn
Business Interstate BI nn, B nn
Table 9: Differences in Roadway Name Prefixes

78
in querying the data sources. These modes are sometimes aggregated into the
category which refers to a combination of modes. Examples include or
. In an ongoing study by Walton et al. (2014), differences in mode of
transport names are currently being addressed. In this dissertation, disambiguation of
mode of transport names is performed by querying each data source with the different
names as the system is not aware of which name is used in each data source.
Note: LTL (less-than-truckload), TL (truck-load)
Figure 16: A combination of Mode of Transport names and sub-categories from multiple
sources

79
Ambiguities in Commodity Names
Commodity name ambiguity is mainly a result of different classification codes
and levels of disaggregation used by the various data sources. For example, the CFS and
FAF3 use the Standard Classification of Transported Goods (SCTG) commodity codes
whiles the North American Transborder database uses the Harmonized Tariff Schedule of
the United States of America (HTUSA)[Bureau of Transportation Statistics 2014a,
2014c]. The CFS and FAF3 report 43 unique commodity codes while the Transborder
database reports information on 99 unique commodity codes. Table 10 shows a sample of
the commodity codes used in the three data sources.
Table 10: Differences in Commodity Code Classifications
Code Commodity Description Code Commodity Description
1 Live animals 1 Live animals and live fish
2 Meat and edible meat offal 2 Cereal grains
3 Fish and crustaceans, mollusks and other aquatic invertebrates3 Other agricultural products
4 Dairy produce; Birds' eggs; Natural honey; Edible products of animal origin, not elsewhere specified or included4 Animal feed and products of animal origin, n.e.c.
5 Products of animal origin, not elsewhere specified or included 5 Meat, fish, seafood, and their preparations
6 Live trees and other plants; Bulbs, roots and the like; Cut flowers and ornamental foliage6 Milled grain products and preparations, bakery products
7 Edible vegetables and certain roots and tubers 7 Other prepared foodstuffs and fats and oils
8 Edible fruit and nuts; Peel of citrus fruit or melons 8 Alcoholic beverages
9 Coffee, tea, mate and spices 9 Tobacco products
10 Cereals 10 Monumental or building stone
11 Products of the milling industry; Malt; Starches; inulin; Wheat gluten11 Natural sands
12 Oil seeds and oleaginous fruits; Miscellaneous grains; Seeds and fruit; Industrial or medicinal plants; Straw and fodder12 Gravel and crushed stone
13 Lac; Gums; Resins and other vegetable saps and extract 13 Nonmetallic minerals n.e.c.
14 Vegetable plaiting materials; Vegetable products not elsewhere specified or included14 Metallic ores and concentrates
15 Animal or vegetable fats and oils and their cleavage products; Prepared edible fats; Animal or vegetable waxes15 Coal
16 Preparations of meat, of fish, or of crustaceans, mollusks or other aquatic invertebrates16 Crude petroleum
17 Sugars and sugar confectionery 17 Gasoline and aviation turbine fuel
18 Cocoa and cocoa preparations 18 Fuel oils
19 Preparations of cereals, flour, starch or milk; Bakers' wares 19 Coal and petroleum products, n.e.c.* (includes Natural gas)
20 Preparations of vegetables, fruit, nuts, or other parts of plants 20 Basic chemicals
21 Miscellaneous edible preparations 21 Pharmaceutical products
22 Beverages, spirits and vinegar 22 Fertilizers
23 Residues and waste from the food industries; Prepared animal feed23 Chemical products and preparations, n.e.c.*
24 Tobacco and manufactured tobacco substitutes 24 Plastics and rubber
25 Salt; Sulfur; Earths and stone; Plastering materials, lime and cement25 Logs and other wood in the rough
26 Ores, slag and ash 26 Wood products
27 Mineral fuels, mineral oils and products of their distillation; Bituminous substances; Mineral waxes27 Pulp, newsprint, paper, and paperboard
28 Inorganic chemicals; Organic or inorganic compounds of precious metals, of rare-earth metals, of radioactive elements or of isotopes28 Paper or paperboard articles
29 Organic chemicals 29 Printed products
30 Pharmaceutical products 30 Textiles, leather, and articles of textiles or leather
31 Fertilizers 31 Nonmetallic mineral products
32 Tanning or dyeing extracts; Tannins and their derivatives; Dyes, pigments and other coloring matter; Paints and varnishes; Putty and other mastics; Inks32 Base metal in primary or semi-finished forms and in finished basic shapes
33 Essential oils and resinoids; Perfumery, cosmetic or toilet preparations33 Articles of base metal
34 Soap, organic surface-active agents, washing preparations, lubricating preparations, artificial waxes, prepared waxes, polishing or scouring preparations, candles and similar articles, modeling pastes, dental waxes and dental preparations with a basis of plaster34 Machinery
35 Albuminoidal substances; Modified starches; Glues; Enzymes 35 Electronic and other electrical equipment and components and office equipment
36 Explosives; Pyrotechnic products; Matches; Pyrophoric alloys; Certain combustible preparations36 Motorized and other vehicles (including parts)
37 Photographic or cinematographic goods 37 Transportation equipment, n.e.c.*
38 Miscellaneous chemical products 38 Precision instruments and apparatus
39 Plastics and articles thereof 39 Furniture, mattresses and mattress supports, lamps, lighting fittings, and illuminated signs
40 Rubber and articles thereof 40 Miscellaneous manufactured products
41 Raw hides and skins (other than furskins) and leather 41 Waste and scrap
42 Articles of leather; Saddlery and harness; Travel goods, handbags and similar containers; Articles of animal gut (other than silkworm gut)43 Mixed freight
43 Furskins and artificial fur; Manufactures thereof 99 Commodity unknown
CFS and FAF SCTG CodesTransborder HTUSA Codes

80
Walton et al. (2014) identifies other commodity codes used other freight data sources
such as the Harmonized Tariff Schedule (or Harmonized System), Schedule B, the
Standard Transportation Commodity Code (STCC), and the Standard International Trade
Classification (SITC) [Railinc 2012; United Nations 2006; US Census Bureau 2014; US
International Trade Commission 2014].
The problem with the different classification codes is that searching for the word
“ ” (using Table 10 as an example) will result in the HTUSA having one commodity
code ( – ) at the
2-digit level and the SCTG having two commodity codes ( – and –
Furthermore, searching
for the phrase “ ” will result in only the SCTG classification providing an
answer which is not entirely accurate as the HTUSA commodity classification code “
” includes “ ” though not directly mentioned in the 2-
digit commodity description. Another example is illustrated using the word “ ”. As
shown in Table 10, none of the 2-digit SCTG commodity codes contain the word “ ”
though the word falls under the larger category –
” (Bureau of Transportation Statistics 2006). However, in the list of 2-
digit HTUSA codes, group “ ” contains the word
“ ”.
As illustrated in the examples above, searching only the top-level 2-digit codes as
utilized in the data sources is not sufficient to identify the various commodity names. The
descriptive text used at this level is limited thus requiring that a deep search of each

81
commodity group be performed. This dissertation examines the feasibility of deep
searching the commodity codes and the challenges associated with using this approach.
4.4 NAMED ENTITY DISAMBIGUATION STRATEGIES AMONGST FREIGHT DATA
SOURCES
Disambiguation tasks in this dissertation focus on only the following named
entities: 1) geographic names for places, 2) roadway names prefixes, 3) mode of
transport names, and 4) commodity names. The following sections discuss the various
methodologies used in performing the disambiguation tasks.
Addressing Geographic Name Ambiguity for Place Names with Respect to Freight
Data Sources
Due to the limited geographical scope of freight data sources used in this
dissertation, place name disambiguation is first performed using two string similarity
algorithms by Levenshtein (1966) and Jaro-Winkler (Winkler 1999). These algorithms
measure the similarity or dissimilarity between two text strings using an edit distance
which is the minimum number of operations (e.g., delete, insert and change a character)
required to transform one string into the other (Goldstein et al. 2005). The purpose of
selecting the string matching algorithms is to determine if database management system
modules such as PostgreSQL’s which provides multiple string matching
algorithms as part of the querying functions (PostgreSQL 2014) is appropriate for
addressing place name disambiguation of freight data sources.
The second method utilized compares actual geographical locations of the place
names. This approach is found to be more effective in place name disambiguation (Smith
and Crane 2001). It, however, requires geocoding of the named entities with the

82
challenge being that the spelling of the place names must correspond with the spelling
used in the geocoding database. This raises the issue of name variant ambiguity (e.g.
and ). Web based geocoding systems such as Microsoft’s Bing
Map Representational State Transfer (REST) Services are found to address name variant
ambiguity to some extent (Microsoft 2014).
The above methodologies do not address misspellings in the database values
themselves. This is the challenge when relying on the agencies to perform data quality
tasks. Databases may need to be further examined to determine if misspellings do exist in
some of the data values. The processes described here are however database independent
and the principles can be applied to any database of choice.
String Matching Algorithms
Levenshtein’s distance measures the difference between two strings by
determining the smallest number of insertions, deletions, and substitutions required to
change one string to another. Mathematically, the distance is computed using the
formula:
{
{
Where ) are the two strings, is the index of each character in each string, and
= 0 when and equal to 1 otherwise. If the result equals 0, the strings are
equal. If not, the first term signifies deletion from , the second term is insertion,

83
and the third term is substitution when there is a mismatch. The cost or edit distance (+1)
is computed for each edit operation. The smaller the edit distance, the greater the
similarity of the two strings (Levenshtein 1966). Edit distances from 0 to 4 are tested to
determine the performance of using Levenshtein’s distance to address place name
ambiguity.
The Jaro–Winkler distance measures similarity based on the number of characters
that two strings have in common. The greater the number of commonalities, the more
similar the strings are. Given the formula:
{
Where are the two strings, are their respective lengths, is the
number of matching characters, is the weight associated with characters in the first
string, is the weight associated with characters in the second string, and is the
weight associated with the number of transpositions of characters i.e., the number of
matching characters in a different sequence order divided by 2. Two characters from
and are considered matching if they are the same and no further apart than
. and are currently set to
for matching applications. If
match by character-to-character then D equals 1. If , do not have any
matching characters then D equals 0. All other string similarities are measured between 0
and 1. Jaro–Winkler Distance favors strings that match from the beginning. Given a
prefix length (

84
is the iteratively computed Jaro-Winkler distance for each value in . Jaro-
Winkler distances between 0.7 and 1.0 are tested to determine the performance of Jaro-
Winkler’s distance to address place name ambiguity.
Measuring the Distance between Geographical Points
To determine the distance between geographical centroids of place names, the
latitude and longitude of each place is first determined. The Haversine formula is then
used to determine the distance. The assumption here is that references to the same place
have a minimum distance threshold for which the same name cannot exist more than
twice. Various distances are tested to determine which one is most appropriate for
addressing place name ambiguity in freight data sources. Five different thresholds are
tested: 5, 10, 25, 50, and 100 miles.
Comparison of the Place Name Disambiguation Methods
The place name disambiguation strategies are compared using the
precision metric. The goal is to minimize the number of false positives and maximize the
number of true positives. Figure 17 shows the results from testing the various methods
discussed.
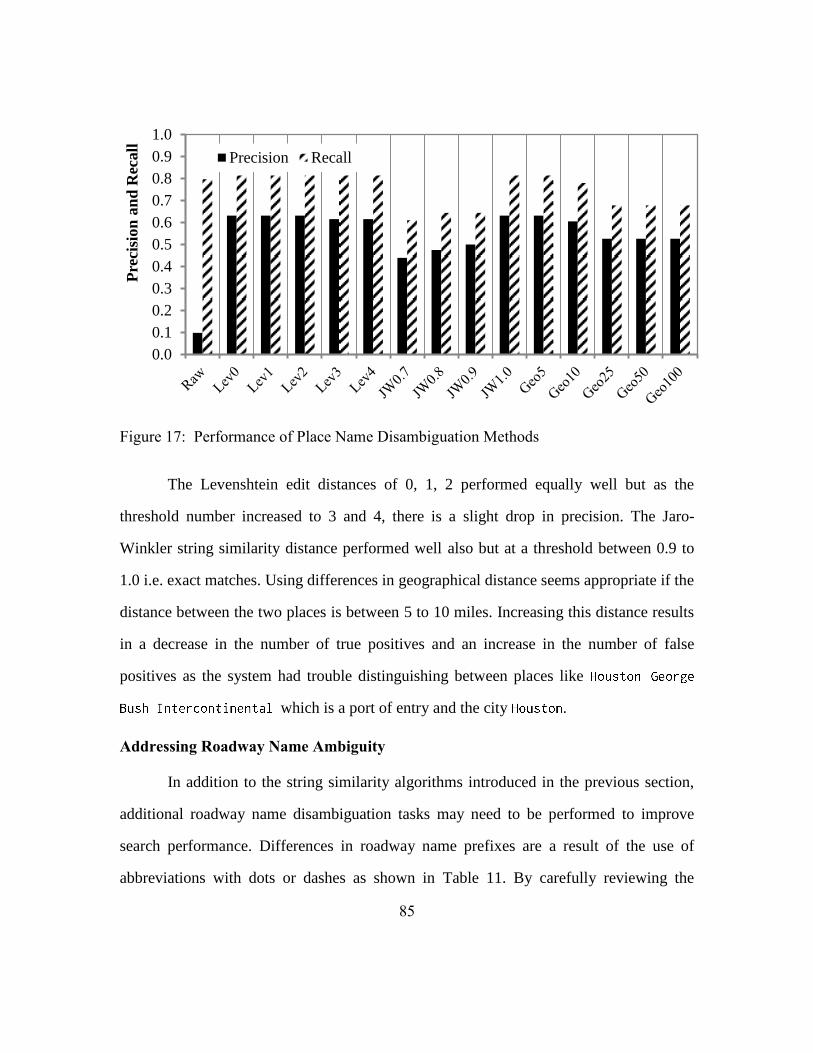
85
Figure 17: Performance of Place Name Disambiguation Methods
The Levenshtein edit distances of 0, 1, 2 performed equally well but as the
threshold number increased to 3 and 4, there is a slight drop in precision. The Jaro-
Winkler string similarity distance performed well also but at a threshold between 0.9 to
1.0 i.e. exact matches. Using differences in geographical distance seems appropriate if the
distance between the two places is between 5 to 10 miles. Increasing this distance results
in a decrease in the number of true positives and an increase in the number of false
positives as the system had trouble distinguishing between places like
which is a port of entry and the city .
Addressing Roadway Name Ambiguity
In addition to the string similarity algorithms introduced in the previous section,
additional roadway name disambiguation tasks may need to be performed to improve
search performance. Differences in roadway name prefixes are a result of the use of
abbreviations with dots or dashes as shown in Table 11. By carefully reviewing the
0.0
0.1
0.2
0.3
0.4
0.5
0.6
0.7
0.8
0.9
1.0P
reci
sion
an
d R
ecall
Precision Recall

86
prefixes, it is possible to reduce the names to only the first letter and the roadway
number. This can then be translated into a regular express pattern where the “ ” which
signifies any character, is placed between the first letter and the roadway number. By
doing so it is possible to capture all roadway names which have any of the naming
schemas shown in Table 11.
Table 11: Addressing Roadway Name Ambiguity
By using the regular expression search pattern, the precision of the roadway name
is improved as shown in Figure 18.
Road Category Ambiguities Reduce To Search With
Interstate
Interstate nn, I-nn,
IH-nn, IH nn I nn ^(i.*nn)$
US Route
U.S. Highway nn,
U.S. Route nn , US nn, US-nn U nn ^(u.*nn)$
State
State Highway nn, S.H. nn,
SH nn, St. Hwy. nn S nn ^(s.*nn)$
County road
County Road nn, County Route nn,
CR nn, Co. Rd. nn C nn ^(c.*nn)$
Loop Loop nn L nn ^(l.*nn)$
Spur Spur nn Sp nn ^(sp.*nn)$
Farm to Market
Road
Farm-to-Market Road nn,
FM nn FM nn ^(f.*nn)$
Ranch to Market
Road
Ranch to Market Road nn,
RM nn RM nn ^(r.*nn)$
Toll Road Toll nn, Toll Road nn T nn ^(t.*nn)$
Business
Interstate BI nn, B nn B nn ^(b.*nn)$

87
Figure 18: Performance of Reduced Regex Method
Addressing Mode of Transport Name Ambiguity
As discussed in the background section, mode of transport ambiguity is a result of
different names being used for the same mode of transport (e.g. water/vessel/ship/carrier)
or the different sub-categories of a mode (e.g. , ,
, ). Limiting the search to exact word phrases with multi-search is
therefore preferable. Mode of transport names are also referred to in their plural form
such as , and or verbal forms such as , , ,
and To limit the possible search patterns, words can be stemmed to their
common form before the search is performed. Therefore, the groups of words used in
performing the multi-search are:
1. rail, train
2. water, vessel, ship, carrier
3. multimodal, multiple modes
4. parcel, courier, mail
0.0
0.2
0.4
0.6
0.8
1.0
Raw Reduced Regex
Pre
cisi
on
an
d R
ecall
Precision Recall

88
Any other words not belonging to the above groups will be searched using exact
pattern matches. The results of the above approach are shown in Figure 19. The precision
of the mode of transport named entity increased as a result of decreased false positives
from the initial number of 85 to 2. The number of true positives however also decreased
from 126 to 106. This shouldn’t be the case therefore further refinement of the algorithm
is required.
Figure 19: Performance of exact match with multi-search for addressing ambiguities in
mode of transport names
Addressing Commodity Name Ambiguity
Commodity name searches can be a challenge. As discussed in the background
section of this chapter, different commodity code and classification systems are utilized
in the different freight data sources. For example, the CFS and FAF reports 43 unique
commodity codes at the 2-digit level while the North American Transborder database
reports information on 99 unique commodity codes at the same level.
The challenge is that, a single keyword search may result in multiple search
results depending on the commodity group level search. Using Table 12 as an example,
searching for the word “ ” in the HTUSA classification codes used by North
0.0
0.2
0.4
0.6
0.8
1.0
Raw Stemming + Multisearch
Pre
cisi
on
an
d R
ecall
Precision Recall

89
American Transborder database returns 13 results at the highest grouping level and 289
results at the lowest grouping (US International Trade Commission 2014). Searching for
the same word in the SCTG commodity codes returns 3 results at the highest level and 4
results at the lowest level.
The best strategy therefore will be to focus on the highest commodity group levels as
reported in the respective databases using the following rules:
1. Perform a deep search of the lowest group but return only the highest level
commodity group
2. Do not aggregate results from different commodity groups.
3. Exclude group names which have the word “ ” or “ ” before the
keyword being searched if both words are in the same parenthesis.
4. Notify user of all applicable commodity groups and let user decide whether to be
more specific e.g. search using “ ” or “ ”.
90
HTUSA SCTG
Code Description Code Description
10
11
19
23
28
39
41
44
68
69
71
72
84
Cereals e.g. 1006.30.90 – Long grain,
Medium grain, Short grain
Products of milling industry; malt; starches;
inulin; wheat gluten e.g. 1104 – Cereal
grains otherwise worked
Preparations of cereals, flour, starch or milk;
bakers' wares e.g. 1903.00 – Tapioca and
substitutes therefor prepared from starch, in
the form of flakes, grains, pearls, [...]
Residues and waste from the food industries;
prepared animal feed e.g. 2302.40.01 – Of
other single cereal grains, chopped, crushed
or ground
Inorganic chemicals; organic or inorganic
compounds of precious metals, [...] e.g.
2818.10.20 – Artificial corundum … in
grains, or ground, pulverized or refined
Plastics and articles thereof e.g. 3919.90.10
– Having a light-reflecting surface produced
in whole or in part by glass grains (ballotini)
Raw hides and skins (other than furskins)
and leather e.g. 4107.11 - Whole hides and
skins: Full grains, unsplit
Wood and articles of wood; wood charcoal
Articles of stone, plaster, cement, asbestos,
mica or similar materials
Ceramic products
Natural or cultured pearls, precious or semi-
precious stones [...]
Iron and steel
Nuclear reactors, boilers, machinery and
mechanical appliances; parts thereof e.g.
8437.10.00 –Machines for cleaning, sorting
or grading seed, grain
02
03
04
06
Cereal Grains (includes seed)
e.g. 02094 – Grain sorghum, 02909 –
Other cereal grains (includes rice)
(excludes soy beans, see 03400, and other
seeds, see 0350x)
Agricultural Products (excludes Animal
Feed, Cereal Grains, and Forage
Products)
Animal Feed, Eggs, Honey, and Other
Products of Animal Origin e.g. 04199 –
Other products of animal origin, and
residues and waste from the food
industries used in animal feeding, not
elsewhere classified (includes natural
honey, sausage casings, down, [...],
distillers spent grains, [...])
Milled Grain Products and Preparations,
and Bakery Products e.g. 06299 – Inulin;
wheat gluten; milled cereals and other
vegetables; and grains otherwise worked,
(includes rolled, flaked, hulled, pearled,
sliced, or kibbled) (excludes milling by-
products, see 04130)
Table 12: Results of commodity group search for the word “grain” as reported in
the HTUSA and SCTG classifications codes

91
Words like “goods” and “freight” and “commodity” are also too general to be
searched. These yield multiple results without any clarity in commodity groups. These
commodity searches may need to be addressed programmatically.
Using the same 60 questions used in evaluating the other ambiguities, the problem
of multiple commodity groups is demonstrated. Two types of searches for the commodity
keywords is performed as shown in Table 13. The first search involves only the top level
2-digit categories and the second search involves the deep search of all commodity
groups.
Table 13: Search results based on the type of search performed.
As expected the number of search results for the deep search exceeds that of the 2
digit search especially for the HTSUSA commodity classification. The HTSUSA
classification contains more category sub-groups than the SCTG thus the higher number
of results. Based on the above search results, the recommended solution therefore is to
allow the user to further specify which commodity group best fits the question being
asked.
Type of Search SCTG HTSUSA
2 Digit Level 43 40
All Commodity Groups 48 86

92
4.5 EXPERT SYSTEMS – MOVING TOWARDS INTELLIGENT KNOWLEDGE BASED
APPLICATIONS TO ANSWER FREIGHT RELATED QUESTIONS
In the field of artificial intelligence, an expert system is defined as an intelligent
system which seeks “to emulate human expertise” to perform tasks (Hadden and
Feinstein 1989). It varies from conventional software or program in that a conventional
program “is a mixture of domain knowledge and a control structure to process this
knowledge”. Changes in the programing code affect both the knowledge and the code
itself. In expert systems, “knowledge is separated from the code processes” (Negnevitsky
2005). Thus new knowledge can be added without the need to make changes to the code.
Expert systems enable the reuse of domain knowledge and ensure consistency in decision
making. As new knowledge is acquired, the systems become “smarter” and provide an
efficient approach to solve difficult problems. The main components of expert systems as
identified in the literature include: a knowledge base, a database of facts, the inference
engine, and the user-interface. The knowledge base contains domain knowledge used in
problem solving (Negnevitsky 2005). The database is a collection of facts used by the
inference engine to match against the conditional parts of the rules stored in the
knowledge base. The inference engine “decides which rules are satisfied by the facts,
prioritizes them, and executes the rule with the highest priority” (Robin 2010). The
challenges with utilizing expert systems include knowledge acquisition, determining the
components of the system, developing the system, and maintaining the system
(Negnevitsky 2005).
One type of expert system is the rule-based expert system where knowledge is
expressed as rules such as in statements. Each rule specifies either a
relation, recommendation, directive, strategy, or heuristic representing the task to be

93
performed (Negnevitsky 2005). The rules provide a description on how to solve a
problem based on available information and can have multiple conditions (antecedents)
and conclusions or actions (consequent).
This section provides some examples of rules to intelligently query databases
based on the question being asked and the information available in the applicable
databases. Querying statements are shown using SQL, a standard language for accessing
databases (Date and Darwen 1987). Multiple scenarios are examined for each example.
The actual database fields used in performing the queries are retrieved from the
respective local ontologies of the respective databases.
Example 1
An alternate form is:
The SQL query statement to answer the above question is given as:
Of interest here is the phrase ‘how many’. If this phrase did not exist and instead the
question is posed as:
Then defining what field we are selecting to answer the question becomes a challenge
as in:

94
One strategy to address the vagueness in the user’s question is to associate key
phrases to fields. This leads to the first rule:
This rule does not apply to questions of the form:
These questions are queried using the following statements:
There are two challenges here. The first challenge is whether the system knows
when to and when not to apply summation (e.g. number of accidents vs. truck traffic).
The second challenge is occurs when the unit of measure is the same as the mode of
transport (e.g. trains, trucks). The above challenges are addressed using the following
rules:

95
Example 2
There are instances where querying the ontologies return additional fields which
are not required to answer the question. For example, the question
Will result in the following response by the FAF3Regional database:
There are a number of issues here.
1. The year is not specified
2. The origins are not specified
3. In addition to domestic mode, the foreign mode fields are selected and querying
all these field at once may result in non-responses
4. Nothing is specified whether this is a domestic, import or export commodity.
The above challenges lead to developing the following rules:

96
The above rules result in the following query statements where the field containing
the mode of transport varies.
Example 3
These examples include keywords which require additional programming steps
beyond SQL statements. Words in brackets […] signify that there are alternative options
which can replace that word. Words in parenthesis (…) are optional.
To address the above questions, the following rules are proposed:

97
Validation of Rules
The generality of the developed rules is tested on the databases selected for this
dissertation. The goal is to determine how the rules apply to the different database
schemas and recommend future revisions to the rules.

98
Database Applicable Rules Query Statement Comments
FAF3REGIONAL R1 = ‘tons’
R3 = Sum(‘tons’)
R6 =
‘DomesticMode’,
‘ForeightInMode’,
‘ForeignOutMode’
Meets 6 field requirements.
Missing IH35.
Multiple queries by mode.
Queries using ForeignInMode and
ForeignOutMode returns null values
TEXASTRAFFIC None Database does not meet SELECT
requirement specified in Rule 1 and
does not pass Rule 2
CFSMODE R1 = tons
R3 = Sum(tons)
Meets 5 field requirements.
Missing IH35 and commodity.
CFSCOMMODITY R1 = tons
R3 = Sum()
Meets 5 field requirements.
Missing IH35 and mode.
FAF3NETWORK R1 = tons
R3 = Sum(tons)
R4 = 2007
Meets 2 field requirements.
Missing link, mode, place names, and
commodity. 1 field is inferred from
Rule 4.
BORDERENTRY None Database does not meet SELECT
requirement specified in Rule 1 and
does not pass Rule 2
TRANSBORDER R1 = tons
R3 = Sum(tons)
Meets 3 field requirements. Missing
IH35 and place. Commodity name is
missing in 2-digit level group.
Table 14 (continued): Validation of Querying Rules

99
Database Applicable Rules Query Statement Comments
FAF3REGIONAL R2 = ‘tons’,’ton-mile’,’value’
R3 = Sum(tons), Sum(value)
R6 = DomesticMode,
ForeightInMode,
ForeignOutMode
Meets 2 field requirements and
SELECT field is inferred from Rule 2.
Multiple queries by mode and unit.
TEXASTRAFFIC R2 = traffic, truck traffic
R3 = No Sum
Meets 1 field requirement and
SELECT field is inferred from Rule 2.
Multiple queries by unit.
CFSMODE R2 = ‘tons’,’ton-mile’,’value’
R3 = Sum(tons), Sum(value)
Meets 2 field requirements and
SELECT field is inferred from Rule 2.
Multiple queries by unit.
CFSCOMMODITY R2 = ‘tons’,’ton-mile’,’value’
R3 = Sum(tons), Sum(value)
Meets 2 field requirements and
SELECT field is inferred from Rule 2.
Multiple queries by unit.
FAF3NETWORK R2 = tons
R3 = Sum(tons)
R4 = 2007
Meets 1 field requirement and
SELECT field is inferred from Rule 2.
BORDERENTRY R2 = trains
R3 = Sum(trains)
Meets all field requirements and
returns desired answer.
TRANSBORDER R2 = tons, value
R3 = Sum(tons), Sum(value)
Meets 4 field requirements and
SELECT field is inferred from Rule 2.
Multiple queries by unit. Returns total
tonnage and value for rail movements
through Eagle Pass
Table 14 (continued): Validation of Querying Rules

100
RULE 8 is invoked for all databases and queries are performed for each year from 2010 to 2014
Database Applicable Rules Query Statement Comments
FAF3REGIONAL R1, R2 = ‘tons’,’ton-
mile’,’value’
R3 = Sum(tons),
Sum(value)
R4 = ‘2012’
R6=’Coal’, ‘Coal and
petroleum products, nec’
Meets 2 field requirements and
SELECT field is inferred from Rules
1 and 2. Multiple queries by unit and
commodity. Rule 8 results in a single
year.
TEXASTRAFFIC R2 = traffic, truck traffic
R3 = No Sum
R4 = ‘2010 to 2012’
Meets 1 field requirement and
SELECT field is inferred from Rule
2. Multiple queries by unit. Rule 8
results in three years.
CFSMODE R1, R2 = ‘tons’,’ton-
mile’,’value’
R3 = Sum(tons),
Sum(value)
R4 = ‘2012’
R6=’Coal’, ‘Coal and
petroleum products, nec’
Meets 1 field requirements and
SELECT field is inferred from Rules
1 and 2. Multiple queries by unit.
Rule 8 results in a single year.
CFSCOMMODITY R1, R2 = ‘tons’,’ton-
mile’,’value’
R3 = Sum(tons),
Sum(value)
R4 = ‘2012’
R6=’Coal’, ‘Coal and
petroleum products, nec’
Meets 2 field requirements and
SELECT field is inferred from Rules
1 and 2. Rule 8 results in a single
year.
Table 14 (continued): Validation of Querying Rules

101
Database Applicable Rules Query Statement Comments
FAF3NETWORK R1, R2 = ‘tons’
R3 = Sum(‘tons’)
R4 = ‘2007’
SELECT Sum(tons) FROM
FAF3NETWORK WHERE
State=’Texas’ AND Year=’2007’
Meets 1 field requirement and
SELECT field is inferred from
Rule 1.
Rule 8 results in a single year.
Commodity name is missing.
BORDERENTRY R2 = ‘trains’,’trucks’,’containers’,
etc.
R3 = Sum(trains). Sum(trucks),
Sum(containers), etc.
SELECT [Sum(trains) OR
Sum(trucks) OR Sum(containers)
OR …] FROM BORDERENTRY
WHERE PortLocation=’Texas’
AND (Year=‘2010’ OR
Year=‘2011’ OR Year=‘2012’
OR Year=‘2013’ OR
Year=‘2014’) GROUP BY Year
Meets 2 field requirement and
SELECT field is inferred from
Rule 1. Multiple queries by unit.
Rule 8 is completely satisfied.
Commodity name is missing.
TRANSBORDER R1, R2 = tons, value
R3 = Sum(tons), Sum(value)
SELECT [Sum(tons) OR
Sum(value)] FROM
TRANSBORDER WHERE
State=’Texas’ AND (Year=‘2010’
OR Year=‘2011’ OR
Year=‘2012’ OR Year=‘2013’
OR Year=‘2014’) GROUP BY
Year
Meets 2 field requirements.
Multiple queries by unit. Rule 8 is
completely satisfied. Commodity
name is missing in 2-digit level
group.
Table 14: Validation of Querying Rules

102
Based on the results shown in Table 14 from the initial set of rules, one additional
rule which can be included to determine which database provides the most likely answer
to the user’s question is:
This final rule will result in the following databases being selected for the
questions tested:
FAF3REGIONAL provides a partial answer to question 1 as it does not contain
information on the route used which in this case is IH35. The Border Crossing/Entry
database (BORDERENTRY) provides a complete answer to question 2 as it contains all
the desired variables. Of the four databases shown in Question 3, the TRANSBORDER
database would have been selected as the best option if a deep search was used in
querying the commodity groups. Commodity groups “
”,
“ ”, “
” and “

103
” contain the word
“ ”. However, TRANSBORDER is limited to Mexico and Canada trade with the U.S.
FAF3REGIONAL and CFSCOMMODITY provide domestic flow information.
Therefore, selecting which of the four databases provides the best answer will require a
more robust rule than Rule 11 – something that ranks the level of importance of each
entity and not just how many fields meet the requirement. This final step needs to be
further examined as ranking named entities can be a confusing task as well. For example,
if COMMODITY is ranked highest, then only one year is provided in the
FAF3REGIONAL and CFSCOMMODITY databases. If TIME is ranked highest then the
BORDERENTRY data can also be selected but it contains no information about “ ”
and is limited only to the U.S.-Mexico Border. Including an additional database such as
the U.S. Census Bureau Foreign Trade database (US Census Bureau 2014b) will also
limit ‘ ’ movements to imports and export – thus ignoring domestic flows. This is
quite an interesting problem and does warrant additional investigation.
4.6 CHAPTER SUMMARY
Intelligently querying heterogeneous data sources to determine which one provides
the best answer to a user’s question is a complex task involving multiple steps and
considerations. In this chapter, the issue of named entity ambiguity was examined and
recommended approaches developed to resolve ambiguities that exist for place names,
roadway names, commodity names, and mode of transport. Additional testing on a larger
corpus and variety of entities is still required. Further refinements to the proposed
methodologies will decrease the number of false positives and increase the precision rate.
Decreasing the number of false positives is essential in the final database querying steps.
104
As demonstrated in the chapter, additional guidance is required to intelligently
perform queries even though applicable database fields may be identified using
ontologies. An introduction to the use of rule-based expert systems to perform this task
was presented. Future work will need to include additional databases and query types in
order to develop more robust knowledge bases. Deciphering between which database
provides the best answer when multiple databases satisfy an initial set of requirements is
also a challenge that warrants further investigation.
Finally, there is the issue of addressing freight data gaps. Freight data gaps exist
as a result of information not being represented at the required level of detail or in the
desired time period (Choubassi et al. 2014). One main reason for this is the absence of a
comprehensive and uniform freight data collection plan. With no set framework for data
collection efforts, different agencies end up collecting similar or overlapping data, at an
arbitrary level of detail. Issues of data redundancy or incompatibility in data sets often
result, making the available data sets insufficient for making informed decisions
(Transportation Research Board 2006, National Freight Advisory Committee 2014).
Strategies for addressing freight data gaps include combining multiple sources and
developing statistical models that provide estimates to fill any gaps. Another strategy is
utilizing information from items with similar characteristics as the object being
examined. An example is in the area of transportation forecasting studies where data from
a similar roadway is utilized as a substitute when actual field data for the infrastructure
does not exist (U.S. Department of Transportation 2013). In freight demand modeling,
substitute data commonly utilized by practitioners include freight trip generation rates
(ITE Trip General Manual 2012), economic input/output models (IMPLAN 2014, FHWA
HERS-ST 2013a), modal operating costs (ATRI 2014), and traffic flow estimates used in

105
developing the Highway Performance Monitoring System (FHWA 2014). Finding
adequate substitutes is a formal process which requires an understanding of the various
options and then determining which of the options serves as the best substitute. In
developing a system that instantaneously provides answers to user queries, the process of
finding the adequate substitute needs to be performed where gaps exist in the data.
Automating this process will require an understanding of the characteristics of an
individual object and how other objects relate to it.

106
CHAPTER 5: CONCLUSION
This dissertation work was successful in identifying and addressing a range of
challenges associated with retrieving information from heterogeneous freight data
sources to answer natural language queries. Current named entity recognition systems
were found to incorrectly classify entities when freight-related questions were tested—for
example, distinguishing between a point of origin and a destination point. These systems
may need to be further trained to perform freight-specific tasks but that will require a
large annotated corpus of freight-related queries, which currently does not exist. A hybrid
approach which combines multiple models and each model used in classifying a specific
named entity was found to be a successful alternative. However, additional work is still
required to improve the hybrid model. Correctly identifying and classifying keywords is
essential in automating the process by which databases are queried. It is possible to
automatically determine if current data sources are sufficient to adequately answer
questions by mapping keywords from questions to data element fields in various freight
databases. This next step requires the development of a standardized knowledge
representation of freight data sources using an ontology that both computer systems and
domain experts can understand. Keywords were then mapped to a global ontology which
in turn referenced multiple local ontologies representing freight data dictionaries. The
ontologies were represented as RDF graphs and queried using SPARQL. The algorithm
developed to perform this task was successful in identifying which databases contained
keywords. However, a number of observations were also made regarding ambiguities in
data values returned by the data sources.
Ambiguities arise as a result of different entities sharing the same names or
values, variants in entity names, and differences in definitions of entities with the same

107
name. Dealing with ambiguities is required to accurately query databases and also avoid
non-responses to user queries even though the information is available in the databases.
This dissertation provides recommendations for addressing ambiguities in freight related
named entities. In addition, the use of knowledge base expert systems to answer freight
questions was also introduced. Rule-based expert systems were used to intelligently
query heterogeneous data sources to determine which one provided the best answer to a
user’s question.
5.1 INTELLECTUAL CONTRIBUTIONS
Intellectual contributions from this dissertation include:
1. Development of a hybrid NER approach to correctly identify and classify
keywords from freight-related natural language questions. Future research on
freight information retrieval can utilize the approach to develop applications that
require the extraction of freight related keywords.
2. A collection of annotated freight-related questions to be used in training NER
models. With time, additional questions can be included to this initial list and
annotated to advance the development of a freight specific corpus.
3. Development of a freight data ontology which can serve as a standardized
knowledge representation of available freight data sources. The ontology
facilitates interoperability between multiple freight data sources and addresses the
semantic heterogeneity issues that currently exist.
4. A querying algorithm for searching through the freight data ontology and
determining relevant freight data sources for answering questions. The querying
algorithm can also be utilized in identifying gaps in freight data.

108
5. Strategies to address ambiguities that exist for place names, roadway names,
commodity names, and mode of transport in freight data values.
6. A rule-based expert system approach to intelligently decipher which databases
provide the best answer to a question when multiple databases satisfy an initial set
of requirements.
5.2 PRACTICAL IMPLICATIONS
Practical implications from this dissertation include:
1. Advancing the use of natural language applications in civil engineering.
Algorithms developed as part of this research work can be improved and
embedded into existing speech recognition applications or search engines to
answer user queries.
2. A hybrid freight NER and annotated corpus that can be expanded to the broader
transportation planning domain.
3. Freight data ontology that serves as a standardized knowledge representation of
freight data sources and facilitate interoperability between multiple systems.
4. The use of knowledge based systems into freight transportation modeling and
planning was introduced to intelligently decipher between multiple databases to
determine which one gave the best answer to a question. There are opportunities
to expand on this domain to perform advanced tasks such as data fusion, data
integration, and gap identification. As the internet moves towards a more
integrated ecosystem, future versions of intelligent search engines can utilize
domain knowledge in performing these advanced tasks.

109
5.3 LIMITATIONS AND FUTURE RESEARCH DIRECTIONS
This dissertation identified a number of areas that warrant future research. The
first is the need for an annotated freight data corpus. Corpus development is a time
consuming task but can be done through contributions from multiple sources. The
OntoNotes project for example, was a collaborative effort involving five universities to
develop a large-scale corpus of 2.9 million words from sources such as telephone
conversations, newswire, newsgroups, broadcast news, broadcast conversation, and
weblogs (Ralph Weischedel et al. 2013). Advancing such efforts in the transportation
domain would provide an opportunity to develop more intelligent applications and
knowledge bases for information exchange and data retrieval. In addition, examining the
use of speech recognition algorithms and porting the proposed approaches into other
languages aside from English will be an interesting area for further examination. The
gathering of questions relating to freight transport also enables practitioners to identify
additional areas for research and data collection. For example, it was found that some the
questions collected for this dissertation were such that answers could only be provided
either through additional research, surveys, interviews or modeling which were beyond
the scope of this work. Knowing what questions people are asking was found to be a very
valuable resource for future research.
A number of observations were also made during the process of finding
applicable data sources using ontologies. Though issues with named entity ambiguity
were addressed, this warrants additional research especially in addressing commodity and
industry classification systems. For example, an entity like freight industry information
was excluded from the analysis. Industry classification systems are similar to commodity
classification systems where top-level group text labels do not sufficiently describe

110
lower-level industry groups. Differences in classification systems raise the issue of
whether to perform a deep search or not. Roadway name ambiguities were also limited to
roadways with numbers. Future research should examine roadway names which include
person names, place names and other entity names. A geographical location
differentiation task similar to what was performed for the place names can be utilized as a
first step.
This dissertation illustrated the ontology querying algorithms using six databases.
Future work can expand on this number to include additional data sources following the
same methodology. Inclusion of additional data sources, especially private data sources,
increases the probability of finding answers to questions for which data is already being
collected. The querying algorithm developed may also need to be optimized. This is
necessary for large scale applications where thousands of user requests are made each
minute.
The issue of data quality and error propagation also warrants further investigation.
The fact that a database is capable of answering a question does not necessarily mean that
the information it is providing is entirely accurate. Future research can examine how data
quality can be incorporated into the database identification and selection processes.
Errors which occur during the named entity recognition, ontology querying and
disambiguation tasks may accumulate, and the system needs to be further developed to
handle this appropriately at each step.
Finally, the advancement of knowledge based expert systems will be beneficial to
how research findings are disseminated in the future. There are opportunities to expand
on this domain to perform more advanced tasks. In addition to rule-based approaches,

111
areas such as frame-based expert systems, fuzzy systems, artificial neural networks, and
genetic algorithms provide additional features which rule-based systems are incapable of
providing. An example is the ability to learn and automatically modify knowledge bases
or adjust existing rules and add new ones. This area of artificial intelligence is of great
interest to the author’s future research goals.
112
APPENDICES
Appendix A – List of Freight Related Questions
Appendix B – Annotated Freight Corpus
Appendix C – Freight Data Ontologies in XML format
Appendix D – Python Source Code

113
APPENDIX A - LIST OF FREIGHT RELATED QUESTIONS

114
1. How many trucks used CR 2222 in 2001?
2. How many truck related accidents occurred on IH35 in 2001?
3. What is the number of trucks on I-10 between 2 PM and 5 PM on a weekday?
4. How many kilograms of sugar were transported from Austin, TX to Houston, TX
the past month?
5. What is the total value of commodities transported during the Christmas season
on IH35 from October 2012 to January 2013?
6. In 2012, how many tons of gravel shipped from Austin to San Antonio using IH
35?
7. how many trains crossed the border at Eagle Pass in 2012?
8. How many tons of wheat were transported between Milwaukee and Madison in
May 2013?
9. How many trucks were carrying corn on I-35 on Saturday, May 10, 2014?
10. In 2013, how many truck-related accidents leading to a spillage in hazardous
materials occurred in the U.S.?
11. How many trucks used FM 2222 in 2001?
12. How many cargo planes landed in Austin-Bergstrom airport in 2013?
13. What is the average number of freight vehicles per day on US 281 between San
Antonio and the Mexican Border?
14. how many ports of entries are between Texas and Mexico?
15. how many northbound commercial trucks crossed the World Trade bridge in
Laredo?
16. how much emissions are produced by truck traffic during the peak period
compared to the non-peak period?
17. which route is cheapest for trucks traveling through Austin: SH 130 or IH-35?
18. What is the truck traffic mix on IH-10 in Houston?
19. What is the average travel time and level of service on major arterial roads during
peak hours?
20. What is the number of truck related accidents which occurred on IH-35 from May
2013 to June 2013?
21. What is the total value of export from the Port of Houston for the month of May
2013?
22. What is the total number of oversize/overweight vehicle permit fees collected in
Texas for FY 2013, by commodity and industry?
23. What percentage of accidents involved OS/OW vehicles in 2011 in the Eagle Fort
Shale area?
24. What is the number of parking facilities available on the IH-20 corridor from El
Paso to DFW?
25. What is the number of bridges along the IH-45 corridor requiring improvements?
26. What are the top five commodities/industries utilizing IH-35 as a major freight
corridor?
27. What are the top 3 most traveled roadways by AADT in Texas?

115
28. What is the total value of commodities transported during the Christmas season
on IH-35 from October 2012 to Jan 2013?
29. how much freight was moved in 2011 in Texas
30. what is the breakdown of freight in 2010 by mode?
31. how much freight was moved by truck last year
32. what city moved the most freight in 2012?
33. what state sends/receives the most freight by rail?
34. how much coal was moved to Texas in the last 5 years
35. What commodity is moved the most in the U.S.?
36. Value of commodity losses because of accidents on IH-20 from May 2013 to June
2013
37. Percentage of accidents involving trucks and motorcycles in the city of Austin for
the year 2012
38. Information on distress and skid data for IH-35 from San Antonio to Laredo in
2012
39. Report on the structural health of Texas bridges as of May 2013
40. Total number of jobs created as a result of the construction of SH 130
41. Information on CO2 emissions on IH-10 Katy from FM-1489 to IH-610 West
Loop
42. Change in emission levels as a result of modal shift from truck to rail along the
IH-45 corridor from Houston to Dallas
43. Data on the loss of vegetative land area as a result of the shale industry in Dimmit
County in 2012
44. Lost revenue to Texas due to jurisdiction shopping in FY 2012
45. Average travel speed of trucks compared to rail along IH-45 corridor from
Houston to DFW
46. Average shipping cost of rail compared to trucks along the coastal corridor in
2012
47. Average cost of transloading containers from truck to rail
48. Percentage of trucks using newly constructed George Bush Expressway instead of
SH-121
49. Truck traffic mix on major Texas roadways
50. Hourly Truck traffic count on IH-35 from Waco to Fort Worth
51. Percentage reduction in number of truck related accidents at intersections on IH
45 due to construction of an interchange
52. Change in air freight movements from Austin to Dallas in comparison to trucks
and rail
53. Change in VMT by transporting freight via rail instead of roadway/waterway
54. Expected percentage of truckers willing to use the newly planned SH 130 toll
road extension connecting San Antonio with Waco.
55. Classification of goods transported from Austin to Dallas by mode along the IH-
35 corridor

116
56. Expected efficiencies/profits/costs through the utilization of long haul vehicles
and heavier trucks on major Texas corridors
57. Number of accidents involving trucks moving petroleum products on IH-35 in FY
2012
58. County with lowest number of hazmat related accidents for FY 2011
59. Safest mode of transportation for NAFTA products (import/export) through Texas
60. Disparity in transportation funding of freight related projects for low income areas
in comparison to high income areas in FY 2012 e.g. intersection improvements,
noise barriers, etc.
61. Accessibility of low-income households to warehousing and manufacturing
facilities.
62. Change in travel speed and time along rail corridors in Houston should there be
no encroachment.
63. Number of intersections on a major arterial roadway requiring improvement to
turning radii.
64. I know 70% of US/MX trade is done by truck. What percentage of those come
thru Texas?
65. in 2013, how much lemons were moved in texas
66. in 2013, how much oil were moved in texas
67. how many lbs of cheese were moved through I-10 last year
68. Who pays for freight
69. What percentage of the network is comprised by rail
70. How many ports can handle post panamax ships
71. Freight data that is publically available– is it useful
72. How many ports are there in Texas
73. Should federal funding pay for freight
74. What percentage does freight jobs contribute to the US economy
75. Should freight be managed by DOTs
76. How has the focus on freight changed in the various highway trust fund bills
77. Is there any spare freight capacity
78. With the shift of crude by rail should we provide federal funds to the railroads
79. Could the DOT structure be steamlined e.g. less agencies or combined agencies
80. How do you find out freight data numbers
81. Which is the largest port in the US
82. Air cargo – what percentage of general freight is this
83. How many dedicated air cargo airports are there
84. What is the current maximum truck weight allowed on the interstate
85. What is the total annual inland freight transport in U.S.?
86. What is the total spending in the U.S. logistics and transportation industry?
87. What is the modal split of inland freight transport in U.S.?
88. What are the factors influence mode choice?

117
89. Where to find the freight flow information for a state, a district, a county, or a
route?
90. Where to find the truck VMT for a state, a district, a county, or a route?
91. Who are the major commercial vehicle carriers?
92. What is the difference between modeling freight transport V.S. other types of
transportation?
93. Where to find information regarding import and export goods?
94. What is typical crash rates for freight movement by severity level for both U.S.
and Texas?
95. How many freight trains travel from Los Angeles to Chicago per day, on average?
96. What is the commodity flow for space-related commodities (e.g., rocket fuel,
rockets, cargo, satellites, etc)?
97. In US, what highway routes are cattle shipped on?
98. How has the amount of corn shipped out by truck and rail from Iowa changed in
the past ten years?
99. Where are Amazon shipping facilities?
What are the freight mobility concerns of travel between Mexico and the US?
100. In your opinion, what technology will be have the greatest impact on the
freight industry?
101. With the expansion of the Panama Canal, what mode of freight will see
the greatest change within the US?
102. Describe the current situation of OS/OW vehicles both locally (Texas) and
nationally.
103. If $500 million was available for fright infrastructure nationally, where
and how would you suggest the money be spent?

118
APPENDIX B - ANNOTATED FREIGHT CORPUS

119
How O
many UNIT
truckers MODE
used O
CR LINK
2222 LINK
in O
2001 TIME
? O
| O
How O
many UNIT
truck MODE
related UNIT
accidents UNIT
occurred O
on O
IH35 LINK
in O
2001 TIME
? O
| O
What O
is O
the O
number UNIT
of O
trucks MODE
on O
I-10 LINK
between O
2PM TIME
and O
5PM TIME
on O
a O
weekday TIME
? O
| O
How O
many UNIT
kilograms UNIT
of O
sugar COMMODITY
were O
transported O
from O
Austin ORIGIN
, ORIGIN
TX ORIGIN
to O
Houston DESTINATION
, DESTINATION
TX DESTINATION
the O
past UNIT
month TIME
? O
| O
What O
is O
the O
total UNIT
value UNIT
of O
commodities COMMODITY
transported O
during O
the O
Christmas TIME
season TIME
on O
IH35 LINK
from O
October TIME
2012 TIME
to O
January TIME
2013 TIME
? O
| O
In O
2012 TIME
, O
how O
many UNIT
tons UNIT
of O
gravel COMMODITY
shipped O
from O
Austin ORIGIN
to O
San DESTINATION
Antonio DESTINATION
using O

120
IH LINK
35 LINK
? O
| O
how O
many UNIT
trains MODE
crossed O
the O
border LOCATION
at O
Eagle LOCATION
Pass LOCATION
in 0
2012 TIME
? O
| O
How O
many UNIT
tons UNIT
of O
wheat COMMODITY
were O
transported O
between O
Milwaukee ORIGIN
and O
Madison DESTINATION
in O
May TIME
2013 TIME
? O
| O
How O
many UNIT
trucks MODE
were O
carrying O
corn COMMODITY
on O
I-35 LINK
on O
Saturday TIME
, TIME
May TIME
10 TIME
, TIME
2014 TIME
? O
| O
In O
2013 TIME
, O
how O
many UNIT
truck-related MODE
accidents UNIT
leading O
to O
a O
spillage O
in O
hazardous COMMODITY
materials COMMODITY
occurred O
in O
the O
U.S. LOCATION
? O
| O
How O
many UNIT
trucks MODE
used O
FM LINK
2222 LINK
in O
2001 TIME
? O
| O
How O
many UNIT
cargo COMMODITY
planes MODE
landed O
in O
Austin-Bergstrom LOCATION
airport LOCATION
in O
2013 TIME
? O
| O
What O
is O
the O
average UNIT

121
number UNIT
of O
freight MODE
vehicles MODE
per UNIT
day UNIT
on O
US LINK
281 LINK
between O
San LOCATION
Antonio LOCATION
and O
the O
Mexican LOCATION
Border LOCATION
? O
| O
how O
many UNIT
ports LOCATION
of LOCATION
entries LOCATION
are O
between O
Texas LOCATION
and O
Mexico LOCATION
? O
| O
how O
many UNIT
northbound UNIT
commercial MODE
trucks MODE
crossed O
the O
World LOCATION
Trade LOCATION
bridge LOCATION
in O
Laredo LOCATION
? O
| O
how O
much O
emissions UNIT
are O
produced O
by O
truck MODE
traffic UNIT
during O
the O
peak UNIT
period UNIT
compared O
to O
the O
non-peak UNIT
period UNIT
? O
| O
which O
route LINK
is O
cheapest UNIT
for O
trucks MODE
traveling O
through O
Austin LOCATION
: O
SH LINK
130 LINK
or O
IH-35 LINK
? O
| O
What O
is O
the O
truck MODE
traffic UNIT
mix O
on O
IH-10 LINK
in O
Houston LOCATION
? O
| O
What O
is O
the O
average UNIT
travel UNIT

122
time UNIT
and O
level UNIT
of UNIT
service UNIT
on O
major LINK
arterial LINK
roads LINK
during O
peak UNIT
hours UNIT
? O
| O
What O
is O
the O
number UNIT
of O
truck MODE
related O
accidents UNIT
which O
occurred O
on O
IH-35 LINK
from O
May TIME
2013 TIME
to O
June TIME
2013 TIME
? O
| O
What O
is O
the O
total UNIT
value UNIT
of O
export COMMODITY
from O
the O
Port LOCATION
of LOCATION
Houston LOCATION
for O
the O
month TIME
of O
May TIME
2013 TIME
? O
| O
What O
is O
the O
total UNIT
number UNIT
of O
oversize MODE
/ MODE
overweight MODE
vehicle UNIT
permit UNIT
fees UNIT
collected O
in O
Texas LOCATION
for O
FY TIME
2013 TIME
, O
by O
commodity COMMODITY
and O
industry INDUSTRY
? O
| O
What O
percentage UNIT
of O
accidents UNIT
involved O
OS/OW MODE
vehicles MODE
in O
2011 TIME
in O
the O
Eagle LOCATION
Fort LOCATION
shale LOCATION
area UNIT
? O
| O

123
What O
is O
the O
number UNIT
of O
parking LOCATION
facilities LOCATION
available O
on O
the O
IH-20 LINK
corridor LINK
from O
El LOCATION
Paso LOCATION
to O
DFW LOCATION
? O
| O
What O
is O
the O
number UNIT
of O
bridges LINK
along O
the O
IH-45 LINK
corridor LINK
requiring O
improvements UNIT
? O
| O
What O
are O
the O
top TIME
five UNIT
commodities COMMODITY
/ O
industries INDUSTRY
utilizing O
IH-35 LINK
as O
a O
major O
freight UNIT
corridor LINK
? O
| O
What O
are O
the O
top UNIT
3 UNIT
most O
traveled O
roadways LINK
by O
AADT UNIT
in O
Texas LOCATION
? O
| O
What O
is O
the O
total UNIT
value UNIT
of O
commodities COMMODITY
transported O
during O
the O
Christmas TIME
season TIME
on O
IH-35 LINK
from O
October TIME
2012 TIME
to O
Jan TIME
2013 TIME
? O
| O
how O
much O
freight COMMODITY
was O
moved O
in O
2011 TIME
in O
Texas LOCATION
? O

124
| O
what O
is O
the O
breakdown O
of O
freight COMMODITY
in O
2010 TIME
by O
mode MODE
? O
| O
how O
much O
freight COMMODITY
was O
moved O
by O
truck MODE
last UNIT
year TIME
? O
| O
what O
city LOCATION
moved O
the O
most O
freight COMMODITY
in O
2012 TIME
? O
| O
what O
state LOCATION
sends UNIT
/ O
receives O
the O
most O
freight COMMODITY
by O
rail MODE
? O
| O
how O
much O
coal COMMODITY
was O
moved O
to O
Texas LOCATION
in O
the O
last UNIT
5 UNIT
years TIME
? O
| O
What O
commodity COMMODITY
is O
moved O
the O
most UNIT
in O
the O
U.S. LOCATION
? O
| O
Value UNIT
of O
commodity COMMODITY
losses O
because O
of O
accidents UNIT
on O
IH-20 LINK
from O
May TIME
2013 TIME
to O
June TIME
2013 TIME
? O
| O
Percentage UNIT
of O
accidents UNIT
involving O
trucks MODE
and O
motorcycles MODE
in O

125
the O
city LOCATION
of LOCATION
Austin LOCATION
for O
the O
year TIME
2012 TIME
? O
| O
Information O
on O
distress UNIT
and O
skid UNIT
data UNIT
for O
IH-35 LINK
from O
San LOCATION
Antonio LOCATION
to O
Laredo LOCATION
in O
2012 TIME
? O
| O
Report O
on O
the O
structural UNIT
health UNIT
of O
Texas LOCATION
bridges LINK
as O
of O
May TIME
2013 TIME
? O
| O
Total UNIT
number UNIT
of O
jobs UNIT
created O
as O
a O
result O
of O
the O
construction INDUSTRY
of O
SH LINK
130 LINK
? O
| O
Information O
on O
CO2 UNIT
emissions UNIT
on O
IH-10 LINK
Katy LINK
from O
FM-1489 LINK
to O
IH-610 LINK
West LINK
Loop LINK
? O
| O
Change UNIT
in O
emission UNIT
levels UNIT
as O
a O
result O
of O
modal UNIT
shift UNIT
from O
truck MODE
to O
rail MODE
along O
the O
IH-45 LINK
corridor LINK
from O
Houston LOCATION
to O
Dallas LOCATION
? O
| O

126
Data O
on O
the O
loss UNIT
of O
vegetative UNIT
land UNIT
area UNIT
as O
a O
result O
of O
the O
shale INDUSTRY
industry INDUSTRY
in O
Dimmit LOCATION
County LOCATION
in O
2012 TIME
? O
| O
Lost O
revenue UNIT
to O
Texas LOCATION
due O
to O
jurisdiction UNIT
shopping UNIT
in O
FY TIME
2012 TIME
? O
| O
Average UNIT
travel UNIT
speed UNIT
of O
trucks MODE
compared O
to O
rail MODE
along O
IH-45 LINK
corridor LINK
from O
Houston LOCATION
to O
DFW LOCATION
? O
| O
Average UNIT
shipping UNIT
cost UNIT
of O
rail MODE
compared O
to O
trucks MODE
along O
the O
coastal LINK
corridor LINK
in O
2012 TIME
? O
| O
Average UNIT
cost UNIT
of O
transloading O
containers UNIT
from O
truck MODE
to O
rail MODE
? O
| O
Percentage UNIT
of O
trucks MODE
using O
newly O
constructed O
George LINK
Bush LINK
Expressway LINK
instead O
of O
SH-121 LINK
? O
| O
Truck MODE
traffic UNIT
mix O

127
on O
major UNIT
Texas LOCATION
roadways LINK
? O
| O
Hourly UNIT
Truck MODE
traffic UNIT
count UNIT
on O
IH-35 LINK
from O
Waco LOCATION
to O
Fort LOCATION
Worth LOCATION
? O
| O
Percentage UNIT
reduction UNIT
in O
number UNIT
of O
truck MODE
related O
accidents UNIT
at O
intersections LINK
on O
IH LINK
45 LINK
due O
to O
construction INDUSTRY
of O
an O
interchange LINK
? O
| O
Change UNIT
in O
air MODE
freight MODE
movements O
from O
Austin LOCATION
to O
Dallas LOCATION
in O
comparison UNIT
to O
trucks MODE
and O
rail MODE
? O
| O
Change UNIT
in O
VMT UNIT
by O
transporting O
freight COMMODITY
via O
rail MODE
instead O
of O
roadway LINK
/ O
waterway LINK
? O
| O
Expected O
percentage UNIT
of O
truckers MODE
willing O
to O
use O
the O
newly O
planned O
SH LINK
130 LINK
toll LINK
road LINK
extension LINK
connecting O
San LOCATION
Antonio LOCATION
with O
Waco LOCATION
? O
| O
Classification UNIT
of O

128
goods COMMODITY
transported O
from O
Austin LOCATION
to O
Dallas LOCATION
by O
mode MODE
along O
the O
IH-35 LINK
corridor LINK
? O
| O
Expected O
efficiencies UNIT
/ O
profits UNIT
/ O
costs UNIT
through O
the O
utilization O
of O
long MODE
haul MODE
vehicles MODE
and O
heavier MODE
trucks MODE
on O
major UNIT
Texas LOCATION
corridors LINK
? O
| O
Number UNIT
of O
accidents UNIT
involving O
trucks MODE
moving O
petroleum COMMODITY
products COMMODITY
on O
IH-35 LINK
in O
FY TIME
2012 TIME
? O
| O
County LOCATION
with O
lowest UNIT
number UNIT
of O
hazmat COMMODITY
related O
accidents UNIT
for O
FY TIME
2011 TIME
? O
| O
Safest UNIT
mode MODE
of O
transportation MODE
for O
NAFTA COMMODITY
products COMMODITY
( O
import COMMODITY
/ O
export COMMODITY
) O
through O
Texas LOCATION
? O
| O
Disparity UNIT
in O
transportation UNIT
funding UNIT
of O
freight UNIT
related UNIT
projects UNIT
for O
low UNIT
income UNIT
areas UNIT
in O
comparison UNIT
to O
high UNIT

129
income UNIT
areas UNIT
in O
FY TIME
2012 TIME
e.g. O
intersection UNIT
improvements UNIT
, O
noise UNIT
barriers UNIT
, O
etc. O
? O
| O
Accessibility UNIT
of O
low-income UNIT
households UNIT
to O
warehousing INDUSTRY
and O
manufacturing INDUSTRY
facilities INDUSTRY
? O
| O
Change UNIT
in O
travel UNIT
speed UNIT
and O
time TIME
along O
rail MODE
corridors LINK
in O
Houston LOCATION
should O
there O
be O
no O
encroachment UNIT
? O
| O
Number UNIT
of O
intersections UNIT
on O
a O
major UNIT
arterial LINK
roadway LINK
requiring O
improvement UNIT
to O
turning UNIT
radii UNIT
? O
| O
I O
know O
70% PERCENTAGE
of O
US LOCATION
/ O
MX LOCATION
trade UNIT
is O
done O
by O
truck MODE
? O
What O
percentage UNIT
of O
those O
come O
thru O
Texas LOCATION
? O
| O
in O
2013 TIME
, O
how O
much O O
lemons COMMODITY
were O
moved O
in O
texas LOCATION
| O
in O
2013 TIME
, TIME
how O

130
much O
oil COMMODITY
were O
moved O
in O
texas LOCATION
? O
| O
how O
many UNIT
lbs UNIT
of O
cheese COMMODITY
were O
moved O
through O
I-10 LINK
last UNIT
year TIME
? O
| O
Who O
pays O
for O
freight UNIT
| O
What O
percentage UNIT
of O
the O
network LINK
is O
comprised O
by O
rail MODE
? O
| O
How O
many UNIT
ports LOCATION
can O
handle O
post MODE
panamax MODE
ships MODE
? O
| O
Freight COMMODITY
data O
that O
is O
publically O
available O
, O
is O
it O
useful O
? O
| O
How O
many UNIT
ports LOCATION
are O
there O
in O
Texas LOCATION
? O
| O
Should O
federal ORGANIZATION
funding UNIT
pay O
for O
freight UNIT
? O
| O
What O
percentage UNIT
does O
freight INDUSTRY
jobs INDUSTRY
contribute O
to O
the O
US LOCATION
economy UNIT
? O
| O
Should O
freight UNIT
be O
managed O
by O
DOTs ORGANIZATION
? O
| O
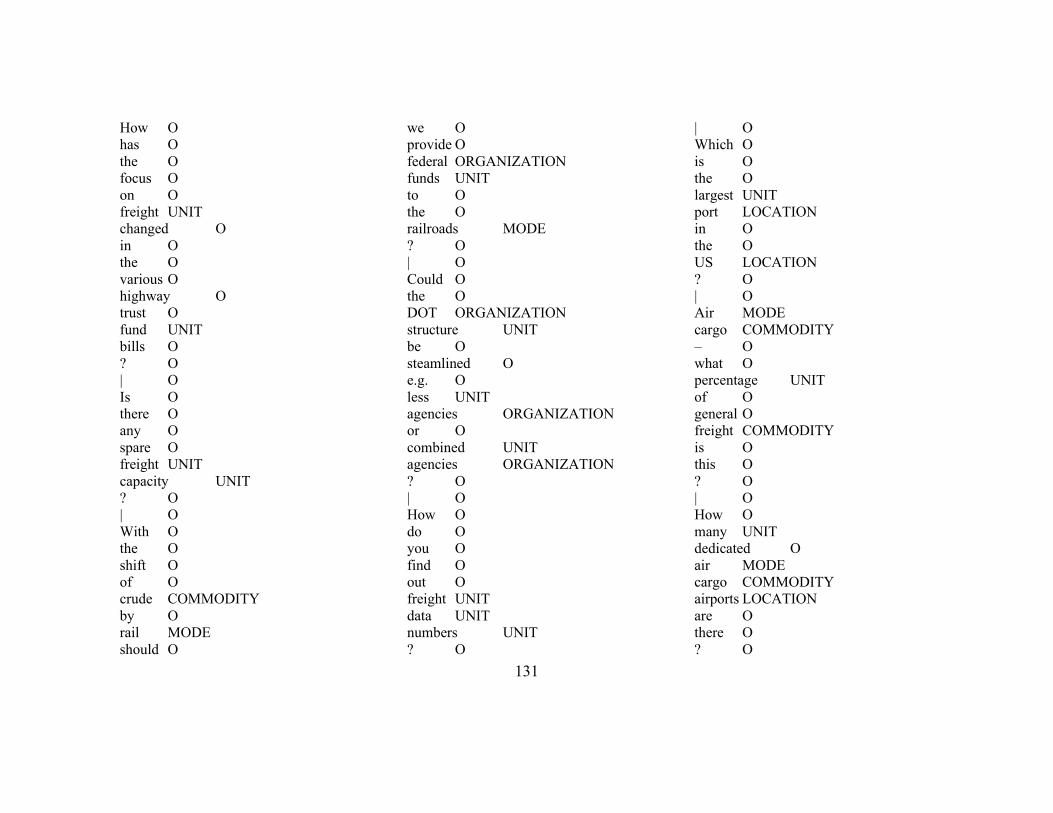
131
How O
has O
the O
focus O
on O
freight UNIT
changed O
in O
the O
various O
highway O
trust O
fund UNIT
bills O
? O
| O
Is O
there O
any O
spare O
freight UNIT
capacity UNIT
? O
| O
With O
the O
shift O
of O
crude COMMODITY
by O
rail MODE
should O
we O
provide O
federal ORGANIZATION
funds UNIT
to O
the O
railroads MODE
? O
| O
Could O
the O
DOT ORGANIZATION
structure UNIT
be O
steamlined O
e.g. O
less UNIT
agencies ORGANIZATION
or O
combined UNIT
agencies ORGANIZATION
? O
| O
How O
do O
you O
find O
out O
freight UNIT
data UNIT
numbers UNIT
? O
| O
Which O
is O
the O
largest UNIT
port LOCATION
in O
the O
US LOCATION
? O
| O
Air MODE
cargo COMMODITY
– O
what O
percentage UNIT
of O
general O
freight COMMODITY
is O
this O
? O
| O
How O
many UNIT
dedicated O
air MODE
cargo COMMODITY
airports LOCATION
are O
there O
? O
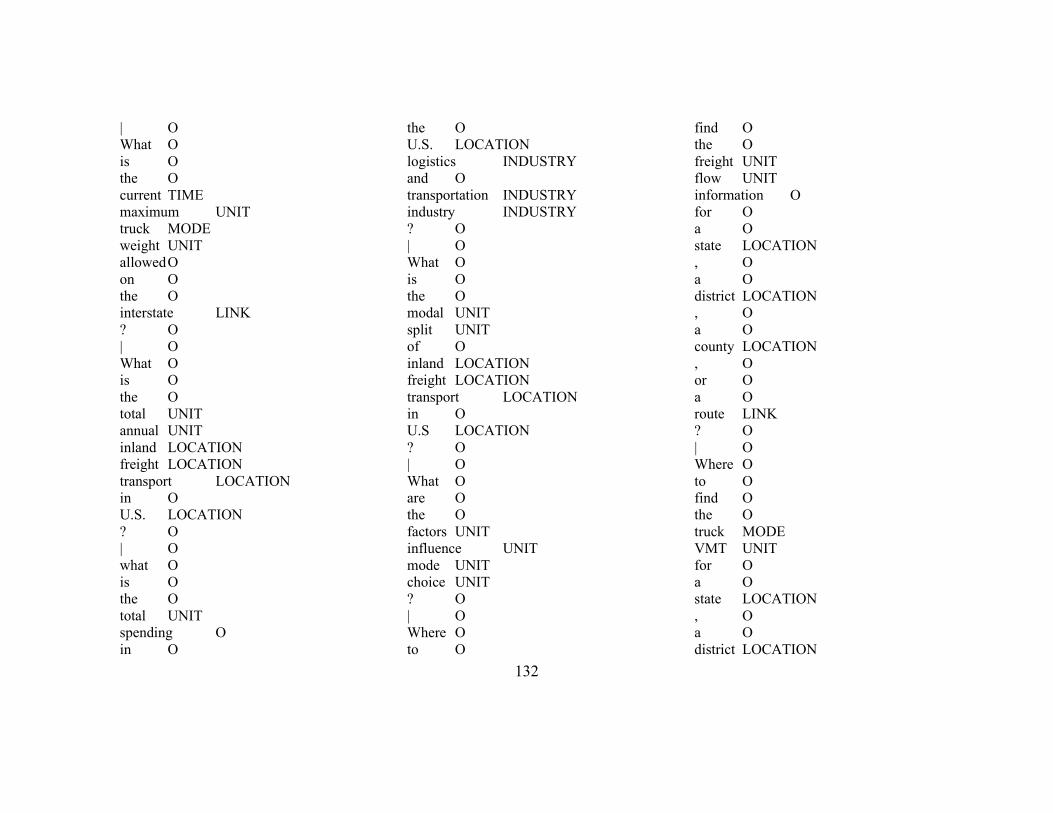
132
| O
What O
is O
the O
current TIME
maximum UNIT
truck MODE
weight UNIT
allowed O
on O
the O
interstate LINK
? O
| O
What O
is O
the O
total UNIT
annual UNIT
inland LOCATION
freight LOCATION
transport LOCATION
in O
U.S. LOCATION
? O
| O
what O
is O
the O
total UNIT
spending O
in O
the O
U.S. LOCATION
logistics INDUSTRY
and O
transportation INDUSTRY
industry INDUSTRY
? O
| O
What O
is O
the O
modal UNIT
split UNIT
of O
inland LOCATION
freight LOCATION
transport LOCATION
in O
U.S LOCATION
? O
| O
What O
are O
the O
factors UNIT
influence UNIT
mode UNIT
choice UNIT
? O
| O
Where O
to O
find O
the O
freight UNIT
flow UNIT
information O
for O
a O
state LOCATION
, O
a O
district LOCATION
, O
a O
county LOCATION
, O
or O
a O
route LINK
? O
| O
Where O
to O
find O
the O
truck MODE
VMT UNIT
for O
a O
state LOCATION
, O
a O
district LOCATION

133
, O
a O
county LOCATION
, O
or O
a O
route LINK
? O
| O
Who O
are O
the O
major UNIT
commercial MODE
vehicle MODE
carriers INDUSTRY
? O
| O
What O
is O
the O
difference O
between O
modeling O
freight MODE
transport MODE
V.S. O
other UNIT
types MODE
of O
transportation MODE
? O
| O
Where O
to O
find O
information O
regarding O
import UNIT
and O
export UNIT
goods COMMODITY
? O
| O
What O
is O
typical O
crash UNIT
rates UNIT
for O
freight UNIT
movement UNIT
by O
severity UNIT
level UNIT
for O
both O
U.S. LOCATION
and O
Texas LOCATION
? O
| O
How O
many UNIT
freight MODE
trains MODE
travel UNIT
from O
Los LOCATION
Angeles LOCATION
to O
Chicago LOCATION
per UNIT
day UNIT
, O
on O
average UNIT
? O
| O
What O
is O
the O
commodity UNIT
flow UNIT
for O
space-related COMMODITY
commodities COMMODITY
( O
e.g. O
, O
rocket COMMODITY
fuel COMMODITY
, O
rockets COMMODITY
, O
cargo COMMODITY

134
, O
satellites COMMODITY
, O
etc O
) O
? O
| O
In O
US LOCATION
, O
what O
highway LINK
routes LINK
are O
cattle COMMODITY
shipped O
on O
? O
| O
How O
has O
the O
amount UNIT
of O
corn COMMODITY
shipped O
out O
by O
truck MODE
and O
rail MODE
from O
Iowa LOCATION
changed O
in O
the O
past UNIT
ten TIME
years UNIT
? O
| O
Where UNIT
are O
Amazon INDUSTRY
shipping INDUSTRY
facilities INDUSTRY
? O
| O
What O
are O
the O
freight UNIT
mobility UNIT
concerns UNIT
of O
travel UNIT
between O
Mexico LOCATION
and O
the O
US LOCATION
? O
| O
In O
your O
opinion O
, O
what O
technology INDUSTRY
will O
be O
have O
the O
greatest UNIT
impact UNIT
on O
the O
freight INDUSTRY
industry INDUSTRY
? O
| O
With O
the O
expansion UNIT
of O
the O
Panama LOCATION
Canal LOCATION
, O
what O
mode MODE
of O
freight MODE
will O
see O
the O

135
greatest UNIT
change UNIT
within O
the O
US LOCATION
? O
| O
Describe O
the O
current UNIT
situation UNIT
of O
OS MODE
/ MODE
OW MODE
vehicles MODE
both O
locally UNIT
( O
Texas LOCATION
) O
and O
nationally LOCATION
? O
| O
If O
$500 MONETORY
million MONETORY
was O
available O
for O
freight LINK
infrastructure LINK
nationally LOCATION
, O
where O
and O
how O
would O
you O
suggest O
the O
money MONETORY
be O
spent O
? O
| O

136
APPENDIX C - FREIGHT DATA ONTOLOGY SAMPLES
The ontologies are available for download at http://unityfreight.com/ontology/FreightData/
To visualize, please upload to http://owlgred.lumii.lv/online_visualization

137
APPENDIX D - PYTHON SOURCE CODE SAMPLES

141

142

143

144

145
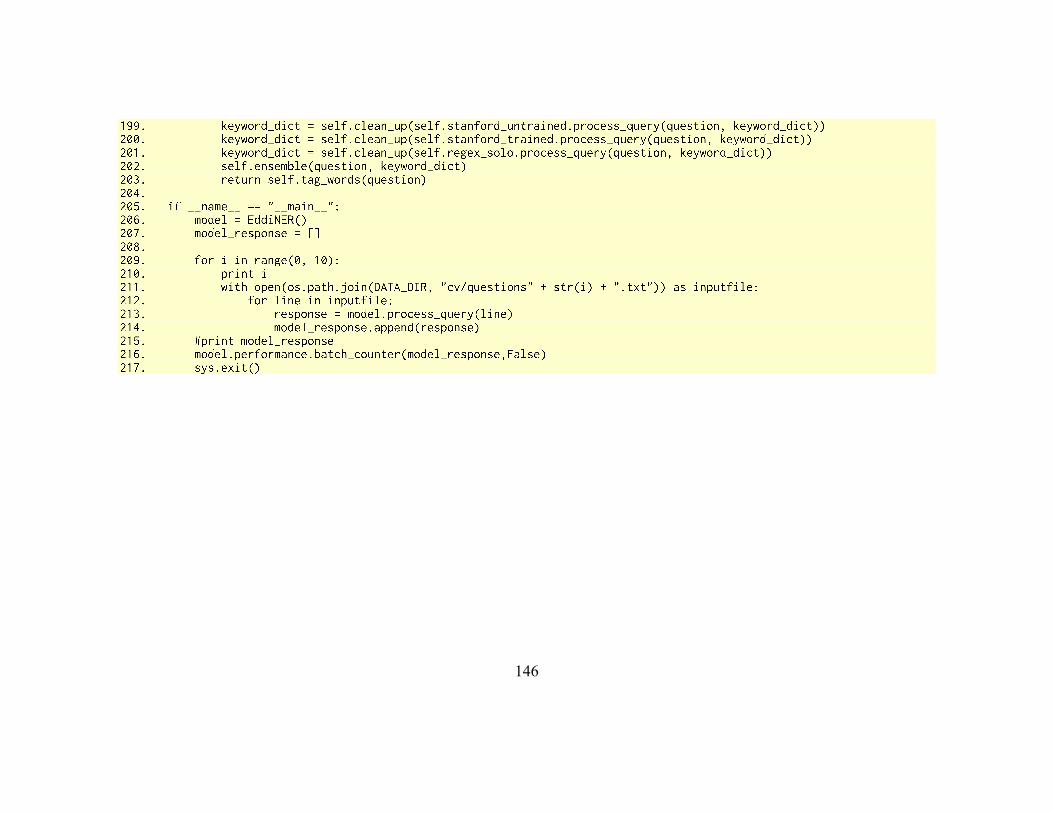
146

147

148
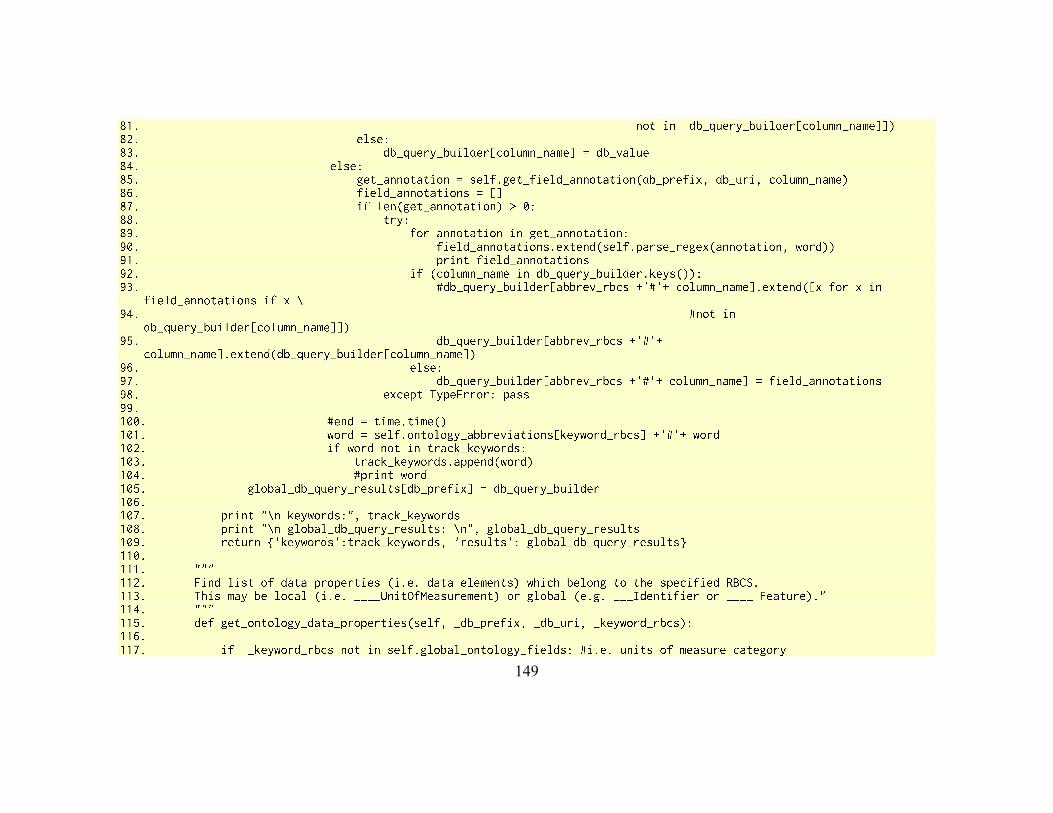
149

150

151

152

153

154

155
REFERENCES
Ambite, José Luis, Genevieve Giuliano, Peter Gordon, Stefan Decker, Andreas Harth,
Karanbir Jassar, Qisheng Pan, and LanLan Wang. "Argos: An ontology and web
service composition infrastructure for goods movement analysis." In Proceedings
of the 2004 annual national conference on Digital government research, p. 5.
Digital Government Society of North America, 2004.
Apple, Siri, Accessed March 2014 at http://www.apple.com/ios/siri/.
Asahara, M., and Matsumoto, Y. (2003). “Japanese named entity extraction with
redundant morphological analysis.” Proceedings of the 2003 Conference of the
North American Chapter of the Association for Computational Linguistics on
Human Language Technology-Volume 1, Association for Computational
Linguistics, 8–15.
Bacastow, T., and Turton, I. (2014). “Evaluating NER engines | GEOG 889: Virtual Field
Experience for the Geospatial Intelligence Professional.” <https://www.e-
education.psu.edu/geog889/l4_p5.html> (Oct. 10, 2014).
Barbara J. Grosz. 1983. TEAM: A transportable natural language interface system. In
Proceedings of the Conference on Applied Natural Language Processing held at
Santa Monica, California on 1-3 February 1983, ed. Association for
Computational Linguistics, 39-45. Morristown, N.J.: Association for
Computational Linguistics.
Bartolini, Roberto, Caterina Caracciolo, E. Giovannetti, Alessandro Lenci, Simone
Marchi, Vito Pirrelli, Chiara Renso, and Laura Spinsanti. "Creation and use of
lexicons and ontologies for NL interfaces to databases." In LREC Conference,
Genova. 2006.
Bauereiss, Thomas; Thomas Cane, Alex Oberhauser, Andreas Thalhammer, and Audun
Vennesland, “e-Freight Ontology”, March 2014.
Bendriss, Sabri, A. Benabdelhafid, and J. Boukachour. "Information system for freight
traceability management in a multimodal transportation context." In Computer
Systems and Applications, 2009. AICCSA 2009. IEEE/ACS International
Conference on, pp. 869-873. IEEE, 2009.
Bickel, P. J., Ritov, Y., and Ryden, T. (1998). “Asymptotic normality of the maximum-
likelihood estimator for general hidden Markov models.” The Annals of Statistics,
26(4), 1614–1635.
Bird, Steven, Ewan Klein, and Edward Loper. “Natural Language Processing with
Python.” O'Reilly Media, Inc., 2009.

156
Boldyrev, A., Weikum, G., and Theobald, M. (2013). “Dictionary-Based Named Entity
Recognition.”
Borthwick, Andrew. “A Maximum Entropy Approach to Named Entity Recognition.”
PhD diss., New York University, 1999.
Brin, S. (1999). “Extracting patterns and relations from the world wide web.” The World
Wide Web and Databases, Springer, 172–183.
Buccella, Agustina, Alejandra Cechich, and Nieves Rodríguez Brisaboa. “An Ontology
Approach to Data Integration.” Journal of Computer Science & Technology 3
(2003).
Bunescu, R., Ge, R., Kate, R. J., Marcotte, E. M., Mooney, R. J., Ramani, A. K., and
Wong, Y. W. (2005). “Comparative experiments on learning information
extractors for proteins and their interactions.” Artificial intelligence in medicine,
33(2), 139–155.
Bureau of Transportation Statistics. “2007 Commodity Flow Survey Standard
Classification of Transported Goods.”
<https://www.census.gov/svsd/www/cfsdat/cfs071200.pdf> (2006). (Oct. 16,
2014).
Bureau of Transportation Statistics. “Border Crossing/Entry Data | Bureau of
Transportation Statistics.”
http://www.rita.dot.gov/bts/help_with_data/border_crossing_entry_data.html
(Oct. 14, 2014b).
Bureau of Transportation Statistics. “Commodity Flow Survey (CFS) | Bureau of
Transportation Statistics.”
<http://www.rita.dot.gov/bts/help_with_data/commodity_flow_survey.html>
(Oct. 14, 2014a).
Bureau of Transportation Statistics. “North American Transborder Freight Data.”
<http://transborder.bts.gov/programs/international/transborder/TBDR_QA.html>
(Oct. 14, 2014c).
Buscaldi, D., and Rosso, P. (2008). “A conceptual density based approach for the
disambiguation of toponyms.” International Journal of Geographical Information
Science, 22(3), 301–313.
Calì, Davide, Antonio Condorelli, Santo Papa, Marius Rata, and Luca Zagarella.
"Improving intelligence through use of Natural Language Processing. A
comparison between NLP interfaces and traditional visual GIS interfaces".
Procedia Computer Science 5 (2011): 920-925.
Cambridge Systematics et al. “Freight Data Sharing Guidebook”. Vol. 25. Transportation
Research Board, 2013.

157
Cambridge Systematics. Forecasting Statewide Freight Toolkit. National Cooperative
Highway Research Program of the Transportation Research Board, Vol. 606,
2008
Chinchor, N. MUC-7 Scoring Methodology. In Proceedings of the Seventh Message
Understanding Conference (MUC-7) (April 1998) in (Borthwick, 1999).
Chiticariu, L., Krishnamurthy, R., Li, Y., Reiss, F., and Vaithyanathan, S. (2010).
“Domain adaptation of rule-based annotators for named-entity recognition tasks.”
Proceedings of the 2010 Conference on Empirical Methods in Natural Language
Processing, Association for Computational Linguistics, 1002–1012.
Choubassi C., Seedah D., Leite F., and Walton C. M. (2014) “A Formal Approach To
Identifying Freight Data Gaps Using Ontologies”, Transportation Research
Record: Journal of the Transportation Research Board. Accepted for Presentation
at the 94th Transportation Research Board Annual Meeting, January 11-15, 2015
Chow, Joseph YJ, Choon Heon Yang, and Amelia C. Regan. "State-of-the art of freight
forecast modeling: lessons learned and the road ahead." Transportation 37, no. 6
(2010): 1011-1030.
Chowdhury, Gobinda G. “Natural language processing.” Annual review of information
science and technology 37, no. 1 (2003): 51-89.
Cohen, W. W., and Sarawagi, S. (2004). “Exploiting dictionaries in named entity
extraction: combining semi-markov extraction processes and data integration
methods.” Proceedings of the tenth ACM SIGKDD international conference on
Knowledge discovery and data mining, ACM, 89–98.
Commodity Flow Survey Conference. Transportation Research Board Circular E-C088,
Transportation Research Board, Issue 0097-5815, (2006).
Cui, Z., and O’Brien, P. “Domain ontology management environment.” System Sciences,
2000. Proceedings of the 33rd Annual Hawaii International Conference on,
IEEE, 9 pp. vol. 1. IEEE 2000.
Date, C. J., and Darwen, H. (1987). A Guide to the SQL Standard. Addison-Wesley New
York.
De Jong, Gerard, and Moshe Ben-Akiva. "A micro-simulation model of shipment size
and transport chain choice." Transportation Research Part B: Methodological 41,
no. 9 (2007): 950-965.
El-Diraby, Tamer E. "Domain Ontology for Construction Knowledge." Journal of
Construction Engineering and Management 139, no. 7 (2012): 768-784.
El-Diraby, Tamer E., and K. F. Kashif. "Distributed ontology architecture for knowledge
management in highway construction." Journal of Construction Engineering and
Management 131, no. 5 (2005): 591-603.

158
El-Gohary, Nora M., and Tamer E. El-Diraby. "Domain ontology for processes in
infrastructure and construction." Journal of Construction Engineering and
Management 136, no. 7 (2010): 730-744.
El-Gohary, Nora M., and Tamer E. El-Diraby. "Merging architectural, engineering, and
construction ontologies." Journal of Computing in Civil Engineering 25, no. 2
(2009): 109-128.
Federal Geographic Data Committee, “Geographic Information Framework Data
Standard”. Accessed March 2014 at
http://www.fgdc.gov/standards/projects/FGDC-standards-projects/framework-
data-standard/framework-data-standard
Federal Highway Administration, “Significant Freight Provisions”, MAP-21 - Moving
Ahead for Progress in the 21st Century, 2013
Federal Highway Administration. “Freight Analysis Framework.”
<http://www.ops.fhwa.dot.gov/freight/freight_analysis/faf/> (Oct. 14, 2014).
Feldman, R., and Rosenfeld, B. (2006). “Boosting unsupervised relation extraction by
using NER.” Proceedings of the 2006 Conference on Empirical Methods in
Natural Language Processing, Association for Computational Linguistics, 473–
481.
Figliozzi, Miguel, and Kristin A. Tufte. 2009. “Prototype for Freight Data Integration and
Visualization Using Online Mapping Software: Issues, Applications, and
Implications for Data Collection Procedures.” In Transportation Research Board
88th Annual Meeting.
Finkel, J. R., Grenager, T., and Manning, C. (2005). “Incorporating non-local information
into information extraction systems by gibbs sampling.” Proceedings of the 43rd
Annual Meeting on Association for Computational Linguistics, Association for
Computational Linguistics, 363–370.
Florian, R., Ittycheriah, A., Jing, H., and Zhang, T. (2003). “Named entity recognition
through classifier combination.” Proceedings of the seventh conference on
Natural language learning at HLT-NAACL 2003-Volume 4, Association for
Computational Linguistics, 168–171.
Fresko, M., Rosenfeld, B., and Feldman, R. (2005). “A hybrid approach to NER by
MEMM and manual rules.” Proceedings of the 14th ACM international
conference on Information and knowledge management, ACM, 361–362.
Gao, Lu and Hui Wu. “Verb-Based Text Mining of Road Crash Report.” Transportation
Research Board 92nd Annual Meeting Compendium of Papers (2013).
Goldstein, A., Kolman, P., and Zheng, J. (2005). Minimum common string partition
problem: Hardness and approximations. Springer.

159
Google Scholar, “Natural Language Processing,” Accessed March 2014 at
http://scholar.google.com/scholar?q=natural+language+processing.
Google, “Natural Language Processing,” Google Research Areas and Publications,
Accessed March 2014 at
http://research.google.com/pubs/NaturalLanguageProcessing.html.
Google. (2014). “Natural Language Processing.”
<http://scholar.google.com/scholar?q=natural+language+processing> (Oct. 10,
2014).
Grosz, Barbara J. TEAM: A transportable natural language interface system. In
Proceedings of the Conference on Applied Natural Language Processing held at
Santa Monica, California on 1-3 February 1983, ed. Association for
Computational Linguistics, 39-45. Morristown, N.J.: Association for
Computational Linguistics.
Gruber, T. R. A translation approach to portable ontologies. Knowledge Acquisition,
5(2):199-220, 1993.
Hadden, S. G., and Feinstein, J. L. (1989). “Symposium: Expert systems. Introduction to
expert systems.” Journal of Policy Analysis and Management, 8(2), 182–187.
Hall, David L., and James Llinas. "An introduction to multisensor data fusion."
Proceedings of the IEEE 85, no. 1 (1997): 6-23.
Harrison, Rob et al. 2010 Emerging Trade Corridors and Texas Transportation Planning.
University of Texas at Austin, Center for Transportation Research, 2010.
Hirschman, L., Colosimo, M., Morgan, A., and Yeh, A. (2005). “Overview of
BioCreAtIvE task 1B: normalized gene lists.” BMC bioinformatics, 6(Suppl 1),
S11.
Horridge, M., Knublauch, H., Rector, A., Stevens, R., and Wroe, C. (2004). “A practical
guide to building OWL ontologies using the Protégé-OWL plugin and CO-ODE
Tools Edition 1.0.” University of Manchester.
Integrated Definition Methods (IDEF), “IDEF0 Function Modeling Method,” Accessed
March 2014 at http://www.idef.com/idef0.htm.
ISO, “ISO 14825:2011 - Intelligent Transport Systems Geographic Data Files (GDF
5.0)”,
Jacob Perkins, 2010. Python NLTK Demos for Natural Language Text Processing,
http://text-processing.com/demo/tag/ Accessed May 2014.
Jenny Rose Finkel, Trond Grenager, and Christopher Manning. 2005. Incorporating Non-
local Information into Information Extraction Systems by Gibbs Sampling.
Proceedings of the 43nd Annual Meeting of the Association for Computational
Linguistics (ACL 2005), pp. 363-370.

160
Kangari, R. “Construction Database Management by Natural Language.” Transportation
Research Record 1126 (1987).
Klinger, R., and Friedrich, C. M. (2009). “User’s Choice of Precision and Recall in
Named Entity Recognition.” RANLP, 192–196.
Klyne, G., Carroll, J. J., and McBride, B. (2014). “RDF 1.1 Concepts and Abstract
Syntax.” <http://www.w3.org/TR/rdf11-concepts/> (Oct. 11, 2014).
Kohavi, R. (1995). “A study of cross-validation and bootstrap for accuracy estimation
and model selection.” IJCAI, 1137–1145.
Kou, Z., Cohen, W. W., and Murphy, R. F. (2005). “High-recall protein entity
recognition using a dictionary.” Bioinformatics, 21(suppl 1), i266–i273.
Krishnan, V., and Ganapathy, V. (2005). “Named Entity Recognition.”
Lafferty, J., McCallum, A., and Pereira, F. C. (2001). “Conditional random fields:
Probabilistic models for segmenting and labeling sequence data.”
LandXML.org, LandXML. Accessed March 2014 at http://www.landxmlproject.org/
Lathia, Neal, Licia Capra, Daniele Magliocchetti, Federico De Vigili, Giuseppe Conti,
Raffaele De Amicis, Theo Arentze, Jianwei Zhang, Davide Calì, and Vlad Alexa.
“Personalizing Mobile Travel Information Services.” Procedia-Social and
Behavioral Sciences 48 (2012): 1195-1204.
Levenshtein, V. I. (1966). “Binary codes capable of correcting deletions, insertions and
reversals.” Soviet physics doklady, 707.
Li, H., Srihari, R. K., Niu, C., and Li, W. (2003). “InfoXtract location normalization: a
hybrid approach to geographic references in information extraction.” Proceedings
of the HLT-NAACL 2003 workshop on Analysis of geographic references-Volume
1, Association for Computational Linguistics, 39–44.
Li, John. “DAML Transpotation.owl - submitted 08/19/2003”. DARPA DAML Program.
Accessed March 2014 at http://www.daml.org/ontologies/409
Liddy, E. D. (2001). “Natural language processing.”
Lima, Celson, Tamer El Diraby, Bruno Fies, Alain Zarli, and Elaine Ferneley. "The e-
COGNOS project: current status and future directions of an ontology-enabled IT
solution infrastructure supporting Knowledge Management in Construction." In
Winds of change: integration and innovation of construction. Construction
research congress. 2003.
Liu, H., Hu, Z.-Z., Torii, M., Wu, C., and Friedman, C. (2006). “Quantitative assessment
of dictionary-based protein named entity tagging.” Journal of the American
Medical Informatics Association, 13(5), 497–507.
Liu, Xuesong, Burcu Akinci, Mario Bergés, and James H. Garrett Jr. “Domain-Specific
Querying Formalisms for Retrieving Information about HVAC Systems.” Journal
of Computing in Civil Engineering 28, no. 1 (2013): 40-49.

161
Lovins, Julie B. Development of a stemming algorithm. MIT Information Processing
Group, Electronic Systems Laboratory, 1968.
Mani, Akshay, and Jolanda Prozzi. State-of-the-practice in freight data: a review of
available freight data in the US. No. 0-4713-P2. Center for Transportation
Research, the University of Texas at Austin, 2004.
Manning, C. (2012). “Information Extraction and Named Entity Recognition.”
<https://web.stanford.edu/class/cs124/lec/Information_Extraction_and_Named_E
ntity_Recognition.pdf> (Oct. 10, 2014).
Mansouri, A., Affendey, L. S., and Mamat, A. (2008). “Named entity recognition
approaches.” International Journal of Computer Science and Network Security,
8(2), 339–344.
Marcus, M. P., Marcinkiewicz, M. A., and Santorini, B. (1993). “Building a large
annotated corpus of English: The Penn Treebank.” Computational linguistics,
19(2), 313–330.
Microsoft Corporation, “Windows Phone 8.1,” Accessed July 2014 at
http://www.windowsphone.com/en-us/features-8-1.
Microsoft. (2014). “Bing Maps REST Services.” <http://msdn.microsoft.com/en-
us/library/ff701713.aspx> (Oct. 25, 2014).
Nadeau, D., and Sekine, S. (2007). “A survey of named entity recognition and
classification.” Lingvisticae Investigationes, 30(1), 3–26.
National Institute of Standards and Technology (NIST), “Federal Information Processing
Standards Publication 183, Computer System Laboratory,” National Institute of
Standards and Technology (1993).
National Research Council (US). Committee on Freight Transportation Data, and a
Framework for Development. A concept for a national freight data program. No.
276. Transportation Research Board, 2003.
Negnevitsky, M. (2005). Artificial intelligence: a guide to intelligent systems. Pearson
Education.
Nihalani, Neelu, Sanjay Silakari, and Mahesh Motwani. "Natural language Interface for
Database: A Brief review." International Journal of Computer Science Issues
(IJCSI) 8, no. 2 (2011).
Noy, Natalya F. "Semantic integration: a survey of ontology-based approaches." ACM
Sigmod Record 33, no. 4 (2004): 65-70.
Noy, Natalya F., and Deborah L. McGuinness. "Ontology development 101: A guide to
creating your first ontology." (2001).
Oudah, M., and Shaalan, K. F. (2012). “A Pipeline Arabic Named Entity Recognition
using a Hybrid Approach.” COLING, 2159–2176.

162
Overell, S., Magalhaes, J., and Rüger, S. (2006). “Place disambiguation with co-
occurrence models.”
Pereira, Francisco C., Filipe Rodrigues, and Moshe Ben-Akiva. "Text analysis in incident
duration prediction." Transportation Research Part C: Emerging Technologies 37
(2013): 177-192.
Perkins, Jacob 2010. Python NLTK Demos for Natural Language Text Processing,
http://text-processing.com/demo/tag/ Accessed May 2014.
Polikoff, I. (2014). “Comparing SPARQL with SQL » TopQuadrant, Inc.”
<http://www.topquadrant.com/2014/05/05/comparing-sparql-with-sql/> (Oct. 11,
2014).
PostgreSQL. (2014). “PostgreSQL: Documentation: 9.3: fuzzystrmatch.”
<http://www.postgresql.org/docs/9.1/static/fuzzystrmatch.html> (Oct. 18, 2014).
Pradhan, Anu R., An Approach To Fuse Data From Multiple Sources To Support
Construction Productivity Monitoring, PhD Thesis, Carnegie Mellon University,
Pittsburgh, PA, 2009.
Pradhan, Anu, Burcu Akinci, and Carl T. Haas. Formalisms for Query Capture and Data
Source Identification to Support Data Fusion for Construction Productivity
Monitoring, Automation in Construction, Vol 20, Issue 4, pp 389-98 (2011).
Prozzi, Jolanda, Dan Seedah, Migdalia Carrion, Ken Perrine, Nathan Hutson, Chandra
Bhat, and C. Michael Walton. Freight Planning for Texas—Expanding the
Dialogue. No. FHWA/TX-11/0-6297-1. 2011.
Prud’hommeaux, E., and Seaborne, A. (2013). “SPARQL Query Language for RDF.”
<http://www.w3.org/TR/rdf-sparql-query/> (Oct. 11, 2014).
Python Software Foundation, “Python.” Retrieved 1 July 2014 at http://www.python.org
Raghavan, H., and Allan, J. (2004). “Using soundex codes for indexing names in ASR
documents.” Proceedings of the Workshop on Interdisciplinary Approaches to
Speech Indexing and Retrieval at HLT-NAACL 2004, Association for
Computational Linguistics, 22–27.
RailInc. (2012). “Standard Transportation Commodity Code - Railinc.”
<https://www.railinc.com/rportal/standard-transportation-commodity-code> (Oct.
16, 2014).
Robin. (2010). “Rule Based Expert Systems.”
<http://intelligence.worldofcomputing.net/expert-systems-articles/rule-based-
expert-systems.html#> (Oct. 17, 2014).
Rocktäschel, T., Weidlich, M., and Leser, U. (2012). “ChemSpot: a hybrid system for
chemical named entity recognition.” Bioinformatics, 28(12), 1633–1640.
Safranm, N. (2013). “The Future Is Not Google Glass, It’s Natural Language
Processing.” Conductor Blog, <http://www.conductor.com/blog/2013/12/the-

163
future-of-search-is-not-google-glass-but-natural-language-processing/> (Oct. 10,
2014).
Seedah, D, Cruz A., O’Brien W, and Walton. C.M. (2014a). Integration of Data Sources
to Optimize Freight Transportation in Texas. Awaiting Publication.
Seedah, D., Sankaran B., and O’Brien W. (2014b). “An Approach to Classifying Freight
Data Elements Across Multiple Data Sources”, Transportation Research Record:
Journal of the Transportation Research Board. Accepted for Presentation at the
94th Transportation Research Board Annual Meeting, January 11-15, 2015
Sekine, S., Grishman, R., and Shinnou, H. (1998). “A decision tree method for finding
and classifying names in Japanese texts.” Proceedings of the Sixth Workshop on
Very Large Corpora.
Semantics. Merriam-Webster Online. An Encyclopedia Britannica Company,
http://www.merriam-webster.com/dictionary/semantics (accessed: March, 2014).
Shende, A., Agrawal, A. J., and Kakde, O. G. (2012). “Domain Specific Named Entity
Recognition Using Supervised Approach.” International Journal of
Computational Linguistics (IJCL), 3(1), 67–78.
Smith, D. A., and Crane, G. (2001). “Disambiguating geographic names in a historical
digital library.” Research and Advanced Technology for Digital Libraries,
Springer, 127–136.
Srihari, R., Niu, C., and Li, W. (2000). “A hybrid approach for named entity and sub-type
tagging.” Proceedings of the sixth conference on Applied natural language
processing, Association for Computational Linguistics, 247–254.
Srivastava, S., Sanglikar, M., and Kothari, D. C. (2011). “Named entity recognition
system for Hindi language: a hybrid approach.” International Journal of
Computational Linguistics (IJCL), 2(1).
Stanford CoreNLP Tools, "The Stanford Natural Language Processing Group." Accessed
March 2014 at http://nlp.stanford.edu/software/index.shtml
Surface Transportation Board, “Reference Guide for the 2012 Surface Transportation
Board Carload Waybill Sample – STCC Headers.” Retrieved May 2014.
Surface Transportation Board, “Reference Guide for the 2012 Surface Transportation
Board Carload Waybill Sample – STCC Headers.” Retrieved May 2014.
Tanabe, L., Xie, N., Thom, L. H., Matten, W., and Wilbur, W. J. (2005). “GENETAG: a
tagged corpus for gene/protein named entity recognition.” BMC bioinformatics,
6(Suppl 1), S3.
Tauberer, Joshua. "Quick Intro to RDF." RDF about.com. Modified (2005).

164
Tavasszy, Lóránt A., Kees Ruijgrok, and Igor Davydenko. "Incorporating logistics in
freight transport demand models: state-of-the-art and research opportunities."
Transport Reviews 32, no. 2 (2012): 203-219.
Thielen, C. (1995). “An approach to proper name tagging for german.” arXiv preprint
cmp-lg/9506024.
Thompson, K. (1968). Programming techniques: Regular expression search algorithm.
Communications of the ACM, 11(6), 419-422.
Tierney, Patrick. "A qualitative analysis framework using natural language processing
and graph theory." The International Review of Research in Open and Distance
Learning 13, no. 5 (2012): 173-189.
Tok, Andre YC, Miyuan Zhao, Joseph YJ Chow, Stephen Ritchie, and Dmitri Arkhipov.
“Online data repository for statewide freight planning and analysis.”
Transportation Research Record: Journal of the Transportation Research Board
2246, no. 1 (2011): 121-129.
Trip Generation: An ITE Informational Report, 8th ed. ITE, 2008.
Tsuruoka, Y., and Tsujii, J. (2003). “Boosting precision and recall of dictionary-based
protein name recognition.” Proceedings of the ACL 2003 workshop on Natural
language processing in biomedicine-Volume 13, Association for Computational
Linguistics, 41–48.
U.S. Department of Transportation, Fatality Analysis Reporting System (FARS), National
Highway Traffic Safety Administration, 2013
U.S. Department of Transportation, Highway Performance Monitoring System Field
Manual, Federal Highway Administration, 2012
United Nations. (2006). “Standard International Trade Classification - Global Inventory
of Statistical Standards.” <http://unstats.un.org/unsd/iiss/Standard-International-
Trade-Classification.ashx> (Oct. 16, 2014).
United States Census Bureau. Annual Estimates of the Resident Population for
Incorporated Places over 50,000, Ranked by July 1, 2013 Population: April 1,
2010 to July 1, 2013 (CSV). 2013 Population Estimates, Population Division.
May 2013. Retrieved May 22, 2014.
US Census Bureau. (2014a). “Foreign trade - Schedule B.”
<http://www.census.gov/foreign-trade/schedules/b/> (Oct. 16, 2014).
US Census Bureau. (2014b). “US International Trade Data - Foreign Trade.”
<http://www.census.gov/foreign-trade/data/> (Oct. 27, 2014).
US International Trade Commission. (2014). “Harmonized Tariff Schedule of the United
States.” <http://hts.usitc.gov/> (Oct. 16, 2014).

165
Uschold, Michael, and Michael Gruninger. "Ontologies and semantics for seamless
connectivity." ACM SIGMod Record 33, no. 4 (2004): 58-64.
van Oosterom, Peter, and Sisi Zlatanova, eds. Creating Spatial Information
Infrastructures: Towards the Spatial Semantic Web. CRC Press, 2008.
Volz, R., Kleb, J., and Mueller, W. “Towards Ontology-based Disambiguation of
Geographical Identifiers.” I3. (2007).
Walton et al. 2014. “Freight Transportation Data Architecture: Data Element Dictionary”,
National Cooperative Freight Research Program, Ongoing study. Accessed March
2014 at http://apps.trb.org/cmsfeed/TRBNetProjectDisplay.asp?ProjectID=3537
Wang, Jinpeng, Jianjiang Lu, Yafei Zhang, Zhuang Miao, and Bo Zhou. "Integrating
heterogeneous data source using ontology." Journal of Software 4, no. 8 (2009):
843-850.
Willett, P. (2006). “The Porter stemming algorithm: then and now.” Program: electronic
library and information systems, 40(3), 219–223.
Winkler, W. E. (1999). “The state of record linkage and current research problems.”
Statistical Research Division, US Census Bureau, Citeseer.
Zhang, Jiansong, and Nora M. El-Gohary. 2013. “Semantic NLP-Based Information
Extraction from Construction Regulatory Documents for Automated Compliance
Checking.” Journal of Computing in Civil Engineering.
Zhang, X. (2012). “Route extraction, road name disambiguation and efficient spatial
query processing under location constraints.” The Pennsylvania State University.
Zhou, D., Schölkopf, B., and Hofmann, T. (2005). “Semi-supervised learning on directed
graphs.”
Ziering, Eric, and Frances Harrison. TransXML: XML schemas for exchange of
transportation data. Vol. 576. Transportation Research Board, 2007.