copyright by ganesh vijayaraghavan 2007
TRANSCRIPT

Copyright
by
Ganesh Vijayaraghavan
2007

The Dissertation Committee for Ganesh Vijayaraghavan Certifies that this is
the approved version of the following dissertation:
Synthesis and Characterization of Carbon anotube Supported
anoparticles for Catalysis
Committee:
Keith J. Stevenson, Supervisor
Jennifer S. Brodbelt
Bert D. Chandler
Arumugam Manthiram
David A. Vanden Bout

Synthesis and Characterization of Carbon anotube Supported
anoparticles for Catalysis
by
Ganesh Vijayaraghavan, B.Tech.; M.S.
Dissertation
Presented to the Faculty of the Graduate School of
The University of Texas at Austin
in Partial Fulfillment
of the Requirements
for the Degree of
Doctor of Philosophy
The University of Texas at Austin
December 2007

Dedication
To S.R and V.V

v
Acknowledgments
I would like to thank Keith Stevenson for the opportunity to be a part of
his research group and learn from him. I have benefitted tremendously in both
professional and personal aspects under his guidance.
I would also like to thank members of the Stevenson research group for all
their help and support. Stephen Maldonado was a huge help right from the
beginning. I’d like to thank Steve for his dedication to the CNT project and
offering sane advice when I needed it most. I wish him luck on his pursuit in
academia. Tim Smith was helpful whenever I needed help with the lab
instrumentation. I’d like to thank Jen Lyon or adding a touch of color to the lab
and insightful discussions. Ryan Williams was of great help in analyzing samples
on the SEM and the AFM. I’d also like to thank Ryan for help with labView. I’d
like to thank Ben Hahn and Lilia Kondrachova for equally insightful discussions
and help with the XPS analyses and ITO samples. I’d like to wish the best of luck
to Jaclyn Wiggins and Cori Atkinson with their projects and thank them for
unique perspectives on their respective areas of research.
I’d like to thank the undergraduate researchers at the Stevenson lab for
bringing fresh insight and energy into the lab. I’d like to thank Sawyer Croley and

vi
Joe Martini in particular for hard work and dedication to their projects. I wish
them the best in their future endeavors. In the same vein I’d like to thank Jenni
Soliz, Emily Barton, Stephen Morin and Alex Barksdale for enriching my
research experience. I’d like to thank Hugo Celio for his friendship, optimism and
help with various aspects of data acquisition and analysis.
I’m indebted to various members of the Department of Chemistry and
Biochemistry for their help and assistance. Members of the Vanden Bout, Bard,
Crooks, Brodbelt, Shear, Holcombe, Jones, Krische, Iverson and Cowley groups
were very gracious in sharing their equipment and knowledge. I’d also like to
thank members of the Manthiram group at the Department of Mechanical
Engineering and the Chandler group at Trinity University for help with
experiments.
Finally I’m indebted to my friends and family for their unconditional love
and support. I couldn’t have done this without them.

vii
Synthesis and Characterization of Carbon anotube Supported
anoparticles for Catalysis
Publication No._____________
Ganesh Vijayaraghavan, PhD
The University of Texas at Austin, 2007
Supervisor: Keith J. Stevenson
This dissertation describes the synthesis and characterization of nitrogen
doped carbon nanotube (NCNT) supported nanoparticles for catalysis,
specifically, the cathodic oxygen reduction reaction (ORR) in fuel cells. Strategies
for synthesis of mono- and bimetallic nanoparticle catalysts through dendrimer
based templating techniques and with the aid of metal organic chemical vapor
deposition (MOCVD) precursors and efficient assembly protocols of the catalysts
with the NCNTs are discussed in detail. Physicochemical properties of the
NCNTs and NCNT supported catalysts were characterized using a host of tools
including scanning electron microscopy, transmission electron microscopy,
Raman spectroscopy, x-ray photoelectron spectroscopy (XPS), thermo
gravimetric analysis, BET surface area and pore size analysis and electrochemical
techniques including cyclic voltammetry, chronocoulometry, chronoamperometry

viii
and rotating disk electrode voltammetry. Chapter 1 serves as a general
introduction and provides a brief overview of challenges associated with the
synthesis, characterization and utilization of graphitic carbons and graphitic
carbon supported catalysts in heterogeneous catalysis. Chapter 2 provides an
overview of the synthesis and characterization of systematically doped iron and
nickel catalyzed NCNTs in an effort to understand the effect of nitrogen doping
on ORR. Chapter 3 describes the use of NCNTs as supports for dendrimer
templated nanoparticle catalysts for ORR. A facile synthetic strategy for the
immersion based loading of catalysts onto NCNTs by spontaneous adsorption to
achieve specific catalyst loadings is explored. Chapter 4 details the loading of
monodisperse Pt, Pd and PtPd catalysts on the as synthesized NCNTs using
MOCVD precursors. The MOCVD route offers promise for direct dispersion and
activation of ORR catalysts on NCNT supports and eliminates a host of problems
associated with traditional solvent based catalyst preparation schemes. Chapter 5
details future directions on a few topics of interest including efficient
electrodeposition strategies for preparing NCNT supported catalysts, studies on
PtCu catalysts for ORR and finally prospects of using NCNT supported catalysts
in fuel cell applications.

ix
Table of Contents
List of Tables xii
List of Figures xiii
List of Schemes xviii
Chapter 1. Nitrogen Doped Nanocarbon Supported Catalysts for Heterogeneous
Catalysis
1.1 Introduction 1
1.2 References 9
Chapter 2. Synthesis and Characterization of Nitrogen Doped Carbon Nanotubes
for Oxygen Reduction
2.1 Introduction 12
2.2 Experimental 16
2.2.1 Fe Catalyzed CNT Synthesis 16
2.2.2 Ni Catalyzed CNT Synthesis 18
2.2.3 Electron Microscopy 18
2.2.4 BET Surface Area and Pore Size Analysis 19
2.2.5 Raman Spectroscopy 19
2.2.6 X-Ray Photoelectron Spectroscopy 19
2.2.7 Thermo Gravimetric Analysis 20
2.2.8 Electrochemical Analysis 20
2.3 Results and Discussion 22
2.3.1 CNT Growth on Substrates 22
2.3.2 TEM Observations of the Fe Catalyst and CNT Crystallinity 24
2.3.3 Surface Area and Porosity of CNTs 26
2.3.4 Raman Analysis 29
2.3.4.1 Raman Analysis at Fe Catalyzed CNTs 29
2.3.4.2 Raman Analysis at Ni Catalyzed CNTs 29
2.3.5 XPS Analysis 31
2.3.5.1 XPS Analysis at Fe Catalyzed CNTs 31
2.3.5.2 XPS Analysis at Ni Catalyzed CNTs 31
2.3.6 Effect of Increasing Fe Content in CNTs on ORR 37
2.3.7 Electrochemical Analysis at CNTs 39
2.3.7.1 ORR at Fe Catalyzed CNTs 39
2.3.7.2 ORR at Ni Catalyzed CNTs 43

x
2.3.7.3 Effect of Pyridinic Nitrogen on ORR 45
2.4 Conclusions 51
2.5 References 52
Chapter 3. Synergistic Assembly of Dendrimer Templated Catalysts and Nitrogen
Doped Carbon Nanotube electrodes for Oxygen Reduction 55
3.1 Introduction 55
3.2 Experimental 60
3.2.1 Synthesis of Monometallic Dendrimer Encapsulated NPs 60
3.2.2 Synthesis of Bimetallic Dendrimer Encapsulated NPs 61
3.2.3 Synthesis of Undoped CNTs and NCNTs 62
3.2.4 Adsorption of Pt-DENs on CNTs and NCNTs 62
3.2.5 Electron Microscopy 64
3.2.6 Thermo Gravimetric Analysis 64
3.2.7 Electrochemistry at CNT/ DEN Composites 64
3.3 Results and Discussion 66
3.3.1 Structure and Composition of DENs 66
3.3.2 Analysis of Pt-DEN Adsorption at CNTs and NCNTs 66
3.3.3 TEM Analysis of DENs Adsorbed on NCNTs 76
3.3.4 Comparison of Adsorption Characteristics of dendrimers 78
3.3.5 TGA Analysis of Pt-DEN Loading on NCNTs 81
3.3.6 Electrochemical Analysis of CNT/ DEN Composites 83
3.3.6.1 CV Analysis at CNT/ Pt-DEN Composites 83
3.3.6.2 Rotating Disk Electrode Studies 84
3.4 Conclusions 89
3.5 References 91
Chapter 4. Metal Organic Chemical Vapor Deposition of Nanocarbon Supported
Mono- and Bimetallic Catalysts for Oxygen reduction 94
4.1 Introduction 94
4.2 Experimental 99
4.2.1 Synthesis of Undoped CNTs and NCNTs 99
4.2.2 CVD of Mono- and Bimetallic Nanoparticles on CNTs 99
4.2.3 Electron Microscopy 100
4.2.4 Raman Characterization 100
4.2.5 XPS Characterization 101
4.2.6 TGA 101
4.2.7 Electrochemical Analysis 101
4.3 Results and Discussion 103
4.3.1 Morphology of Catalysts Synthesized by MOCVD 103

xi
4.3.2 Raman Analysis 107
4.3.3 XPS Analysis 107
4.3.4 TGA Analysis 110
4.3.5 Electrochemical Analysis 113
4.3.5.1 Cyclic Voltammetry 113
4.3.5.2 ESA Analysis by CO Stripping 115
4.3.5.3 Chronoamperometric Studies 117
4.3.5.4 RDE Studies 119
4.3.5.5 Stability of PtPd Catalysts 121
4.4 Conclusions 126
4.5 References 127
Chapter 5. Future Directions 130
5.1 Introduction 130
5.2 Results and Discussion 132
5.2.1 Electrodeposition of Nanoparticle Catalysts on NCNTs 132
5.2.2 Synthesis and Characterization of NCNT Supported PtCu 139
5.2.2.1 Studies on Dealloying at Au Thin Films 140
5.2.2.2 Effects of Electrochemical Dealloying at NCNT/PtCu 143
5.2.2.3 Development of New Characterization Strategies 145
5.2.3 CNT Supported Catalysts in Fuel Cells 146
5.4 Conclusions 148
5.4 References 148
Vita.......................................................................................................................150

xii
List of Tables.
Table 2.1 Comparison of parameters derived from Raman, XPS, cyclic
voltammetry, surface area analysis and TGA analysis for Fe and Ni
catalyzed NCNTs 50
Table 3.1 Comparison of Pt-DEN adsorption parameters, BET surface area,
electroactive surface area and peak potential for ORR at undoped
CNT/ Pt-DEN, and NCNT/ Pt-DEN composites for 4 % NCNTs and
7.5 % NCNTs 86
Table 4.1 Comparison of BET surface areas and edge plane content for pristine
nanocarbons calculated from Raman data for undoped CNTs, 4 %
NCNTs and 6.5 % NCNTs. Also compared are catalyst loadings on
the nanocarbons and ESAs obtained from integrated charge
associated with the oxidation of CO and hydrogen adsorption/
desorption for supported PtPd catalysts 118

xiii
List of Figures.
Figure 1.1 Representation of disparity in classic and new carbons. Plot shows
comparison of surface areas between the two classes of carbons 2
Figure 2.1 Schematic of the apparatus used to synthesize undoped and nitrogen
doped CNTs 17
Figure 2.2 Representative SEM image of CNTs grown directly on a Ni mesh
current collector. Image shows that CNTs retain their alignment even
after acid dissolution of the Ni 23
Figure 2.3 Representative TEM images of residual Fe catalyst particles encased
within the graphitic sheets of CNTs. a) Encapsulated Fe in undoped
CNTs. b) Fe encapsulated within 5 % NCNTs 25
Figure 2.4 Plot of differential surface area corresponding to pore sizes at
undoped CNTs and NCNTs measured using nitrogen 28
Figure 2.5 Raman spectra showing the D and G bands on nitrogen doped Ni
catalyzed NCNTs 30
Figure 2.6 Plot of ID / IG vs. the pyridinic concentration at Ni based NCNTs.
Also shown is the length of crystallinity (La) correlating degree of
structural disorder to the pyridinic fraction of surface nitrogen 32
Figure 2.7 XPS spectra showing the nitrogen region in nitrogen doped Ni
catalyzed NCNTs 34
Figure 2.8 Quantitative comparison of the different nitrogen fractions in
nitrogen doped Ni catalyzed NCNTs based on XPS spectra 36
Figure 2.9 Oxygen reduction at 4 % NCNTs with varying concentrations of Fe
added to the electrolyte solution 38
Figure 2.10 Plot showing correlation between peak potential for ORR activity
corresponding to mass of iron precursor used to synthesize nitrogen
doped CNTs 40

xiv
Figure 2.11 ORR activity for undoped CNTs and NCNTs in oxygen saturated 0.1
M H2SO4. ν = 20 mVs-1
42
Figure 2.12 Comparison of cyclic voltammograms for ORR at undoped CNTs
and NCNTs synthesized using Fe and Ni precursors in oxygen
saturated 0.1 M H2SO4. ν = 20 mVs-1
44
Figure 2.13 Plot showing correlation between peak potential for ORR activity
corresponding to edge plane content calculated from Raman spectra
at Fe and Ni based NCNTs. ORR activity was measured in oxygen
saturated 0.1 M H2SO4 46
Figure 2.14 Plot showing correlation between peak potential for ORR activity
corresponding to the pyridinic nitrogen fraction at Fe and Ni based
NCNTs. ORR activity was measured in oxygen saturated 0.1 M
H2SO4 47
Figure 2.15 Plot showing correlation between peak potential for ORR activity
corresponding to the total nitrogen content at Fe and Ni based
NCNTs. ORR activity was measured in oxygen saturated 0.1 M
H2SO4 48
Figure 3.1 Representative TEM image of Pt –DENs. The histogram depicts a
typical particle size distribution for the Pt-DENs 67
Figure 3.2 Representative TEM image of Pd –DENs. The histogram depicts a
typical particle size distribution for the Pd-DENs 68
Figure 3.3 Representative TEM image of PdAu –DENs. The histogram depicts
a typical particle size distribution for the PdAu-DENs 69
Figure 3.4 Representative energy dispersive spectrum for PdAu- DENs 70
Figure 3.5 UV-Vis spectra showing cumulative adsorption measurements
observed over 24 hours for the adsorption of Pt-DEN nanoparticles
on 4 % NCNTs 71
Figure 3.6 Picture representing the Pt-DEN adsorption process on NCNTs. A)
20 µM Pt-DENs. B) Pt-DENs with NCNTs suspended in solution. C)
NCNT/ Pt-DEN suspension after 24 hrs showing all DENs having
been adsorbed onto the NCNTs rendering the solution colorless 73

xv
Figure 3.7 Adsorption isotherms for G4-NH2 Pt-DEN adsorption on undoped
CNT and NCNT supports 74
Figure 3.8 TEM image of G4-NH2 Pt-DENs adsorbed on 4 % NCNT supports
(Scale bar is 20nm). The inset shows high resolution structure of Pt
nanoparticles (Scale bar is 5nm) 77
Figure 3.9 TEM images of dendrimer encapsulated nanoparticles adsorbed on
the NCNT surface. a) Pd DENs adsorbed on 4 % NCNTs. b) PdAu
DENs adsorbed on 4 % NCNTs 79
Figure 3.10 Representative TEM images comparing the adsorption of –NH2
terminated and –OH terminated Pt DENs on 4 % NCNTs. a) G4-
NH2 Pt DENs adsorbed on 4 % NCNTs. b) G4-OH Pt DENs
adsorbed on 4 % NCNTs 80
Figure 3.11 Representative TGA heating curves for blank NCNTs and Pt-DENs
adsorbed on 7.5 % NCNTs. Mass loading of Pt on NCNTs is
calculated by subtracting final wt. % of NCNT/ Pt-DEN from final
wt. % at blank NCNT 82
Figure 3.12 Cyclic voltammograms for ORR at control undoped CNTs and
NCNTs synthesized using Fe and Ni precursors compared to NCNT/
Pt-DEN composites in oxygen saturated 0.1 M H2SO4. ν = 20
mVs-1
85
Figure 3.13 Polarization curves for the ORR on G4-NH2 Pt-DEN/CNT and
NCNT composites supported on a glassy carbon electrode immersed
in an O2 saturated 0.1M H2SO4 solution. In all cases the Pt loading is
18±1 µg. Also shown are polarization curves for CNT and NCNT
supports. Rotation rate =1600 rpm, scan rate =20 mV s-1
87
Figure 4.1 TEM images of a) Pt and c) Pd catalysts on NCNT supports.
Corresponding particle size histograms for b) Platinum and d)
Palladium catalysts 105
Figure 4.2 TEM image of a) PtPd particles on 6.5 % NCNT supports. Inset
shows high resolution image of a PtPd bimetallic catalyst particle. b)
Corresponding particle size histogram for PtPd catalysts. c)

xvi
Representative energy dispersive spectrum of a single PtPd
nanoparticles 106
Figure 4.3 Raman spectra of PtPd bimetallic catalysts on NCNT supports with
varying surface concentrations of nitrogen 108
Figure 4.4 XPS spectra of PtPd supported on 6.5 % NCNTs. a) Survey
spectrum of PtPd showing Pt and Pd regions. b) High resolution XPS
spectrum of Pt and c) Pd catalysts supported on 6.5 % NCNTs 109
Figure 4.5 TGA heating curves for PtPd catalysts on various CNT supports 111
Figure 4.6 Effect of edge plane content at NCNTs on PtPd loading as
determined by TGA 112
Figure 4.7 Representative cyclic voltammogram for PtPd catalysts supported on
6.5 % NCNTs in O2 saturated 0.1M H2SO4 114
Figure 4.8 CO stripping voltammogram on PtPd catalysts supported on 6.5 %
NCNTs. CO was dosed into solution for 20 min followed by 30 min
of Ar purge to remove CO in bulk 116
Figure 4.9 CO stripping transients on PtPd catalysts supported on 6.5 %
NCNTs. CO was dosed into solution for 20 min followed by 30 min
of Ar purge to remove CO in bulk. The working electrode was held
at 0.11V during CO dosing and raised to stripping potentials 120
Figure 4.10 Polarization curves for ORR on PtPd catalysts supported on 6.5 %
NCNTs in O2 saturated 0.1 M HClO4. The RDE was rotated between
250 – 3000 rpm in increments of 250 rpm. Scan rates were set at 20
mV /s 122
Figure 4.11 Polarization curves for ORR on PtPd catalysts supported on 6.5 %
NCNTs in O2 saturated 0.1 M H2SO4 showing the effects of
adsorbed bisulfate. The RDE was rotated between 250 – 3000 rpm in
increments of 250 rpm. Scan rates were 20 mV /s 123
Figure 4.12 Extended cycling of PtPd catalysts supported on 6.5 % NCNTs in O2
saturated 0.1 M H2SO4 124

xvii
Figure 5.1 Chronocoulometric profile of the electrodeposition of Au
nanoparticles from 0.2 mM HAuCl4 solutions on NCNTs 134
Figure 5.2 Representative TEM images of nanoparticle catalysts deposited on 4
% NCNTs. a) Au nanoparticles. b) PtAu nanoparticles 135
Figure 5.3 High resolution TEM image of PtAu nanoparticles electrodeposited
on NCNTs 137
Figure 5.4 Cyclic voltammograms for oxygen reduction at PtAu catalysts
deposited on NCNTs. CV’s were run in O2 saturated 1 M KNO3 138
Figure 5.5 Scanning electron microscope image of Au film subjected to 30
alloy/ dealloy cycles in a ZnCl2 / benzyl alcohol solution 141
Figure 5.6 Cyclic voltammograms of an Au film in 0.5 M H2SO4 before and
after alloying/ dealloying cycles in a ZnCl2 / benzyl alcohol solution.
Integration of the cathodic AuO peak showed a 17.1 % increase in
the electrochemical surface area on the dealloyed Au film 142
Figure 5.7 Electrochemical dissolution of Cu from PtAu bimetallic catalysts
synthesized using dendrimer templates. The PtCu/ DEN catalysts
were supported on 6.5 % NCNTs. Dissolution studies were carried
out in 0.1 M HClO4 144
Figure 5.8 Half cell trial of CNT supported Pt DEN catalysts for ORR in 1 M
H2SO4 147

xviii
List of Schemes.
Scheme 3.1 Preparation of amine terminated PAMAM dendrimer encapsulated
Pt nanoparticles (G4-NH2 Pt-DENs) and adsorption onto carbon
nanotube (CNT) supports 58
Scheme 3.2 Representation of synergistic ORR activity at NCNT/ Pt-DEN
composites 90

1
CHAPTER 1
itrogen Doped anocarbon Supported Catalysts for Heterogeneous Catalysis
1.1 ITRODUCTIO
The use of carbon in a chemical process dates back as far as 3750 BC in
the Bronze Age. Early Egyptians and Sumerians were known to have used
charcoal to reduce copper, tin and zinc ores for producing bronze. Since then
carbons have evolved for use in a multitude of processes. Traditional carbons1,2 or
‘classic carbons’ such as soot, charcoal and diamond have been mostly replaced
with new and novel carbon materials or ‘new carbons’.3 Since the 1960’s a variety
of synthetic strategies have been employed to produce carbons that have favorable
structure, texture and composition that allow for these new carbons to perform
significantly better than classic carbons.4 Early examples of these new carbons
included carbon fibers, porous carbons and pyrolitic graphite electrodes.3 Of these
new carbons, graphitic carbons have shown promise for usage in energy storage
and conversion processes due to their high electronic conductivity, resistance to
corrosion and physical stability.5,6,7
Diverse synthetic protocols have been utilized in the preparation of
graphitic carbons. Fullerenes,8 are one form of graphitic carbons that were
discovered in 1985 and have been synthesized by the evaporation of carbon using
an electric arc between graphite electrodes in an inert atmosphere. Carbon
nanotubes (CNTs) discovered by Ijima9 in 1991 are another form of graphitic

2
1 2 3 4 5 6 7 80
200
400
600
800
1000
1200
Su
rfa
ce
are
a
(m2 /
g)
Carbons
1. Graphite
2. Thermax
3. Phil black A
4. Carbon black
5. PAN fibers
6. Vulcan XC 72
7. Kejtenblack
8. Functionalized CNTs
Classic carbons
New carbons
Figure 1.1 Representation of disparity in classic and new carbons. Plot shows comparison of surface areas between the two classes of carbons.

3
carbons that have been synthesized by various routes. CNTs have been produced
using templated techniques, some of which involve the deposition of carbon from
propylene gas at 800 0C on the inner walls of nanoscale channels in an aluminum
oxide film.10,11
The CNTs were then recovered by dissolution of the film in HF.
Other techniques include CNTs produced using a polymer blend process,12,13
CNTs produced with the help of a steep thermal gradient in alcohols,14 CNTs
produced by the decomposition of SiC in a single crystal wafer15 and the more
popular laser ablation technique.16,17
The popularity of CNTs stems from favorable properties such as good
electronic conductivity, surface area, preferred pore structure, ability to be
synthesized in ordered arrays,18 ease of assembly on a secondary substrate
through Van der Waal’s interactions,19,20
facility for directed growth21 – typically
brought upon by application of an electric field and scalability of the patterned
growth.22
While these as-synthesized CNTs perform well in their primary purpose as
electron conductors in chemical and electrochemical processes, it would be of
tremendous advantage if this class of graphitic carbons were modified to be active
in these chemical and electrochemical reactions themselves. Efforts towards this
end have involved heteroatom doping – most notably nitrogen doping on graphitic
carbons. A number of groups such as Thrower et al,23,24
Wang et al25, Boehm et
al,26,27
Gooding et al,28,29
Compton et al,30,31
Cai et al32 and Dodelet et al
25,33 have
studied the effects of nitrogen doping in graphitic carbons especially on the

4
oxygen reduction reaction (ORR). ORR is a technologically important reaction
that takes place in the cathodic side of a fuel cell.
A number of synthetic strategies have been employed in the nitrogenation
of graphitic carbons. The most popular method being the introduction of the as-
prepared carbon into an atmosphere of NH3 or HCN at high temperatures.25 The
resulting carbon was found to be enriched in nitrogen and had a significantly
higher activity for electrochemical reduction of oxygen. While it has been of
general consensus that nitrogen doping increases the activity at these carbons,
there has been ambiguity as to what physicochemical factor or factors effect this
difference in activity. Most of the ambiguity stems from poor reproducibility33
and stability problems associated with the post- synthetic modification step at
these carbons. To this end, effort in the Stevenson research lab has been
concentrated on developing facile synthetic protocols34,35,36
that enable synthesis
of systematically doped graphitic nanocarbons in order to elucidate individual
physicochemical properties and their contribution to ORR activity.
Chemical vapor deposition (CVD) is employed for the controlled
synthesis of nitrogen doped carbon nanotubes (NCNTs) at the Stevenson research
lab. The use of synthetic precursors in CVD synthesis allows for systematic
manipulation of structure, composition, surface area and the degree of structural
disorder at NCNTs. This systematic manipulation allows for distinctive
delineation of the effects brought upon by nitrogen doping on the electrochemical
properties of the NCNTs. Accordingly, Maldonado et al have published a series of

5
papers34,35,36
elucidating the influence of systematic nitrogen doping at NCNTs on
several electrochemical processes including ORR.
While a systematic increase in nitrogen doping at graphitic carbons
increases the activity for ORR at these nanocarbons, their activities are lower than
what is seen at metals known for exhibiting high ORR activity. Efforts undertaken
to improve on this particular aspect have involved using these carbons as supports
for active metal nanoparticle catalysts to be used in heterogeneous catalysis.
Conventional strategies employed for loading metal catalysts on carbons
typically involve inducing surface functionalities such as carbonyl, carboxylate,
ester-like oxygen or alcohol on the carbon to facilitate anchoring of catalysts on
the support. This is done using aggressive protocols that involve the use of strong
acids37 like HNO3, H2SO4, HCN or strong oxidizing agents
38 like H2O2, KMnO4.
These protocols are often not reproducible and degrade the preferred structural
and compositional properties of both the carbon support and active metal catalyst.
The ability to manipulate in-situ, the structure, composition, surface area
and the density of edge plane sites on NCNTs provides a significant advantage
over traditional carbons for use as catalyst supports because there is no further
need to modify the surface to facilitate catalyst loading. This offers tremendous
advantages in using NCNTs as catalyst supports while circumventing the time
consuming and often structurally degrading pre- synthesis steps that are used in
catalyst loading protocols like microemulsion,39 impregnation,
40 co-
precipitation,41 sonochemical
42 and fluidized bed CVD processes.
43 NCNTs as
catalyst supports also allow for uniform catalyst dispersion and utilization

6
stemming from control of their surface properties such as the density of edge
plane sites and porosity.
Challenges in defining physicochemical properties of nitrogenated
graphitic carbons (esp. NCNTs) that contribute to oxygen reduction and the
advantages in using these properties efficiently and synergistically with active
metal catalysts for ORR are discussed in this dissertation.
This dissertation is organized into five chapters. Chapter 1 serves as a
general introduction and provides a brief overview of challenges associated with
the synthesis, characterization and utilization of graphitic carbons and graphitic
carbon supported catalysts in heterogeneous catalysis.
Chapter 2 provides an overview of the synthesis and characterization of
systematically doped iron and nickel catalyzed NCNTs in an effort to understand
the effects of nitrogen doping on ORR. The influence of nitrogen doping on the
physicochemical and electrochemical properties at these NCNTs is characterized
using transmission electron microscopy (TEM), scanning electron microscopy
(SEM), Raman spectroscopy, x-ray photoelectron spectroscopy (XPS), thermo
gravimetric analysis (TGA), BET surface area and pore size analyses and
electrochemical characterization including cyclic voltammetry (CV) and rotating
disk electrode voltammetry (RDE). Raman analysis in conjunction with XPS and
electrochemical analysis suggests that the presence of increased edge plane sites
at NCNTs along with increased surface concentrations of pyridinic nitrogen are
influencing factors for remarkable ORR activity at NCNTs. BET surface area and
pore size analyses indicate that the porosity at NCNTs does not correlate to ORR

7
activity. ORR activity studies at Ni based NCNTs suggest that an Fe based active
center does not provide for a complete picture of the ORR mechanism.
Chapter 3 describes the use of CNTs as supports for dendrimer templated
catalysts (DENs) for ORR. A facile synthetic strategy for the immersion based
loading of catalysts onto a carbon support by spontaneous adsorption to achieve
specific catalyst loadings is explored. The resultant CNT-DEN composites were
assembled without necessitation of time consuming and irreproducible pre- and
post- synthetic processing steps. The advantage of this synthetic strategy is that
the compositional and structural properties of both the carbon support and the
DEN catalyst can be reproducibly prepared and synergistically tuned to directly
assemble carbon-supported catalyst composites via adsorption from aqueous
solution. The as loaded Pt-DENs were found to be uniformly dispersed
throughout the CNTs and CNT/ Pt-DEN composites were found to be active for
ORR. A synergistic activity is envisioned where the NCNT support is reactive
and serves to reduce the peroxide formed as a byproduct during oxygen reduction
at the metal catalyst.
Chapter 4 details the loading of monodisperse Pt, Pd and PtPd catalysts on
as synthesized NCNTs using metal organic chemical vapor deposition (MOCVD)
precursors. The MOCVD route offers promise for the direct dispersion and
activation of mono- and multimetallic ORR catalysts on NCNT supports and
eliminates the current inevitable problems involving loading, sintering and
activation steps associated with traditional solvent based catalyst preparation
schemes. The tunability of the amount of edge plane content on the NCNT

8
support offers distinct advantages with regard to preferential catalyst loading and
decomposition of peroxide specific to ORR. The MOCVD process is expected to
serve as a model system for rapid and direct assembly of carbon supports and
varied catalyst compositions that provide promising activity for oxygen reduction.
Chapter 5 details future directions in studies on a few topics of interest
involving efficient synthetic strategies for NCNT/ nanoparticle catalysts and their
application towards ORR. In this regard, electrodeposition aspects of loading
mono- and bimetallic catalysts directly on as synthesized NCNT electrodes is
reported. Facile characterization protocols that allow for TEM observations of the
as synthesized NCNT/ catalyst composite and the composite after being subject to
ORR are also discussed. These characterization protocols show marked
improvements to existing strategies and are expected to play a vital role in the
design of effective ORR catalysts. Other future directions discussed include
studies on PtCu catalysts for ORR. The selective dissolution of Cu from a
bimetallic PtCu catalyst presents intriguing possibilities as to a more active
catalyst surface for ORR. The electrochemical dealloying of Cu is speculated to
improve the electrochemical surface area and enhance mass transport.
Characterization of such interfaces will help design stable and active catalyst
combinations for ORR.

9
1.2 REFERECES
1. Inagaki, M. Old but new materials: carbons. In Carbons- control of structure and functions; Elsevier, 2000; p. 1 – 29.
2. Walker Jr. P. L. Carbon, 1990, 28, 261.
3. Inagaki, M.; Radovic, L. R. Carbon, 2002, 40, 2263.
4. Inagaki, M. In ew carbons – control of structure and functions; Inagaki, M., Ed.; Elsevier, 2000; p. 82-123.
5. Sato, K.; Noguchi, M.; Demachi, A.; Oki, N.; Endo, M. Science, 1994, 264, 556.
6. Endo, M.; Maeda, T.; Takeda, T., Kim, Y. J.; Koshiba, K.; Hara, H.; Dresselhaus, M. S. J. Electrochem. Soc. 2001, 148, A910.
7. Endo, M.; Hayashi, T.; Hing, S. H.; Enoki, T.; Dresselhaus, M. S. J. Appl. Phys. 2001, 90, 5670.
8. Kroto, H. W.; Heath, J. R.; O’ Brien, S. C.; Curl, R. F.; Smalley, R. E. ature, 1985, 318, 162.
9. Ijima, S. ature, 1991, 354, 56.
10. Kyotani, T.; Tsai, L.; Tomita, A. Chem. Mater. 1995, 7, 1427.
11. Kyotani, T.; Tsai, L.; Tomita, A. Chem. Mater. 1996, 8, 2109.
12. Oya, A.; Kasahara, N. Carbon, 2000, 38, 1141.
13. Hulicova, D.; Sato, F.; Okabe, K.; Koishi, M.; Oya, A. Carbon, 2001, 39, 1438.
14. Zhang, Y.; Nishitani- Gamo, M.; Nagakawa, K.; Ando, T. J. Mater. Res. 2002, 17, 2457.
15. Kusunoki, M.; Rokkaku, M.; Suzuki, T. Appl. Phys. Lett. 1997, 18, 2620.
16. Kocabas, C.; Meitl, M. A.; Gaur, A.; Shim, M.; Rogers, J. A. ano Lett. 2004, 4, 2421.

10
17. Krungleviciute, V.; Heroux, V.; Migone, A. D.; Kingston, C. T.; Simard, B. J. Phys. Chem. B 2005, 109, 9317.
18. Fan, S.; Chapline, M.; Franklin, N.; Tombler, T.; Cassell, A.; Dai, H. Science, 1999, 283, 512.
19. Cassell, A.; Franklin, N.; Tombler, T.; Chan, E.; Han, J.; Dai, H. J. Am. Chem. Soc. 1999, 121, 7975.
20. Franklin, N.; Dai, H. Adv. Mater. 2000, 12, 890.
21. Zhang, Y.; Chan, A.; Cao, J.; Wang, Q.; Kim, W.; Dai, H. Appl. Phys. Lett. 2001, 79, 3155.
22. Franklin, N.; Li, Y.; Chen, R. J.; Javey, A.; Dai, H. Appl. Phys. Lett. 2001, 79, 4571.
23. Strelko, V. V.; Kuts, V. S.; Thrower, P. A. Carbon, 2000, 38, 1499.
24. Thrower, P. A.; Radovic, L. R.; Carbon, 2000, 39, 1.
25. Wang, H.; Cote, R.; Faubert, G.; Guay, D.; Dodelet, J. P. J. Phys. Chem. B 1999, 103, 2042.
26. Boehm, H. P.; Mair, G.; Stoehr, T.; DeRincon, A. R.; Tereczki, B. Fuel 1984, 63, 1061.
27. Stohr, B.; Boehm, H. P.; Schlogl, R. Carbon 1991, 29, 707.
28. Gooding, J. J. Electrochimica Acta 2005, 50, 3049.
29. Chou, A.; Bocking, T.; Singh, N. K.; Gooding, J. J. Chem. Commun. 2005, 7, 842.
30. Banks, C. E.; Moore, R. R.; Davies, T. J.; Compton, R. G. Chem. Commun. 2004, 16, 1804.
31. Salimi, A.; Banks, C. E.; Compton, R. G. Analyst, 2004, 129, 225.
32. Jaouen, F.; Lefevre, M.; Dodelet, J. P.; Cai, M. J. Phys. Chem. B 2006, 110, 5553.
33. Jouen, F.; Charreteur, F.; Dodelet, J. P. J. Electrochem. Soc. 2006, 153, A689.

11
34. Maldonado, S.; Stevenson, K. J. J. Phys. Chem. B 2004, 108, 11375.
35. Maldonado, S.; Stevenson, K. J. J. Phys. Chem. B 2005, 109, 4707.
36. Maldonado, S.; Morin, S.; Stevenson, K. J. Carbon 2006, 44, 1429.
37. Wang, J.; Musameh, M.; Lin, Y. J. Am. Chem. Soc. 2003, 125, 2408.
38. Tian, Z. Q.; Jiang, S. P.; Liang, Y. M.; Shen, P. K. J. Phys. Chem. B. 2006, 110, 5343.
39. Yoon, B.; Wai, C. M. J. Am. Chem. Soc. 2005, 127, 17174.
40. Gaur, V.; Sharma, A.; Verma, N. Carbon 2005, 42, 3041.
41. Li, X.; Hsing, I. -M. Electrochim. Acta 2006, 51, 5250.
42. Xing, Y. J. Phys. Chem. B 2004, 108, 19255.
43. Serp, P.; Hierso, J. C.; Feurer, R.; Kihn, Y.; Kalck, P.; Faria, J. L.; Aksoylu, A. E.; Pacheco, A. M.; Figueiredo, J. L. Carbon 1999, 37, 527.

12
CHAPTER 2
Synthesis and Characterization of itrogen Doped Carbon anotubes for Oxygen Reduction
2.1 ITRODUCTIO
Graphitic carbons have been used as supports for a variety of processes
and especially in heterogeneous catalysis.1-4 The interest in using these carbons
stems from their good electrical conductivity,5,6 high surface area7 and good
mechanical and chemical stability.8 While these carbons perform well in their
primary purpose as electron conductors for chemical and electrochemical
processes, it would be of tremendous advantage if these carbons were tuned to
take part in these chemical and electrochemical reactions themselves. This
scenario would make more efficient use of the surface area of these supports in
devices like fuel cells and batteries.
One technologically important reaction where graphitic carbons are used
as catalyst supports is the oxygen reduction reaction (ORR) that takes place in the
cathodic side of a fuel cell.9-11 Efforts to enhance the oxygen reduction activity at
these carbons have been afoot since the late 60’s12 have increased substantially
since the early 80’s partly due to the re-emergence of fuel cells as promising
‘green’ power sources.13 Heteroatom doping of these graphitic carbons especially
with nitrogen has been known to significantly enhance their chemical reactivity,3,4
although the exact mechanism is not well understood. While a number of
protocols have been used to prepare nitrogen doped carbons,14,15 the more popular

13
methods call for heat treatment of pre-synthesized carbons in an atmosphere of
NH3 or HCN16 followed by exposure to an Ar atmosphere at higher temperatures.
One of the earlier reports by Wang et al17 details the oxidation of Vulcan carbon
using a strong acid and successive heat treatments under NH3 at 600 C and Ar at
900 C. The resulting carbon was found to exhibit enhanced activity for ORR
compared to the undoped carbon as shown by a positive shift of ~200 mV in the
oxygen reduction peak potential.
The enhancement in activity for nitrogenated graphitic carbons has been
attributed to the changes in the electronic structure of the graphene. The
Gooding18,19 and Compton groups20,21 have attributed the enhanced
electrocatalytic activity to the inducement of surface structural disorder
characterized by an increase in density of edge plane sites. While it is well known
that nitrogen doping on carbons produces pyridinic, pyrrolic and quaternary
nitrogen functionalities,11 reports differ on which of these surface functionalities
is responsible for or contributes to ORR activity. Thrower et al22 and Boehm et
al13 have ascribed pyridinic nitrogen functionalities on the edge plane sites to
increased reactivity while other hypotheses23 have proposed nitrogen substituted
in the basal graphene as a vital factor. Literature data have also suggested that the
residual iron from precursors used to synthesize these materials bound to nitrogen
and carbon in a FeNxCy type active site24 is responsible for ORR activity.
Residual iron particles in these carbons have also been attributed to reduction of
peroxide which is one of the byproducts of ORR.25 Although these hypotheses
attempt to elucidate the increased activity of nitrogen doped carbons, none of

14
them satisfactorily explain the exact mechanism of ORR at the active centers of
these carbons.
The ambiguity in assigning how a factor or a combination of factors
contribute to the electrocatalytic activity at nitrogen doped graphitic carbons
originates from complexities involved in the nitrogenation of pre existing carbons.
To this end, a synthetic protocol to prepare and characterize a series of
systematically doped carbon nanotubes was undertaken by Maldonado et al.11
This synthetic strategy allowed for tuning the diameter, length, structure and
composition of nitrogen doped carbon nanotubes (NCNTs).10,11 These studies
elucidated the changes in structure and composition of NCNTs brought upon by
systematic nitrogen doping and enabled correlating these changes with the
chemical reactivity and the electrochemical properties on the NCNTs as compared
to regular undoped carbon nanotubes (undoped CNTs). Parallel studies by Lyon et
al26 dealt with dissolution and passivation of residual Fe encased in NCNTs and
have concluded that FeII/III redox activity and successive passivation of the FeII/III
surface oxides do not impact the onset and activity for ORR at these NCNTs.
This chapter follows up on previous experiments conducted in the
Stevenson research group on systematic nitrogen doping of Fe based carbon
nanotubes (NCNTs). Knowledge gained from those series of experiments was
used to setup a new batch of analyses aimed to clarify the controlling aspects for
ORR at NCNTs. A new variety of NCNTs synthesized using a Ni based precursor
was utilized for these measurements. Efforts were also made to elucidate the
importance of pyridinic nitrogen functionalities comprising total surface nitrogen

15
concentrations on ORR activity at Ni NCNTs. Raman spectral data were used to
quantify the degree of structural disorder on the NCNT surface and account for
the involvement of edge plane sites in ORR.

16
2.2 EXPERIMETAL
2.2.1 Fe Catalyzed CT Synthesis
Nitrogen doped and undoped carbon nanotubes were synthesized using a
floating catalyst CVD method described previously.10,11 Briefly, an automated
dual zone furnace system (Carbolite HST 12/35/200/2416CG) integrated with lab
view controlled mass flow controllers (MKS 1179A) and syringe pumps (New
Era Pump Systems NE-1000) was used in a setup as shown in Figure 2.1. NCNTs
were prepared with pyridine (Fisher) and ferrocene (Alfa Aesar, 20mg ml -1)
precursors (xylene and ferrocene were used for undoped CNTs) loaded in an
airtight syringe (Hamilton 81320) mounted on the syringe pump. The precursors
were injected at a rate of 100µL min-1 into zone 1 of the furnace system
maintained at 130C for NCNTs (150C for undoped CNTs) while the pyrolysis
temperature in zone 2 was 800C (700C for the undoped CNTs). The total gas
flow rate was held constant at 575 sccm for NCNTs and undoped CNTs, and a
calculated feed stream (2.5 – 10 %) of anhydrous ammonia (Aldrich, 99.9%) was
introduced to facilitate higher levels of nitrogen doping with Ar (99.997%
Praxair) making up the reminder of the flow stream. Gas flows for the undoped
CNTs constituted 500 sccm Ar and 75 sccm H2 (99.95% Praxair). The CNTs were
grown on the inside wall of a quartz tube (26mm OD, 22mm ID) that acted as the
reaction chamber.
The as synthesized undoped CNTs and NCNTs were carefully collected
from the inner walls of the quartz reaction chamber and stored in air tight vials

17
Figure 2.1 Schematic of the apparatus used to synthesize undoped and nitrogen doped CNTs.
prior to successive measurements. Electrochemical measurements were conducted
on a measured mass of the CNTs drop cast27 on a glassy carbon rotating disk
Furnace system
Z1 Z2
Mass flow controllers (Ar, H2, NH3)
Syringe pump (Precursors)
smix)

18
electrode (RDE) as detailed in the electrochemical section below. Initial
electrochemical measurements were also performed on CNTs grown directly on a
nickel mesh substrate9 that was cut to specific dimensions so as to keep the
surface area of the electrode constant. The nickel mesh substrates were supported
on a piece of nickel foam and were placed in the center of Z2 of the furnace
system for CNT growth. After the synthesis, these substrates were stored in air
tight vials prior to electrochemical analysis.
2.2.2 i Catalyzed CT Synthesis
Ni catalyzed CNTs were synthesized using the same experimental setup
used for Fe catalyzed CNTs. The precursor mix used for the synthesis consisted of
Nickelocene (Alfa Aesar, 15 mg ml -1) in Acetonitrile (Fisher). The precursor mix
was sonicated for 5 min prior to loading in the injection syringe to facilitate
uniform dispersion of the catalyst in acetonitrile. The resulting mixture was dark
green in color and care was taken to reduce the presence of precipitates and
atmospheric gases in the injection volume. The reaction conditions were similar to
that used for the synthesis of NCNTs.
2.2.3 Electron Microscopy
Transmission electron microscope (TEM) analysis of the CNTs was
performed on a JEOL 2010F instrument operating at 200 kV. The CNT sample
was suspended in anhydrous ethanol and drop cast on a Cu TEM grid covered
with a 3 nm thick amorphous carbon film.
Scanning electron microscope (SEM) analysis was performed using either
a LEO 1530 or a Hitachi S 4000 instrument operating at 10 kV. Carbon samples

19
collected from the interior of the quartz tube were deposited on an adhesive
carbon film prior to analysis. CNTs grown on Ni substrates were introduced per
se into the sample chamber.
2.2.4 BET Surface Area and Pore Size Analysis
Surface area and pore size analysis were performed on the undoped CNTs
and NCNTs using a Quantachrome Autosorb-1 instrument. Sample masses of
atleast 20 mg were introduced into a quartz sample holder and were degassed at
200C for atleast 5 hrs under vacuum. Nitrogen was used as the probe gas.
Surface areas were calculated from an 11 point BET analysis. Micropore
distributions were obtained from density functional theory method and Monte
Carlo simulation methods available within the instrument software.
2.2.5 Raman Spectroscopy
A Renishaw inVia system equipped with a 514.5 nm Ar laser at 3 mW/
cm2 and 100X aperture was used. Spectra were scan averaged for a total time of
300 s. Bands at 1220, 1351, 1487, 1583 and 1624 cm-1 corresponding to I, D, D′′,
G, and D′ bands denoted by Cuesta et al29 were fit using a Peak Fit 4 software
package to correlation factors greater than 0.998. A linear baseline correction was
used to compensate for photoluminescence background.
2.2.6 X-ray Photoelectron Spectroscopy
X-ray photoelectron spectroscopy (XPS) characterization of the samples
was performed using a PHI 5700 ESCA system operating at a scan step size of 0.1
eV and an Al Kα monochromatic line and calibrated with Au 4f7/2, Ag 3d5/2 and
Cu 2p3/2 signals. These spectra were scan averaged 5 times. XPS Spectra were

20
also obtained with a Kratos Axis Ultra DLD system equipped with a dual anode
(150 W Al Kα and Mg sources) with a resolution of 0.1 eV and calibrated with
Au 4f7/2, Ag 3d5/2 and Cu 2p3/2 signals. These spectra were scan averaged 3 times.
Atomic percentages were quantified from survey scans relative to carbon, iron
and nitrogen. FITT 1.2 (Photoelectron Spectroscopy lab, Seoul National
University) software with Shirley background corrections was used to analyze the
spectra.
2.2.7 Thermo Gravimetric Analysis
Thermo gravimetric analysis (TGA) was performed using a Perkin Elmer
7000 TGA. CNT samples (3-5 mg) were held in platinum pans heated to 800 C
in flowing air (Praxair, 99.998%).
2.2.8 Electrochemical Analysis
Electrochemical measurements were carried out on an EG&G Instruments
263A potentiostat equipped with a Pine Instruments MSRX controller for rotating
disk electrode (RDE) measurements. Data acquisition and analysis was performed
on a Corrware (Scribner Associates) software package. Sample slurries prepared
with 0.15 wt. % nafion in anhydrous ethanol and de-ionized water were drop cast
as a film on a glassy carbon (GC) RDE (0.5 cm diameter, Pine Instruments)
polished to a mirror finish and allowed to dry under a stream of Ar (Praxair
99.98%) prior to electrochemical measurements.
Cyclic voltammograms were obtained in a standard three electrode cell
with a gold counter electrode and an Hg/Hg2SO4 reference electrode in O2
(Praxair) saturated 0.1 M H2SO4 prepared with deionized water (>18 MΩ cm). All

21
potentials were converted to NHE for comparison to literature values. Prior to
oxygen reduction, the CNT film was cycled between 0.8 and -0.2V in order to
make the film hydrophilic and achieve steady state voltammograms.

22
2.3 RESULTS AD DISCUSSIO
2.3.1 CT Growth on Substrates
Carbons used throughout this study were undoped and nitrogen-doped
multi walled carbon nanotubes and hereafter referred to as undoped CNTs and
NCNTs respectively. Carbon nanotubes in general are referred to as CNTs. While
a few hypotheses exist as to the mechanism of the growth of CNTs aided by a
metal catalyst, the base catalyzed growth mechanism is commonly accepted. The
graphene layers that make up the CNTs precipitate out from the metal catalyst
after super saturation of the catalyst with gaseous carbon. The graphene layers
either originate out from the metal catalyst, leaving the metal particle at the base
or push the metal catalyst particle out as the growth progresses. In either of these
scenarios the metal particles are encapsulated within the graphene layers.
A variety of electrode supports were chosen for CNT growth to facilitate
the ease and reproducibility of measurements conducted. Initial electrochemical
measurements were carried out on CNTs grown directly on the surface of nickel
mesh electrodes cut to exact dimensions so as to maintain a constant surface area.
SEM characterization of undoped CNTs grown on nickel mesh substrates showed
a remarkable degree of conformal growth and alignment along a perpendicular
axis to the surface of the substrate. Earlier experiments by Maldonado et al.
indicate that the as grown CNTs retain their alignment even after the removal of
the growth substrate by acid dissolution as shown in Figure 2.2.
A majority of electrochemical experiments were carried out on CNTs
drop cast on GC substrates. CNTs used in these experiments were carefully

23
2µm2µm
Figure 2.2 Representative SEM image of CNTs grown directly on a Ni mesh current collector. Image shows that CNTs retain their alignment even after acid dissolution of the Ni.

24
extracted form the inner walls of the quartz tube that was used as a reaction
chamber for CNT growth. The extracted CNTs were in the form of carbon mats.
These carbon mats had a long range order in the case of the undoped CNTs while
they were more powder like in the case of the NCNTs.
2.3.2 TEM Observations of the Fe Catalyst and CT Crystallinity
Ferrocene was used as an Fe precursor that was used as the growth
catalyst for CNTs. TEM observations were carried out on the Fe particles
encapsulated within the undoped CNTs and NCNTs to discern the properties of
the growth catalyst that remained after CNT synthesis. These observations
indicate that the Fe particles were crystalline and were fully encapsulated inside
the graphene matrix in both the undoped CNTs and NCNTs. Figure 2.3 shows
representative TEM images of Fe particles in undoped CNTs and NCNTs. In the
case of the undoped CNTs, the Fe particles are encapsulated within the innermost
walls of the CNTs while the NCNTs appear to grow in either direction of the Fe
catalyst.
The synthesized CNTs were crystalline and found to have diameters
ranging from 20 – 40 nm and lengths of 15 - 20 µm. Undoped CNTs had ordered
sidewalls while NCNTs exhibited disruptions in the graphene stacking consistent
with the incorporation of nitrogen. Nitrogen doping introduces pentagonal defects
causing dislocations in the hexagonal arrangement of the carbon atoms. Nitrogen
doping also caused a noticeable change in the length of crystallinity (Lc) of the
NCNTs, consistent with earlier reports.10

25
Figure 2.3 Representative TEM images of residual Fe catalyst particles encased within the graphitic sheets of CNTs. a) Encapsulated Fe in undoped CNTs. b) Fe encapsulated within 5 % NCNTs.
a) b)

26
2.3.3 Surface Area and Porosity of CTs
Surface area and porosity measurements were conducted on undoped
CNTs and NCNTs to evaluate the effect of an increased surface area and the
presence of micropores on ORR activity. Micropores are commonly defined as
pores that have widths < 25 Å. Mesopores are pores between 25 – 100 Å while
macropores have widths > 100 Å. Porosity and surface area measurements were
carried out on the undoped CNTs and NCNTs using nitrogen as the probe
molecule. These studies were conducted to determine if there was a difference in
the surface area hosted at micropores on NCNTs with increasing nitrogen content
that would be consistent with the findings of the Cai group. Earlier reports by Cai
et al28 discuss the activity of nitrogen doped carbons in relation to the
incorporation of micropores into the carbon matrix. Cai et al conducted a series of
experiments where carbon black was mixed with iron acetate and subjected to
heat treatment at 900 0C under a stream of ammonia. They expected the heat
treatment step to incorporate nitrogen atoms into the carbon and also facilitate the
formation and activation of micropores in the carbon due to the reaction between
the carbon and ammonia. Porosity experiments were also conducted on these
carbons before and after the heat treatment steps and the increased activity of the
resulting carbons was attributed partially to the formation of micropores in the
carbon. Carbons resulting from the heat treatment were found to exhibit no pores
between 8.5 – 9 Å and 21.5 – 22.5 Å while the surface area hosted by pores
between 7 – 22 Å was found to increase within the first 20 min of heat treatment
and subsequently decreased upon further exposure to the heat treatment

27
procedure. A majority ( ~60 %) of the surface area of these carbons was found to
be confined in the micropores while the rest was hosted in mesopores. There was
no evidence of the surface area hosted in macropores.
Figure 2.4 shows a plot of the differential surface area vs. the pore width
for undoped CNTs and NCNTs. It is seen that a majority of the pores in NCNTs
are confined to micropores. Remarkably, micropores at these NCNTs with
varying surface concentrations of nitrogen seem to be confined between 5 – 9 Å.
In the case of the undoped CNTs, the micropores seem to be confined in a
narrower range between 6 – 8 Å. Figure 2.4 also indicates minor differences
between the NCNT varieties at pore sizes between 8 – 20 Å. The presence of a
small Gaussian feature between 12 – 18 Å for the NCNTs indicates that some of
the surface area is confined to pores in that size range. Undoped CNTs were not
found to possess pore sizes greater than 9 Å. There was no evidence of the
presence mesopores or macropores on the CNTs.
BET surface area measurements were also conducted on the undoped
CNTs and NCNTs in order to evaluate the influence of an increase in surface area
on the ORR activity. The undoped CNTs had a surface area of 125 m2 / g while
the 4 % NCNTs had a surface area of 130 m2 / g. Surface area of the NCNTs were
found to increase corresponding to increasing nitrogen content with the 7.5 %
NCNTs having a surface area of 226 m2 / g.

28
2 4 6 8 10 12 140
20
40
60
80
100
120
Differential surface area / m
2Å
−1
g-1
Pore radius / Å
4 % NCNT 5 % NCNT 7.5 % NCNT Undoped CNT
Figure 2.4 Plot of differential surface area corresponding to pore sizes at undoped CNTs and NCNTs measured using nitrogen.

29
2.3.4 Raman Analysis
2.3.4.1 Raman Analysis at Fe Catalyzed CTs
Raman analysis was conducted on Fe catalyzed NCNTs to quantify the
degree of structural disorder on the NCNTs due to the incorporation of nitrogen
on the surface. Previous reports indicate distinct differences in the first order
Raman spectra between the undoped CNTs and systematically doped NCNTs.11
The quantification of D and G bands at 1355 cm-1 and 1585 cm-1 respectively
facilitates study of structural disorder at NCNTs as described by Cuesta et al.29
Ratios of the integrated intensities of the D and G bands were used to calculate
the in plane crystalline length (La) at NCNTs with varying nitrogen doping levels.
Raman analysis also enabled correlations between the degree of structural
disorder and ORR activity at Fe catalyzed NCNTs.10
2.3.4.2 Raman Analysis at i Catalyzed CTs
Raman spectra were acquired for Ni based NCNTs to elucidate the extent
of structural disorder at these carbons in an effort to compare them to Fe based
NCNTs. Figure 2.5 shows a detail of the D and G bands obtained from the Raman
spectra between 1000 - 2000 cm-1 at Ni based NCNTs. A qualitative comparison
of these spectra to Fe based NCNTs showed no discernible differences in the
general features of the D and G bands. Spectra were background subtracted and
the intensities of the D and G band were integrated to calculate ID / IG. This ratio
is a quantitative indicator of the degree of structural disorder at these NCNTs and
can be used to estimate La at these carbons as discussed in earlier sections.30 Edge
plane sites formed at the NCNT surface as a result of the structural disorder have

30
1000 1200 1400 1600 1800 2000
1.20 at.% N
2.96 at.% N
5.25 at.% N
3.73 at.% N
Wavenumbers / cm-1
Figure 2.5 Raman spectra showing the D and G bands on nitrogen doped Ni catalyzed NCNTs.

31
been attributed to an increased activity for ORR. Figure 2.6 shows a plot of the ID
/ IG ratio vs. the pyridinic concentration at Ni based NCNTs. Although there is a
decrease in the length of crystallinity from 3.4 nm to 2.8 nm demonstrated by an
increase in ID / IG for NCNTs with increased nitrogen doping levels, they are
quantitatively smaller than that of the Fe based NCNTs (3.4 nm to 1.7 nm) as
described by previous literature reports.11 These quantitative comparisons were
made for Ni and Fe based NCNTs that had NH3 constituting upto 7.5 % of the gas
flow stream.
2.3.5 XPS Analysis
2.3.5.1 XPS Analysis at Fe Catalyzed CTs
XPS studies on nitrogen doping at Fe catalyzed NCNTs indicate the
existence of three distinct peaks in the nitrogen area at 398.6 eV, 400.9 eV and
404.2 eV. These peaks are attributed to the pyrrolic, pyridinic and quaternary
nitrogen functionalities31 respectively. A fair degree of ambiguity exists in
assigning the peak at 404.2 eV to quaternary nitrogen. Peaks in the near vicinity
have been attributed to physisorbed nitrogen32 in the graphitic lattice and to
chemisorbed nitrogen oxide.33 A systematic study by Maldonado et al. on
increasing the nitrogen content on NCNTs revealed an increase in the pyridinic
fraction of the total nitrogen content on the NCNT surface.11
2.3.5.2 XPS Analysis at i Catalyzed CTs
XPS measurements were performed on systematically doped Ni based
NCNTs in an effort to elucidate the nature of the nitrogen species incorporated on
the surface and enable correlations to ORR activity. The XPS data on four

32
0.0 0.5 1.0 1.5 2.0 2.5 3.0
1.3
1.4
1.5
1.6
1.7
1.8
I D / I G
Pyridinic Nitrogen / at. %
ID / I
G
La
2.4
2.6
2.8
3.0
3.2
3.4
La / n
m
Figure 2.6 Plot of ID / IG vs. the pyridinic concentration at Ni based NCNTs. Also shown is the length of crystallinity (La) correlating degree of structural disorder to the pyridinic fraction of surface nitrogen.

33
different Ni based NCNTs with increasing nitrogen contents showed no
discernable differences in the oxygen and carbon regions when compared to Fe
based NCNTs. The nitrogen region, however, was found to be remarkably
different from that of the Fe based NCNTs.
Figure 2.7 shows XPS spectra with high resolution detail of the nitrogen
region for Ni based NCNTs with incremental levels of total surface nitrogen
concentration. It can be seen that the intensities of peaks assigned to the pyrrolic,
pyridinic and quaternary fractions of surface nitrogen are qualitatively different
from that reported by Maldonado et al11 for Fe based NCNTs. The peak near 404
eV as discussed in preceding sections is hereto referred to as the quaternary peak
although ambiguity exists as to its particular assignment. While the pyrrolic and
quaternary fraction increase almost linearly with an increase in the total nitrogen
concentration, the increase in the intensity of the pyridinic peak is less gradual
across the entire variety of Ni based NCNTs. These observations are in contrast to
observations at Fe based NCNTs as detailed in the subsequent discussion.
Constant flow rates of NH3 used in Ni catalyzed and Fe catalyzed NCNT
synthesis for each variety of carbon resulted in a lower level of nitrogen doping at
Ni catalyzed NCNTs. For example when NH3 constituted 7.5 % of the gas flow
stream during Fe catalyzed NCNT synthesis, the resulting carbon had 7.5 at. %
nitrogen incorporated on the surface. Under the same conditions for Ni catalyzed
NCNT synthesis, the resulting carbon only had 3.7 at. % nitrogen incorporated on
the surface.

34
390 395 400 405 410 415
1.20 at.% N
2.96 at.% N
3.73 at.% N
5.25 at.% N
Binding Energy / eV
Figure 2.7 XPS spectra showing the nitrogen region in nitrogen doped Ni catalyzed NCNTs.

35
Quantitative measurements were made on the XPS spectra obtained on the
Ni based NCNTs by integrating individual peaks that contributed to the total
nitrogen concentration against a Shirley background correction. Literature reports
and earlier experiments at the Stevenson research lab have strongly suggested the
surface concentration of pyridinic nitrogen as a major factor in promoting ORR at
Fe catalyzed NCNTs. A comparison of Ni based NCNTs and Fe based NCNTs
that had comparable total surface nitrogen content (4 % NCNT – Fe vs. 3.7 %
NCNT – Ni), showed that the distribution of individual nitrogen species
(pyridinic, pyrrolic and quaternary) that made up the total concentration was
found to be significantly different. Quaternary nitrogen concentrations were found
to be relatively minor at 1.2 % NCNTs and 3 % NCNTs but increase dramatically
at 3.7 % NCNTs and 5.3 % NCNTs. Earlier reports11 see a rise in the intensity of
the pyrrolic peak at higher overall nitrogen concentrations, but there are no
reports of a dramatic rise in the concentration of quaternary/ physisorbed nitrogen.
Figure 2.8 indicates that as the surface nitrogen content increases, the
pyrrolic and quaternary fractions in Ni based NCNTs rise in intensity and
constitute a majority of the nitrogen content. In the case of Fe based NCNTs, the
pyridinic fraction makes up more than 50 % of the total surface nitrogen
concentration of NCNTs with total nitrogen concentrations upto 7.5 at. % (3.3 at.
% pyridinic nitrogen in Fe catalyzed 7.5 % NCNTs). In contrast to the
observations at Fe based NCNTs, Ni based NCNTs seem to support pyridinic
fractions that constitute an average of 40 % of the total nitrogen content across a
variety of the NCNTs doped with systematically increasing concentrations of

36
0 1 2 3 4 5 60.0
0.5
1.0
1.5
2.0
2.5
3.0
3.5
4.0 Pyridinic nitrogen Pyrrolic and Quaternary nitrogen
Total Nitrogen / %
Pyridinic nitrogen / at. %
0.0
0.5
1.0
1.5
2.0
2.5
3.0
3.5
4.0
Pyrro
lic and Quaternary n
itrogen / a
t. %
Figure 2.8 Quantitative comparison of the different nitrogen fractions in nitrogen doped Ni catalyzed NCNTs based on XPS spectra.

37
nitrogen as shown in Figure 2.8. The relative concentration of the pyridinic
fraction decreases with increasing nitrogen doping levels with the pyridinic
fraction making up 2.1 at. % of the total nitrogen concentration at 5.2 % NCNTs.
These observations clearly indicate the differences between nitrogen doping at Fe
based NCNTs and Ni based NCNTs especially with regard to the pyridinic
nitrogen content.
2.3.6 Effect of Increasing Fe content in CTs on ORR
This section details experiments performed to discern effects of the Fe
catalyst in CNTs on ORR. The first set of experiments was carried out to study
the effect of Fe bound to the surface of the CNTs on ORR. A pre-determined
mass of 4 % NCNTs was drop cast onto a GC electrode and control ORR studies
were conducted in oxygen saturated 0.1 M H2SO4. The electrolyte solution was
then infused with predetermined volumes of iron sol prepared in accordance with
Sorum et al.34 Fe2+ spikes amounting to 1, 2 and 5 mM were injected into the
electrolyte with the ORR being run after every subsequent spike. The resulting
ORR peak potentials were then compared to the control experiment performed on
the blank carbon.
Cyclic voltammograms of ORR performed on the 4 % NCNT with
varying Fe spikes is shown in Figure 2.9. It was seen that while there was a slight
increase in the current density for ORR in the presence of an Fe spike, there was
no effective shift in the peak potential. The increase in current densities were also
found to plateau after the first 1 mM spike suggesting no strong correlations to the

38
1.2 1.0 0.8 0.6 0.4 0.2 0.0
0.00
-0.03
-0.06
-0.09
-0.12
-0.15
O2 sat. 0.1M H
2SO
4
ν = 20mV / s
Current / mA
Potential / V vs. NHE
4 % NCNT 1mM spike 4 % NCNT 2mM spike 4 % NCNT 5mM spike Control 4 % NCNT
Figure 2.9 Oxygen reduction at 4 % NCNTs with varying concentrations of Fe2+ added to the electrolyte solution.

39
presumed effect on an increased concentration of surface bound Fe2+ to an
enhanced activity for ORR.
Experiments were also performed to deduce whether an increased
concentration of Fe in the precursor mix led to an enhanced activity for ORR at 4
% NCNTs. Accordingly, the concentration of Fe in the precursor mix was
increased in predetermined amounts resulting in mass loadings of Fe in the as
prepared NCNTs from 11 wt. % to 22.6 wt. %. Fe mass loading in the 4 %
NCNTs was measured using TGA analysis. The resulting carbons were analyzed
for their activity towards ORR. It was seen that there was a negative effect to an
increase in the mass of Fe in NCNTs. Figure 2.10 shows a plot of the peak
potential for ORR for each of the 4 % NCNTs synthesized using varying masses
of Fe in the precursor mix. The peak potential for ORR shifts negative by ~ 100
mV with an increase in 10 wt. % Fe. XPS measurements conducted on the same
carbon samples indicated that there was a decrease in the pyridinic nitrogen
fraction by 0.5 at. % corresponding to a decrease in total surface nitrogen content
by 1.2 at. % between NCNTs with Fe loadings of 11 wt. % and 22.6 wt. %. These
observations suggest a strong correlation between oxygen reduction efficiency
and the pyridinic surface nitrogen content rather than Fe content in the NCNTs.
2.3.7 Electrochemical Analysis at CTs
2.3.7.1 ORR at Fe catalyzed CTs
The activity of Fe catalyzed NCNTs and undoped CNTs for ORR was
tested in oxygen saturated 0.1 M H2SO4. Figure 2.11 shows representative cyclic
voltammograms for oxygen reduction at undoped CNTs and 4 % and 7.5 %

40
30 35 40 45 50 55 60
0.30
0.32
0.34
0.36
0.38
0.40
0.42
Potential / V vs. NHE
Fe loading (mg) in NCNF Precursor
Ep in O2 sat. 0.1 M H
2SO
4
Figure 2.10 Plot showing correlation between peak potential for ORR activity corresponding to mass of iron precursor used to synthesize NCNTs.

41
NCNTs. The peak potentials for ORR at 4 % and 7.5 % NCNTs are shifted
positive by 580 mV and 730 mV respectively compared to the undoped CNTs.
Although the commonly accepted explanation for this increase in activity in
NCNTs is attributed in general to nitrogen doping, quite a few hypotheses exist as
to the exact nature of the active sites that adsorb and reduce oxygen.
Attempts to find a correlation between the surface area and ORR activity
at the NCNTs and undoped CNTs were not successful, contradictory to previous
reports that attempted to explain enhanced activity at nitrogenated carbons to
increased surface areas.28 While the difference in surface areas between the
undoped CNTs and 4 % NCNTs was only 5 m2 / g, the peak potential for ORR in
0.1 M H2SO4 was shifted positive by 580 mV. Peak potentials were shifted
positive by 150 mV between 4 % NCNTs and 7.5 % NCNTs although the
difference in surface areas was 96 m2 / g indicating no strong correlations
between surface area and activity at undoped CNTs and NCNTs. While the
undoped CNTs and NCNTs had pore size distributions within the same range as
described in a previous section dealing with surface area and porosity, the ORR
activity at NCNTs is significantly higher than undoped CNTs as shown in Figure
2.11. These observations suggest that the presence of micropores at these carbons
does not seem to be an influencing factor in the enhanced activity for ORR at
NCNTs.
The cyclic voltammetry data viewed in conjunction with the Raman
analysis reveals that there was an inverse relationship between the activity for
ORR at CNTs and NCNTs with La values at these carbons. This is evidenced by a

42
0.6 0.4 0.2 0.0 -0.2 -0.4-0.1
0.0
0.1
0.2
Current / mA
Potential /V vs. NHE
Undoped CNT 4 % NCNT - Fe 7.5 % NCNT - Fe
O2 sat. 0.1 M H
2SO
4
ν = 20 mV / s
Figure 2.11 ORR activity for undoped CNTs and NCNTs in oxygen saturated 0.1 M H2SO4. ν = 20 mVs-1

43
decrease in La from 3.4 nm to 1.7 nm for the 4 % NCNTs and 7.5 % NCNTs
respectively. These studies provide strong arguments that systematic induction of
structural disorder on the NCNT surface characterized by an increase in edge
plane sites corresponding to nitrogen doping plays an important role in the
adsorption and reduction of oxygen at these sites.
2.3.7.2 ORR at i Catalyzed CTs
Figure 2.12 shows representative cyclic voltammograms for ORR at Ni
catalyzed NCNTs containing 3.7 at. % N compared to Fe based undoped CNTs
and NCNTs containing 4 and 7.5 at. % N in oxygen saturated 0.1 M H2SO4. The
Ni catalyzed NCNTs are more active for ORR compared to Fe catalyzed undoped
CNTs. The peak potential for ORR was shifted positive by ~360 mV for the Ni
catalyzed NCNTs against the undoped CNTs. The peak potential for ORR at Fe
based 4 % NCNTs was shifted positive by ~ 220 mV compared to the Ni based
NCNTs. While the 3.7 % Ni based NCNTs had a slightly lower overall surface
nitrogen concentration than the 4 % NCNTs, the pyridinic fraction at the Ni
NCNTs was found to be 1.5 at. % compared to 2.1 at. % found in Fe based 4 %
NCNTs offering a correlation for ORR activity to the amount of pyridinic
nitrogen.
The voltammetry data correlate well with Raman observations at the Ni
based NCNTs. Raman analysis suggests a lower degree of structural disorder
corresponding to an increase in surface nitrogen content at Ni based NCNTs
compared to Fe based NCNTs (as detailed in the Raman analysis section). This
results in a smaller number of edge plane sites that are more active than regular

44
0.8 0.6 0.4 0.2 0.0 -0.2 -0.4-0.05
0.00
0.05
0.10
0.15
0.20
0.25
Current / mA
Potential /V vs. NHE
Undoped CNT 3.7 % NCNT - Ni 4.0 % NCNT - Fe 7.5 % NCNT - Fe
O2 sat. 0.1 M H
2SO
4
ν = 20 mV / s
Figure 2.12 Comparison of cyclic voltammograms for ORR at undoped CNTs and NCNTs synthesized using Fe and Ni precursors in oxygen saturated 0.1 M H2SO4. ν = 20 mVs-1.

45
basal plane sites for adsorption and reduction of oxygen. Figure 2.13 shows a plot
of 1 / La values calculated for Fe and Ni based NCNTs with respect to Ep values
for ORR at the corresponding carbons. A direct correlation between these two
parameters emphasizes the effect of edge plane sites on ORR activity.
2.3.7.3 Effect of Pyridinic itrogen on ORR
A plot correlating the amount of pyridinic nitrogen at Ni and Fe based
NCNTs to the peak potential for ORR at these carbons is shown in Figure 2.14.
The pyridinic fraction was calculated for each of the NCNTs by performing a
quantitative analysis of the peak near 400 eV with respect to the total nitrogen
concentration on the NCNT surface. It is seen that the peak potential for ORR
shifts by ~750 mV corresponding to an increase of 2.7 at. % pyridinic nitrogen
across the entire variety of carbons. This corresponds to a positive shift of ~ 295
mV with respect to an increase in each at. % of pyridinic nitrogen in the Fe based
NCNTs. No strong correlations were found between pyrrolic and quaternary
nitrogen contents with ORR activity.
Figure 2.14 shows that the Ni based NCNTs and the Fe based NCNTs
have ORR activities that track well with the pyridinic nitrogen content (R2 =
0.99). A lesser degree of correlation (R2 = 0.94) was seen with ORR activities
compared to total nitrogen content as seen in Figure 2.15. These results are a clear
indication that the ORR activity at these NCNTs is independent of the Fe or Ni
catalyst that was used in the synthesis of these NCNTs. Earlier reports by
Maldonado et al.11 have correlated the amount of pyridinic fraction of the total
nitrogen content to the amount of edge plane sites created due to the nitrogen

46
0.1 0.2 0.3 0.4 0.5 0.6 0.7
-0.2
0.0
0.2
0.4
0.6
1 / La
Ep / V vs. NHE
1 / La (nm
-1)
R2 = 0.99
Figure 2.13 Plot showing correlation between peak potential for ORR activity corresponding to edge plane content calculated from Raman spectra at Fe and Ni based NCNTs. ORR activity was measured in oxygen saturated 0.1 M H2SO4.

47
0.0 0.5 1.0 1.5 2.0 2.5 3.0
-0.2
0.0
0.2
0.4
0.6
R2 = 0.99
Ep /V vs. NHE
Pyridinic Nitrogen / at. %
Undoped CNT - Fe
1.2 % NCNT - Ni
2.9 % NCNT - Ni
3.7 % NCNT - Ni
4 % NCNT - Fe
Pyridinic nitrogen
Slope = 295 mV / at. % 7.5 % NCNT - Fe
Figure 2.14 Plot showing correlation between peak potential for ORR activity corresponding to the pyridinic nitrogen fraction at Fe and Ni based NCNTs. ORR activity was measured in oxygen saturated 0.1 M H2SO4.

48
0 2 4 6 8
-0.2
0.0
0.2
0.4
0.6
Undoped CNT - Fe1.2 % NCNT - Ni
4 % NCNT - Fe
7.5 % NCNT - Fe
Ep /V vs. NHE
Total Nitrogen / at. %
Total nitrogen
R2 = 0.94
2.9 % NCNT - Ni
3.7 % NCNT - Ni
Figure 2.15 Plot showing correlation between peak potential for ORR activity corresponding to the total nitrogen content at Fe and Ni based NCNTs. ORR activity was measured in oxygen saturated 0.1 M H2SO4.

49
doping in conjunction to Raman analysis at NCNTs. These background studies
and the present set of data as shown in Table 2.1 compile a strong correlation for
ORR activity to the pyridinic nitrogen content and the presence of edge plane
sites at the NCNT surface.

50

51
2.4 COCLUSIOS
The ability to tune the physicochemical properties such as length,
diameter, structural orientation and composition of as grown Fe or Ni catalyzed
NCNTs was established. Structural and compositional variations brought upon by
systematic nitrogen doping on CNTs as quantified by Raman and XPS analysis
were correlated to the enhanced activity for ORR at the surface of these NCNTs.
These studies provide fundamental knowledge that can be used in understanding
and manipulating NCNTs for use as metal catalyst supports for ORR as dealt with
in subsequent chapters.

52
2.5 REFERECES
1. Planeix, J. M.; Coustel, N.; Coq, B.; Brotons, V.; Kumbhar, P. S.; Dutartre, R.; Geneste, P.; Bernier, P.; Ajayan, P. M. J. Am. Chem. Soc. 1994, 116, 7935.
2. McCreery, R. L. Carbon Electrodes: Structural Effects on Electron Transfer Kinetics. In Electroanalytical Chemistry; Bard, A. J., Ed.; Dekker: New York, 1991; Vol. 17.
3. Glenis, S.; Nelson, A. J.; Labes, M. M. Journal of Applied Physics 1999, 86, 4464.
4. Endo, M.; Hayashi, T.; Hong, S. H.; Enoki, T.; Dresselhaus, M. S. J. Appl. Phys. 2001, 90, 5670.
5. Berber, S; Kwon, Y-K.; Tomanek, D. Phys. Rev. Lett. 2000, 84, 4613.
6. Nevidomskyy, A. H.; Csanyi, G.; Payne, M. C. Phys. Rev. Lett. 2003, 91, 105502.
7. Kaneko, K.; Ishii, C.; Ruike, M.; Kuwabara, H. Carbon, 1992, 30, 1075.
8. Sharda, T.; Soga, T.; Jimbo, T.; Umeno, M. Diamond Relat. Mater. 2000, 9, 1331.
9. Maldonado, S.; Stevenson, K. J. J. Phys. Chem. B 2004, 108, 11375.
10. Maldonado, S.; Stevenson, K. J. J. Phys. Chem. B 2005, 109, 4707.
11. Maldonado, S.; Morin, S.; Stevenson, K. J. Carbon 2006, 44, 1429.
12. Brezina, M.; Jindra, J.; Mrha, J. Coll. Czech. Chem. Comm. 1967, 33, 2363.
13. Boehm, H. P.; Mair, G.; Stoehr, T.; DeRincon, A. R.; Tereczki, B. Fuel 1984, 63, 1061.
14. Lahaye, J.; Nanse, G.; Bagreev, A.; Strelko, V. Carbon 1999, 37, 585.
15. Sjostrom, H.; Stafstrom, S.; Boman, M.; Sundgren, J. E. Phys. Rev. Lett. 1995, 75, 1336.
16. Stohr, B.; Boehm, H. P.; Schlogl, R. Carbon 1991, 29, 707.

53
17. Wang, H.; Cote, R.; Faubert, G.; Guay, D.; Dodelet, J. P. J. Phys. Chem. B 1999, 103, 2042.
18. Gooding, J. J. Electrochimica Acta 2005, 50, 3049.
19. Chou, A.; Bocking, T.; Singh, N. K.; Gooding, J. J. Chem. Commun. 2005, 7, 842.
20. Banks, C. E.; Moore, R. R.; Davies, T. J.; Compton, R. G. Chem. Commun. 2004, 16, 1804.
21. Salimi, A.; Banks, C. E.; Compton, R. G. Analyst, 2004, 129, 225.
22. Strelko, V. V.; Kuts, V. S.; Thrower, P. A. Carbon 2000, 38, 1499.
23. Sidik, R. A.; Anderson, A. B.; Subramanian, N. P.; Kumaraguru, S. P.; Popov, B. N. J. Phys. Chem. B 2006, 110, 936.
24. Jouen, F.; Charreteur, F.; Dodelet, J. P. J. Electrochem. Soc. 2006, 153, A689.
25. Sljukic, B.; Banks, C. E.; Compton, R. G. -ano Lett. 2006, 6, 1556.
26. Lyon, J. L.; Stevenson, K. J. Langmuir 2007, in press.
27. Schmidt, J.; Gasteiger, H. A; Stab, G. D.; Urban, P. M.; Kolb, D. M.; Behm, R. J. J. Electrochem. Soc. 1998, 145, 2354.
28. Jaouen, F.; Lefevre, M.; Dodelet, J. P.; Cai, M. J. Phys. Chem. B 2006, 110, 5553.
29. Cuesta, A.; Dhamelincourt, P.; Laureyns, J.; Martinezalonso, A.; Tascon, J. M. D. Carbon 1994, 32, 1523.
30. Sjostrom, H.; Stafstrom, S.; Boman, M.; Sundgren, J. E. Phys. Rev. Lett. 1995, 75, 1336.
31. Stohr, B.; Boehm, H. P.; Schlogl, R. Carbon, 1991, 29, 707.
32. Choi, H. C.; Park, J.; Kim, B. J. Phys. Chem. B 2005, 109, 4333.
33. Biniak, S.; Szymanski, G.; Siedlewski, J.; Swiatkowski, A. Carbon 1997, 35, 1799.

54
34. Sorum, C. H. J. Am. Chem. Soc. 1928, 50, 1263.

55
CHAPTER 3
Synergistic Assembly of Dendrimer Templated Catalysts and itrogen Doped Carbon anotube Electrodes for
Oxygen Reduction
3.1 ITRODUCTIO
High surface area carbons such as Ketjenblack and Vulcan carbon used as
supports for electrocatalysis applications are beneficial in terms of providing
electronic conductivity and high dispersion of metal catalysts.1,2 Unfortunately,
the multitude of preparation strategies for carbon supported catalysts makes it
difficult to understand the role of the carbon support on electrocatalysis including
the degree of catalyst utilization, promotion of catalyst-support interactions, and
the stability of the catalyst towards dissolution, agglomeration, and other
degradation processes. Moreover, carbon supports are typically prepared via
aggressive processes for activation including refluxing in concentrated acids3
(HNO3, H2SO4, HCN) or strong oxidizing agents4 (H2O2, KMnO4) to create
surface functionalities (carbonyl, carboxylate, ester-like oxygen, alcohol) to
facilitate more efficient anchoring and loading of the metal catalyst via
impregnation5, coprecipitation
6, microemulsion
7 or sonochemical
8 methods. The
activation methods often significantly degrade the preferred structural and
compositional properties of both the carbon support and active metal catalyst and
have typical drawbacks of large average catalyst size, broad size distribution, and
poor reproducibility.9 Of vital importance is the need to significantly improve

56
catalyst dispersion and utilization (typically <20% is catalytically active) on the
carbon support, and to reduce catalyst sintering and poisoning processes. Carbon
nanotubes (CNTs) have attracted significant interest as catalyst supports after
their recent discovery,10 as they have optimal electronic conductivity, proper
surface area and pore structure.11,12,13,14
While as synthesized CNTs have some of
the desirable properties required for supports, efficient anchoring and utilization
of loaded metal catalysts is still achieved through extensive surface modification
of the CNTs15,16,17
using some of the aggressive and time consuming conditioning
protocols listed above. To this end, we have been exploring facile synthetic
strategies for preparing both robust, high surface area nitrogen doped CNT
supports18,19
and active metal catalysts with well controlled properties that
circumvent the majority of processing steps required by more traditional loading
routes, such as washing, drying, calcination, and reduction.
This chapter describes the use of nitrogen doped carbon nanotube (NCNT)
supports 19 that strongly bind size monodisperse mono- and bimetallic dendrimer
encapsulated catalysts prepared by a dendrimer template method20 without
necessitation for covalent21 or non-convalent
22 functionalization of the carbon
support prior to catalyst loading. The dendrimer template method of synthesizing
nanoparticles is versatile since a variety of nanoparticle properties such as size,
structure and composition23 can be modified with relative ease compared to
various other methods24,25,26
employed to synthesize nanoparticles. The ability to
modify properties of the interior and exterior functional groups in a dendrimer
template facilitates control of the way in which precursor metal ions coordinate

57
within the dendrimer template. This is due to a difference in basicity between the
interior and exterior functional groups in the dendrimer. For example, in the case
of amine terminated dendrimers, the interior amines have a pKa value of 6.30
while the exterior amines have a pKa value of 9.23 which facilitates easier
protonation of the exterior amines and thus allows for selective coordination of
metal ions with the interior amines. The presence of specific functionalities on the
dendrimer exterior also provides an efficient way to anchor the resultant
encapsulated nanoparticle to a specific substrate. For example the Crooks group
has shown that amine terminated PAMAM dendrimers show strong adsorption to
HOPG.27 The use of a particular dendrimer generation allows for efficient control
of size of the nanoparticle based on the number of available interior functional
groups that coordinate with metal ions from the precursor.23,24,25
While the
diameter of the dendrimer molecule increases logarithmically with each
dendrimer generation, the number of functional groups increases exponentially.
For this particular study, PAMAM generation 4, amine terminated dendrimers
(G4-NH2) were used. The number (62) of interior functional groups in G4
dendrimers was best suited to synthesize ~2 nm size nanoparticles and the amine
terminated peripheral functional groups allowed for facile adsorption onto
NCNTs.
Scheme 1 demonstrates the basic approach for the assembly of the CNT-
DEN composites. The advantage of this scheme is that the compositional and
structural properties of both the carbon support 18 and dendrimer encapsulated Pt

58
Scheme 3.1 Preparation of amine terminated PAMAM dendrimer encapsulated Pt nanoparticles (G4-NH2 Pt-DENs) and adsorption onto carbon nanotube (CNT) supports.

59
nanoparticle (Pt-DEN) catalyst can be reproducibly prepared and synergistically
tuned to directly assemble carbon-supported catalyst composites via adsorption
from aqueous solution. This chapter focuses on the uniform dispersion and
loading of dendrimer encapsulated mono- and bimetallic catalysts supported on
undoped CNTs and NCNTs that show enhanced catalytic behavior for the oxygen
reduction reaction (ORR) in fuel cells. The ability to prepare high quality, well
dispersed supported metal catalysts, with sizes in the 2-5 nm range that avoid
painstaking and lengthy synthetic and post processing activation steps is required
to advance electrocatalysis performance.

60
3.2 EXPERIMETAL
3.2.1 Synthesis of Monometallic Dendrimer Encapsulated anoparticles
Fourth generation, amine terminated, poly(amidoamine) PAMAM
dendrimers (G4-NH2) (Dendritech) were used as templates to prepare Pt-DENs
and Pd-DENs. The G4-NH2 templates were received in a 10 % methanol solution
that was removed under vacuum prior to DEN synthesis. K2PtCl4 and K2PdCl4
(Aldrich) were used as precursors for Pt and Pd DENs respectively.27 A carefully
measured volume of G4-NH2 dendrimers was dried off methanol and suspended
in a pH adjusted HCl solution (pH 5 for Pt-DENs and pH 3 for Pd-DENs)
resulting in 5 – 20 µM dendrimer solutions. This pH adjustment facilitated in
selective protonation of the exterior amines. Aqueous 0.1 M K2PtCl4 or 0.1 M
K2PdCl4 constituting 40 mol equivalent of the dendrimers was added to the
dendrimer solution. A slight increase in pH resulting from the addition of the
metal precursors was countered with addition of small aliquots of dilute 0.1 M
HCl until the acidity was restored to the original pH levels. The resulting solution
was left to stir for 72 hrs due to sluggish co-ordination times between the Pt ions
and interior amines.28,29
Pd co-ordination rates were much faster with the reaction
happening within 30 min. A 20 mol excess (w.r.t metal ion concentration in
solution) of 0.5 M NaBH4 (Fisher) was added drop by drop after allowing for
appropriate co-ordination times. The resulting DEN solutions were dark brown in
color which is consistent with the formation of nanoparticles by reduction. After
reduction the DEN solutions were adjusted to pH 8 to prevent agglomeration of
the nanoparticles. Following pH adjustment the DEN solutions were subjected to

61
dialysis against 10 L of 18 MΩ cm nanopure water for 12 hrs to remove
impurities resulting from the synthesis. Cellulose dialysis sacks with MWCO
12000 (Sigma) were employed in the dialysis step.30 Dialyzed DEN solutions
were stored in acid washed airtight vials prior to further analysis.
3.2.2 Synthesis of Bimetallic Dendrimer Encapsulated anoparticles
Bimetallic PdAu DENs were synthesized primarily to compare ORR
activity at a non Pt based catalyst and to gain insight into ORR activity at a Pd
alloy surface. A carefully measured volume of G4-NH2 dendrimers was dried off
methanol and suspended in an aqueous HCl solution that was adjusted to pH 3
resulting in a 20 µM dendrimer solution. A 0.1 M K2PdCl4 solution constituting
20 mol equivalent of the dendrimers was added to the dendrimer solution and the
pH was adjusted back to 3. Pd ions were allowed to coordinate with the interior
amines for 30 min after which a 20 mol equivalent of 0.1 M HAuCl4 was added
and the solution allowed to stir for an additional 10 min. A 20 mol excess 0.5 M
NaBH4 solution was added drop by drop after stirring was completed and pH of
the resultant DEN solution was adjusted to 8 to prevent agglomeration. The
resulting DEN solution was brown in color and was dialyzed against 10 L of 18
MΩ nanopure water for 12 hrs to remove impurities resulting from the synthesis.
The same type of dialysis sacks used for the monometallic DENs (cellulose with
12000 MWCO) was used in the dialysis step. PdAu DEN solutions were stored in
acid washed airtight vials prior to further analysis. While a number of synthesis
protocols31 like co-complexation and sequential loading using quaternized

62
dendrimers have been utilized to prepare bimetallic particles, this present scheme
was suited for studies on ORR activity at PdAu surfaces.
3.2.3 Synthesis of Undoped CTs and CTs
CNTs were prepared using the floating catalyst chemical vapor deposition
method18,19
described in chapter 2. Briefly, xylene (Aldrich) as carbon source and
ferrocene (Aldrich) as catalyst were used for the growth of the undoped CNTs
while a pyridine (Fisher) and ferrocene precursor combination was used for the
synthesis of nitrogen-doped CNTs. The use of a pyridine precursor allowed for a
controlled doping of ~ 4 at. % N on the NCNT surface. Higher surface nitrogen
concentrations (5-10 at. % N) were obtained by introducing a regulated stream of
ammonia gas (Aldrich) into the CVD furnace system along with the pyridine and
ferrocene precursors. As grown undoped CNTs and NCNTs were carefully
extracted from the inner walls of the quartz tube used as a reaction chamber and
stored in airtight vials prior to characterization and further use.
3.2.4 Adsorption of Pt-DEs on CTs and CTs
Pt-DEN standard solutions ranging from 5-20 µM were prepared and
characterized using UV-Vis spectroscopy using a Varian Cary 5000 instrument by
monitoring the featureless absorption at 350 nm that reports on the formation and
concentration of colloidal Pt. A calibration curve from 0-20 µM was constructed
to follow the adsorption of the Pt-DENs onto the various CNT supports by
monitoring the decrease in absorbance of the supernatant at 350 nm as a function
of immersion time from 1 to 24 h for a 1 mg/ml carbon sample dispersed in a
stirred solution containing known amounts of Pt-DENs.32 The absorbance at 350

63
nm has been attributed to the presence of colloidal Pt resulting from the
synthesis.27 A calibration curve was constructed from absorbance values at 350
nm from Pt-DEN solutions of varying concentrations from 5-20 µM.
Absorbance readings were taken every 30 min during the adsorption
process by first centrifuging the solution for 2 min so as not to withdraw any of
the CNTs suspended in solution. A 3 ml volume of the supernatant was then
carefully withdrawn from solution and placed in a quartz cuvette used for
absorbance measurements. After the measurements were completed, the
supernatant was injected back into the CNT/ DEN solution and the adsorption
process was allowed to continue accompanied by stirring. Nylon filters (GE corp.)
with an average of 0.2 µm pore size were employed in the filtration process.
Background experiments revealed that the filters did not adsorb any significant
quantities of the DENs. After the initial 3 hrs, measurements were taken every
hour since the adsorption slowed down considerably. While the NCNTs used in
this experiment were hydrophilic and went into solution immediately after
introduction, the undoped CNTs were not and took longer times to be completely
wet in solution. Care was taken to ensure that CNTs were well dispersed before
they were introduced into the DEN solution. In the case of 7.5 % NCNTs, the
DEN solution was regenerated with a fresh solution after absorbance
measurements indicated complete adsorption of DENs from the initial solution.
These studies were conducted to measure the maximum amount of adsorption of
DENs at the NCNTs. Once the adsorption process was deemed complete, the
CNT / DEN solutions were centrifuged and the supernatant was extracted

64
carefully. The resultant CNT/ Pt-DEN composites were washed with de ionized
water and allowed to dry. Pt-DEN composites were stored in air tight vials prior
to further analyses.
3.2.5 Electron Microscopy
Transmission electron microscope (TEM) analysis of the CNTs was
performed on a JEOL 2010F instrument operating at 200 kV. DEN samples were
drop cast on a Cu TEM grid covered with a thin layer of amorphous carbon and
allowed to dry overnight in a dessicator prior to TEM analysis. CNT samples with
adsorbed DENs were allowed to dry after recovery from the DEN solution and
suspended in anhydrous ethanol prior to drop casting on a lacey carbon covered
Cu TEM grid.
3.2.6 Thermo Gravimetric Analysis
Thermo gravimetric analysis (TGA) was performed using a Perkin Elmer
7000 TGA. CNT/ DEN samples (3-5 mg) were held in platinum pans heated to
800 C in flowing air (Praxair, 99.998%) at a rate of 5
0C / min. The resulting
mass contained Fe2O3 from the residual Fe catalyst in the CNTs and Pt from Pt-
DENs. Control TGA studies performed using particular varieties of the blank
CNTs enabled the mass of hematite to be subtracted facilitating calculations of the
mass loading of Pt on CNTs.
3.2.7 Electrochemistry at CT/ DE Composites
Electrochemical measurements were carried out on an EG&G Instruments
263A potentiostat equipped with a Pine Instruments MSRX controller for rotating
disk electrode (RDE) measurements. Data acquisition and analysis was performed

65
on a Corrware (Scribner Associates) software package. CNT/ DEN sample
slurries prepared with 0.15 wt. % nafion in anhydrous ethanol and de-ionized
water were drop cast as a film on a glassy carbon (GC) RDE (0.5 cm diameter,
Pine Instruments) polished to a mirror finish and allowed to dry under a stream of
Ar (Praxair 99.98%) prior to electrochemical measurements.
Cyclic voltammograms were obtained in a standard three electrode cell
with a gold counter electrode and an Hg/Hg2SO4 reference electrode in O2
(Praxair) saturated 0.1 M H2SO4 prepared with deionized water (>18 MΩ cm). All
potentials were converted to NHE for comparison to literature values. Prior to
oxygen reduction, the CNT/ DEN film was cycled between 0.8 and -0.2V in order
to make the film hydrophilic and achieve steady state voltammograms. This step
was primarily used for undoped CNT/ DEN catalyst films that required atleast 10
CV cycles before exhibiting hydrophilicity. NCNTs on the other hand are easily
wettable due to the presence of positively charged nitrogen groups on the surface
and to the existence of more edge plane sites than the undoped CNTs.
Rotating disk electrode measurements were performed on the same films
after the completion of cyclic voltammetry measurements. The electrode was
rotated between 250 and 2000 rpm in increments of 250 rpm except for the
potentiodynamic voltammogram obtained at 1600 rpm.33 The electrolyte solution
was replenished with O2 in between two potentiodynamic measurements and also
between consecutive CVs. Potentials were typically scanned from 1 V vs. NHE to
0 V vs. NHE.

66
3.3 RESULTS AD DISCUSSIO
3.3.1 Structure and Composition of DEs
A representative TEM image in Figure 3.1 shows G4 NH2 Pt-DENs from a
20 µM solution. The particles are well dispersed and do not exhibit any
agglomeration. The corresponding histogram reveals that the particle size
distribution is narrow and nearly monodisperse consistent with earlier reports.27
The average diameter of the Pt nanoparticles was found to be 2.2 ± 0.3 nm. Pd-
DENs had an average diameter of 2.0 ± 0.4 nm (Figure 3.2) while the PdAu
DENs (Figure 3.3) had average diameters of 2.3 ± 0.4 nm. Energy dispersive
spectroscopy (EDS) analysis performed on single PdAu nanoparticles (Figure 3.4)
showed that these were bimetallic and had compositions of Pd 31 ± 5 % and Au
69 ± 5 %. The standard deviations result from challenges associated with
obtaining reliable EDS spectra from particles smaller than 2 nm.31 The TEM
images also show that the DENs are crystalline as evidenced from observations of
lattice structures.
3.3.2 Analysis of Pt-DE Adsorption at Undoped CTs and CTs
Pt-DEN adsorption measurements were performed on undoped CNTs and
NCNTs by monitoring the absorbance at 350 nm over 24h. Figure 3.5 shows a
representative adsorption profile for Pt-DENs on 4 % NCNTs over a 24h period.
The absorbance between 200- 800 nm is seen to decrease consistently as a
function of time corresponding to a lowering of the DEN concentration in the
supernatant. The broad absorbance between 300 – 800 nm has been associated
with the presence of colloidal Pt and is seen to decrease until no significant

67
Figure 3.1 Representative TEM image of Pt –DENs. The histogram depicts a typical particle size distribution for the Pt-DENs.
1.4 1.6 1.8 2.0 2.2 2.40
5
10
15
20
25
30
Co
un
ts
Particle Diameter /nm

68
Figure 3.2 Representative TEM image of Pd –DENs. The histogram depicts a typical particle size distribution for the Pd-DENs.
1.4 1.6 1.8 2.0 2.2 2.40
5
10
15
20
25
30
Co
unts
Particle Diameter / nm

69
Figure 3.3 Representative TEM image of PdAu –DENs. The histogram depicts a typical particle size distribution for the PdAu-DENs.
1.4 1.6 1.8 2.0 2.2 2.4 2.60
5
10
15
20
25
30
Cou
nts
Particle Diameter / nm

70
Figure 3.4 Representative energy dispersive spectrum for PdAu- DENs.
Au
Au PdPd Au
Au
Pd
Au
Au
Au
Au
Pd Au
Au
Pd
Au
Au
Au
Au
Au
Au
2 4 6 8 10
Full Scale 705 cts Cursor: 2.280 keV (31 cts) keVFull Scale 705 cts Cursor: 2.280 keV (31 cts) keVFull Scale 705 cts Cursor: 2.280 keV (31 cts) keV
Spectrum 1

71
Figure 3.5 UV-Vis spectra showing cumulative adsorption measurements observed over 24 hrs for the adsorption of Pt-DEN on 4 % NCNTs.
200 300 400 500 600 700 800
A
bso
rba
nce
/ a
.u.
Wavelength / nm

72
absorbance exists over the 24h period. This corresponds to the adsorption of
virtually all Pt-DENs from solution on the NCNT surface. The appearance of a
broad shoulder at 260 nm has been attributed to the absorbance at unreduced Pt2+
that remains bound to the exterior amine groups of the dendrimers.27 Figure 3.6
shows a picture depicting a visual representation of the Pt-DEN adsorption
process. Vial A contained a 20 µM solution of Pt-DENs which were dark brown
in color consistent with the presence of colloidal Pt in solution. Vial B contained a
1 mg/ ml of 4 % NCNTs dispersed in the Pt-DEN solution. The NCNTs seem
well dispersed in the solution showing no visual evidence of agglomeration. Vial
C represents the NCNT/ Pt-DEN solution after 24h of stirring the NCNT/ Pt-DEN
solution. The supernatant is transparent, consistent with the adsorption of Pt-
DENs from the solution onto the NCNT surface.
The adsorption behavior of the G4-NH2-terminated Pt-DENs for undoped
CNTs, 4 % NCNTs and 7.5 % NCNTs corresponding to different initial bulk Pt-
DEN solution concentrations for a 24 h period is shown in Figure 3.7. Adsorption
experiments were conducted in triplicate with Pt-DENs in the concentration range
of 5-20 µM. For each concentration, there was an increase in the percentage
adsorbed with increased immersion time. The extent of uptake of Pt-DEN
gradually decreases, finally reaching a limiting value as indicated by the plateau.
As discussed in section 3.2.4, UV-Vis data was used to construct adsorption
isotherms and estimate adsorption parameters by fitting to a Langmuir based
model for the adsorption of Pt-DENs. All of the curves in Figure 3.7 have a
similar shape, only differing in the amount of Pt-DEN adsorbed. The adsorption

73
Figure 3.6 Picture representing the Pt-DEN adsorption process on NCNTs. A) 20 µM Pt-DENs. B) Pt-DENs with NCNTs suspended in solution. C) NCNT/ Pt-DEN suspension after 24 hrs showing all DENs having been adsorbed onto the NCNTs rendering the solution colorless.
A B C

74
0 5 10 15 20
0.00
0.03
0.06
0.09
0.12
0.15
0.18
0.21
nm (µmol/g) K (L µmol
-1)
1. 0.37 ± 0.07 8 ± 1
2. 0.34 ± 0.03 6 ± 1
3. 0.29 ± 0.02 3 ± 1
P
t D
EN
ad
so
rbe
d / µ
mo
lg-1
Pt DEN Solution Concentration / µM
7.5 % NCNT (1)
4 % NCNT (2)
Undoped CNT (3)
Figure 3.7 Adsorption isotherms for G4-NH2 Pt-DEN adsorption on undoped CNT and NCNT supports.

75
of Pt-DENs onto 7.5 % NCNTs was almost twice as fast as that for undoped
CNTs for the same immersion time, especially within the first hour. Adsorption of
the Pt-DENs always went to completion for these specific carbons. The solutions
were transparent after 24 h, and showed no UV-Vis absorbance between the 250-
800 nm range. It should be noted the limited solubility of Pt-DENs in aqueous
solution (ca. 20 µM) restricts the range of the adsorption isotherm studies and
therefore complete saturation behavior for the adsorption isotherms was not
observed. However, trends in the relative characteristics of Pt-DEN adsorption on
the various CNT supports are easily discerned.
Pt-DEN adsorption values and adsorption equilibrium constants for 4 %
NCNTs, 7.5 % NCNTs and undoped CNT/ Pt-DEN composites calculated from
the isotherms are reported in the inset of Figure 3.7. The adsorption of the G4–
NH2 Pt-DENs was attributed to the strong van der Waals interactions 34 with edge
plane sites at NCNTs. One of the factors that hinders the adsorption of –NH2
terminated Pt-DENs on the undoped CNTs is the relative difficulty of wetting the
CNTs in solution. NCNTs on the other hand are easily wettable due to the
presence of positively charged nitrogen groups on the surface and to the existence
of more edge plane sites.18 These observations are supported by Raman
spectroscopic studies from Chapter 2 that estimate that 4 % NCNTs have roughly
2.4 times more edge plane sites per unit length compared to the undoped CNTs,
which is consistent with the 2.6 times greater adsorption affinity estimated from
the Pt-DEN adsorption isotherm data.

76
Similar studies on the adsorption of aqueous metal ion (Pb2+, Cd
2+, Cu
2+,
Ca2+ and Hg
2+) species on oxygen and nitrogen functionalized activated carbons
conducted by Xiao et al35 found strong correlations between the concentration of
nitrogen groups and metal ion adsorption from solution. While the adsorption
mechanism is still a topic of considerable discussion, the Pt-DENs remained
anchored to the carbon support and withstood repeated sonication and washings
with deionized water. The ability to load catalysts directly from solution onto
unmodified NCNTs circumvents a majority of traditional pre-processing steps
that modify the carbon and the catalyst and provides advantages in utilizing
properties of the pristine carbon and the catalyst.
3.3.3 TEM Analysis of DEs Adsorbed on CTs
TEM analysis was performed on the NCNT/ DEN composites to confirm
structural and compositional properties of the DENs on the NCNTs. Figure 3.8
shows a representative TEM image of Pt-DENs adsorbed from solution onto 4 %
NCNTs. The Pt nanoparticles themselves are stable inside the dendrimer template
and appear suspended a few angstroms above the carbon support. It is clear that
the DENs are well dispersed throughout the NCNTs and do not show any signs of
agglomeration. No evidence of agglomeration was found on undoped CNTs and
NCNTs with other nitrogen contents either. The inset in Figure 3.8 shows a high
resolution detail of the Pt particles on the NCNT surface. The presence of lattice
structures at the Pt nanoparticles shows that they are crystalline. Particle size
distributions calculated from the Pt-DENs adsorbed on the NCNTs show that they

77
Figure 3.8 TEM image of G4-NH2 Pt-DENs adsorbed on 4 % NCNT supports (Scale bar is 20nm). The inset shows high resolution structure of Pt nanoparticles (Scale bar is 5nm).

78
are virtually the same when compared to distributions calculated from as-
synthesized particles.
Figure 3.9 shows representative TEM images of Pd and PdAu DENs
adsorbed on 4 % NCNTs. The Pd DENs are found to be similarly well dispersed
and found to retain the same size as that of the as synthesized DENs. No
agglomeration of particles was observed. The PdAu DENs adsorbed on the 4 %
NCNTs had similar characteristics as that of the monometallic Pt and Pd-DENs.
EDS analysis of the adsorbed PdAu particles showed no changes in the
composition. A closer analysis of the left edge at the NCNT in Figure 3.9 B
corroborates evidence of the DENs suspended a few angstroms above the NCNTs.
Prolonged immersion of the NCNTs in DEN solutions were not found to affect
their structure as derived from TEM observations.
3.3.4 Comparison of Adsorption Characteristics of –H2 and –OH Terminated DEs
To further elucidate the difference in adsorption and the significance of
the terminal –NH2 groups at the dendrimers, experiments were carried out with
G4-OH Pt-DENs in the same concentration range. Pt-DENs synthesized using
these different dendrimer varieties were found to have highly comparable particle
size distributions. Figure 3.10 shows representative TEM images of Pt DENs
adsorbed on 4 % NCNTs from 20 µM solutions of G4-NH2 Pt-DEN and G4-OH
Pt-DENs. While the G4-NH2 Pt-DENs were well dispersed on the NCNTs, the
G4-OH Pt-DENs were found to agglomerate on the surface.
Reduced affinity was also seen for the –OH terminated DENs and was
attributed to weaker interactions between the alcohol groups and the carbon

79
Figure 3.9 TEM images of DENs adsorbed on the NCNT surface. a) Pd DENs adsorbed on 4 % NCNTs. b) PdAu DENs adsorbed on 4 % NCNTs
20 nm20 nm
a) b)

80
Figure 3.10 Representative TEM images comparing the adsorption of –NH2 terminated and –OH terminated Pt DENs on 4 % NCNTs. a) G4-NH2 Pt DENs adsorbed on 4 % NCNTs. b) G4-OH Pt DENs adsorbed on 4 % NCNTs
20 nm10 nm
a) b)

81
support. 4 % NCNTs suspended in a 20 µM solution of G4-OH Pt-DEN did not
seem to adsorb the Pt-DENs at the same rates as that of the –NH2 terminated Pt-
DENs. The supernatant after 24h had significant absorbance at 350 nm consistent
with considerable concentration (>40 % of initial concentration) of the G4-OH Pt-
DENs left unadsorbed in solution. These observations are consistent with
previous reports that G4-NH2 dendrimers adsorb more strongly than G4-OH
dendrimers onto supports including HOPG, gold and glassy carbon.27,31,34
3.3.5 Thermo Gravimetric Analysis of Pt DE loading on CTs
Total Pt loadings (wt. %) were quantified by centrifuging undoped CNT/
Pt-DEN and NCNT composites, decanting the supernatant and drying in air prior
to TGA analysis. The mass of iron catalyst used for CNT growth (~12 wt. %),
was constant for a particular variety of CNTs and was subtracted from the total
mass of the residue obtained after each TGA run.
TGA analysis performed on CNT samples with varying immersion times
in Pt-DEN solutions enabled control of the Pt loading with respect to immersion
times. Figure 3.11 shows TGA heating curves for control 7.5 % NCNT and 7.5 %
NCNTs with maximum Pt loadings. Maximum loadings were achieved by
replenishing the initial 20 µM Pt-DEN solution with a fresh solution after
complete adsorption of the DENs on NCNTs. This solution was allowed to stir
until no appreciable change was seen in the absorbance at 350 nm. Pt loadings as
high as 26 wt. % were observed using G4-NH2 terminated Pt-DENs on 7.5%
NCNTs after 30 h immersion. In contrast, loadings of only 15 wt. % were

82
Figure 3.11 Representative TGA heating curves for blank NCNTs and Pt-DENs adsorbed on 7.5 % NCNTs. Mass loading of Pt on NCNTs is calculated by subtracting final wt. % of NCNT/ Pt-DEN from final wt. % at blank NCNT.
0 200 400 600 800 1000
20
40
60
80
100
120
We
igh
t %
Temperature 0C
7.5 % NCNT / Pt-DEN
Control 7.5 % NCNT

83
achieved using G4-NH2 Pt-DENs on undoped CNTs and loadings of only ~7 wt.
% were achieved using G4-OH Pt-DEN on 7.5% NCNT after 30 h.
These observations are consistent with Raman data (Chapter 2) that
estimate higher edge plane content at NCNTs. The presence of a higher number of
edge plane sites effects higher adsorption rates and thus a higher mass loading of
DENs at the NCNTs as discussed in section 3.3.2.
3.3.6 Electrochemical Analysis of CT/ DE Composites
3.3.6.1 Cyclic Voltammetry Studies at CT/ Pt-DE Composites
The catalytic activity for ORR of the CNT/ Pt-DEN and NCNT
composites was studied using cyclic voltammetry conducted in a standard single
compartment three electrode electrochemical cell. To provide a direct basis for
comparison, voltammetric studies of CNT/ Pt-DEN and NCNT/ Pt-DEN
composites were performed on materials possessing the same Pt loading of 18±1
µg calculated based on a 5 µL aliquot of the composite obtained from a slurry
prepared with 1 mg CNT, or 1 mg NCNT, 75 µL of 0.15 wt. % Nafion in
anhydrous ethanol and 75 µL of 18 MΩ cm water. The aliquot was then drop cast
onto a glassy carbon electrode with a constant geometric surface area. Control
studies were also performed on undoped CNTs and NCNTs without Pt-DENs
present by casting films in a similar fashion to distinguish the effect of the carbon
support on ORR. Importantly, we were able to control the amount of Pt-DEN
dispersed on the CNT and NCNT supports by regulating the immersion time. The
same slurry preparation procedure was used to prepare a Pt/Vulcan carbon
standard composite (Johnson Matthey) with a Pt loading of 20 wt. %.

84
The peak potential (Ep) corresponding to CV’s for ORR at 7.5 % NCNT/
Pt-DEN was 730 mV more positive than the Ep seen for the undoped CNTs at -
210 mV as shown in Figure 3.12. This indicates that the Pt-DENs adsorbed on the
NCNT surface are in electrical contact with the carbon and are active for ORR. It
should be noted that the CV corresponding to ORR at 7.5 % NCNT/ Pt-DEN
showed the most positive shift in Ep value for an NCNT/ Pt-DEN composite.
Electroactive surface areas (ESAs) for the undoped CNT and NCNT/ Pt-DEN
composites were assessed by integration of the amount of charge associated with
the hydrogen adsorption on the Pt-DEN catalysts. The ESAs were 17.1 m2g-1 for
undoped CNT/ Pt-DEN, 20.6 m2g-1 for 4 % NCNT/ Pt-DEN and 24.9 m
2g-1 for
7.5 % NCNT/ Pt-DEN as shown in Table 3.1. Comparative analysis of the surface
area at the control CNTs and the ESA’s corresponding to adsorbed Pt at the CNTs
does not show correlations between those parameters consistent with findings
discussed in Chapter 2.
3.3.6.2 Rotating Disk Electrode Studies
Figure 3.13 displays ORR polarization curves for undoped CNT/ Pt-DEN
and various NCNT/ Pt-DEN composites in O2-saturated 0.1 M H2SO4 obtained
using an RDE at 1600 RPM.33 The performance of the as prepared CNT/ Pt-DEN
composites is consistent with previous voltammetry and RDE studies of Pt-DENs
immobilized on glassy carbon electrodes.36,37,38
However, the activity of Pt-DENs
supported on NCNT supports is higher than Pt-DENs supported on undoped
CNTs. Furthermore, the onset potential for ORR and activity of Pt-DENs
supported on NCNTs tracks with the amount of incorporated nitrogen, as

85
0.9 0.6 0.3 0.0 -0.3
0.0
0.1
0.2
Cu
rre
nt / m
A
Potential /V vs. NHE
Undoped CNT
3.7 % NCNT - Ni
4.0 % NCNT - Fe
7.5 % NCNT - Fe
7.5 % NCNT / Pt-DEN
Figure 3.12 Cyclic voltammograms for ORR at control undoped CNTs and NCNTs synthesized using Fe and Ni precursors compared to NCNT/ Pt-DEN composites in oxygen saturated 0.1 M H2SO4. ν = 20 mVs
-1.

86
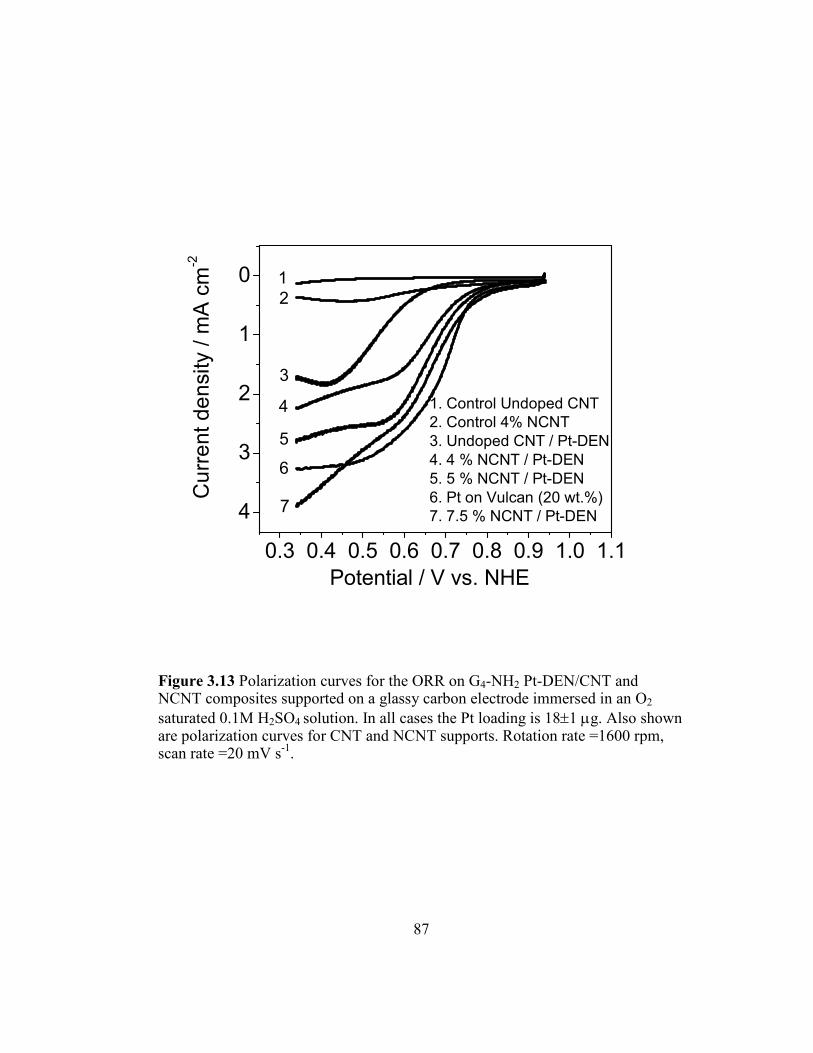
87
0.3 0.4 0.5 0.6 0.7 0.8 0.9 1.0 1.1
4
3
2
1
0
1. Control Undoped CNT
2. Control 4% NCNT
3. Undoped CNT / Pt-DEN
4. 4 % NCNT / Pt-DEN
5. 5 % NCNT / Pt-DEN
6. Pt on Vulcan (20 wt.%)
7. 7.5 % NCNT / Pt-DEN
Cu
rre
nt
de
nsity / m
A c
m-2
Potential / V vs. NHE
1
2
3
4
5
6
7
Figure 3.13 Polarization curves for the ORR on G4-NH2 Pt-DEN/CNT and NCNT composites supported on a glassy carbon electrode immersed in an O2
saturated 0.1M H2SO4 solution. In all cases the Pt loading is 18±1 µg. Also shown are polarization curves for CNT and NCNT supports. Rotation rate =1600 rpm, scan rate =20 mV s
-1.

88
illustrated in Figure 3.13 for Pt-DENs supported on 4 %, 5 % and 7.5 % NCNTs.
We attribute the increase in catalytic activity at NCNTs to an improved carbon-
catalyst binding and increased electrical conductivity and also hypothesize that a
synergistic support effect is present with the NCNTs as they are known to
decompose reactive intermediates such as hydrogen peroxide into oxygen during
ORR.18 Furthermore, the mass transport limited current densities and mass
activities (estimated from RDE curves at +350 mV) for 7.5 % NCNT/ Pt-DEN
composites were 2.3 mA cm-2 and 0.05 mA g
-1, respectively. These values are on
par with reported values of 3.4 mA cm-2 and 0.085 mA g
-1 for conventional Pt
catalysts in the 2 nm size range.36 The quasi ideal electrocatalytic response for
NCNT/ Pt-DEN composites is attributed to improved mass transport and
electronic interactions of the Pt-DENs with the NCNT support. Clearly the CV
and RDE studies indicate that the Pt-DENs are catalytically active and function as
active centers for ORR.

89
3.4 COCLUSIOS
In summary, a facile method for preparing catalytically active carbon
supported Pt catalysts is demonstrated. The choice of the PAMAM G4-NH2
dendrimer template and terminal amine functional groups provides for uniform
preparation of size monodisperse catalysts and facilitates the controlled dispersion
and loading of the catalysts onto NCNT supports with well controlled structural
and compositional properties. The immersion based loading of catalysts onto a
carbon support by spontaneous adsorption to achieve specific Pt loadings offers a
less aggressive processing approach for preparing carbon supported catalysts
compared to the harsher catalyst dispersion and loading methods that generally
require oxidative treatment of the carbon support and/or chemical reduction of
metal salts to achieve selective binding of the active metal catalyst. Additionally,
the Pt-DENs and NCNTs serve as well defined models whose properties can be
controlled synergistically to achieve better performance at these composites as
depicted in Scheme 3.2. A synergistic activity is envisioned where the NCNT
support is reactive and serves to reduce the peroxide formed as a byproduct
during oxygen reduction at the metal catalyst. Studies of this nature will foster
better understanding of role of the carbon support on catalytic efficiency, catalyst
utilization and catalyst stability.

90
Scheme 3.2 Representation of synergistic ORR activity envisioned at NCNT/ Pt-DEN composites.
O2 OH
-
O2 + H2O2
OH-
+ H2O2
O2 OH-

91
3.5 REFERECES
1. Radovic, L. R.; Rodriguez-Reinoso, F. In Chemistry and Physics of Carbon; Thrower, P. A. Ed. Marcel Dekker, 1997, Vol. 25, p 243-358.
2. Wildgoose, G. G.; Banks C. E.; Compton, R. G. Small 2006, 2, 182.
3. Wang, J.; Musameh, M.; Lin, Y. J. Am. Chem. Soc. 2003, 125, 2408.
4. Tian, Z. Q.; Jiang, S. P.; Liang, Y. M.; Shen, P. K. J. Phys. Chem. B. 2006, 110, 5343.
5. Gaur, V.; Sharma, A.; Verma, N. Carbon 2005, 42, 3041.
6. Li, X.; Hsing, I. -M. Electrochim. Acta 2006, 51, 5250.
7. Yoon, B.; Wai, C. M. J. Am. Chem. Soc. 2005, 127, 17174.
8. Xing, Y. J. Phys. Chem. B 2004, 108, 19255.
9. Serp, P.; Hierso, J. C.; Feurer, R.; Kihn, Y.; Kalck, P.; Faria, J. L.; Aksoylu, A. E.; Pacheco, A. M.; Figueiredo, J. L. Carbon 1999, 37, 527.
10. Ijima, S. "ature 1991, 354, 56.
11. Dai, H. Surface Sci. 2002, 500, 218.
12. Li, W.; Liang, C.; Zhou, W.; Qiu, J.; Zhou, Z.; Sun, G.; Xin, Q. J. Phys. Chem. B 2003, 107, 6292.
13. Thess, A.; Lee, R.; Nikolaev, P.; Dai, H.; Petit, P.; Robet, J.; Xu, C.; Lee, Y. H.; Kim, S. G.; Rinzler, A.; Colbert, D. T.; Scuseria, D.; Tomanek, J. E.; Fischer, J. E.; Smalley, R. Science, 1996, 273, 483.
14. Serp, P.; Corrias, M.; Kalck, P. Appl. Catal. A: Gen. 2003, 253, 337.
15. Ebbesen, T. W. J. Phys. Chem. Solids 1996, 57, 951.
16. Lordi, V.; Yao, N.; Wei, J. Chem. Mater. 1998, 10, 718.
17. Yu, R.; Chen, L.; Liu, Q.; Lin, J.; Tan, K. –L.; Ng, S. C.; Chan, H. S. O.; Xu, G. –Q.; Hor, T. S. A. Chem. Mater. 1998, 10, 718.
18. Maldonado, S.; Stevenson, K. J. J. Phys. Chem. B 2005, 109, 4707.

92
19. Maldonado, S.; Morin, S.; Stevenson, K. J. Carbon 2006, 44, 1429.
20. Scott, R. W. J.; Wilson, O. M.; Crooks, R. M. J. Phys. Chem. B 2005, 109, 692.
21. Hirsch, A. Angew. Chem., Int. Ed. 2002, 41, 1853.
22. Guldi, D. M.; Rahman, G. M. A.; Zerbetto, F.; Prato, M. Acc. Chem. Res. 2005, 38, 871.
23. Niu, Y.; Crooks, R. M. C. R. Chimie 2003, 6, 1049.
24. Planeix, J. M.; Coustel, N.; Coq, B.; Brotons, V.; Kumbhar, P. S.; Dutartre, R.; Geneste, P.; Bernier, P.; Ajayan, P. M. J. Am. Chem. Soc. 1994, 116, 7935.
25. Li, W.; Liang, C.; Qiu, J.; Zhou, W.; Han, H.; Wei, Z.; Sun, G.; Xin, Q. Carbon 2002, 40, 787.
26. Satishkumar, B. C.; Vogl, E. M.; Govindaraj, A.; Rao, C. N. R. J. Phys. D: Appl. Phys. 1996, 29, 3173.
27. Ye, H.; Scott, R. W. J.; Crooks, R. M. Langmuir 2004, 20, 2915.
28. Zhao, M.; Crooks, R. M. Angew. Chem., Int. Ed. 1999, 38, 364.
29. Zhao, M.; Crooks, R. M. Adv. Mater. 1999, 11, 217.
30. Scott, R. W. J.; Ye, H.; Henriquez, R. R.; Crooks, R. M. Chem. Mater. 2003, 15, 3873.
31. Scott, R. W. J.; Wilson, O. M.; Oh, S. –K.; Kenik, E. A.; Crooks, R. M. J. Am. Chem. Soc. 2004, 126, 15583.
32. Vijayaraghavan, G.; Stevenson, K. J. Langmuir 2007, 23, 5279.
33. Schmidt, J.; Gasteiger, H. A; Stab, G. D.; Urban, P. M.; Kolb, D. M.; Behm, R. J. J. Electrochem. Soc. 1998, 145, 2354.
34. Sun, L.; Crooks, R. M. Langmuir 2002, 18, 8231.
35. Xiao, B.; Thomas, K. M. Langmuir 2005, 21, 3892.
36. Gasteiger, H. A.; Kocha, S. S.; Sompalli, B.; Wagner, F. T. Appl. Catal. B 2005, 56, 9.

93
37. Paulus, U. A.; Schmidt, T. J.; Gasteiger, H. A.; Behm, R. J. J. Electroanal. Chem. 2001, 495, 134.
38. Mayrhofer, K. J. J.; Blizanac, B. B.; Arenz, M.; Stamenkovic, V. R.; Ross, P. N.; Markovic, N. M. J. Phys. Chem. B 2005, 109, 14433.

94
CHAPTER 4
Metal Organic Chemical Vapor Deposition of anocarbon Supported Mono- and Bimetallic Catalysts for
Oxygen Reduction
4.1 ITRODUCTIO
The efficiency and utilization of heterogeneous catalysts is directly
dependant on the synthetic protocols involved in the loading and subsequent
activation of the catalyst. These steps are typically refined to optimize size,
composition, dispersion and surface area of the catalyst on the carbon support.
While a host of liquid phase methods like microemulsion1 and impregnation
2 are
used to deposit noble metal catalysts on carbon supports, they typically require
harsh chemical or physical processing steps of the carbon support to facilitate
catalyst loading and dispersion. Typical procedures used for activating carbon
supports and creating surface oxygen functionalities use strong acids3 such as
HNO3 or H2SO4 or strong oxidizing agents.4 These methods alter the intrinsic
properties of the support and tend to be variable and time consuming processes.
The use of the above mentioned procedures can also hinder understanding of the
role of the carbon support properties on specific catalytic activity. To this end, we
have been studying the specific role of nitrogen doped carbon nanotube (NCNT)
supports in technologically important reactions such as ORR as dealt with in
Chapter 2. Previous reports from the Stevenson research group have demonstrated
that NCNTs show inherent catalytic activity for both ORR and the heterogeneous

95
decomposition of hydrogen peroxide.5, 6
While as grown NCNTs are less active
than Pt supported on carbon supports, we speculate that they promote a catalytic
synergism by scavenging intermediates from ORR such as hydrogen peroxide.5
The removal of these reactive intermediates is a key step in improving the
catalytic activity of a support/ catalyst combination and also leads to supports that
are better resistive to corrosion7 over extended periods. These properties of the
NCNTs has been taken advantage of in previous studies that pair these supports
with catalysts synthesized using dendrimer templates,8 as discussed in Chapter 3.
Although the NCNT/ dendrimer composites were active catalysts, their
electrochemical surface areas were lower compared to commercial catalysts. The
cost of the dendrimer templates also hinders commercialization aspects of this
particular scheme for preparing templated nanoparticles and alternate routes are
necessary to prepare cost effective active carbon/ catalyst composites.
Literature reports have dealt with the surface selective nature of CVD for a
variety of metals such Pt9, Pd
9, Rh
10 and Ag
11 using metal organic chemical vapor
deposition (MOCVD) precursors. The influence of surface area, porosity and the
presence of anchoring sites at specific supports on the preparation of supported
catalysts using MOCVD routes have also been discussed.12 A number of different
techniques have been employed to effect the CVD process and a few hypotheses
exist as to the nucleation and growth mechanism. Nuzzo et al. have performed
extensive studies on the CVD of hexafluoroacetylacetonate metal precursors on
various substrates and have proposed a fairly comprehensive mechanism.13,14
A
combination of XPS, RAIRS and TPD studies on the CVD of

96
bis(hexafluoroacetylacetonate)-palladium(II) Pd(hfac)2 on a copper surface has
shown that this process involved several principal steps. The first was the
adsorption of Pd(hfac)2 molecules on the Cu surface at the appropriate
sublimation temperatures. The second step involved the reduction of PdII to Pd
0
by the Cu surface. Processes that involve CVD on a non metallic surface have
effected this step by employing a reductive gas such as H2 during the
deposition.15,16
The use of a reductive gas flow or a reductive surface, results in
the dissociation of the hfac ligands from the Pd that constitutes the third step. The
hfac ligands were seen to react with the surface Cu to form Cu(hfac)2 which was
then desorbed from the surface. In the case of CVD at a non metallic surface, the
decomposition and removal of the precursor ligands was seen to be facilitated by
the H2 gas during reduction of the metal.
A majority of the CVD processes are applied for the deposition of thin
films on relatively smooth surfaces.17 Deposition of particles through CVD has
been typically nucleated by the creation of aberrations and induction of specific
functionalities on the surface of the support by aggressive processes as discussed
in the preceding paragraphs. Several groups have studied the dependence of the
nucleation rate of metals on the nature of the support and have agreed in principle
that surfaces customized with specific composition and structure can be used to
control the nucleation step of CVD facilitating tailored growth of
nanoparticles.13,16
Traditional CVD processes employed towards the deposition of
nanoparticle catalysts on a carbon support utilize a fluidized bed.18,19
Fluidized

97
bed processes use a gas stream flowing from the bottom of a reactor to suspend
highly functionalized carbon supports in the deposition zone. This enables better
interaction of the precursor with the carbon in the deposition zone resulting in a
fairly uniform dispersion of the metallic nanoparticles on the carbon surface.
The ability to manipulate in-situ,5,6 the structure, composition, surface
area and the amount of edge plane sites on NCNTs provides a significant
advantage over traditional carbons for use as supports in the CVD scheme
because there is no further need to modify the surface to facilitate catalyst
loading. The capability to synthesize NCNTs with a remarkable degree of
alignment and uniformity on a variety of substrates facilitates the direct
deposition of metal nanoparticles. Substrates with the as synthesized NCNTs can
then be directly exposed to the CVD precursors for controlled and uniform
nanoparticle growth without necessitation of a fluidized bed reactor.
The attractive properties of NCNTs along with the ease of tailoring and
availability of a variety of catalyst precursors used in MOCVD provides
significant advantages over other schemes for direct synthesis of support/ catalyst
combinations without extensive pre- and post processing steps. Since MOCVD
precursors can serve as sources for both the synthesis of the carbon support and
the ORR metal catalyst, it should be possible to create active catalysts directly on
high-surface area carbons in fewer processing steps. This chapter details the
loading of monodisperse Pt, Pd and PtPd catalysts in a subsequent step after the
synthesis of NCNTs. However, it is also possible to synthesize carbon/ catalyst
combinations from a single precursor source- a topic that is currently being

98
explored at the Stevenson research lab. The MOCVD route offers promise for the
direct dispersion and activation of mono- and multimetallic ORR catalysts on
carbon supports and eliminates the current inevitable problems involving loading,
sintering and activation steps associated with traditional solvent based catalyst
preparation schemes.
While this chapter discusses the synthesis aspects of monometallic Pt, Pd
and bimetallic PtPd nanoparticles on nanocarbons in detail, emphasis is placed on
the characterization of the bimetallic PtPd catalysts. Although Pt catalysts show
high activity for ORR, their performance decreases over time due to the formation
of Pt-OH20 that inhibits adsorption and reduction of oxygen on the catalyst
surface. Recent studies by the Adzic group20 conducted on carbon supported
monometallic Pt (Pt/C) and bimetallic PtAu (PtAu/C) have shown that the Pt/C
catalyst loses over 45 % of its electroactive surface area after 30,000 cycles (0 –
1.2 V vs. NHE) in oxygen saturated 0.1 M HClO4. Under the same experimental
conditions the bimetallic PtAu/C retained its original electroactive surface area.
Adzic et al attributed the stability of the PtAu bimetallic catalyst to the decreased
oxidation of the Pt nanoparticles covered by the Au surface. Multimetallic Pt
catalysts with synergistic components that help prevent oxide formation on Pt are
of vital importance in improving ORR efficiency.

99
4.2 Experimental
4.2.1 Synthesis of Undoped CTs and CTs
CNTs were prepared using the floating catalyst chemical vapor deposition
method5,6 described in chapter 2. Briefly, xylene (Aldrich) as carbon source and
ferrocene (Aldrich) as catalyst were used for the growth of the undoped CNTs
while a pyridine (Fisher) and ferrocene precursor combination was used for the
synthesis of nitrogen-doped CNTs. The use of a pyridine precursor allowed for a
controlled doping of ~ 4 at. % N on the NCNT surface. Higher surface nitrogen
concentrations (5-10 at. % N) were obtained by introducing a regulated stream of
ammonia gas (Aldrich) into the CVD furnace system along with the pyridine and
ferrocene precursors.
4.2.2 CVD of Mono- and Bimetallic anoparticles on CTs
Monometallic Pt, Pd and bimetallic PtPd catalyst nanoparticles were
directly deposited via CVD in a sequential step on the as grown CNTs using
thermally labile precursors. Once the synthesis step for a particular variety of the
CNTs was completed, a carefully measured mass of Pt(acac)2 or Pd(acac)2 (Alfa
Aesar, 99.9%) was weighed and placed in a ceramic boat in zone 1 of the furnace
for deposition of Pt or Pd nanoparticles respectively. While the gas flow stream
comprised of 400 sccm Ar and 70 sccm H2, zone 1 was maintained at 170 C (190
C for Pd) and zone 2 was maintained at 220
C for sublimation and subsequent
decomposition respectively of the Pt or Pd catalysts on the CNTs. The
sublimation and decomposition process spanned a 20 minute period and a dark

100
organic mass was left in the ceramic boat. After the furnaces were allowed to cool
to room temperature, the catalysts were retrieved from the interior of the quartz
tube and stored in airtight vials prior to characterization.
In the case of bimetallic PtPd nanoparticles, a 50:50 mass ratio of
Pt(acac)2 and Pd(acac)2 was weighed and placed in a ceramic boat at zone 1 of the
furnace system. The carrier gas stream consisted of 400 sccm Ar and 70 sccm H2.
Zone 1 was maintained at 190 C and zone 2 at 220
C for sublimation and
decomposition respectively of the catalyst precursors.
4.2.3 Electron Microscopy
Transmission electron microscopy (TEM) characterization of the CNT
supported catalysts was performed on a JEOL 2010F microscope operating at 200
kV. Energy dispersive spectroscopy was performed on an Oxford instruments
INCA detector that was part of the TEM instrumentation. TEM samples were
prepared by dispersing the catalysts in anhydrous ethanol and drop casting on a
Cu TEM grid covered with lacey carbon film.
4.2.4 Raman Characterization
A Renishaw inVia system equipped with a 514.5 nm Ar laser at 3 mW/
cm2 and 100X aperture was used. Spectra were scan averaged for 300 s. Bands at
1220, 1351, 1487, 1583 and 1624 cm-1 corresponding to I, D, D′′, G, and D′ bands
denoted by Cuesta et al13 were fit using a Peak Fit 4 software package to
correlation factors greater than 0.998. A linear baseline correction was used to
compensate for photoluminescence background.

101
4.2.5 X-Ray Photoelectron Spectroscopy Characterization
X-ray photoelectron spectroscopy characterization of the samples was
performed using a PHI 5700 ESCA system operating at a scan step size of 0.1 eV
and an Al Kα monochromatic line (1486.6 eV) calibrated with Au 4f7/2, Ag 3d5/2
and Cu 2p3/2 signals. All spectra were scan averaged 5 times. Atomic percentages
were quantified from survey scans relative to carbon, iron and nitrogen. FITT 1.2
(Photoelectron Spectroscopy lab, Seoul National University) software with
Shirley background corrections was used to analyze the spectra.
4.2.6 Thermo Gravimetric Analysis
Thermo gravimetric analysis (TGA) was performed using a Perkin Elmer
7000 analyzer. Samples (~5 mg) were held in platinum pans heated to 800 C at 5
C / min in flowing air (Praxair, 99.998%).
4.2.7 Electrochemical Analysis
Electrochemical measurements were carried out on a EG&G Instruments
263A potentiostat equipped with a Pine Instruments MSRX controller for rotating
disk electrode (RDE) measurements. Data acquisition and analysis was performed
on a Corrware (Scribner Associates) software package. Sample slurries prepared
with 0.15 wt. % nafion in anhydrous ethanol and de-ionized water were drop cast
as a film on a glassy carbon RDE (0.5 cm diameter, Pine Instruments) polished to
a mirror finish and allowed to dry under a stream of Ar (Praxair 99.98%) prior to
electrochemical measurements. Cyclic voltammograms were obtained in a
standard three electrode cell with a gold counter electrode and a Hg/Hg2SO4
reference electrode in O2 (Praxair) saturated 0.1 M H2SO4 prepared with

102
deionized water (>18 MΩ cm). All potentials were converted to NHE for
comparison to literature values. For electro-active surface area measurements, CO
(Praxair) was dosed into the electrolyte solution for 20 min while the electrode
was held at a constant potential and the solution then purged with Ar for 30 min to
remove CO from the bulk.
Prior to oxygen reduction and CO stripping experiments, the CNT/catalyst
film was cycled between 0.8 and -0.2V in order to make the film hydrophilic and
achieve steady state voltammograms.
Chronoamperometry experiments were carried out in CO saturated 0.1 M
H2SO4. CO was dosed into the electrolyte for 10 min while the electrode was held
at 0.11V. CO in bulk was purged by bubbling in a stream of Ar for 20 min.
Electrode potentials were subsequently stepped up and chronoamperometric
transients recorded on a 30 S time scale.

103
4.3 RESULTS AD DISCUSSIO
4.3.1 Morphological Properties of Catalysts Synthesized by MOCVD
The surface interaction between a catalyst precursor and the carbon
support is important in the synthesis of carbon supported catalysts through
chemical vapor deposition.12 The choice of specific precursors, the composition
and flow rate of the feed gas stream highly influences the size, crystallinity,
structure and composition of the catalyst particle. The presence of a reducing
agent such as hydrogen21 in the feed stream greatly reduces the deposition of free
carbon contaminations from the metal organic precursor that significantly
decreases the available surface area of the metal. The introduction of the catalyst
precursor into zone 1 of the furnace after the synthesis of CNTs in zone 2 was
carefully controlled and the quartz tube purged with Ar for 30 minutes to remove
trace oxygen. The presence of oxygen could lead to the formation of oxygen
functionalities on the surface of the CNT support, affect efficient decomposition
of the precursor and the electrochemical performance of the catalyst composite.
Initial experiments with the sublimation and decomposition of PtMe2(COD) on
CNT supports left substantial amounts of carbon impurities22 on the surface of the
CNT/catalyst composites. While the amount of carbon impurities was reduced
using appropriate flow rates of hydrogen in the feed stream, the particle sizes
were found to vary over a wide range (15-30 nm) and were not evenly distributed.
The use of Pt(acac)2 and Pd(acac)2 precursors allowed for a narrower size
distribution and smaller particle sizes compared to the PtMe2(COD) precursor

104
used for the Pt source. Figure 4.1 shows TEM images of Pt and Pd catalysts
directly deposited on NCNT supports without additional processing or post
activation steps. As shown in Figure 4.1a and the corresponding particle size
histogram in Figure 4.1b the Pt nanoparticles are fairly monodisperse with an
average diameter of 2.1 nm and appear to be dispersed uniformly over the NCNT
support. The Pt catalysts also appear to be strongly anchored with the NCNT
support and withstand repeated washing and sonication steps. In comparison Pd
catalysts prepared using a Pd(acac)2 precursor under similar conditions were of a
larger average particle size of 11.8 nm (Figure 4.1c and 4.1d).
Figure 4.2 shows a representative TEM image and the particle size
distribution of PtPd on 6.5 % NCNTs. Literature data12,21
suggest that the carbon
impurities from the precursor constitute less than 1% of the total mass consistent
with TEM observations. The inset in Figure 4.2 shows that PtPd bimetallic
particles deposited on 6.5% NCNTs were crystalline with an average particle size
of 3.1 nm. The graphitic nature of the carbon substrate is also clearly represented.
Overall the particles were fairly monodisperse with no evidence of
agglomerations. Average particle size and particle size distributions were
calculated from a total of at least 100 particles measured across three different
batches. The energy dispersive spectrum (Figure 4.2c) of single PtPd bimetallic
particles averaged across at least three different samples shows that the particles
consist of 62 ± 2 % Pt and 38 ± 3 % Pd.

105
Figure 4.1 TEM images of a) Pt and c) Pd catalysts on NCNT supports. Corresponding particle size histograms for b) Pt and d) Pd catalysts.
a)
c)
8 10 12 140
10
20
30
Counts
Particle size / nm
d)
1 2 3 40
10
20
30
40
Counts
Particle size / nm
b)

106
1.0 1.5 2.0 2.5 3.0 3.5 4.0 4.5 5.00
10
20
30
Counts
Particle size / nm
b)
Figure 4.2 TEM image of a) PtPd particles on 6.5 % NCNT supports. Inset shows high resolution image of a PtPd bimetallic catalyst particle. b) Corresponding particle size histogram for PtPd catalysts. c) Representative energy dispersive spectrum of a single PtPd nanoparticle.
a)
c)

107
4.3.2 Raman Analysis
First order Raman spectra of the catalysts supported on different varieties
of CNTs (Figure 4.3) were collected primarily to quantify and ensure that the
amount of edge plane sites on the CNT supports loaded with catalysts was
comparable to that of the pristine CNT varieties thereby minimizing ambiguity on
other factors that might influence catalyst loading. The amount of disorder on
each of the CNT supports were measured by fitting and integrating the intensities
of the D and G bands over an average of three different batches as shown by
Cuesta et al.23 1/ La values calculated for undoped CNTs, 4 % NCNTs and 6.5 %
NCNTs loaded with PtPd were 0.12, 0.3 and 0.52 nm-1 respectively and were
agreement to reported values. Raman analysis was found to be an accurate
indicator of the amount of edge plane content in the CNTs.
4.3.3 XPS Analysis
Figure 4.4a shows a representative XPS survey spectrum of the PtPd
catalysts on 6.5% NCNT. The carbon peak at 284.7 eV is close to values reported
earlier.5, 24
It should be noted that there are no remarkable peaks in the 286-289
eV shoulder region that indicate a significant presence of oxygen like
functionalities on the surface of the NCNTs, which lends credence to reasoning
that these groups do not influence the deposition of catalysts on the NCNTs. High
resolution spectra of the Pt and Pd regions are shown in Figure 4.4b and 4.4c
respectively. The Pt 4f region shows doublets arising from the spin-orbital
splitting of the 4f7/2 and the 4f3/2 states. Peaks at 71 and 74.5 eV are attributed to
metallic Pt (Pt(0)). The Pd region shows peaks at 335 and 341 eV that have been

108
400 800 1200 1600 2000
Normalized Counts
Raman Shift / cm-1
PtPd on Undoped CNT
PtPd on 4% NCNT
PtPd on 6.5% NCNT
Figure 4.3 Raman spectra of PtPd bimetallic catalysts on NCNT supports with varying surface concentrations of nitrogen.

109
65 70 75 80 85 90
Normalized Counts
Binding Energy / eV
High resolution
Pt spectrum71 eV
74.5 eV
b)
330 335 340 345 350
Normalized Counts
Binding Energy / eV
High resolution
Pd spectrum335.1 eV
340.5 eV
c)
Figure 4.4 XPS spectra of PtPd supported on 6.5 % NCNTs. a) Survey spectrum of PtPd showing Pt and Pd regions. b) High resolution XPS spectrum of Pt and c) Pd catalysts supported on 6.5 % NCNTs.
0 500 1000
PtPd
Survey spectrum
Normalized Counts
Binding Energy / eV
Pt
Pd
a)

110
attributed to zerovalent Pd. As reported by S.H.Y Lo at al,25 the 3d3/2 peak can be
fit to different oxidation states of Pd with peaks at 340.5, 341.4 and 342.6
corresponding to Pd, PdO and PdO2. The peak at 335 eV was also fit to the same
oxidation states with bands at 335.1, 336.2 and 337.2 corresponding to Pd, PdO
and PdO2. Peak fits for the PtPd catalysts were similar across the different
varieties of CNT supports analyzed. High resolution spectra of the nitrogen region
were compared to NCNT spectra without any catalyst loading and agreed with
reported literature data5 with respect to the position of the pyridinic, pyrrolic and
quaternary nitrogen and quantitation of the corresponding nitrogen moieties.
4.3.4 TGA Analysis
Quantitation of catalyst loading amounts on the CNTs was performed by
TGA. TGA analysis in conjunction with Raman spectral analysis of the amount of
edge plane content in CNTs provided strong correlations to the influence of the
edge plane sites on catalyst loading. For comparison purposes, data presented
correspond to catalysts loaded on undoped CNT, 4 % NCNT and 6.5 % NCNT
supports.
Figure 4.5 shows TGA curves of various CNTs that were subjected to the
same loading protocols utilizing the same precursor mass. Control undoped
CNTs, 4% NCNTs and 6.5% NCNTs studied at the same temperature range had
residual iron (Fe2O3) mass percentages of 7 ± 1 %, 9 ± 1 % and 12 ± 1 %
respectively. Subtracting the mass of iron from the final mass obtained at 800 C,
PtPd loadings of 0.9 ± 0.3 %, 4 ± 1 % and 18 ± 1 % were obtained for undoped
CNTs, 4% NCNTs and 6.5% NCNTs respectively. The difference in loading was

111
0 200 400 600 8000
20
40
60
80
100
Weight %
Temperature / oC
PtPd 6.5% NCNT
PtPd 4% NCNT
PtPd undoped CNT
Figure 4.5 TGA heating curves for PtPd catalysts on various CNT supports

112
0.4 0.8 1.2 1.6 2.0 2.4
0
3
6
9
12
15
18
PtPd loading / Weight %
ID / I
G ratio
6.5% NCNT
4% NCNT
Undoped CNT
Figure 4.6 Effect of edge plane content at NCNTs on PtPd loading as determined by TGA.

113
directly correlated to the amount of edge plane content in the respective CNTs as
shown in Figure 4.6. Careful control of TGA analysis conditions also provides
insight into burn off temperatures and rates for various CNTs that can be directly
correlated to the amount of disorder on the surface.23 The measured burn off rates
were slightly lower than pristine CNTs reported by Maldonado et al5 and were
consistent with literature reports.26
4.3.5 Electrochemical Analysis
4.3.5.1 Cyclic Voltammetry
The electroactive surface area is an important benchmark in comparing
catalysts.27 The commonly accepted method of determining the electroactive
surface area (ESA) of a catalyst is the integration of charge associated with the
amount of hydrogen adsorbed/desorbed on the surface of the electrode. While this
method of determining the ESA is fairly accurate for Pt catalysts, it is difficult to
normalize the surface areas of non noble metal catalysts and in cases of Pt based
bimetallic catalysts. The adsorption/ desorption of hydrogen on the surface of
PtPd is known to be particularly dependant on the size and surface composition of
the catalyst.28 Voltammograms of PtPd catalysts of varying compositions have
been shown to have distinct differences in the ‘hydrogen region’ and subsequently
lead to significant differences in the surface areas calculated through the
integration of the charge associated with the adsorption/ desorption of hydrogen.
Figure 4.7 shows a typical cyclic voltammogram of the PtPd catalysts supported
on 6.5% NCNT. The voltammogram is similar to that of other PtPd catalysts on
the nanoscale as reported in literature.29 This voltammogram was also comparable

114
1.4 1.2 1.0 0.8 0.6 0.4 0.2 0.0 -0.2-2
-1
0
1
2
3
4
5
Current density / (mA/cm
2)
Potential / V vs. NHE
O2 sat. 0.1M H
2SO
4
20 mV/s
PtPd 6.5% NCNT
Figure 4.7 Representative cyclic voltammogram for PtPd catalysts supported on 6.5 % NCNTs in O2 saturated 0.1M H2SO4.

115
to pure Pd catalysts and the peak near 0 V has been ascribed to the combination of
hydrogen desorbed from the bulk of the metal with that of hydrogen at the
surface. The peak at 0.2 V has been ascribed to the desorption of hydrogen on the
surface and also in the α- phase of the Pd catalyst.30 Grden et al
29 and Eley et al
31
have shown that the appearance of two distinct peaks related to the desorption of
hydrogen suggest there are two distinct phases of adsorbed hydrogen that exist on
the Pd surface that affect the ESA. ESA values calculated from hydrogen
adsorption on PtPd supported at undoped CNTs, 4 % NCNTs and 6.5 % NCNTs
were 1.8 ± 0.6 m2/g, 13 ± 1 m
2/g and 56 ± 3 m
2/g respectively.
4.3.5.2 ESA Analysis by CO Stripping
With some of the inherent problems in using the hydrogen region to
calculate the ESA, CO adsorption and oxidation on the surface of catalysts is an
effective method that provides information on the ESA regardless of whether the
catalyst is composed of noble or non-noble metals and insight into surface
poisoning. Current-time transients with respect to CO oxidation at various
potentials also provide insight into the effects of particle size and mechanism of
CO monolayer oxidation especially with regard to OHads on the surface of the
catalysts.32 CO electro-oxidation was carried out on PtPd films drop cast on a
highly polished glassy carbon (GC) RDE and dried under argon to prevent
oxidation of the catalyst layer. CO stripping on PtPd catalysts deposited on 6.5%
NCNT is shown in Figure 4.8 The portion of the CO stripping voltammogram in
the hydrogen region was devoid of any features associated with the adsorption/
desorption of hydrogen indicating that the catalyst surface was saturated with CO.

116
1.2 0.9 0.6 0.3 0.0 -0.3
-3
0
3
6
9
12
O2 sat. 0.1M H
2SO
4
20 mV/s
Current density / mA cm
-2
Potential / V vs. NHE
CO stripping on PtPd 6.5 % NCNT
Subsequent voltammogram
Figure 4.8 CO stripping voltammogram on PtPd catalysts supported on 6.5 % NCNTs. CO was dosed into solution for 20 min followed by 30 min of Ar purge to remove CO in bulk.

117
Furthermore, it was also indicative of oxidation of CO on the surface and not
from the bulk solution. The peak potential and onset for the PtPd catalysts were
0.77 V and 0.65 V respectively and were found to be comparable to Pt catalysts in
the same size range.32 The feature around 0.5 V was attributed to the reduction of
surface oxide. The voltammogram recorded in succession to the CO stripping
showed peaks associated with the adsorption/ desorption of hydrogen and is
indicative of the regeneration of the surface after CO oxidation.
ESA values calculated from CO electro-oxidation experiments were
compared over three consecutive cycles and displayed no significant decrease in
the surface area of the catalysts. ESA values for the PtPd catalysts estimated by
hydrogen adsorption/ desorption and CO stripping are reported in Table 4.1. It
should be noted that the voltammogram recorded in succession to the CO
stripping voltammogram was used to calculate the charge associated with the
adsorption/ desorption of hydrogen. The differences in the surface areas
calculated from CO and hydrogen adsorption peaks are apparent from Table 4.1.
The ESA’s calculated from hydrogen adsorption/ desorption are greater than the
ESA’s calculated from CO oxidation because of errors associated with the
integration of the amount of charge due to hydrogen adsorption/ desorption. We
believe that surface areas calculated from CO stripping serve as more accurate
indicators for comparison to activity benchmarks.
4.3.5.3 Chronoamperometric Studies
Chronoamperometric transients for CO oxidation on the PtPd catalysts
were conducted to study the influence of the catalyst particle size on activity.

118

119
These experiments also provide insight into the mechanism of CO oxidation and
the effect of OHads on the surface.33 Figure 4.9 shows chronoamperometric
transients for the PtPd catalysts supported on 6.5% NCNT. These transients were
comparable to Pt particles of the same average size supported on GC as reported
in Maillard at al32 and show current maxima at faster time scales. This particular
aspect was attributed to the presence of smaller particles less than 0.8 nm that
result from the CVD process. The transients show well defined peaks for the
current rise and decay34 and the current maximum increases and shifts to faster
time scales corresponding to an increase in the oxidation potential. The rise and
decay of the current maxima is a subject of considerable argument due to
ambiguity in attributing multistep electrochemical processes and rate limiting
steps to particular characteristics of the curve, but it is generally agreed that the
formation of CO2 occurs during the initial current rise. As has been dealt with in
several literature sources35 transients were not background subtracted due to the
influence of CO coverage on surface oxidation and double layer charging.
4.3.5.4 RDE Studies
The activity of PtPd catalysts and the synergistic role of the nanocarbon
support were studied for ORR using RDE experiments. The carbon support plays
a vital role in enhancing the activity of the catalysts prepared by the MOCVD
route since the NCNTs are known to spontaneously decompose peroxide which is
a byproduct of ORR.36 ORR peak potentials were more positive for catalysts
supported on NCNTs than on undoped CNTs with identical catalyst loadings.8
RDE experiments facilitated calculations as to the efficiency of ORR on the

120
0 5 10 15 20 25 30
0.0
0.2
0.4
0.6
0.8
1.0
Current / mA
Time / s
0.7 V
0.8 V
0.85 V
Figure 4.9 CO stripping transients on PtPd catalysts supported on 6.5 % NCNTs. CO was dosed into solution for 20 min followed by 30 min of Ar purge to remove CO in bulk. The working electrode was held at 0.11V during CO dosing and raised to stripping potentials.

121
catalysts and compare activities to commercial Pt values in literature. RDE
polarization curves shown in Figure 4.10 for PtPd catalysts supported on 6.5%
NCNT were comparable to benchmark catalyst systems. The mass transport
limited current density at 1600 rpm37 was 2.5 mA/ cm
2 which was comparable to
commercial Pt catalysts on XC-72 in the same size range.27 Koutecky- Levich
plots derived from the RDE data indicate that 3.6 electrons were involved in ORR
which also compares well to published literature data.27 To account for the effects
of the bisulfate in sulfuric acid, RDE experiments were carried out in 0.1 M
HClO4. This resulted a significant decrease in the current density of a peak shaped
feature attributed to the bisulfate adsorbed on the catalyst surface as shown in
Figure 4.11.
4.3.5.5 Stability of PtPd Catalysts
One of the primary advantages of MOCVD is that it allows for the
synthesis of nanoparticles directly on the CNT surface without the need for
templates to control size distributions of the as synthesized nanoparticles. This
allows for direct interrogation of the synergistic effects of the substrate and the
catalyst devoid of possible interactions with templating agents or influence from
multiple synthesis and processing steps that are typically needed to design
catalysts of similar size distribution. While MOCVD is a ‘soft’ chemical route
that does not require heat treatment at high temperatures, the stability of these
catalysts are on par with commercial Vulcan based catalysts. Figure 4.12 shows
representative voltammograms for the 1st and the 50
th cycles for PtPd catalysts
supported on 6.5% NCNTs. It was seen that the oxygen reduction peak shifts

122
Figure 4.10 Polarization curves for ORR on PtPd catalysts supported on 6.5 % NCNTs in O2 saturated 0.1 M HClO4. The RDE was rotated between 250 – 3000 rpm in increments of 250 rpm. Scan rates were 20 mV /s.
1.0 0.8 0.6 0.4 0.2
0.0
0.2
0.4
0.6
0.8
1.0
O2 sat. 0.1M HClO
4
ν = 20 mV/s
Current / mA
Potential / V vs. NHE

123
1.0 0.8 0.6 0.4 0.2
0.0
0.2
0.4
0.6
0.8
1.0
Current / mA
Potential / V vs. NHE
O2 sat. 0.1M H
2SO
4
ν = 20 mV/s
Figure 4.11 Polarization curves for ORR on PtPd catalysts supported on 6.5 % NCNTs in O2 saturated 0.1 M H2SO4 showing the effects of adsorbed bisulfate. The RDE was rotated between 250 – 3000 rpm in increments of 250 rpm. Scan rates were 20 mV /s.

124
1.4 1.2 1.0 0.8 0.6 0.4 0.2 0.0 -0.2
-2
0
2
4
6
8
Current density / (mA/cm
2)
Potential / V vs. NHE
PtPd 6.5% NCNT 1st cycle
PtPd 6.5% NCNT 50th cycle
O2 sat. 0.1M H
2SO
4
20 mV/s
Figure 4.12 Extended cycling of PtPd catalysts supported on 6.5 % NCNTs in O2 saturated 0.1 M H2SO4.

125
positive by 12 mV for the PtPd catalysts. This was attributed to cleansing the
catalyst surface of impurities associated with the MOCVD process. A marginal
decrease in the current density of 0.18 mA/ cm2 for PtPd was also seen. This loss
in current density for PtPd was attributed to the possible rearrangement of the
catalyst surface. For the PtPd catalysts, the plateau observed between 0.55 and 0.7
V on the cathodic sweep was attributed to the reduction of PdO.38 Features in the
hydrogen region become more resolved over extended cycling while no
significant loss was seen with the amount of charge associated with hydrogen
adsorption/ desorption supporting the idea that the PtPd is electrocatalytic and
stable.

126
4.4 COCLUSIO
In conclusion, the MOCVD scheme for preparing mono- and bimetallic
catalysts directly on undoped and nitrogen doped carbon supports was shown to
compare well with catalysts prepared through other processes that require a
sequence of pre- and post synthesis steps. The ability to deposit fairly
monodisperse catalyst nanoparticles that bind strongly to the NCNT supports and
display synergistic effects on the oxygen reduction reaction was unambiguously
defined through a series of experiments. The tunability of the amount of edge
plane content on the nanocarbon substrate offers distinct advantages with regard
to preferential catalyst loading and decomposition of peroxide specific to ORR.
The MOCVD process is expected to serve as a model system for rapid and direct
assembly of carbon supports and varied catalyst compositions that provide
promising activity for oxygen reduction. This method of catalyst screening is
expected to be straightforward for a wide variety of combinations due to the
availability of thermally labile precursors for a range of different metals that show
promise for ORR activity either by themselves or in multimetallic combinations.
This could be taken advantage of for studies on catalyst dispersion, availability
and stability in combination with a variety of carbon supports.

127
4.5 REFERECES
1. Yoon, B.; Wai, C. J. Am. Chem. Soc. 2005, 127, 17174.
2. Gaur, V.; Sharma, A.; Verma, N. Carbon 2005, 42, 3041.
3. Wang, J.; Musameh, M.; Lin, Y. J. Am. Chem. Soc. 2003, 125, 2408.
4. Tian, Z. Q.; Jiang, S. P.; Liang, Y. M.; Shen, P. K. J. Phys. Chem. B. 2006, 110, 5343.
5. Maldonado, S.; Morin, S.; Stevenson, K. J. Carbon 2006, 44, 1429.
6. Maldonado, S.; Stevenson, K. J. J. Phys. Chem. B. 2005, 109, 4707.
7. Chaparro, A. M.; Mueller, N.; Atienza, C.; Daza, L. J. Electroanal. Chem. 2006, 591, 69.
8. Vijayaraghavan, G.; Stevenson, K. J. Langmuir 2007, 23, 5279.
9. Jeon, N. L.; Lin, W.; Erhardt, M. K.; Girolami, G. S.; Nuzzo, R. G. Langmuir 1997, 13, 3833.
10. Crane, E. L.; You, Y.; Nuzzo, R. G.; Girolami, G. S. J. Am. Chem. Soc. 2000, 122, 3422.
11. Lin, W.; Warren, T. H.; Nuzzo, R. G.; Girolami, G. S. J. Am. Chem. Soc. 1993, 115, 11644.
12. Serp, P.; Kalck, P.; Feurer, R. Chem. Rev. 2002, 102, 3085.
13. Crane, E. L.; Girolami, G. S.; Nuzzo, R. G. Acc. Chem. Res. 2000, 33, 869.
14. Tagge, C. D.; Simpson, R. D.; Bergman, R. G.; Hosteler, M. J.; Girolami, G. S.; Nuzzo, R. G. J. Am. Chem. Soc. 1996, 118, 2634.
15. Xue, Z.; Strouse, M. J.; Shuh, D. K.; Knobler, C. B.; Kaesz, H. D.; Hicks, R. F.; Williams, R. S. J. Am. Chem. Soc. 1989, 111, 8779.
16. Xue, Z.; Thridandam, H.; Kaesz, H. D.; Hicks, R. F. Chem. Mater. 1992, 4, 162.

128
17. Norman, J. A. T.; Muratore, B. A.; Dwyer, D. N.; Roberts, D. A.; Hochberg, A. K. J. Phys. IV 1991, 1(C2), 271.
18. Powell, Q. H.; Kodas, T. T.; Anderson, B. M. Chem. Vap. Deposition 1996, 2, 179.
19. Zhu, Y.; Li, C.; Wu, Q. Surf. Coat. Technol. 2000, 135, 14.
20. Zhang, J.; Sasaki, K.; Sutter, E.; Adzic, R. R. Science, 2007, 315, 220.
21. Vahlas, C.; Juarez, F.; Feurer, R.; Serp, P.; Caussat, B. Chem. Vap. Deposition 2002, 8, 127.
22. Chen, Y. J.; Kaesz, H. D.; Thridandam, H.; Hicks, R. F. Appl. Phys. Lett. 1988, 53, 1591.
23. Cuesta, A.; Dhamelincourt, P.; Laureyns, J.; Martinez-Alonso, A.; Tascon, J. M. D. J. Mater. Chem. 1998, 8, 2875.
24. Papakonstantinou, P.; Lemoine, P. J. Phys-Condens. Matter 2001, 13, 2971.
25. Lo, S. H. Y.; Wang, Y-Y.; Wan, C-C. J. Colloid Interface Sci. 2007, 310, 190.
26. Serp, P.; Corrias, M.; Kalck, P. Appl. Catal. A. 2003, 253, 337.
27. Gasteiger, H. A.; Kocha, S. S.; Sompalli, B.; Wagner, F. T. Appl. Catal. B. 2005, 56, 9.
28. Solla-Gullon, J.; Rodes, A.; Montiel, V.; Aldaz, A.; Clavilier, J. J. Electroanal. Chem. 2003, 554, 273.
29. Grden, M.; Piascik, A.; Koczorowski, Z.; Czerwinski, A. J. Electroanal. Chem. 2002, 532, 35.
30. Pang, L. S. K.; Saxby, J. D.; Chatfield, S. P. J. Phys. Chem. 1993, 97, 6941.
31. Eley, D.D.; Pearson, E.J. J. Chem. Soc. Faraday I 1978, 74, 223.
32. Maillard, F.; Savinova, E. R.; Stimming, U. J. Electroanal. Chem. 2007, 599, 221.

129
33. Andreaus, B.; Maillard, F.; Kocylo, J.; Savinova, E.; Eikerling, M. J. Phys. Chem. B. 2006, 110, 21028.
34. Mc Callum, C.; Pletcher, D. J. Electroanal. Chem. 1976, 70, 277.
35. Arenz, M.; Mayrhofer, K.J.J.; Stamenkovic, V.; Blizanac, B.B.; Tomoyuki, T.; Ross, P.N.; Markovic, N.M. J. Am. Chem. Soc. 2005, 127, 6819.
36. Maldonado, S.; Stevenson, K. J. J. Phys. Chem. B. 2004, 108, 11375.
37. Climent, V.; Markovis, N. M.; Ross, P. N. J. Phys. Chem. 2000, 104, 3116.
38. Lukaszewski, M.; Czerwinski, A. J. Electroanal. Chem. 2006, 589, 38.

130
CHAPTER 5
Future Directions
5.1 ITRODUCTIO
One of the primary factors that prevents the commercialization of fuel
cells is kinetic limitations associated with the oxygen reduction reaction (ORR) at
the cathode.1 Fundamental understanding of the design, synthesis and utilization
of efficient catalysts is of vital importance in addressing these limitations. Current
research in the design of efficient catalysts for ORR primarily focuses on Pt based
multimetallic catalysts that work in a synergistic fashion. For example, recent
reports from the Adzic group2,3
that have compared carbon supported
monometallic Pt (Pt/C) and bimetallic PtAu (PtAu/C) have shown that the Pt/C
catalyst loses over 45 % of its electroactive surface area after 30,000 cycles in
oxygen saturated HClO4. Under the same experimental conditions the bimetallic
PtAu/C showed no change in the electroactive surface area. The stability of the
PtAu bimetallic catalyst was attributed to the decreased oxidation of the Pt
nanoparticles covered by the Au surface. Similar studies performed by Markovic
et al.4 on Pt3Ni (111) have shown that the particular bimetallic combination was
10 fold more active than a Pt (111) surface and 90 fold more active than currently
available commercial Pt/C catalysts for ORR. Strong ORR activity at the Pt3Ni
(111) surface was attributed to a highly favorable arrangement of the surface
atoms that promoted weak interactions between Pt surface atoms and non reactive

131
oxygenated species which increased the number of surface sites available for
oxygen adsorption and reduction. These fundamental studies serve as good
indicators for directions that need to be explored towards synthesis,
characterization and utilization of efficient ORR catalysts.
The previous three chapters were devoted to the fundamental
understanding of ORR at nitrogenated carbon nanotubes (NCNTs) and progress in
understanding ORR activity at metal organic chemical vapor deposition
(MOCVD) based and dendrimer templated catalysts supported on the NCNTs.
This chapter will focus on a three aspects of ongoing research, the first of
which is related to the efficient synthetic strategies to electrodeposit mono- and
multimetallic nanoparticle catalysts directly on NCNTs, second, research on
characterization protocols that enable understanding of the ORR process at
electrochemically dealloyed PtCu bimetallic catalysts supported on carbon that
are speculated to have undergone selective Cu dissolution and finally, preliminary
data from CNT supported catalysts utilized in a half cell ORR process that
simulated fuel cell conditions. These experiments were carried out in
collaboration with members of the Stevenson and Manthiram research groups.

132
5.2 RESULTS AD DISCUSSIO
5.2.1 Electrodeposition of anoparticle Catalysts on CTs
The concept of electrochemical deposition of nanoparticle catalysts has
been explored by a few research groups recently. Notable schemes include
nanoparticles deposited electrochemically on glassy carbon (GC) substrates,5
nanoparticles deposited on CNTs grown on carbon cloth6 and nanoparticles
deposited on CNTs cast on GC substrates.7
Some of the problems associated with electrodeposition on GC involve
irregular dispersion of the nanoparticles on the GC surface and poor control of
nucleation and growth of the nanoparticle due to difficulties in defining surface
sites on the GC.5 Difficulties in the electrodeposition of catalysts on CNTs have
much in common with difficulties at the GC surfaces but can be overcome with
aggressive preprocessing steps that create surface functionalities on the CNTs
allowing for better anchoring, nucleation and dispersion of nanoparticles.8 The
drawback to using these preprocessing steps is that they degrade structure and
composition of the CNT, leading to broad variations in stability.
The use of NCNTs is an attractive option for the synthesis and
characterization of nanoparticles through electrodeposition in the face of the
difficulties described above. As discussed in the previous chapters, properties of
NCNTs can be controlled to a remarkable degree. Systematic manipulation of the
edge plane sites and surface concentration of nitrogen facilitate controlled

133
nucleation, dispersion and growth of nanoparticles that make active carbon/
catalyst composites for ORR.
Studies involving electrodeposition of Au and PtAu nanoparticles on
NCNTs are primarily detailed in this section. These studies were conducted in
collaboration with Mr. Jay Sawyer Croley at the Stevenson research lab. The
NCNTs used for electrodeposition were grown directly on a nickel mesh substrate
cut to specific dimensions so as to normalize the surface area as described in the
experimental section in chapter 2.
Au nanoparticles were deposited on 4 % NCNTs from a solution of 0.2
mM HAuCl4. A step in potential from open circuit to -0.01 V vs. NHE for 0.1 ms
facilitated the electrodeposition. PtAu bimetallic nanoparticles were synthesized
in a subsequent step after the deposition of Au at -0.1 V for 0.1 ms. The
underpotential electrodeposition of Au on Pt is currently being explored. Figure
5.1 shows a representative chronocoulometric curve from the electrodeposition of
Au nanoparticles on 4 % NCNT supports. The systematic study of the charge
associated with the deposition of nanoparticles with respect to time provides a
guideline that facilitates effective control of the nanoparticle size and
composition.
Figure 5.2 shows representative TEM images of nanoparticles
electrodeposited on 4 % NCNTs. Figure 5.2a shows that the Au nanoparticles are
nearly spherical and uniformly dispersed on the NCNT surface. Edge plane sites
at the NCNT surface are speculated to play a role in the uniform dispersion of the
Au particles as evident by an absence of particle agglomeration. PtAu bimetallic

134
0 2 4 6 8 102.5
2.0
1.5
1.0
0.5
0.0
Charge / 1e-7 C
Time / 1e-5 s
Figure 5.1 Chronocoulometric profile of the electrodeposition of Au nanoparticles from 0.2 mM HAuCl4 solutions on NCNTs

135
Figure 5.2 Representative TEM images of nanoparticle catalysts deposited on 4 % NCNTs. a) Au nanoparticles. b) PtAu nanoparticles.
b)
a)

136
particles shown in Figure 5.2b were found to be similarly well dispersed. A high
resolution image of the PtAu nanoparticles in Figure 5.3 shows that the as
deposited nanoparticles were crystalline.
The activity for ORR at the PtAu/ NCNT composites was tested in oxygen
saturated 1 M KNO3 since the NCNTs were grown on a Ni mesh substrate. Figure
5.4 shows representative cyclic voltammograms for ORR at PtAu nanoparticles
supported on 4 % NCNTs. A 200 mV positive shift in the peak potential for ORR
was seen at the 4 % NCNT/ PtAu composites, showing that they were active for
ORR. Further studies in order to provide better control of the particle size and
composition of these bimetallic catalysts are underway.
Fundamental studies on the synthesis of mono- and multimetallic
nanoparticles on NCNTs through electrodeposition provide insight into direct
synthetic strategies for producing active ORR catalysts. These studies also
provide solutions that circumvent a majority of pre- and post processing steps
required for synthesis of traditional carbon supported catalysts. For example the
Adzic group used galvanostatic displacement to deposit Au on Pt which showed
remarkable enhancement in ORR activity. The use of NCNTs in the
electrodeposition process enables synthesis of varying compositions of AuPt
bimetallic catalysts without the need for galvanostatic displacement. The
electrodeposition of well defined nanoparticles without the need for expensive
templating agents also emphasizes the cost effective nature of this strategy.

137
Figure 5.3 High resolution TEM image of PtAu nanoparticles electrodeposited on NCNTs.

138
Figure 5.4 Cyclic voltammograms for oxygen reduction at PtAu catalysts deposited on NCNTs. CV’s were run in oxygen saturated 1 M KNO3.
0.6 0.4 0.2 0.0 -0.2
-0.6
-0.3
0.0
0.3
0.6
0.9
Current / mA
Potential / V vs. NHE
Control 6.5 % NCNTs
PtAu on 6.5 % NCNTs

139
5.2.2 Synthesis and Characterization of ORR at CT supported PtCu Catalysts
Selective electrodissolution of Cu atoms from PtCu bimetallic
nanoparticle catalysts has been a topic of interest recently due to significant
enhancement in the ORR activity at the resultant catalyst. It has been speculated
that the selective electrochemical dealloying of the surface Cu atoms creates
preferred structural rearrangement of the Pt atoms.9,10
The structural
rearrangements are hypothesized to include active crystal facets or favorable Pt-Pt
interatomic distances that enhance the adsorption and reduction of oxygen at these
catalyst surfaces.
While selective dissolution studies clearly show significant enhancement
in the catalytic activity for ORR at carbon supported PtCu9 and PtCuCo
10
catalysts, the mechanistic details still remain topics of debate. Although it has
been hypothesized that dealloying of Cu does not increase the surface area of the
resultant catalyst, characterization steps performed on those specific catalysts lack
convincing proof to support those specific claims.
In an effort to improve upon the existing characterization data that try to
explain enhanced catalytic activity at dealloyed surfaces, a set of basic
measurements were made. These involved i) understanding dealloying aspects at
Au surfaces through repeated alloying/ dealloying cycles with Zn. ii) synthesis of
PtCu nanoparticle catalysts using dendrimer templates (as described in chapter 3)
and testing for ORR activity at dealloyed PtCu dendrimer encapsulated
nanoparticles (DENs) supported on NCNTs. iii) the development of new

140
characterization strategies that enable interrogation of the PtCu catalyst surface
before and after dealloying.
5.2.2.1 Fundamental Studies on Dealloying at Au Thin Films
Figure 5.5 shows an SEM image of a Au thin film after 30 alloying/
dealloying cycles with Zn. Au films were deposited on an Indium tin oxide (ITO)
substrate. Electrochemical alloying/ dealloying was carried out in a standard three
electrode electrochemical cell with the Au film serving as the working electrode,
a thin zinc strip serving as a reference and another piece of zinc serving as a
counter electrode. 1.6 M ZnCl2 in benzyl alcohol was used as the electrolyte and
the working electrode was cycled between -0.7 and 1.8 V vs. Zn.11
The resultant
film was found to have a roughened surface and exhibited a presence of pores
created by the alloy/ dealloy process. The Au film also had a few spots on the
surface where the Au had been removed from the ITO surface due to the cycling.
The difference in the electrochemical surface area for the Au film before
and after the alloy/ dealloy cycling was measured by cyclic voltammetry of the
film in 0.5 M H2SO4. The Au film served as the working electrode while a Pt wire
and an Hg/ Hg2SO4 electrode were used as counter and reference electrodes,
respectively. Potentials are reported vs. NHE for comparison. Cyclic
voltammograms of the Au films before and after Zn alloying/dealloying are
shown in Figure 5.6. Electrochemical surface area of the Au film was determined
by integration of the charge associated with the reduction of AuO during the
cathodic sweep of the voltammogram. An 17.1 % increase in the electrochemical

141
Figure 5.5 Scanning electron microscope image of Au film subjected to 30 alloy/ dealloy cycles in a ZnCl2 / benzyl alcohol solution.

142
0.0 0.2 0.4 0.6 0.8 1.0-0.6
-0.4
-0.2
0.0
0.2
0.4
0.6
Current / mA
Potential / V vs. Zn
Pristine Au film
Au film after 30 AuZn cycles
Figure 5.6 Cyclic voltammograms of an Au film in 0.5 M H2SO4 before and after alloying/ dealloying cycles in a ZnCl2 / benzyl alcohol solution. Integration of the cathodic AuO peak showed a 17.1 % increase in the electrochemical surface area on the dealloyed Au film.

143
surface area was seen at the Au film after 30 alloying/ dealloying cycles with Zn.
While it is clear that there is an increase in the electrochemical surface area it
would be of interest from a fundamental standpoint to determine if there was an
increase in the physical surface area of the resultant Au film and how the
geometric surface area changes with respect to the electrochemical surface area.
Studies involving spectroscopic ellipsometry in conjunction with a custom made
cell that would enable toluene dosing at the Au films are planned to elucidate
differences in the physical surface area as a result of alloying/ dealloying steps.
These fundamental studies are expected to improve understanding of the ORR
process at dealloyed nanoparticle catalysts.
5.2.2.2 Effects of Electrochemical Dealloying on ORR at PtCu DE!s supported on 6.5 % !C!Ts.
Preliminary studies were conducted to determine the effects of
electrochemical dealloying for ORR activity at PtCu nanoparticle catalysts. PtCu
DENs were prepared with assistance of Ms. Wenly Ruan. Briefly, generation 4,
amine terminated dendrimers were used to coordinate with Pt and Cu ions from
solution and then reduced with NaBH4 to form 1.4 nm PtCu bimetallic
nanoparticles. The as synthesized PtCu DENs were adsorbed onto 6.5 % NCNTs
by suspending the NCNTs in the DEN solution and stirring for 12 h similar to
protocols described in chapter 3.
Selective Cu dissolution from the PtCu DENs was carried out in 0.1 M
HClO4. A sample slurry of a measured mass of the PtCu DENs supported on
NCNTs in ethanol was drop cast on a GC working electrode suspended in a three

144
-0.2 0.0 0.2 0.4 0.6 0.8 1.0 1.2-0.8
-0.6
-0.4
-0.2
0.0
0.2
0.4
Current / mA
Potential / V vs. NHE
PtCu DEN / 6.5 % NCNT Cycles 1-5
PtCu DEN / 6.5 % NCNT Cycles 6-10
PtCu DEN / 6.5 % NCNT Cycles 11-15
PtCu DEN / 6.5 % NCNT Cycles 16-20
Figure 5.7 Electrochemical dissolution of Cu from PtAu bimetallic catalysts synthesized using dendrimer templates. The PtCu/ DEN catalysts were supported on 6.5 % NCNTs. Dissolution studies were carried out in 0.1 M HClO4.

145
electrode cell with a gold counter and Hg/ Hg2SO4 reference. Potentials are
reported vs. NHE for comparison. Figure 5.7 shows dealloying cycles 1-20 at the
PtCu DENs. Features on the CV’s related to the alloying and dealloying of Zn
with Au compare well with literature reports on similar systems. Current densities
of the peak at 0.4 V associated with the Cu decrease with the number of
dealloying cycles due to the oxidation of Cu from the catalyst surface. More
significantly, features associated with the adsorption/ desorption of hydrogen (0 -
0.2 V) at the Pt surface seem to increase in current density due to a larger number
of Pt atoms being exposed on the surface for hydrogen adsorption/ desorption.
Fundamental studies involving varied compositions of PtCu are currently being
carried out to elucidate ORR activity at dealloyed surfaces.
5.2.2.3 Devising Improved Synthesis and Characterization Strategies for ORR Catalysts
While a large number of reports have delved on ORR over the past few
decades, the need for effective and cost efficient catalysts still exists. Most reports
have discussed empirical and applied aspects of catalysts and fuel cells but have
not conducted fundamental studies that understand ORR at catalyst composites
through advanced characterization strategies. Towards this end, some of the
research at the Stevenson research lab has been focused on devising hybrid
characterization strategies that elucidate the state of a nanoparticle catalyst before
and after it is subject to ORR.
Some of the recent efforts involve the growth of NCNTs directly on
customized Ni and Au TEM grids. Nanoparticle catalysts can then be
incorporated on the NCNT surface either by suspending the grid in a DEN

146
solution or by electrochemical means – similar to protocols discussed in chapter 3
and section 5.2.1. The NCNT supported catalysts might be characterized at the
TEM, subject to ORR in acidic or basic media and then characterized again using
the TEM. These measurements enable direct analysis of the nanoparticle surface
using TEM and energy dispersive spectroscopy (EDS) before and after ORR. The
size, structure and composition of the catalyst before and after ORR can be
directly correlated to the corresponding activity enabling significantly better
understanding of the catalysis, thereby helping design efficient catalysts.
5.2.3 CT Supported Catalysts in Fuel Cells
CNT supported ORR catalysts were tested in a half cell configuration for
oxygen reduction under simulated fuel cell conditions. These studies were
conducted in collaboration with Dr. Raghuveer Vadari at the Manthiram research
group. Pt DEN catalysts were adsorbed on CNTs resulting in CNT/ Pt-DEN
composites that were spray coated on a carbon cloth from a suspension in nafion.
A 1 cm2 area of the thus coated electrode containing 0.05 mg / cm
2 Pt loading was
tested for ORR activity in 1 M H2SO4.
Figure 5.8 shows a representative half cell ORR process at CNT/ Pt-DENs
compared to commercial 20 wt. % Pt on Vulcan XC-72. While the current
densities are lower for the CNT/ Pt-DENs, it should be noted that the catalyst
loading was lower than 50 % than that at the commercial catalyst. Such studies
show promise for CNT supported catalysts and further studies involving NCNT
supported catalysts are planned for the future.

147
Figure 5.8 Half cell trial of CNT supported Pt DEN catalysts for ORR in 1 M H2SO4.
0.00 -0.05 -0.10 -0.15 -0.200.0
0.2
0.4
0.6
0.8
1.0 Commercial Pt
CNT/ Pt-DEN
Potential / V vs. NHE
Current density / A cm-2

148
5.3 COCLUSIOS
Efficient synthetic strategies for cost effective and active ORR catalysts
have been explored through electrodeposition. Preliminary data show promise for
extending these studies to different catalyst compositions that minimize the
amount of Pt loading while increasing ORR activity.
Studies on selective electrochemical dealloying of bimetallic catalysts
were carried out in effort to elucidate the effects of this process on ORR activity.
Auxiliary studies on alloying/ dealloying at Au surfaces and studies on PtCu
alloys synthesized using dendrimer templates and supported on NCNTs aim to
detail changes in the catalyst surface structure, surface area and composition that
correlate to enhanced ORR activity.
Preliminary half cell ORR studies on CNT supported Pt-DEN catalysts
show promise for carbon nanotube supported catalysts in fuel cells.

149
5.4 REFERECES
1. Gasteiger, H. A.; Kocha, S. S.; Sompalli, B.; Wagner, F. T. Appl. Catal. B
2005, 56, 9.
2. Zhang, J.; Sasaki, K.; Sutter, E.; Adzic, R. R. Science, 2007, 315, 220.
3. Strbac, S.; Adzic, R. R. J. Electroanal. Chem. 1996, 403, 169.
4. Stamenkovic, V. R.; Fowler, B.; Mun, B. S.; Wang, G.; Ross, P. N.;
Lucas, C. A.; Markovic, N. M. Science, 2007, 315, 493.
5. Papadimitriou, S.; Tegou, A.; Pavlidou, E.; Kokkinidis, G.; Sotiropoulos,
S. Electrochimica Acta, 2007, 52, 6254.
6. Tsai, M. –C.; Yeh, T. –K.; Tsai, C. –H. Electrochem. Comm. 2006, 8,
1445.
7. Zhao, Y.; Fan, L.; Zhong, H.; Li, Y.; Yang, S. Adv. Funct. Mater. 2007,
17, 1537.
8. Xu, Y.; Lin, X. Electrochimica Acta 2007, 52, 5140.
9. Koh, S.; Strasser, P. J. Am. Chem. Soc. 2007, 129, 12624.
10. Srivastava, R.; Mani, P.; Hahn, N.; Strasser, P. Angew. Chem. Int. Ed.
2007, 46, 1.
11. Jia, F.; Yu, C.; Ai, Z.; Zhang, L. Chem. Mater. 2007, 19, 3648.

150
Vita
Ganesh Vijayaraghavan, the son of Saraswathi and Vijayaraghavan
Velayutham was born in Madurai, India in June 1978. After graduating from high
school, he pursued a Bachelor’s degree in Chemical and Electrochemical
Engineering at the Central Electrochemical Research Institute in Karaikudi, India.
After completion of a Master’s degree in Analytical Chemistry from Texas Tech
University in 2004, he joined the University of Texas at Austin to pursue his
Doctorate in Analytical Chemistry under the guidance of Prof. Keith J. Stevenson.
Permanent address: 3405 Helms St #104, Austin TX 78705
This dissertation was typed by the author.