corp ppt template - general use
TRANSCRIPT

VerisignQ4 and Full Year 2018 Earnings Conference Call
February 7, 2019

Safe Harbor Disclosure
Statements in this announcement other than historical data and information constitute forward-looking
statements within the meaning of Section 27A of the Securities Act of 1933 as amended and Section 21E of the
Securities Exchange Act of 1934 as amended. These statements involve risks and uncertainties that could cause
our actual results to differ materially from those stated or implied by such forward-looking statements. The
potential risks and uncertainties include, among others, whether an amended .com Registry Agreement will
include any or all off the changes permitted in Amendment 35; the failure to renew key agreements on similar
terms, or at all; new or existing governmental laws and regulations in the U.S. or other applicable foreign
jurisdictions; system interruptions, security breaches, attacks on the internet by hackers, viruses, or intentional
acts of vandalism; the uncertainty of the impact of changes to the multi-stakeholder model of internet
governance; risks arising from our operation of two root zone servers and our performance of the Root Zone
Maintainer functions; changes in internet practices and behavior and the adoption of substitute technologies; the
success or failure of the evolution of our markets; the highly competitive business environment in which we
operate; whether we can maintain strong relationships with registrars and their resellers to maintain their
marketing focus on our products and services; the possibility of system interruptions or failures; challenging
global economic conditions; economic, legal and political risk associated with our international operations; our
ability to protect and enforce our rights to our intellectual property and ensure that we do not infringe on others’
intellectual property; the outcome of legal or other challenges resulting from our activities or the activities of
registrars or registrants, or litigation generally; the impact of our new strategic initiatives, including our IDN
gTLDs; whether we can retain and motivate our senior management and key employees; and the impact of
unfavorable tax rules and regulations. More information about potential factors that could affect our business
and financial results is included in our filings with the SEC, including in our Annual Report on Form 10-K for the
year ended Dec. 31, 2017, Quarterly Reports on Form 10-Q and Current Reports on Form 8-K. Verisign
undertakes no obligation to update any of the forward-looking statements after the date of this announcement.
2

Introduction
Registry Services Highlights
Financial Performance / Guidance
Closing / Q&A / Appendix
Agenda
3

Domain Name Base(1) at 153.0 Million Names, up 4.5% Y/Y
139.0 Million .com Names and 14.0 Million .net Names
0
20
40
60
80
100
120
140
160
180
.com/.net Domain Name Base
1) The domain name base as presented here is the active zone plus the number of domain names that are registered but not configured for use in
the respective Top-Level Domain zone file plus the number of domain names that are in a client or server hold status. This data is not comparable
to previous earnings presentations, (prior to first quarter 2015), where names in hold status were not included.
Millions
Registry Services Highlights
4

Registry Services Highlights
Millions
Q4
New Name Registrations
.com/.net New Name
RegistrationsRenewal Rate (1)
1) Renewal rates are not fully measurable until 45 days after the end of the quarter.
2) This guidance is based on historical seasonality and current market trends.
Q3Q2Q1
• Q3 2018 renewal rate 74.8%
• Q4 2018 renewal rate expected to
be approximately 74.2%(1)(2)
compared with 72.2% in Q4 2017
• Ending Q4 2018 Domain Name
Base increased by 1.29M
registrations from prior quarter end
• 34.5M registrations expiring in Q1
2019 vs. 32.7M in Q1 2018
• Domain Name Base expected to
increase by between 2.25% to
4.25% from end 2018 to end 2019(2)
9.5 Million New Name Registrations in Q4 2018
Compared with 9.0 Million in Q4 2017
Renewal Rate
5
50%
60%
70%
80%
90%
100%
0
2
4
6
8
10
12
'13'14'15'16'17'18 '13'14'15'16'17'18 '13'14'15'16'17'18 '13'14'15'16'17'18

• Revenue of $1,215M, up 4.3% y/y
• Operating Income
• GAAP: $767M
• Non-GAAP: $820M(1)
• Operating Margin
• GAAP Operating Margin 63.2%
• Non-GAAP Operating Margin 67.5%(1)
• Free Cash Flow of $661M(2)
• CapEx of $37M
• Total Liquidity(3)
• $1.27B(3) of which $504M was domestic as
of Dec. 31, 2018
1) Please refer to “Summary of Non-GAAP Measures” for important information.
2) Free cash flow is non-GAAP financial measure defined as cash flow from operating activities, less capital expenditures. Please see Free Cash Flow Calculation in slide appendix for more detail.
3) Consists of cash, cash equivalents, and marketable securities.
2018 Full Year Financial Highlights
6
0%
10%
20%
30%
40%
50%
60%
70%
80%
90%
100%
0
200
400
600
800
1,000
1,200
1,400
RevenueNon-GAAP Operating MarginGAAP Operating Margin
Revenue & Profitability
Non-GAAP & GAAP Operating Margins (1)$ Millions

0%
10%
20%
30%
40%
50%
60%
70%
80%
90%
100%
0
25
50
75
100
125
150
175
200
225
250
275
300
325
RevenueNon-GAAP Operating MarginGAAP Operating Margin
$ Millions
Revenue & Profitability
Non-GAAP & GAAP Operating Margins (2)• Revenue of $307M, up 4.0% y/y
• GAAP operating margin of 63.1%
• GAAP diluted EPS of $1.50(1)
• Non-GAAP operating margin of 66.7%(2)
• Non-GAAP diluted EPS of $1.58(1)
• Operating Cash Flow of $219M
• Free Cash Flow of $211M(2)
• 900 Full-Time Employees at Dec 31, 2018
1) During the 4th quarter Verisign recorded a $54.8 million pre-tax gain related to the sale of Verisign Security Services’ customer contracts to Neustar. This gain
increased GAAP net income by $52.0 million, GAAP diluted EPS by $0.43, Non-GAAP net income by $42.8 million, and Non-GAAP diluted EPS by $0.36.
2) See “Reconciliation of Non-GAAP Financial Measures” in slide appendix for important information.
3) Free cash flow is a non-GAAP financial measure defined as cash flow from operating activities, less capital expenditures. See Free Cash Flow Calculation in slide
appendix for more detail.
Q4 2018 Financial Performance
7

• Revenue
• $1.215 billion to $1.235 billion
• Domain Name Base Growth
• 2.25% to 4.25%
• Non-GAAP Operating Margin(2)
• 67.5% to 68.5%
• Interest Expense and Non-Operating Income, net
• $42 million to $49 million expense
• Capital Expenditures
• $45 million to $55 million expense
• Cash Taxes
• $95 million to $115 million
1) Our guidance is based on expectations about the outlook of our business in addition to our financial projections for interest income and expense. Guidance for all non-
GAAP figures is based on the definition of non-GAAP metrics noted below. See “Reconciliation of Non-GAAP Financial Guidance” in slide appendix.
2) The most directly comparable GAAP measure to non-GAAP operating margin is GAAP operating income. Non-GAAP operating margin is defined as GAAP operating
income adjusted for stock-based compensation which is then divided by revenues.
Full Year 2019 Financial Guidance(1)
8
Q&A
Appendix
9

Non-GAAP Financial Measures
Financial forecasts and guidance are forward looking statements and actual results may
vary for a number of reasons including those mentioned in our most recent 10-K, 10-Q
and 8-K filings with the SEC.
10
Verisign provides quarterly and annual financial statements that are prepared in accordance with generally accepted
accounting principles (GAAP). Along with this information, management typically discloses and discusses certain non-
GAAP financial information in quarterly earnings news releases, on investor conference calls and during investor
conferences and related events. This non-GAAP financial information does not include the following types of financial
measures that are included in GAAP: stock-based compensation, unrealized gain/loss on the contingent interest derivative
on the subordinated convertible debentures, non-cash interest expense through June 30, 2018, and loss on debt
extinguishment. Non-GAAP net income is decreased by amounts accrued for contingent interest payable through Aug. 15,
2017, related to the subordinated convertible debentures, and is adjusted for an income tax rate of 22 percent starting from
the first quarter of 2018, 25 percent for the second through the fourth quarters of 2017, and 26 percent for the first quarter
of 2017, all of which differ from the GAAP income tax rate.
Management believes that this non-GAAP financial data supplements the GAAP financial data by providing investors with
additional information that allows them to have a clearer picture of Verisign’s operations and financial performance and the
comparability of Verisign’s operating results from period to period. The presentation of this additional information is not
meant to be considered in isolation nor as a substitute for results prepared in accordance with GAAP.
The tables appended to this release include a reconciliation of the non-GAAP financial information to the comparable
financial information reported in accordance with GAAP for the given periods.

Reconciliation of Non-GAAP Financial Measures
SUPPLEMENTAL FINANCIAL INFORMATION
The following table presents the classification of stock-based compensation:
(In thousands, except per share data)
(Unaudited)
11
Three Months Ended Three Months Ended Three Months Ended
December 31, 2018 September 30, 2018 December 31, 2017
Operating
Income Net
Income Operating
Income Net
Income Operating
Income Net
Income
GAAP as reported $ 193,966 $ 182,195 $ 194,997 $ 137,680 $ 176,432 $ 102,837
Adjustments:
Stock-based compensation
.................................................................. 11,098 11,098 15,130 15,130 12,864 12,864
Non-cash interest expense
.................................................................. — — 3,851
Tax adjustment
.................................................................. (2,193 ) (1,933 ) (480 )
Non-GAAP
........................................................................... $ 205,064 $ 191,100 $ 210,127 $ 150,877 $ 189,296 $ 119,072
Revenues
........................................................................... $ 307,452 $ 305,777 $ 295,501
Non-GAAP operating margin
........................................................................... 66.7 % 68.7 % 64.1 %
Diluted shares
........................................................................... 121,329 122,261 124,257
Diluted EPS, non-GAAP
........................................................................... $ 1.58 $ 1.23 $ 0.96
Three Months Ended
December 31, Three Months Ended
September 30, Three Months Ended
December 31,
2018 2018 2017
Cost of revenues
........................................................................................... $ 1,652 $ 1,755 $ 1,719
Sales and marketing
........................................................................................... 579 1,451 1,433
Research and development
........................................................................................... 1,696 1,623 1,560
General and administrative
........................................................................................... 7,171 10,301 8,152
Total stock-based compensation expense
........................................................................................... $ 11,098 $ 15,130 $ 12,864

Reconciliation of Non-GAAP Financial Measures
SUPPLEMENTAL FINANCIAL INFORMATION
The following table presents the classification of stock-based compensation:
(In thousands, except per share data)
(Unaudited)
12
Year Ended December 31,
2018 2017
Cost of revenues
........................................................................................................................ $ 6,835 $ 7,030
Sales and marketing
........................................................................................................................ 4,972 5,688
Research and development
........................................................................................................................ 6,728 6,113
General and administrative
........................................................................................................................ 33,969 34,076
Total stock-based compensation expense
........................................................................................................................ $ 52,504 $ 52,907
Year Ended December 31,
2018 2017
Operating
Income Net Income Operating
Income Net Income
GAAP as reported $ 767,392 $ 582,489 $ 707,722 $ 457,248
Adjustments:
Stock-based compensation
................................................................................ 52,504 52,504 52,907 52,907
Unrealized loss on contingent interest derivative on the
subordinated convertible debentures
................................................................................
—
893
Non-cash interest expense
................................................................................ 5,719 14,678
Contingent interest payable on subordinated convertible
debentures
................................................................................
—
(9,445 )
Loss on debt extinguishment
................................................................................ 6,554 —
Tax adjustment
................................................................................... (27,717 ) (24,352 )
Non-GAAP $ 819,896 $ 619,549 $ 760,629 $ 491,929
Revenues
.......................................................................................... $ 1,214,969 $ 1,165,095
Non-GAAP operating margin
.......................................................................................... 67.5 % 65.3 %
Diluted shares
.......................................................................................... 122,661 124,180
Diluted EPS, non-GAAP
.......................................................................................... $ 5.05 $ 3.96
13
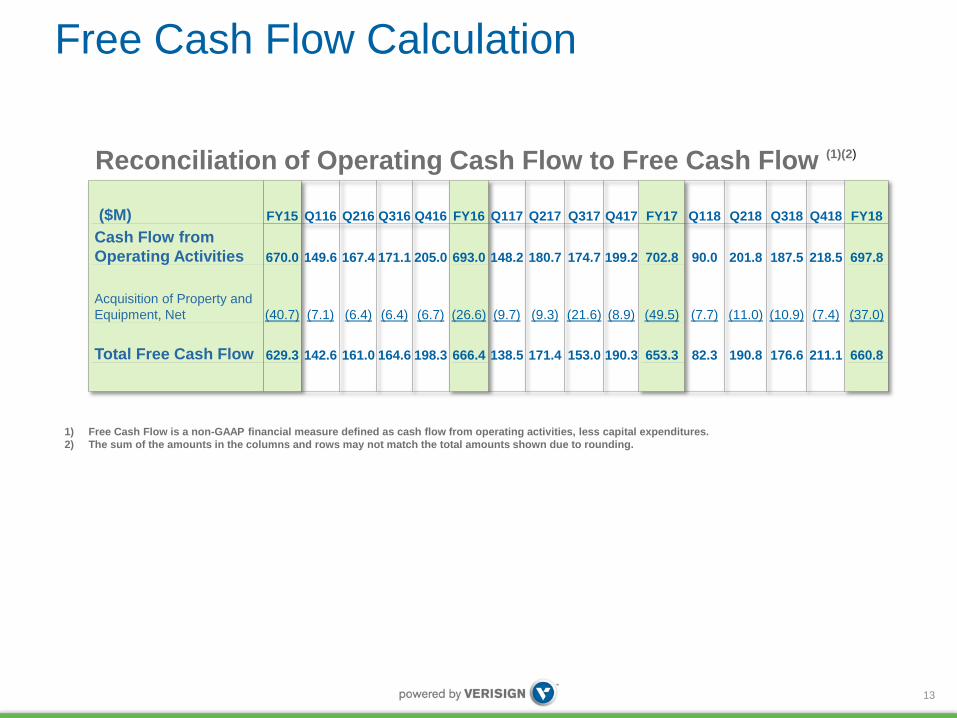
Reconciliation of Operating Cash Flow to Free Cash Flow (1)(2)
($M) FY15 Q116 Q216 Q316 Q416 FY16 Q117 Q217 Q317 Q417 FY17 Q118 Q218 Q318 Q418 FY18
Cash Flow from
Operating Activities 670.0 149.6 167.4 171.1 205.0 693.0 148.2 180.7 174.7 199.2 702.8 90.0 201.8 187.5 218.5 697.8
Acquisition of Property and
Equipment, Net (40.7) (7.1) (6.4) (6.4) (6.7) (26.6) (9.7) (9.3) (21.6) (8.9) (49.5) (7.7) (11.0) (10.9) (7.4) (37.0)
Total Free Cash Flow 629.3 142.6 161.0 164.6 198.3 666.4 138.5 171.4 153.0 190.3 653.3 82.3 190.8 176.6 211.1 660.8
Free Cash Flow Calculation
1) Free Cash Flow is a non-GAAP financial measure defined as cash flow from operating activities, less capital expenditures.
2) The sum of the amounts in the columns and rows may not match the total amounts shown due to rounding.
13

Reconciliation of Non-GAAP Financial Guidance
14
(Reconciliation of Financial Guidance as given on slide 8 of February 2019 earnings presentation)
1) Full year 2019 non-GAAP operating margin guidance:
67.5% to 68.5%
Low High
GAAP operating margin 63.1% 64.1%
Stock-based compensation 4.4% 4.4%
Non-GAAP operating margin 67.5% 68.5%

© 2019 VeriSign, Inc. All rights reserved. VERISIGN and other trademarks, service marks, and designs are registered or unregistered trademarks of
VeriSign, Inc. and its subsidiaries in the United States and in foreign countries. All other trademarks are property of their respective owners.