corporate presentation - ir.vincom.com.vn · vincom center ba trieu vincom center dong khoi vincom...
TRANSCRIPT

September 2019
Corporate Presentation
1
Disclaimer
IMPORTANT: The information contained herein is preliminary and subject to change without notice, its accuracy is not guaranteed, has not been independently verified and may not
contain all material information concerning Vincom Retail Joint Stock Company (the “Company”) and its subsidiaries (the “Group”). You should not rely upon it or use it to form the
basis for any investment decision or commitment whatsoever.
None of the Company, its shareholders, or any of their respective affiliates, directors, officers, employees, agents, advisers or any other person makes any representation or warranty
(express or implied) or accepts any responsibility or liability for the accuracy or completeness of this presentation or any or all of the information in this presentation or otherwise made
available. It is not the intention to provide, and you may not rely on these materials as providing, a complete or comprehensive analysis of the financial or trading position or prospects
of the Group. No part of this presentation shall form the basis of or be relied upon in connection with any contract or commitment whatsoever. Further, nothing in this presentation
should be construed as constituting legal, business, tax or financial advice. You should conduct such independent investigations and analysis of the Group as you deem necessary or
appropriate in order to make an independent determination of the suitability, merits and consequences of investment in the Company.
This presentation contains “forward-looking statements”. These forward-looking statements involve known and unknown risks and uncertainties, many of which are beyond the
Company’s control and all of which are based on management’s current beliefs and expectations about future events. Forward-looking statements are sometimes identified by the use
of forward-looking terminology such as “believe”, “expects”, “may”, “will”, “could”, “should”, “shall”, “risk”, “intends”, “estimates”, “aims”, “targets”, “plans”, “predicts”, “continues”,
“assumes”, “positioned” or “anticipates” or the negative thereof, other variations thereon or comparable terminology. These forward-looking statements include all matters that are not
historical facts. Forward-looking statements are not guarantees of future performance. These forward-looking statements speak only as at the date of this presentation, and none of
the company, its shareholders, or any of their respective affiliates, directors, officers, employees, agents, advisers or any other person undertakes to update or revise any forward-
looking statements as a result of new information or to reflect future events or circumstances.
1

2
Vincom Retail (“VRE”) is the largest and fastest growing retail developer, owner
and operator in Vietnam
Key investment highlights are as follows:
Market leader in terms of the shopping mall GFA in Vietnam’s major cities…
…the direct proxy for consumer demand
Proven Track Record of
Highly Scalable Platform
with Strong Operating
Performance
Vietnam at an Economic
and Consumption
Inflection Point
Ability to Leverage the
Best-in-Country
Vingroup Ecosystem
Modern Retail Set to
Take Off
Experienced
Management Team with
Strong Corporate
Governance
Largest and Most
Dominant Retail Platform
The Dominant and Fastest Growing Retail Platform in Vietnam
Executive Summary
2
3
Residential
Premium
real estate
developer
Largest in
Vietnam
c.34,000
YTD units
sold
(Contracted
sales of VND
55.2
trillion)(2)
Hospitality
Leading
hospitality
operator in
Vietnam
Apprx.
16,627
rooms
owned &
managed
Education
Leading
private
school
operator
About
27,000
students
registered at
32 facilities(1)
Healthcare
Leading
hospital
operator
About 750
beds under
operation
7 full-service
general
hospitals
3
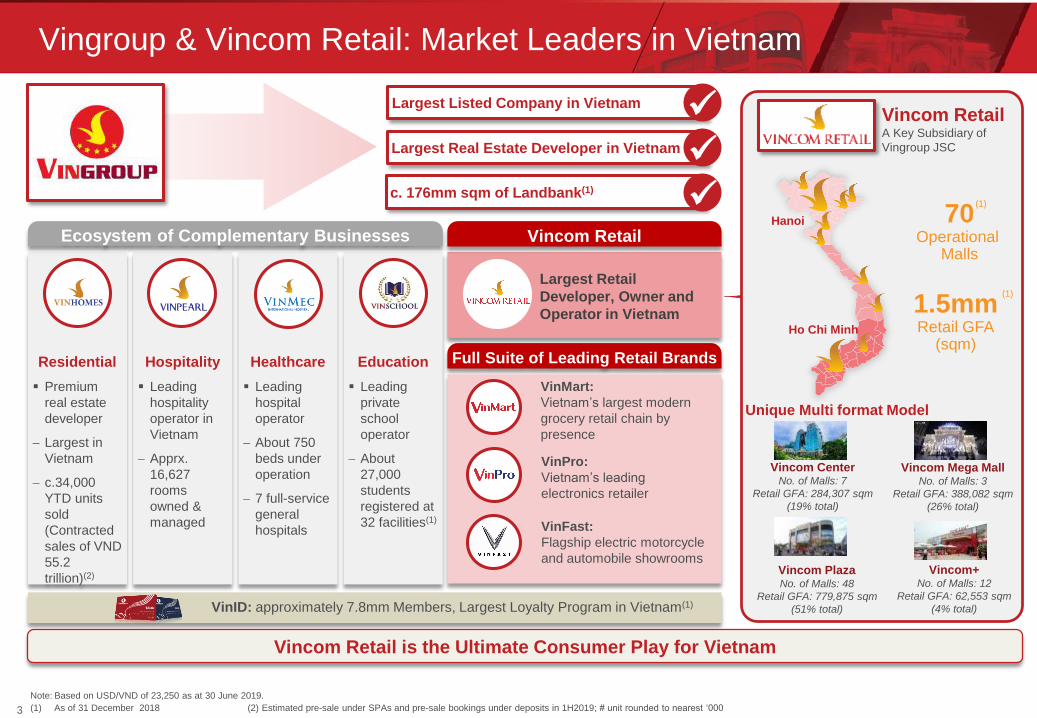
Vingroup & Vincom Retail: Market Leaders in Vietnam
Full Suite of Leading Retail Brands
1.5mmRetail GFA
(sqm)
70Operational
Malls
Hanoi
Ho Chi Minh
Vincom Retail is the Ultimate Consumer Play for Vietnam
Note: Based on USD/VND of 23,250 as at 30 June 2019.
(1) As of 31 December 2018 (2) Estimated pre-sale under SPAs and pre-sale bookings under deposits in 1H2019; # unit rounded to nearest ‘000
Vincom RetailA Key Subsidiary of
Vingroup JSC
Ecosystem of Complementary Businesses
Largest Retail
Developer, Owner and
Operator in Vietnam
VinMart:
Vietnam’s largest modern
grocery retail chain by
presence
VinPro:
Vietnam’s leading
electronics retailer
Vincom Retail
VinID: approximately 7.8mm Members, Largest Loyalty Program in Vietnam(1)
Largest Listed Company in Vietnam
Largest Real Estate Developer in Vietnam
Vincom Mega MallNo. of Malls: 3
Retail GFA: 388,082 sqm
(26% total)
Vincom PlazaNo. of Malls: 48
Retail GFA: 779,875 sqm
(51% total)
Vincom CenterNo. of Malls: 7
Retail GFA: 284,307 sqm
(19% total)
Vincom+No. of Malls: 12
Retail GFA: 62,553 sqm
(4% total)
Unique Multi format Model
VinFast:
Flagship electric motorcycle
and automobile showrooms
(1)
(1)
c. 176mm sqm of Landbank(1)
4
1 2 3 3 5 6 21 31 46 66
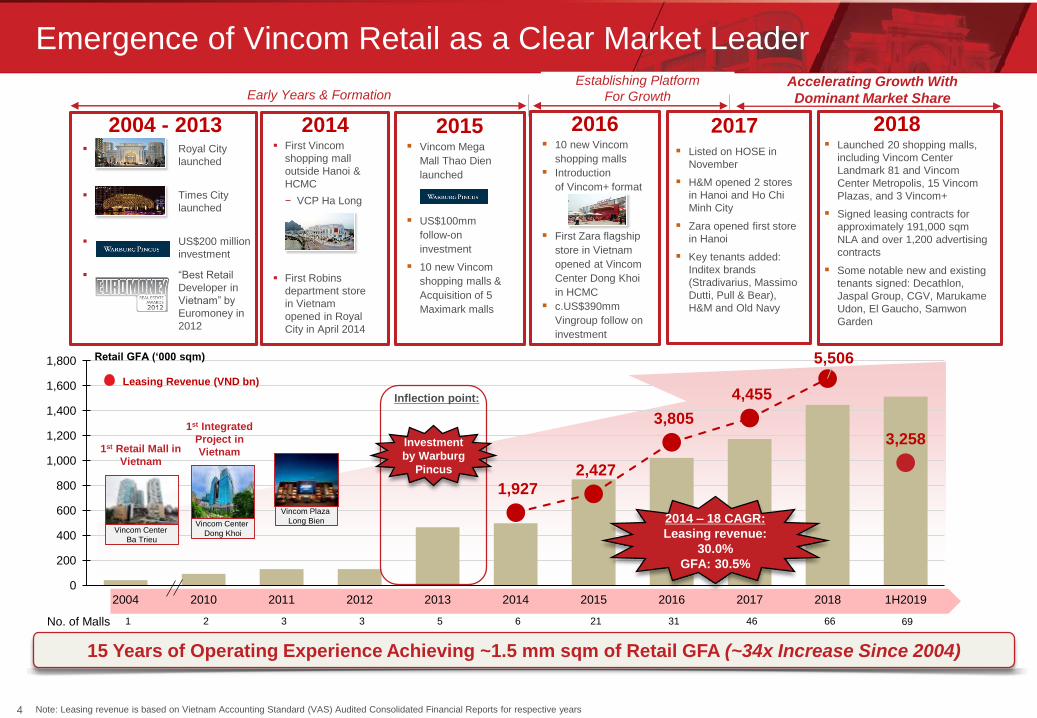
1,927 2,427
3,805
4,455
5,506
3,258
-20
980
1980
2980
3980
4980
5980
0
200
400
600
800
1,000
1,200
1,400
1,600
1,800
2004 2010 2011 2012 2013 2014 2015 2016 2017 2018 1H2019
Emergence of Vincom Retail as a Clear Market Leader
Early Years & FormationEstablishing Platform
For GrowthAccelerating Growth With
Dominant Market Share
2017 Listed on HOSE in
November
H&M opened 2 stores
in Hanoi and Ho Chi
Minh City
Zara opened first store
in Hanoi
Key tenants added:
Inditex brands
(Stradivarius, Massimo
Dutti, Pull & Bear),
H&M and Old Navy
2014 First Vincom
shopping mall
outside Hanoi &
HCMC
− VCP Ha Long
First Robins
department store
in Vietnam
opened in Royal
City in April 2014
15 Years of Operating Experience Achieving ~1.5 mm sqm of Retail GFA (~34x Increase Since 2004)
2015 Vincom Mega
Mall Thao Dien
launched
US$100mm
follow-on
investment
10 new Vincom
shopping malls &
Acquisition of 5
Maximark malls
No. of Malls
2016 10 new Vincom
shopping malls
Introduction
of Vincom+ format
First Zara flagship
store in Vietnam
opened at Vincom
Center Dong Khoi
in HCMC
c.US$390mm
Vingroup follow on
investment
2004 - 2013 Royal City
launched
Times City
launched
US$200 million
investment
“Best Retail
Developer in
Vietnam” by
Euromoney in
2012
Note: Leasing revenue is based on Vietnam Accounting Standard (VAS) Audited Consolidated Financial Reports for respective years
Retail GFA (‘000 sqm)
Vincom Center
Ba Trieu
Vincom Center
Dong Khoi
Vincom Plaza
Long Bien
1st Retail Mall in
Vietnam
1st Integrated
Project in
Vietnam
Leasing Revenue (VND bn)
Inflection point:
Investment
by Warburg
Pincus
2014 – 18 CAGR:
Leasing revenue:
30.0%
GFA: 30.5%
2018 Launched 20 shopping malls,
including Vincom Center
Landmark 81 and Vincom
Center Metropolis, 15 Vincom
Plazas, and 3 Vincom+
Signed leasing contracts for
approximately 191,000 sqm
NLA and over 1,200 advertising
contracts
Some notable new and existing
tenants signed: Decathlon,
Jaspal Group, CGV, Marukame
Udon, El Gaucho, Samwon
Garden
4
69

55
Retail Consolidates Around the Dominant Local Landlord
Global examples clearly demonstrate retail consolidation around the
dominant local landlord
Significant parallels seen between VRE and regional retail leaders
Vietnam's current position at an early, higher growth stage of the retail
cycle translates to a stronger growth profile and a more dominant market
share
Vincom Retail
Vietnam’s largest retail developer, owner and
operator
Scentre Group
Australia’s largest retail owner and
operator
SM Prime
Philippines’ largest retail real estate developerCentral Pattana
Thailand’s largest shopping mall developer arm of
Central Group
CapitaLand
Singapore’s largest retail mall owner and
manager
Simon Property
US’s largest shopping mall operator
Vietnam
Thailand
Singapore
Indonesia
Philippines
Australia
United States
1.0 1.5
2016 2018
GFA (mm sqm)
2007 2016 2007 2016
GFA (mm sqm)(3)
Market Share by GFA(2)
2008 2017
Market Share by NLA(3)
1996 2007
2002 2008
Market Share by GLA(5)
Source: Company filings, Colliers, Statista, Urban Redevelopment Authority, Savills, Urbis.
1. Based on Central Pattana’s retail NLA in Bangkok Metropolitan Area and total shopping mall NLA in Bangkok Metropolitan Area.
2. Based on SM Prime’s retail GFA in Metro Manila and total retail GFA in Metro Manila.
3. Malls greater than 100,000 sq ft NLA. CapitaLand’s market share includes directly owned as well as owned through CapitaLand Mall Trust.
4. Based on Lippo Karawaci’s retail GFA in Indonesia, and combined shopping mall GFA of Jakarta, Greater Jakarta and Surabaya. Total Indonesian Retail GFA unavailable.
5. Based on Westfield Holdings’ GLA in Australia in 2002 and 2008, divided by total Australia shopping center GLA in 2001 and 2007. Westfield Holdings was restructured into Scentre Group in 2014.
6. Based on Simon Property’s retail GLA in the U.S, and total shopping mall GLA in the U.S.
Lippo Karawaci
Indonesia’s largest mall owner and operator
arm of Lippo Group
Market Share by GFA(4)
11.1mm
Total Market Size (GLA sqm)(6)
502mm 657mm
14.9mm
Total Market Size (GLA sqm)(5)
10.7mm7.8mm
Market Share by GLA(6)
Total Market Size (NLA sqm)(3)
3.2mm 3.3mm
Total Market Size (GFA sqm)(2)
2013 2017 2013 2017
NLA (mm sqm)(1)
Market Share by NLA(1)
Total Market Size (NLA sqm)(1)
4.3mm3.9mm
Total Market Size (GFA sqm)(4)
6.8mm 8.5mm
0.6
15%
0.9
21%
13%
17%
32%39%
2.23.5
28%
33%19%
25%
2.1%3.4%
2012 2017

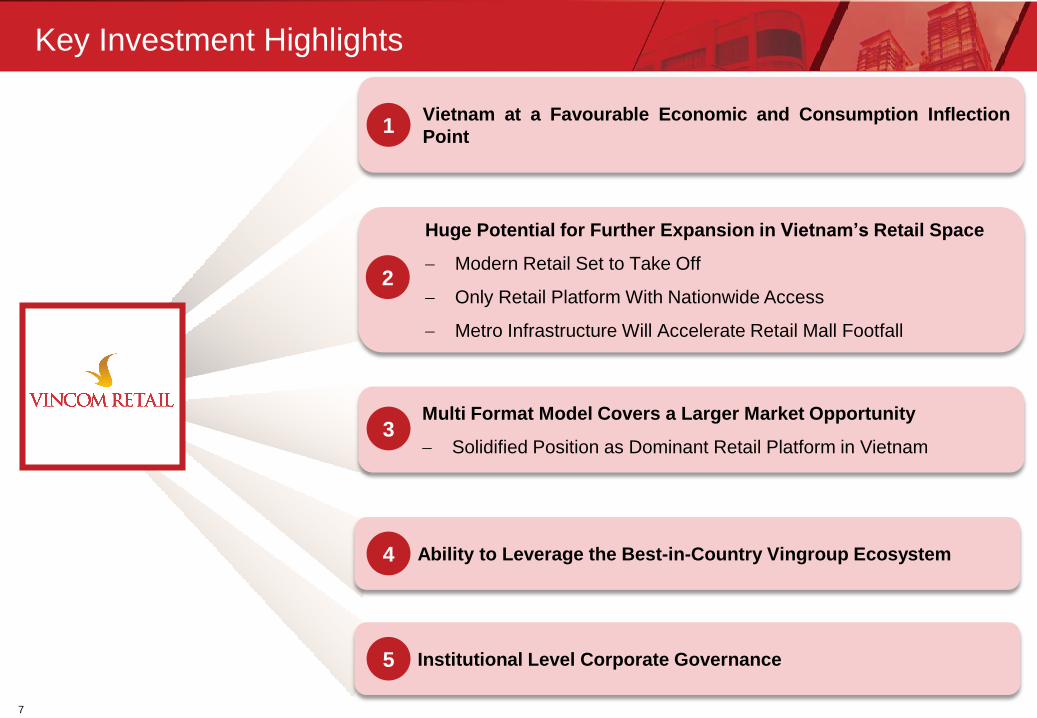
Key Investment Highlights
Key Investment Highlights
Vietnam at a Favourable Economic and Consumption Inflection
Point
Huge Potential for Further Expansion in Vietnam’s Retail Space
Modern Retail Set to Take Off
Only Retail Platform With Nationwide Access
Metro Infrastructure Will Accelerate Retail Mall Footfall
1
2
Multi Format Model Covers a Larger Market Opportunity
Solidified Position as Dominant Retail Platform in Vietnam
Ability to Leverage the Best-in-Country Vingroup Ecosystem4
7
Institutional Level Corporate Governance
3
5
8
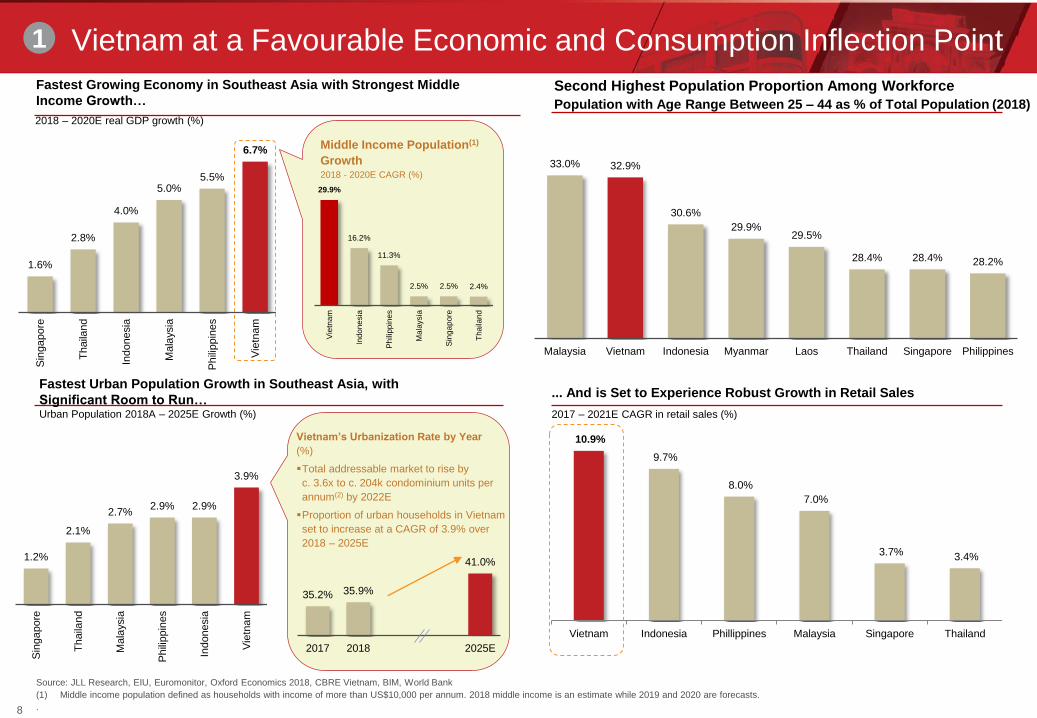
1.6%
2.8%
4.0%
5.0% 5.5%
6.7%
Sin
ga
pore
Thaila
nd
Indonesia
Ma
laysia
Ph
ilippin
es
Vie
tnam
10.9%
9.7%
8.0%
7.0%
3.7% 3.4%
Vietnam Indonesia Phillippines Malaysia Singapore Thailand
Vietnam at a Favourable Economic and Consumption Inflection Point
2017 – 2021E CAGR in retail sales (%)
... And is Set to Experience Robust Growth in Retail Sales
Second Highest Population Proportion Among Workforce
Population with Age Range Between 25 – 44 as % of Total Population (2018)2018 – 2020E real GDP growth (%)
Fastest Growing Economy in Southeast Asia with Strongest Middle
Income Growth…
Fastest Urban Population Growth in Southeast Asia, with
Significant Room to Run…Urban Population 2018A – 2025E Growth (%)
Source: JLL Research, EIU, Euromonitor, Oxford Economics 2018, CBRE Vietnam, BIM, World Bank
(1) Middle income population defined as households with income of more than US$10,000 per annum. 2018 middle income is an estimate while 2019 and 2020 are forecasts.
.
1
Middle Income Population(1)
Growth2018 - 2020E CAGR (%)
29.9%
16.2%
11.3%
2.5% 2.5% 2.4%
Vie
tna
m
Indo
ne
sia
Ph
ilipp
ine
s
Mala
ysia
Sin
ga
pore
Tha
ilan
d
8
Vietnam’s Urbanization Rate by Year
(%)
Total addressable market to rise by
c. 3.6x to c. 204k condominium units per
annum(2) by 2022E
Proportion of urban households in Vietnam
set to increase at a CAGR of 3.9% over
2018 – 2025E
35.2% 35.9%
41.0%
2017 2018 2025E
33.0% 32.9%
30.6%
29.9% 29.5%
28.4% 28.4% 28.2%
Malaysia Vietnam Indonesia Myanmar Laos Thailand Singapore Philippines
1.2%
2.1%
2.7%2.9% 2.9%
3.9%
Sin
ga
pore
Th
aila
nd
Mala
ysia
Ph
ilippin
es
Indonesia
Vie
tnam

10
930
1,576
2004 2020E
999
2,335
1990 2020E
Huge Potential for Further Expansion in Vietnam’s Retail Space
Low and fast growing disposable income per capita compared to neighboring countries, coupled with low
mall GFA, presents an opportunity to enlarge Vietnam’s retail mall space to close the regional gap.
Modern Retail is still at a Nascent Stage… …With the Growing Middle Class Set to Drive
Next Wave of Consumption
Disposable income per capita (US$)
Vietnam’s Disposable Income per Capita is similar to Philippines in
2004 and Thailand in 1990, implying huge growth potential
Source: EIU, Colliers, CBRE
Vietnam
Philippines
Thailand
Vietnam has a Low Mall GFA compared to Thailand and
Philippines(1) which is Compounded on a Per Capita Basis
2018 GFA per capita (sqm)2018 GFA (mm sqm)
950 1,018 1,122
?
2017 2018E 2019E Future
(1) As of 30 Sep 201810
2
0.1
1.0
0.5
Hanoi/ HCMC Bangkok Metro Manila
7.9x
4.4x1.9
8.0
6.9
Hanoi/ HCMC Bangkok Metro Manila
3.5x4.2x
70.0%
75.0%
80.0%
85.0%
90.0%
95.0%
100.0%
0.00
2.00
4.00
6.00
8.00
10.00
12.00
2013 2014 2015 2016 2017 2018 1H2019
x 1
00000
NLA Hanoi NLA HCMCOccupancy HN Occupany HCMC
Strong supply which validates the market’s potential, backed by
high rental growth and high occupancy rates
12
Source: EIU, Euromonitor, Vietnam Investment Review, Inside Retail Asia, CBRE Vietnam
(1) % E-commerce penetration represented by internet retailing over retailing.
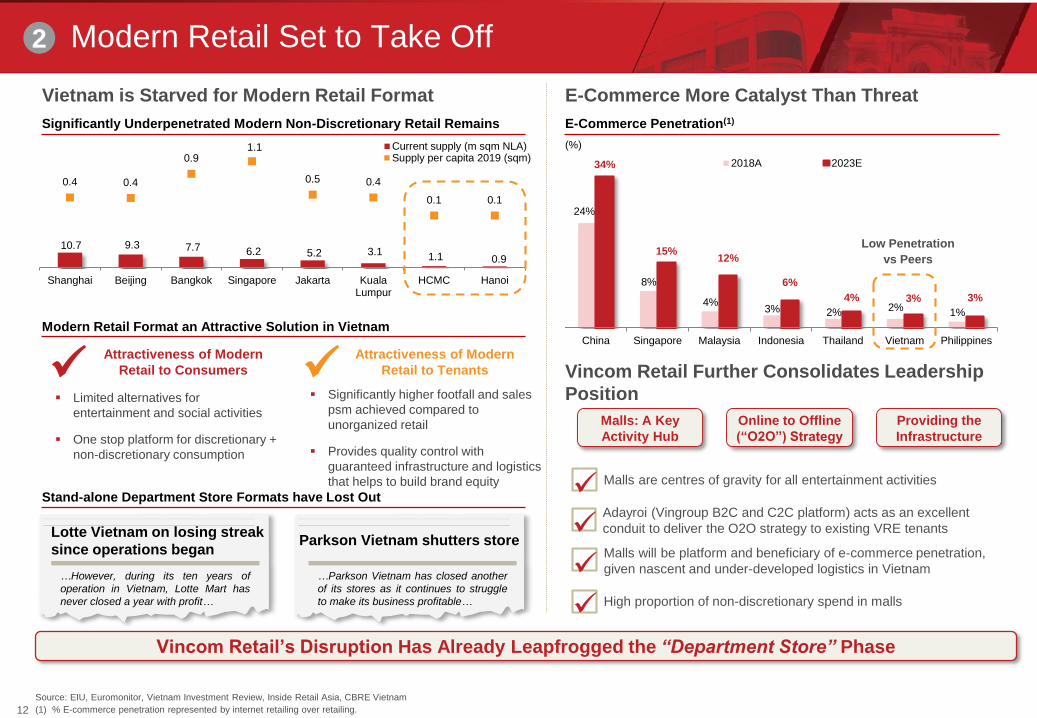
Modern Retail Set to Take Off
Vietnam is Starved for Modern Retail Format E-Commerce More Catalyst Than Threat
E-Commerce Penetration(1)
24%
8%
4%3% 2% 2%
1%
34%
15%12%
6%
4% 3% 3%
China Singapore Malaysia Indonesia Thailand Vietnam Philippines
2018A 2023E
(%)
Vincom Retail Further Consolidates Leadership
Position
Malls are centres of gravity for all entertainment activities
High proportion of non-discretionary spend in malls
Adayroi (Vingroup B2C and C2C platform) acts as an excellent
conduit to deliver the O2O strategy to existing VRE tenantsMalls will be platform and beneficiary of e-commerce penetration,
given nascent and under-developed logistics in Vietnam
Attractiveness of Modern
Retail to Consumers
Attractiveness of Modern
Retail to Tenants
Modern Retail Format an Attractive Solution in Vietnam
Significantly Underpenetrated Modern Non-Discretionary Retail Remains
Malls: A Key
Activity Hub
Online to Offline
(“O2O”) Strategy
Providing the
Infrastructure
Vincom Retail’s Disruption Has Already Leapfrogged the “Department Store” Phase
Low Penetration
vs Peers
Limited alternatives for
entertainment and social activities
One stop platform for discretionary +
non-discretionary consumption
Significantly higher footfall and sales
psm achieved compared to
unorganized retail
Provides quality control with
guaranteed infrastructure and logistics
that helps to build brand equity
Stand-alone Department Store Formats have Lost Out
Lotte Vietnam on losing streak
since operations began
…However, during its ten years of
operation in Vietnam, Lotte Mart has
never closed a year with profit…
Parkson Vietnam shutters store
…Parkson Vietnam has closed another
of its stores as it continues to struggle
to make its business profitable…
12
2
10.7 9.3 7.7 6.2 5.2 3.1 1.1 0.9
0.4 0.4
0.91.1
0.5 0.4
0.1 0.1
Shanghai Beijing Bangkok Singapore Jakarta KualaLumpur
HCMC Hanoi
Current supply (m sqm NLA)Supply per capita 2019 (sqm)
13
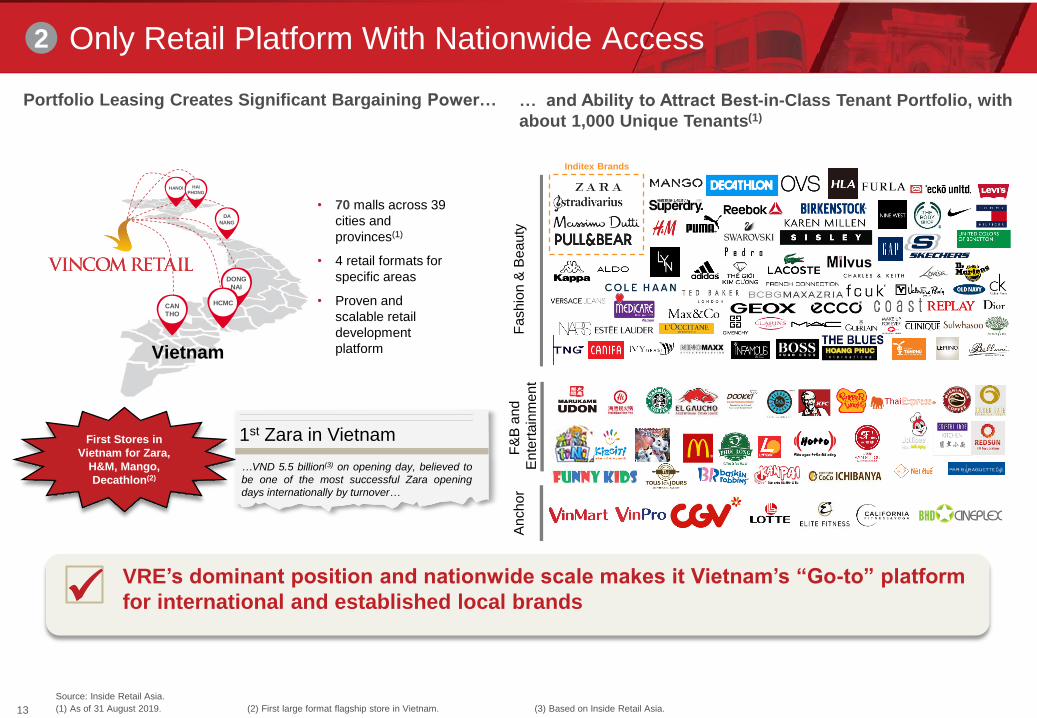
Only Retail Platform With Nationwide Access
Portfolio Leasing Creates Significant Bargaining Power… … and Ability to Attract Best-in-Class Tenant Portfolio, with
about 1,000 Unique Tenants(1)
Source: Inside Retail Asia.
(1) As of 31 August 2019. (2) First large format flagship store in Vietnam. (3) Based on Inside Retail Asia.
2
CAN
THO
DONG
NAI
HCMC
DA
NANG
HANOI HAI
PHONG
• 70 malls across 39
cities and
provinces(1)
• 4 retail formats for
specific areas
• Proven and
scalable retail
development
platform
VRE’s dominant position and nationwide scale makes it Vietnam’s “Go-to” platform
for international and established local brands
Fa
sh
ion
& B
ea
uty
Vietnam
First Stores in
Vietnam for Zara,
H&M, Mango,
Decathlon(2)
1st Zara in Vietnam
…VND 5.5 billion(3) on opening day, believed to
be one of the most successful Zara opening
days internationally by turnover…
Inditex Brands
F&
B a
nd
Ente
rtain
men
tA
nch
or
13
14
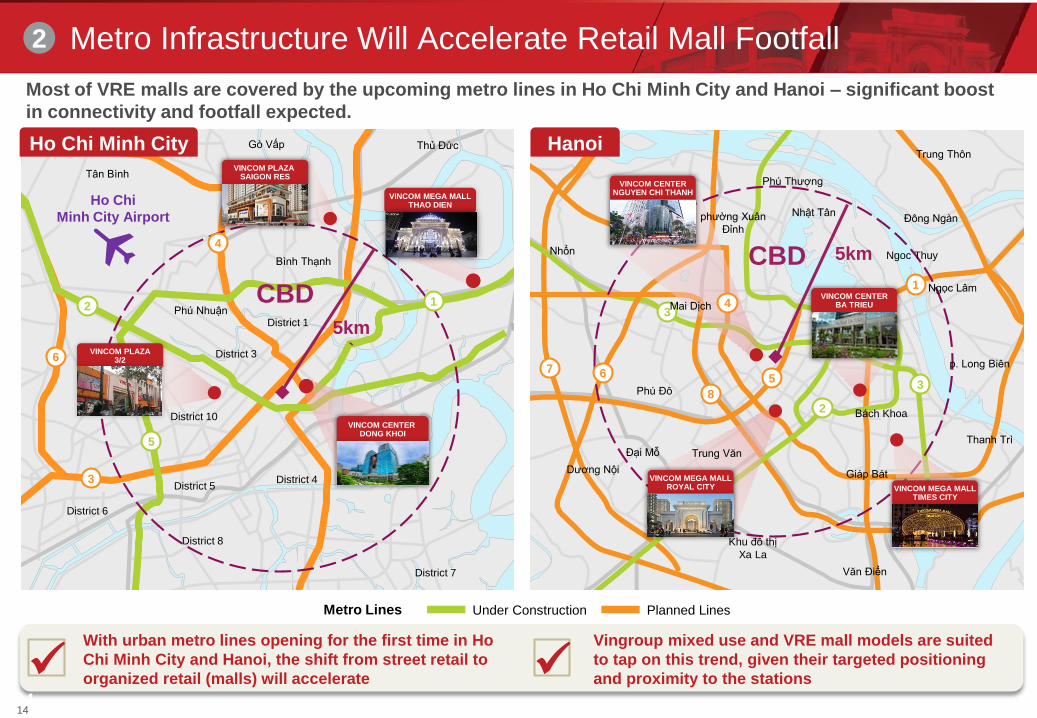
Metro Infrastructure Will Accelerate Retail Mall Footfall
CBD
Under Construction Planned Lines
District 6
District 5
District 8
District 4
District 7
District 3
District 1Phú Nhuận
Bình Thạnh
Gò Vấp Thủ Đức
Ho Chi
Minh City Airport
4
2
6
3
5
Tân Bình
District 10
CBD
Ho Chi Minh CityVINCOM PLAZA
SAIGON RES
VINCOM PLAZA3/2
VINCOM MEGA MALLTHAO DIEN
VINCOM CENTERNGUYEN CHI THANH
VINCOM MEGA MALLROYAL CITY
VINCOM CENTER DONG KHOI
VINCOM MEGA MALLTIMES CITY
VINCOM CENTERBA TRIEU
3
8
5
2
67
4
1
3
Trung Văn
Dương Nội
Mai Dịch
Nhổn
Bách Khoa
Giáp Bát
Khu đô thị
Xa La
p. Long Biên
Phú Thượng
Nhật Tân
Ngoc Thuy
phường Xuân
Đỉnh
Phú Đô
Đại Mỗ
Văn Điển
Thanh Trì
Đông Ngàn
Trung Thôn
Ngọc Lâm
Metro Lines
Most of VRE malls are covered by the upcoming metro lines in Ho Chi Minh City and Hanoi – significant boost
in connectivity and footfall expected.
Hanoi
With urban metro lines opening for the first time in Ho
Chi Minh City and Hanoi, the shift from street retail to
organized retail (malls) will accelerateVingroup mixed use and VRE mall models are suited
to tap on this trend, given their targeted positioning
and proximity to the stations
1
5km
`
5km
2
14

15
Multi Format Model Covers a Larger Market Opportunity
Household Annual
Income
Distribution
(% of Households
in Vietnam)(1)
Target Segment:
City Center/
CBD consumers
Middle & upper
middle incomeTarget Segment:
Integrated
development
catchment area
Targets families
across all
income segments Target Segment:
Heart of provincial
town plus urban
non-CBD
consumers of
key cities
Family &
activity hub
Middle income
Target Segment:
Regional &
non-CBD
catchment areas
Low to
middle income
Lotte
Target
Segment:
Upper middle
income
Holistic Segment Coverage Across Formats Competitors
Vincom Center Vincom Mega Mall Vincom Plaza Vincom+
AEON
Target
Segment:
Middle
income /
Upper middle
income
Vincom Retail has access
to addressable market
segment of over US$160bn
of retail revenue
Above
US$25,000
p.a
(1.6%)
US$3,000
p.a and
below
(17.5%)
US$3,000 –
US$5,000
p.a
(29.2%)
US$5,000 –
US$10,000
p.a
(38.3%)
US$10,000 –
US$25,000
p.a
(13.4%)
Source: EIU
Based on EIU estimates for year 2018. Definition refers to percentage of households with nominal disposable income per annum of various buckets.
3
15
16
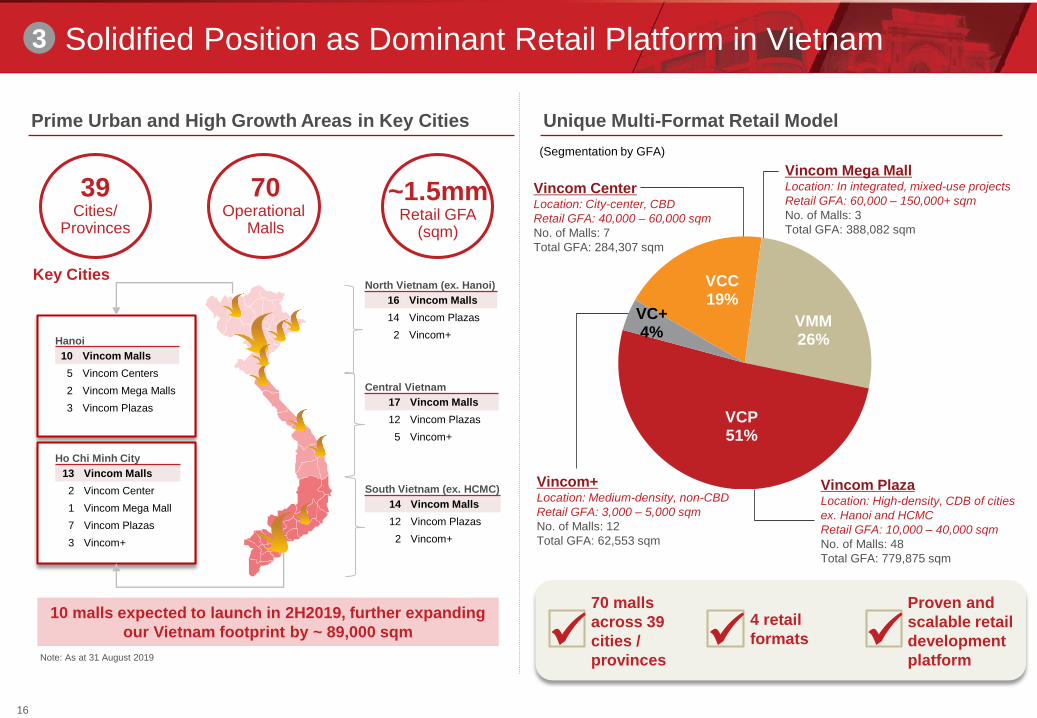
Prime Urban and High Growth Areas in Key Cities Unique Multi-Format Retail Model
VCC19%
VMM26%
VCP51%
VC+4%
70 malls
across 39
cities /
provinces
4 retail
formats
Proven and
scalable retail
development
platform
Vincom CenterLocation: City-center, CBD
Retail GFA: 40,000 – 60,000 sqm
No. of Malls: 7
Total GFA: 284,307 sqm
Vincom Mega MallLocation: In integrated, mixed-use projects
Retail GFA: 60,000 – 150,000+ sqm
No. of Malls: 3
Total GFA: 388,082 sqm
Vincom PlazaLocation: High-density, CDB of cities
ex. Hanoi and HCMC
Retail GFA: 10,000 – 40,000 sqm
No. of Malls: 48
Total GFA: 779,875 sqm
Vincom+Location: Medium-density, non-CBD
Retail GFA: 3,000 – 5,000 sqm
No. of Malls: 12
Total GFA: 62,553 sqm
(Segmentation by GFA)
Hanoi
10 Vincom Malls
5 Vincom Centers
2 Vincom Mega Malls
3 Vincom Plazas
Ho Chi Minh City
13 Vincom Malls
2 Vincom Center
1 Vincom Mega Mall
7 Vincom Plazas
3 Vincom+
North Vietnam (ex. Hanoi)
16 Vincom Malls
14 Vincom Plazas
2 Vincom+
Central Vietnam
17 Vincom Malls
12 Vincom Plazas
5 Vincom+
South Vietnam (ex. HCMC)
14 Vincom Malls
12 Vincom Plazas
2 Vincom+
Key Cities
70Operational
Malls
39Cities/
Provinces
~1.5mmRetail GFA
(sqm)
Note: As at 31 August 2019
Solidified Position as Dominant Retail Platform in Vietnam
10 malls expected to launch in 2H2019, further expanding
our Vietnam footprint by ~ 89,000 sqm
3
16
1717
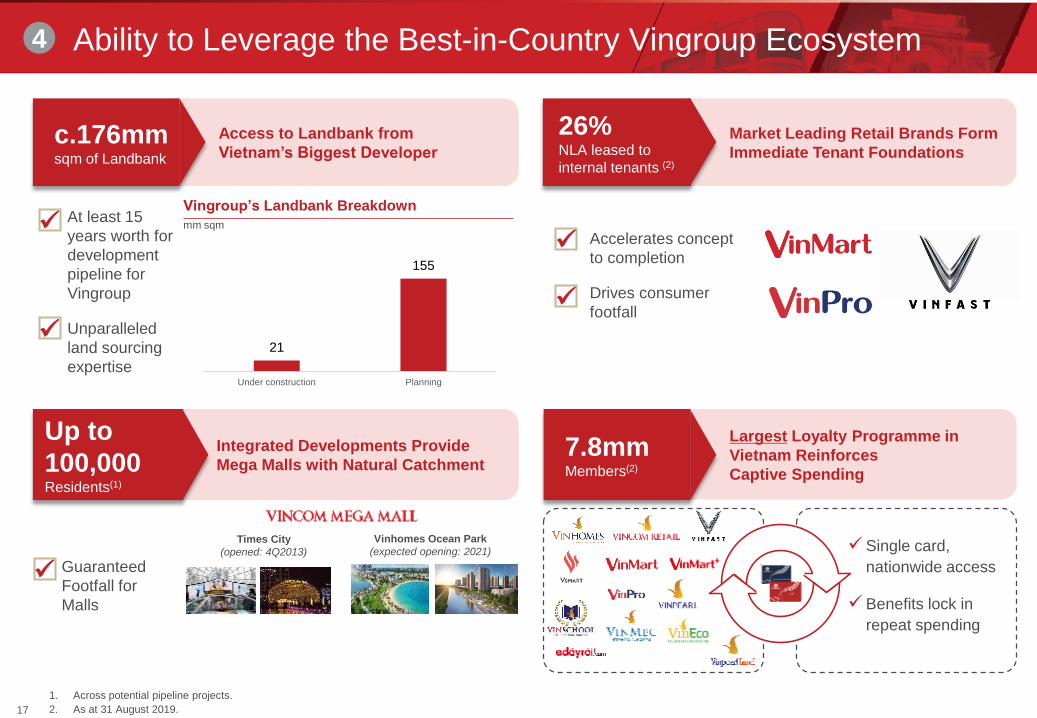
Ability to Leverage the Best-in-Country Vingroup Ecosystem
Largest Loyalty Programme in
Vietnam Reinforces
Captive Spending
Integrated Developments Provide
Mega Malls with Natural Catchment
Access to Landbank from
Vietnam’s Biggest Developer
At least 15
years worth for
development
pipeline for
Vingroup
Unparalleled
land sourcing
expertise
Vingroup’s Landbank Breakdown
mm sqm
Single card,
nationwide access
Benefits lock in
repeat spending
Guaranteed
Footfall for
Malls
Market Leading Retail Brands Form
Immediate Tenant Foundations
Accelerates concept
to completion
Drives consumer
footfall
c.176mm sqm of Landbank
Up to
100,000Residents(1)
26% NLA leased to
internal tenants (2)
7.8mm Members(2)
1. Across potential pipeline projects.
2. As at 31 August 2019.
21
155
Under construction Planning
Times City
(opened: 4Q2013)
Vinhomes Ocean Park
(expected opening: 2021)
4

18
Institutional Level Corporate Governance
Conflict Area Description Control
Decision Making• Vingroup will continue to be VRE’s majority
shareholder following the Offering
• All transactions must be entered into on commercially reasonable
basis as a statutory requirement.
• Significant related party transactions must be approved by the board
of directors or the general meeting of shareholders
• Interested parties must abstain from voting
Competition• Both Vingroup and VRE are in the business of property
development
• Non-compete from Vingroup on retail; VRE has a clear Right of First
Refusal (“ROFR”) for all stand-alone retail projects, retail
components and select mixed-use projects with well-defined criteria
Land Bank Access • Vingroup holds much larger land bank than VRE
• The ROFR above gives VRE economy of scale in land sourcing, and
delaying early-stage development costs
• VRE has ROFR on land that can be used for retail, at cost
• VRE has an independent land sourcing team and primarily focuses
on different types of projects than Vingroup
Related Party Tenants • VRE has related party-tenants (Vingroup entities)
• Allows VRE to expand faster with the key anchor tenants in place in
advance of commencing construction
• Leases are negotiated on an arms’ length commercial terms
• Governed by related party rules under “Decision Making”
Management Services
Contracts
• VRE has contracts with Vingroup entities such as
Vincom Security for non-core services such as
security, and Vingroup for headquarters services such
as marketing, treasury and corporate HR
• Fees are calculated based on comparable third-party service
providers and Vingroup fees are allocated based on number of man
hours and assets under management
• Helps VRE to manage expansion with minimum overhead as it can
share resources and costs with the rest of Vingroup
• Governed by related party rules18
5
Operational Update
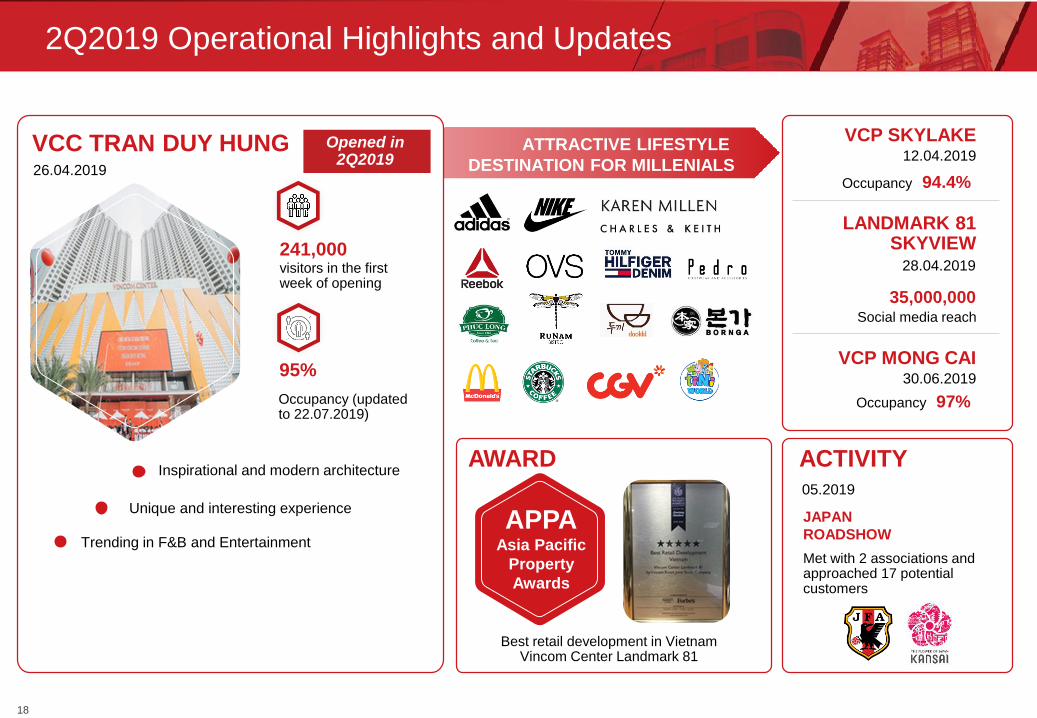
2Q2019 Operational Highlights and Updates
ATTRACTIVE LIFESTYLE
DESTINATION FOR MILLENIALSVCC TRAN DUY HUNG
visitors in the first week of opening
241,000
Occupancy (updated to 22.07.2019)
95%
Inspirational and modern architecture
Unique and interesting experience
Trending in F&B and Entertainment
VCP SKYLAKE12.04.2019
VCP MONG CAI30.06.2019
LANDMARK 81SKYVIEW
28.04.2019
Occupancy 94.4%
Social media reach
35,000,000
Occupancy 97%
APPAAsia Pacific
Property
Awards
Best retail development in VietnamVincom Center Landmark 81
05.2019
JAPAN
ROADSHOW
Met with 2 associations and approached 17 potential customers
AWARD ACTIVITY
26.04.2019
Opened in2Q2019
2018
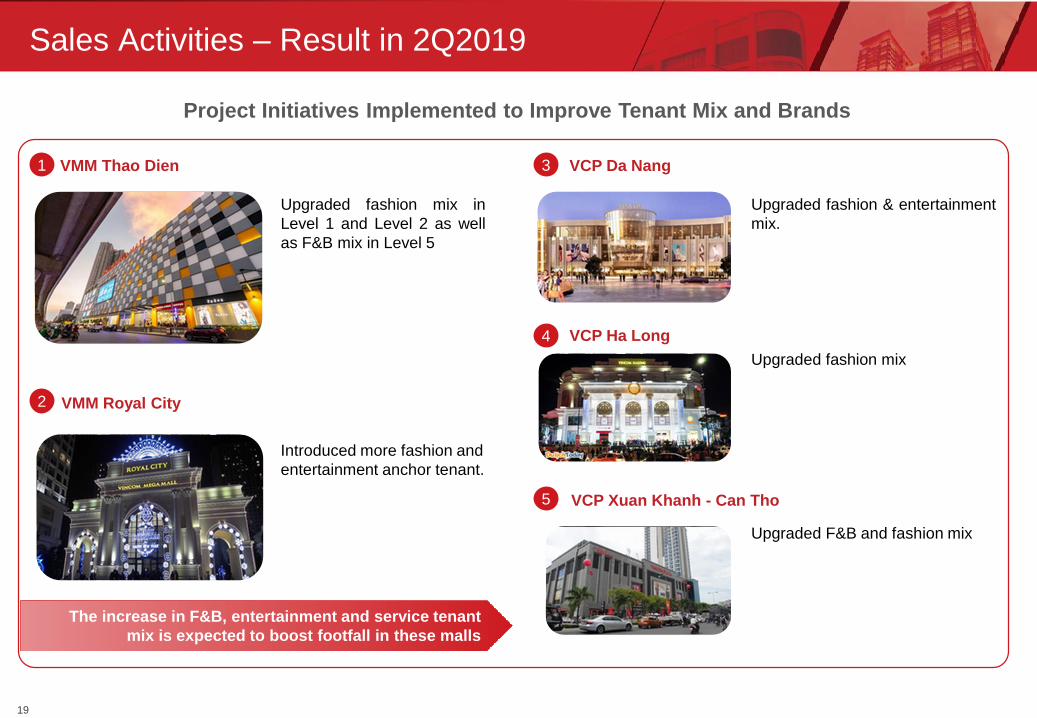
Sales Activities – Result in 2Q2019
Upgraded fashion & entertainment
mix.
Upgraded fashion mix in
Level 1 and Level 2 as well
as F&B mix in Level 5
VMM Royal City
VMM Thao Dien
Introduced more fashion and
entertainment anchor tenant.
VCP Da Nang
VCP Ha Long
VCP Xuan Khanh - Can Tho
Upgraded fashion mix
Upgraded F&B and fashion mix
Project Initiatives Implemented to Improve Tenant Mix and Brands
1 3
4
2
5
The increase in F&B, entertainment and service tenant
mix is expected to boost footfall in these malls
2119
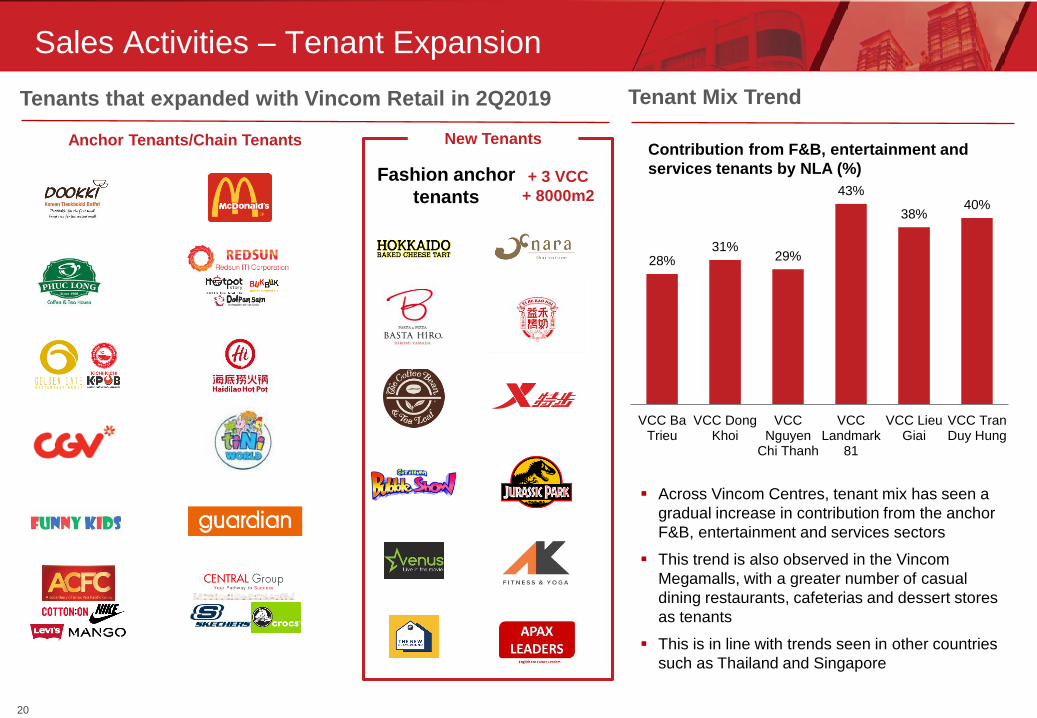
Sales Activities – Tenant Expansion
Tenants that expanded with Vincom Retail in 2Q2019 Tenant Mix Trend
New TenantsAnchor Tenants/Chain Tenants
+ 3 VCC
+ 8000m2
Across Vincom Centres, tenant mix has seen a
gradual increase in contribution from the anchor
F&B, entertainment and services sectors
This trend is also observed in the Vincom
Megamalls, with a greater number of casual
dining restaurants, cafeterias and dessert stores
as tenants
This is in line with trends seen in other countries
such as Thailand and Singapore
28%31%
29%
43%
38%40%
VCC BaTrieu
VCC DongKhoi
VCCNguyen
Chi Thanh
VCCLandmark
81
VCC LieuGiai
VCC TranDuy Hung
Fashion anchor
tenants
Contribution from F&B, entertainment and
services tenants by NLA (%)
2220
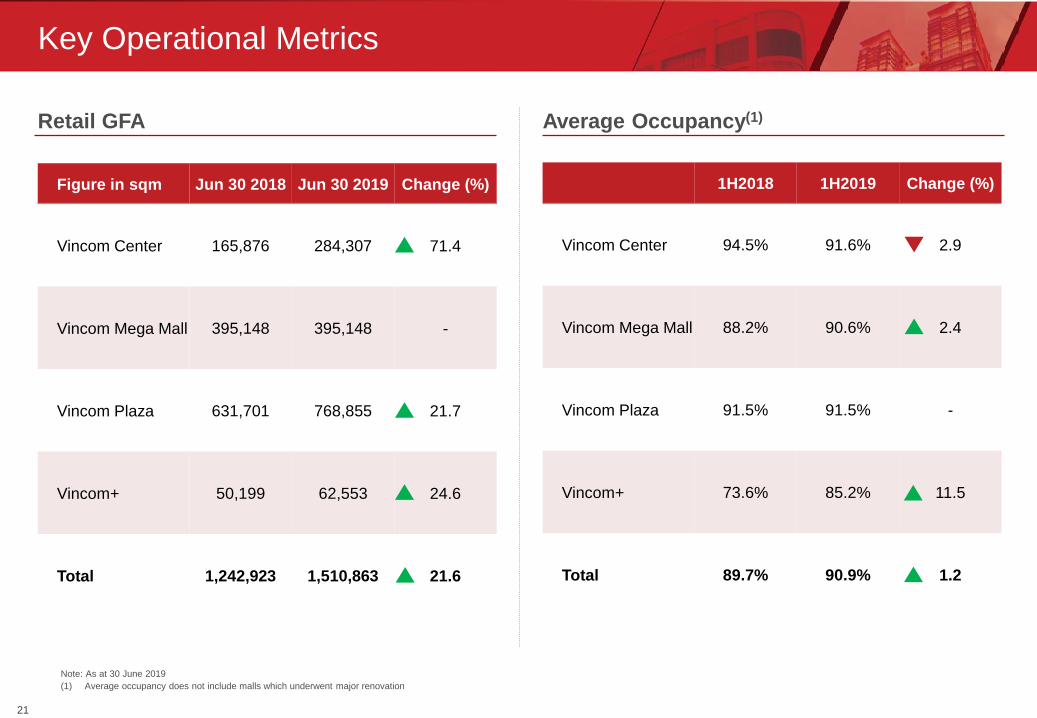
Retail GFA
Key Operational Metrics
Average Occupancy(1)
Figure in sqm Jun 30 2018 Jun 30 2019 Change (%)
Vincom Center 165,876 284,307 71.4
Vincom Mega Mall 395,148 395,148 -
Vincom Plaza 631,701 768,855 21.7
Vincom+ 50,199 62,553 24.6
Total 1,242,923 1,510,863 21.6
1H2018 1H2019 Change (%)
Vincom Center 94.5% 91.6% 2.9
Vincom Mega Mall 88.2% 90.6% 2.4
Vincom Plaza 91.5% 91.5% -
Vincom+ 73.6% 85.2% 11.5
Total 89.7% 90.9% 1.2
Note: As at 30 June 2019
(1) Average occupancy does not include malls which underwent major renovation
2321

24
3Q2019 Plan
Sales:
Continue to reach potential international tenants
Planning to source for anchor tenants for the 3 Vincom
Megamall projects located in Vinhomes mega projects, i.e.
Ocean Park, Smart City and Grand Park in 2H2019
Continue to upgrade the tenant mix of city projects such as
Thao Dien, Pham Ngoc Thach
Marketing – To organise highlight events that affirm Vincom as the
destination of choice for every local in areas where Vincom has presence
Launch Vincom 2019 Red Sale Carnival campaign
Launch the 2019 Mid-Autumn Campaign — 1 of 4 Vincom's biggest
campaigns of the year
Brainstorm of ideas for upcoming large scale campaigns such as
Black Friday and Christmas

Financial Highlights
26
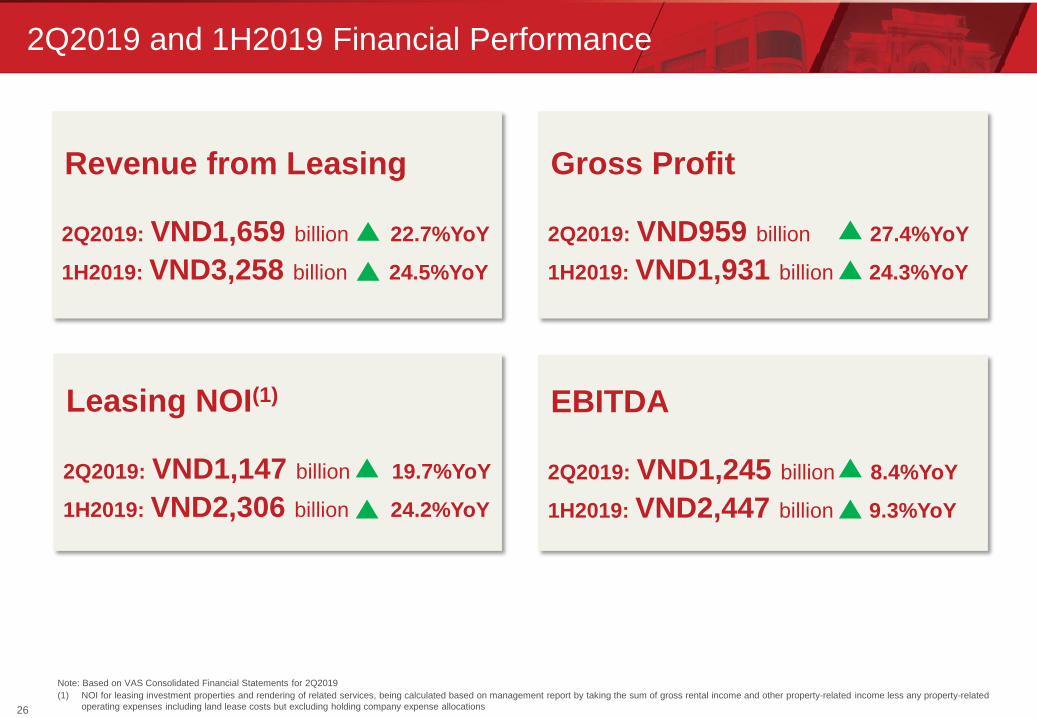
2Q2019 and 1H2019 Financial Performance
Note: Based on VAS Consolidated Financial Statements for 2Q2019
(1) NOI for leasing investment properties and rendering of related services, being calculated based on management report by taking the sum of gross rental income and other property-related income less any property-related
operating expenses including land lease costs but excluding holding company expense allocations
Revenue from Leasing
2Q2019: VND1,659 billion 22.7%YoY
1H2019: VND3,258 billion 24.5%YoY
Leasing NOI(1)
2Q2019: VND1,147 billion 19.7%YoY
1H2019: VND2,306 billion 24.2%YoY
Gross Profit
2Q2019: VND959 billion 27.4%YoY
1H2019: VND1,931 billion 24.3%YoY
EBITDA
2Q2019: VND1,245 billion 8.4%YoY
1H2019: VND2,447 billion 9.3%YoY
26

27
Financial Performance
VNDbn
Total Revenue Gross Profit(1)
VNDbn
Leasing Net Operating Income (NOI)(2)
VNDbn
Profit After Tax and Minority Interest
VNDbn
Gross Profit Margin (%)
33.7% 50.8%41.4%
Note: Based on VAS Audited Consolidated Financial Statements for respective years and VAS Reviewed Consolidated Financial Statements for 2Q2019
(1) Depreciation and amortization relating to investment properties is laid down below the graph and should be added back for IFRS. Since 2018, “Other” segment includes results from management of Da Nang condotels which was
loss-making as the property was still ramping up after launch in May 2018.
(2) NOI for leasing investment properties and rendering of related services, being calculated based on management report by taking the sum of gross rental income and other property-related income less any property-related
operating expenses including period land lease costs but excluding holding company expense allocations
39.9% 49.6% 45.3%
2,4273,805
4,4555,506
2,6183,258
3,267
2,556 951
3,433
492
903
26424
112
185
25
105
5,9586,386
5,518
9,124
3,134
4,267
2015 2016 2017 2018 1H2018 1H2019
Leasing of Investment Properties Sale of Inventory Properties Other revenue
1,401 2,011 2,342
2,882
1,390 1,701
607
623 411
806
163 269
(2)
8 48
(47)
0
(39)2,007
2,642 2,801
3,641
1,554 1,931
2015 2016 2017 2018 1H2018 1H2019
Leasing of Investment Properties Sale of Inventory Properties Other revenue
414 642 829 1,042 480 676
Depreciation & amortization of investment properties (VNDbn)
1,651
2,5903,089
3,829
1,8582,306
2015 2016 2017 2018 1H2018 1H2019
68.0% 68.1% 69.3% 69.5%
Leasing NOI Margin (%)
71.1% 70.9%
1,090
2,437
1,905
2,404
1,161 1,251
2015 2016 2017 2018 1H2018 1H2019
27
28
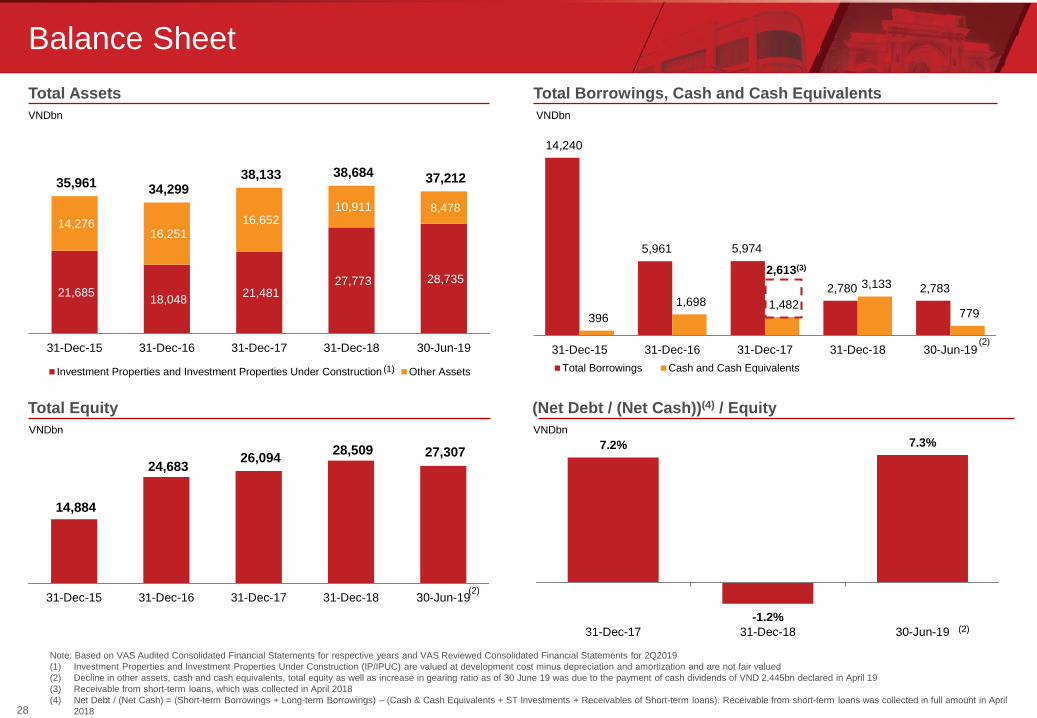
Balance Sheet
VNDbn
Total Assets
VNDbn
Total Equity
VNDbn
Total Borrowings, Cash and Cash Equivalents
(1)
(Net Debt / (Net Cash))(4) / Equity
VNDbn
21,685 18,048
21,481 27,773 28,735
14,276 16,251
16,652 10,911 8,478
35,961 34,299
38,133 38,684 37,212
31-Dec-15 31-Dec-16 31-Dec-17 31-Dec-18 30-Jun-19
Investment Properties and Investment Properties Under Construction Other Assets
14,884
24,683 26,094
28,509 27,307
31-Dec-15 31-Dec-16 31-Dec-17 31-Dec-18 30-Jun-19(2)
Note: Based on VAS Audited Consolidated Financial Statements for respective years and VAS Reviewed Consolidated Financial Statements for 2Q2019
(1) Investment Properties and Investment Properties Under Construction (IP/IPUC) are valued at development cost minus depreciation and amortization and are not fair valued
(2) Decline in other assets, cash and cash equivalents, total equity as well as increase in gearing ratio as of 30 June 19 was due to the payment of cash dividends of VND 2,445bn declared in April 19
(3) Receivable from short-term loans, which was collected in April 2018
(4) Net Debt / (Net Cash) = (Short-term Borrowings + Long-term Borrowings) – (Cash & Cash Equivalents + ST Investments + Receivables of Short-term loans). Receivable from short-term loans was collected in full amount in April
2018
7.2%
-1.2%
7.3%
31-Dec-17 31-Dec-18 30-Jun-19 (2)
14,240
5,961 5,974
2,780 2,783
396
1,698 1,482
3,133
779
31-Dec-15 31-Dec-16 31-Dec-17 31-Dec-18 30-Jun-19
Total Borrowings Cash and Cash Equivalents
2,613(3)
(2)
28

29
Financial Performance in 2Q 2019 vs. 2Q 2018
Note: VAS Reviewed Consolidated Financial Statements for 2Q2019
(1) Gross profit includes D&A relating to investment properties under VAS.
Figures in VND billion 2Q 2018 2Q 2019Change
(%)Commentary
Leasing of Investment
Properties and Rendering
of Related Services1,352 1,659 22.7
Leasing revenue growth mainly driven by growth from the 20
malls opened in 2018
Sale of Inventory
Properties156 302 93.2
Increase primarily driven by delivery of shop-house in Ca Mau
and Mong Cai
Other revenue 8 22 178.4
Total Revenue 1,516 1,983 30.8
Gross Profit(1) 753 959 27.4Lower gross margin reflects negative mix from higher growth in
sale of relatively lower margin inventory properties
Operating Profit / (Loss) 731 788 7.9
Profit / (Loss) before Tax 772 788 2.0
Profit / (Loss) after Tax for
the Period620 640 3.3
Profit / (Loss) after Tax and
Minority Interest620 639 3.1
29
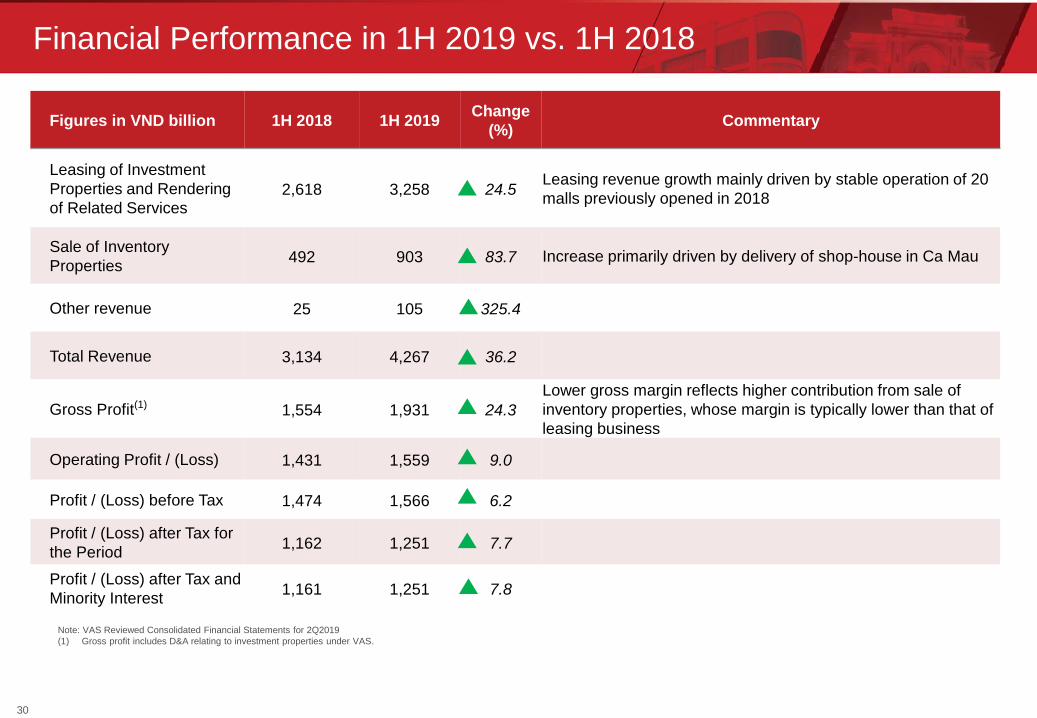
30
Figures in VND billion 1H 2018 1H 2019Change
(%)Commentary
Leasing of Investment
Properties and Rendering
of Related Services2,618 3,258 24.5
Leasing revenue growth mainly driven by stable operation of 20
malls previously opened in 2018
Sale of Inventory
Properties492 903 83.7 Increase primarily driven by delivery of shop-house in Ca Mau
Other revenue 25 105 325.4
Total Revenue 3,134 4,267 36.2
Gross Profit(1) 1,554 1,931 24.3
Lower gross margin reflects higher contribution from sale of
inventory properties, whose margin is typically lower than that of
leasing business
Operating Profit / (Loss) 1,431 1,559 9.0
Profit / (Loss) before Tax 1,474 1,566 6.2
Profit / (Loss) after Tax for
the Period1,162 1,251 7.7
Profit / (Loss) after Tax and
Minority Interest1,161 1,251 7.8
Financial Performance in 1H 2019 vs. 1H 2018
Note: VAS Reviewed Consolidated Financial Statements for 2Q2019
(1) Gross profit includes D&A relating to investment properties under VAS.

Appendix

32
Bridging VAS to IFRS – 1H2019
Note: Based on VAS Consolidated Financial Statements for 2Q2019 and conversion to IFRS by management, excluding impact from Investment Property and Investment Property Under Construction (IP/IPUC) revaluation
gain/loss
Unit: VND billion
VAS
1H2019
Adj. IFRS
1H2019
Commentary on Adjustments
Leasing revenue and other related
services3,258 (28) 3,230
Realized unearned revenue of deposit from customer in relation to
amortization of deposit
Sale of inventory properties 903 903
Other revenue 105 105
Total revenue 4,267 (28) 4,238
Cost of leasing activities and other related
services(1,557) 579 (978) Mostly depreciation of malls included in VAS; excluded under IFRS
Cost of inventory properties sold (634) (36) (670)Net Realizable Value adjustment of shop-office handed over during
1H2019
Others (144) (144)
Cost of goods & services (2,336) 543 (1,792)
Gross profit 1,931 515 2,446
Selling expenses (141) (141)
General and administrative expenses (243) 36 (206) Amortization of Goodwill included in VAS; excluded under IFRS
Other income 22 - 22
Other expense (15) (15)
Finance expense (146) (81) (227)Amortization of deposit from customer, and interest expense of lease
liabilities under IFRS16
Finance income 157 125 282 Amortisation of deposit under BCC
Profit before tax 1,566 595 2,161
Tax expense (314) 22 (292)Mainly Deferred tax from Net Realizable Value adjustment of shop-
office handed over during 1H2019
Profit after tax 1,251 617 1,869

Investor Relations Department
Vincom Retail JSC
7 Bang Lang 1, Vinhomes Riverside, Viet Hung Ward
Long Bien District, Hanoi, Vietnam
Tel: +84 (24) 3974 9999 ext. 9852
Fax: +84 (24) 3974 8888
Website: ir.vincom.com.vn/en
E-mail: [email protected]