correlation of stationary and pass-by noise · pdf filecorrelation of stationary and pass-by...
TRANSCRIPT

STUDY ON
CORRELATION OF STATIONARY AND PASS-BY NOISE LEVELS
&DEVELOPMENT OF NOISE STANDARDS FOR
IN-USE VEHICLESby
S. RAJU
Sr. Deputy DirectorAutomotive Research Association of India,
Pune, India

OBJECTIVE• To measure the stationary exhaust and engine
noise levels as per IS:10399-1998/ISO:5130-1982 (E) and pass-by noise level as per IS:3028-1998 of different CMVR categories of road vehicles.
• To measure as above for in-use vehicles of different categories and vintages (not more than 10 years old).
• To analyze the data obtained from above with the aim of suggesting noise limits for different categories of in-use vehicles.

New In-use1 2 Wheelers (<80 cc / 80-175 cc / > 175 cc) 25 (7/13/5) 15 (4/9/2)2 3 Wheelers (< 175 cc / > 175 cc) 10 (5/5) 06 (3/3)3 4 Wheelers (M1) 30 22
5 4 Wheelers (M2/N1 Vehicles with Max. Massbetween 2 tons and 3.5 tons) 5 (4/1) 4 (4/--)
64 Wheelers (M2/M3 Vehicles with Max. Massmore than 3.5 tons and engine power less than150 kW)
7 (1/6) 7(3/4)
84 Wheelers (N2/N3 Vehicles with Max. Massmore than 3.5 tons and engine power less than75 kW)
10 (10/--) 1 (1/--)
94 Wheelers (N2/N3 Vehicles with Max. Massmore than 3.5 tons and engine power of 75 kWand above but below 150 kW)
4 (--/4) 6 (--/6)
TOTAL 91 61
7Nil
(vehicles of this type are not produced in India)
Nil (vehicles of this type are not
produced in India)10
4 Wheelers (M2/M3 Vehicles with Max. Massmore than 3.5 tons and engine power of 150 kWand above)
4 Wheelers (N2/N3 Vehicles with Max. Massmore than 3.5 tons and engine power of 150 kWand above)
4 Wheelers (M2/N1 Vehicles with Max. Massless than 2 tons)4
Nil (vehicles of this type are not
produced in India)
TABLE-I: CLASSIFICATION OF VEHICLES TAKEN UP FOR THE STUDY
Sl. No. Vehicle Classification No. of Vehicles

STATIONARY ENGINE NOISE MEASUREMENT
ISO:5130-1982• Not included in the main body but as an Annexure.
• “because it requires instrumentation which is presently under development in different countries to avoid damage to the engine”
• Draft revision suggest deletion of this test.
JAPAN
• Introduced in 1952
• Changed over in 1986 to proximity safety noise level test which is the same as stationary exhaust noise test
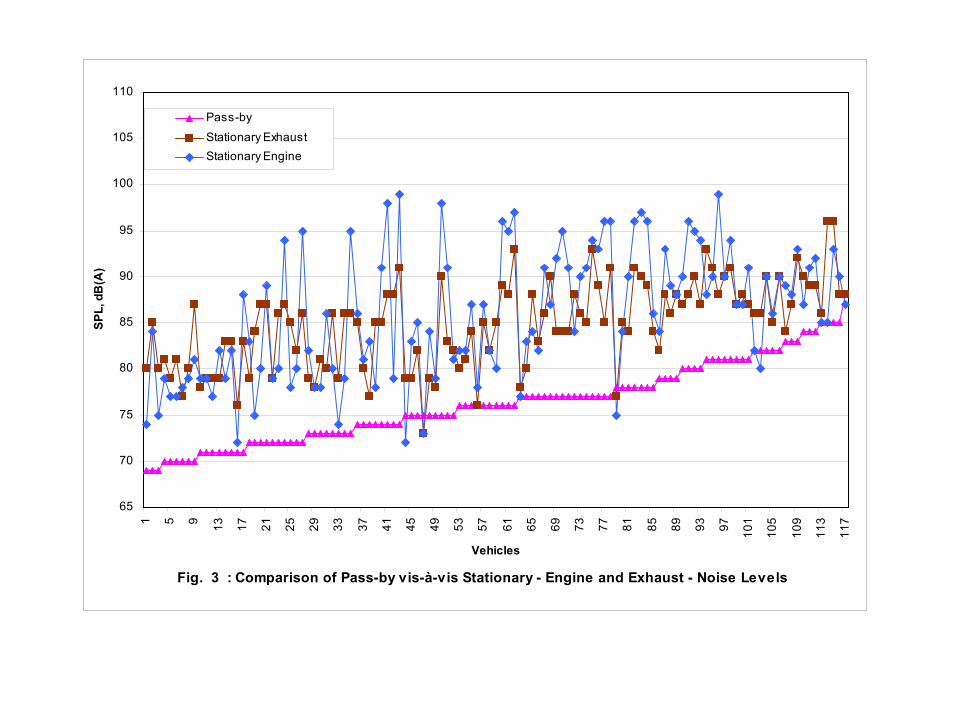
Fig. 3 : Comparison of Pass-by vis-à-vis Stationary - Engine and Exhaust - Noise Levels
65
70
75
80
85
90
95
100
105
110
1 5 9 13 17 21 25 29 33 37 41 45 49 53 57 61 65 69 73 77 81 85 89 93 97 101
105
109
113
117
Vehicles
SPL,
dB
(A)
Pass-by
Stationary ExhaustStationary Engine

Fig. 16 : Comparison of Stationary and Pass-by Noise Levels of all 91 New Vehicles of Different Categories
y = 0.0938x + 79.509
y = 0.0547x + 72.813
60
65
70
75
80
85
90
95
100
105
110
1 4 7 10 13 16 19 22 25 28 31 34 37 40 43 46 49 52 55 58 61 64 67 70 73 76 79 82 85 88 91
Vehicles
SPL
in "
dBA
"
Pass By "dBA"
Stationary "dBA"
2W 3W M1 N1 N2 M2 M3 N3
7 d
B(A
)
10
dB(A
)
Overall AveragePass-by 75 dB(A)
Stationary 83 dB(A)
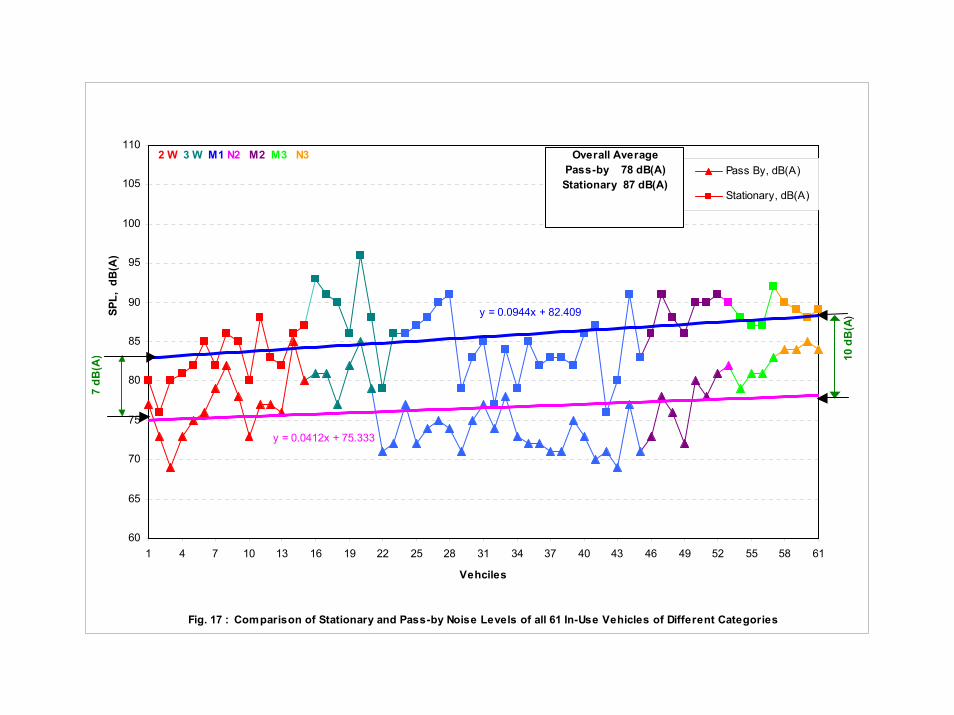
Fig. 17 : Comparison of Stationary and Pass-by Noise Levels of all 61 In-Use Vehicles of Different Categories
y = 0.0412x + 75.333
y = 0.0944x + 82.409
60
65
70
75
80
85
90
95
100
105
110
1 4 7 10 13 16 19 22 25 28 31 34 37 40 43 46 49 52 55 58 61
Vehciles
SPL,
dB
(A)
Pass By, dB(A)
Stationary, dB(A)
2 W 3 W M1 N2 M2 M3 N3
7 d
B(A
) 10
dB(A
)
Overall AveragePass-by 78 dB(A)Stationary 87 dB(A)

Fig. 6 : Comparison of Average Values of Stationary and Pass-by Noise Levels of Two and Three Wheelers
70
75
80
85
90
95
100
< 80 cc between 80 ccand 175 cc
> 175 cc 2 Wheeler 3 Wheeler
Category
SPL,
dB
(A)
Pass-by
Stationary
6.7 5.
3
5.7
5.8
11
2 Wheelers
New VehiclesIn-use VehiclesAverage

Fig. 8 : Comparison of Stationary and Pass-by Noise Levels of all 52 M1 Category Vehicles
y = 0.1759x + 78.519
y = 0.0905x + 70.61965
70
75
80
85
90
95
100
1051 3 5 7 9 11 13 15 17 19 21 23 25 27 29 31 33 35 37 39
Vehicles
SPl
,dB
(A)
Pass By, dB(A)
Stationary, dB(A)
New Vehicle In - use Vehicle
7 dB
(A)
11 d
B(A
)
Overall AveragePass-by 73 dB(A)
Stationary 82 dB(A)
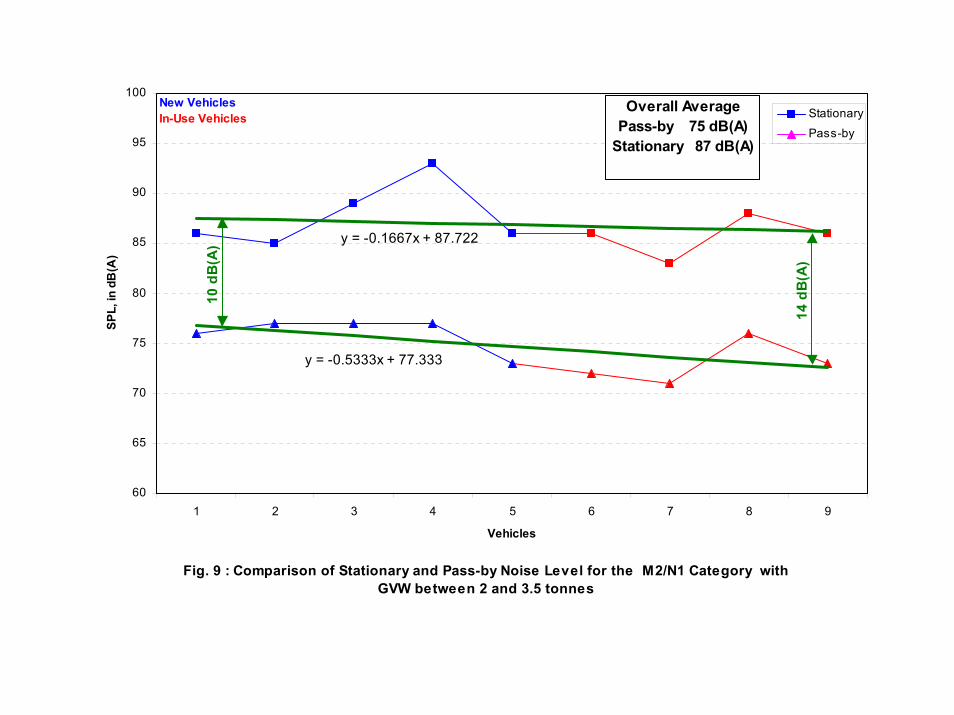
Fig. 9 : Comparison of Stationary and Pass-by Noise Level for the M2/N1 Category with GVW between 2 and 3.5 tonnes
y = -0.1667x + 87.722
y = -0.5333x + 77.333
60
65
70
75
80
85
90
95
100
1 2 3 4 5 6 7 8 9
Vehicles
SPL,
in d
B(A
)Stationary
Pass-by
10 d
B(A
)
14 d
B(A
)
New VehiclesIn-Use Vehicles
Overall AveragePass-by 75 dB(A)
Stationary 87 dB(A)

Fig. 10 : Comparison of Stationary and Pass-by Noise Level for the M2/M3 Category with Engine Capacity Less Than 150 kW
y = 0.2264x + 86.945
y = 0.0681x + 79.275
70
75
80
85
90
95
100
1 2 3 4 5 6 7 8 9 10 11 12 13 14
Vehicles
SPL,
dB(A
)Stationary
Pass-by
8 dB
(A)
10 d
B(A
)
New VehiclesIn-Use Vehicles
Overall AveragePass-by 80 dB(A)
Stationary 89 dB(A)

Fig. 11 :Comparison of Stationary and Pass-by Noise Levels of all 11 N2/N3 Category Vehicles with Max. Mass More Than 3.5 tons and Engine Power Less Than 75 kW
y = 0.1455x + 87.764
y = 0.1182x + 77.564
60
65
70
75
80
85
90
95
100
1 2 3 4 5 6 7 8 9 10 11
Vehicles
SPL,
dB
(A)
Stationary
Pass-by
10 d
B(A
)
11 d
B(A
)
New VehiclesIn-Use Vehicles
Overall AveragePass-by 78 dB(A)
Stationary 89 dB(A)
s

Fig. 12 : Comparison of Stationary and Pass-by Noise Level for the N2/N3 Category with Engine Capacity between 75kW and 150 kW
y = 0.0909x + 88.4
y = 0.1333x + 82.667
75
80
85
90
95
100
1 2 3 4 5 6 7 8 9 10
Vehicles
SPL,
dB
(A)
Stationary
Pass-by
6 dB
(A)
5 dB
(A)
New VehiclesIn-Use Vehicles
Overall AveragePass-by 83 dB(A)
Stationary 89 dB(A)

Fig.13 Comparison of Correlation of Stationary and Pass-by Noise Levels Between Measured Data and Literature for Commercial Vehicles (Ref. 22)
y = 0.2478x + 68.587
y = 0.8532x + 26.856
80
85
90
95
100
105
110
115
65 70 75 80 85 90 95 100
Pass BY SPL,dB(A)
M2/N2M3/N3Combined M2/N2/M3/N3Comparison for Brazilian Commercial Vehicles(Ref.22)
Fig. 14 : Correlation of Pass-by and Stationary Noise Levels of all 152 Vehicles
y = 0.7076x + 30.85
65
69
73
77
81
85
89
93
97
101
105
109
65 69 73 77 81 85 89
Pass By SPL, dB(A)
Stat
iona
ry S
PL, d
B(A
)

Fig. 15: Global Comparison of the Difference Between Stationary and Pass-by Noise Levels for Different Categories of Vehicles
70
75
80
85
90
95
100
2W(< 80cc)
2W(between 80cc and 175
cc)
2W( >175 cc)
3W( <175 cc)
3W( >175 cc )
M1 M2/N1(GVW
between 2& 3.5t)
M2 / M3( <150 kW)
N2 / N3 (<75 kW)
N2 / N3(Between
75 and 150kW)
Category
SPL,
dB
(A)
Pass-by
Stationary
6
11 11
12
9
6
7
5
9 10

Pass-By
Statio-nary
Age in km
Pass-By
Diff. * Statio-nary
Diff. * Age in km
Pass-By
Diff. * Statio-nary
Diff. * Age in km
Pass-By
Diff. *
Two Wheelers (7)1 81 84 6000 80 -1 87 32 70 81 10496 69 -1 80 -1 15984 73 3 81 03 79 88 12078 85 6 86 -24 75 79 21532 79 4 82 35 75 79 39728 77 2 80 16 76 81 53675 73 -3 80 -1
76 82 77.167 82.5 73 81Three Wheelers (5)
7 77 84 15000 85 8 96 12 34887 82 5 86 2 200000 79 28 72 87 112113 77 5 90 3 200000 81 9 93 6
M1 Category Vehicles (15)9 77 84 2974 78 1 84 0 3100 77 0 85 1 12974 77 010 74 88 4796 74 0 91 3 52635 75 1 90 211 71 77 5762 69 -2 80 3 141076 71 0 76 -1 380393 71 012 72 84 8910 72 0 85 113 69 85 9000 71 2 79 -6 33676 71 2 83 -214 72 79 9684 73 1 79 015 73 86 13191 72 -1 86 0 46570 74 1 88 2 107058 73 0
M2 / N1 Category Vehicles between 2t & 3.5t (1)16 M2 73 86 12000 72 -1 86 0
M2 / M3 Category Vehicles less than 150kW (1)17 M3 79 86 100000 81 2 87 1
N2 / N3 Category Vehicles less than 75kW (1)18 N2 76 92 13595 78 2 90 -2
N2 / N3 Category Vehicles between 75kW and 150kW (1)19 N3 81 88 300000 84 3 89 1
Diff. * - The difference In the Stationary and Pass-by Noise Levels between In-Use and New Vehicles
In-Use
TABLE V : Comparison of Variation in Pass-by and Stationary Noise Levels of New and In-Use Vehicles - 31 Vehicles of 19 Models
(All Values in dB(A))
SR. NO
New

Fig. 18 :Comparison of Variation in the Stationary and Pass-by Noise Levels Between New and In-use Vehicles (31 Vehicles of 19 Models)
1
1
6
42
3
2
5
0
0
20
2
1 1 1
2
2
3
3
34
0
1
00
0
3
1
2
31
1
1
3
0
2
1
1
40
0 0
2
1
1
2
3
1
1
2
20
8
1
1
2
65
70
75
80
85
90
95
100
1 2 3 4 5 6 7 8 9 10 11 12 13 14 15 16 17 18 19
SPL,
dB
(A)
Pass-by Stationary
Vehicle Model Number of In-use Vehicles Tested in Each Model
1 2 1 1 1 1 2 2 3 2 3 1 2 1 3 1 1 1 1

NOISE LEVEL IN NEW AND IN-USE VEHICLES
4 / 6 (M2/M3)8 / 10 (N2/N3)
1.25 / 0 / 12-300,000
M2 / M3 / N2 / N3
8 /180.25 / 0.35 / 8-400,000
M1
8 / 106 / 6 / 15-200,0003 Wheelers
9 / 101.6 / 0.5 / 6-54,0002 Wheelers
Range of Pass-by / Stationary in New Vehicles,
dB(A)
Avg. Increase in Pass-by /
Stationary / Mileage,
dB(A) / dB(A) / km
Class

Table VI : Comparison of Noise Limits in Japan and Australia
17103862410783Other Vehicles> 200 PS
18101832210583Other Vehicles≤ 200 PS
1390772510378M1/N1
139077---------3 Wheelers
13-179477-812499752 Wheelers
Diff.Statio-nary
Pass-byDiff.Statio-nary
Pass-by
AustraliaJapan
Noise Limits, dB(A)Vehicle
Category
No allowance for in-use vehicles over pass-by
Norway : 5 dB(A)
EEC/ECE : 3dB(A) …?

NOISE LIMITS FOR IN-USE VEHICLES
• Not many countries with legislation for in-use vehicle noise norms• New South Wales ranging from 85 dB(A) to 103 dB(A)• Japan ranging between 94 and 99 dB(A)• As compared to 96 dB(A), the highest noise level measured in the
present study for a N3 new vehicle
• No stationary noise levels prescribed for type approval under EPA.
• FMCSA specifies 88 dB(A) for vehicles with mass more than 4.5 tons.
• Measurement procedure in USA is different :> the point of measurement is 15 m away from the exhaust as
against 0.5 m in ISO [adds 29.5 dB(A)]> the engine has to be tested from idling to no-load governed speed as against upto 75% of the same in ISO:5130 and other European standards [adds 3-7 dB(A)]
• Results in 120-124 dB(A)
NOISE LIMITS FOR IN-USE VEHICLES
• Aim of proposed revision of ISO:5130-2002 : To provide a simple method for use in road-side check. Not recommended against a general noise limit for categories
of road vehicles. But with reference to measurements made under similar
conditions such as during the type approval of road vehicles.
• Globally looking, mandatory noise limits for in-use vehicles seems to be the exception rather than a rule. Further, wherever such norms has been legislated, the limits have been kept very high so that their effectiveness is not felt.
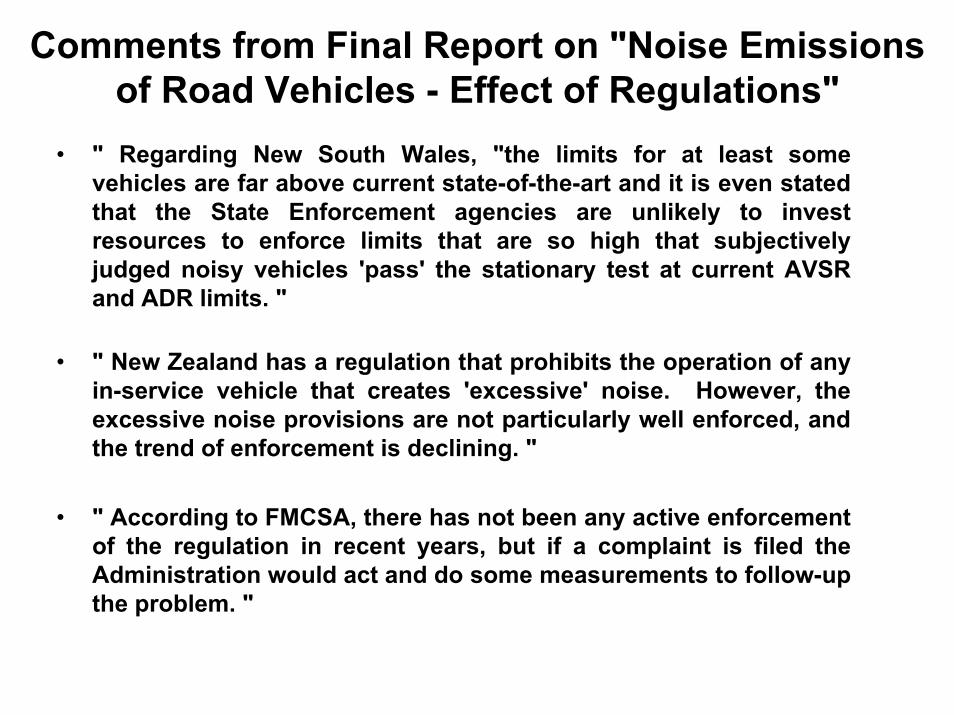
Comments from Final Report on "Noise Emissions of Road Vehicles - Effect of Regulations"
• " Regarding New South Wales, "the limits for at least some vehicles are far above current state-of-the-art and it is even stated that the State Enforcement agencies are unlikely to invest resources to enforce limits that are so high that subjectively judged noisy vehicles 'pass' the stationary test at current AVSRand ADR limits. "
• " New Zealand has a regulation that prohibits the operation of any in-service vehicle that creates 'excessive' noise. However, the excessive noise provisions are not particularly well enforced, and the trend of enforcement is declining. "
• " According to FMCSA, there has not been any active enforcement of the regulation in recent years, but if a complaint is filed the Administration would act and do some measurements to follow-up the problem. "
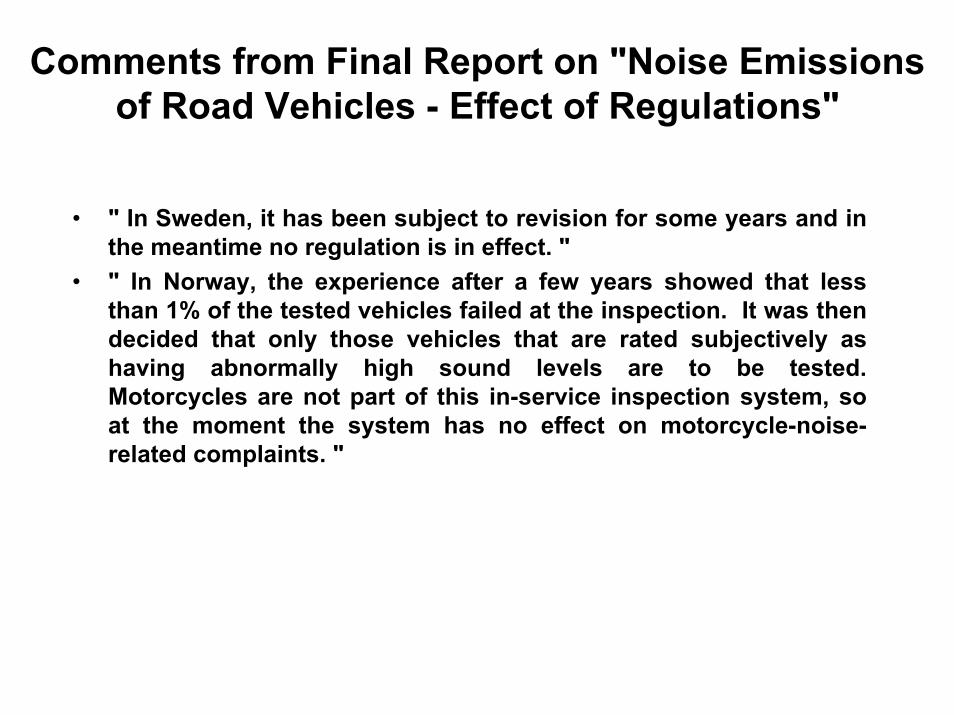
Comments from Final Report on "Noise Emissions of Road Vehicles - Effect of Regulations"
• " In Sweden, it has been subject to revision for some years and in the meantime no regulation is in effect. "
• " In Norway, the experience after a few years showed that less than 1% of the tested vehicles failed at the inspection. It was then decided that only those vehicles that are rated subjectively as having abnormally high sound levels are to be tested. Motorcycles are not part of this in-service inspection system, so at the moment the system has no effect on motorcycle-noise-related complaints. "
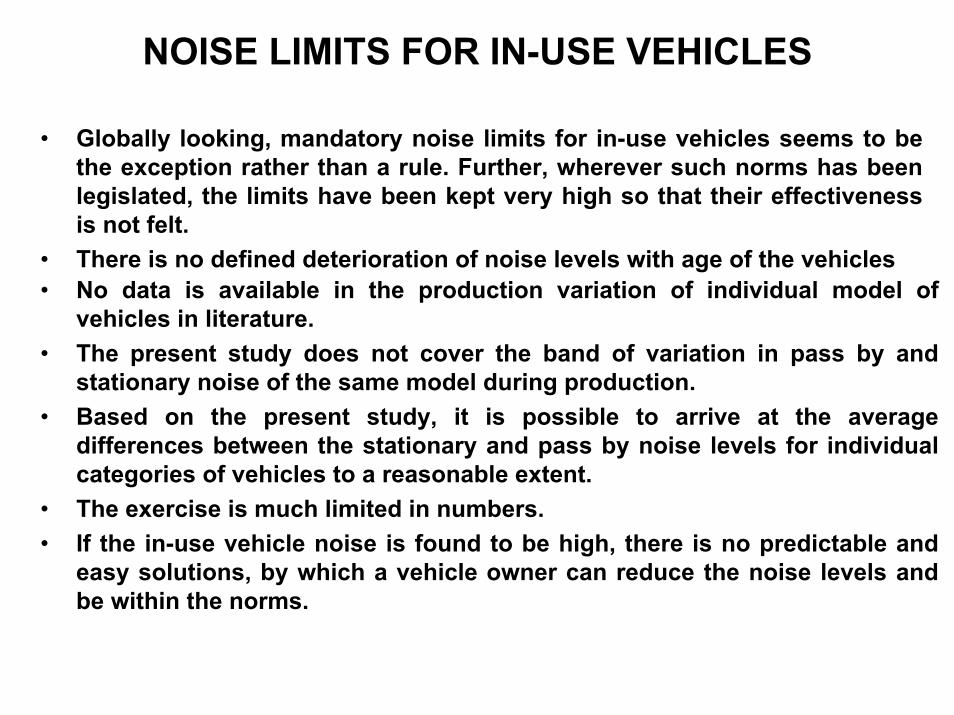
NOISE LIMITS FOR IN-USE VEHICLES
• Globally looking, mandatory noise limits for in-use vehicles seems to be the exception rather than a rule. Further, wherever such norms has been legislated, the limits have been kept very high so that their effectiveness is not felt.
• There is no defined deterioration of noise levels with age of the vehicles • No data is available in the production variation of individual model of
vehicles in literature.• The present study does not cover the band of variation in pass by and
stationary noise of the same model during production. • Based on the present study, it is possible to arrive at the average
differences between the stationary and pass by noise levels for individual categories of vehicles to a reasonable extent.
• The exercise is much limited in numbers. • If the in-use vehicle noise is found to be high, there is no predictable and
easy solutions, by which a vehicle owner can reduce the noise levels and be within the norms.