cost analysis of orchestrated 5g networks for broadcasting · will in principle permit the...
TRANSCRIPT
MARCH 2019
Marcello Lombardo, EBU
Cost analysis of
orchestrated
5G networks for
broadcasting

EBU Technology & Innovation | Technical Review | MARCH 2019 2
FOREWORD
The main purpose of an EBU Technical Review is to critically examine new technologies or developments in media production or distribution. All Technical Reviews are reviewed by 1 (or more) technical experts at the EBU or externally and by the EBU Technical Editions Manager. Responsibility for the views expressed in this article rests solely with the author(s).
To access the full collection of our Technical Reviews, please see: tech.ebu.ch/publications
If you are interested in submitting a topic for an EBU Technical Review, please contact: [email protected]
EBU Technology & Innovation | Technical Review | MARCH 2019 3
ABSTRACT
5G promises a revolution that will impact society in many ways, opening the door to new services and business models. 5G introduces the concept of network slicing that will in principle permit the orchestration and dynamic allocation of heterogeneous network resources for different services. A 5G infrastructure could ideally be extended with existing broadcast networks to open the door for the introduction of media broadcasting services as another network slice.
This study evaluates the costs associated with two types of network, one where orchestration is allowed and one where it is not, in a normalized country modelled against the principal European markets.
The study forecasts a fully operative 5G service in 2030. In this timeframe, the analysis of two possible scenarios, one where DTT is phased out in favour of 5G only, and one where the orchestration of heterogeneous networks is enabled by 5G, sees the latter delivering many benefits for operators and audiences.
It would accelerate and enable high geographical coverage and large capacity in a shorter time frame and with lower costs, especially in rural areas and developing countries where network densification could be problematic and non-remunerative.
It would provide spectrum optimization by deploying the best network resources for the best usage and additionally it would provide regulatory flexibility allowing coexistence of heterogeneous networks.
For these reasons the study concludes that broadcasters should be engaged with the 5G ecosystem, operators, vendors and end-user manufacturers to make sure that traditional broadcast platforms are considered and included in the network orchestration that 5G will permit.
EBU Technology & Innovation | Technical Review | MARCH 2019 4
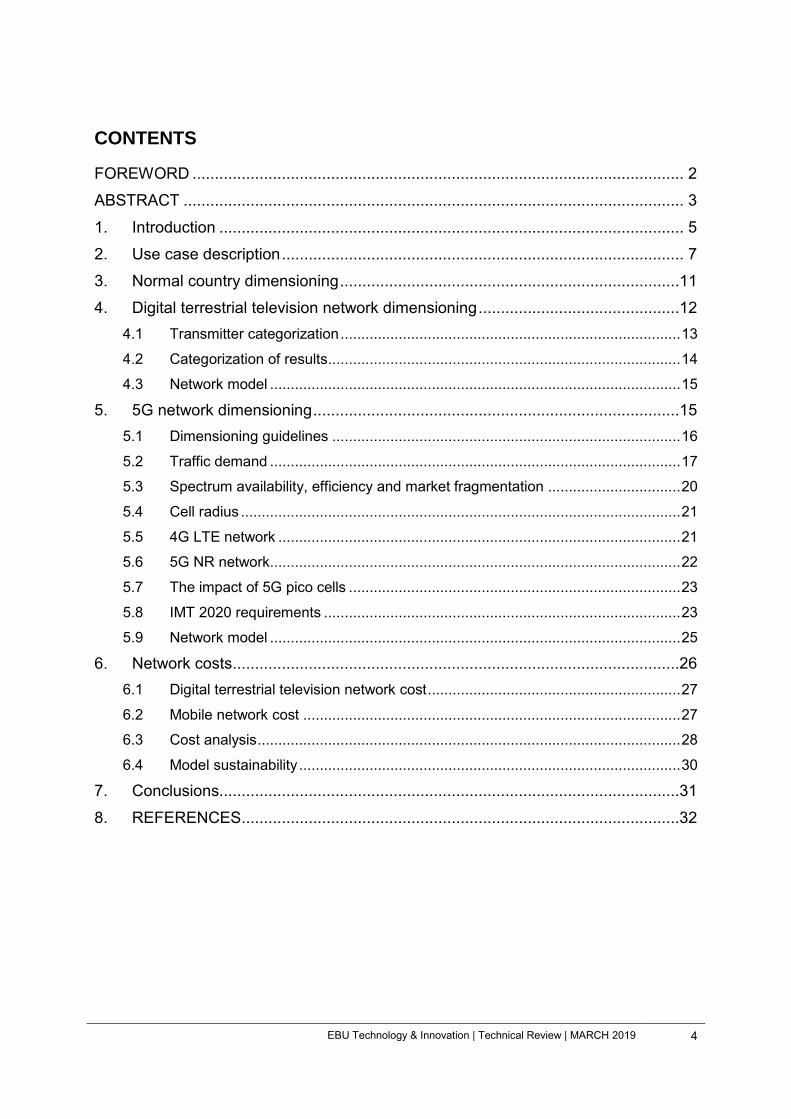
CONTENTS
FOREWORD .............................................................................................................. 2
ABSTRACT ................................................................................................................ 3
1. Introduction ........................................................................................................ 5
2. Use case description .......................................................................................... 7
3. Normal country dimensioning ............................................................................11
4. Digital terrestrial television network dimensioning .............................................12 4.1 Transmitter categorization .................................................................................. 13
4.2 Categorization of results ..................................................................................... 14
4.3 Network model ................................................................................................... 15
5. 5G network dimensioning ..................................................................................15
5.1 Dimensioning guidelines .................................................................................... 16
5.2 Traffic demand ................................................................................................... 17
5.3 Spectrum availability, efficiency and market fragmentation ................................ 20
5.4 Cell radius .......................................................................................................... 21
5.5 4G LTE network ................................................................................................. 21
5.6 5G NR network................................................................................................... 22
5.7 The impact of 5G pico cells ................................................................................ 23
5.8 IMT 2020 requirements ...................................................................................... 23
5.9 Network model ................................................................................................... 25
6. Network costs ....................................................................................................26
6.1 Digital terrestrial television network cost ............................................................. 27
6.2 Mobile network cost ........................................................................................... 27
6.3 Cost analysis ...................................................................................................... 28
6.4 Model sustainability ............................................................................................ 30
7. Conclusions.......................................................................................................31
8. REFERENCES ..................................................................................................32
EBU Technology & Innovation | Technical Review | MARCH 2019 5
1. INTRODUCTION
In today’s world, ICT infrastructures play a vital role in bridging the digital divide. The consequence of selecting an infrastructure over another impacts content providers and their audience at the economic and social level.
EBU Technical Report 026 [1] describes the requirements an ICT infrastructure must meet to be considered as a viable distribution platform for public service broadcasting; these requirements include universality, reach, availability, ease of use and so on.
Nevertheless, today’s requirements might be subject to change depending on the introduction of new use cases and services. For example, broadcasters are recognising that the capability of consistently receiving direct feedback from the audience is becoming more and more important. This enables broadcasters to know their audiences better and then serve them better.
In other words, a modern broadcast infrastructure requires both a downlink and an uplink.
The principal wireless technologies that can be used by broadcasters to distribute their content are digital terrestrial television, satellite, mobile broadband in unicast mode and mobile broadband in broadcast mode. The former two are best suited to serve mass populations with live content but they do not offer a return channel. The latter two do have a return channel but they are not as capable or as efficient as the former two in the delivery of the same content to mass audiences at the same time. The conclusion is that today, without even considering the associated costs, no single solution represents the optimum.
In this context 5G promises a revolution that will impact society in many ways, opening the door to new business models. It will enable Enhanced Mobile Broadband (eMBB), Ultra-Reliable and Low Latency Communications (URLLC, e.g. for autonomous driving, remote surgery), and Massive Machine Type Communications (mMTC, e.g. for Internet of Things) but perhaps even more interestingly, 5G introduces the concept of network slicing that will in principle permit the orchestration and dynamic allocation of heterogeneous network resources for different services.
Quoting the 5G Infrastructure Public Private Partnership (5G PPP) [2]: “The industry
consensus is that by 2020, the 5G network of the future will involve the integration of
several cross-domain networks, and the 5G systems will be built to enable logical
network slices across multiple domains and technologies to create tenant- or service-
specific networks”.
This promise, if maintained, can indeed have an impact on the broadcasting industry, as shown in Figure 1.

EBU Technology & Innovation | Technical Review | MARCH 2019 6
Figure 1: Heterogeneous 5G infrastructure
As shown, a 5G infrastructure could ideally be extended with existing broadcast networks, which will open the door for the introduction of media broadcasting services as another network slice. The capability of serving the audience with the best distribution technology according to the situation would optimise network use and minimise waste of precious resources.
For 5G to maintain all its promises there must be a place for media and entertainment, in particular, for broadcasters.
To assess the pertinence such a solution, it is necessary to analyse the costs associated with its full technological rollout and compare the results with those of different scenarios.
For simplicity this study projects the costs associated with two macro possibilities, one where 5G will not permit network orchestration with cellular based platforms and one where it will:
1. 5G will not permit orchestration with existing broadcasting infrastructures, broadcasting services are migrated entirely on 5G MBB in unicast mode. It is assumed that the network slice “Media Broadcasting” presented in Figure 1 will be treated as a sub case of eMBB.
2. 5G will permit orchestration with existing broadcasting infrastructures, broadcasting services will be allocated among DTT and MBB. It is assumed that the network slice “Media Broadcasting” presented in Figure 1 will be treated as a complete service orchestrated by 5G.
For practical reasons, mobile broadband will only be considered as a unicast technology; in fact mobile broadcasting mode has never significantly been fully deployed on a large enough scale to be considered as a viable alternative1 ([3]).
1 As of September 2018: - Forty-one operators have invested in eMBMS (encompassing those considering/testing/trialing, deploying or piloting and
those that have deployed or launched eMBMS) - Five operators have now deployed eMBMS or launched some sort of commercial service using eMBMS. - GSA has now identified 48 different mobile processors / platforms and 9 cellular modems that come with eMBMS support
(though they will not all support the same eMBMS feature sets and functionalities). - GSA has currently identified 57 devices confirmed as being offered as part of commercial eMBMS services, or devices that
the vendors state are shipping with eMBMS enabled, or that have been used in trials.

EBU Technology & Innovation | Technical Review | MARCH 2019 7
Costs will be calculated on a fictional country based on the averages of the principal five markets in the European area (France, Germany, Italy, Spain and UK).
The “big 5” European markets as baseline: - Population: 321 M (63% of the union) - Area: 2 Mkm2 (46% of the union) - GDP: 13212 Billion $ (71% of the union)
Figure 2: European markets evaluated in this study
2. USE CASE DESCRIPTION
Content is king, distribution is queen.
This phrase embodies the spirit of broadcasting; the provision of appealing content and, equally important, with the capability of reaching all possible audiences with the best quality and the lowest cost. For this exercise it is thus critical to analyse the various distribution platforms under the conditions of highest possible usage.
The use case scenario is then necessarily centred on the distribution of premium live content (e.g. the football world cup, but also news coverage and so on).
It is possible to extrapolate from several sources ([4, 5, 6, 7, 8]) that during prime time, on average 35% of households, and by extension 35% of the population, consume some form of TV content, live, recorded and over the top (OTT).
Figure 3: TV content share per type (source: comScore)

EBU Technology & Innovation | Technical Review | MARCH 2019 8
In case of premium live content, we observe a shift in the share of live TV, recorded and OTT. Live TV share reaches at least 20% of households, while the grand total does not change dramatically, and remains constant at about 35%.
In other words, during a premium live event, 20% of the population watches it at home on a traditional distribution platform.
Additionally, according to audience measurement we can assume that during prime time of premium live content, an additional 8% of the population will consume TV content (60% of which live and 40% on demand), relying exclusively on mobile broadband.
All considered, we conclude that in case of transmission of premium content a total of 25% of the population consumes it live, about 20% on traditional broadcasting platforms and about 5% on mobile broadband.
Figure 4: TV consumption during prime time
These numbers represent a baseline scenario for today’s consumption, but to evaluate a possible scenario for 5G it is necessary to make forward-looking assumptions about when a 5G network will be fully available and what type of platform share we will have at that time.
If we follow the footsteps of LTE we can see that the first LTE service was launched in 2009. Ten years later, as reported in [9], the average LTE coverage to households in the EU28 is 97.8% (this number does not quantify the geographical coverage and the connection quality). If 5G follows a similar rollout pattern, we will not see a full 5G network before 2030 at the earliest2.
2 A factor that may speed up the rollout is the Non-Standalone version of 5G. In this case, the EPC network of 4G will be reused almost entirely.

EBU Technology & Innovation | Technical Review | MARCH 2019 9
Figure 5: Source: IHS Broadband coverage in Europe 2017
Moreover, network availability does not imply mass adoption. In fact, as demonstrated by the LTE case, adoption rate moves at a much slower pace and in 2017, after 10 years, LTE saw an adoption rate of 42% [10].
Figure 6: (source:GSMA)
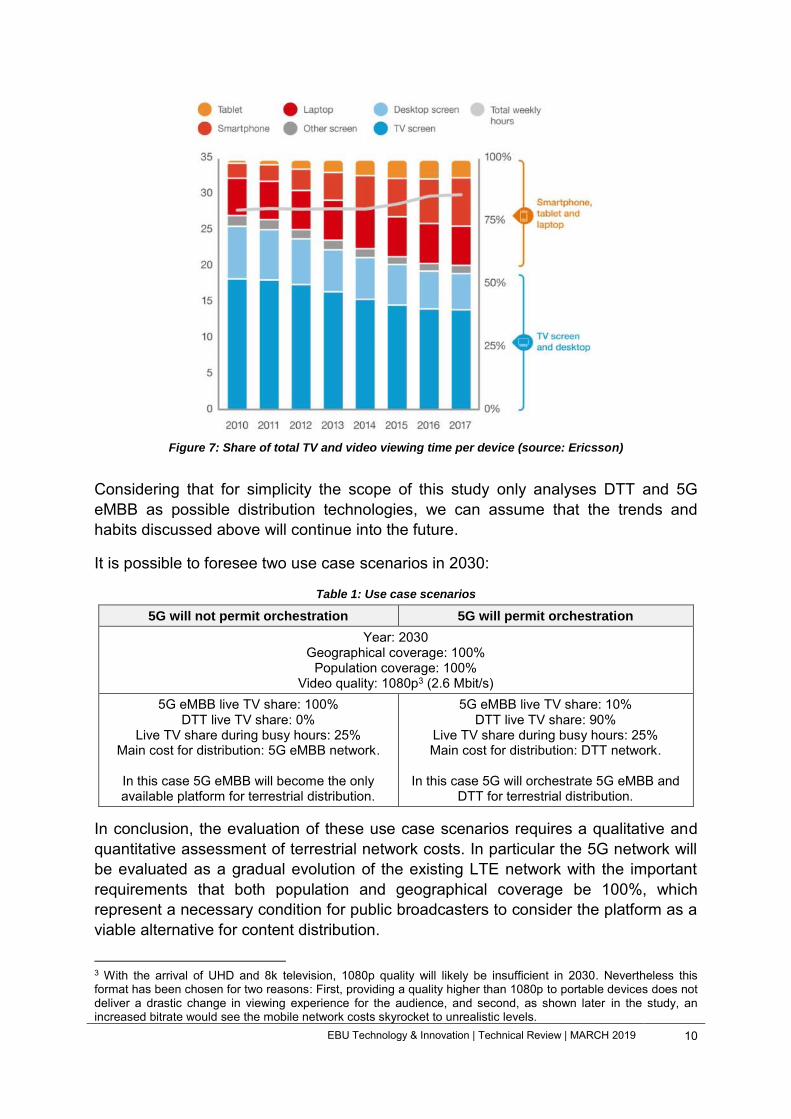
Moving on to the platform share, many sources forecast the growing importance of handheld devices as primary screens. For example, Ericsson forecasts 30% mobile viewing by 2020 [11].
EBU Technology & Innovation | Technical Review | MARCH 2019 10
Figure 7: Share of total TV and video viewing time per device (source: Ericsson)
Considering that for simplicity the scope of this study only analyses DTT and 5G eMBB as possible distribution technologies, we can assume that the trends and habits discussed above will continue into the future.
It is possible to foresee two use case scenarios in 2030:
Table 1: Use case scenarios
5G will not permit orchestration 5G will permit orchestration
Year: 2030 Geographical coverage: 100%
Population coverage: 100% Video quality: 1080p3 (2.6 Mbit/s)
5G eMBB live TV share: 100% DTT live TV share: 0%
Live TV share during busy hours: 25% Main cost for distribution: 5G eMBB network.
In this case 5G eMBB will become the only available platform for terrestrial distribution.
5G eMBB live TV share: 10% DTT live TV share: 90%
Live TV share during busy hours: 25% Main cost for distribution: DTT network.
In this case 5G will orchestrate 5G eMBB and
DTT for terrestrial distribution.
In conclusion, the evaluation of these use case scenarios requires a qualitative and quantitative assessment of terrestrial network costs. In particular the 5G network will be evaluated as a gradual evolution of the existing LTE network with the important requirements that both population and geographical coverage be 100%, which represent a necessary condition for public broadcasters to consider the platform as a viable alternative for content distribution.
3 With the arrival of UHD and 8k television, 1080p quality will likely be insufficient in 2030. Nevertheless this format has been chosen for two reasons: First, providing a quality higher than 1080p to portable devices does not deliver a drastic change in viewing experience for the audience, and second, as shown later in the study, an increased bitrate would see the mobile network costs skyrocket to unrealistic levels.

EBU Technology & Innovation | Technical Review | MARCH 2019 11
3. NORMAL COUNTRY DIMENSIONING
As mentioned, this study considers the “big 5” European markets as the baseline for network dimensioning. These countries combined represent an excellent sample of the whole euro area in terms of population, geographic area, GDP, and topology.
The goal is to model a normal country adopting the same methodology of [12], focusing on normalized size and normalized population.
Table 2: Normal country calculation
France Germany Italy Spain UK Normal country
Million inhabitants 67M 83M 60M 47M 66M 64M Area, km2 551695 357168 301338 505990 242495 391737
This stage of normalization is enough to model the DTT network for the normal country, but it is not sufficient to model a MBB network. A good level of granularity in the estimation of population density is necessary to dimension a unicast MBB network.
The next step is to segment the normal country into regions and cities, each of them characterized by a certain population density. The quantitative and qualitative analysis technique used to perform this calculation is an extension of the normalization procedure previously used to compute size and population of the normal country.
Table 3: Normal country regions
Population in M Area in km2 Density pop/km2 total % total %
Major cities4 City 1 3.64 5.6% 983 0.3% 3702 City 2 2.58 4.0% 1 175 0.3% 2195 City 3 1.29 2.0% 392 0.1% 3292
Region 1 Urban centres 0.93 1.4% 1 410 0.4% 658
Remaining territory 0.23 0.4% 5 641 1.4% 41
Region 2 Urban centres 0.77 1.2% 1 645 0.4% 470
Remaining territory 0.19 0.3% 6 581 1.7% 29
Region 3 Urban centres 1.03 1.6% 2 821 0.7% 366
Remaining territory 0.26 0.4% 11 282 2.9% 23
Region 4 Urban centres 4.64 7.2% 3 212 0.8% 1445
Remaining territory 1.16 1.8% 12 849 3.3% 90
Region 5 Urban centres 3.71 5.8% 3 704 0.9% 1003
Remaining territory 1.13 1.7% 14 416 3.7% 78
Region 6 Urban centres 1.55 2.4% 4 801 1.2% 322
Remaining territory 0.39 0.6% 18 803 4.8% 21
4 The fragmentation in regions for the normal country is inspired by the average qualitative and quantitative separation in regions of the studied countries

EBU Technology & Innovation | Technical Review | MARCH 2019 12
Population in M Area in km2 Density pop/km2 total % total %
Region 7 Urban centres 3.61 5.6% 4 544 1.2% 795
Remaining territory 0.90 1.4% 18 177 4.6% 50
Region 8 Urban centres 4.13 6.4% 5 171 1.3% 798
Remaining territory 1.03 1.6% 20 684 5.3% 50
Region 9 Urban centres 1.55 2.4% 6 268 1.6% 247
Remaining territory 0.39 0.6% 25 071 6.4% 15
Region 10 Urban centres 4.13 6.4% 6 189 1.6% 667
Remaining territory 1.03 1.6% 24 758 6.3% 42
Region 11 Urban centres 3.10 4.8% 6 346 1.6% 488
Remaining territory 0.77 1.2% 25 385 6.5% 30
Region 12 Urban centres 4.90 7.6% 7 365 1.9% 665
Remaining territory 1.53 2.4% 29 459 7.5% 52
Region 13 Urban centres 5.67 8.8% 9 715 2.5% 584
Remaining territory 1.42 2.2% 38 860 9.9% 37
Region 14 Urban centres 5.56 8.6% 14 886 3.8% 373
Remaining territory 1.29 2.0% 59 544 15.2% 22
4. DIGITAL TERRESTRIAL TELEVISION NETWORK DIMENSIONING
The correct dimensioning and planning of a DTT network is not a trivial task. Nevertheless, to complete the scope of this study an approximated model of the qualitative and quantitative composition of the DTT network in the normal country is needed.
Rather than attempting a dimensioning from scratch, the methodology used is centred on reverse engineering the data of existing networks5 (national networks covering approximately 99% of the territory) and from there extrapolate, with statistical techniques, a model that can approximate how the DTT network in the normal country would look like. Key parameters that impact planning like topology and interference will not be directly addressed but will be quantified as error margins in the model.
The operation is performed in six steps:
5 Data available on national frequency and media regulators websites.

EBU Technology & Innovation | Technical Review | MARCH 2019 13
Figure 8: DTT model assessment approach
4.1 Transmitter categorization
A real network sees a large variety of transmitters with ERPs ranging from tens of watts to hundreds of kilowatts. Such a dense granularity makes it nearly impossible to create a manageable economic model. It is then necessary to group existing transmitters in a number of manageable, finite, categories.
For consistency with other available sources ([12, 13, 14]) it has been decided to restrict the possible categorization to only three possible types of transmitters.
Table 4: DTT transmitter categorization
Low Tower, Low Power
(LTLP)
Medium Tower, Medium Power
(MTMP)
High Tower, High Power
(HTHP)
Power range in watts < 1 kW 1 kW - 25 kW > 25 kW Power range in dBm < 62 dBm 62 dBm - 76 dBm > 76 dBm Service area in km2 191 km2 790 km2 7123 km2
Transmitter type (average) 100 W 5 kW 25 kW
With this categorization, for example, a real 60 kW ERP transmitter will fall under the HTHP category, while a 500 W ERP transmitter will be considered a LTLP transmitter.

EBU Technology & Innovation | Technical Review | MARCH 2019 14
4.2 Categorization of results
Applying the categorization criteria to existing DTT networks in the studied countries it is possible to estimate through statistical inference the overall percentages of LTLP, MTMP and HTHP composing a DTT network.
Given the limited number of samples it was possible to compute a tolerance interval that provides a confidence level of 80%.
Table 5: Average DTT network composition in the big 5
LTLP MTMP HTHP
80% confidence tolerance interval [93.28% , 94.06%] [3.60% , 5.38%] [1.21% , 2.47%] total
Mean value 93.67% 4.49% 1.84% 100%
Table results basically imply that qualitatively6 a given DTT network is composed for 93.67% of LTLP, for 4.49% of MTMP and for the final 1.84% of HTHP.
The quantitative analysis starts with simple calculations to estimate the number of transmitters per category required to cover the whole territory of a country (if only that individual category was deployed), considering the country size and the theoretical service area of the transmitter category [13].
Table 6: Number of sites needed, to provide full area coverage in the “big 5” and the normal country
France Germany Italy Spain UK Normal country
HTHP 77 50 42 71 34 55
MTMP 698 452 381 641 309 496
LTLP 2889 1872 1578 2653 1279 2051
For example, to cover France either 77 HTHP or 698 MTMP could be deployed.
Using again the data coming from existing DTT networks categorized, this time it is possible to estimate through statistical inference the overall percentages of country covered with the combination of LTLP, MTMP and HTHP.
Table 7: Average network coverage with nominal service area in the big 5
LTLP MTMP HTHP
80% confidence tolerance interval [52.35% , 87.59%] [9.37% , 20.8%] [29.37% , 61.99%] total
Mean value 69.97% 15.08% 45.68% 130.74%
The expected total coverage is 130.74%. The additional 30.74% could be addressed in first instance to the consequence of the topology of the country and the coexistence with similar networks working in the same spectrum band. 6 The countries considered are the largest in area and population in Europe (except Russia). For smaller countries a different proportion might be found

EBU Technology & Innovation | Technical Review | MARCH 2019 15
4.3 Network model
Merging the quantitative and qualitative analysis the final model for the DTT network in the normal country is:
Table 8: Normal country DTT network
LTLP MTMP HTHP total
No. of transmitters 1437 75 25 1537
Coverage, % 69.97% 15.08% 45.68% 130.74%
Tower type, % 93.5% 4.87% 1.63% 100%
The identified network provides a total coverage of 130.74% of the territory, in line with the findings of Table 7, while the distribution of towers in percentage (for example we see that 93.5% of the network is composed of LTLP) follows the distribution presented in Table 6.
5. 5G NETWORK DIMENSIONING
In the absence of reliable data describing the composition of mobile networks in the big 5, it is not possible to apply the same reverse engineering technique as in the case of DTT and the procedure is consequently more complicated.
The operation is performed in seven steps:
Figure 9: Mobile network model assessment
The process depicted in Figure 9 will be performed three times, evaluating:
• the network as it exists in 2017, assuming a full scale deployment of LTE,

EBU Technology & Innovation | Technical Review | MARCH 2019 16
• the network necessary to satisfy the Ericsson traffic forecast for 2024, assuming a full scale deployment of LTE
• the network that satisfies the use case scenario for 2030, assuming a full scale deployment of 5G
This design approach is driven by the need to simulate the updates to, and growth of the network as it would happen in reality.
Figure 10: Mobile network dimensioning steps adopted in the study
5.1 Dimensioning guidelines
A mobile network is dimensioned to accommodate the users’ demands of traffic in a specific area. This can be achieved by deploying a combination of macro, micro and pico cells to guarantee both coverage and continuity of service.
To cover a specific area, in addition to the spatial configuration that considers the chosen inter-site distance between base stations as the main constraint, it is also possible to increase the offered capacity by deploying more carriers on the same site or service area of an existing cell.
Figure 11: Example of traffic distribution with a combination of different types of cell
As shown in Figure 11, higher traffic density can be accommodated by adding more layers to the network. Each layer can be deployed on a different frequency carrier.
As reported in [15], for homogeneous networks with a uniform traffic distribution, the number of base stations can be approximated by either the maximum average aggregate throughput (“capacity limited”), or the cell range (“coverage limited”). In

EBU Technology & Innovation | Technical Review | MARCH 2019 17
other words it is possible to decide to dimension the network by prioritizing either the throughput or the coverage.
Considering that this study contemplates the possibility for 5G to replace DTT, then the resulting 5G network should guarantee at least the same geographical coverage of the latter. For this reason it has been decided to dimension the network by prioritizing coverage first.
This choice implies that for a cell of class , characterized by a maximum radius and given that cells are hexagonally shaped, the number of base stations
required to serve an area of size is:
Given that each cell of class is also characterized by a maximum capacity , the area throughput density , provided by base stations of class in the area is:
If the calculated area throughput is not enough it is possible to add network layers7, until the calculated area throughput density, , given by:
satisfies the throughput requirement for the area.
It is important to highlight that this technique assumes ideal conditions, such as having constant throughput density in the whole service area and with no signal loss caused by topology or interference. This implies that the resulting network will most likely be an underestimation of a realistic MBB network.
5.2 Traffic demand
User demand is the primary metric used to dimension mobile networks. A good assessment of user demand will permit correct capacity dimensioning that will prevent network collapse even in case of extreme traffic peaks.
Rewheel research8 frequently publishes reports on mobile broadband data consumption and capacity utilisation.
Figure 10 provides many interesting findings. The average mobile data consumption per month in the euro area, weighted on population, is about 2.75 Gbyte.
7 Each layer corresponding to a carrier. 8 http://research.rewheel.fi/networkeconomics/ .

EBU Technology & Innovation | Technical Review | MARCH 2019 18
Figure 12: Mobile data usage per capita per month in 2017 (source: Rewheel research)
In this context it appears that the Finnish case is unique and can hardly be considered a reference model; not only is the Finnish average data consumption more than 8 times higher than the overall weighted average of 2.75 Gbyte/month, it is also higher than the average German fixed line data consumption, where issues of the availability of unlimited data plans do not apply.
The weighted average for the big 5 is 2.2 Gbyte/month.
Figure 11 provides additional information about current utilisation of the network; according to the numbers provided, hardly more than 20% of the available capacity is used. In fact, the weighted average capacity used by the big 5 is 11.6%. This number will be used to assess the current capacity of existing networks.
Figure 13: Capacity utilisation in 2017 - during busy hour in the 5% most loaded sectors
(source: Rewheel research)
According to several authors [16, 17, 18], dimensioning should be such that the busy hour data consumption that accounts for about 10% - 20% of total daily traffic occupies up to 80% of the available network capacity.

EBU Technology & Innovation | Technical Review | MARCH 2019 19
If we define:
Monthly traffic as the average Gbytes consumed per month per capita
Busy hour traffic as the Mbytes per hour per capita consumed during the busy hour
Busy hour bitrate as the Mbit/s per capita consumed during the busy hour
Network capacity as the Mbit/s per capita the network should be able to provide
Area throughput T as the Mbit/s per km2 in a determined area T
In equations:
The following table shows the various network capacities required in different cases, starting in 2017 until 2030, the year of our use case scenarios. In the estimation for 2030, the network capacity required must fulfil the use case requirement (25% of the population watching live TV at a quality of 2.6 Mbit/s).
Even if the extreme case of eMBB as the only TV distribution platform would not happen, it is fair to assume that the effective 5G network will need to be densified to accommodate the various network slices.
Table 9: Network capacity in various scenarios
Monthly traffic (Gbyte)
Busy hour traffic (Mbyte/hour ÷ pop)
Busy hour bitrate (Mbit/s ÷ pop)
Network capacity (Mbit/s ÷ pop)
2017 network 2.2 14.67 0.04 0.04
2017 network full 15.17 101.15 0.22 0.28
2024 Ericsson forecast9 21 140 0.31 0.39
2030 use case 43.88 292.50 0.65 0.81
9 https://www.ericsson.com/en/mobility-report/mobility-calculator?up=1&bp=2&v=0&c=0

EBU Technology & Innovation | Technical Review | MARCH 2019 20
5.3 Spectrum availability, efficiency and market fragmentation
Mobile broadband can be deployed on various licensed frequency bands and for each frequency band it is possible to add another layer of base stations.
This means that a planning constraint is the number of carriers available for deployment.
A number of online sources10 provide a list of spectrum allocations per country, based on which it is possible to assume that for each mobile operator in the normal country the following frequency bands are available:
Table 10: Spectrum lots available in the normal country11
SPECTRUM BANDS FDD uplink FDD downlink Use in the study
700 MHz 10 MHz 10 MHz Macro cell 800 MHz 10 MHz 10 MHz Macro cell
900 MHz 10 MHz 10 MHz Used for GSM, not considered
1800 MHz 20 MHz 20 MHz Micro cell 2100 MHz 15 MHz 15 MHz Micro cell 2600 MHz 20 MHz 20 MHz Pico cell
The next step is to identify the total capacity that can be delivered according to the mobile technology. For simplicity we assume immediate re-farming of available frequency bands for deployment with the latest technology. This means that once the 900 MHz band used for GSM is excluded, all other allocations will implement either 4G or 5G, in other words, legacy technology and mix of technologies are not considered.
Table 11: Mobile technology spectral efficiency
4G LTE (64-QAM 4x4 MIMO) 5G NR12
Efficiency Sectors Efficiency Sectors
Macro cell 15 bit/s/Hz 1 - 3 23 bit/s/Hz 1 - 3
Micro cell 15 bit/s/Hz 1 - 3 23 bit/s/Hz 1 - 3
Pico cell 15 bit/s/Hz 1 23 bit/s/Hz 1
It is important to highlight that these assumptions represent ideal conditions of spectrum optimization. For example, real mobile networks will hardly see a full re-farming and will continue operating services with legacy technologies in the 10 For example, https://www.spectrummonitoring.com/frequencies/ 11 Mobile spectrum allocations are also present in other frequency bands such as 1.5 GHz and 3.4 - 3.8 GHz, which are harmonised for 5G in Europe but not yet deployed. In this study it is assumed that by 2030 they will have been deployed in the networks with 20 MHz of supplemental downlink in the 1.5 GHz band, and 20 MHz FDD in the 3.5 GHz band. 12 Source for the efficiency estimation: http://www.techplayon.com/spectral-efficiency-5g-nr-and-4g-lte/. 5G-Xcast has estimated the peak spectral efficiency in MIMO configuration [20] as 47.93 bit/s/Hz, which is above IMT2020 requirements of 30 bit/s/Hz. It has been decided to use the least optimistic and most conservative estimation.

EBU Technology & Innovation | Technical Review | MARCH 2019 21
assigned frequency bands. This, along with the dimensioning technique used in the study, reinforces the fact that the resulting network will most likely be an underestimation of a realistic MBB network.
Finally, we suppose that the three mobile operators are operating in the market, each having equal shares of market, about one third of the population. Assuming that this proportion applies uniformly to the whole normal country, the dimensioning of the network will be based on a third of the population density recorded in Table 3:
Normal country regions
5.4 Cell radius
Cell radius is strongly dependent on the population density of the area being served, which effectively means that effectively the quality of the area served commands a certain planning style.
The classification of areas according to the population density varies from source to source, and consequently does cell radius.
In this study the following classification will be used:
Table 12: Cell radius relation with population density
Macro cell Micro cell Pico cell
Rural (0 - 500 pop/km2) 10 km 5 km N/A
Urban (300 - 1500 pop/km2) 2.5 km 1.25 km 0.2 km
Dense Urban (>1500 pop/km2) 1 km 0.5 km 0.1 km
With these assumptions it is possible to treat each area identified in Table 2 according to this classification.
Table 13: Normal country breakdown
Population in M Area in km2
total % total %
Dense Urban 7.51 11.6% 2550 0.7%
Urban 45.28 70.2% 78077 19.9%
Rural 11.72 18.2% 311509 79.4%
5.5 4G LTE network
With all inputs data available, it is possible to estimate the composition of a 4G LTE network in 2017 and 2024 (network for one operator serving one third of the population).

EBU Technology & Innovation | Technical Review | MARCH 2019 22
Figure 14: Mobile network dimensioning for 4G LTE
Using the methodology described in the ‘Dimensioning Guidelines’ section the ideal composition of 2017 and 2024 LTE networks is reported in Table 14:
Table 14: Normal country LTE network in 2017 and 2024
2017 network 2024 forecast
Base Stations Sectors Base Stations Sectors
Macro cell 11640 30123 12989 34170 Micro cell 3443 5169 6185 10857 Pico cell - - - -
Total 15083 35292 19174 45027
5.6 5G NR network
An equivalent analysis has been done for 5G.
Figure 15: Mobile network dimensioning for 5G NR
As expected, the higher spectral efficiency that 5G will deliver has an impact on the total number of cells required to serve the desired capacity. Unfortunately, providing the desired network capacity to rural areas results in problematic rural coverage. To solve this problem it was necessary to reduce cell radius for stations deployed in rural areas.

EBU Technology & Innovation | Technical Review | MARCH 2019 23
Table 15: Normal country 5G network in 2030
2030 network 2030 network with reduced macro cell radius (5 km) for rural areas
Base Stations Sectors Base Stations Sectors
Macro cell 13812 36640 20360 43188
Micro cell 10303 19547 7162 16406
Pico cell - - - -
Total problem problem 27522 59594
5.7 The impact of 5G pico cells
Existing mobile networks deploy different technologies in different frequency bands. For this reason it is hard to envisage a 5G only network in the near future; rather a 5G network that will be deployed on the available frequency bands only, namely 700 MHz and 3.5 GHz13. With this limitation on the usable frequency bands, what changes in terms of network magnitude?
Rather than reassessing the network for the whole country, Table 16 breaks down the network composition for City 1 of the normal country using the same dimensioning methodology:
Table 16: Realistic 5G network for City 1
2030 network for City 1;
5G only 2030 network for City 1;
5G and legacy technologies
Base Stations Sectors Base Stations Sectors
Macro cell 493 1479 758 2274 Micro cell - - 3024 9084 Pico cell - - 1150 1150
The table shows that the ideal 5G only network is much smaller than the network deploying a combination of 5G and legacy technologies. In particular the higher spectrum efficiency provided by 5G in the latter network will largely be deployed in pico cells that enormously increase the operating expenses for that network.
5.8 IMT 2020 requirements
In the previous section we have quantified the impact of legacy technologies in future mobile networks by showing how much densification is critical to guarantee sufficient throughput to satisfy area requirements. With this finding, as a side element to this
13 The 26 GHz band will also provide capacity but only for very local coverage.

EBU Technology & Innovation | Technical Review | MARCH 2019 24
study, it is interesting to evaluate the degree of compliance of the requirements presented in this document compared to IMT 2020 requirements for 5G [19].
Figure 16: 5G requirements
In particular we are interested in two requirements, “Area traffic capacity” and “User experienced data rate”.
The desired Area traffic capacity for IMT 2020 corresponds to 10 Mbit/s/m2, that is equivalent to 107 Mbit/s/km2. This enormous number implies on one side the necessity of extreme densification via femto cells and on the other side the impossibility of guaranteeing this level of densification at national level.
With a spectral efficiency of 47.93 bit/s/Hz, identified in 5G-Xcast [20], and supposing 10 MHz available per femtocell, in order to satisfy this requirement a maximum radius of 4.29 m is acceptable. As an example, to provide this area throughput for City 1 and its area of 983 km2 we would need more than 20 million femtocells. It appears evident that this requirement can’t be met on a large-scale network.
With similar assumptions, if we wanted to meet the 100 Mbit/s per user for City 1 and its 3.64 million inhabitants we would need about 760 thousand femtocells. Again, it is evident that this requirement can’t be met on a large-scale network.

EBU Technology & Innovation | Technical Review | MARCH 2019 25
5.9 Network model
All things considered, it is possible to assume an evolution of the network from today until 2030.
Table 17: Normal country network evolution
2017 network - 4G 2024 forecast - 4G 2030 network - 5G
Base Station Sectors Base Station Sectors Base Station Sectors
Macro cell 11640 30123 12989 34170 20360 43188 Micro cell 3443 5169 6185 10857 7162 16406 Pico cell - - - - - -
Total 15083 35292 19174 45027 27522 59594
Network dimensioning has led to other results that complement the numbers shown in Table 17.
1. Real networks are, and will be larger. The results obtained consider an ideal situation where there is no loss of throughput towards cell borders and where the technology used is the highest performing for every single cell. It is fair to assume that current networks require about 30% more cells at least.
2. Spectrum use could be optimized: the results in Table 17 have been obtained mainly with the use of macro cells and the best available spectral efficiency. Microcells have been used to provide additional capacity where required.
3. A full LTE network would be future proof in 2024: As shown, Ericsson’s forecast could easily be accommodated with about 40 MHz of spectrum and a sufficiently dense network.
4. Rural areas are problematic: while the use of identical radius for the 2017 and 2024 cases left a wide margin of improvement for the network capacity, in the 5G case the densification was not sufficient to guarantee adequate throughput in rural areas. This means that already at this stage it is possible to deduce the importance of a broadcast platform.
5. Network assessment with a decreased radius size to provide sufficient throughput to rural areas shows an abysmal difference in the number of cells required. What the numbers are saying is that to provide adequate service to about 20% of the population, the network must be about 100% larger.
Although fewer cells are required by 5G, it is hard to envisage a reduction of network size for two main reasons:
1. The concept of network slicing is based on the principle of sharing and dynamically allocating network resources for multiple services; the assessed network satisfies only the eMBB service and as such, rather than being smaller, the final network will probably be much larger.

EBU Technology & Innovation | Technical Review | MARCH 2019 26
2. Technology rollout and penetration takes time. Considering that the first LTE service started in 2009 and 10 years later [9] the EU28 average LTE coverage is 97.8% of households, it is reasonable to assume that a 5G rollout will follow a similar pattern and we will not see a full 5G network before 2030 at least. This implies that the existing network will be gradually updated rather than replanned and reduced.
6. NETWORK COSTS
To broadly assess the costs associated with each terrestrial network it is necessary to understand which elements comprise the Opex and which the Capex. The principal elements that contribute to the Opex are the energy consumption, the heat dissipation, site rental and maintenance.
Similarly, the Capex is defined by the equipment cost and the tower cost plus tower installation cost.
Certainly, other costs associated with frequency planning, backhaul infrastructure, spectrum and other costs are present, but are out of scope of this study as it intends to provide an overall minimal estimation of the costs.
With these assumptions, the input figures required to assess the Opex and Capex include the number of sites composing the network, and for each site, the power of the transmitter and the type of site, either large or small.
Table 18: Opex and Capex elements
Opex Capex Input figures
• Energy consumption • Heat dissipation • Site operation & maintenance (O&M) • Site rental
• Equipment cost • Tower cost • Installation cost
• Number of transmitters • Transmitter power • Transmitter energy profile • Site categorization
In equations, these are the calculations that will be performed:
EBU Technology & Innovation | Technical Review | MARCH 2019 27
6.1 Digital terrestrial television network cost
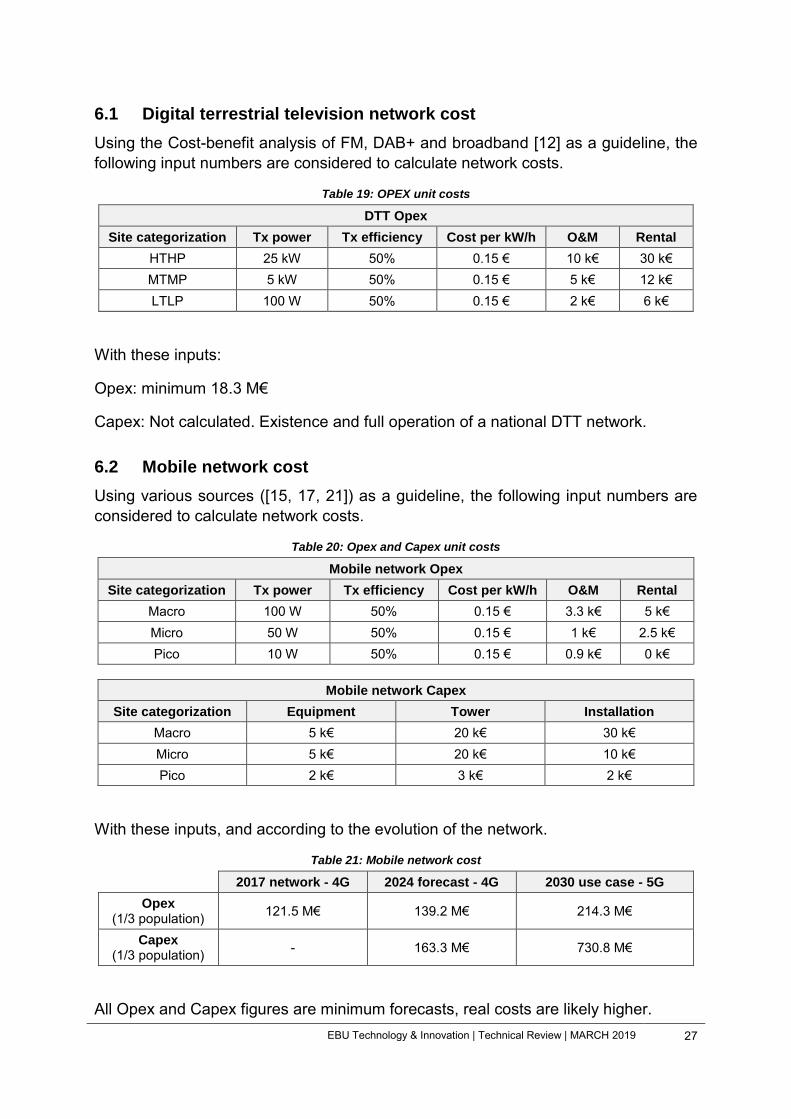
Using the Cost-benefit analysis of FM, DAB+ and broadband [12] as a guideline, the following input numbers are considered to calculate network costs.
Table 19: OPEX unit costs
DTT Opex
Site categorization Tx power Tx efficiency Cost per kW/h O&M Rental
HTHP 25 kW 50% 0.15 € 10 k€ 30 k€ MTMP 5 kW 50% 0.15 € 5 k€ 12 k€ LTLP 100 W 50% 0.15 € 2 k€ 6 k€
With these inputs:
Opex: minimum 18.3 M€
Capex: Not calculated. Existence and full operation of a national DTT network.
6.2 Mobile network cost
Using various sources ([15, 17, 21]) as a guideline, the following input numbers are considered to calculate network costs.
Table 20: Opex and Capex unit costs
Mobile network Opex
Site categorization Tx power Tx efficiency Cost per kW/h O&M Rental
Macro 100 W 50% 0.15 € 3.3 k€ 5 k€ Micro 50 W 50% 0.15 € 1 k€ 2.5 k€ Pico 10 W 50% 0.15 € 0.9 k€ 0 k€
Mobile network Capex
Site categorization Equipment Tower Installation
Macro 5 k€ 20 k€ 30 k€ Micro 5 k€ 20 k€ 10 k€ Pico 2 k€ 3 k€ 2 k€
With these inputs, and according to the evolution of the network.
Table 21: Mobile network cost
2017 network - 4G 2024 forecast - 4G 2030 use case - 5G
Opex (1/3 population) 121.5 M€ 139.2 M€ 214.3 M€
Capex (1/3 population) - 163.3 M€ 730.8 M€
All Opex and Capex figures are minimum forecasts, real costs are likely higher.

EBU Technology & Innovation | Technical Review | MARCH 2019 28
6.3 Cost analysis
To perform the cost analysis, it was supposed that the Capex investment to make the network compliant with 2024 capacity requirement started in 2017 with duration of 7 years. Similarly, the Capex investment to upgrade the network to full 5G will start in 2024 and will end in 2030.
For simplicity a linear depreciation model with a 0% discount rate was used.
Figure 17: Network cost in million euros
On the chart of Figure 10 it is possible to appreciate how an increment in desired capacity for a mobile network dramatically increases both Opex and Capex for the network operator, while a DTT network guarantees a lower, stable and foreseeable expense. It is also fundamental to highlight the fact that the mobile operator in this chart is serving only one third of the population, while the DTT operator is serving the whole population at the same time.
This simple consideration shows how expensive a unicast mobile network is in providing high throughput. As shown in Figure 11 a 5G eMBB network cost per citizen is about 60 times higher than the DTT network cost per citizen.

EBU Technology & Innovation | Technical Review | MARCH 2019 29
Figure 18: Non-orchestrated 5G network cost per year per citizen
Is this huge difference justifiable? It is hard to say, and it will probably depend on the relevance of linear TV & radio versus OTT in the future.
A 5G eMBB network would immediately guarantee the capability of reaching mobile phones and portable devices with a full downlink/uplink architecture, which will enable both live and on demand TV viewing.
Nevertheless, most of the population still massively relies on traditional broadcasting to consume live content, and the number of citizens uniquely using MBB to watch live and on demand TV on a mobile device is still very limited but growing. To what extent it will grow is hard to foresee.
In this context a 5G orchestrated network could represent a win-win solution for multiple reasons:
1. It permits higher spectrum efficiency. 5G networks are supposed to serve multiple use case scenarios on multiple industry verticals using heterogeneous resources. This study showed the economical superiority of terrestrial broadcasting in delivering high throughput to mass audiences, which implies that a 5G infrastructure could offload this type of traffic to a DTT network while retaining capacity for on demand content and uplink communications or other network slices. In other words, this type of network permits the efficient use of resources where they are really needed.
2. It lowers network costs. Without considering capex investments, the calculated 5G network has a higher running cost compared to the calculated 2024 4G network that accommodates Ericsson data consumption forecast. Offloading linear TV traffic would require less capacity from 5G MBB and thus an overall lower network cost. In Figure 12 we see that orchestrating a 5G network with DTT would basically halve network expenses.
3. It provides flexibility. The possibility of having coexisting, coordinated heterogeneous network resources provides the flexibility to deploy a combination of technologies without being forced to opt for one or another. This would be a huge benefit for administrations and broadcasters.

EBU Technology & Innovation | Technical Review | MARCH 2019 30
Figure 19: Orchestrated 5G network cost per year per citizen
6.4 Model sustainability
Another fundamental aspect to consider is the economic sustainability of the model. To this end a regression analysis has been performed on the derived data, the growth of network capacity versus the growth of the sum of Opex and Capex. The results are shown in Figure 18.
Figure 20: MBB Opex and Capex versus network capacity
The main finding is that the best fit for this model is obtained with a 4th order polynomial curve that scores an R-squared14 value of 0.92. Although this relationship might seem absurd at first sight, it is explainable as follows. The estimated model had reached saturation with macro cells, which means that further densification could
14 R-squared is a statistical measure of how close the data are to the fitted regression curve. A value of 1 indicates that the model explains all the variability of the response data around its mean.

EBU Technology & Innovation | Technical Review | MARCH 2019 31
only happen with the addition of micro cells and pico/femto cells that will tremendously increase both Opex and Capex.
The crucial question to answer is simply; can it be assumed that customers would be willing to pay substantially more for the added capacity under these circumstances?
As shown in various of the statistics in this study, this assumption is debatable, which implies that unless the network would open new opportunities and business models through network slicing it will hardly be sustainable in the future.
7. CONCLUSIONS
5G could potentially be a game-changer for many industry sectors, media and entertainment included. As demonstrated with this study, the possibility of orchestrating heterogeneous network resources would retain flexibility whilst keeping costs as low as possible and providing the best possible service for audiences in the shortest possible time frame. Especially in a situation where customer requirements could change rapidly.
We know that even in the most developed countries, 4G coverage has exceeded 95% household penetration only after 10 years since the first commercial deployment, but more importantly, even after all this time, 4G still has a very low adoption rate, accounting for 42% of total connections.
Assuming that these patterns and trends will not change in the future we can expect to see a full 5G rollout for developed countries in 2030, and a satisfactory adoption rate in 2035.
Additionally, it was discovered that Capex investments are significant, especially for the coverage of rural areas, and this can’t be ignored especially in a situation where mobile operators will still be operating 2G, 3G and 4G. In particular the study discovered that the coverage of 20% of the population living in rural areas costs about half the entire running cost of the network for the whole country. This huge disproportion might leave doubts about the feasibility of future deployment of sufficient network densification for those areas.
Another important aspect related to network cost is the forecast of future Opex and Capex depending on the capacity required by the network. It was shown that any future improvement to network capacity will require an enormous financial exposure for network operators, which suggests that to guarantee economic sustainability it would be necessary to optimize network capacity by orchestrating high throughput downstream.
Summing up:
1. Given the long time horizon for full 5G deployment, an orchestration with broadcasting infrastructures will guarantee large capacity and coverage in a shorter time frame.
EBU Technology & Innovation | Technical Review | MARCH 2019 32
2. 5G exclusive coverage for rural areas and developing countries could be economically difficult and a mix of technologies could facilitate and accelerate this process.
3. Orchestrating heterogeneous networks will provide flexibility and optimization of resources, meaning that 5G broadcasting infrastructures could be used for high throughput applications15 and 5G mobile infrastructures could be used for other vertical uses.
4. Coexistence of heterogeneous infrastructures would also provide regulatory flexibility for administrations who will not be obliged to opt for a technology against another one.
All things considered, it is reasonable to state that given its potentially huge benefits, broadcasters should be engaged with the 5G ecosystem, operators, vendors and end user manufacturers to make sure that traditional broadcasting platforms are considered and included in the network orchestration that 5G will provide.
8. REFERENCES
[1] EBU-T&I, Technical Report TR 026: “Assessment of available options for the distribution of broadcast service”.
[2] 5GPPP, “View on 5G Architecture”. [3] GSA, “LTE Broadcast Market Update”. [4] ComScore, “TV essentials & total home custom reporting”. [5] BBC, “iPlayer performance report”. [6] EBU-MIS, “Audience trends in media consumption 2018”. [7] EBU-MIS, “TV distribution 2018”. [8] EBU-MIS, “Media intelligence survey 2018”. [9] IHS, “Broadband coverage in Europe”. [10] GSMA, “The Mobile Economy Europe 2018”. [11] Ericsson, “TV and Media 2017”. [12] EBU-T&I,Technical review, 2017 “Cost-benefit analysis of FM, DAB, DAB+ and
broadband for radio broadcasters and listeners”. [13] P. Nygren, “High and Low Tower Broadcast Networks”. [14] ITU-R, Report ITU-R BT.2386-0: “Digital terrestrial broadcasting: Design and
implementation of single frequency networks (SFN)”. [15] K. Johansson, “Cost Effective Deployment Strategies for Heterogeneous
Wireless Networks”. [16] H. Holma and A. Toskala, “LTE for UMTS: evolution to LTE advanced”. [17] G. Blennerud, “Don’t worry – Mobile broadband is profitable”. [18] Cisco, “Traffic Analysis for Voice over IP”.
15 As long as everybody is potentially receiving the same content.

EBU Technology & Innovation | Technical Review | MARCH 2019 33
[19] ITU-R, “IMT Vision – Framework and overall objectives of the future development of IMT for 2020 and beyond”.
[20] 5G-Xcast, “Deliverable 3.2 Air interface”. [21] Schneir, Juan Rendon et al., “Cost Analysis of a 5G Network with Multi-
Tenancy Options”. [22] A. Elnashar, “Practical Aspects of LTE Network Design and Deployment”. [23] J. Markendahl and Ö. Mäkitalo, “A comparative study of deployment options,
capacity and cost structure for macrocellular and femtocell networks”. [24] Ericsson, “Ericsson Mobility Report November 2018”. [25] J. Markendahl, “User demand, network capacity and network dimensioning”. [26] R. Ekstrand, RAN Design group and PA Radio kista sweden, “LTE Radio
dimensioning”. [27] Fujitsu, “High-Capacity Indoor Wireless Solutions: Picocell or Femtocell?”.
AUTHOR BIOGRAPHY
Marcello Lombardo is a Project Manager at the EBU Technology & Innovation department. He joined the European Broadcasting Union in 2014 as Project Manager. He works actively on Spectrum management for Digital Terrestrial Television, Digital Radio and Hybrid Radio. He holds a masters degree in Electronics/Robotics Engineering and his master thesis work was published in 2009 with the title “Policy Gradient Learning for a Humanoid Soccer Robot”. In 2013 he became a PMI certified Project Management Professional, and in 2019 a Lean Six Sigma Black Belt. Through the years he nurtured experience in various technology fields such as telecommunications (Ericsson), railway automation (Bombardier), aerospace and missile flight (MBDA).
Published by the European Broadcasting Union, Geneva, Switzerland ISSN: 1609-1469
Editor-in-Chief: Patrick Wauthier E-mail: [email protected]
Responsibility for views expressed in this article rests solely with the author(s).