cost driver analysis of the zimbabwean economypdf.usaid.gov/pdf_docs/pa00m6xw.pdf · of the...
TRANSCRIPT

USAID STRATEGIC ECONOMIC RESEARCH AND ANALYSIS – ZIMBABWE (SERA) PROGRAM
COST DRIVER ANALYSIS OF THE ZIMBABWEAN ECONOMY
CONTRACT NO. AID-613-C-11-00001
This report was produced by Nathan Associates Inc. for review by the United States Agency for International Development (USAID). October 2014

2
USAID STRATEGIC ECONOMIC RESEARCH AND ANALYSIS – ZIMBABWE (SERA) PROGRAM
COST DRIVER ANALYSIS OF THE ZIMBABWEAN ECONOMY
CONTRACT NO. AID-613-C-11-00001
Program Title: USAID Strategic Economic Research & Analysis – Zimbabwe (SERA)
Sponsoring USAID Office: USAID/Zimbabwe
Contract Number: AID-613-C-11-00001
Contractor: Nathan Associates Inc.
Date of Publication: October 2014
Author: Marcos Arocha and Dumisani Sibanda (Consultants)
With:
Gibson Chigumira (ZEPARU Executive Director)
Evengelista Mudzonga (ZEPARU Research Fellow)
Tichaona Mudzviti (Economist, Ministry of Industry & Commerce)
DISCLAIMER
This document is made possible by the support of the American people through USAID. Its contents are the sole responsibility of the
author or authors and do not necessarily reflect the views of USAID or the United States government.

3
COST DRIVER ANALYSIS OF THE ZIMBABWEAN ECONOMY
by
ZEPARU1
OCTOBER 2014
1 The research team comprised of Marcos Arocha & Dumisani Sibanda (Consultants); Gibson Chigumira (Executive Director); Evengelista
Mudzonga (Research Fellow) and Tichaona Mudzviti (Economist Ministry of Industry & Commerce).

Acknowledgements
ZEPARU acknowledges the financial support provided by the Government of Zimbabwe, African
Capacity Building Foundation (ACBF) and USAID Strategic Economic Research and Analysis—
Zimbabwe (SERA) Program under contract number USAID-613-C-11-00001, without which this study
would not have been possible. The Study team acknowledges the inputs from diverse stakeholders and
colleagues who shared their insights and spared time to provide information and data that was used in
this study. Special thanks go to Mr Ashok Chakravarti, and Dr. Daniel Ndlela for their insights and
comments. The findings of this study do not necessarily reflect the views of ZEPARU or its funding
partners. The authors bear full responsibility for any factual errors and omissions.
5
Table of Contents
EXECUTIVE SUMMARY ....................................................................................................................................................... 11
I. INTRODUCTION AND METHODOLOGY ............................................................................................................... 16
II. ZIMBABWE’S EXTERNAL TRADE AND RELEVANT ECONOMIC CONTEXT ................................................ 17
III. COST-DRIVERS COMPARATIVE ANALYSIS ........................................................................................................ 19
A. Labour ........................................................................................................................................................................... 19
B. Power ............................................................................................................................................................................ 24
C. Water ............................................................................................................................................................................. 29
D. Finance .......................................................................................................................................................................... 32
E. Transportation and Trade Logistics ............................................................................................................................... 36
F. Tariffs and Trade Taxes ................................................................................................................................................ 40
G. Taxation ........................................................................................................................................................................ 41
H. Information Technology (IT) ........................................................................................................................................ 44
IV. CONCLUSIONS AND RECOMMENDATIONS ........................................................................................................ 46
V. CASE STUDIES .................................................................................................................................................................. 53
Case Study 1: Cement Manufacturing ................................................................................................................................... 53
Case Study 2: Fertilizer Manufacturing ................................................................................................................................. 58
ANNEX 1: THE OECD REFERENCE CHECKLIST FOR REGULATORY DECISION-MAKING .................................... 81
ANNEX 2: CONDITIONS IN CENTRAL AND EASTERN EUROPE IN THE WAKE OF THE GLOBAL FINANCIAL
CRISIS .......................................................................................................................................................................... 82
ANNEX 3: PDL AND WAGE NEGOTIATIONS IN ZIMBABWE ........................................................................................ 84
ANNEX 4: TOOLS TO REVIEW EXISTING REGULATION ............................................................................................... 85
ANNEX 5: ANALYSIS OF THE ZIMBABWEAN FINANCIAL SERVICES SECTOR ....................................................... 86
ANNEX 6: LACK OF SCALE – THE ROLE OF THE AGRICULTURE SECTOR ............................................................... 89
ANNEX 7: LACK OF CHANGE .............................................................................................................................................. 96
ANNEX 8: PRACTICE IN DETERMINING NATIONAL EMPLOYMENT COUNCIL WAGES ....................................... 98
ANNEX 9: LIST OF STAKEHOLDERS INTERVIEWED ................................................................................................... 100
List of Tables
Table 1: Zimbabwe’s 2013 Top 10 Exports..........................................................................................................17
Table 2: Zimbabwe’s Imports and Exports by Destination, 2013 ......................................................................18
Table 3: Minimum Wage, US$ per Month, 2009-2013........................................................................................21
Table 4: Evolution of Minimum Wage and US$ Exchange Rates, 2009-2013 ..................................................22
Table 5: Redundancy Dismissal Costs, Weeks of Wages ....................................................................................23
Table 6: Minimum Wage Evolution in Zimbabwe, US $ per month, Selected Sectors ....................................23
Table 7: Minimum Wages of Selected Sectors as a % of Government ..............................................................24
Table 8: Government Employment Costs to GDP (percentage) ........................................................................24
Table 9: Government Employment Costs to National Expenditure (percentage) ............................................24
Table 10: Independent Power Producers .............................................................................................................26
Table 11: Performance of Zimbabwe Power Company ......................................................................................26
Table 12: Average Capacity Utilization................................................................................................................27
Table 13: Cost of Power by Source .......................................................................................................................27
Table 14: Regional Comparison Hydro Power Generation Costs .....................................................................27
Table 15: Regional Comparison Thermal Power Generation ............................................................................27
Table 16: Non Residential Tariff by Level of Consumption (US Cents) ...........................................................28
Table 17: Electricity Use by Consumer Type ......................................................................................................28
Table 18: Percentage Electricity Use by Consumer Type (%) ...........................................................................28
Table 19: Raw Water Charges ..............................................................................................................................30
Table 20: Domestic Clear Water Tariffs ..............................................................................................................31
Table 21: Industrial Consumers ............................................................................................................................32
Table 22: Intermediation Costs % points.............................................................................................................34
Table 23: Credit Information System Development ...........................................................................................35
Table 24: Costs and Time to Trade .......................................................................................................................38
Table 25: Costs to Trade on US$ per tonne/km basis .........................................................................................38
Table 26: Regional Rail Rates ...............................................................................................................................39
Table 27: Customs Clearance, Selected Indicators .............................................................................................40
Table 28: Import Tariffs 2012 ...............................................................................................................................41
Table 29: Total Tax Rate, % of Profit ..................................................................................................................43
Table 30: Costs of fixed-telephony, mobile, and fixed-broadband (US$ per month), 2012 ............................45
Table 31: Access fixed-telephony, mobile, and fixed-broadband 2005 and 2012 .............................................46
Table 32: SMS Services ..........................................................................................................................................46
Table 33: Voice Services (Charges in US Cents) .................................................................................................46
Table 34: Landed cost of ZAR 95.84 per bag conversion to US$ .......................................................................54
Table 35: Cost Comparison for Cement Production ...........................................................................................55
Table 36: Unit Cost Comparison of Final Product ..............................................................................................55
Table 37: Zimbabwe Import Tariffs – Sample Spare Parts ...............................................................................56
Table 38: Gap Reduction .......................................................................................................................................56
Table 39: Market Analysis – Local versus Imported Fertilizer .........................................................................60
Table 40: Post Dollarization ..................................................................................................................................60
Table 41: Consumption of fertilizer products by farming sector .......................................................................61
Table 42: The market shares of the farming subsectors .....................................................................................61
Table 43: Capacity Utilization (Granulation Plus Blending) Prior to Dollarization ........................................61
7
Table 44: Capacity Utilization – Post Dollarization ............................................................................................62
Table 45: Ratio of Imports to Capacity ................................................................................................................62
Table 46: Ratio of Imports to Capacity – Post Dollarization .............................................................................62
Table 47: Cost Structure – Sable Chemicals Ammonium Nitrate .....................................................................64
Table 48: Capacity Utilization, Ammonium Nitrate: 2009 - 2013 ......................................................................64
Table 49: Sensitivity Analysis - Ammonium Nitrate ...........................................................................................65
Table 50: Ammonium Nitrate price history since dollarization. ........................................................................65
Table 51: Capacity Utilization of Sables Chemicals ............................................................................................67
Table 52: Cost Structure Phosphate Rock ...........................................................................................................67
Table 53: Power Tariff ...........................................................................................................................................68
Table 54: Cost Structure – Superphosphate ........................................................................................................68
Table 55: ZimPhos is on the normal industrial tariff like other industrial consumers as follows; ................69
Table 56: ZimPhos Capacity Utilisation 2009 to 2013 ........................................................................................69
Table 57: ZimPhos Production 2009 to 2013 .......................................................................................................69
Table 58: ZimPhos Cost Reduction ......................................................................................................................69
Table 59: History of Prices of Supersphophates – since dollarization ...............................................................70
Table 60: Import Parity Price Comparison AN ..................................................................................................71
Table 61: ZimPhos – Super Phosphates ...............................................................................................................71
Table 62: Cost Structure – Secondary Stage Granulation and Blending ..........................................................71
Table 63: Summary – Process Costs .....................................................................................................................72
Table 64: Comparison – Current Costs – Import Parity Prices ........................................................................72
Table 65: Maize Fertilizer ......................................................................................................................................73
Table 66: Tobacco Fertilizer ..................................................................................................................................73
Table 67: Regulatory Costs for each Distribution point per year ......................................................................75
Table 68: Banking Performance ...........................................................................................................................86
Table 69: Loans and Advances Deposit Ratio ......................................................................................................87
Table 70: Deposit Ratio to Total Country ............................................................................................................87
List of Figures
Figure 1: Minimum Wage Growth vs. GDP Growth, 2009-2012 ......................................................................22
Figure 2: Zimbabwe Minimum Wage as % of S. Africa Minimum Wage .......................................................23
Figure 3: Average Lending Rates, % 2010-2013 ................................................................................................34
Figure 4: Access to Finance by Zimbabwean Firms, Selected Indicators ........................................................35
Figure 5: Time to Export ......................................................................................................................................39
Figure 6: Time to Import .....................................................................................................................................39
Figure 7: Total Tax Rate, % of Profit .................................................................................................................43
Figure 8: Zimbabwe Fertilizer Industry Production Flow Chart .....................................................................59
List of Abbreviations
ADSL Asymmetric Digital Subscriber Line
AEZs Agro-Ecological Zones
AN Ammonium Nitrate
ARDA Agricultural and Rural Development Authority
BAZ Broadcasting Authority of Zimbabwe
BBR Beit Bridge Railways
BPO Business Processing Outsourcing
COMESA Common Market for Eastern and Southern Africa
CZI Confederation of Zimbabwe Industries
ECA Economic Commission for Africa
EMA Environmental Management Agency
FAO Food and Agriculture Organisation
FDI Foreign Direct Investment
GCI Global Competitiveness Index
GDP Gross Domestic Product
GMB Grain Marketing Board
GMO Genetically Modified Organisms
GWh Gigawatt Hours
HPA Health Professions Authority
ICT Information Communication Technology
IDC Industrial Development Corporation
IEE Indigenisation and Economic Empowerment
IMF International Monetary Fund
IT Information Technology
ITC International Trade Centre
ITU International Telecommunications Union
KVA Kilovolt-Ampere
KWh Kilo Watt Hour
LCU Local Currency Unit
LPG Liquefied Petroleum Gas
MCAZ Medicine Control Authority of Zimbabwe
MFN Most Favoured Nation
MIC Ministry of Industry and Commerce
MW Megawatts
NEC National Employment Council
NPKs Nitrogen, Phosphorous, and Potash (Potassium)
NRZ National Railways of Zimbabwe
NSSA National Social Security Authority
OECD Organisation for Economic Cooperation and Development
OPC Office of the President and Cabinet
PDL Poverty Datum Line
POTRAZ Postal and Telecommunications Regulatory Authority of Zimbabwe
PPC Pretoria Portland Cement
PPPs Public Private Partnerships
PSTN Public Switched Telephone Network
RG Reference Group
RPAZ Radiation Protection Authority Zimbabwe
SADC Southern African Development Community
10
SERA Strategic Economic Research and Analysis
SMS Short Message Service
TOU Time of Use
US United States
USAID United States Agency for International Development
WAPCOS Water and Power Company Services (India)
WB World Bank
WEF World Economic Forum
WTO World trade Organisation
ZAR South African Rand
ZCFU Zimbabwe Commercial Farmers Union
ZEPARU Zimbabwe Economic Policy Analysis and Research Unit
ZERA Zimbabwe Energy Regulatory Authority
ZESA Zimbabwe Electricity Supply Authority
ZETDC Zimbabwe Electricity Transmission and Distribution Company
ZFC Zimbabwe Fertilizer Company Limited
ZIM ACP Zimbabwe Agricultural Competitiveness Programme
ZimStat Zimbabwe National Statistical Agency
ZIM$ Zimbabwean Dollar
ZimPhos Zimbabwe Phosphates
ZIMRA Zimbabwe Revenue Authority
ZINWA Zimbabwe National Water Authority
ZISCO Zimbabwe Iron and Steel Company
ZNCC Zimbabwe National Chamber of Commerce
ZPC Zimbabwe Power Company
11
EXECUTIVE SUMMARY
This study was carried out in response to a request by the Ministry of Industry and Commerce, to ZEPARU to
conduct an evaluation of cost drivers affecting the competitiveness of Zimbabwe’s businesses. Factors identified
in ZEPARU’s previous studies which were considered in this study included labor, power, water, finance,
transportation costs, tariffs and trade taxes, taxation and information technology. The study extended the analysis
to consider the following factors: lack of scale- under performance of agriculture (Annex 6); failure by
government to pay for goods and services on time; and lack of change (Annex 7). These factors were raised by
company executives and business associations during interviews as negatively impacting on costs and
competitiveness.
Zimbabwe’s international trade flows, and their composition, point towards a sustained loss of competitiveness.
Merchandise imports have risen twice as fast as exports in the last five years. The composition of those exports
has changed over that period, as more concentration in minerals and metals is observed imports of services have
grown faster than exports.
Following the adoption of the multi-currency system in 2009, the economy faces increased competition from
South African imports, its main trading partner accounting for nearly 75% of exports and 48% of imports. The
Rand has depreciated against the US Dollar from levels of R7 to R10 currently, which has in turn made South
African imports cheaper. The depreciation of the Rand adversely affects the competitiveness of Zimbabwean
companies whose costs are on a stronger currency.
Under the multi-currency system the option of devaluing the national currency to regain competitiveness is
foregone. Under these circumstances a combination of increased productivity and reduction in the cost of doing
business become viable strategies to enhance competiveness. It should be noted that while this study is limited to
selected factors within the overall cost of doing business from the perspective of the private enterprise, a holistic
internal cost reduction, analogous to a process of “internal devaluation” is needed which in turn will support
productivity increases. In this regard, the policy responses to the competitiveness gap developed in Central and
Eastern European economies in the wake of the global finance crisis is instructive. Key among the measures
adopted by these countries was achieving fiscal balance through both public and private sector wage cuts, which
had ripple effects throughout the rest of their economies.
Minimum wage levels indicate higher labour costs in Zimbabwe when compared to Zambia, Botswana, and
Mozambique, and a labour cost advantage in relation to South Africa. However, the trend observed in the last five
years reveals large increases that do not appear to be justified by increased economic growth or productivity, at a
time when the economy faces increased regional competition from devaluation in neighbouring countries. To
remain competitive, wage increases in a given economy need to be aligned with productivity levels; however the
current labour code and practices translate into salary increases expected and upheld by law for all employees
regardless of their performance and productivity. Large wage increases (in particular in central government,
which is the largest formal employer) observed indicate the need to review the mechanisms through which they
are set.
Redundancy dismissals are lengthy and prohibitively expensive. Severance payments average 69.2 weeks of
wages, nearly three times as high as the neighbouring country average of 25.4 weeks. The financial implications
of retrenching for Zimbabwean companies are not allowing them to reduce their excess labour to regain
competitiveness, essentially leaving them in an uncompetitive trap.
Modifications to the current labour code to shift collective bargaining to the company level, explicitly regulation
of redundancy benefits in line with regional levels, the introduction of a rapid resolution scheme to allow
retrenchment at a reasonable cost, and revision to the wage setting mechanisms at all government levels with a
view towards incorporating productivity and ability to pay are recommended.

12
In the region, Zimbabwean-based firms face the higher (i.e. least competitive) electricity costs for Zimbabwean
firms are the least competitive regionally. Demand exceeds available supply and firms are experiencing power
load shedding. Users are required to pay an effective tariff of 14.5 US Cents per kilowatt/hour to avoid being
subjected to the latter. The average of the 4 neighbouring countries (Botswana, Mozambique, South Africa and
Zambia) at the lowest level of commercial consumption is 8.3 US cents per KWh2, which is 57% of what
Zimbabwean businesses pay for electricity. Sixty percent of power is generated at Kariba at a competitive cost
(hydropower), a benefit that is being washed away by much more inefficient thermal stations. Options to optimize
power generation include the attraction of private capital into existing thermal power generations through public
private partnerships (PPPs) and separating Kariba to use it strategically for new expansions into hydro generation.
Water tariffs are more expensive in Botswana and South Africa, although fixed charges were found to be higher,
and users reported instances in which ZINWA sells raw water to farmers regardless of whether they helped with
dam construction or borehole drilling. To encourage investment in agriculture the government could consider
exempting farmers from paying for raw water where the farmers have constructed and maintained their dams. It
was also noted that the pricing models in use are not sensitive to water intensive industries and affordability by
consumers.
On average, Zimbabwean firms borrowing costs (at an average of 28% in 2013) are twice to three times the levels
observed in the region. These high lending rates are reflecting the combined effect of several factors, but
“paramount among them is widespread perceived country risk and limited investor confidence”3 which is
constraining the ability of the financial system to mobilize savings to be used for investment. Besides risk, other
factors include high levels of non-performing loans, high bank concentration of assets (indicating limited
competition in the sector), and high operating costs. Only 12.5% of firms reported having a bank loan, 13% were
using banks to finance investments and working capital, and only 5.5% of working capital needs were financed by
bank loans. The costs of finance go beyond high interest rates as firms are unable or unwilling to demand capital
to achieve economies of scale, to purchase inputs when prices are convenient, to reduce unutilized labour due to
high redundancy costs, or to finance investments in much needed plant and equipment improvements. These costs
are real and placing Zimbabwean firms at a competitive disadvantage, although they are harder to measure.
Risk reduction in the economy to make capital affordable and improve access to finance should be a priority in
light of the higher costs it imposes on domestic firms. Improving reliable credit information and collateral
mechanisms is recommended, as well as improvements to the business environment more generally. In this
regard, all other policies recommended should improve the risk profile of the Zimbabwean economy. In addition,
strengthening public-private dialogue within the reform process will ensure that the reforms enacted are captured
by influential international indexes such as the GCI and The World Bank Doing Business, lowering the risk
perceived by international investors which can lead to increased FDI attraction and liquidity, as well as beneficial
competition in the banking, transport, and IT sectors. However, restrictions in these sectors need to be removed as
well, including those stemming from the IEE Act. Credibly clarifying the rules and scope of this Act would be a
crucial step in this process of effectively opening up the country to FDI.
Expressed as percentage of freight value, Zimbabwean businesses can expect to pay 18.8% to export, and a
staggering 28.8% of freight value when importing, including documents preparation, customs clearance and
control, port and terminal handling, and in-land transportation. The latter is the largest component of these costs.
The comparative figures place Zimbabwean businesses between 3 and 5 percentage point disadvantage vis a vis
Botswana and Zambia when exporting, and more than 10 percentage points when importing. The gap with South
Africa is even wider (the costs of exporting are nearly double and three times those of importing).
2 At the lowest level of commercial consumption 3Piorela, Newfarmeret.al (2014), p. 14
13
Poor road infrastructure, limits on competition and foreign investment, and excessive roadblocks, tolls and police
fines (regarded by stakeholders to be more of a revenue raising activity) are contributing to higher transportation
costs. Rail freight is about 40% cheaper relative to road transport; however, unpredictable delivery times and the
poor maintenance of the network restrict its use.
Beyond transportation, importing and exporting in Zimbabwe is subject to red tape, excessive and opaque
processes, overregulation, frequent solicitation of informal payments, and importantly, multiple physical
inspections. All these are negatively impacting the costs of trading. The time to prepare documents consumes 33
out of the 53 days required for exports and 42 out of the 71 for imports. All agricultural commodities and inputs
as well as medicines imported or exported from Zimbabwe are subject to specific licensing requirements, with
many of them requiring multiple licenses, sometimes from different departments in the same ministry). Lack of
predictability in obtaining permits adds to the costs faced by firms involved in importing or exporting: their ability
to close transactions with international buyers is compromised in the latter case or a critical input cannot be
obtained in the former. Logistics professionals report that they typically deal with 10 different government
agencies in the clearance process, 50% of respondents in Zimbabwe reported that they often find solicitation of
informal payments in the clearance process, and that about 42% of import shipments are subject to multiple
physical inspections.
Reviewing import and export licenses eyeing their elimination and facilitating compliance for those remaining,
expanding risk-based inspections, introducing a trusted-trader program, as well as establishing a dialogue between
the 10 border agencies with the goal of establishing a single window system are highly recommended trade
facilitation measures. Likewise, transparency through an easy to navigate trade information portal, and licensing
custom brokers at the individual level could help in facilitating international trade.
Tariff policy in Zimbabwe is significantly placing producers and exporters at a significant competitive
disadvantage. Available figures point to tariff levels (inclusive of the recently introduced 25% import surtax)
being twice as high as the average of its neighbours (which implies that businesses in Zimbabwe pay on average
twice as many taxes for imported inputs. This disadvantage can be reduced and/or eliminated by removing the
surtax and reducing tariff levels at least to those observed in the neighboring countries. A policy shift where other
tools are used instead of tariffs to promote industrial development is recommended.
Property taxes appear to have a disproportionate impact in taxation levels, accounting for 8.1 percentage points of
an estimated total tax rate of 35.3%. The rates vary per property type/location, and are assessed against the value
of the property. The high impact could be stemming from property values that are out of date and do not reflect
market values. Property valuations should be updated to reduce their disproportionate impact.
A particular set of regulations that were deemed very onerous by most private sector stakeholders consulted were
those stemming from the Ministry of Environment, Water and Climate and the EMA Act. Stakeholders and
previous studies reported problems ranging from lack of transparency about the regulations to compliance costs
having a disproportionate impact on the profitability of enterprises. Benchmarking globally and regionally and
reassessing these regulations is recommended, as evidence is mounting that these regulations are deterring
domestic and foreign investment.
The multiplicity of fees, licenses, excise taxes, regulatory charges, permits, and other levies, described throughout
the study, as well as mounting evidence of large impacts on the profitability of enterprises point to the need for a
broad regulatory reform of existing regulations and introducing the principles of regulatory quality across
government agencies. The main elements to achieve such quality are to consult those affected (transparency),
assess the impact before enacting new regulation (accountability), and that regulations are effective in terms of
achieving a clear public-policy purpose.
In this light, Zimbabwe would benefit from a comprehensive, all-of-government regulatory reform to repeal
excessive regulations that place a large burden on private businesses. Establishing a Better Business Regulation
14
Commission mandated at the highest government level to create an inventory of regulations to be repealed or
modified has been an approach followed by countries wishing to improve their business environments. Such a
commission could also introduce elements of regulatory quality to ensure that the flow of new regulation meets
agreed quality criteria. The processes utilizes regulatory quality tools such as subjecting regulations to an impact
analysis, place the burden of proof on the regulator to justify existing regulations, and could establish a permanent
unit to review impact analysis for new regulations.
Infrastructure development can improve access to ICT in certain segments (broad-band, fixed-telephony) and
reduce the cost of services. The perception from private sector stakeholders consulted, is that service providers in
the ICT sector cannot offer the same quality of services due to varying investments in infrastructure development.
ECONET is the dominant player and the pace setter. The limited competition in this sector has given rise to
higher prices. In this regard the regulator should investigate and monitor any abuse of market power. The
regulator could also consider a policy of infrastructure sharing to reduce cost and improve efficiency in service
delivery. The market in Zimbabwe is relatively small, e.g. when compared with South Africa; and the sharing of
infrastructure could reduce the total costs to the economy and subscribers. The policy should eliminate
duplication of infrastructure and help to direct resources to building a more efficient service and to serve
uncovered areas.
Most companies in Zimbabwe are operating at sub – optimal level. Capacity utilization in manufacturing is
particularly low increasing unit costs. In an environment of high fixed costs and under capacity utilization as
prevailing in the country unit product costs become high and products cannot compete on price domestically and
in the foreign markets. CZI survey (2013) reports that capacity utilization at 39 % has reduced from the average of
44 % reported in 2012. The legal framework as governing labour, property taxes and many statutory obligations
do not enable firms to adjust their costs downwards as volumes decline resulting in higher product unit costs. As
alluded to above capacity utilization is also impacted by lack of adequate working capital which prevents
adequate procurement of inputs, undependable domestic consumption, and sub – optimal supply of agriculture
inputs. The Zimbabwean economy is agro- based. All sectors of the economy depend on the strength of the
agriculture sector as 70% of Zimbabweans derive their income and livelihood from agriculture related activities.
The performance of the sector is therefore an important enhancer of economic activities.
There are strong linkages between agriculture, manufacturing, mining and commercial sectors. Whenever the
agricultural season was good, the performance of other sectors was correspondingly good, because of strong
forward and backwards linkages that exist between agriculture and other productive activities and commercial
services. The performance of the entire economy is heavily influenced by how the agricultural sector is
performing. Any positive developments in agriculture filter through the rest of the economy. “Linkages between
agriculture and manufacturing are particularly strong.” The manufacturing processes sixty percent of agricultural
outputs while also supplying agriculture with many of its input requirements.
The government should act on factors restricting the performance in the agricultural sector as a prelude to
rejuvenating the economy. Strategies should be implemented to overcome the weaknesses resulting from the land
reform program, craft a sustainable mutually beneficial contract farming policy, support the fertilizer industry and
evaluate the prevailing agriculture model with a view to regroup means of production, (labor, management, skills,
capital) incorporating an institutional framework and private sector participation.
Delay by government to pay for goods and services are crippling many sectors of economy. The fertilizer
industry, pharmaceutical, construction and other service providers have been hurt by long delays that have
brought some companies to a comatose state. Companies are pressurized to meet tax and operational obligations
on revenue on which there are outstanding debts. Some of the affected companies have been forced to scale down
operations to a degree to which their working capital is tied in overdue debtors.
The economy has been short of sufficient small denominators for use as change since dollarization. There was
some endeavor to solve this problem as it relates to small transactions in 2012. The attempt to import coins
15
proved to be economically unviable. It was then considered necessary to solve the problem by minting local
dollars that would trade at the exchange rate of ZIM$ 1 being equal to US $ 1. Coins of smaller denominations
would have been made available by the Reserve Bank of Zimbabwe (RBZ) to facilitate trade in the retail sector. A
study was carried out at RBZ in conjunction with the Ministry of Finance. The Ministry of Finance and RBZ
should re – visit the matter with a view to introducing local dollars as was recommended then. Lack of change
distorts pricing of products, suppresses demand, misallocates household income and reduces capacity utilization.
Overall, the Zimbabwean economy needs to adjust to the realities of dollarization and the need for an “internal
devaluation” to reduce higher cost factors is evident. Restrictions that are in place in the country’s labour, foreign
investment, and international trade policies are increasing the cost of doing business and the economy cannot
afford them. The specific recommendations made by this study predicate the need for a more open, liberalized and
unrestricted economy and a more customer-centric (i.e. business-friendly) government that improves the quality
of its regulation.
This internal devaluation requires coordinated actions across government as well as commitment at the highest
level. In as far as the cost-structures highlighted in this study are central for the competitiveness of Zimbabwean
industries, an appropriate role for the Ministry of Industry and Commerce is to highlight them (and their
solutions) to other government agencies and become an advocate for reform within government.
16
I. INTRODUCTION AND METHODOLOGY
This study was prepared responding to a request from Ministry of Industry and Commerce (MIC) for ZEPARU to
undertake an analysis of the “country’s pricing structure”. Policy makers and other stakeholders are of the view
that the nation’s pricing structure is contributing to the current loss of competitiveness of the country’s exports
and rising demand for cheaper imports. The USAID-SERA Program agreed to support ZEPARU through the
engagement of two consultants to be part of the research team.
The study’s objectives were to develop a regional comparative analysis of those major cost factors affecting the
competitiveness of Zimbabwe industries, evaluate Zimbabwe’s cost levels in light of those comparisons, and to
highlight priority areas and policy reforms that could decrease the cost gaps identified.
This study benefited from insights drawn from the four value chain studies that had been recently commissioned
by ZEPARU. The studies focused on Chemical Industries, Engineering and Metal Products, Cotton to Clothing,
and the Agricultural Products Value Chains. These studies among other issues, identified labour, power, water,
finance, transportation costs, duties and taxes, and higher domestic prices for imported inputs as major cost
drivers. Information Technology (IT) was added to the list, given its key role as a cross-cutting productivity
enhancer and the country’s potential in BPO services.
The study team proceeded to gather objective quantitative and qualitative data for each of the cost-drivers
identified and benchmark its levels to those observed in South Africa, Botswana, Mozambique, and Zambia (the
main regional trade partners). The team looked for data that would allow it to assess the level of costs as private
business would face them in the different countries. The use of international data sets was maximized to ensure
comparability of the information presented. Next, the team conducted additional research and analysis to develop
an understanding of the factors that were driving higher costs in Zimbabwe.
A wide and diverse group of public and private stakeholder interviews took place from May 27th through June 14th
(see Annex 9 List of Stakeholders Interviewed) in Harare and Bulawayo. The list of cost-drivers to evaluate was
subsequently validated through these interviews, as well as at a Reference Group (RG) meeting at the outset.
It is worth clarifying that although the study delves into many costs of doing business, it yet falls short of a
comprehensive business enabling environment or competitiveness study. It is limited to a regional comparison of
objective measures of “costs” from the perspective of a private enterprise (as opposed to economy wide costs). It
is also not a competitiveness study, since it just focuses on the cost elements as opposed to many other strategic
elements of positioning an industry/product, the quality of the workforce, and the technology used in combining
factors of production. Said differently, the focus is merely on cost competitiveness, and is not intended to cover
other aspects beyond costs.
As such, the focus on quantitative “costs” may have side-lined other elements in the business and regulatory
environment that raise the costs of doing business (i.e. resolving insolvency, incorporating a business, enforcing
contracts), as well as many industry specific regulations. The latter are better assessed in value chain analyses and
with methodologies designed specifically to measure regulatory compliance costs. However, to the extent that the
information was available, it was taken into account in the relevant section.
The rest of the paper is organized as follows. Section II discusses Zimbabwe’s current trading position, as well as
other relevant elements of the economic context in which the perceived competitiveness loss is developing.
Section III presents the data and analysis of each identified cost-driver. Section IV concludes with the policy
options identified. The last section includes some simple case studies on the impact in selected products of
reducing the costs of a few of the factors considered throughout this research paper.
17
II. ZIMBABWE’S EXTERNAL TRADE AND RELEVANT ECONOMIC CONTEXT
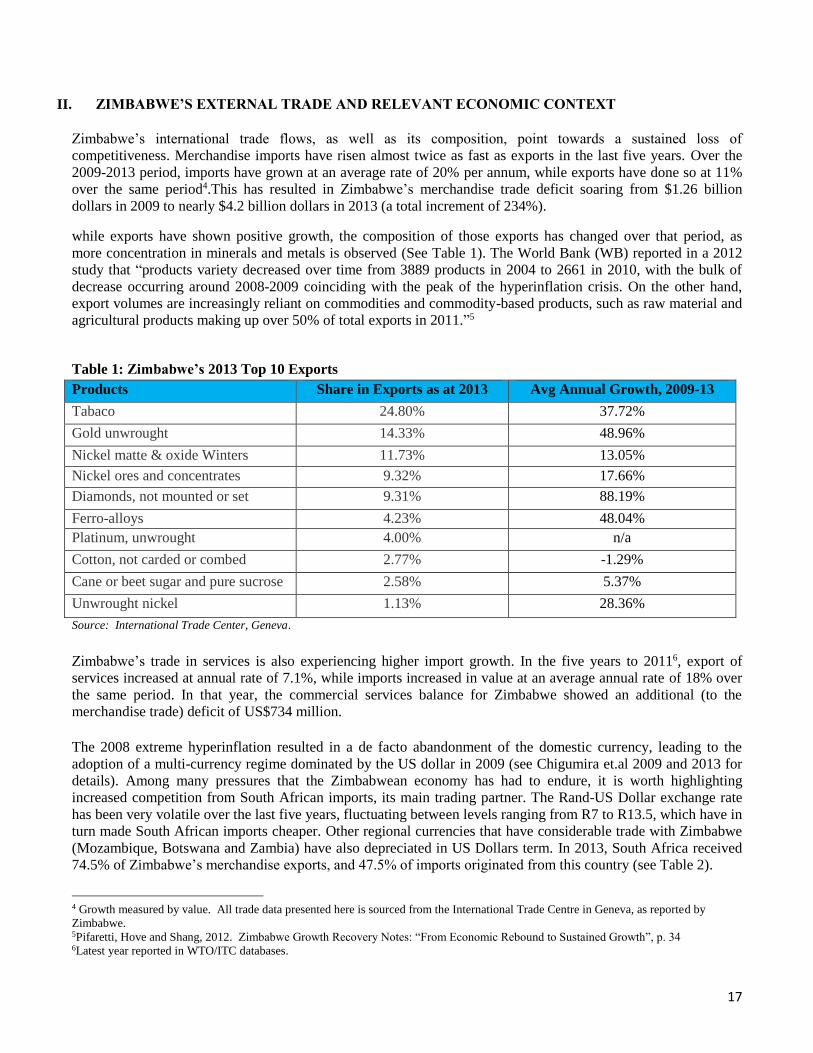
Zimbabwe’s international trade flows, as well as its composition, point towards a sustained loss of
competitiveness. Merchandise imports have risen almost twice as fast as exports in the last five years. Over the
2009-2013 period, imports have grown at an average rate of 20% per annum, while exports have done so at 11%
over the same period4.This has resulted in Zimbabwe’s merchandise trade deficit soaring from $1.26 billion
dollars in 2009 to nearly $4.2 billion dollars in 2013 (a total increment of 234%).
while exports have shown positive growth, the composition of those exports has changed over that period, as
more concentration in minerals and metals is observed (See Table 1). The World Bank (WB) reported in a 2012
study that “products variety decreased over time from 3889 products in 2004 to 2661 in 2010, with the bulk of
decrease occurring around 2008-2009 coinciding with the peak of the hyperinflation crisis. On the other hand,
export volumes are increasingly reliant on commodities and commodity-based products, such as raw material and
agricultural products making up over 50% of total exports in 2011.”5
Table 1: Zimbabwe’s 2013 Top 10 Exports
Products Share in Exports as at 2013 Avg Annual Growth, 2009-13
Tabaco 24.80% 37.72%
Gold unwrought 14.33% 48.96%
Nickel matte & oxide Winters 11.73% 13.05%
Nickel ores and concentrates 9.32% 17.66%
Diamonds, not mounted or set 9.31% 88.19%
Ferro-alloys 4.23% 48.04%
Platinum, unwrought 4.00% n/a
Cotton, not carded or combed 2.77% -1.29%
Cane or beet sugar and pure sucrose 2.58% 5.37%
Unwrought nickel 1.13% 28.36%
Source: International Trade Center, Geneva.
Zimbabwe’s trade in services is also experiencing higher import growth. In the five years to 20116, export of
services increased at annual rate of 7.1%, while imports increased in value at an average annual rate of 18% over
the same period. In that year, the commercial services balance for Zimbabwe showed an additional (to the
merchandise trade) deficit of US$734 million.
The 2008 extreme hyperinflation resulted in a de facto abandonment of the domestic currency, leading to the
adoption of a multi-currency regime dominated by the US dollar in 2009 (see Chigumira et.al 2009 and 2013 for
details). Among many pressures that the Zimbabwean economy has had to endure, it is worth highlighting
increased competition from South African imports, its main trading partner. The Rand-US Dollar exchange rate
has been very volatile over the last five years, fluctuating between levels ranging from R7 to R13.5, which have in
turn made South African imports cheaper. Other regional currencies that have considerable trade with Zimbabwe
(Mozambique, Botswana and Zambia) have also depreciated in US Dollars term. In 2013, South Africa received
74.5% of Zimbabwe’s merchandise exports, and 47.5% of imports originated from this country (see Table 2).
4 Growth measured by value. All trade data presented here is sourced from the International Trade Centre in Geneva, as reported by
Zimbabwe. 5Pifaretti, Hove and Shang, 2012. Zimbabwe Growth Recovery Notes: “From Economic Rebound to Sustained Growth”, p. 34 6Latest year reported in WTO/ITC databases.

18
Table 2: Zimbabwe’s Imports and Exports by Destination, 2013
Exports Markets % of Total Exports Origin of Imports % of Total Imports
South Africa 74.5 South Africa 47.5
Mozambique 10.5 United Kingdom 18.4
United Arab Emirates 6.5 China 5.7
Zambia 3.3 Zambia 3.4
Botswana 1.3 Mozambique 2.6
Source: International Trade Center, Geneva, as reported by Zimbabwe.
More specifically, a World Bank publication observed that Zimbabwe is developing a competitiveness gap. The
appreciation of the real exchange rate suggests that the price structure of the economy has shifted against tradable
products. In 2012, the International Monetary Fund (IMF) estimated that the real exchange would have to
depreciate by 15 to 20 % in order to clear the competitiveness gap and ensure long-term sustainability7.
The dollarization of the Zimbabwean economy precludes exchange rate devaluation. This implies that to regain
competitiveness a combination of increased productivity and reduction in the cost of doing business needs to be
achieved. This study is limited to selected factors of the latter, but reducing the cost of doing business will also
support productivity increases.
In this order of ideas, a holistic internal cost reduction, analogous to a process of “internal devaluation” is needed.
Zimbabwe’s situation resembles the situation of Central and European countries which had their currencies fixed
to the euro in the wake of the global financial crisis of 2008, and examining their policy responses to the
competitiveness challenge can be instructive. These are summarized in Annex 2. Rather than devaluing their
currencies, these countries regained their competitiveness through a series of policy responses to achieve the
required levels of internal devaluation. Key among these measures was achieving fiscal balance through public
wage cuts, which had ripple effects throughout the rest of their economies.
The scope and methodology of this study called for an examination of labour costs more broadly, and excluded
the examination of the effects of government finances in the overall level of costs in the economy. As such, the
issue is treated only tangentially in as much as public sector wages appear to be out of line with economic growth.
Nevertheless, the measures taken by these countries highlight, on one account, the stabilizing benefits of
achieving holistic cost reductions and on the other, additional options to achieve it.
7 Pifaretti, Hove and Shang, 2012. Zimbabwe Growth Recovery Notes: “From Economic Rebound to Sustained Growth”,IMF. p. 32

19
III. COST-DRIVERS COMPARATIVE ANALYSIS
The sections below analyse each cost-driver as identified in the introduction. Whenever possible, the costs are
benchmarked with levels in South Africa, Botswana, Mozambique, Zambia, which are the main regional trade
partners as discussed in the previous section.
A. Labour
Along with capital, labour is a basic factor of production, and its costs influences the costs of all goods and
services produced in the economy in the proportion of the particular intensity with which the production process
utilizes labour. As such, it has a cross-cutting influence in all the other identified cost-drivers, including finance.
In some sectors, such as manufacturing and banking, it might represent as much as 33% and 55% respectively of
total input costs. It is therefore critical to ensure that wage levels are aligned with overall growth and productivity
in the economy.
Considering minimum wage levels in 2013 as an indication of labour costs, labour in Zimbabwe is more
expensive in relation to Zambia, Botswana, and Mozambique. However, Zimbabwe appears to have labour cost
advantage in relation to South Africa. At an average of US$246.50 per month in Zimbabwe, the minimum wage
in Botswana, Mozambique and Zambia stands roughly between 42% and 53% of the level in Zimbabwe.
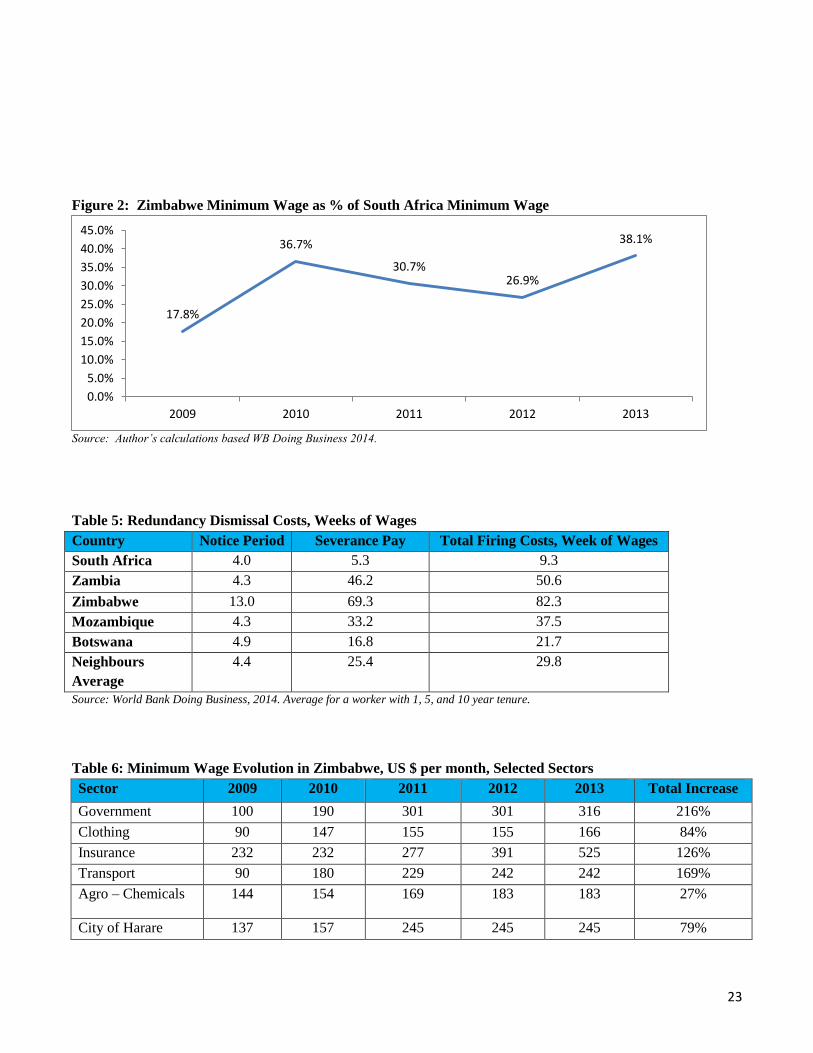
Nevertheless, the Zimbabwean minimum wage for an entry level position is roughly 38% of the South African
levels, where the comparable minimum is US$646.40. (See Table 3: Minimum Wage 2009-2013)8.
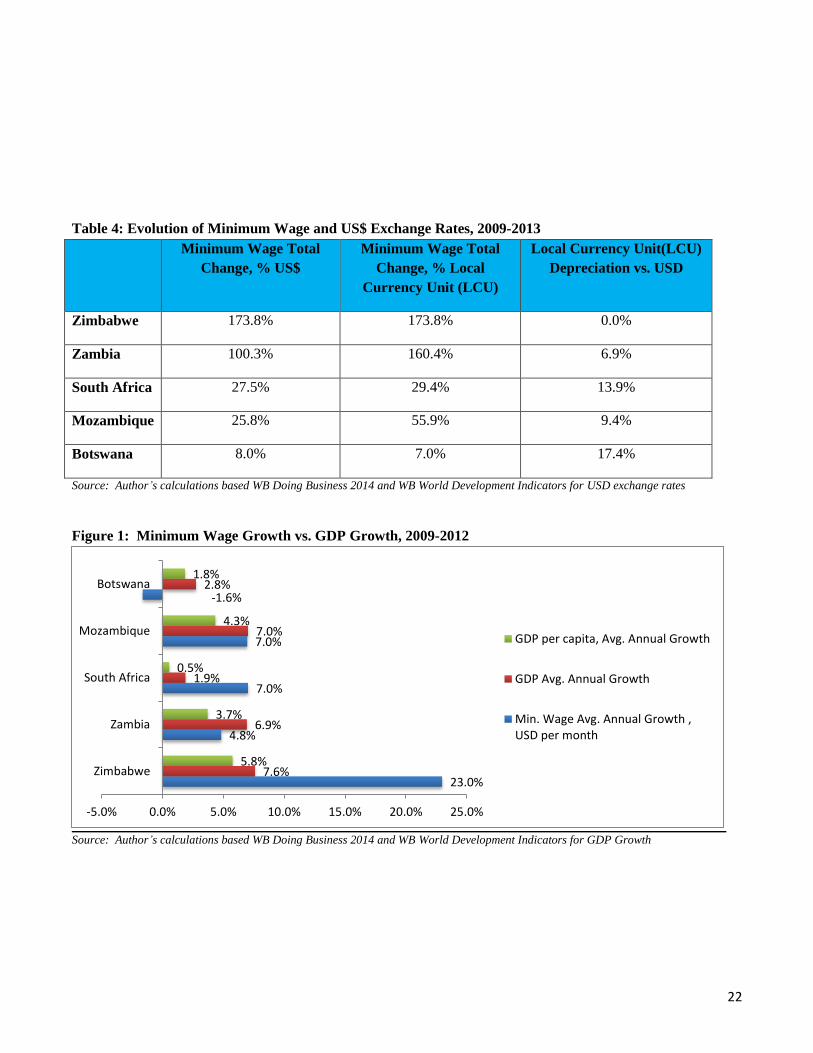
However, when one looks at the evolution of the minimum wage levels, a worrying trend emerges for Zimbabwe.
From 2009 to 2013, the minimum wage in Zimbabwe (in US dollar terms) increased from US$90 to the current
US$246.50 level (a total increase of 173.84%) which translates into an average annual growth of 28.6%.
Meanwhile, the minimum wage levels in the rest of the region only increased at average annual rates way below
that level- 19% in Zambia, 6.3% in South Africa, 5.9% in Mozambique and only 2% per year in Botswana over
the same period.
Private sector stakeholders consulted for this study (the Confederation of Zimbabwe Industries (CZI) and the
Zimbabwe National Chamber of Commerce (ZNCC) as well as individual business executives), while validating
the extent of labour cost increases in the last five years, had mixed views about whether the much larger wage
increases in comparison with regional levels were due to wages “catching up” from being set at the “wrong level”
due the dollarization process in 2009. However, there was broad agreement that the labour code and the practices
were out of date hence the need to modernize them if the Zimbabwean economy is to regain competitiveness.
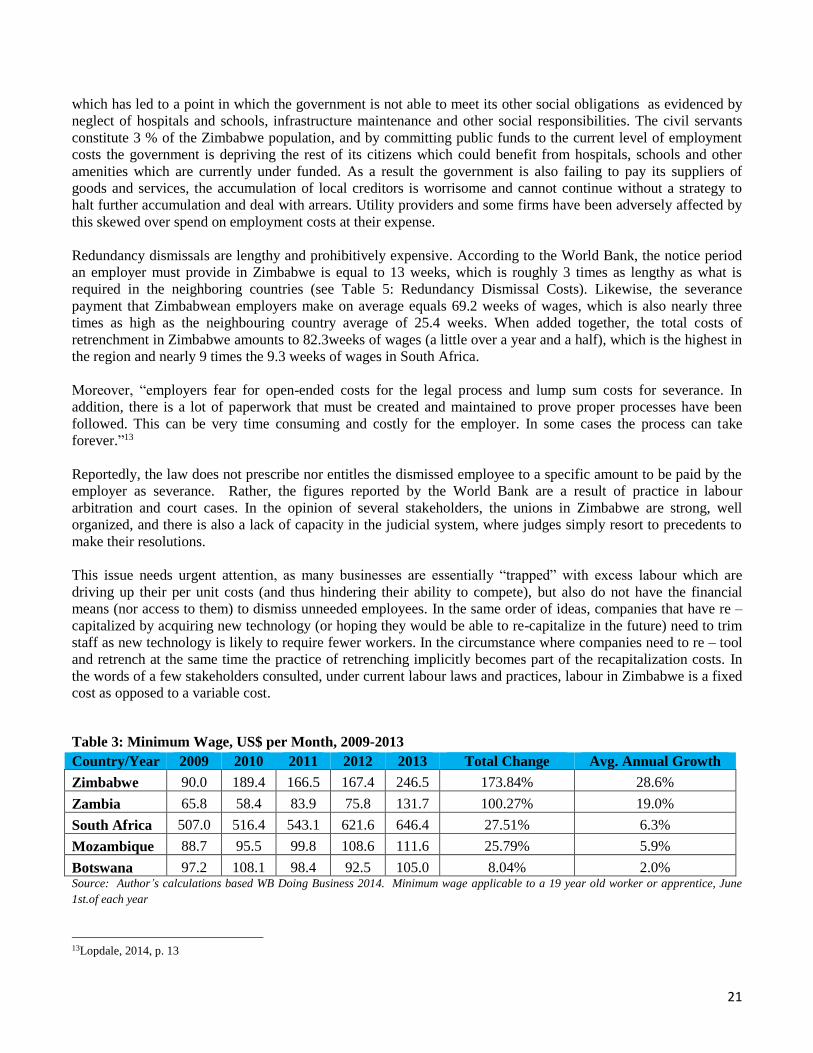
In any case, wage levels in a dollarized economy such as Zimbabwe need to be flexible enough to adjust to
competitive pressures which may stem from depreciation of currency levels in other countries (see Table 4:
Minimum Wages and Exchange Rates). Additionally, wage increases need to be aligned with productivity levels
for the economy to remain competitive. Neither of these principles is congruent with the observed wage increases
in Zimbabwe during the 2009-2013 period. While wage levels increased disproportionately in Zimbabwe,
regional trading partners experienced currency depreciations ranging from 6.9% (Zambia’s Kwacha) to 17.9%
(Botswana’s Pula). Likewise, the large increases in labour costs observed in Zimbabwe do not appear to be
justified by growth in Gross Domestic Product (GDP) per capita (see Figure 1)
8 The minimum wage is a good indicator but one factor that has not been explored explicitly in this study is the impact of the huge salaries
and allowances for top managers in the public & private sectors on competiveness especially where they have not been linked to
productivity and profitability of the enterprise. These salaries and allowances could be a major driver of cost especially in an environment
where there are such huge distortions.
20
The current labour code, as well as elements of practice underpinned by it, is contributing to driving labour costs
beyond sustainable levels in Zimbabwe, and, importantly, it is not placing the correct incentives for a motivated
and productive labour force. Although minor amendments have been enacted over the years, the labour laws date
from the introduction of the Labour Relations Act of 1985, with the imperative of protecting the employees from
the history of exploitation by what were then mostly non-indigenous employers.9 The Labour Act provides for
collective bargaining at the National Employment Council (NEC) level. The categorization of NECs is based on a
broad classification of industries, which many times may include sub-sectors and companies with varying cost
structures. However, the agreed salary increases at NEC level are applicable to all companies falling under the
particular NEC, without considering their ability to pay. While exemptions are allowed, a climate of expectation
will have already been created by the increase agreed at the NEC level. This practice translates into salary
increases expected and upheld by law and practice for all employees regardless of their performance and
productivity.
Additionally, the Poverty Datum Line (PDL) is used traditionally as a reference for wage negotiations.10The
labour movement in Zimbabwe is strong, and the attempt to close the gap between PDL and the minimum wages
may lead to a situation in which competitiveness would be difficult to regain.
When examining the initial level and evolution of minimum wages in different sectors (see Table 6 and Table 7),
one can observe the different levels of bargaining power between the central government, state owned enterprises
(as exemplified by ZESA) and local government (as exemplified by the City of Harare). The central government
appears to have been able to control wage growth establishing at the outset of dollarization an initially minimum
of $100 per month. In the private sector, the levels were lower with the exception of banking and insurance.
However, ZESA and the City of Harare, even when they are part of the government, started at much higher levels.
Over the subsequent years the latter situation has corrected itself as moderate increases to the minimum wage
were registered. The situation highlights, though, the lack of reference to productivity levels and ability to pay in
labour negotiations.
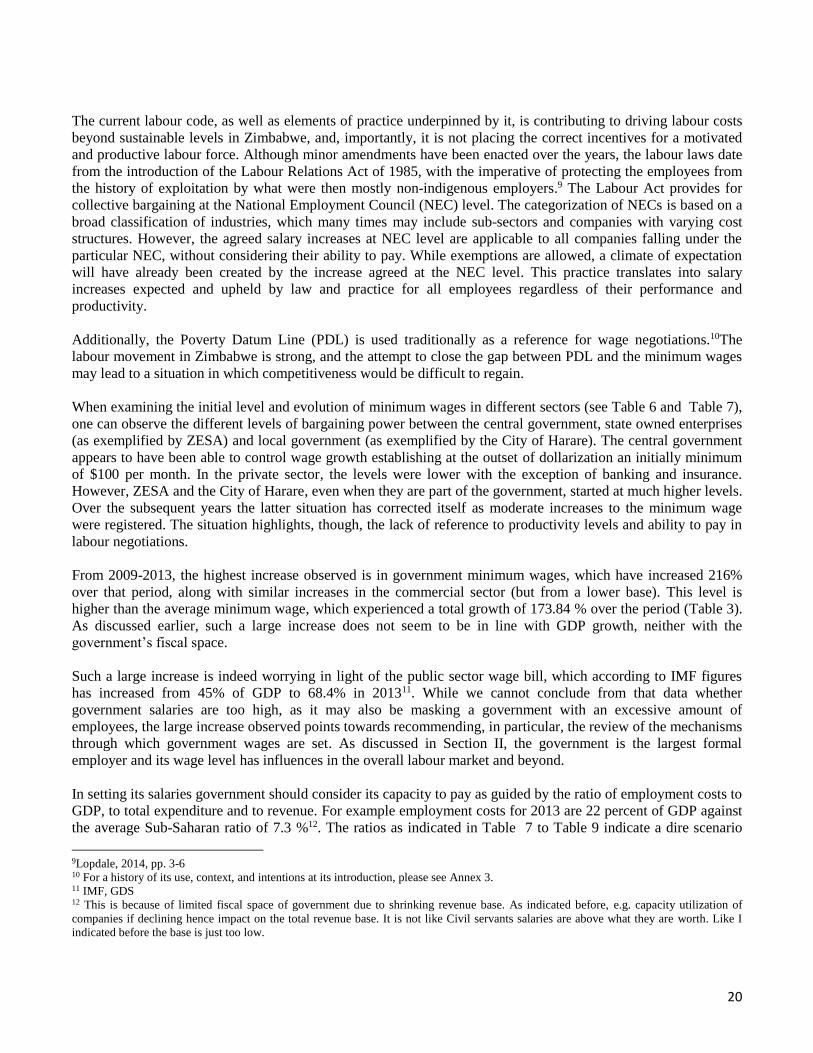
From 2009-2013, the highest increase observed is in government minimum wages, which have increased 216%
over that period, along with similar increases in the commercial sector (but from a lower base). This level is
higher than the average minimum wage, which experienced a total growth of 173.84 % over the period (Table 3).
As discussed earlier, such a large increase does not seem to be in line with GDP growth, neither with the
government’s fiscal space.
Such a large increase is indeed worrying in light of the public sector wage bill, which according to IMF figures
has increased from 45% of GDP to 68.4% in 201311. While we cannot conclude from that data whether
government salaries are too high, as it may also be masking a government with an excessive amount of
employees, the large increase observed points towards recommending, in particular, the review of the mechanisms
through which government wages are set. As discussed in Section II, the government is the largest formal
employer and its wage level has influences in the overall labour market and beyond.
In setting its salaries government should consider its capacity to pay as guided by the ratio of employment costs to
GDP, to total expenditure and to revenue. For example employment costs for 2013 are 22 percent of GDP against
the average Sub-Saharan ratio of 7.3 %12. The ratios as indicated in Table 7 to Table 9 indicate a dire scenario
9Lopdale, 2014, pp. 3-6 10 For a history of its use, context, and intentions at its introduction, please see Annex 3. 11 IMF, GDS 12 This is because of limited fiscal space of government due to shrinking revenue base. As indicated before, e.g. capacity utilization of
companies if declining hence impact on the total revenue base. It is not like Civil servants salaries are above what they are worth. Like I
indicated before the base is just too low.
21
which has led to a point in which the government is not able to meet its other social obligations as evidenced by
neglect of hospitals and schools, infrastructure maintenance and other social responsibilities. The civil servants
constitute 3 % of the Zimbabwe population, and by committing public funds to the current level of employment
costs the government is depriving the rest of its citizens which could benefit from hospitals, schools and other
amenities which are currently under funded. As a result the government is also failing to pay its suppliers of
goods and services, the accumulation of local creditors is worrisome and cannot continue without a strategy to
halt further accumulation and deal with arrears. Utility providers and some firms have been adversely affected by
this skewed over spend on employment costs at their expense.
Redundancy dismissals are lengthy and prohibitively expensive. According to the World Bank, the notice period
an employer must provide in Zimbabwe is equal to 13 weeks, which is roughly 3 times as lengthy as what is
required in the neighboring countries (see Table 5: Redundancy Dismissal Costs). Likewise, the severance
payment that Zimbabwean employers make on average equals 69.2 weeks of wages, which is also nearly three
times as high as the neighbouring country average of 25.4 weeks. When added together, the total costs of
retrenchment in Zimbabwe amounts to 82.3weeks of wages (a little over a year and a half), which is the highest in
the region and nearly 9 times the 9.3 weeks of wages in South Africa.
Moreover, “employers fear for open-ended costs for the legal process and lump sum costs for severance. In
addition, there is a lot of paperwork that must be created and maintained to prove proper processes have been
followed. This can be very time consuming and costly for the employer. In some cases the process can take
forever.”13
Reportedly, the law does not prescribe nor entitles the dismissed employee to a specific amount to be paid by the
employer as severance. Rather, the figures reported by the World Bank are a result of practice in labour
arbitration and court cases. In the opinion of several stakeholders, the unions in Zimbabwe are strong, well
organized, and there is also a lack of capacity in the judicial system, where judges simply resort to precedents to
make their resolutions.
This issue needs urgent attention, as many businesses are essentially “trapped” with excess labour which are
driving up their per unit costs (and thus hindering their ability to compete), but also do not have the financial
means (nor access to them) to dismiss unneeded employees. In the same order of ideas, companies that have re –
capitalized by acquiring new technology (or hoping they would be able to re-capitalize in the future) need to trim
staff as new technology is likely to require fewer workers. In the circumstance where companies need to re – tool
and retrench at the same time the practice of retrenching implicitly becomes part of the recapitalization costs. In
the words of a few stakeholders consulted, under current labour laws and practices, labour in Zimbabwe is a fixed
cost as opposed to a variable cost.
Table 3: Minimum Wage, US$ per Month, 2009-2013
Country/Year 2009 2010 2011 2012 2013 Total Change Avg. Annual Growth
Zimbabwe 90.0 189.4 166.5 167.4 246.5 173.84% 28.6%
Zambia 65.8 58.4 83.9 75.8 131.7 100.27% 19.0%
South Africa 507.0 516.4 543.1 621.6 646.4 27.51% 6.3%
Mozambique 88.7 95.5 99.8 108.6 111.6 25.79% 5.9%
Botswana 97.2 108.1 98.4 92.5 105.0 8.04% 2.0% Source: Author’s calculations based WB Doing Business 2014. Minimum wage applicable to a 19 year old worker or apprentice, June
1st.of each year
13Lopdale, 2014, p. 13
22
Table 4: Evolution of Minimum Wage and US$ Exchange Rates, 2009-2013
Minimum Wage Total
Change, % US$
Minimum Wage Total
Change, % Local
Currency Unit (LCU)
Local Currency Unit(LCU)
Depreciation vs. USD
Zimbabwe 173.8% 173.8% 0.0%
Zambia 100.3% 160.4% 6.9%
South Africa 27.5% 29.4% 13.9%
Mozambique 25.8% 55.9% 9.4%
Botswana 8.0% 7.0% 17.4%
Source: Author’s calculations based WB Doing Business 2014 and WB World Development Indicators for USD exchange rates
Figure 1: Minimum Wage Growth vs. GDP Growth, 2009-2012
Source: Author’s calculations based WB Doing Business 2014 and WB World Development Indicators for GDP Growth
23.0%
4.8%
7.0%
7.0%
-1.6%
7.6%
6.9%
1.9%
7.0%
2.8%
5.8%
3.7%
0.5%
4.3%
1.8%
-5.0% 0.0% 5.0% 10.0% 15.0% 20.0% 25.0%
Zimbabwe
Zambia
South Africa
Mozambique
Botswana
GDP per capita, Avg. Annual Growth
GDP Avg. Annual Growth
Min. Wage Avg. Annual Growth ,USD per month
23
Figure 2: Zimbabwe Minimum Wage as % of South Africa Minimum Wage
Source: Author’s calculations based WB Doing Business 2014.
Table 5: Redundancy Dismissal Costs, Weeks of Wages
Country Notice Period Severance Pay Total Firing Costs, Week of Wages
South Africa 4.0 5.3 9.3
Zambia 4.3 46.2 50.6
Zimbabwe 13.0 69.3 82.3
Mozambique 4.3 33.2 37.5
Botswana 4.9 16.8 21.7
Neighbours
Average
4.4 25.4 29.8
Source: World Bank Doing Business, 2014. Average for a worker with 1, 5, and 10 year tenure.
Table 6: Minimum Wage Evolution in Zimbabwe, US $ per month, Selected Sectors
Sector 2009 2010 2011 2012 2013 Total Increase
Government 100 190 301 301 316 216%
Clothing 90 147 155 155 166 84%
Insurance 232 232 277 391 525 126%
Transport 90 180 229 242 242 169%
Agro – Chemicals 144 154 169 183 183 27%
City of Harare 137 157 245 245 245 79%
17.8%
36.7%
30.7%26.9%
38.1%
0.0%
5.0%
10.0%
15.0%
20.0%
25.0%
30.0%
35.0%
40.0%
45.0%
2009 2010 2011 2012 2013
24
Z.E.S.A. 214 214 224 275 294 37%
Commercial 70 150 200 220 246 251%
Banking 273 355 575 575 575 111%
Source: Labour and Economic Development Institute of Zimbabwe, Min of Labour, Public Service and Social Welfare, National
Employment Council
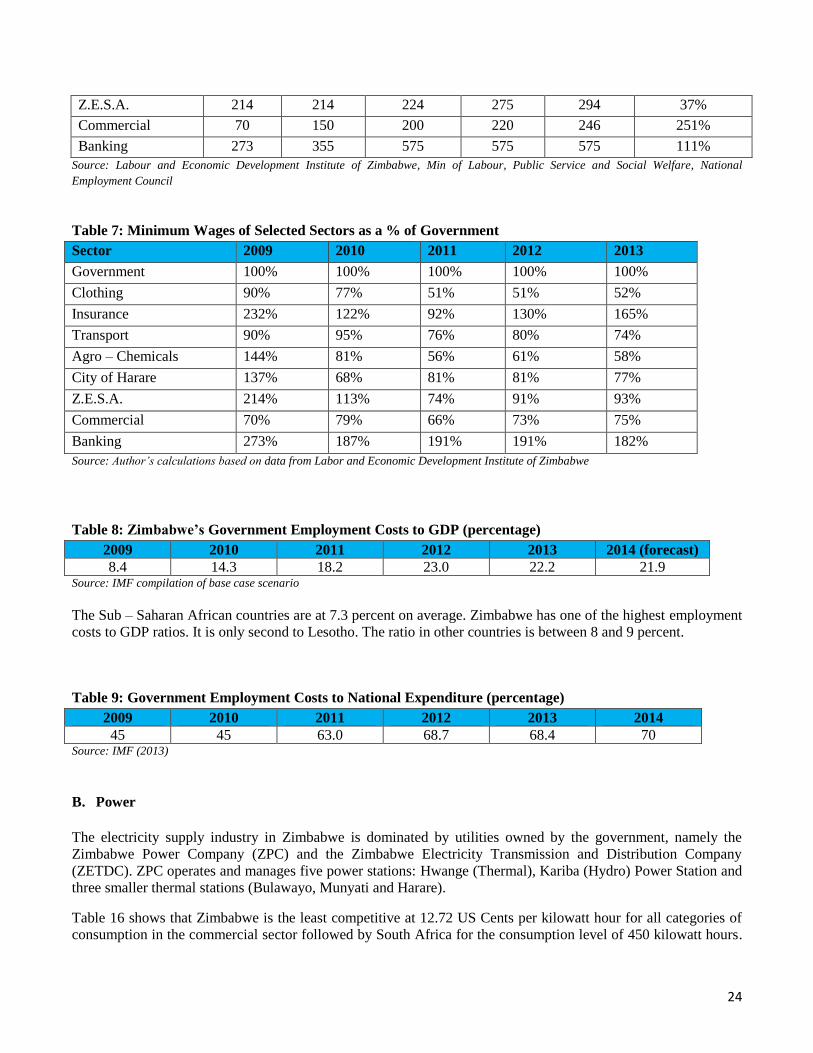
Table 7: Minimum Wages of Selected Sectors as a % of Government
Source: Author’s calculations based on data from Labor and Economic Development Institute of Zimbabwe
Table 8: Zimbabwe’s Government Employment Costs to GDP (percentage)
2009 2010 2011 2012 2013 2014 (forecast)
8.4 14.3 18.2 23.0 22.2 21.9 Source: IMF compilation of base case scenario
The Sub – Saharan African countries are at 7.3 percent on average. Zimbabwe has one of the highest employment
costs to GDP ratios. It is only second to Lesotho. The ratio in other countries is between 8 and 9 percent.
Table 9: Government Employment Costs to National Expenditure (percentage)
2009 2010 2011 2012 2013 2014
45 45 63.0 68.7 68.4 70 Source: IMF (2013)
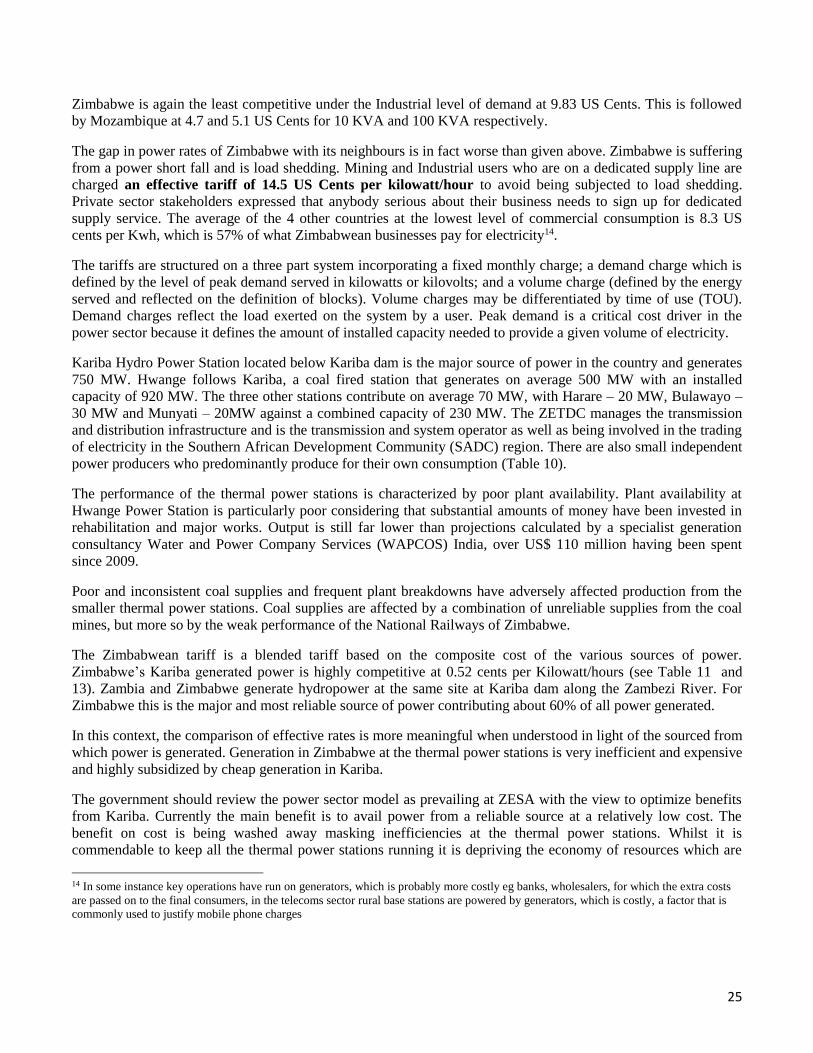
B. Power
The electricity supply industry in Zimbabwe is dominated by utilities owned by the government, namely the
Zimbabwe Power Company (ZPC) and the Zimbabwe Electricity Transmission and Distribution Company
(ZETDC). ZPC operates and manages five power stations: Hwange (Thermal), Kariba (Hydro) Power Station and
three smaller thermal stations (Bulawayo, Munyati and Harare).
Table 16 shows that Zimbabwe is the least competitive at 12.72 US Cents per kilowatt hour for all categories of
consumption in the commercial sector followed by South Africa for the consumption level of 450 kilowatt hours.
Sector 2009 2010 2011 2012 2013
Government 100% 100% 100% 100% 100%
Clothing 90% 77% 51% 51% 52%
Insurance 232% 122% 92% 130% 165%
Transport 90% 95% 76% 80% 74%
Agro – Chemicals 144% 81% 56% 61% 58%
City of Harare 137% 68% 81% 81% 77%
Z.E.S.A. 214% 113% 74% 91% 93%
Commercial 70% 79% 66% 73% 75%
Banking 273% 187% 191% 191% 182%
25
Zimbabwe is again the least competitive under the Industrial level of demand at 9.83 US Cents. This is followed
by Mozambique at 4.7 and 5.1 US Cents for 10 KVA and 100 KVA respectively.
The gap in power rates of Zimbabwe with its neighbours is in fact worse than given above. Zimbabwe is suffering
from a power short fall and is load shedding. Mining and Industrial users who are on a dedicated supply line are
charged an effective tariff of 14.5 US Cents per kilowatt/hour to avoid being subjected to load shedding.
Private sector stakeholders expressed that anybody serious about their business needs to sign up for dedicated
supply service. The average of the 4 other countries at the lowest level of commercial consumption is 8.3 US
cents per Kwh, which is 57% of what Zimbabwean businesses pay for electricity14.
The tariffs are structured on a three part system incorporating a fixed monthly charge; a demand charge which is
defined by the level of peak demand served in kilowatts or kilovolts; and a volume charge (defined by the energy
served and reflected on the definition of blocks). Volume charges may be differentiated by time of use (TOU).
Demand charges reflect the load exerted on the system by a user. Peak demand is a critical cost driver in the
power sector because it defines the amount of installed capacity needed to provide a given volume of electricity.
Kariba Hydro Power Station located below Kariba dam is the major source of power in the country and generates
750 MW. Hwange follows Kariba, a coal fired station that generates on average 500 MW with an installed
capacity of 920 MW. The three other stations contribute on average 70 MW, with Harare – 20 MW, Bulawayo –
30 MW and Munyati – 20MW against a combined capacity of 230 MW. The ZETDC manages the transmission
and distribution infrastructure and is the transmission and system operator as well as being involved in the trading
of electricity in the Southern African Development Community (SADC) region. There are also small independent
power producers who predominantly produce for their own consumption (Table 10).
The performance of the thermal power stations is characterized by poor plant availability. Plant availability at
Hwange Power Station is particularly poor considering that substantial amounts of money have been invested in
rehabilitation and major works. Output is still far lower than projections calculated by a specialist generation
consultancy Water and Power Company Services (WAPCOS) India, over US$ 110 million having been spent
since 2009.
Poor and inconsistent coal supplies and frequent plant breakdowns have adversely affected production from the
smaller thermal power stations. Coal supplies are affected by a combination of unreliable supplies from the coal
mines, but more so by the weak performance of the National Railways of Zimbabwe.
The Zimbabwean tariff is a blended tariff based on the composite cost of the various sources of power.
Zimbabwe’s Kariba generated power is highly competitive at 0.52 cents per Kilowatt/hours (see Table 11 and
13). Zambia and Zimbabwe generate hydropower at the same site at Kariba dam along the Zambezi River. For
Zimbabwe this is the major and most reliable source of power contributing about 60% of all power generated.
In this context, the comparison of effective rates is more meaningful when understood in light of the sourced from
which power is generated. Generation in Zimbabwe at the thermal power stations is very inefficient and expensive
and highly subsidized by cheap generation in Kariba.
The government should review the power sector model as prevailing at ZESA with the view to optimize benefits
from Kariba. Currently the main benefit is to avail power from a reliable source at a relatively low cost. The
benefit on cost is being washed away masking inefficiencies at the thermal power stations. Whilst it is
commendable to keep all the thermal power stations running it is depriving the economy of resources which are
14 In some instance key operations have run on generators, which is probably more costly eg banks, wholesalers, for which the extra costs
are passed on to the final consumers, in the telecoms sector rural base stations are powered by generators, which is costly, a factor that is
commonly used to justify mobile phone charges
26
being ploughed into them. As mentioned above US$ 109 million has been spent at Hwange Power Station, but the
country is still to receive the fully anticipated benefits from the investment.
Options to explore include:
With the objective of reducing power costs to the economy, ZPC could be unbundled by separating
Kariba into an entity 100 % owned by government and invite private sector participation into the existing
thermal power stations. This should bring about competition in generation. Creating competition and
private sector involvement should lead to a reduction of waste and inefficiencies in the sector resulting in
lower generation costs. Several options exist for this, such as combining the 3 thermal stations into one
company and inviting private shareholders through a listing on the stock exchange with a major strategic
partner or split the thermal power stations into three different companies and invite private investors as
strategic partners with government.
It is recognized that one of the challenges facing government is limited fiscal space; Kariba could be used
strategically for new expansions in hydro generation and to support the national budget. This could be
done through a memorandum and articles that restrict dividend payments to ensure that sufficient reserves
are maintained for dam wall maintenance and future expansion. Also for a set period a stabilization fund
could be established from the profits for a target period whilst new arrangements for thermal power
generation improve productivity to prevent shocks on the tariff. As alluded to above private sector
participation would minimize the inefficiencies at the thermal stations and the economic benefits from
Kariba would supersede access to electricity alone but to include a financial benefit from profits, which
are now being washed away.
Zimbabwe domestic consumers use electricity for home heating. The model where electricity is used for
this purpose arose from prior to independence where the country had excess cheap power from Kariba.
With demand exceeding supply and the high cost of building new power stations it is recommended that
the use of power by domestic consumers be reviewed with the view to promote the use of LP (Liquefied
Petroleum) gas. It is cheaper and will release a lot of power for commercial use. Effective demand for
power as measured by what can be paid for is not as high as is currently consumed. The collection
efficiencies are not as high as evidenced by the arrears at ZETDC.
It is recommended that a study is commissioned to evaluate the sector holistically to optimize the use of power,
involvement of the private sector into existing power stations and assessment of how the country could derive
financial benefit from Kariba Power Station.
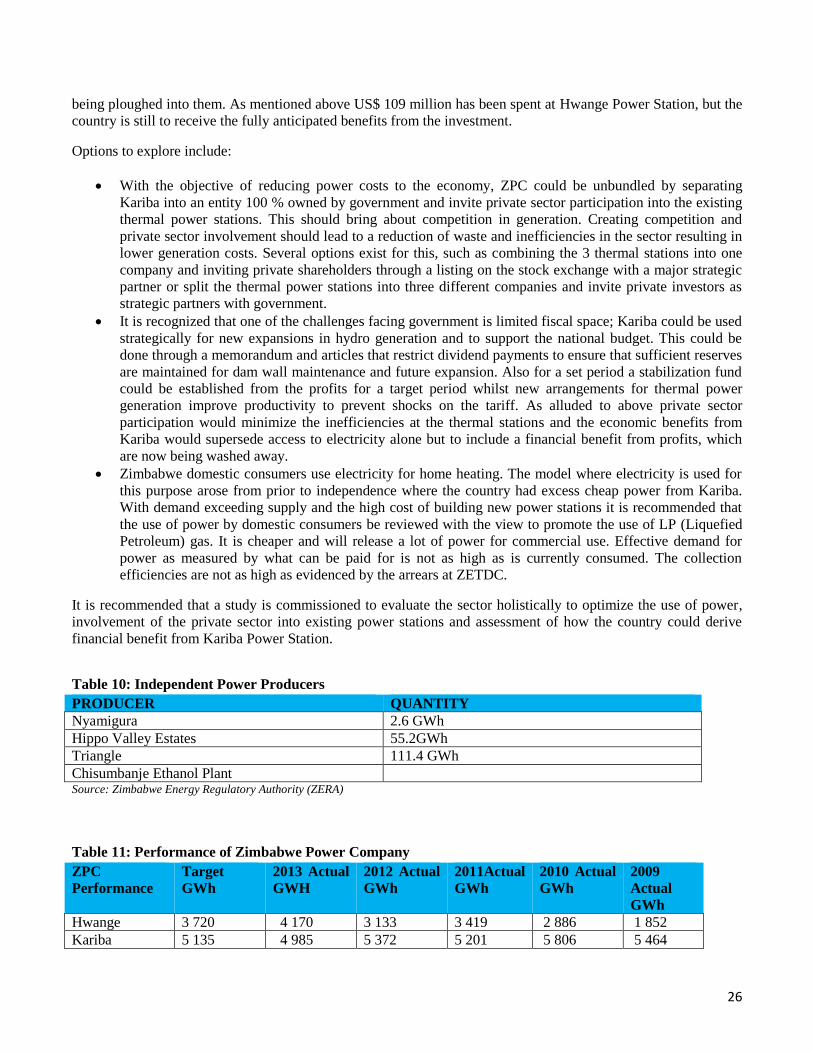
Table 10: Independent Power Producers
PRODUCER QUANTITY
Nyamigura 2.6 GWh
Hippo Valley Estates 55.2GWh
Triangle 111.4 GWh
Chisumbanje Ethanol Plant Source: Zimbabwe Energy Regulatory Authority (ZERA)
Table 11: Performance of Zimbabwe Power Company
ZPC
Performance
Target
GWh
2013 Actual
GWH
2012 Actual
GWh
2011Actual
GWh
2010 Actual
GWh
2009
Actual
GWh
Hwange 3 720 4 170 3 133 3 419 2 886 1 852
Kariba 5 135 4 985 5 372 5 201 5 806 5 464

27
Harare 193 150 60 73 0 25
Munyati 223 202 203 193 80 0
Bulawayo 223 187 178 125 0 0
Total 9 494 11 713 8 946 9 013 10 781 9 350 Source: ZERA
Table 12: Average Capacity Utilization
Source Established Capacity
(MW)
Capacity Utilization
(MW)
Percent Capacity Utilization
Hwange 920 575 63
Kariba 750 750 100
Bulawayo 90 35 39
Munyati 120 31 26
Harare 90 45 55
Total 1970 1 436 73 Source: ZERA
Table 13: Cost of Power by Source
Source Cost per MW
(US Cents)
Average
Produced 2011
– 2013 GWh)
Average Total
Cost per Year
Percent of
Total
Produced
Percent of
Total Cost
Hwange 8.14 3 276 266 670 000 36.00 73
Kariba 0.52 5 286 26 430 000 58.00 7
Bulawayo 15 66 9 900 000 0.07 3
Munyati 15 198 29 700 000 2.00 8
Harare 16 200 32 000 000 0.20 9
Total 9 026 364 700 000 Source: ZERA
Table 14: Regional Comparison Hydro Power Generation Costs
Country Cost Per MW (US Cents)
Zimbabwe 0.52
Mozambique 2.00
Zambia 2.00
South Africa 2.7
DRC 2.50 Source: Infrastructure Country Diagnostic Power Tariff Database
Table 15: Regional Comparison Thermal Power Generation
Country Cost Per MW
Zimbabwe (Hwange Power Station) 8.14
Botswana (Moropule) 4
South Africa 4.7 Source: Infrastructure Country Diagnostic Power Tariff Database
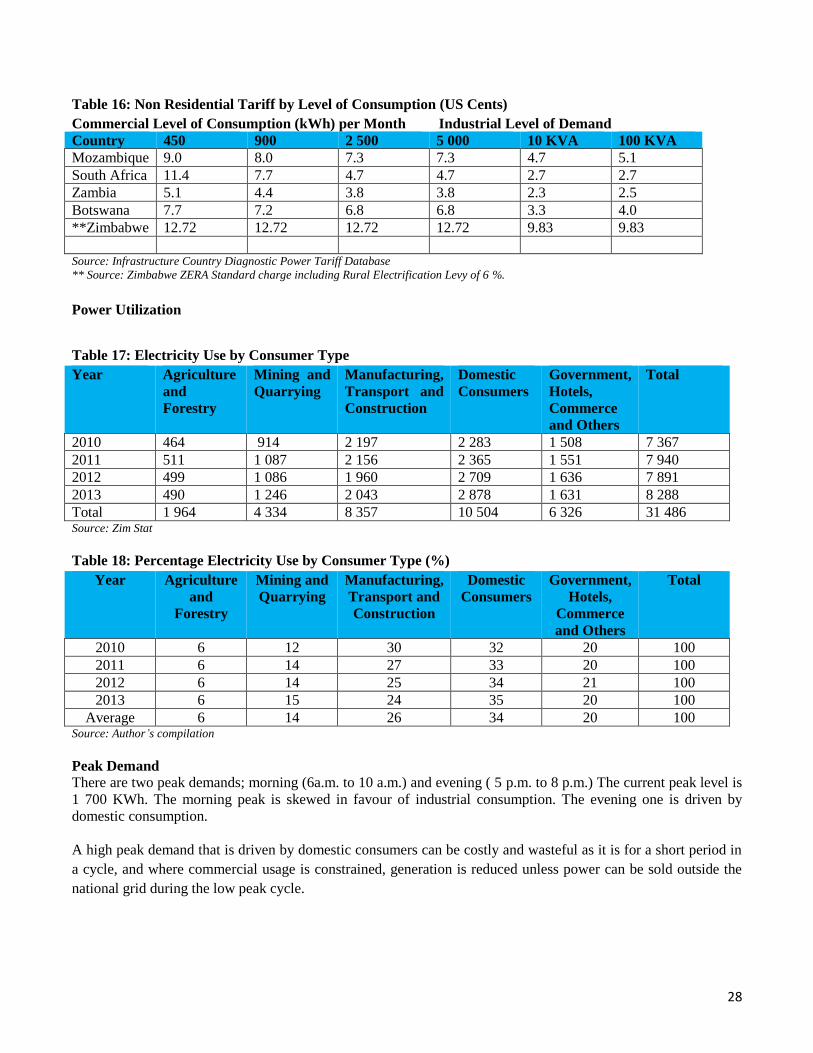
28
Table 16: Non Residential Tariff by Level of Consumption (US Cents)
Commercial Level of Consumption (kWh) per Month Industrial Level of Demand
Country 450 900 2 500 5 000 10 KVA 100 KVA
Mozambique 9.0 8.0 7.3 7.3 4.7 5.1
South Africa 11.4 7.7 4.7 4.7 2.7 2.7
Zambia 5.1 4.4 3.8 3.8 2.3 2.5
Botswana 7.7 7.2 6.8 6.8 3.3 4.0
**Zimbabwe 12.72 12.72 12.72 12.72 9.83 9.83
Source: Infrastructure Country Diagnostic Power Tariff Database
** Source: Zimbabwe ZERA Standard charge including Rural Electrification Levy of 6 %.
Power Utilization
Table 17: Electricity Use by Consumer Type
Year Agriculture
and
Forestry
Mining and
Quarrying
Manufacturing,
Transport and
Construction
Domestic
Consumers
Government,
Hotels,
Commerce
and Others
Total
2010 464 914 2 197 2 283 1 508 7 367
2011 511 1 087 2 156 2 365 1 551 7 940
2012 499 1 086 1 960 2 709 1 636 7 891
2013 490 1 246 2 043 2 878 1 631 8 288
Total 1 964 4 334 8 357 10 504 6 326 31 486 Source: Zim Stat
Table 18: Percentage Electricity Use by Consumer Type (%)
Year Agriculture
and
Forestry
Mining and
Quarrying
Manufacturing,
Transport and
Construction
Domestic
Consumers
Government,
Hotels,
Commerce
and Others
Total
2010 6 12 30 32 20 100
2011 6 14 27 33 20 100
2012 6 14 25 34 21 100
2013 6 15 24 35 20 100
Average 6 14 26 34 20 100 Source: Author’s compilation
Peak Demand
There are two peak demands; morning (6a.m. to 10 a.m.) and evening ( 5 p.m. to 8 p.m.) The current peak level is
1 700 KWh. The morning peak is skewed in favour of industrial consumption. The evening one is driven by
domestic consumption.
A high peak demand that is driven by domestic consumers can be costly and wasteful as it is for a short period in
a cycle, and where commercial usage is constrained, generation is reduced unless power can be sold outside the
national grid during the low peak cycle.
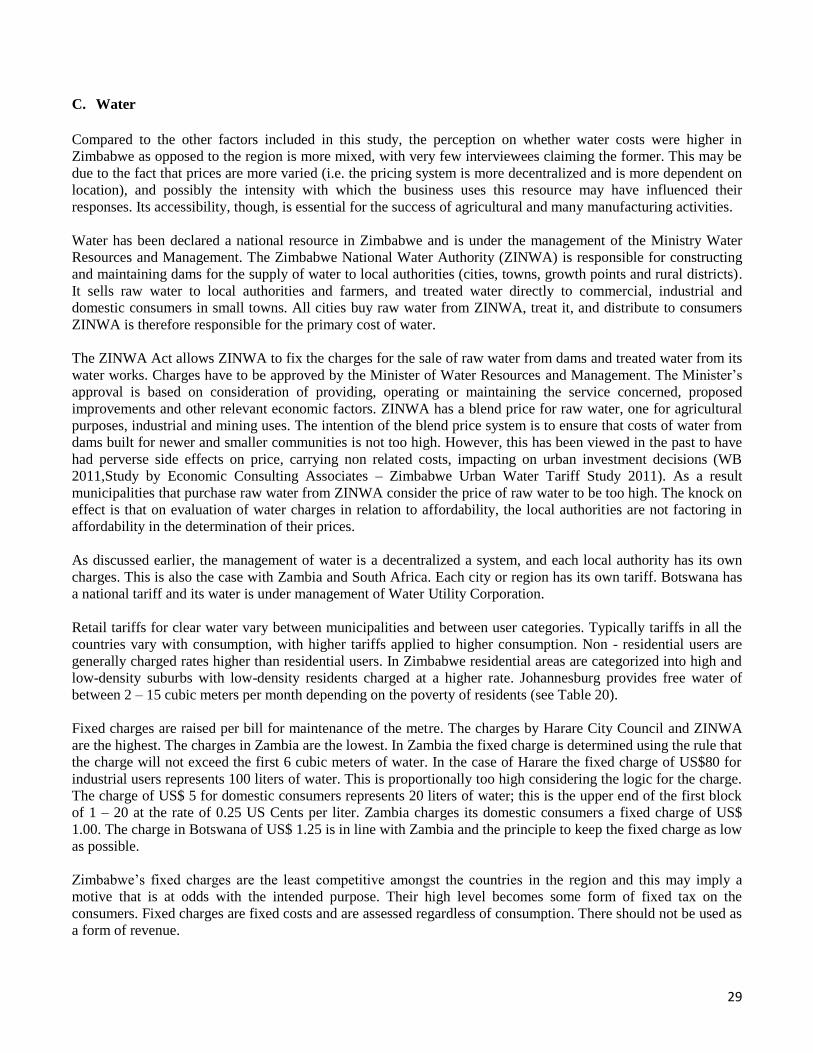
29
C. Water
Compared to the other factors included in this study, the perception on whether water costs were higher in
Zimbabwe as opposed to the region is more mixed, with very few interviewees claiming the former. This may be
due to the fact that prices are more varied (i.e. the pricing system is more decentralized and is more dependent on
location), and possibly the intensity with which the business uses this resource may have influenced their
responses. Its accessibility, though, is essential for the success of agricultural and many manufacturing activities.
Water has been declared a national resource in Zimbabwe and is under the management of the Ministry Water
Resources and Management. The Zimbabwe National Water Authority (ZINWA) is responsible for constructing
and maintaining dams for the supply of water to local authorities (cities, towns, growth points and rural districts).
It sells raw water to local authorities and farmers, and treated water directly to commercial, industrial and
domestic consumers in small towns. All cities buy raw water from ZINWA, treat it, and distribute to consumers
ZINWA is therefore responsible for the primary cost of water.
The ZINWA Act allows ZINWA to fix the charges for the sale of raw water from dams and treated water from its
water works. Charges have to be approved by the Minister of Water Resources and Management. The Minister’s
approval is based on consideration of providing, operating or maintaining the service concerned, proposed
improvements and other relevant economic factors. ZINWA has a blend price for raw water, one for agricultural
purposes, industrial and mining uses. The intention of the blend price system is to ensure that costs of water from
dams built for newer and smaller communities is not too high. However, this has been viewed in the past to have
had perverse side effects on price, carrying non related costs, impacting on urban investment decisions (WB
2011,Study by Economic Consulting Associates – Zimbabwe Urban Water Tariff Study 2011). As a result
municipalities that purchase raw water from ZINWA consider the price of raw water to be too high. The knock on
effect is that on evaluation of water charges in relation to affordability, the local authorities are not factoring in
affordability in the determination of their prices.
As discussed earlier, the management of water is a decentralized a system, and each local authority has its own
charges. This is also the case with Zambia and South Africa. Each city or region has its own tariff. Botswana has
a national tariff and its water is under management of Water Utility Corporation.
Retail tariffs for clear water vary between municipalities and between user categories. Typically tariffs in all the
countries vary with consumption, with higher tariffs applied to higher consumption. Non - residential users are
generally charged rates higher than residential users. In Zimbabwe residential areas are categorized into high and
low-density suburbs with low-density residents charged at a higher rate. Johannesburg provides free water of
between 2 – 15 cubic meters per month depending on the poverty of residents (see Table 20).
Fixed charges are raised per bill for maintenance of the metre. The charges by Harare City Council and ZINWA
are the highest. The charges in Zambia are the lowest. In Zambia the fixed charge is determined using the rule that
the charge will not exceed the first 6 cubic meters of water. In the case of Harare the fixed charge of US$80 for
industrial users represents 100 liters of water. This is proportionally too high considering the logic for the charge.
The charge of US$ 5 for domestic consumers represents 20 liters of water; this is the upper end of the first block
of 1 – 20 at the rate of 0.25 US Cents per liter. Zambia charges its domestic consumers a fixed charge of US$
1.00. The charge in Botswana of US$ 1.25 is in line with Zambia and the principle to keep the fixed charge as low
as possible.
Zimbabwe’s fixed charges are the least competitive amongst the countries in the region and this may imply a
motive that is at odds with the intended purpose. Their high level becomes some form of fixed tax on the
consumers. Fixed charges are fixed costs and are assessed regardless of consumption. There should not be used as
a form of revenue.
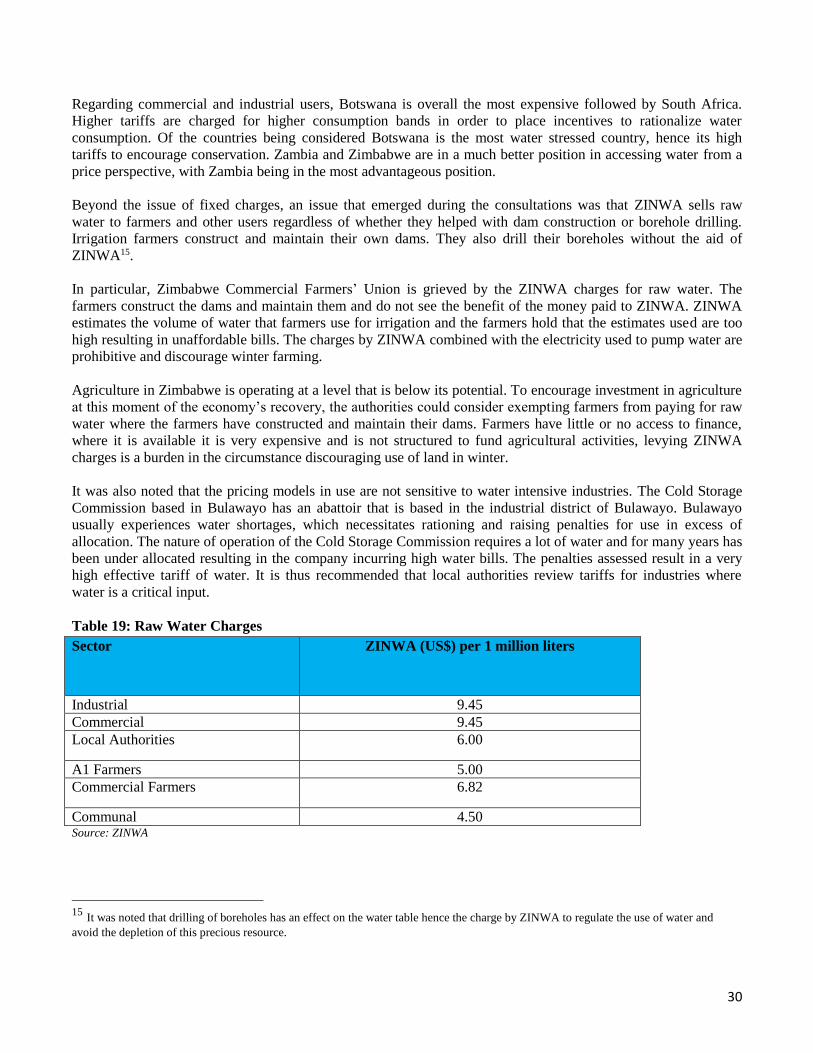
30
Regarding commercial and industrial users, Botswana is overall the most expensive followed by South Africa.
Higher tariffs are charged for higher consumption bands in order to place incentives to rationalize water
consumption. Of the countries being considered Botswana is the most water stressed country, hence its high
tariffs to encourage conservation. Zambia and Zimbabwe are in a much better position in accessing water from a
price perspective, with Zambia being in the most advantageous position.
Beyond the issue of fixed charges, an issue that emerged during the consultations was that ZINWA sells raw
water to farmers and other users regardless of whether they helped with dam construction or borehole drilling.
Irrigation farmers construct and maintain their own dams. They also drill their boreholes without the aid of
ZINWA15.
In particular, Zimbabwe Commercial Farmers’ Union is grieved by the ZINWA charges for raw water. The
farmers construct the dams and maintain them and do not see the benefit of the money paid to ZINWA. ZINWA
estimates the volume of water that farmers use for irrigation and the farmers hold that the estimates used are too
high resulting in unaffordable bills. The charges by ZINWA combined with the electricity used to pump water are
prohibitive and discourage winter farming.
Agriculture in Zimbabwe is operating at a level that is below its potential. To encourage investment in agriculture
at this moment of the economy’s recovery, the authorities could consider exempting farmers from paying for raw
water where the farmers have constructed and maintain their dams. Farmers have little or no access to finance,
where it is available it is very expensive and is not structured to fund agricultural activities, levying ZINWA
charges is a burden in the circumstance discouraging use of land in winter.
It was also noted that the pricing models in use are not sensitive to water intensive industries. The Cold Storage
Commission based in Bulawayo has an abattoir that is based in the industrial district of Bulawayo. Bulawayo
usually experiences water shortages, which necessitates rationing and raising penalties for use in excess of
allocation. The nature of operation of the Cold Storage Commission requires a lot of water and for many years has
been under allocated resulting in the company incurring high water bills. The penalties assessed result in a very
high effective tariff of water. It is thus recommended that local authorities review tariffs for industries where
water is a critical input.
Table 19: Raw Water Charges
Sector ZINWA (US$) per 1 million liters
Industrial 9.45
Commercial 9.45
Local Authorities 6.00
A1 Farmers 5.00
Commercial Farmers 6.82
Communal 4.50 Source: ZINWA
15 It was noted that drilling of boreholes has an effect on the water table hence the charge by ZINWA to regulate the use of water and
avoid the depletion of this precious resource.
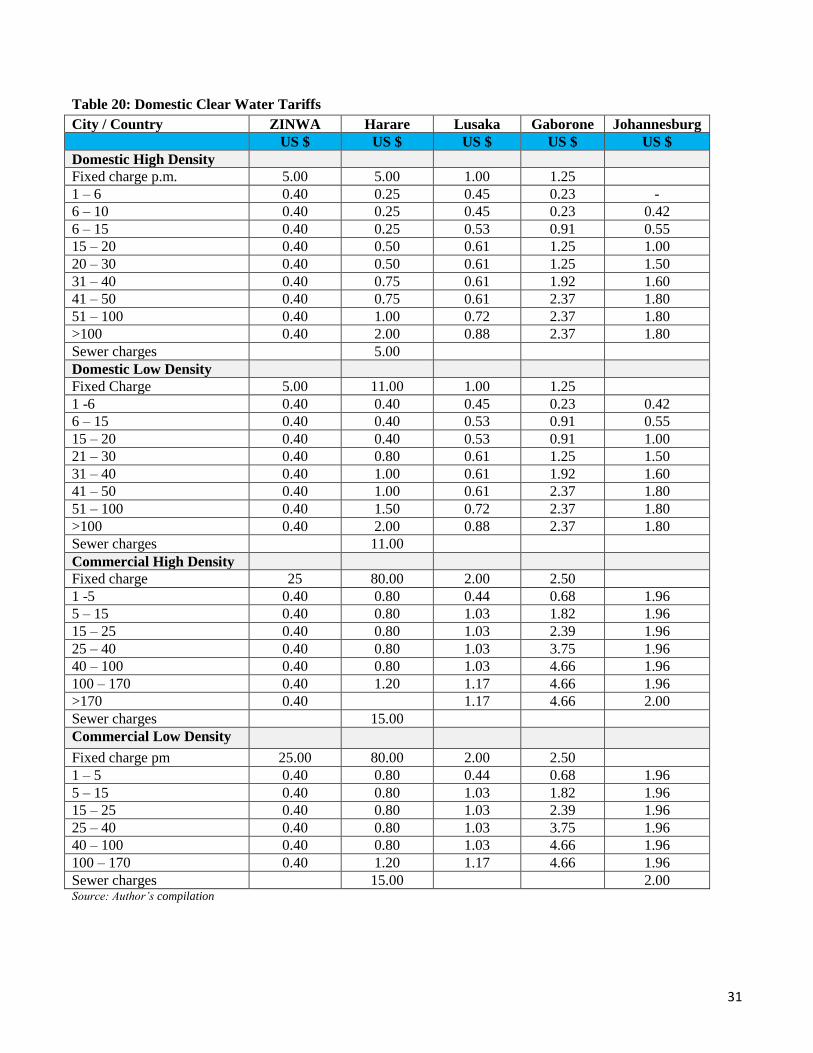
31
Table 20: Domestic Clear Water Tariffs
City / Country ZINWA Harare Lusaka Gaborone Johannesburg
US $ US $ US $ US $ US $
Domestic High Density
Fixed charge p.m. 5.00 5.00 1.00 1.25
1 – 6 0.40 0.25 0.45 0.23 -
6 – 10 0.40 0.25 0.45 0.23 0.42
6 – 15 0.40 0.25 0.53 0.91 0.55
15 – 20 0.40 0.50 0.61 1.25 1.00
20 – 30 0.40 0.50 0.61 1.25 1.50
31 – 40 0.40 0.75 0.61 1.92 1.60
41 – 50 0.40 0.75 0.61 2.37 1.80
51 – 100 0.40 1.00 0.72 2.37 1.80
>100 0.40 2.00 0.88 2.37 1.80
Sewer charges 5.00
Domestic Low Density
Fixed Charge 5.00 11.00 1.00 1.25
1 -6 0.40 0.40 0.45 0.23 0.42
6 – 15 0.40 0.40 0.53 0.91 0.55
15 – 20 0.40 0.40 0.53 0.91 1.00
21 – 30 0.40 0.80 0.61 1.25 1.50
31 – 40 0.40 1.00 0.61 1.92 1.60
41 – 50 0.40 1.00 0.61 2.37 1.80
51 – 100 0.40 1.50 0.72 2.37 1.80
>100 0.40 2.00 0.88 2.37 1.80
Sewer charges 11.00
Commercial High Density
Fixed charge 25 80.00 2.00 2.50
1 -5 0.40 0.80 0.44 0.68 1.96
5 – 15 0.40 0.80 1.03 1.82 1.96
15 – 25 0.40 0.80 1.03 2.39 1.96
25 – 40 0.40 0.80 1.03 3.75 1.96
40 – 100 0.40 0.80 1.03 4.66 1.96
100 – 170 0.40 1.20 1.17 4.66 1.96
>170 0.40 1.17 4.66 2.00
Sewer charges 15.00
Commercial Low Density
Fixed charge pm 25.00 80.00 2.00 2.50
1 – 5 0.40 0.80 0.44 0.68 1.96
5 – 15 0.40 0.80 1.03 1.82 1.96
15 – 25 0.40 0.80 1.03 2.39 1.96
25 – 40 0.40 0.80 1.03 3.75 1.96
40 – 100 0.40 0.80 1.03 4.66 1.96
100 – 170 0.40 1.20 1.17 4.66 1.96
Sewer charges 15.00 2.00 Source: Author’s compilation
32
Table 21: Industrial Consumers
City / Country ZINWA Harare Lusaka Gaborone Johannesburg
Fixed Charge 25.00 80.00 2.00 2.50
1 – 5 0.80 0.80 0.44 0.68 1.96
5 – 15 0.80 0.80 0.44 1.82 1.96
15 – 25 0.80 0.80 0.44 2.39 1.96
25 – 40 0.80 0.80 1.03 3.75 1.96
40 – 100 0.80 080 1.03 4.66 1.96
100 – 170 0.80 1.20 1.03 4.66 1.96
170 – 200 0.80 1.20 1.17 4.66 1.96
>200 0.80 1.20 1.17 4.66 2.00
Sources: ZINWA; Harare City Council; Botswana – Water utilities Authority: Zambia
D. Finance
The financial sector is the engine that puts in motion productive and economic activities ranging from basic
means of payment for monetary transactions, to complex schemes for financing investment and trade. Although
declining, the cost of money in Zimbabwe is still extremely expensive when compared to regional levels. The
average lending rate stood at 28% in 2013, which is nearly double the level observed in Mozambique (15.3%, the
second highest in the regional sample) and slightly more than 3 times the levels observed in South Africa where
the average lending rate stood at 8.5% (Table 24).
These high lending rates are reflecting the combined effect of several factors, but “paramount among them is
widespread perceived country risk and limited investor confidence”16 which is constraining the ability of the
financial system to mobilize savings to be used for investment. About 90% of deposits are short-term, resulting in
a mismatch with longer-term investment needs.17For a gauge of both domestic and international investors
perceived country risk, one only needs to look at Zimbabwe’s low and deteriorating ranks in international indexes
such as World Economic Forum (WEF) Global Competitiveness Index (GCI) (where the country ranked 131st out
of 148 economies in the former), and the World Bank Ease of Doing Business (170th out of 189), just to cite a
couple of the most influential ones.
With the average lending rate projected to run at 22% in 201418, and domestic institutional depositors such as the
pension funds requiring at least a 7% return for deposits longer than 3 months, the intermediation costs in
Zimbabwe are estimated to be about 15%, which are huge in comparison to the regional averages (see Table 22,
below)19. The gap by this measure is even larger, as the intermediation costs are 5 times the level of Zambia and
South Africa, where the intermediation process is more efficient, and about twice as large as in Botswana and
Mozambique.
Besides risk, there is evidence of other factors causing high interest rates. One is the rising cost of non-performing
loans, which stood at 12.6% in 201220, increasing to 15.9% at the end of the last quarter 201321. Another issue is
16 Piorela, Newfarmer et.al (2014), p. 14 17IDA, IFC, MIGA (2013), p. 11 18 The Economist Intelligence Unit Forecast, Country Report April 2014. 19 Average deposit rates for Zimbabwe were not publicly available. Zimstat latest report indicates a range of 3 to 8% on deposits longer
than 3 months. 20Pifaretti (2012), p. 42-43
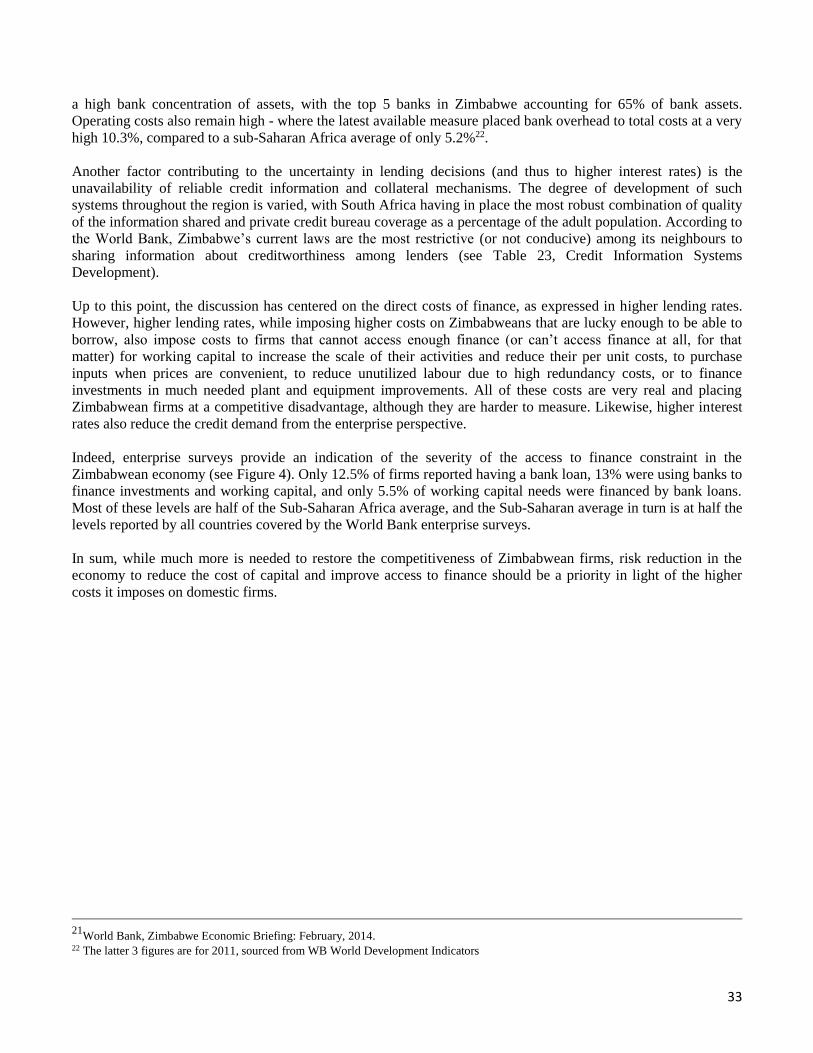
33
a high bank concentration of assets, with the top 5 banks in Zimbabwe accounting for 65% of bank assets.
Operating costs also remain high - where the latest available measure placed bank overhead to total costs at a very
high 10.3%, compared to a sub-Saharan Africa average of only 5.2%22.
Another factor contributing to the uncertainty in lending decisions (and thus to higher interest rates) is the
unavailability of reliable credit information and collateral mechanisms. The degree of development of such
systems throughout the region is varied, with South Africa having in place the most robust combination of quality
of the information shared and private credit bureau coverage as a percentage of the adult population. According to
the World Bank, Zimbabwe’s current laws are the most restrictive (or not conducive) among its neighbours to
sharing information about creditworthiness among lenders (see Table 23, Credit Information Systems
Development).
Up to this point, the discussion has centered on the direct costs of finance, as expressed in higher lending rates.
However, higher lending rates, while imposing higher costs on Zimbabweans that are lucky enough to be able to
borrow, also impose costs to firms that cannot access enough finance (or can’t access finance at all, for that
matter) for working capital to increase the scale of their activities and reduce their per unit costs, to purchase
inputs when prices are convenient, to reduce unutilized labour due to high redundancy costs, or to finance
investments in much needed plant and equipment improvements. All of these costs are very real and placing
Zimbabwean firms at a competitive disadvantage, although they are harder to measure. Likewise, higher interest
rates also reduce the credit demand from the enterprise perspective.
Indeed, enterprise surveys provide an indication of the severity of the access to finance constraint in the
Zimbabwean economy (see Figure 4). Only 12.5% of firms reported having a bank loan, 13% were using banks to
finance investments and working capital, and only 5.5% of working capital needs were financed by bank loans.
Most of these levels are half of the Sub-Saharan Africa average, and the Sub-Saharan average in turn is at half the
levels reported by all countries covered by the World Bank enterprise surveys.
In sum, while much more is needed to restore the competitiveness of Zimbabwean firms, risk reduction in the
economy to reduce the cost of capital and improve access to finance should be a priority in light of the higher
costs it imposes on domestic firms.
21
World Bank, Zimbabwe Economic Briefing: February, 2014. 22 The latter 3 figures are for 2011, sourced from WB World Development Indicators
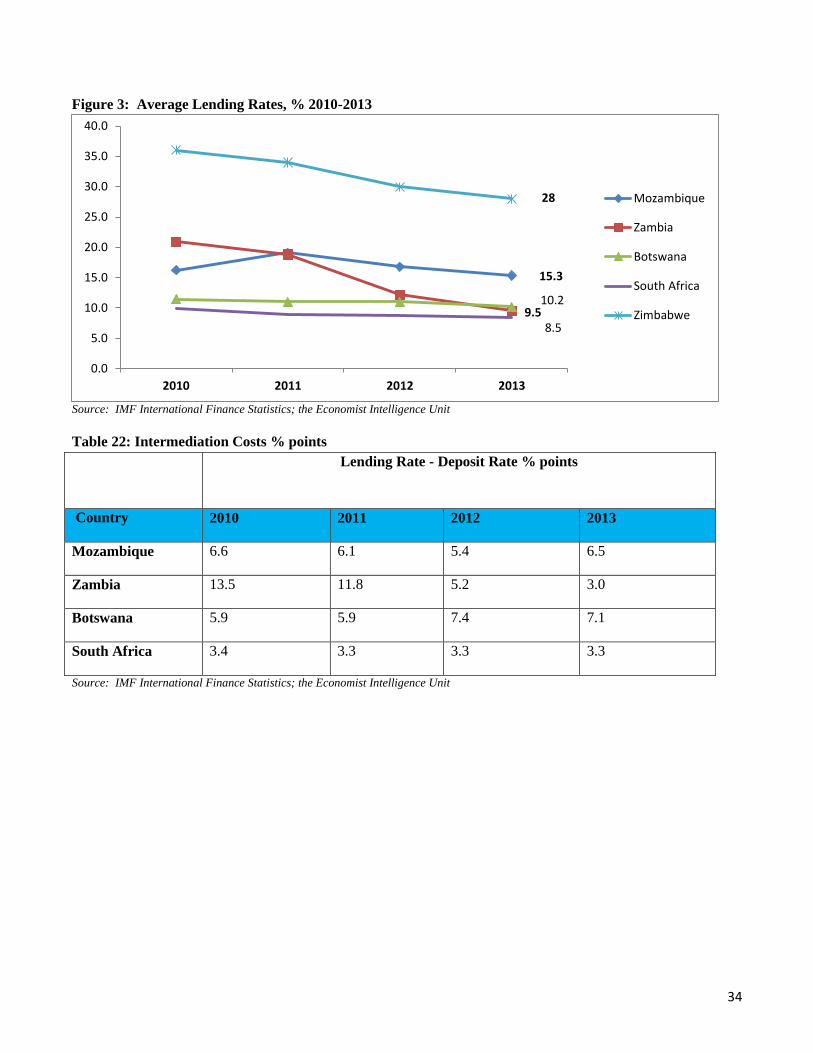
34
Figure 3: Average Lending Rates, % 2010-2013
Source: IMF International Finance Statistics; the Economist Intelligence Unit
Table 22: Intermediation Costs % points
Lending Rate - Deposit Rate % points
Country 2010 2011 2012 2013
Mozambique 6.6 6.1 5.4 6.5
Zambia 13.5 11.8 5.2 3.0
Botswana 5.9 5.9 7.4 7.1
South Africa 3.4 3.3 3.3 3.3
Source: IMF International Finance Statistics; the Economist Intelligence Unit
15.3
9.510.2
8.5
28
0.0
5.0
10.0
15.0
20.0
25.0
30.0
35.0
40.0
2010 2011 2012 2013
Mozambique
Zambia
Botswana
South Africa
Zimbabwe
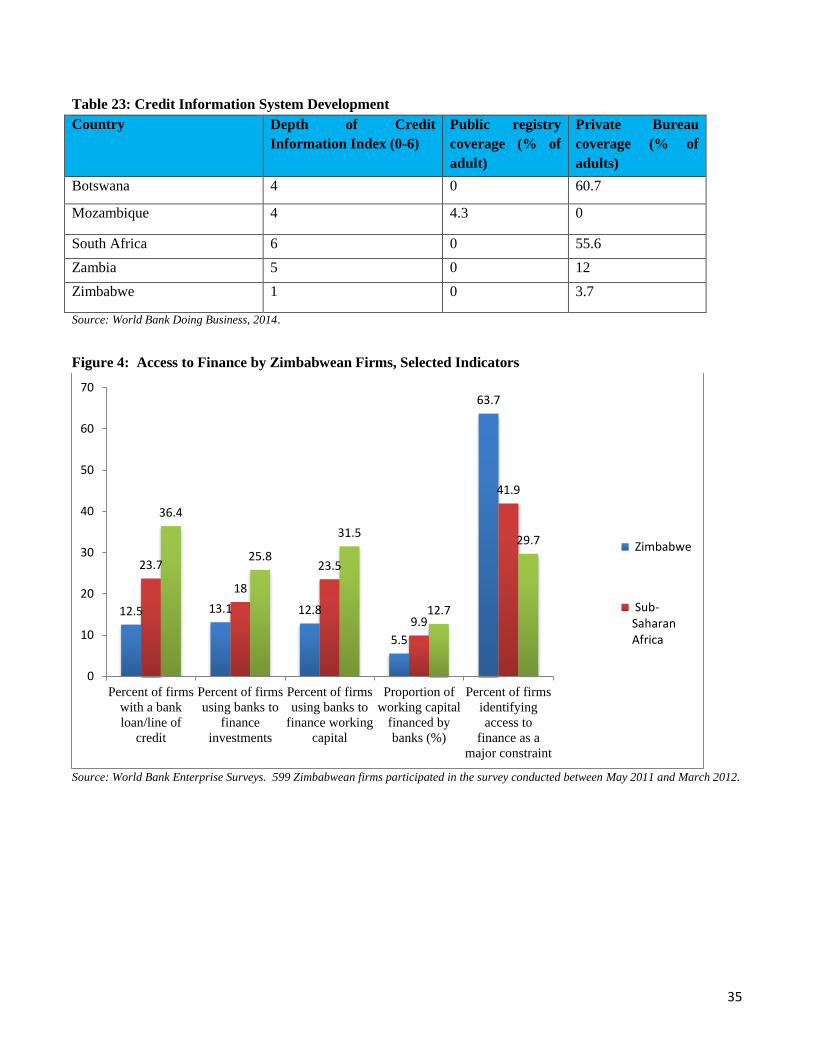
35
Table 23: Credit Information System Development
Country Depth of Credit
Information Index (0-6)
Public registry
coverage (% of
adult)
Private Bureau
coverage (% of
adults)
Botswana 4 0 60.7
Mozambique 4 4.3 0
South Africa 6 0 55.6
Zambia 5 0 12
Zimbabwe 1 0 3.7
Source: World Bank Doing Business, 2014.
Figure 4: Access to Finance by Zimbabwean Firms, Selected Indicators
Source: World Bank Enterprise Surveys. 599 Zimbabwean firms participated in the survey conducted between May 2011 and March 2012.
12.5 13.1 12.8
5.5
63.7
23.7
18
23.5
9.9
41.9
36.4
25.8
31.5
12.7
29.7
0
10
20
30
40
50
60
70
Percent of firms
with a bank
loan/line of
credit
Percent of firms
using banks to
finance
investments
Percent of firms
using banks to
finance working
capital
Proportion of
working capital
financed by
banks (%)
Percent of firms
identifying
access to
finance as a
major constraint
Zimbabwe
Sub-SaharanAfrica
36
E. Transportation and Trade Logistics
A critical dimension of competitiveness is the ability of businesses to access imported inputs easily at competitive
prices. In addition to tariffs and other trade taxes (discussed in the section below), complex procedures, permits
and other charges all serve to increase the cost of inputs. Moreover, if businesses are not able to procure inputs at
short notice, businesses inventory costs rise and opportunities to purchase at favourable prices are missed.
While all businesses are subject to logistical costs, the incremental costs Zimbabwean firms pay relative to their
neighbours, particularly on imports, represent a very significant competitive disadvantage (See Table 24).
According to the World Bank, the costs of shipping for exports a 20 foot container from a warehouse outside
Harare to Durban (the most frequently used port by all the countries compared) is US $3,765. That figure is
between 20-25% higher than the also land-locked Botswana and Zambia, and the gap is much larger with South
Africa.
When shipping imports from Durban to the respective business capitals, the gap is even wider. At US $5,660 per
container, Zimbabwe costs are roughly 36% higher when compared to its land-locked neighbours. Expressed as
percentage of freight value, Zimbabwean businesses can expect to pay 18.8% to export, and 28.8% of freight
value when importing. These comparative figures place Zimbabwean businesses at 3-5 percentage point
disadvantage visa vis Botswana and Zambia when exporting, and more than 10 percentage points when importing.
When compared to South Africa, the costs of exporting are nearly double and three times those of importing, all
of which highlights the need to take action to help reduce this wide gap.
The costs mentioned above are based on freight moving from each business capital (Harare, Gaborone, Lusaka,
and Johannesburg) to the most frequently used port (Durban), and cover documents preparation, customs
clearance and control, port and terminal handling, and in-land transportation. The latter is the largest component
of the four. But the distances to Durban are different from each business capital. A closer inspection of the inland
transportation costs, though, reveal that on a per tonne kilometre basis (considering the different distances
involved from the business capitals to Durban), Zimbabwe’s transport rates are almost on par with those of South
Africa, and significantly less costly than Botswana, but still 70% higher than in Zambia when considering export
bound freight (see Table 25). However, when considering import-bound freight, at 0.26 US cents per tonne km,
Zimbabwe inland transportation costs on a per tonne km basis are almost on par with Botswana’s, 30% higher
than in South Africa (0.18 cents) and more than double Zambia’s costs (0.12 cents). So, even when controlling for
distance, transport costs in Zimbabwe are significantly higher when compared regionally.
Rail freight is about 40% cheaper relative to road transport (see Table 26); however, unpredictable delivery times
and the poor maintenance of the network restrict its use to high-volume low value items that are not time-
sensitive. “Estimations are that only 10% of goods are transported by rail. Rail freight has dropped from 14.3
million tons in 1990 to less than 3 million tons in 2009”23.
Poor road infrastructure is part of the higher transport costs. Of the country’s total road network of nearly 90,000
kilometres, the proportion of those considered to be in fair to good condition has declined from 73% in 1995 to
only 60% in 2011, according to the African Development Bank. In turn, the poor state of the roads makes it
dangerous to travel by night. According to stakeholders in the freight forwarding industry, the charges per day of
delay range from US$250-US$500.
Reportedly, there are also limits on competition and foreign ownership which may be contributing. “Road
shipping services are one of the sectors expressly reserved by domestic investors, and Zimbabwe’s Investment
Authority limits foreign ownership to 35% in reserved sectors, although exceptions can be granted.”24
23 Pierola and Newfarmer, 2014. p.80 24Ibid, p.78
37
Additionally, although Zimbabwe Transporter’s Association reports having more than 100 owners owning about
4,000 trucks, the industry is dominated by five large firms who then subcontract individual operators.
Likewise, according to stakeholders consulted, transport companies pay additional fees when transiting within
Zimbabwe, including excessive roadblocks and tolls, and police fines (regarded by stakeholders to be more of
revenue raising activity). The impact of road blocks and unmeasured implicit costs can be understood from the
reality that a truck travelling from Harare to Bulawayo, a distance of 430 kilometres, can expect to be stopped at a
minimum of at least15 road blocks. For each road block a truck may stop for 10 minutes. The total time on a
return trip would be 300 minutes of stoppage time. It is estimated that there are 4 000 active local trucks, this
sums to 1.2 million minutes (20 000 hours) per trip for all trucks. This is an immense cost of idle time
contributing to under - utilization of assets in the economy. Trucks use more diesel on low gears, therefore they
consume more diesel to prepare to stop and start. The economy cannot afford this high degree of waste as the
cumulative effect of this waste is an enormous cost. The result is reduced economic activity and scale at which
truckers are operating.
Beyond transport, importing and exporting in Zimbabwe is subject to red tape, excessive and opaque processes,
frequent solicitation of informal payments, and importantly, multiple physical inspections which are negatively
impacting the costs of trading.
In this regard, it is useful to examine the time costs associated with importing and exporting (Figures 5 and 6). In
Zimbabwe, the most time consuming activity is preparing documents. Time to prepare documents consume 33 out
of the 53 days required for exports and 42 out of the 71 for imports. This points to lack of transparency, easiness,
and overregulation of international trade.
Previous studies reported that practically “all agricultural commodities and inputs as well as medicines imported
or exported from Zimbabwe are subject to specific licensing requirements, with many of them requiring multiple
licenses” (sometimes from different departments in the same ministry). “All traders are issued with non-
transferable and quantity bound permits valid for 3 months and limited to 30 months.”25
It is worth highlighting that stakeholders in the fertilizer sector reported that the process of obtaining an export
license was not only lengthy and costly, but the lack of predictability in obtaining it severely limited their ability
to compete as their credibility with international buyers was diminished. So the costs go beyond those of
complying with onerous regulation .Diminished exports and sales contribute to less capacity utilization, adding to
their ability to compete in domestic markets as well.
Moreover, logistics professionals operating in Zimbabwe reported in an international survey that they typically
deal with 10 different government agencies in the clearance process, and that nearly 14% of their import
shipments are subject to physical inspection and about 42% to multiple physical inspections (Table 27). By
way of comparison, professionals in South Africa and Zambia typically deal with only 2 to 5 agencies, and only
8% of their shipments are subject to physical inspection (with an even lower percentage subject to multiple
inspection). Likewise, about half of respondents in Zimbabwe reported that they often find solicitation of informal
payments in the clearance process, and none of them thought that clearing customs was a transparent process.
Two factors appear to be compounding the problems. According to interviews with freight forwarding
professionals, the information publicly available on import and export requirements is fragmented. They are of the
view that it should be made in a format that the public can easily consume. They also reported that there are
frequent errors delaying the customs clearing process due to custom broker incompetence in preparing required
documentation. They expressed the need to create standards and a license at the individual practitioner level.
25 Fernandes and Kirk, 2014, p. 28

38
Table 24: Costs and Time to Trade
Country Cost to
export
(US$ per
container)
Cost to
import
(US$ per
container)
Import to
Export
Costs
Ratio*
Time to
export
(days)
Time to
import
(days)
Cost to
Export as a
% Freight
Value*
Cost to
Import as
a % of
Freight
Value*
Botswana 3,045 3,610 1.19 27 35 15.2% 18.1%
South Africa 1,705 1,980 1.16 16 21 8.5% 9.9%
Zambia 2,765 3,560 1.29 44 49 13.8% 17.8%
Zimbabwe 3,765 5,660 1.50 53 71 18.8% 28.3%
S.S. Africa 2,108 2,793 1.32 31 38 10.5% 14.0%
Source: *Author’s calculations, World Bank Doing Business, 2014. The costs measure the charges for ocean transport levied on a 20-foot
container in U.S. dollars weighing 10 tons, valued at US$20,000 .
Table 25: Costs to Trade on US$ per tonne/km basis
COST TO EXPORT (US$)
Details S. Africa Zimbabwe Zambia Botswana
Inland transportation and
handling
1,000 3,000 2,100 2,500
Transportation Charge per Ton 100 300 210 250
Km. Business Capital to Durban 557 1760 2126 915
US$ per tonne/km 0.18 0.17 0.10 0.27
COST TO IMPORT (US$)
S. Africa Zimbabwe Zambia Botswana
Inland transportation and
handling
1,000 4,500 2,500 2,600
Charge per Ton 100 450 250 260
Km. Business Capital to Durban 557 1760 2126 915
US$ per tonne/km 0.18 0.26 0.12 0.28
Source: *Author’s calculations, World Bank Doing Business, 2014. Cost measures the charges levied on a 20-foot container in U.S. dollars
weighing 10 tons, valued at US$20,000 . Business Capital to Durban distance provided by Zimbabwe Transport Association based on
figures reported by FESARTA.

39
Table 26: Regional Rail Rates
Railway Companies US Cents/Tonne/KM
National Railways of Zimbabwe (NRZ) 0.08
Zambia Railways (ZR) 0.15
Beitbridge-Bulawayo Railway (BBR) 0.11
Botswana Railways (Morupule-Zim) 0.08
CFM Mozambique 0.07
Source: Interviews with NRZ management. Non freight weighted rates. Botswana Railways rate is based on coal, while BBR offers a flat
rate regardless of commodity.
Figure 5: Time to Export
Source: World Bank Doing Business, 2014.
Figure 6: Time to Import
Source: World Bank Doing Business, 2014.
8
3327
112
4
4
34
4
4
42
12
9
9
0
10
20
30
40
50
60
S. Africa Zimbabwe Zambia Botswana
Inland transportationand handling
Ports and terminalhandling
Customs clearance andtechnical control
Documentspreparation
7
42
21152
6
6
39
9
9
93
14
13
8
0
10
20
30
40
50
60
70
80
S. Africa Zimbabwe Zambia Botswana
Inland transportationand handling
Ports and terminalhandling
Customs clearanceand technical control
Documentspreparation

40
Table 27: Customs Clearance, Selected Indicators
ZIMBABWE S. AFRICA ZAMBIA
Number of agencies – exports 10 2 5
Number of agencies – imports 10 2 5
Physical inspection (% of import shipments) 13.69% 8.64% 8.89%
Multiple inspection (% of import shipments) 41.83% 2.10% 1%
Solicitation of Informal Payments (% of responses
saying nearly always or often)
50% 7.14% 0%
Transparency of Customs Clearance (% of responses
answering nearly always or often)
0% 42.90% 66.70%
Source: Logistics Performance Index (LPI), 2014.
F. Tariffs and Trade Taxes
High levels of tariffs, duties, and other taxes hurt the competitiveness of firms by raising the costs of accessing
imported inputs. Empirical research at the firm level has found that the propensity of a firm to import some of its
inputs is much higher if the firm exports some of its products, than if the firm sells all of its output in the domestic
market.26 In landlocked countries such as Zimbabwe, where transportation costs need to account for longer
distances, the tariff compounds with what is already a disadvantage in procuring inputs competitively. To the
extent that tariffs are higher than those of the regional competitors, the lower tariffs would confer to them an
advantage over Zimbabwean producers, reducing the ability of all domestic firms to compete both in export and
domestic markets, but even more so to firms that do export.
Zimbabwe operates multiple tariff schedules, a Most Favoured Nation (MFN) rate extended to all World Trade
Organisation (WTO) members, along with tariff rates under preferential trade agreements such as the Common
Market for Eastern and Southern Africa (COMESA), SADC, and bilateral trade agreements with South Africa,
Botswana, Malawi, Mozambique and Namibia.
The National Trade Policy 2012-2016 regards tariffs as a policy tool for encouraging domestic production and
diversification. Moreover, according to Annual Reports of the Competition and Tariff Commission, tariffs and
other border barriers appear to be motivated by a concern to protect local industry, encourage infant industries,
stimulate exporting and regional integration, and to favour economic activities that have broad social impact and
or have the potential to become competitive. In this context, it is worth highlighting that “on December 2011 an
import surtax of 25% was introduced for a range of products for which Zimbabwe has import-competing
industries that were experiencing strong competition from imports” (103 in total). The surtax, at least as expressed
in policy instruments, is to be applied on an MFN basis, and is to be applied to all countries including COMESA
and SADC members.27
In this context, the policy objectives were empirically validated by recent analysis conducted by the World
Bank28, which noted wide-tariff disparities within and between broad economic sectors, which are indicative of
the intent to use tariffs to promote import-substituting activities.
The nature and complexity of the tariff regime, as well as data limitations pose challenges to benchmarking
accurately tariff levels with the neighbouring countries. The presence of purely specific duties or excise duties, as
26 Fernandes and Kirk, 2014. “Creating Incentives for New Dynamism in Zimbabwe’s Merchandise Exports: The Role of Trade and
Industrial Policies”, p. 24 27 Fernandes and Kirk, 2014. Op. Cit., p.5 28 Fernandes and Kirk, 2014, Op. Cit.

41
well as the surtax restricts in some cases the construction of ad-valorem equivalents. Likewise, in standard
international databases data for Zimbabwe is missing, possibly due to reporting anomalies, which is why
Zimbabwe is not included in Table 28, below.
Within these limitations, though, the cited World Bank analysis added the surtax to calculate average tariffs. At
the HS-digit level, for 2012, the authors report an MFN simple average tariff rate of 15.4% and an MFN weighted
tariff mean of 16.7%. The number of product lines with tariffs above peak levels (15%) is reported at 30.4%.
In all of these three measures, Zimbabwean tariff levels (without exception) are imposing higher costs on its
enterprises (Table 28, below). Zimbabwe’s MFN simple average tariff is 6 %higher than the average level in
Botswana, South Africa and Zambia (about 63% higher). The gap widens when considering the MFN weighted
mean tariff, which at 16.4% is twice as high as the average of the three countries (8.2%).
In sum, tariff policy in Zimbabwe is significantly placing producers, exporters, and perhaps would-be exporters at
a competitive disadvantage. This disadvantage can be, of course, reduced or eliminated by removing the surtax
and reducing tariff levels at least to those observed in the neighbouring countries. Doing so might require, though,
a policy shift where other tools are used instead of tariffs to promote industrial development.
Table 28: Import Tariffs 2012
Botswana S. Africa Zambia Average
Binding coverage, all products (%) 91.6 91.6 11.4 64.8
Share of tariff lines with international peaks, all products (%) 18.3 18.5 21.8 19.6
Share of tariff lines with specific rates, all products (%) 1.2 1.7 0.0 1.0
Tariff rate, applied, simple mean, all products (%) 7.6 7.1 9.8 8.2
Tariff rate, applied, weighted mean, all products (%) 6.4 4.2 4.1 4.9
Tariff rate, MFN, simple mean, all products (%) 7.5 7.5 13.1 9.4
Tariff rate, MFN, weighted mean, all products (%) 7.6 5.7 11.4 8.2
Source: World Bank World Development Indicators
G. Taxation
Benchmarking taxation across countries from the perspective of its costs to a private business is a challenging
exercise, as the analytical effort needs to go beyond statutory rates and consider the basis of their application,
allowable deductions and exemptions, among many other aspects of the prevailing tax regime in each country.
One comparable indicator is the Total Tax Rate compiled by the World Bank Doing Business unit, which
measures the taxes and mandatory contributions that a medium-size company flowerpot manufacturer must pay in
a given year. All taxes and contributions that are government mandated applicable to the standardized business
that impact its financial statements are included, after accounting for allowable deductions and exemptions, and
they are expressed as percentage of commercial profit, before any tax is deducted.
By this measure, Zimbabwe’s tax regime is more costly and disadvantaging local businesses in relation to its
regional competitors, with Mozambique being an exception. The Zimbabwe-based medium-size business can
expect to pay 35.3% of its commercial profit, which is about 5 % higher than what a similar company would pay
in South Africa (30.1%), twice as much as what would be expected for a similar company in Zambia (15.1%), and
about 10 % higher than in Botswana (25.4%) (Table 29 and Figure 7). In Mozambique, the total tax rate adds up
to 37.5% due to the higher impact of income tax.
42
While the impact of labour and income taxes in the total tax rate appears to be more or less in line with the
regional levels, property taxes (which account for 8.1 % of the 9.4 % that “other taxes” contribute to the total tax
rate of 35.3%) appear to have a disproportionate impact in taxation levels in the country. Taxes other than income
and labour only account from 2.1 to 4.2 % of the total tax rate in the neighbouring countries.
In Zimbabwe, property taxes are contributing slightly less than one-fourth of the total taxation rate as measured
by the World Bank. The rates vary per property type and location, and they are assessed against the value of the
property. Stakeholders consulted indicated that such a high impact of property taxes might be stemming from
property values that are outdated and do not reflect market values. This is an area that should be looked at in more
depth.
However, taxation extends well beyond what the Doing Business unit considers in its indicators. The standard
business case does not participate in foreign trade (no import or export) and does not handle products subject to
special tax regimes, including excise, environmental, licensing, and many other forms of taxation that are better
benchmarked at the industry sub-sector level and thus fall beyond the scope of this study.
Nevertheless, other recent studies have looked at these issues and some of their findings are worth citing here.
The USAID-funded ZIM ACP Project assessed the cost of compliance with regulations in the livestock and
poultry sectors.29In the case of beef, their results show that various levies (including an 11.625% levy to be
assessed on the value of all cattle sold) recently enacted by Regional District Councils (RDCs), registration of
abattoirs with multiple agencies (Veterinary Public Health, Agricultural Marketing Authority, and Environmental
Management Agency (EMA), meat inspection charges, and effluent disposal under EMA regulations, amount to a
projected US$112 per animal sold, which is calculated to lead to loses (when fixed costs are included) of between
US$7 - US$17 per head.
In this particular case, the total projected cost of all government mandated payments amount to 16% of total costs,
and therefore are high on an absolute level as well as on a comparative regional basis. According to the
benchmarks presented in the report, livestock buyer fees in Zimbabwe are between 20-50 times those applicable
in Botswana, the regulatory costs in Zambia amount to only $4.72 per head, and in South Africa marketing levies
are less than US$1 . The regulatory costs of the other subsectors are also high in relation to neighbouring
countries and have a significant impact in their competitiveness.
A particular set of regulations that were deemed very onerous by most (if not all) private sector stakeholders
consulted were those stemming from the Ministry of Environment, Water and Climate and the EMA Act. “The
latter provides for the sustainable management of natural resources and protection of the environment, the
prevention of pollution and environment degradation and the establishment of the EMA among others. The main
subsidiary regulations issued in terms of the Act are Environment Management (Effluent and Solid Waste
Disposal) Regulations of 2007, Environmental Impact Assessment and Ecosystems Protection Regulations, Air
Pollution Control Regulations and Environmental Management (Hazardous Substances, Pesticides, and other
Toxic Substances) Regulations.”30
Stakeholders across industry sectors identified several problems with these regulations. First, they cited that the
environmental standards were set at a very high level for a country of Zimbabwe’s level of development.
Secondly, there was no reasonable period given to comply with them, with the main interest being the collection
of unreasonably high fines as opposed to providing guidance and incentives to comply with the regulations. A few
29 For further details please see Chamboko, Tafireyi and Erasmos, Jaco. 2013. “ Analysis of Cost Compliance with Regulations in the
Livestock and Poultry Sectors”, Zimbabwe Agricultural Competitiveness Program, USAID
30Chamboko, Tafireyi and Erasmos, Jaco. 2013, Op. cit., p.34

43
stakeholders also mentioned lack of transparency and information availability about the regulations and how to
comply with them.
Consistent with these views, the study conducted by the ZIM ACP project indicated that the majority of livestock
and producers are not complying with the regulations because of lack of awareness and knowledge about them.
Additionally, while their analysis showed that compliance with the regulations (specifically, the effluent and solid
waste disposal regulations) meant a significant, though variable impact in profitability for all subsectors, but most
dramatic for small scale farmers in poultry production, with potential to reduce the profitability of egg production
by 42% per tray.
Another instance in which EMA regulations appear to be onerous, and are deterring foreign and domestic
investment, is the 5% up-front cost for an environmental compliance certificate that is assessed on the value of
any green field investment project. This results in a prohibitive cost, particularly for large investments, for a
service that according to interviewed stakeholders, can cost only US$50,000 in South Africa.
The multiplicity of fees, licenses, excise taxes, regulatory charges, permits, and other levies, such as the ones
described above, and that have such large impacts on the profitability of enterprises, constitutes evidence pointing
to the need of reforming existing regulations and introducing the principles of regulatory quality across
government agencies. The main element of such quality is to consult those affected and assess the impact before
enacting new regulation.
Table 29: Total Tax Rate, % of Profit
Botswana Mozambique
South
Africa Zambia Zimbabwe
Sub-
Saharan
Africa
Profit tax (%) 21.7 30.9 21.9 1.2 20.8 18.4
Labor tax and contributions (%) 0 4.5 4.1 10.4 5.1 13.7
Other taxes (%) 3.6 2.1 4.2 3.6 9.4 21.3
Total tax rate (% profit) 25.4 37.5 30.1 15.1 35.3 53.3
Source: World Bank Doing Business, 2014. Assumes net taxes accruing to a medium-sized LLC manufacturing ceramic flowerpots.
Figure 7: Total Tax Rate, % of Profit
Source: World Bank Doing Business, 2014. Assumes taxes accruing to a medium-sized LLC in the manufacturing sector.
21.730.9
21.9
1.2
20.8 18.4
0
4.5
4.1
10.4
5.1 13.73.6
2.14.2
3.6
9.4
21.3
0
10
20
30
40
50
60
Other taxes (%)
Labor tax and contributions (%)
Profit tax (%)

44
H. Information Technology (IT)
Affordable information technology (IT) costs are critical in enabling IT-based services, such as Business
Processes Outsourcing (BPO), which have been identified as having good potential in Zimbabwe. IT also plays
across all the sectors of the economy as an element with potential to enhance productivity and transform existing
business models into more efficient and effective ones.
Zimbabwe has three mobile network service providers, namely Econet, NetOne and Telecel. There is one fixed
network operator, TelOne, which is owned by the government of Zimbabwe. There are several internet access
providers, namely Aptics, Powertel, Tel One (ADSL), Liquid Telecom (Econet controlled), Telco and Africom.
Econet has the largest infrastructure, operates as the dominant firm in the sector controlling seventy percent of the
mobile market share. Net One and Telecel share the thirty percent equally. Regulation of the sector is divided
between the Postal and Telecommunications Regulatory Authority of Zimbabwe (POTRAZ), under the Minister
of Transport and Communications; and the Broadcasting Authority of Zimbabwe (BAZ) and the Media and
Information Commission (MIC), which report to the Minister of Media, Information and Publicity. Each operator
has its own network and is responsible for national and international traffic for their network resulting in a
fragmented wholesale market. Tel One is licensed to operate the international gateway services and Econet has its
own. The smaller operators use the Tel One gateway for international services.
Given the different pricing plans, discounts, and pricing structures employed by the multiple IT service providers
in the different countries, the best way to assess the costs of IT services and compare them to Zimbabwe’s
regional competitors is to use the prices per month published by the International Telecommunications Union
(ITU) which assume a standard level of usage in the fixed-telephony, mobile-cellular (including SMS), and fixed-
broadband (see Table 30 for details of the assumptions).
On the other hand, mobile cellular telephone subscriptions have increased dramatically in Zimbabwe from 5.1 per
100 people to 91.9 over the same period. The mobile cellular usage basket was priced in Zimbabwe at US$20.6
per month. At this level, the mobile telephony looks expensive by regional standards, with the exception of South
Africa where the same basket was priced at US$32.6 in 2012. By this measure, Mozambique, Botswana and
Zambia have more affordable pricing for mobile, ranging from only US$13.0 per month in the former two, to
US$14.5 in the latter. It is worth noting that by this measure, the Sub-Saharan average of US$14.6 is nearly 30%
cheaper than in Zimbabwe.
The fixed broadband usage basket was priced at US$30 per month, which is just slightly higher than the US$28.1
priced in South Africa, but substantially lower than the other regional benchmarks, including the Sub-Saharan
average of US$46.6. However, subscriptions per 100 people reached only 0.5 in 2012, a level that is low by
absolute standards but appears in line with regional benchmarks.
The picture that emerges is that there is a need to increase access through infrastructure development in certain
segments (broad-band, fixed-telephony), and prices are relatively higher in mobile. The relatively high prices of
mobile services and the dominant position of ECONET suggest that there is no effective competition in the sector.
In the opinion of private sector stakeholders consulted, the infrastructure owned by ECONET cannot be matched
by competitors as such they cannot provide the same level of service. The regulator should investigate and
monitor any abuse of market power.
Further, Zimbabwe could introduce an interconnection policy along the lines of what is being considered in South
Africa. Vodacom and MTN are the dominant operators and to encourage competition and facilitate
interconnectivity between networks the regulator is in process of regulating the termination call rates after
concerns were raised by the public and government that the charges were too high and were benefiting the
dominant players at the expense of public interests. Termination rates are fees that operators charge each other to
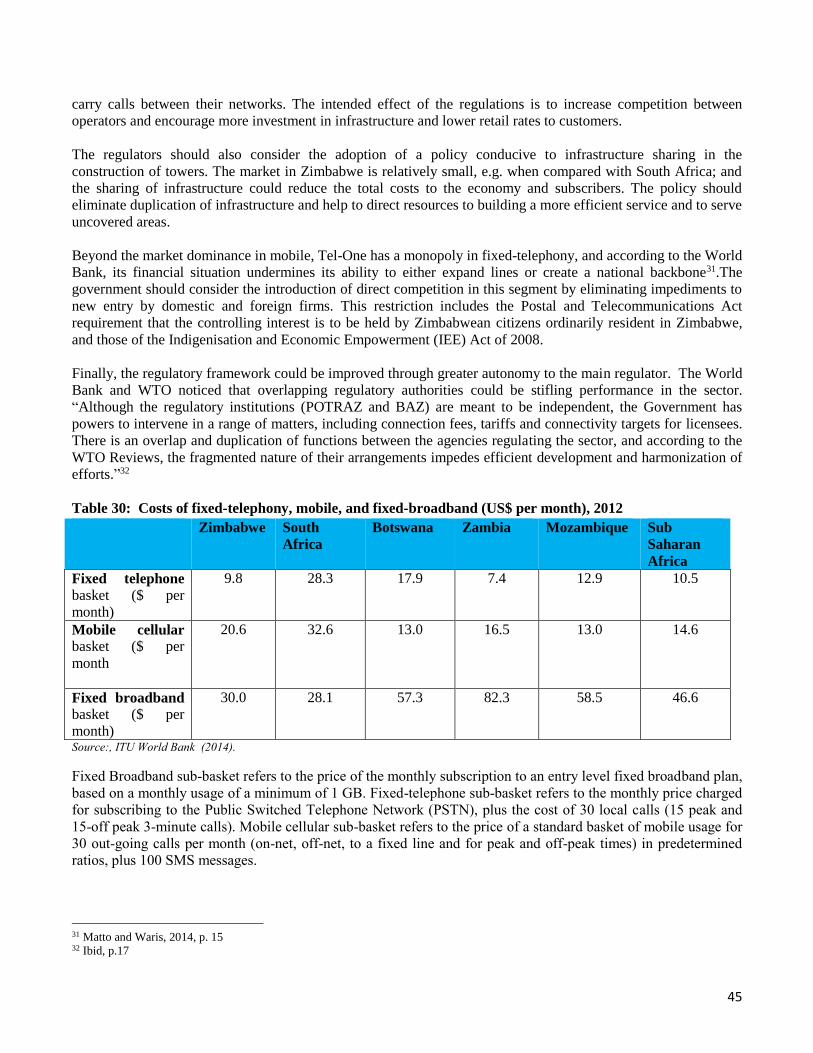
45
carry calls between their networks. The intended effect of the regulations is to increase competition between
operators and encourage more investment in infrastructure and lower retail rates to customers.
The regulators should also consider the adoption of a policy conducive to infrastructure sharing in the
construction of towers. The market in Zimbabwe is relatively small, e.g. when compared with South Africa; and
the sharing of infrastructure could reduce the total costs to the economy and subscribers. The policy should
eliminate duplication of infrastructure and help to direct resources to building a more efficient service and to serve
uncovered areas.
Beyond the market dominance in mobile, Tel-One has a monopoly in fixed-telephony, and according to the World
Bank, its financial situation undermines its ability to either expand lines or create a national backbone31.The
government should consider the introduction of direct competition in this segment by eliminating impediments to
new entry by domestic and foreign firms. This restriction includes the Postal and Telecommunications Act
requirement that the controlling interest is to be held by Zimbabwean citizens ordinarily resident in Zimbabwe,
and those of the Indigenisation and Economic Empowerment (IEE) Act of 2008.
Finally, the regulatory framework could be improved through greater autonomy to the main regulator. The World
Bank and WTO noticed that overlapping regulatory authorities could be stifling performance in the sector.
“Although the regulatory institutions (POTRAZ and BAZ) are meant to be independent, the Government has
powers to intervene in a range of matters, including connection fees, tariffs and connectivity targets for licensees.
There is an overlap and duplication of functions between the agencies regulating the sector, and according to the
WTO Reviews, the fragmented nature of their arrangements impedes efficient development and harmonization of
efforts.”32
Table 30: Costs of fixed-telephony, mobile, and fixed-broadband (US$ per month), 2012
Zimbabwe South
Africa
Botswana Zambia Mozambique Sub
Saharan
Africa
Fixed telephone
basket ($ per
month)
9.8 28.3 17.9 7.4 12.9 10.5
Mobile cellular
basket ($ per
month
20.6 32.6 13.0 16.5 13.0 14.6
Fixed broadband
basket ($ per
month)
30.0 28.1 57.3 82.3 58.5 46.6
Source:, ITU World Bank (2014).
Fixed Broadband sub-basket refers to the price of the monthly subscription to an entry level fixed broadband plan,
based on a monthly usage of a minimum of 1 GB. Fixed-telephone sub-basket refers to the monthly price charged
for subscribing to the Public Switched Telephone Network (PSTN), plus the cost of 30 local calls (15 peak and
15-off peak 3-minute calls). Mobile cellular sub-basket refers to the price of a standard basket of mobile usage for
30 out-going calls per month (on-net, off-net, to a fixed line and for peak and off-peak times) in predetermined
ratios, plus 100 SMS messages.
31 Matto and Waris, 2014, p. 15 32 Ibid, p.17

46
Table 31: Access fixed-telephony, mobile, and fixed-broadband 2005 and 2012
Subscriptions Per
100 people
Zimbabwe South Africa Botswana Zambia Mozambiqu
e
Sub-Saharan
Africa
2005 2012 2005 2012 2005 2012 2005 2012 2005 2012 2005 2012
Fixed-telephone 2.6 2.2 9.8 7.7 7.3 8 0.8 0.6 0.3 0.3 1.5 1.2
Mobile Celular 5.1 91.9 70.4 130.6 30.1 153.8 8.3 74.8 7.2 36.2 12 59.3
Fixed broadband 0.1 0.5 0.3 2.1 0.1 0.9 0 0.1 0 0.1 0 0.2
Source: ITU, World Bank (2014).
Table 32: SMS Services
Zimbabwe South
Africa
Botswana Zambia Mozambique
SMS on Net 9 7 3 5 6
SMS originating 9 7 3 5 6
SMS terminating 9 7 3 5 6
SMS originating international 22 15 6 9 17
Source :
Table 33: Voice Services (Charges in US Cents)
Zimbabwe South
Africa
Botswana Zambia Mozambique
Econet MTN Orange Airtel Vodacoom
Intra calls on net calls 23 24 15 20 13
Interconnected calls off net 25 26 19 35 13
Terminating calls international 40 51 39 56 42 Source: Interviews with Potraz management and staff
IV. CONCLUSIONS AND RECOMMENDATIONS
There is plenty of evidence ranging from its trade performance, to international organizations calculations of the
real exchange rate, to the testimony of business owners and executives that report their inability to compete
domestically and internationally, that Zimbabwe has developed a competitiveness gap. In the current context
where the confidence of economic agents would preclude the re-introduction of a national currency, the economy
needs to adjust to the realities of dollarization and the need for an “internal devaluation” that supposes a
downward adjustment in the costs businesses face in their production processes.
With the exception of water and certain IT segments (and even then, some issues are discussed in the relevant
sections) the other input factors examined have sizeable gaps in relation to regional competitors. The main factors
of production, capital (finance) and labour will impact all the other cost factors in the proportion that each activity
uses each factor, but the others examined here are critical as well for a competitive business and economic
performance.
Amid the restrictions imposed by dollarization (specifically, the inability to regain competitiveness through a
currency devaluation), the Zimbabwean economy cannot afford the restrictions that are in place in its labour,
foreign investment and international trade policies that are increasing the cost of doing business. While there are
large investment needs in rail, power, information communication technology (ICT), and road infrastructure to
47
close those cost gaps, a more open, liberalized and unrestricted economy, coupled with a more customer-centric
government that improves the quality of its regulation can go a long way in the path to achieve the needed cost
reductions to close the competitiveness gap. Indeed, as detailed throughout this report, a significant part of the
high costs are policy-inflicted.
This internal devaluation process requires coordinated actions across different government ministries and agencies
in Zimbabwe. And for reform processes to work, they need buy-in and mandates at high levels of government.
This is recognized in the recommendation to establish a Better Business Regulation Commission, as detailed in
numeral 5, below. However, in as far as they relate to cost structures and industry competitiveness, this becomes
the central business for the MIC to flag the impacts of these costs to other government structures. In many
countries, the role of advocating for a business-friendly enabling environment is also reinforced by investment
promotion agencies that become the “guardians of the business environment”.
Within this context, specific actions and policy options that MIC could advocate for reducing costs to private
enterprises are detailed below, with the possible implementer or level of government identified in parenthesis.
1) Reforms to the labour code and wage- setting practices
The study highlighted that wage increases need to be aligned with productivity for the economy to remain
competitive (particularly for dollarized economies), and the current labour code and practices create expectations
at the industry level that are then reinforced by practice elements. Large increases observed in the minimum
wages during the last five years, and particularly at the government level, point to the need to review those
mechanisms. Redundancy dismissals are lengthy, and severance payments, although not mandated expressly in
law, result in amounts three times as costly as the average of the neighbouring countries. Options for
improvement include:
Replace collective bargaining from the NEC to the company level. Such a change will take the
particular circumstances of the company (as opposed to that of a broad industry sector) into consideration
and the salary increases arrived at this way are bound to be realistic, sustainable and more in line with
productivity. A regional example of such a system is prevalent in Zambia (Ministry of Public Service,
Labor and Social Welfare, Office of the President and Cabinet: OPC). See Annex 8
Modify legislation to explicitly regulate redundancy benefits in line with or below regional levels.
This will reduce costs to the employer and position the business for improved profitability and
sustainability, which in turn will allow increased employment. A time frame for prompt resolution should
also be legislated. (Ministry of Public Service, Labour and Social Welfare, OPC)
Introduce a rapid resolution scheme to allow companies to retrench at a reasonable cost. Changing
accumulated practices may take a long time, especially when the capacity of judges and arbiters needs to
be built. Allowing companies to reduce their unutilized labour so that they can regain competitiveness is
urgent, as described in the Labour section of this report. (Ministry of Public Service, Labor and Social
Welfare, OPC)
Revision of wage-setting mechanisms of central and local government, and state owned enterprises. An approach that incorporates ability to pay, productivity and the competitiveness of the economy should
be adopted. The government’s ability to pay should be derived from the government being able to achieve
best practice ratios in respect of total employment costs to GDP, expenditure and revenue as detailed
under Table 7 to Table 9. As the largest formal employer, government wage levels have high influence in
the private sector as well as the overall fiscal balance. (Ministry of Finance; Ministry of Public Service,
Labor and Social Welfare, OPC)
2) Tariffs Reduction, Streamlining of Permits, and Trade Facilitation
48
Simplify the tariff structure, rationalize and eliminate the import surtax and reduce tariff levels at
least to regional levels. High tariff rates and a complex tariff structure are increasing the costs of
sourcing inputs (twice the levels observed in the region) and creating opportunities for corruption at the
border. The above may require a shift in policy that does not regard tariffs (and export taxes and other
restrictions in certain industries for that matter) as a policy tool for encouraging domestic production and
diversification, and the recognition that world trade is increasingly composed of intermediate products, as
well as intra-firm trade, pointing to an increased segmentation of production across borders. While value
chain integration is indeed desirable, the competitiveness of downstream production cannot be forced and
it can actually harm the competitiveness of those value chain segments that can compete. There are other
less distortive policies and incentives that can work towards this aim. High-border barriers will only result
in high local production costs. (MIC, Ministry of Finance, OPC)
Review all import and export licenses and permits with a view towards their rationalization and
elimination where prudent, and for those remaining; facilitate private sector compliance by
coordinating within departments in the same Ministry, and across ministries. Multiple import
permits and the cumbersome process of obtaining them are delaying trade unnecessarily. Likewise, export
permits are complicating sales abroad and preventing companies from reaching economies of scale that
would reduce their per unit costs. Where necessary, a strict time frame for their issuance or decline should
be legislated. The Government could adopt a policy that if no response is obtained from the government
within a reasonable time frame after a correctly filed application, the permit can be considered approved.
In 2008, half of the then 30 Organisation for Economic Cooperation and Development (OECD) member
countries used the “silence is consent” rule, which implies that licences are issued automatically if the
competent licensing office has not reacted by the end of the statutory response period. This principle can
be applicable to other regulations that create a lot of red tape for businesses as well. (Ministry of Finance,
OPC, MIC)
Deepen and expand risk-based inspections, including introduction of a trusted trader program: Logistics professionals report too many agencies (typically, 10) are dealt with at the border and a very
high percentage of their shipments are subject to multiple inspections (42%). Reportedly, Zimbabwe
Revenue Authority (ZIMRA) is applying a risk management system but the evidence shows that this is
insufficient and needs to be expanded to the other agencies responsible for border control. The
introduction of a trusted trader program, whereby expedited clearance can be provided to pre-cleared
businesses should also be considered. (Ministry of Finance, OPC)
Establish a formal dialogue between border agencies with a view towards establishing a national
single window system, including a dialogue with customs users. Improved cooperation between
government agencies is a key measure and principle for faster and more efficient customs and border
management procedures. Efforts in this regard should be ongoing, and mandated at high levels of
government with oversight of the process. With the principle of making it easier for private agents to
conduct business, government should coordinate to ensure that they never ask for the same information
twice, consolidate the information needed from the private sector in a reduced number of forms (a single
one would be the goal), and facilitate access and understanding of the required forms. At least 73
countries around the world have implemented this best practice that has been effective in reducing the
time to trade considerably. Governments have also engaged the private sector for their input and ideas on
how to make things easier.(MIC, Home Affairs, Ministry of Finance, Transport and Infrastructure, OPC)
Establish a Trade Information Portal: Like the national single-window system, publishing and making
available information for traders is a recognized practice for faster border procedures, which were
included as consensus principles in the WTO Trade Facilitation Agreement Ministerial Conference held
in Bali, Indonesia in December 2013. The need for unfragmented, “consumable” information was
49
recognized by stakeholders consulted, including logistics professionals. Such a portal could include
information on import, export procedures, download of forms, contact details for agencies, among others.
(MIC, Ministry of Home Affairs, OPC)
Creating standards and screening mechanisms at the custom broker level: Issues were reported with
custom brokers incorrectly completing the required paperwork to clear merchandise across borders,
adding to the delays in the time to trade. This could be addressed through establishing standard
qualifications and screening criteria for customs brokers. Reportedly, a mechanism exists at the company
level, but logistics professionals believe it is insufficient. (Ministry of Finance, ZIMRA, MIC, OPC)
Rationalize roadblocks: Excessive roadblocks and informal payment solicitations are compounding the
problem of inadequate road infrastructure and adding to the costs and time to trade. In the opinion of
stakeholders, their number can easily be reduced. (Ministry of Home Affairs , Transport and
Infrastructure Development, OPC)
3) Update property valuations to reflect market conditions: Property taxes appear to disproportionately
impact businesses. Of an estimated, comparatively high total tax rate of 35.3%, slightly less than a quarter is
due to property taxes. Taxes are likely being assessed on historical rather than current market values.
Updating the values to current market conditions can reduce the impact of taxation on struggling
businesses.(Ministry Local Government, Ministry of Finance, OPC)
4) Revision of Environmental Standards and EMA regulations: While a comprehensive review and
benchmark with other countries of the EMA standards, fines, and regulations was not possible within the
scope of this study, testimonials from the private sector, as well as evidence of specific regulations that result
in much higher costs of compliance and fines in Zimbabwe, point to the recommendation of conducting a
thorough review, including benchmarking with regional and other developing economies. (EMA, OPC)
5) Establishment of a Better Business Regulation Commission, a permanent unit to review the flow of new
business regulations, and introduction of regulatory quality elements (MIC, Office of the President and
Cabinet)
The Zimbabwean economy needs a comprehensive, all of government regulatory reform to repeal excessive
regulations that place a large burden on businesses. Government-wide reform processes usually include the
appointment of a credible commission mandated at high levels of government, which makes an inventory of
existing regulations that are creating a hostile business environment, identifies suitable reforms, and
introduces elements of regulatory quality in the country to ensure that the flow of new regulation adheres to
an agreed quality criteria.
Many of the tools used in this process can be of help in the Zimbabwean context. These regulatory quality
tools include subjecting existing and new regulations to an impact analysis, placing the burden of proof to
justify the need of existing regulations on the regulators (a key feature of the Guillotine approach to reform),
and establishing a system by which a permanent unit reviews new regulation against a quality criteria before it
is enacted. The type of regulations subject to reform has varied in the different countries where they have
been used: it can be broad (to include all regulations that affect businesses) or it can be narrow (for example,
restricted to business licenses). Likewise, the standards and methods of the impact analysis as well as the
quality criteria upon which to review regulation are varied. Nevertheless, they typically involve a combination
of the principles set forth by the OECD, included in Annex 1. Importantly, these include the requirement for
public consultation and assessment of costs and benefits before enacting regulation. Annex 4 includes an
overview of regulatory reform tools and approaches.

50
These regulatory quality tools are generally not mutually exclusive, and they are more effective if their
application is conceived in a framework with a medium- and long-term perspective, and integrated with
broader regulatory reform efforts, such as the establishment of a Better Business Regulation Commission.
6) Optimize power production through increased private sector participation. The effective tariff to prevent
power load shedding for Zimbabwean businesses is 14.5 US cents per kWh, compared with an average of 8.3
US cents among regional competitors. Demand exceeds available supply and 60% of power is generated from
hydro powers sources at a competitive cost, but thermal power generation is inefficient. Increased private
sector participation in thermal power operations could help correct this. Separating Kariba and using its
advantages strategically for expansions into increased hydropower generation and budget support can also be
considered (Ministry of Energy and Power Development, Ministry of Finance, MIC, Office of the President
and Cabinet)
7) Credit Information System Development: Zimbabwe’s current laws are the most restrictive among its
neighbors to sharing information about creditworthiness among lenders. The Bankers Association reported
that there is a general agreement among banks to share their credit information, which in other countries has
proven to be an obstacle to the critical free flow of credit information needed to develop the system, and that
legislation is being developed. The framework should ensure that positive and negative information from all
credit providers flows freely to be incorporated in the credit reports, that measures are in place to correct
errors, and that the information is adequately safeguarded. The development of a robust credit information
system should assist the financial entities to more accurately evaluate the creditworthiness of loan
applications, reduce the operational costs of providing credit and lower intermediation costs, among other
benefits. (Ministry of Finance, Reserve Bank of Zimbabwe)
8) Measures to reduce risk in the economy and improve foreign direct investment (FDI) attraction
The need to reduce riskiness in the economy was highlighted in the section discussing access to finance. All
of the recommendations made up to this point will help to improve the predictability of business outcomes in
the Zimbabwean economy (and thus, contribute in risk reduction). In this order of ideas, improved labour
practices will help, as well as easing international trade and introducing other business friendly reforms.
Indeed, the introduction of business friendly reforms will also help improve Zimbabwe’s business image
abroad as they begin to be captured by the highly influential World Bank Doing Business report and the WEF
GCI. These indices have a strong self-reported component (in other words, local businesses are surveyed to
compile them). As such, the following actions are also recommended:
Strengthen Public-Private Dialogue. Involve the business community in the reform efforts not only for
their valuable input and to facilitate ensuing implementation, but also that they are aware of the reform
efforts and that they can be reflected adequately in international indices. Improving the country position
in them will help reduce risk perceptions of domestic and international investors alike, and assist to attract
much needed liquidity and foreign direct investment. (This can be done as part of the Better Business
Regulation Commission suggested in numeral 5).
Credibly clarifying the rules, scope and implementation of the IEE. The Indigenization and Economic
Empowerment (IEE) Act of 2008 looks to endeavour and secure at least 51% of the shares of every public
company and any other business shall be owned by indigenous Zimbabweans. Frequent amendments and
more specific regulations have added to the confusion, resulting in a lack of clarity and adding risk in the
economy. As noted by Pierola and Farmer (2014)33, “the IEE program not only establishes restrictions on
foreign ownership, but also actively aims at restricting ownership within the domestic economy (of non-
indigenous domestic agents). Lack of clarity around financing of the program has augmented uncertainty
33 Pierola and Newfarmer, Op. Cit., p. 56
51
over protection of ownership. This would reduce an important source of uncertainty and risk across the
Zimbabwean economy, removing an obstacle to attracting much needed investment to reduce costs in the
banking, rail, transport, and IT sectors. (Ministry of Finance, Zimbabwe Investment Centre, Ministry of
Indigenization, OPC)
9) Lack of scale: capacity utilization has been compromised by the supply side, chiefly arising from lack of
sufficient working capital finance and restricted performance of the agriculture sector. Government should
consider putting in place a mutually beneficial contract farming policy, support the fertilizer industry and
revisit the 1995 – 2020 agriculture policy. Government should consider the role of Agricultural and Rural
Development Authority (ARDA) estates and the Cold Storage Commission with a view to recapitalize them
on a public – private partnership (PPP) and remodel use of land to regroup labour (skill and management),
capital and technology. (MIC, Ministry of Agriculture, CZI, ZCFU)
10) Delay by government to pay for goods and services: this is threatening the going concern capability of
certain firms. Government should consider commissioning a study to deal with its arrear creditors and to
prevent further accumulation. (Min of Finance, MIC, OPC,CZI, ZNCC, Ministry of Health of Child Care)
11) Lack of change; the Ministry of Finance should revisit the study that was carried out by the Reserve Bank of
Zimbabwe and consider implementing the recommendation from the study.
12) Internal Devaluation: In the absence of the option of currency devaluation, the only available option to close
the competitiveness gap is for government to adopt the internal devaluation strategy that was adopted by
Latvia and other Baltic States. This will involve a systematized cost cutting measure across all the sectors of
economy, incorporating a reduction in employment costs in both government, the private sector, parastatals,
local authorities and other public institutions. As alluded to above a review of all cost of goods and services,
taxes, direct and indirect and regulatory costs should be considered to make Zimbabwe a low cost producer of
goods and services. These measures should close the un -competitiveness gap, making exports more viable,
improving private sector profitability and enhancing higher volume sales. Improving private sector
profitability should result in an increase in government taxes and enhance margins on commodities whose
pricing is currently facing international pressure.
13) Zimbabwe Economic Recovery Bill: The operationalization of the internal devaluation process and
recommendations of this study require a legal framework that will have an overarching effect on existing
laws. It is observed that the Zimbabwe Agenda for Sustainable Socio Economic Transformation (Zim –
Asset) lacks a legal framework to facilitate its implementation. It is recommended that a Zimbabwe Economic
Recovery Bill that will encapsulate necessary legal adjustments to current laws is promulgated to give effect
to the legal environment that will enable the country to close the unfolding un – competitiveness and
eliminate the effect of existing laws that have become an obstacle to the recovery of the economy.
14) Skills Enhancement Program: The international isolation of Zimbabwe in the last ten years has resulted in a
skills gap in both the public and private sector. A skills audit in the public sector is imminent and should help
government to adapt to managing a dollarized economy. The implementation of the Results Based
Management program is recognised as an attempt by government to improve the management of resources,
the impact of flight of human capital in the last ten years cannot be over emphasized as the country lost some
of its best minds. There is a need to evaluate the present human capabilities and skills to develop capacities
that will match the demands of a changed dollarized economy.
15) Economic Recovery Specialist Team: The changes required demand a multiple of diverse skills and a
dedicated team to guide the process on implementing the recommendations of the study, It is recommended
that a team of specialists with requisite skills and experience is put in place to enable the operationalization of
the recommendations proposed in this study.

52
53
V. CASE STUDIES
Case Study 1: Cement Manufacturing
Background
The industry comprises three manufacturers namely; Pretoria Portland Cement (PPC) Lafarge and Sino – Zim
Cement. The three companies have the following capacities:
PPC 850 000 tons
Lafarge 450 000 tons
Sino – Zim 250 000 tons
Total 1 550 000 tons
PPC controls 65 % of the Zimbabwean local market. The market is highly concentrated and oligopolistic with
PPC as the price setter distributing cement countrywide at one national price. The retail price is US$ 11 -12
per bag.
According to ITC figures as reported by Zimbabwe, exports of cement have been declining from about US
$39.4 million in 2009 to US$21.3 (an average annual decline of 14.2%). Likewise, cement’s share as
percentage of the country’s exports has declined from 1.74% to 0.61%. Meanwhile, imports have been
erratic (in value terms) from US$2.5 million in 2009 to US$5.5 million in 2011, reaching a level of US$2.3
million in 2013.
The sector is currently operating at between 60 and 70 % capacity.
Challenges facing the sector
1. Power
The producers are charged a non-load shedding tariff, which is effectively 14.50 cents per KWh. The
normal tariff is 9.83 cents per KWh. Loss of power through load shedding is not only affecting
production but also damaging cement plants, forcing the companies in the sector to opt for the
dedicated supply at a premium of 14.50 per KWh.
2. Transport Costs
Cement inputs and the finished product are bulky and require rail transportation. The inefficiencies at
the National Railways of Zimbabwe at times force producers to use the expensive road option. With
the reduction in the volume of traffic available within the economy, road haulers are using the NRZ
charges as a reference to determine their rates, resulting in the NRZ charges in certain routes being
matched by road operators. PPC has a peculiarity in that it moves its traffic on the NRZ and Beit
Bridge Railways (BBR) managed routes. The Bulawayo to Colleen Bawn route where the clinker is
produced is managed by (BBR). The rest of the routes are under the NRZ. The BBR rate is higher
than the NRZ rate per ton kilometer. The NRZ charges 7.78 US Cents per ton kilometer for moving
coal from Hwange to Bulawayo. The wagons from Hwange are passed over to the BBR, which
charges a higher rate of 10.53 US cents per ton kilometer. The NRZ and BBR are monopolies and
therefore are able to charge monopolistic rates. A road transporter, Colbro is offering PPC a more
competitive rate of 9.70 US cents than BBR in the same route.
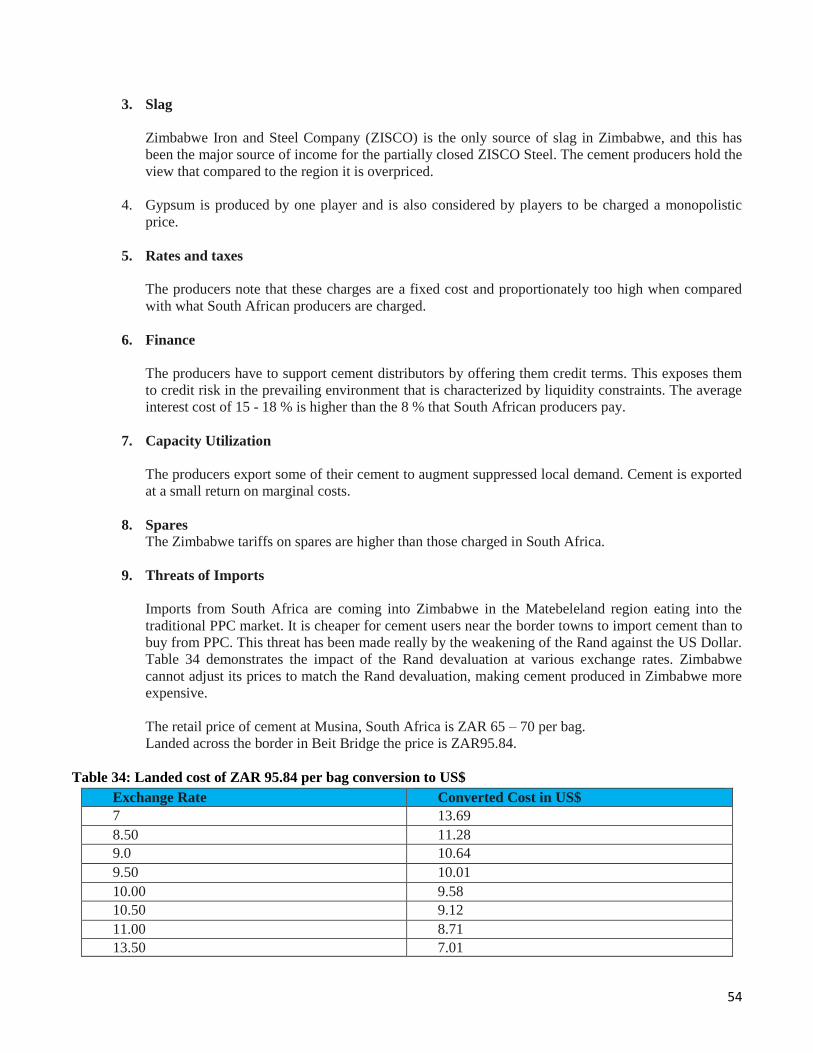
54
3. Slag
Zimbabwe Iron and Steel Company (ZISCO) is the only source of slag in Zimbabwe, and this has
been the major source of income for the partially closed ZISCO Steel. The cement producers hold the
view that compared to the region it is overpriced.
4. Gypsum is produced by one player and is also considered by players to be charged a monopolistic
price.
5. Rates and taxes
The producers note that these charges are a fixed cost and proportionately too high when compared
with what South African producers are charged.
6. Finance
The producers have to support cement distributors by offering them credit terms. This exposes them
to credit risk in the prevailing environment that is characterized by liquidity constraints. The average
interest cost of 15 - 18 % is higher than the 8 % that South African producers pay.
7. Capacity Utilization
The producers export some of their cement to augment suppressed local demand. Cement is exported
at a small return on marginal costs.
8. Spares
The Zimbabwe tariffs on spares are higher than those charged in South Africa.
9. Threats of Imports
Imports from South Africa are coming into Zimbabwe in the Matebeleland region eating into the
traditional PPC market. It is cheaper for cement users near the border towns to import cement than to
buy from PPC. This threat has been made really by the weakening of the Rand against the US Dollar.
Table 34 demonstrates the impact of the Rand devaluation at various exchange rates. Zimbabwe
cannot adjust its prices to match the Rand devaluation, making cement produced in Zimbabwe more
expensive.
The retail price of cement at Musina, South Africa is ZAR 65 – 70 per bag.
Landed across the border in Beit Bridge the price is ZAR95.84.
Table 34: Landed cost of ZAR 95.84 per bag conversion to US$
Exchange Rate Converted Cost in US$
7 13.69
8.50 11.28
9.0 10.64
9.50 10.01
10.00 9.58
10.50 9.12
11.00 8.71
13.50 7.01

55
Source: ZIMSTAT
The factory price in Zimbabwe for PPC is US$ 9.60, and retails at US$11.00. At the current exchange rate of
ZAR 10.50 South African cement lands in Zimbabwe at a comparable price of US$9.12, indicating a
competitiveness gap in the Zimbabwean market of 17%. While it is not known how much more could South
African producers reduce their prices to compete in the Zimbabwean market, Zimbabwean producers are indeed
facing intense competition that could be increased should the rand devalue further.
Should the Zimbabwean environment be improved with policies that reduce the cost of doing business,
Zimbabwean producers would be able to compete and possibly regain some of their lost export levels. It should be
noted, though, that the analysis is static- as information about demand changes in the region for cement is not
available and has an influence in all the variables discussed.
Table 35: Cost Comparison for Cement Production
Cost Type South
Africa
(US$)
Cost per
ton
(US$)
Zambia
(US$)
Cost per
ton (US$)
Zimbabwe
(US$)
Cost per
ton
(US$)
Cement milled (tons) 1 093 923 264 000 658 905
Coal 9 734 155 9.00 4 896 508 18.55 4 452 894 6.76
Diesel 1 349 346 1.25 1 876 649 2.85
Gypsum 442 426 1.33 504 140 1.91 688 420 1.04
Limestone 2 039 875 7.73 1 599 078 2.43
Contract labor 400 750 0.37 3 706 549 5.63
Repairs ordinary 3 115 946 2.88 1 231 718 4.67 4 509 405 6.84
Repairs special 3 453 554 3.19 83 253 0.13
Packaging 4 133 352 3.19 2 240 621 8.49 3 561 467 5.41
Power 7 688 492 7.11 2 240 621 5.54 1 461 809 14.5
Refractories 1 529 858 1.41 626 787 0.95
Salaries 8 024 761 7.42 3 969 000 15.03 8 971 483 13.62
Other overheads 3 943 185 3.65 1 971 152 7.47 2 248 443 3.41 Source: Cement Producers
Table 36: Unit Cost Comparison of Final Product
Cost Type South Africa Zambia Zimbabwe
Total Cost per ton ($) 46.70 72.14 82.67
Coal 8.94 18.55 7.57
Power 7.03 5.54 14.69
Gypsum 1.32 1.91 1.06
Maintenance 6.01 4.67 7.06
Packing 3.78 8.49 5.48
Source: Cement Producers
Potential Measures to Close the Gap with South Africa
Power – reduce tariff from 14.50 US cents to 9.83 US cents. Cost per ton reduction of finished product would be
US $ 2.44
Maintenance – Duty paid on imported spares is much higher than that paid by South African producers. The
highest level of duty in South Africa is 15 percent and there is no duty on parts considered critical. Cement plant

56
spares are specialized and are mostly produced in Europe. The cost of transporting spares from overseas is on
average 10 % in addition to the actual cost of the spares. Duties levied on spares from Europe attract tariffs as
high as 40 % as shown in the sample below:
Duty on packaging is also high at 30 %.
Table 37: Zimbabwe Import Tariffs – Sample Spare Parts
Spare Part Country of Origin Duties Transport and
clearance
Filters U.K. 40 % 2.64 %
SAE process oil Germany 25 % 5.18 %
Seal blade Germany 15 % 8.43 %
Circuit breaker Germany 10 % 2.39 %
Support wheel assembly Germany 5 % 20.67 %
Refractory bricks China 5 % 8.06 %
Electric motors Germany 0 % 7.41 %
In the sample the maintenance cost in Zimbabwe at US$ 7.06 is the highest, followed by South Africa at US$
6.01. The recommendation to review tariffs is validated as tariffs of 40 % as above arose from the Zimbabwe
Dollar era and have not been re – aligned to the use of hard currency as the trade currency.
The level of tariffs required to match Zambia and South Africa could not be ascertained within the scope of this
study.
Capacity utilization
PPC is currently operating at 70 % capacity. Demand in the country is currently depressed because of the
prevailing liquidity challenges. Enhancing capacity utilization can only be derived from exports. The region is
facing excess capacity. Namibia and South Africa in particular have excess capacity compared to their local
demand. Mozambique and Zambia have demand that is not matched with local supply. Movement of cement is
determined by use of rational economic zone evaluation. This measures the distance between the factory and the
market. The further the market is, the transport costs impact on the marginal cost profit, which beyond a certain
point becomes uneconomic. The size of rational economic zone depends on an efficient rail system. The NRZ is
currently struggling to survive and is not able to offer attractive rates and an efficient service. The Mozambique
market of Tete has high cement demand and PPC has been servicing it and could do more if the NRZ service was
improved. The increase in utilization based on exports does not reduce the price of cement production as pricing
is based on marginal costs with fixed costs being recovered from local sales.
An increase in utilization of 10 % based on local demand would reduce fixed costs by US$ 2.98
Finance Costs
PPC is currently benefiting from PPC South Africa and is borrowing at a competitive interest rate through a group
facility. The impact of the interest rate of 15 - 18 % against South Africa’s 8.5 % could not be evaluated.
Table 38: Gap Reduction
Country South Africa Zambia Zimbabwe
Cost Per Ton US$ 46.70 US$ 72.14 US$ 82.67
Power (32 % reduction) 4.70
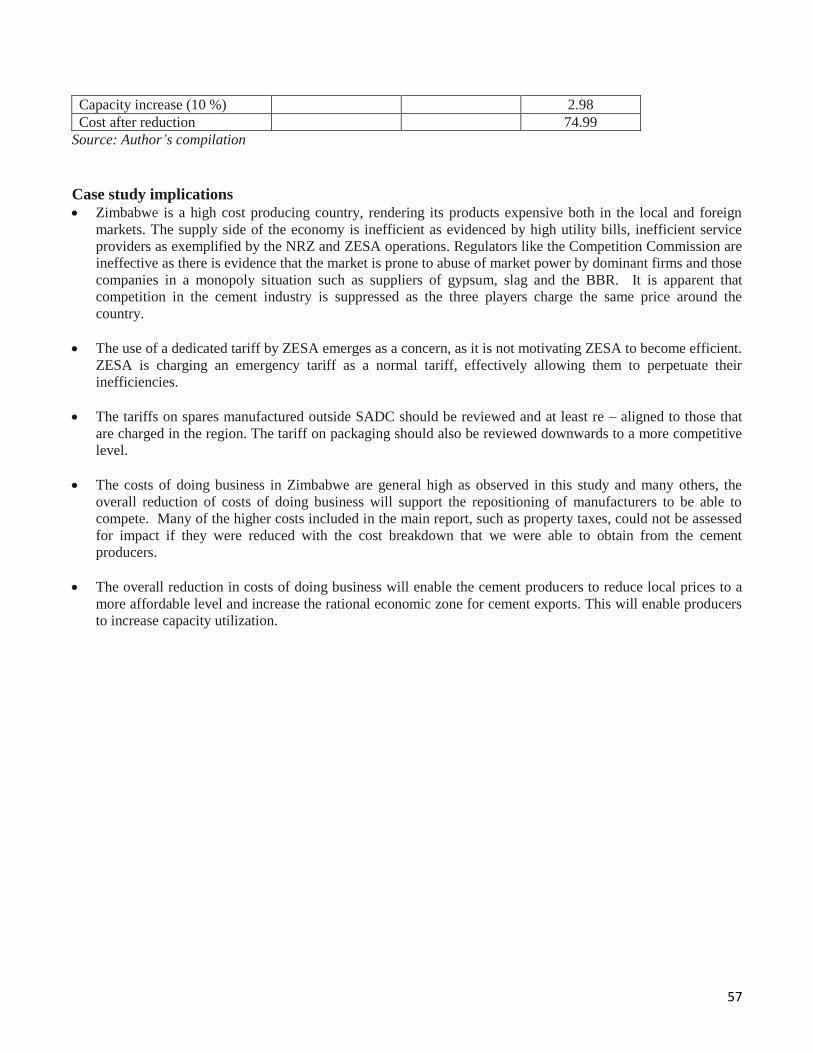
57
Capacity increase (10 %) 2.98
Cost after reduction 74.99
Source: Author’s compilation
Case study implications
Zimbabwe is a high cost producing country, rendering its products expensive both in the local and foreign
markets. The supply side of the economy is inefficient as evidenced by high utility bills, inefficient service
providers as exemplified by the NRZ and ZESA operations. Regulators like the Competition Commission are
ineffective as there is evidence that the market is prone to abuse of market power by dominant firms and those
companies in a monopoly situation such as suppliers of gypsum, slag and the BBR. It is apparent that
competition in the cement industry is suppressed as the three players charge the same price around the
country.
The use of a dedicated tariff by ZESA emerges as a concern, as it is not motivating ZESA to become efficient.
ZESA is charging an emergency tariff as a normal tariff, effectively allowing them to perpetuate their
inefficiencies.
The tariffs on spares manufactured outside SADC should be reviewed and at least re – aligned to those that
are charged in the region. The tariff on packaging should also be reviewed downwards to a more competitive
level.
The costs of doing business in Zimbabwe are general high as observed in this study and many others, the
overall reduction of costs of doing business will support the repositioning of manufacturers to be able to
compete. Many of the higher costs included in the main report, such as property taxes, could not be assessed
for impact if they were reduced with the cost breakdown that we were able to obtain from the cement
producers.
The overall reduction in costs of doing business will enable the cement producers to reduce local prices to a
more affordable level and increase the rational economic zone for cement exports. This will enable producers
to increase capacity utilization.
58
Case Study 2: Fertilizer Manufacturing
Introduction and Background
Fertilizer is produced in Zimbabwe at two levels of processing, the primary and secondary levels. The primary
stage involves the production of raw material fertilizer inputs, namely, ammonium nitrate and the phosphates that
are produced at Sable Chemicals Limited and Zimbabwe Phosphorous Limited respectively. Sable Chemicals is
situated in Kwekwe, and Zimbabwe Phosphates (ZimPhos) is in Harare but rock is mined and concentrated at
Dorowa. Sable Chemicals is 220 kilometers from Harare while Dorowa is 300 kilometers away. The phosphates
and ammonium nitrate together with potash are the raw materials required in the manufacture of fertilizer. Potash
is imported through Beira.
The two companies, Zimbabwe Fertilizer Company Limited (ZFC) and Windmill Limited, both based in Harare
are the secondary producers and get their material inputs from the above sources. The two companies have the
following granulation capacities; Zimbabwe Fertilizer Company – 200 000 tons and Windmill – 160 000 tons,
their blending capacities are 100 000 tons each.
The companies were established prior to independence and were developed as part of national strategy to support
agriculture.
The water electrolysis process used at Sable Chemicals is an energy intensive technology used for generating
hydrogen and oxygen from water. The hydrogen produced in the water electrolysis process is destined for use in
the production of ammonia at the ammonia synthesis plant where a combination of hydrogen and nitrogen take
place. Nitrogen is obtained from the air separation plant where liquifaction and distillation of air takes place. The
country could afford to use electricity for this hydrogen production in the 1960 to 70s era because there was
excess and affordable power from Kariba Hydro Power Station. With the increase in the demand for power the
water electrolysis process has now become too expensive for Sable Chemicals. The cost of electricity accounts for
up to 86 % of the cost of producing ammonia at Sable Chemicals as a result of both the nature of the process and
escalation in the price of electricity between the 1980s and to date. Sable Chemicals has an installed capacity to
produce 240,000 metric tons of ammonium nitrate fertilizer. However, currently the company is producing 60 to
70 000 metric tons per year. This is short of the national requirement of 150 000 tons per year. The shortfall is
imported.
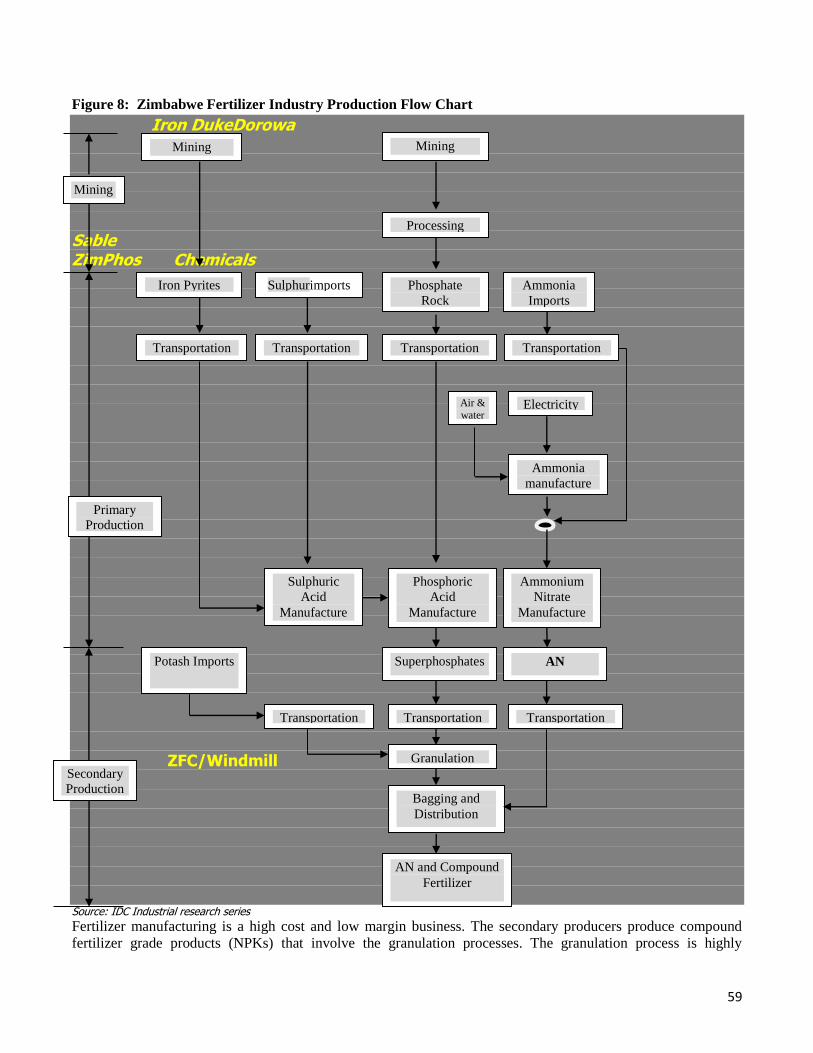
59
Figure 8: Zimbabwe Fertilizer Industry Production Flow Chart
Iron DukeDorowa Sable ZimPhos Chemicals ZFC/Windmill Source: IDC Industrial research series Fertilizer manufacturing is a high cost and low margin business. The secondary producers produce compound
fertilizer grade products (NPKs) that involve the granulation processes. The granulation process is highly
Mining
Mining
Sulphurimports
Mining
Air &
water
Ammonia
Imports
Iron Pyrites
Processing
Phosphate
Rock
Transportation Transportation Transportation Transportation
Electricity
Ammonia
manufacture
Ammonium
Nitrate
Manufacture
Phosphoric
Acid
Manufacture
Sulphuric
Acid
Manufacture
Primary
Production
AN Superphosphates Potash Imports
Transportation Transportation
Transportation
Granulation
Bagging and
Distribution
AN and Compound
Fertilizer
Secondary
Production

60
mechanized with raw materials constituting over 75 % of the manufacturing cost. Both the raw materials and
finished products are bulky and require an efficient and low cost mode of transportation. Therefore rail is the most
appropriate method of transportation.
The two producers, ZFC and Windmill, are currently competing with fertilizer importers. The main importer is
Omnia (Private) Limited, a wholesale and retail division of the South African based company, Nutrichem and
Prophet (Private) Limited who import most of their fertilizers from South Africa.
Market Analysis
Table 39: Market Analysis – Local versus Imported Fertilizer
Prior to Dollarization
Year Ammonium
Nitrate
NPK
Compounds
Total ZFC
& Windmill
Imports Total
including
Imports
Percentage
of Imports
(%)
1995 174 994 239 994 414 988 50 000 464 000 11
1996 212 687 256 728 469 415 91 000 560 000 16
1997 190 383 230 121 420 504 45 000 465 000 10
1998 196 286 227 535 423 821 40 000 464 000 9
1999 203 173 257 148 460 821 30 000 490 000 6
2000 168 825 176 864 345 689 20 000 355 000 6 Source: ZFC
The ratio of imported fertilizer to the total used was modest with the highest ratio of 16 % in 1996. In that year
there was a one month shutdown of the plant at Sable Chemicals for maintenance.
Table 40: Post Dollarization
Year AN NPK Total ZFC &
Windmill
Imports Total
including
imports
Percentage
of imports
(%)
2009 54 000 100 000 154 000 70 000 224 000 31
2010 80 615 145 393 240 167 73 125 299 133 24
2011 89 748 139 163 219 538 68 550 297 461 23
2012 95 682 113 320 156 252 88 455 297 457 30
2013 100 000 125 792 201 833 124 787 350 579 35 Source: ZFC
The ratio of imported fertilizer used has markedly increased from the average of 10 % to over 30 % since
dollarization and seems to be on the rise.
Fertilizer consumption
Until 1999, the large-scale commercial farming subsector accounted for most of the fertilizer consumption. The
N:P2O5:K2O ratio was 1.0: 0.55:0.43 in the commercial farming subsector and 1.0:0.51:0.18 in the communal
subsector (Table 41).
The application rates in the large-scale commercial farming subsector were comparable with those in developed
countries. The application rates in the smallholder subsector were and have remained much lower (Table 42).
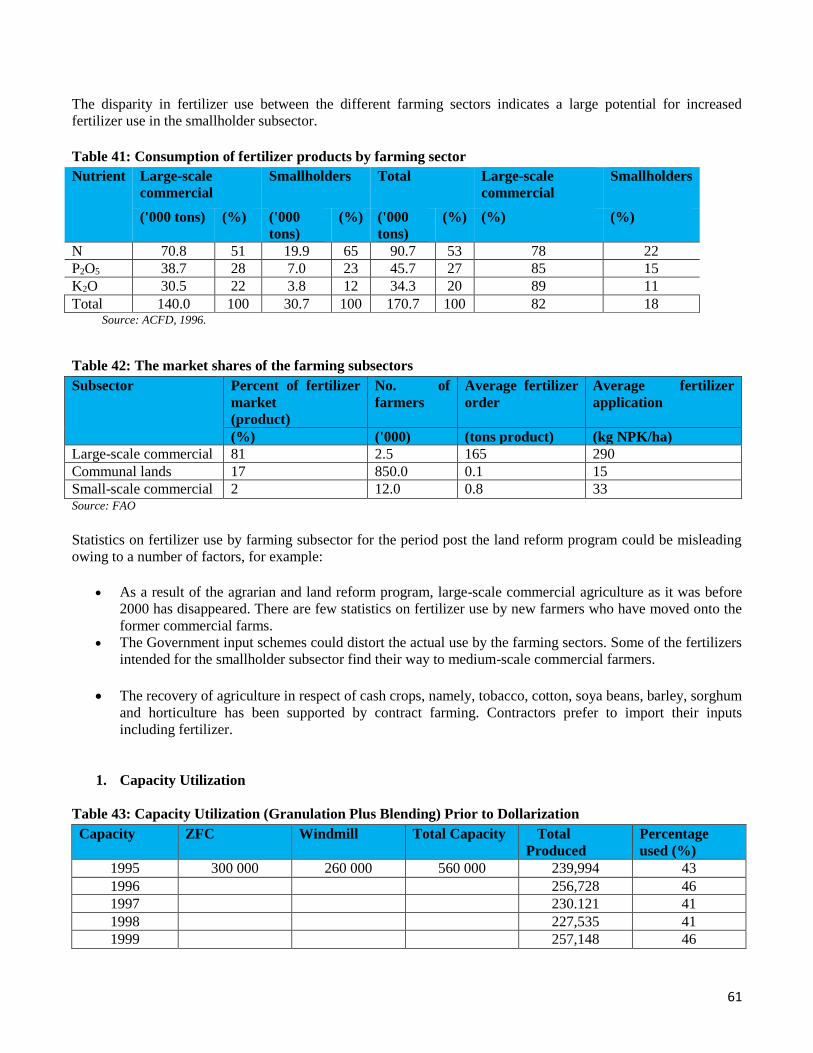
61
The disparity in fertilizer use between the different farming sectors indicates a large potential for increased
fertilizer use in the smallholder subsector.
Table 41: Consumption of fertilizer products by farming sector
Nutrient Large-scale
commercial
Smallholders Total Large-scale
commercial
Smallholders
('000 tons) (%) ('000
tons)
(%) ('000
tons)
(%) (%) (%)
N 70.8 51 19.9 65 90.7 53 78 22
P2O5 38.7 28 7.0 23 45.7 27 85 15
K2O 30.5 22 3.8 12 34.3 20 89 11
Total 140.0 100 30.7 100 170.7 100 82 18 Source: ACFD, 1996.
Table 42: The market shares of the farming subsectors
Subsector Percent of fertilizer
market
(product)
No. of
farmers
Average fertilizer
order
Average fertilizer
application
(%) ('000) (tons product) (kg NPK/ha)
Large-scale commercial 81 2.5 165 290
Communal lands 17 850.0 0.1 15
Small-scale commercial 2 12.0 0.8 33 Source: FAO
Statistics on fertilizer use by farming subsector for the period post the land reform program could be misleading
owing to a number of factors, for example:
As a result of the agrarian and land reform program, large-scale commercial agriculture as it was before
2000 has disappeared. There are few statistics on fertilizer use by new farmers who have moved onto the
former commercial farms.
The Government input schemes could distort the actual use by the farming sectors. Some of the fertilizers
intended for the smallholder subsector find their way to medium-scale commercial farmers.
The recovery of agriculture in respect of cash crops, namely, tobacco, cotton, soya beans, barley, sorghum
and horticulture has been supported by contract farming. Contractors prefer to import their inputs
including fertilizer.
1. Capacity Utilization
Table 43: Capacity Utilization (Granulation Plus Blending) Prior to Dollarization
Capacity ZFC Windmill Total Capacity Total
Produced
Percentage
used (%)
1995 300 000 260 000 560 000 239,994 43
1996 256,728 46
1997 230.121 41
1998 227,535 41
1999 257,148 46

62
2000 176.864 33 Source: ZFC
The lowest of capacity utilization was experienced in 2008 where 70 000 tons was produced. This represented 12
% capacity utilization.
Table 44: Capacity Utilization – Post Dollarization
Capacity ZFC Windmill Total Capacity Total Produced Percentage
Used (%)
2009 300 000 260 000 560 000 100,000 18
2010 145,393 26
2011 139,163 25
2012 113,320 20
2013 125,792 22
Source: ZFC
Capacity utilization increased from the low level of 12 % to the highest 26 % in 2010. The momentum has slowed
down as imports have been rising.
Table 45: Ratio of Imports to Capacity
Capacity ZFC Windmill Total Capacity Imports Percentage of
imports (%)
1995 300 000 560 000 50 000 9
1996 91 000 16
1997 45 000 8
1998 40 000 7
1999 30 000 5
2000 20 000 3
Source: ZFC
Imports averaged 9 % over the period of five years above.
Table 46: Ratio of Imports to Capacity – Post Dollarization
Capacity ZFC Windmill Total Capacity Imports Percentage of
imports
2009 300 000 560 000 70 000 12
2010 73 125 13
2011 68 550 12
2012 88 455 16
2013 124 787 23
Source: Author’s calculation
Imports averaged 15 % over the last five years after dollarization and are on the rise.
63
Potential capacity lost to imports is on average 15 % over the past 5 years. The average for the past two years is
20 percent.
4. Finance
Reduce finance costs from 20 % to 10 % per year:
Finance is required to support production through a calendar year. The fertilizer industry has a long cash cycle
and most customers would require to be offered credit facilities for at least three months. The fertilizer sales cycle
in Zimbabwe has shifted over the years. Prior to 2000 the sales cycle was as follows:
Winter crop – 40 % off take
Summer crop - 60 % off take
Current scenario
Winter crop - 20 % off take
Summer crop - 80% off take
The former cycle enabled producers to produce through the year with reasonable finance costs. The collection
efficiencies were also reasonable as the country had sufficient and suitable structured finance towards working
capital for both fertilizer producers and farmers. The current scenario requires producers to hold stock for a longer
period without sales if they have to produce continuously through the year. This requires a higher level of
working capital to finance stock holding.
The seasonal nature of fertilizer demands makes it difficult for companies to generate sufficient cash flow from
sales to finance operations. The companies need to obtain borrowings from banks. Because of high interest rates
firms manufacturer fertilizers on demand in order to avoid overstocking and under stocking. This however,
presents logistical difficulties in ensuring timely supply, more so to small holders who tend to buy fertilizer after
the start of the rainy season. Firms have to hold stocks for at least three months to meet peak demand.
Challenges Facing Producers
Low Capacity utilization
Lack of sufficient working capital, where available, it is expensive, short term and not suitable for
agricultural activities
Low effective demand, farmers lack adequate financial resources to purchase fertilizer requirements
Lack of procurement transparency in contract farming
Late announcement of government agriculture support programs, results in late placement of orders.
Delay in settlement of accounts by government
Exorbitant regulatory charges, incorporating local authority rates and taxes, license fees, Environmental
Management Agent charges and rent seeking fines.
Unreliable rail service by the National Railways of Zimbabwe
Delays in issuing export permits
High cost of power
Rigid labor laws
Cost Structure Primary Producers
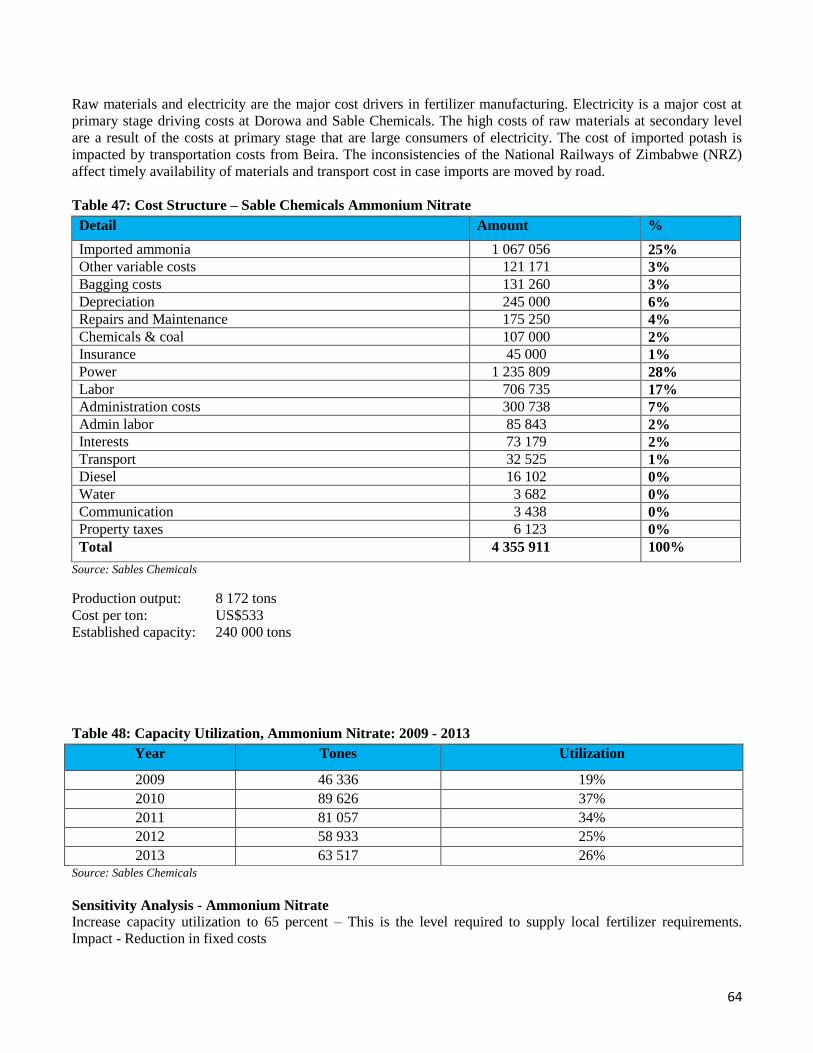
64
Raw materials and electricity are the major cost drivers in fertilizer manufacturing. Electricity is a major cost at
primary stage driving costs at Dorowa and Sable Chemicals. The high costs of raw materials at secondary level
are a result of the costs at primary stage that are large consumers of electricity. The cost of imported potash is
impacted by transportation costs from Beira. The inconsistencies of the National Railways of Zimbabwe (NRZ)
affect timely availability of materials and transport cost in case imports are moved by road.
Table 47: Cost Structure – Sable Chemicals Ammonium Nitrate
Detail Amount %
Imported ammonia 1 067 056 25%
Other variable costs 121 171 3%
Bagging costs 131 260 3%
Depreciation 245 000 6%
Repairs and Maintenance 175 250 4%
Chemicals & coal 107 000 2%
Insurance 45 000 1%
Power 1 235 809 28%
Labor 706 735 17%
Administration costs 300 738 7%
Admin labor 85 843 2%
Interests 73 179 2%
Transport 32 525 1%
Diesel 16 102 0%
Water 3 682 0%
Communication 3 438 0%
Property taxes 6 123 0%
Total 4 355 911 100%
Source: Sables Chemicals
Production output: 8 172 tons
Cost per ton: US$533
Established capacity: 240 000 tons
Table 48: Capacity Utilization, Ammonium Nitrate: 2009 - 2013
Year Tones Utilization
2009 46 336 19%
2010 89 626 37%
2011 81 057 34%
2012 58 933 25%
2013 63 517 26% Source: Sables Chemicals
Sensitivity Analysis - Ammonium Nitrate
Increase capacity utilization to 65 percent – This is the level required to supply local fertilizer requirements.
Impact - Reduction in fixed costs

65
Table 49: Sensitivity Analysis - Ammonium Nitrate
Detail Amount Cost per
ton at 40
percent
capacity
Capacity
Increase to
65 percent
Interest
Reduction
to 10 %
Reduced
Cost per
Ton
Imported ammonia 1 067 056 130 130
Other variable costs 121 171 15 15
Bagging costs 131 260 16 16
Depreciation 245 000 30 11 19
Repairs and Maintenance 175 250 21 21
Chemicals & coal 107 000 13 13
Insurance 45 000 7 4 3
Power 1 235 809 151 151
Labor 706 735 86 32 54
Administration costs 300 738 37 14 23
Admin labor 85 843 10 3 7
Interests 73 179 9 4 5
Transport 32 525 4 4
Diesel 16 102 2 2
Water 3 682 0.5 0.2 0.3
Communication 3 438 0.4 0.1 0.3
Property taxes 6 123 0.7 0.2 0.5
EMA,
Total 4 355 911 533 64.5 4 464.1
Source: Author’s compilation
Enhancement of capacity has high impact and at 65 % utilization would reduce costs per ton by US$ 64.50. The
company would also need to finance the incremental working capital; currently the company has a facility
thatattracts interest of 18 %. An interest cost of 10 % would reduce the cost per ton by US $ 4. The combination
of the two inputs at a mark - up of 5 % would make take the price of ammonium nitrate to the level of 2010 of
US$ 490 (US$ 487 based on above figures), making it more competitive to produce locally than to import.
Table 50: Ammonium Nitrate price history since dollarization.
Source: Sables Chemicals
Import parity price – US$ 564.
Regulatory Costs Sable Chemicals
There is potential to rationalize regulatory costs that are given below. The total regulatory costs of US$34 905 are
substantial more so as secondary producers are also charged further license fees. As mentioned in the main report,
Year Price/t (US$)
2009 470
2010 490
2011 515
2012 560
2013 560
66
section under trade taxes, license fees are being used by these regulatory agents for revenue generation rather the
regulatory function.
Environmental Management Agency (EMA)
1. License for Storage and Manufacturing of Hazardous Substances (all chemicals)
2. License for importation of hazardous substances (mainly ammonia)
3. Aerial Emissions license for North Nitric Acid Plant Stack
4. Aerial Emissions license for South Nitric Acid Plant Stack
5. Aerial Emissions license for Ammonium Nitrate Plant Stack
6. Aerial Emissions license for coal fired boilers Stack
7. Solid waste disposal license
8. Effluent disposal license
9. Hazardous waste disposal license
Total annual payment – US$ 16 280
National Social Security Authority (NSSA)
1. Manufacturing license
Annual cost – US $ 14 727
Medicine Control Authority of Zimbabwe (MCAZ)
1. Premise license
2. Persons license
Annual cost US $ 360
Radiation Protection Authority Zimbabwe (RPAZ)
1. License for possession and storage of radiation generating equipment for Ammonium Nitrate Plant
2. License for possession and storage of radiation generating equipment for North Nitric Acid Plant
3. License for possession and storage of radiation generating equipment for South Nitric Acid Plant
Annual cost US $ 3 020

67
Health Professions Authority (HPA)
1. Premise operating license
Annual cost US $ 518
(ii) Total Annual Regulatory Costs
1. EMA - US$ 16 280
2. RPAZ - US$ 3 020.00
3. HPA - US$ 518.00
4. MCAZ - US$ 360.00
5. NSSA - US$ 14 726.96
Independent inspections are required to certify compliance with NSSA requirements annually.
Cost – US$ 2 457
1. The effective power rate: 3c/kWh. This is a negotiated and government subsidized rate.
The government is responsible for the subsidy of 6 cents per KWh.
Table 51: Capacity Utilization of Sables Chemicals
Year Capacity (tons) Tons Produced
(tons)
Capacity
Utilization (%)
AN Price per
ton (US$)
2009 240 000 46 336 19 470
2010 89 626 37 490
2011 81 057 34 515
2012 58 933 25 560
2013 63 517 26 560 Source: Sables Chemicals
The main cost driver is electricity and the current power tariff of 3 US cents is subsidized by the government
which is responsible for the subsidy of 6 US cents per KWh.
Sable Chemicals has capacity to meet local demand for ammonium nitrate which at the prevailing level of
agricultural activity is 150 000 tons per year. The company is constrained by lack of adequate working capital and
high interest rate. The company has a bank facility that attracts interest of 18 percent.
The price of US$ 560 is marginally lower than the import parity price of US$ 564 per ton.
Table 52: Cost Structure Phosphate Rock
Dorowa Mine
Cost Percent (%) Cost per Ton at 20
% capacity
Cost Reduction at
65 % capacity
Reduced Cost
per ton
Mining 30 47.25 13.07 34.18
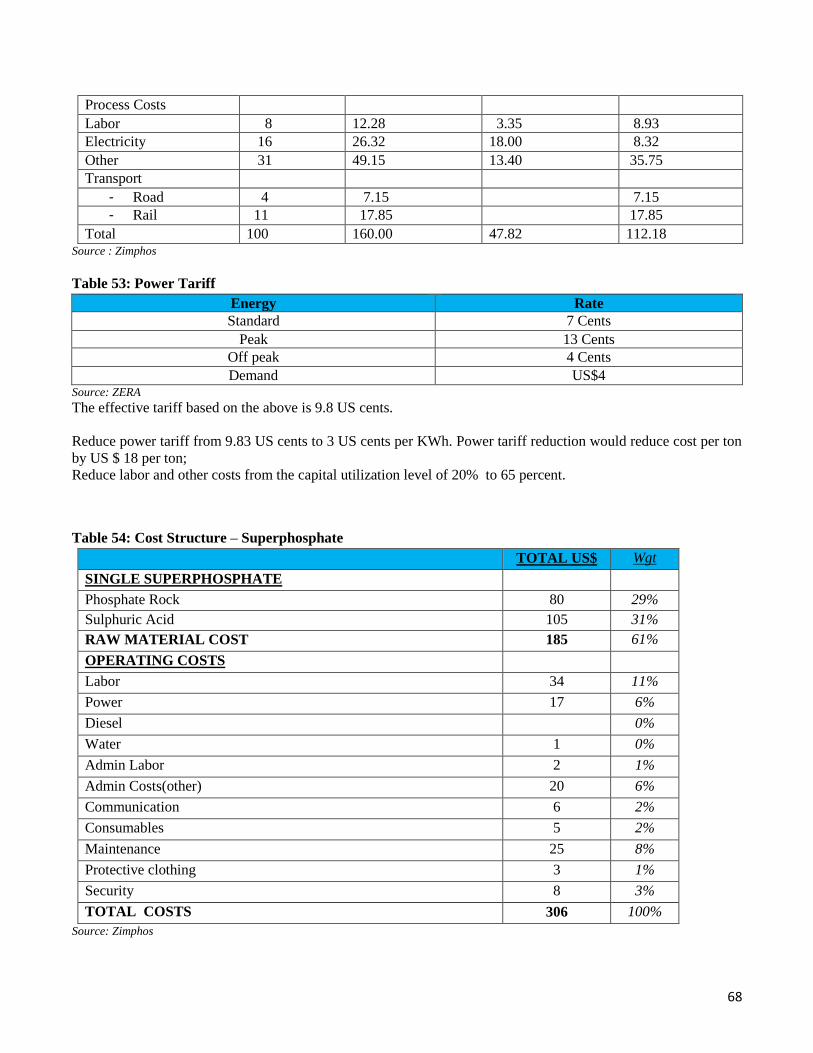
68
Process Costs
Labor 8 12.28 3.35 8.93
Electricity 16 26.32 18.00 8.32
Other 31 49.15 13.40 35.75
Transport
- Road 4 7.15 7.15
- Rail 11 17.85 17.85
Total 100 160.00 47.82 112.18 Source : Zimphos
Table 53: Power Tariff
Energy Rate
Standard 7 Cents
Peak 13 Cents
Off peak 4 Cents
Demand US$4 Source: ZERA
The effective tariff based on the above is 9.8 US cents.
Reduce power tariff from 9.83 US cents to 3 US cents per KWh. Power tariff reduction would reduce cost per ton
by US $ 18 per ton;
Reduce labor and other costs from the capital utilization level of 20% to 65 percent.
Table 54: Cost Structure – Superphosphate
TOTAL US$ Wgt
SINGLE SUPERPHOSPHATE
Phosphate Rock 80 29%
Sulphuric Acid 105 31%
RAW MATERIAL COST 185 61%
OPERATING COSTS
Labor 34 11%
Power 17 6%
Diesel 0%
Water 1 0%
Admin Labor 2 1%
Admin Costs(other) 20 6%
Communication 6 2%
Consumables 5 2%
Maintenance 25 8%
Protective clothing 3 1%
Security 8 3%
TOTAL COSTS 306 100%
Source: Zimphos
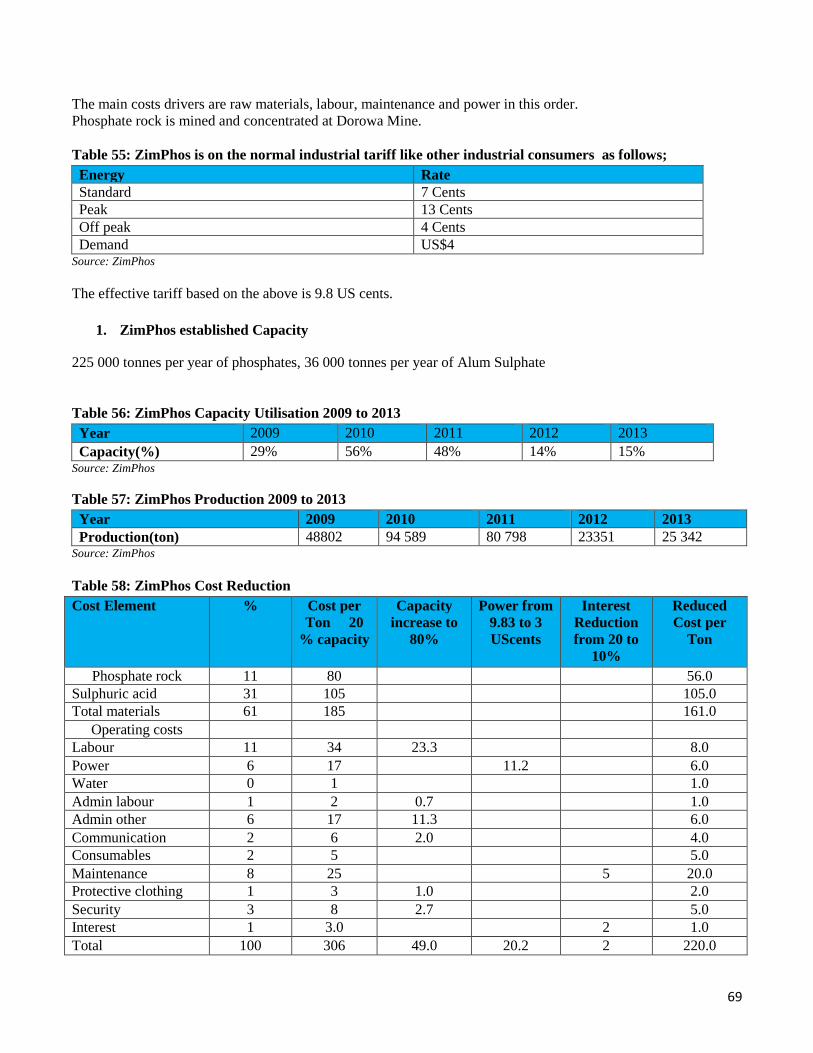
69
The main costs drivers are raw materials, labour, maintenance and power in this order.
Phosphate rock is mined and concentrated at Dorowa Mine.
Table 55: ZimPhos is on the normal industrial tariff like other industrial consumers as follows;
Energy Rate
Standard 7 Cents
Peak 13 Cents
Off peak 4 Cents
Demand US$4 Source: ZimPhos
The effective tariff based on the above is 9.8 US cents.
1. ZimPhos established Capacity
225 000 tonnes per year of phosphates, 36 000 tonnes per year of Alum Sulphate
Table 56: ZimPhos Capacity Utilisation 2009 to 2013
Year 2009 2010 2011 2012 2013
Capacity(%) 29% 56% 48% 14% 15% Source: ZimPhos
Table 57: ZimPhos Production 2009 to 2013
Year 2009 2010 2011 2012 2013
Production(ton) 48802 94 589 80 798 23351 25 342 Source: ZimPhos
Table 58: ZimPhos Cost Reduction
Cost Element % Cost per
Ton 20
% capacity
Capacity
increase to
80%
Power from
9.83 to 3
UScents
Interest
Reduction
from 20 to
10%
Reduced
Cost per
Ton
Phosphate rock 11 80 56.0
Sulphuric acid 31 105 105.0
Total materials 61 185 161.0
Operating costs
Labour 11 34 23.3 8.0
Power 6 17 11.2 6.0
Water 0 1 1.0
Admin labour 1 2 0.7 1.0
Admin other 6 17 11.3 6.0
Communication 2 6 2.0 4.0
Consumables 2 5 5.0
Maintenance 8 25 5 20.0
Protective clothing 1 3 1.0 2.0
Security 3 8 2.7 5.0
Interest 1 3.0 2 1.0
Total 100 306 49.0 20.2 2 220.0
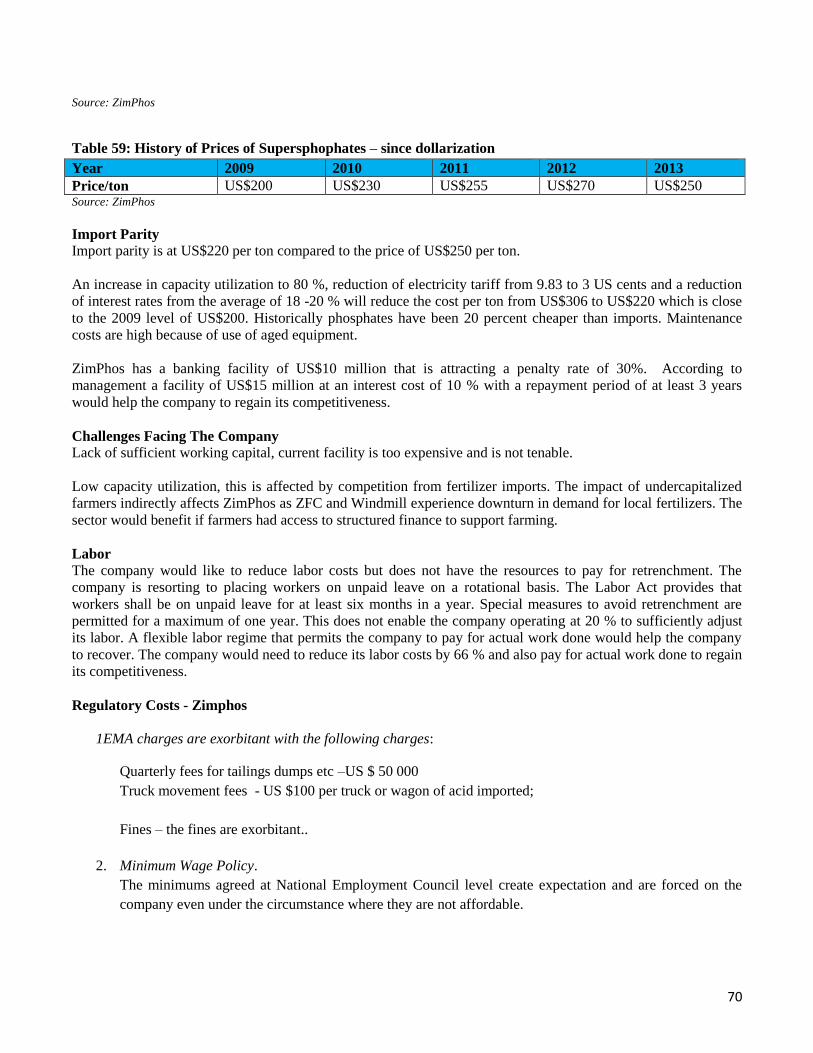
70
Source: ZimPhos
Table 59: History of Prices of Supersphophates – since dollarization
Year 2009 2010 2011 2012 2013
Price/ton US$200 US$230 US$255 US$270 US$250 Source: ZimPhos
Import Parity
Import parity is at US$220 per ton compared to the price of US$250 per ton.
An increase in capacity utilization to 80 %, reduction of electricity tariff from 9.83 to 3 US cents and a reduction
of interest rates from the average of 18 -20 % will reduce the cost per ton from US$306 to US$220 which is close
to the 2009 level of US$200. Historically phosphates have been 20 percent cheaper than imports. Maintenance
costs are high because of use of aged equipment.
ZimPhos has a banking facility of US$10 million that is attracting a penalty rate of 30%. According to
management a facility of US$15 million at an interest cost of 10 % with a repayment period of at least 3 years
would help the company to regain its competitiveness.
Challenges Facing The Company
Lack of sufficient working capital, current facility is too expensive and is not tenable.
Low capacity utilization, this is affected by competition from fertilizer imports. The impact of undercapitalized
farmers indirectly affects ZimPhos as ZFC and Windmill experience downturn in demand for local fertilizers. The
sector would benefit if farmers had access to structured finance to support farming.
Labor
The company would like to reduce labor costs but does not have the resources to pay for retrenchment. The
company is resorting to placing workers on unpaid leave on a rotational basis. The Labor Act provides that
workers shall be on unpaid leave for at least six months in a year. Special measures to avoid retrenchment are
permitted for a maximum of one year. This does not enable the company operating at 20 % to sufficiently adjust
its labor. A flexible labor regime that permits the company to pay for actual work done would help the company
to recover. The company would need to reduce its labor costs by 66 % and also pay for actual work done to regain
its competitiveness.
Regulatory Costs - Zimphos
1EMA charges are exorbitant with the following charges:
Quarterly fees for tailings dumps etc –US $ 50 000
Truck movement fees - US $100 per truck or wagon of acid imported;
Fines – the fines are exorbitant..
2. Minimum Wage Policy.
The minimums agreed at National Employment Council level create expectation and are forced on the
company even under the circumstance where they are not affordable.
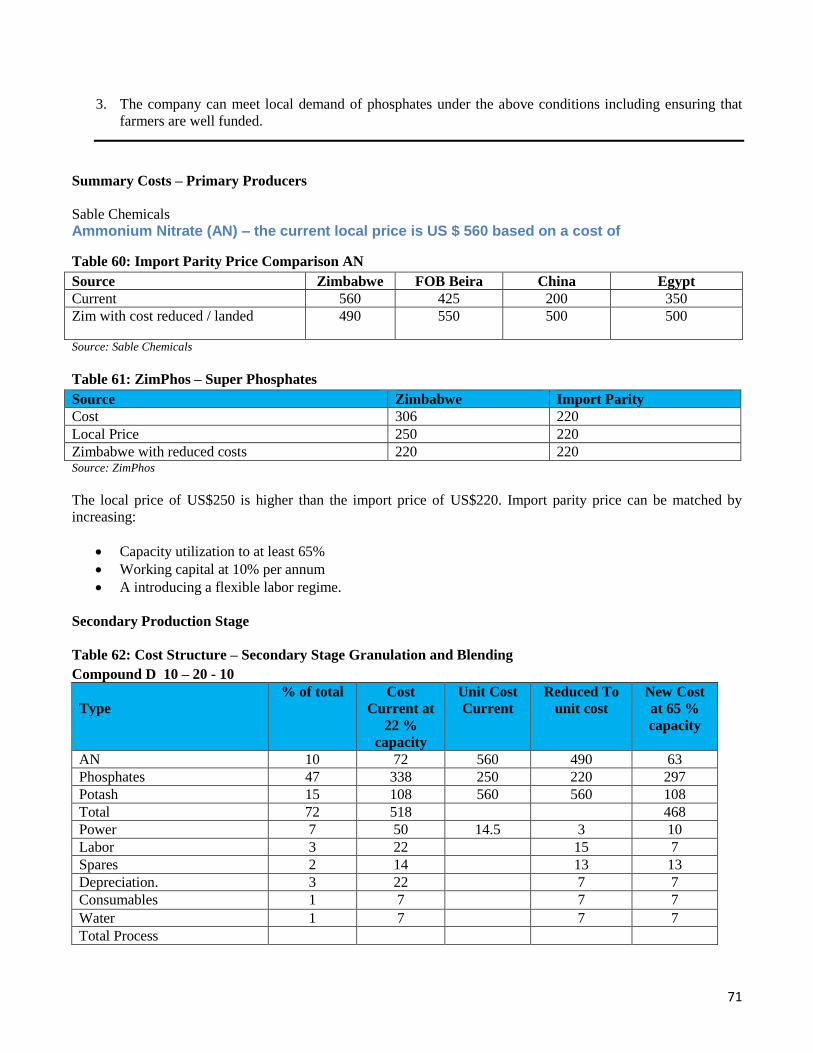
71
3. The company can meet local demand of phosphates under the above conditions including ensuring that
farmers are well funded.
Summary Costs – Primary Producers
Sable Chemicals
Ammonium Nitrate (AN) – the current local price is US $ 560 based on a cost of
Table 60: Import Parity Price Comparison AN
Source Zimbabwe FOB Beira China Egypt
Current 560 425 200 350
Zim with cost reduced / landed 490 550 500 500
Source: Sable Chemicals
Table 61: ZimPhos – Super Phosphates
Source Zimbabwe Import Parity
Cost 306 220
Local Price 250 220
Zimbabwe with reduced costs 220 220 Source: ZimPhos
The local price of US$250 is higher than the import price of US$220. Import parity price can be matched by
increasing:
Capacity utilization to at least 65%
Working capital at 10% per annum
A introducing a flexible labor regime.
Secondary Production Stage
Table 62: Cost Structure – Secondary Stage Granulation and Blending
Compound D 10 – 20 - 10
Type
% of total Cost
Current at
22 %
capacity
Unit Cost
Current
Reduced To
unit cost
New Cost
at 65 %
capacity
AN 10 72 560 490 63
Phosphates 47 338 250 220 297
Potash 15 108 560 560 108
Total 72 518 468
Power 7 50 14.5 3 10
Labor 3 22 15 7
Spares 2 14 13 13
Depreciation. 3 22 7 7
Consumables 1 7 7 7
Water 1 7 7 7
Total Process

72
Admin labor 2 14 5 5
Admin expenses 2 14 5 5
Finance 4 29 18 10 % 16
Profit 3.00 23 18
Total 100.00 720 563 Source: ZFC
Import parity price: US$600 per ton.
Current local price: US$720 per ton.
To reduce to US$563:
Cost Reduction due to:
Reduction in local materials; AN and super phosphates as recommended in item 10.
Increase in capacity utilization from 22 % to 65 %.
Reduction in electricity tariff from 14.5 US cents to 3 US cents per KWh.
A flexible labor regime
Table 63: Summary – Process Costs
Cost Type Current Cost Reduced Cost
AN 560 per ton of AN 490 per ton
Phosphates 250 per ton P 220 per ton
Potash 560 per ton of K 560 per ton
Variable Costs 28 of fertilizer 28 per ton of fertilizer
Power 50 “ 10 “
Fixed Costs 72 “ 30 “
Finance 29 “ 18 “
Profit 23 “ 16 “ Source: Author’s Compilation
Table 64: Comparison – Current Costs – Import Parity Prices
Compound D 10-20-10 14 -28-14 7-14-7
Cost Type Compounds Current Costs Reduced Cost Current Reduced Current Reduced
N 134 119 71 62 123 103
P 290 266 387 433 263 174
K 98 98 135 135 66 66
Variable 28 28 28 28 28 28
Power 50 10 50 10 50 10
Fixed 72 30 72 30 72 30
Finance 29 18 18 18 18 18
Profit 34 29 39 36 30 23
Total 720 598 800 752 620 429
Import parity 600 600 775 775
Ratio (%) 83 97 Source: Authors’ Compilation
Other Potential Cost Savings
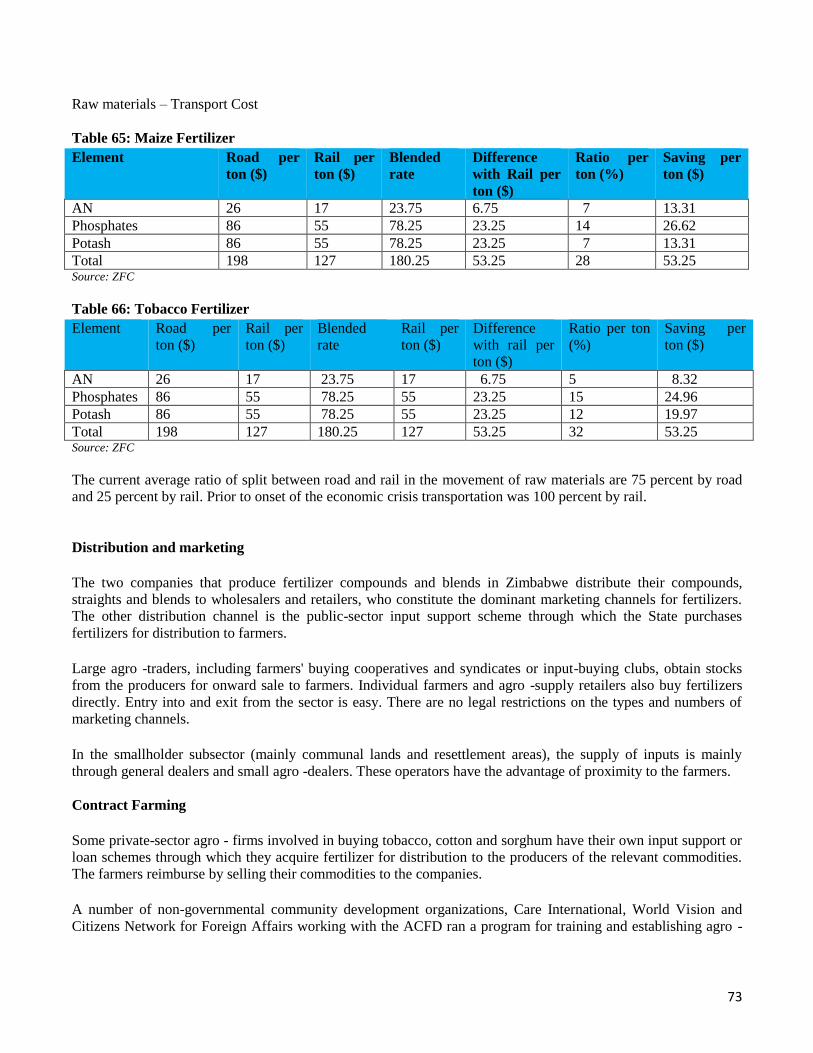
73
Raw materials – Transport Cost
Table 65: Maize Fertilizer
Element Road per
ton ($)
Rail per
ton ($)
Blended
rate
Difference
with Rail per
ton ($)
Ratio per
ton (%)
Saving per
ton ($)
AN 26 17 23.75 6.75 7 13.31
Phosphates 86 55 78.25 23.25 14 26.62
Potash 86 55 78.25 23.25 7 13.31
Total 198 127 180.25 53.25 28 53.25 Source: ZFC
Table 66: Tobacco Fertilizer
Element Road per
ton ($)
Rail per
ton ($)
Blended
rate
Rail per
ton ($)
Difference
with rail per
ton ($)
Ratio per ton
(%)
Saving per
ton ($)
AN 26 17 23.75 17 6.75 5 8.32
Phosphates 86 55 78.25 55 23.25 15 24.96
Potash 86 55 78.25 55 23.25 12 19.97
Total 198 127 180.25 127 53.25 32 53.25 Source: ZFC
The current average ratio of split between road and rail in the movement of raw materials are 75 percent by road
and 25 percent by rail. Prior to onset of the economic crisis transportation was 100 percent by rail.
Distribution and marketing
The two companies that produce fertilizer compounds and blends in Zimbabwe distribute their compounds,
straights and blends to wholesalers and retailers, who constitute the dominant marketing channels for fertilizers.
The other distribution channel is the public-sector input support scheme through which the State purchases
fertilizers for distribution to farmers.
Large agro -traders, including farmers' buying cooperatives and syndicates or input-buying clubs, obtain stocks
from the producers for onward sale to farmers. Individual farmers and agro -supply retailers also buy fertilizers
directly. Entry into and exit from the sector is easy. There are no legal restrictions on the types and numbers of
marketing channels.
In the smallholder subsector (mainly communal lands and resettlement areas), the supply of inputs is mainly
through general dealers and small agro -dealers. These operators have the advantage of proximity to the farmers.
Contract Farming
Some private-sector agro - firms involved in buying tobacco, cotton and sorghum have their own input support or
loan schemes through which they acquire fertilizer for distribution to the producers of the relevant commodities.
The farmers reimburse by selling their commodities to the companies.
A number of non-governmental community development organizations, Care International, World Vision and
Citizens Network for Foreign Affairs working with the ACFD ran a program for training and establishing agro -

74
dealers in smallholder areas. About 2 000 dealers were trained in the basic principles of storing, retailing, pricing
and service.
PUBLIC-SECTOR DISTRIBUTION CHANNEL SYSTEM
The government agencies involved in fertilizers include agricultural extension departments and parastatals, the
Grain Marketing Board (GMB) and the Agricultural and Rural Development Authority (ARDA). The GMB is
responsible for the importation, storage, transport and wholesaling of the main food grains, i.e. maize and wheat.
The ARDA is responsible for running State farms as well as promoting rural and agricultural development
through infrastructure support and development. These channels are used by the Government to supply subsidized
fertilizers, seeds and other inputs to smallholders on communal lands, resettlement areas and to A1 and A2
farmers in the new farming areas. Because of bureaucratic ordering and distribution processes and the limited
amount of money, not all farmers are able to access fertilizers in a timely manner through this system. However,
the major problem has been the failure by some of the farmers to repay the sums they have borrowed.
The role of the government in promoting fertilizer supply and use
The Government of Zimbabwe has established some measures for promoting the supply and use of fertilizers.
These include:
price controls fixing the maximum wholesale and retail prices for agricultural inputs;
subsidized credit scheme for input purchases;
crop input schemes providing seeds, fuel and fertilizers to smallholder farmers;
support for the agro-input dealer programs.
Constraints and challenges of fertilizer distribution in Zimbabwe
A major constraint facing distributors is the above-mentioned general shortage of fertilizers. The shortage is in
terms of both absolute quantities and timing. Some fertilizers arrive well after peak application time. The
distributors then have to carry over large unpurchased stocks. Another problem concerns the price controls. These
result in reduced profit margins, particularly for rural traders who face high transportation costs. The Government
input schemes through which fertilizers are provided to farmers through the GMB and other government agencies
also have an adverse impact on agro -dealers as they reduce the quantities purchased from the dealers. A further
constraint is the lack of storage capacity among small agro -dealers.
Other factors determining the profitability of fertilizer use varied with the farming subsector. In the large-scale
farming subsector, the main determinant was the ability of farmers to procure fertilizer early in the year, around
June/July, prior to the fertilizer price adjustment for the following season. The farmers reduced transaction costs
through bulk buying and using their own transport. The large-scale farmers had appropriate equipment for precise
and timely fertilizer application. The rates applied were based on individual soil analyses. The shortages and price
increases had a negative impact on fertilizer use in the smallholder subsector, which tends to buy fertilizer as the
need arises.
Studies on the economics of fertilizer use in the smallholder subsector have given variable results but generally
show suboptimal returns owing to suboptimal application rates. This is attributed partly to farmers not applying
recommended rates owing to their inability to purchase the full quantity of the required fertilizers. However, even
where farmers applied fertilizer according to the general recommended rates, they were often under applying them
owing to a lack of information on their specific requirements.
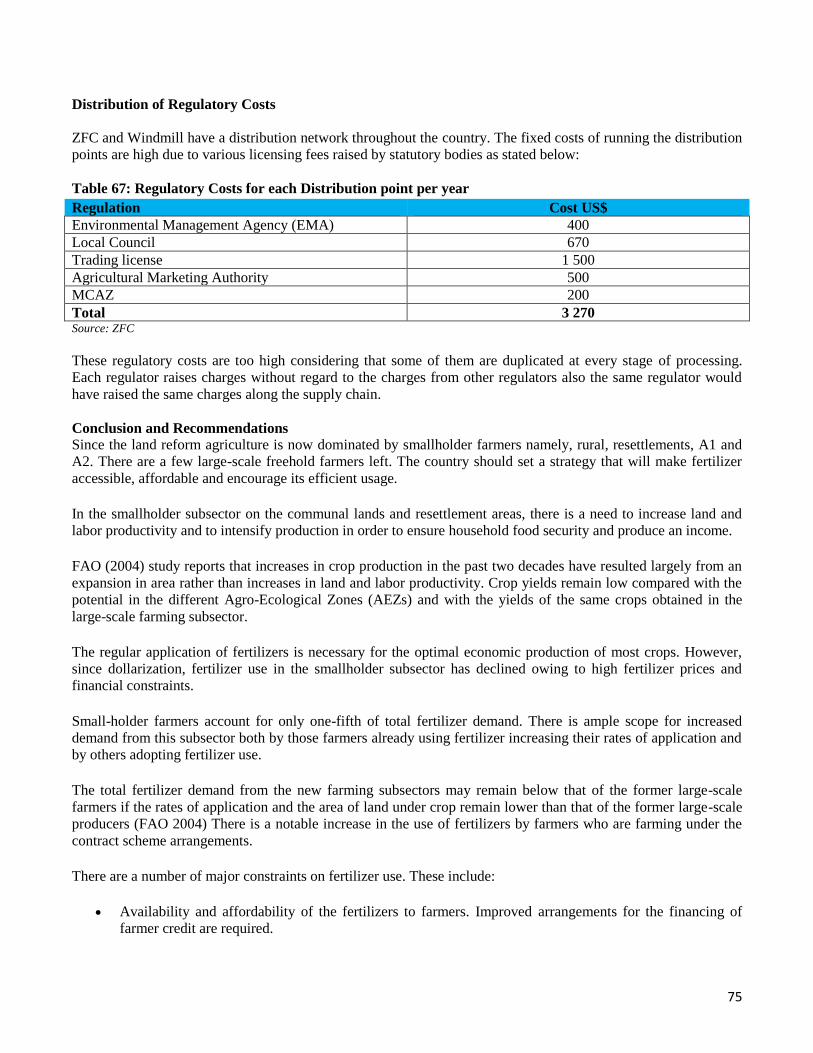
75
Distribution of Regulatory Costs
ZFC and Windmill have a distribution network throughout the country. The fixed costs of running the distribution
points are high due to various licensing fees raised by statutory bodies as stated below:
Table 67: Regulatory Costs for each Distribution point per year
Regulation Cost US$
Environmental Management Agency (EMA) 400
Local Council 670
Trading license 1 500
Agricultural Marketing Authority 500
MCAZ 200
Total 3 270 Source: ZFC
These regulatory costs are too high considering that some of them are duplicated at every stage of processing.
Each regulator raises charges without regard to the charges from other regulators also the same regulator would
have raised the same charges along the supply chain.
Conclusion and Recommendations
Since the land reform agriculture is now dominated by smallholder farmers namely, rural, resettlements, A1 and
A2. There are a few large-scale freehold farmers left. The country should set a strategy that will make fertilizer
accessible, affordable and encourage its efficient usage.
In the smallholder subsector on the communal lands and resettlement areas, there is a need to increase land and
labor productivity and to intensify production in order to ensure household food security and produce an income.
FAO (2004) study reports that increases in crop production in the past two decades have resulted largely from an
expansion in area rather than increases in land and labor productivity. Crop yields remain low compared with the
potential in the different Agro-Ecological Zones (AEZs) and with the yields of the same crops obtained in the
large-scale farming subsector.
The regular application of fertilizers is necessary for the optimal economic production of most crops. However,
since dollarization, fertilizer use in the smallholder subsector has declined owing to high fertilizer prices and
financial constraints.
Small-holder farmers account for only one-fifth of total fertilizer demand. There is ample scope for increased
demand from this subsector both by those farmers already using fertilizer increasing their rates of application and
by others adopting fertilizer use.
The total fertilizer demand from the new farming subsectors may remain below that of the former large-scale
farmers if the rates of application and the area of land under crop remain lower than that of the former large-scale
producers (FAO 2004) There is a notable increase in the use of fertilizers by farmers who are farming under the
contract scheme arrangements.
There are a number of major constraints on fertilizer use. These include:
Availability and affordability of the fertilizers to farmers. Improved arrangements for the financing of
farmer credit are required.
76
Access to fertilizers. Fertilizers and other inputs (such as seeds and agrochemicals) should be more
readily available in the farming areas.
Supply of fertilizers. This needs to be increased.
Fertilizer production technologies and facilities need improvement.
Competition from imports can be matched with overall improvement in the general economic
environment of the country.
In a study on persuading farmers to use fertilizers, Rusike and Dimes (1993) highlighted the following factors:
More precise weather forecasts concerning rainfall would enable farmers to better assess the risks of
fertilizer use.
Farmers need more precise guidance on fertilizer use than provided by the current standard or blanket
recommendations.
Selling fertilizers in small packs would encourage wider use by farmers.
The supply of other inputs (e.g. seeds) should be linked to that of fertilizers.
The above measures should improve local demand of fertilizers and enable smallholder farmers to buy their
requirements in advance of the rainy season. This should enable producers to plan better.
Recommendations
It is recommended that all fertilizer producers (ZimPhos, Windmill and Dorowa Mines, like Sable
Chemicals, are given a special power tariff to enable them to reduce the cost of fertilizer. A tariff of 3
United States Cents based on the export tariff of ZESA is recommended. This represents the most
efficient cost of producing power. The current arrangement where Sable Chemicals is charged 3 US cents
per KWh with 6 cents being charged to government is not sustainable; government has no budgetary
capacity to pay, the tariff of 3 cents reflects the marginal cost of producing power, (where there is perfect
competition, marginal cost is equal to marginal revenue that is equal to price: mc = m. = p) ZESA is
operating in a monopolistic situation and lacks motivation to be efficient. Notwithstanding this the
continued operation of Sable Chemicals using the current electrolysis process as mentioned below is very
costly to the economy and the best recourse is to seek for alternative technology and release the power
tied to the process to other more productive sectors..
The producers need a firm market to improve capacity utilization. The country requires on average 350
000 tons of fertilizer based on the current agricultural activities. The two secondary producers have more
capacity than this and should be allowed to export production that is in excess to requirements. The
fertilizer requirements should be assessed regularly in advance of the rainy season and be agreed with the
Ministry of Agriculture. The producers should be allowed to export the excess with reduced
administrative hindrances.
The most reliable market for fertilizer is from contracted farmers whose financiers seem to prefer
imported fertilizer. The country supports the principle and policy of self - sufficiency in agricultural
production. Fertilizer is an important input in crop production and importing large quantities as is
unfolding implicitly means that the country is importing a portion of its crop even though producing
locally. This can be demonstrated by the production of cotton, soya bean and tobacco where there is
evidence pointing to the foreign content in production being more than the local content. This is however
beyond the scope of this study.
Fertilizer producers should be consulted as part of process in deciding the level of imports that are permitted,
more so as affecting cash crops such as tobacco, maize, cotton and soya beans. It is noted that some restrictions
already exist in the form of import permits. However there is a lack of consultation between the issuing authorities
and the local industry resulting in import permits being issued for fertilizers that can be manufactured locally. The
77
practice in place in the oil industry could be adopted for the sector. Import permits that are issued in liaison with
the industry before being issued.
Government should come with sufficient funding at the right cost for both secondary and primary
producers.
Deliberate effort to use rail to move raw material inputs and finished fertilizer.
A review of trade taxes, local authority licensing costs, various EMA fees and fines and other regulatory
charges as recommended in the main study report would help to bring down fixed costs.
The review of these costs would be part of a subsidy mechanism to the producers of fertilizer.
The recommendations contained in the main study are particularly relevant to the fertilizer industry in view of its
current status where firms are characterized by weak balance sheets. The “ internal devaluation” process that is
proposed will help the companies to reduce their labor, finance, electricity and other operational costs.
Primary Producers
Both Chemplex (Zimphos) and Sable Chemicals have peculiar problems that need to be addressed urgently.
Chemplex Cooperation
The company is in need of recapitalization, according to management its going concern capabilities are under
threat. It is wholly owned by government which presently has no capacity to inject fresh money. The company
will not be able to go much longer without recapitalization.
Sable Chemicals
The company cannot continue with the present electrolysis technology, consuming 9 – 10 percent of national grid
at full throttle. This is too much power in a power deficit country. The opportunity cost of power has not been
evaluated but it is much higher than the 6 US cents that is charged as an additional charge to government. There
have been calls from both CZI and Chamber of Mines to switch off the electrolysis process at Sable Chemicals.
This would release power to the productive sectors of the economy. Government is budget constrained and cannot
afford to carry the 6 US cents to support an inefficient process. The government has not paid the subsidy which
has accumulated to over US$110 million. This makes 3 US cents the effective tariff.
Companies with dedicated power supplies are charged 14.5 US cents. The opportunity cost to the economy based
on 3 cents is 11.5 cents.
Because of power shortfall companies have standby generators whose power costs 25 US cents on average. The
opportunity costs on 14.5 cents is 10.5 cents.
With Sable Chemicals operating at 40 percent capacity, the total power consumed per year is 80 GWh. The total
opportunity cost on charging 3 cents is US$ 9.2 million per year. The cost arising from using generators is US$
8.4 million. The total cost is 17.6 million. This is a real cost that the economy is carrying because of the continued
use of an outdated technology.
In view of above opportunity cost which is not sustainable for the economy it is prudent that the electrolysis plant
is shutdown. Ammonium Nitrate could be imported whilst a more efficient technology is adopted. A strategy for
alternative sourcing of ammonium nitrate should be pursued and the power dedicated towards the electrolysis
process can be allocated for more efficient use in the economy.
78
Secondary producers have relatively strong balance sheets and with enhanced capacity utilization and other
improvement measurements as espoused in this study they can produce competitively and import ammonium
nitrates for their requirements.
A viable strategy to build an alternative source of nitrogen nitrate should be pursued with private sector
participation whilst secondary producers import ammonium nitrate.

79
Bibliographical and Electronic Sources
Anders Åslund, 2012. “Lessons from Reforms in Central and Eastern Europe in the Wake of the Global
Financial Crisis”, Working Paper 12-7, Peterson Institute for International Economics, Washington DC.
Arvis, Jean Francois. et.al. “Connecting to Compete 2014: Logistics Performance Index”, World Bank,
Washington DC
Chamboko, Tafireyi and Erasmos, Jaco. 2013. “ Analysis of Cost Compliance with Regulations in the
Livestock and Poultry Sectors”, Zimbabwe Agricultural Competitiveness Program, USAID.
Chigumira G. Chipumho.E and S. Shamu (2009) Currency Reform in Zimbabwe: An Analysis of
Possible Options, ZEPARU Working Paper.
Fernandes, Ana M and Robert Kirk, 2014. “Creating Incentives for New Dynamism in Zimbabwe’s
Merchandise Exports: The Role of Trade and Industrial Policies”, Notes on Trade and Competitiveness:
World Bank/Multi-Donor Trust Fund.
Federation of East and Southern African Road Transport Associations (FESARTA). www.fesarta.org/
IDA, IFC, MIGA, 2013. “Interim Strategy Note for the Republic of Zimbabwe for the Period FY 13-
15”, Report No. 74226-ZW.
IFC/World Bank Enterprise Surveys. http://www.enterprisesurveys.org
International Monetary Fund (IMF), International Finance Statistics (IFS) Database
IMF (2013) IMF International Finance Statistics; the Economist Intelligence Unit
Jefferis. K, Chigumira.G and E. Chipumho (2013) A Review of Zimbabwe’s Optimum Future Currency
Regime, ZEPARU Working Paper,
Logistics Performance Index (LPI), 2014. www.lpi.worldbank.org
Lopdale Consultancy, 2014. “Labor Laws in Zimbabwe: Impact on Business Competitiveness”, advocacy paper
commissioned by ZNCC, March 2014.
Matto and Waris. 2014. "Zimbabwe Empowerment through Services Trade Reform", The WorldBank
MDTF, March 2014.
Pierola, and Newfarmer et.al. 2014. “Trade in Zimbabwe: Changing Incentives to Enhance
Competitiveness”, World Bank/Multi-Donor Trust Fund.
80
Pifaretti, Hove and Shang, 2012. Republic of Zimbabwe Growth Recovery Notes: “From Economic
Rebound to Sustained Growth”, Report No. ACS2396
The Economist Intelligence Unit, 2014. “Zimbabwe Country Report”, London, UK: April 2014,
www.economist.com
Trademap, International Trade Center (ITC), Geneva. http://www.trademap.org
USAID/SERA Program. 2014. “Agro-Industries/ Food and Beverages Value Chain Analysis”, ZEPARU
OccassionalOccasional Paper 2/2014, USAID/Zimbabwe
USAID/SERA Program. 2014. “Cotton to Clothing Value Chain Study”, ZEPARU
OccassionalOccasional Paper 1/2014, USAID/Zimbabwe
USAID/SERA Program. 2014. “Engineering and Metals Industry Value Chain Analysis”, ZEPARU
Occassional Paper 3/2014, USAID/Zimbabwe
Economic Consulting Associates (2011) Zimbabwe Urban Water Tariff Study,
World Bank and International Telecommunication Union (ITU), 2014. “The Little Data Book on ICT
2014”, Washington DC: World Bank
World Bank, 2013.“Doing Business Report 2014: Understanding Business Regulation for Small and
Medium Size Enterprises”, Washington DC, Oct. 2013. http://www.doingbusiness.org
World Bank (2014) Zimbabwe Economic Briefing: February, 2014.
World Bank World Development Indicators http://data.worldbank.org/data-catalog/world-development-
indicators
Zimbabwe Investment Authority (ZIA), 2012. “Report on Improving the Business Climate in
Zimbabwe”, Harare: May 2012
Zimhunga E.S. et.al. 2014. “Zimbabwe Chemical Industries Value Chain Analysis”, ZEPARU
Occassionaloccasional Paper 4/2014, USAID/SERA Program.
81
ANNEX 1: THE OECD REFERENCE CHECKLIST FOR REGULATORY DECISION-MAKING
1. The problem to be solved should be precisely stated, giving evidence of its nature and magnitude, and
explaining why it has arisen (identifying the incentives of affected entities)
2. Government intervention should be based on explicit evidence that government action is justified, given the
nature of the problem, the likely benefits and costs of action (based on a realistic assessment of government
effectiveness), and alternative mechanisms for addressing the problem.
3. Regulators should carry out, early in the regulatory process, an informed comparison of a variety of
regulatory and non-regulatory policy instruments, considering relevant issues such as costs, benefits,
distributional effects and administrative requirements.
4. Regulatory processes should be structured so that all regulatory decisions rigorously respect the “rule of law”;
that is, responsibility should be explicit for ensuring that all regulations are authorized by higher-level regulations
and consistent with treaty obligations, and comply with relevant legal principles such as certainty, proportionality
and applicable procedural requirements.
5. Regulators should choose the most appropriate level of government to take action, or if multiple levels are
involved, should design effective systems of co-ordination between levels of government.
6. Regulators should estimate the total expected costs and benefits of each regulatory proposal and of feasible
alternatives, and should make the estimates available in accessible format to decision-makers. The costs of
government action should be justified by its benefits before action is taken.
7. To the extent that distributive and equity values are affected by government intervention, regulators should
make transparent the distribution of regulatory costs and benefits across social groups.
8. Regulators should assess whether rules will be understood by likely users, and to that end should take steps to
ensure that the text and structure of rules are as clear as possible.
9. Regulations should be developed in an open and transparent fashion, with appropriate procedures for
effective and timely input from interested parties such as affected businesses and trade unions, other interest
groups, or other levels of government.
10. Regulators should assess the incentives and institutions through which the regulation will take effect, and
should design responsive implementation strategies that make the best use of them.
82
ANNEX 2: CONDITIONS IN CENTRAL AND EASTERN EUROPE IN THE WAKE OF THE GLOBAL
FINANCIAL CRISIS
The state of their economies was as follows, salient features:
1. The countries were faced with a financial crisis after the collapse of the Soviet Union.
2. The countries had inflation hovering around 1 000 percent.
3. There was corruption and organized crime in some of the countries.
4. The countries had a record of poor fiscal discipline and large public debt.
5. Most of the countries had large budget deficits.
6. Wages and real estate prices were high.
7. Unemployment was high.
8. Investor confidence was very low.
9. The countries had lost competitiveness.
Major Anti-Crisis Measures Adopted
The most radical and successful changes took place in the three Baltic countries, particularly Latvia, but also in
Lithuania and slightly less so in Estonia. The main thrust of the measures was for the countries to regain
competitiveness. The countries had their national currencies fixed to the Euro. The countries had large current
account deficits, which under the conventional wisdom of the IMF would indicate the need to devalue the
currency. While the countries had the option to devalue, they instead pursued a policy of ‘internal devaluation’,
cutting wages and public expenditures, which rendered their cost levels competitive and allowed them to turn
their large current deficits swiftly into substantial surpluses.
The main measures taken were:
1. Fiscal adjustments – substantial cut of public expenditure – material civil servants salary cuts.
2. Voluntary cuts of ministers salaries by 35 % in Latvia.
3. In order to cut production costs substantial wage cuts in public sector organizations and in the private
sector.
4. Labor markets were deregulated to make them adjustable by employers as circumstances would demand.
5. Safeguards were made for the poor and social benefits for the middle class were trimmed.
6. There were minor changes in the rates of taxation. Expenditure cuts were preferred to tax hikes in view of
that people do not appreciate paying taxes when they receive fewer public services.
7. Reforms were affected in public administration, reducing red tape; reforms were also made in the health
and education sectors.
8. In Latvia the administrative reforms surprisingly turned out to be politically easy, citizens preferred fewer
bureaucrats and less bureaucracy. The Latvian government closed down half of its agencies, cut the
public wage costs by 26 percent in one year, trimmed its labor numbers by 29 percent. Measures were
placed to stipulate a ceiling of salaries of state owned corporations. Latvia also closed some hospitals and
schools and introduced some reforms in the school systems. It also had too many institutions of higher
learning inherited from the Soviet era; there was some rationalization to focus on quality improvement.
9. The countries engaged in improving the cost of doing business
10. Reforms were initiated in respect of pension funds schemes.
83
The reform measures that were instituted by the political economy have been summarized in the dictum: Crisis
made the unthinkable possible. There were two major objectives for the reforms:
1. To overcome macroeconomic crisis and to bring it under control.
2. To develop conditions for a return to high economic growth into the future.

84
ANNEX 3: PDL AND WAGE NEGOTIATIONS IN ZIMBABWE
The reference and application of the concept of PDL in wage negotiations in Zimbabwe predates the country’s
independence in 1980. Cubitt and Riddell carried out the major study on the PDL in Zimbabwe in 1974. Later
studies updated the PDL levels for inflation to make estimates current. The PDL was designed to be “time bound
– specific” location bound measures of the price of a particular bundle of commodities required for subsistence of
defined households. (Clarke 1977:1). The surveys on PDL were therefore seen as a basis for tracking the money
price of basic “subsistence”. It was inevitably used as a basis to check on the adequacy or otherwise of minimum
wages. According to Clarke, the PDL illustrates the extent to which wage structures remain palpably inadequate
in the satisfaction of the basic consumption needs of workers forced to be dependent on them. (1977).
The attainment of independence in April 1980 was accompanied by nationwide strikes emanating from a crisis of
expectations. As a result, government constituted a Commission of inquiry under the chairmanship of Roger
Riddell in September 1980 to look into incomes and conditions of service with a view to adopting an incomes
policy to assist in correcting inherited anomalies. The Commission highlighted the need to introduce policies to
alleviate poverty and narrowing income differentials in what it termed – growth with equity through minimum
wages which should solely meet the needs of workers and their families and not based on the place where work is
carried out or the type of work performed. It is only through adopting the principle of need that present (and
future) anomalies can be removed. Thus, whether a person is employed as a domestic worker, as a factory worker
the criterion of need should determine minimum wages.
Based on the PDL for an average family of six, a father, mother and four children, the “ideal” target income paths
were plotted for urban and rural based workers. The Commission recommended that the target wage policy was to
reach 90 percent of PDL by mid - 1984 (after 3.5 years) with a two-tier wage system (the remaining 10 percent
would allow for rewarding of human capital traits). This approach of linking the minimum wage to PDL in the
Riddell report was premised on a projected growth rate of 14 percent per annum. However, when the recession of
1982/3 and three years of consecutive drought set in, the government abandoned the target wage path, and instead
adopted a stabilization program with a wage restraint component. Indeed the Riddell Commission was aware of
the specific conditions on which the wage target was based, warning against implementing it in conditions of
economic decline. Source: Zimbabwe Public Service Employment: Pay Issues and Options 2013
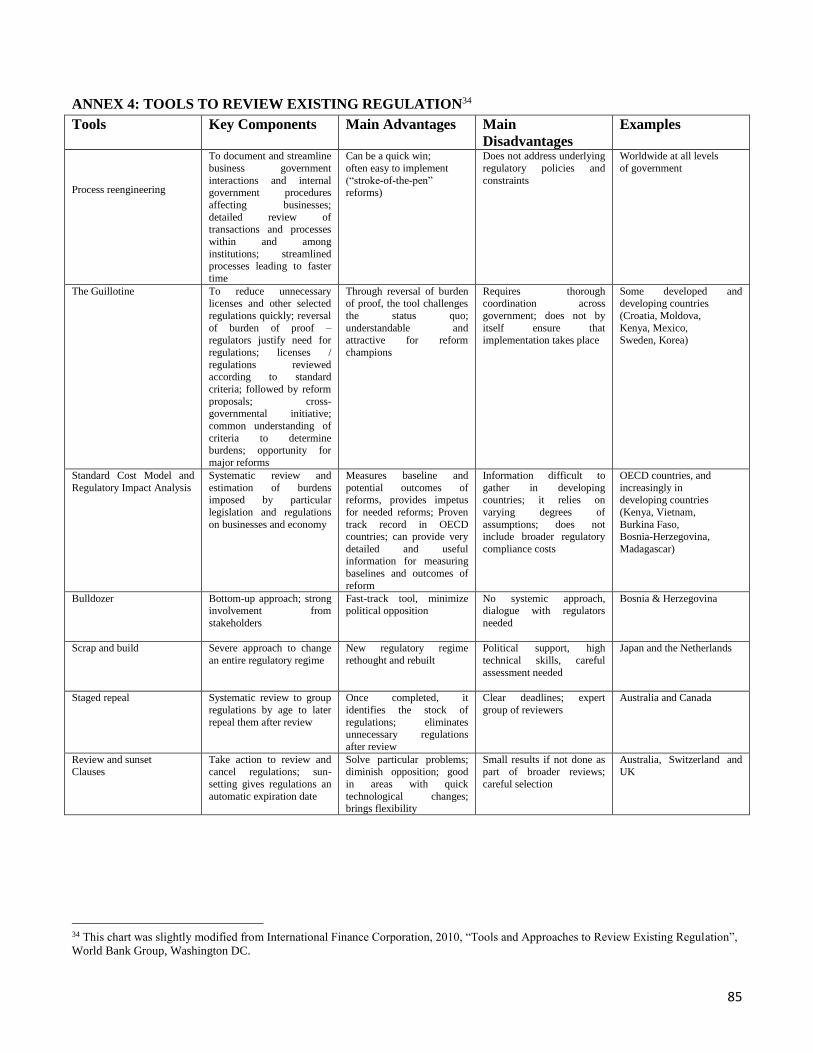
85
ANNEX 4: TOOLS TO REVIEW EXISTING REGULATION34
Tools Key Components Main Advantages Main
Disadvantages
Examples
Process reengineering
To document and streamline
business government
interactions and internal government procedures
affecting businesses;
detailed review of transactions and processes
within and among
institutions; streamlined processes leading to faster
time
Can be a quick win;
often easy to implement
(“stroke-of-the-pen” reforms)
Does not address underlying
regulatory policies and
constraints
Worldwide at all levels
of government
The Guillotine To reduce unnecessary licenses and other selected
regulations quickly; reversal
of burden of proof – regulators justify need for
regulations; licenses /
regulations reviewed according to standard
criteria; followed by reform
proposals; cross-governmental initiative;
common understanding of
criteria to determine burdens; opportunity for
major reforms
Through reversal of burden of proof, the tool challenges
the status quo;
understandable and attractive for reform
champions
Requires thorough coordination across
government; does not by
itself ensure that implementation takes place
Some developed and developing countries
(Croatia, Moldova,
Kenya, Mexico, Sweden, Korea)
Standard Cost Model and
Regulatory Impact Analysis
Systematic review and
estimation of burdens imposed by particular
legislation and regulations
on businesses and economy
Measures baseline and
potential outcomes of reforms, provides impetus
for needed reforms; Proven
track record in OECD countries; can provide very
detailed and useful information for measuring
baselines and outcomes of
reform
Information difficult to
gather in developing countries; it relies on
varying degrees of
assumptions; does not include broader regulatory
compliance costs
OECD countries, and
increasingly in developing countries
(Kenya, Vietnam,
Burkina Faso, Bosnia-Herzegovina,
Madagascar)
Bulldozer
Bottom-up approach; strong involvement from
stakeholders
Fast-track tool, minimize political opposition
No systemic approach, dialogue with regulators
needed
Bosnia & Herzegovina
Scrap and build
Severe approach to change
an entire regulatory regime
New regulatory regime
rethought and rebuilt
Political support, high
technical skills, careful
assessment needed
Japan and the Netherlands
Staged repeal Systematic review to group
regulations by age to later
repeal them after review
Once completed, it
identifies the stock of
regulations; eliminates unnecessary regulations
after review
Clear deadlines; expert
group of reviewers
Australia and Canada
Review and sunset
Clauses
Take action to review and
cancel regulations; sun-
setting gives regulations an
automatic expiration date
Solve particular problems;
diminish opposition; good
in areas with quick
technological changes; brings flexibility
Small results if not done as
part of broader reviews;
careful selection
Australia, Switzerland and
UK
34 This chart was slightly modified from International Finance Corporation, 2010, “Tools and Approaches to Review Existing Regulation”,
World Bank Group, Washington DC.
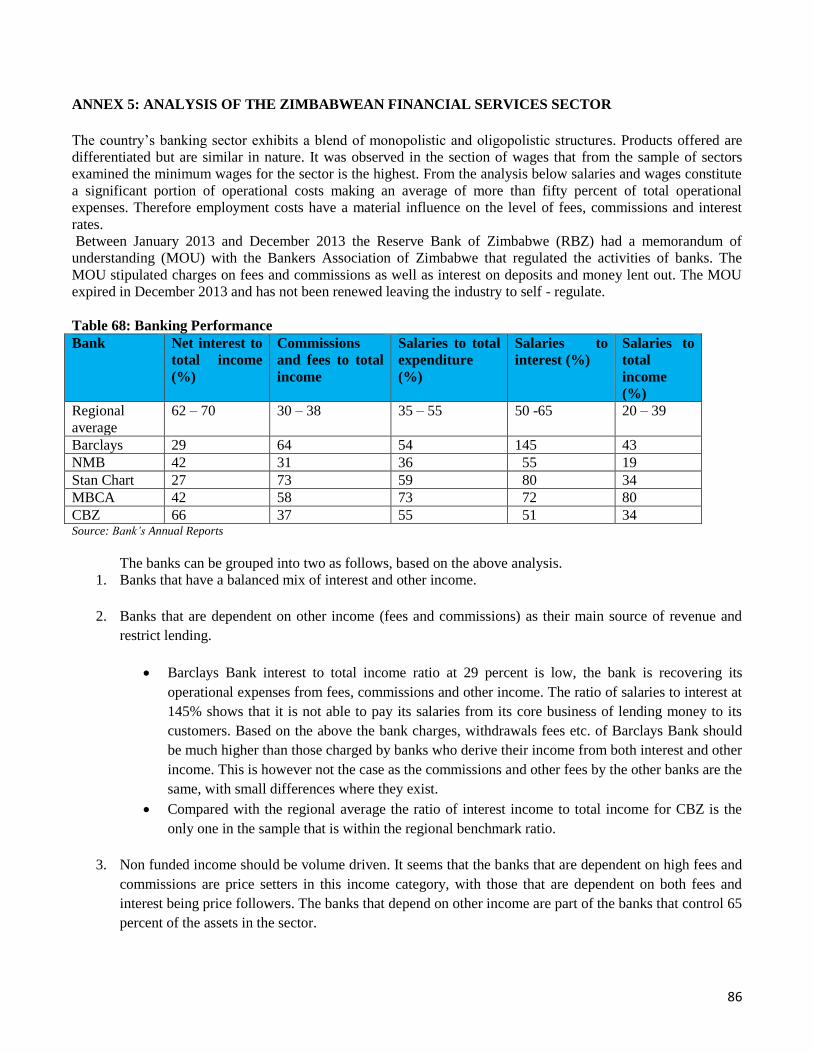
86
ANNEX 5: ANALYSIS OF THE ZIMBABWEAN FINANCIAL SERVICES SECTOR
The country’s banking sector exhibits a blend of monopolistic and oligopolistic structures. Products offered are
differentiated but are similar in nature. It was observed in the section of wages that from the sample of sectors
examined the minimum wages for the sector is the highest. From the analysis below salaries and wages constitute
a significant portion of operational costs making an average of more than fifty percent of total operational
expenses. Therefore employment costs have a material influence on the level of fees, commissions and interest
rates.
Between January 2013 and December 2013 the Reserve Bank of Zimbabwe (RBZ) had a memorandum of
understanding (MOU) with the Bankers Association of Zimbabwe that regulated the activities of banks. The
MOU stipulated charges on fees and commissions as well as interest on deposits and money lent out. The MOU
expired in December 2013 and has not been renewed leaving the industry to self - regulate.
Table 68: Banking Performance
Bank Net interest to
total income
(%)
Commissions
and fees to total
income
Salaries to total
expenditure
(%)
Salaries to
interest (%)
Salaries to
total
income
(%)
Regional
average
62 – 70 30 – 38 35 – 55 50 -65 20 – 39
Barclays 29 64 54 145 43
NMB 42 31 36 55 19
Stan Chart 27 73 59 80 34
MBCA 42 58 73 72 80
CBZ 66 37 55 51 34 Source: Bank’s Annual Reports
The banks can be grouped into two as follows, based on the above analysis.
1. Banks that have a balanced mix of interest and other income.
2. Banks that are dependent on other income (fees and commissions) as their main source of revenue and
restrict lending.
Barclays Bank interest to total income ratio at 29 percent is low, the bank is recovering its
operational expenses from fees, commissions and other income. The ratio of salaries to interest at
145% shows that it is not able to pay its salaries from its core business of lending money to its
customers. Based on the above the bank charges, withdrawals fees etc. of Barclays Bank should
be much higher than those charged by banks who derive their income from both interest and other
income. This is however not the case as the commissions and other fees by the other banks are the
same, with small differences where they exist.
Compared with the regional average the ratio of interest income to total income for CBZ is the
only one in the sample that is within the regional benchmark ratio.
3. Non funded income should be volume driven. It seems that the banks that are dependent on high fees and
commissions are price setters in this income category, with those that are dependent on both fees and
interest being price followers. The banks that depend on other income are part of the banks that control 65
percent of the assets in the sector.

87
Table 69: Loans and Advances Deposit Ratio
Loans and Advances to Deposit
Ratio
Ratio of Deposits Held to Total
Country Deposits
Barclays 42 6.5
NMB 80 5
Standard Chartered 66 9.5
MBCA 54 4.2
CBZ 77 32
Industry Average 77 Source: Zimbabwe Banking Sector’s Competitive Landscape (2013)
It is widely publicized that bank deposits are predominantly short term and do not allow for long term lending to
firms. Main players in the sector are competing for US$ 4.4 billion deposits, the level where deposits have
plateaued. According to Zimbabwe Banking Sector’s Competitive Landscape report of 2013, 5 top banks by
assets account for 65 % of sector assets at US$ 2.9 billion. Deposits are spread as follows:
Table 70: Deposit Ratio to Total Country
Bank
CBZ Banc Stanbic Stan
Chart
Barclays FBC NMB
Ratio (%) 31.58 9.75 9.75 9.25 6.5 7 5 Source: Banking Sector’s Competitive Landscape (2013)
According to the report foreign owned banks with the exception of Stanbic Bank have adopted a conservative
approach to lending and are dependent on other income to finance operational expenses.
Table 69 shows that Barclays at 42 % loan / advances to deposit ratio has a conservative lending policy, followed
by MBCA and Standard Chartered. The Standard Chartered ratio has been low and has increased to the 60 %
level.
Labor Costs
Labor costs constitute a significant portion of banking costs. The minimum wage level for the sector has been the
highest since dollarization and remains at this position. The role of the banking sector in the recovery of the
economy has been noted as problematic, with high uncompetitive interest rates. The lack of sufficient funds in the
banking sector that can be advanced to support economic activities is negatively affected by the general lack of
liquidity in the country and is understood as a sovereign related matter. These relate to the historical loss of
capital as a result of hyperinflation, low foreign direct investment and economic isolation by major international
lenders, the World Bank, IMF and other bilateral lenders. Notwithstanding the country risk, the cost of banking
services as reflected by both transaction costs (non - funded income) and interest rates are heavily weighed on by
the cost structure of banks.
Interest Costs - Cost build up
Foreign sourced funds
Average lenders cost 2 percent points
Country risk (average) 5 %
Local cost plus profit 12 %
Foreign costs average 7 %
88
Locally generated costs are materially higher than external costs that the sector has no control of. According to the
Bankers Association of Zimbabwe local pension funds require 7 percent interest rate per annum for their funds
placed with the banks. This is the same level covering foreign costs from off shore funds. Labor costs as shown
above are on average 55 % of operational costs. The sector and the rest of the economy have control over the
larger part of financing costs which has been singled out as one of the high costs negatively affecting the
country’s ability to compete.
The impact of non - performing loans on banking transaction costs could not be ascertained in this study due to
time constraints, however evidence points to that the banks that have taken a conservative lending view have a
low ratio of non- performing loans yet their bank charges are relatively high.
The smaller asset based banks tend to attract deposit funds by offering investment rates which are higher than
those offered by larger banks. Whilst investment rates are higher as the investment period increases the rates
offered by the smaller banks tend to be higher resulting in relatively higher lending rates to their clients. This
practice has the effect of exaggerating the level of interest rates thus inducing the default rate to service
borrowings.
Recommendations
1. The uniform charges of transaction costs are characteristic of a monopolized sector. It appears that
competition is by way of winning deposits from the market based on perception of confidence in a bank.
There is competition in winning deposit funds based on reputation and perceived risk. Services which
appear differentiated are intrinsically similar and there seems to be cartelization and price fixing by a few
dominant players who are price setters. It is therefore recommended that a study on the pricing model of
banking services is commissioned. It should also be observed that the broad recommendation for “internal
devaluation” is applicable to the sector and will help to bring down interest rates and other costs of
services.
2. It is also recommended that the Reserve Bank of Zimbabwe sets standards based on best practice to
measure critical ratios that will minimize off - loading inefficiencies on the economic.
89
ANNEX 6: LACK OF SCALE – THE ROLE OF THE AGRICULTURE SECTOR
Stakeholders consulted advised that one of the major factors negatively affecting costs and competitiveness of
firms was poor performance of the agricultural sector. Stakeholders are concerned that since 2000 when the land
reform program was implemented, the economy has continued to suffer from the adverse effects of the policy.
There is concern that efforts to revive the economy will not be optimal without restoring productivity in the sector
to at least the pre - 2000 threshold. There is a strong view that firms will not achieve economies of scale and
compete sustainably unless the performance of the sector is restored.
According to ZimTrade 60 percent of manufacturers are dependent on agriculture for raw materials or as a market
for inputs. Over 70 percent of the Zimbabwean population derive their livelihood and income from agriculture.
Also agriculture related employment supported a third of the labour force in formal employment.
There are strong linkages between agriculture, manufacturing, mining and commercial sectors. Whenever the
agricultural season was good, the performance of other sectors was correspondingly good, because of strong
forward and backwards linkages that exist between agriculture and other productive activities and commercial
services. The performance of the entire economy is heavily influenced by how the agricultural sector is
performing. Any positive developments in agriculture filter through the rest of the economy. “Linkages between
agriculture and manufacturing are particularly strong.” ( Zimtrade) Manufacturing processes many agricultural
outputs while also supplying agriculture with many of its input requirements.
This corroborated by FAO (2006) which states that the Zimbabwe’s economy relies heavily on the agriculture
sector. Agriculture contributes about 18 percent to its gross domestic product (GDP). Almost half the country’s
exports are derived from agriculture, especially cotton, tobacco and the horticultural crops. The major crops
grown in Zimbabwe are: maize, cotton, soybeans, wheat, tobacco and horticultural crops such as roses, cut
flowers and vegetables. Maize is the country’s staple crop.
The reliance of the economy is further buttressed by the FAO (1999) study which states that from 1980 to 1994,
agricultural output grew at about 1.4 percent per year, below the annual population growth rate of about 3 percent
for the same period. The economy grew by an average of 3.7 percent per year from 1980 to 1990, compared to 2.2
percent per year for agriculture. With the record drought of 1991/92, agricultural output fell by 5 and 18 percent
in 1991 and 1992, respectively, before recovering in 1993 and in 1994. The rest of the economy contracted by 5
percent in 1993 and grew by over 8 percent in 1994, an indication of the dependence of the general economy on
developments in the agriculture sector.
The Government of Zimbabwe has always recognized the role of agriculture as pivotal in setting direction in the
performance of the economy. The vision 1995 – 2020- recognizes this role as stated below and summarized in the
vision’s agricultural policy:
AGRICULTURE POLICY
The basic policy aim is to promote and sustain a viable agriculture sector. This entails developing and managing
resources through the provision of appropriate technical, administrative and advisory services. In this way the
agriculture sector can optimize productivity and contribute to the equitable and sustainable social and economic
development of Zimbabwe. Based on the assumption of good agricultural seasons with a possibility of at least one
drought season every four years, projections indicate the gross output of the sector growing at an annual average
rate of 5 percent. Thus, the sector will contribute over 21 percent to GDP in the short to medium term as the
economy undergoes structural transformation. This level of output will enable export earnings to increase the
current growth rate of 7 percent per year. The sector will remain one of the largest employers of labour.
In 1996, the government launched the Zimbabwe Agricultural Policy Framework, 1995-2020 (ZAPF), which
subjects the agriculture sector to the principles of financial and economic viability. A stable macro-economic
environment and public sector-financed supporting infrastructure are to facilitate private sector investment and so
90
achieve growth in agricultural output. The ZAPF recognizes that incomes generated in the smallholder sector and
related rural-based industry are important for eradicating poverty, hunger, malnutrition and underemployment. Its
main aims are:
-term increase in agricultural output which exceeds population growth;
infrastructure to cover all rural areas; and
More specifically, the objectives pertinent to fertilizer use are:
ich promote diversification into new varieties of crops and breeds
of livestock;
competitive and export oriented;
high value crops;
resettlement areas;
r farming sector;
utilization of improved inputs.
One precise target is the doubling of grain yields in the smallholder sector; another is to
increase its irrigated area from 10 000 to 50 000 ha. The ZAPF also stresses the importance of
access to credit facilities, highlighting the need:
dequate credit facilities are available for input supply;
A fertilizer strategy for Zimbabwe
The smallholder sector lies at the heart of future agricultural developments and input supply
is a basic determinant of future prospects.
Specific objectives on fertilizer supply highlight the fertilizer industry’s need:
production, cut costs and be competitive with imports;
meet the needs of a diverse market.
In order to achieve the planned increase in agricultural production, government, the private sector and other
stakeholders need to invest in agricultural infrastructure. Indeed, the main objective of the Agricultural Sector
Investment Programme (ASIP) is to enable the achievement of the policy goals in the effective utilization of
national resources. The ASIP targets are:
training facilities to cater for specialized aspects of
agriculture;
programmes that support and strengthen agricultural research and extension
services.
Source: Extract From Fertilizer Strategy For Zimbabwe (FAO, ACFD) 2006
According to the World Bank study, Growth Notes (2012) growth in the manufacturing sector appears to depend
more on the internal demand generated by the two main drivers of growth, namely agriculture and mining. The
quality of policy in the two sectors will be the chief determinant of the rate of growth of the Zimbabwean
91
economy in the medium term. Stronger policies in the two sectors will ultimately have positive downstream
effects on the manufacturing sector and services.
The study (WB 2012) notes that most of the old large commercial pre 2000 farms have been dismantled and the
existing large commercial ones are still battling recovery. The Zimbabwean agriculture has lost its leading role of
the past and from this perspective it has lost the opportunity to lead a potentially vigorous supply response to
recent higher international prices.
The land reform process negatively impacted accumulation of capital, productivity and incentives. The sector has
since the 2000 - 2004 been afflicted by severe droughts, quasi fiscal interventions, macro - economic collapse and
hyperinflation during 2005 – 2008.
The study (WB 2012) notes that the coincidental confluence of liberalization, dollarization and higher
international prices supported agricultural profitability and over 2009 – 2011 production responded vigorously to
the dramatically improved incentives. The dramatic improvements however, come amidst a strongly changed
agricultural structure, economic decay and persistent weakness of the overall economic climate and business
culture.
Agriculture Performance
Contribution to Gross Domestic Product (%) 1995 1996 1997 1998 1999 2009 2010 2011 2012 2013
14 18 21 19 22 16 16 16 14 10 ZimStats RBZ
Contribution to Exports (%) 1995 1996 1997 1998 1999 2009 2010 2011 2012 2013
33 37 37 42 44 26 16 20 24 25 ZimStats RBZ
Challenges Facing Agriculture
Low production due lack of capital and suitably structured credit funding
Land tenure insecurity which affects long term funding and collateral
Farmers’ reluctance to improve and maintain or repair infrastructure due uncertain future.
Lack of skill amongst new farmers
Limited lines of credit
Inadequate investment in the rehabilitation and development of irrigation systems to mitigate against
droughts
Limited use of modern technology amongst new farmers
Inadequate national budgetary allocations
GMB delays in paying farmers
Unreliable power supplies and high utility charges and levies. This has affected winter cropping
Lack of regulatory framework and policy on contract farming which makes farmers junior partners in the
arrangements
Uncertain weather pattern
Volatile international commodity prices
Inadequate advisory services
92
Other Indicators of Poor Agricultural Performance
Regional Comparison of Production Costs
Country Barley (US$ /ha) Maize (US$/ha) Sorghum(US$/ ha)
Zimbabwe 1 514 817 813
South Africa 1 489 634 608
Zambia 1 746 645 619 Source: Delta Limited
Zimbabwe is the most expensive with the exception for barley where Zambia is the most expensive.
Regional Price Comparison (US$ per Ton)
Country Barley Maize Sorghum
Zimbabwe 450 390 390
South Africa 298 210 (non GMO) 259
Zambia 469 220 220 Source: Delta Limited
Zimbabwe is the highest priced except for barley in Zambia.
Yield per hector
Small scale versus large scale producers Tons / ha
Crop Large Scale Producer Small Scale Producer
Maize 5 .89
Tobacco 3 0.500 – 1.2 Source: ZFC
Comparison with past Achievement
Cereal Yield per Hector – Zimbabwe (kgs per hectare)
Year 1999 2000 2010
Yield 1 625.4 1 404.5 751.5 Source: World Bank Indicators – Zimbabwe Agricultural Production (2013)
Land Under Cereal Production (Hectors in Zimbabwe)
Year 1990 2000 2010
Hectors 1 556 058 1 793 790 1 901 777 Source: World Bank Indicators – Zimbabwe Agricultural Production (2013)
Output in cereal production has been enhanced by of use of more land as yields have remained subdued. This is as
a result of the challenges facing new farmers, especially access to fertilizers, its poor application where accessed
and inadequate advisory services.
The yields per hector has been on a decline since the land reform program was instituted.
Comparison Maize Production 2013 Season (tons)

93
Country Output Surplus (deficit)
Zimbabwe 1.3 million (.500)
South Africa 13.5 million 1.3 million
Zambia 3.5 million .500
Mozambique 1.6 million .300 Source: CFU
Zimbabwe is the only country that has a deficit for maize national requirements. Whilst most rural households
have sufficient food to last until the next season certain sections of the country experienced an intra - season dry
spell which affected yields. The needs for commercial use towards stock feed manufacturing and other
commercial activities are not enough and may lead to imports of grain before the next season.
Since the change of land ownership and control in 2000 the world has dramatically changed. The emerging new
economic powers China and India have taken over as the main consumers of raw materials. More important to the
Zimbabwean agricultural sector in the circumstance of historical loss of capital, skills, technology and a viable
local market, the sector faces dramatic adverse weather changes. Below is an extract from TERRAFRICA –
Regional Sustainable Land Management report which was done for Comprehensive Africa Development
Programme.
Global warming increasingly altering weather patterns
The historical climate record for Africa shows warming of approximately 0.7 degrees Celsius over most of the
continent during the 20th century, a decrease in precipitation over large portions of the Sahel and an increase in
precipitation in east Africa (Desanker 2002). Droughts and floods have increased in frequency and severity across
all of Africa, but particularly in the South and East.
These warming trends and changes in precipitation patterns are expected to increase more rapidly and will be
accompanied by a rise in sea level and increase in the frequency of extreme weather events such as droughts,
floods (Desanker 2002) and storms.
A study on the specific impacts of climate change on agriculture in developing countries showed that in
aggregate, African countries will be let worse off. Indeed, the study noted that areas that were currently marginal
could find themselves unsuitable for agriculture in the future (FAO 2007a).
Source: Comprehensive Africa Development Program
The agriculture sector therefore faces both exogenous and endogenous factors.
Exogenous Factors
The main factor is the unpredictability in the weather patterns, as observed above the trend is a negative one
characterized by a high frequency of droughts and as experienced in the 2013 rain season a dry spell in the middle
of a season that started with a promise of a good rainy season. Lack of foreign capital in the sector
Endogenous Factors
These are given under challenges facing the sector and have to do with Zimbabwe’s internal matters, e.g. policy,
labor laws, general performance of the economy, skills and management e.t.c
These are internal weaknesses that can be overcome through policy.
Conclusion and Recommendations
94
Policy makers should evaluate the state of agriculture realistically and contextually under the prevailing
exogenous and endogenous factors and formulate contextual strategies.
Evaluate current performance under the four land controlling categories; namely Communal, resettled farmers
under A1 and A2 scheme, Contract farming arrangement and to formulate a policy and guiding principles.
Evaluate the role and status of ARDA Estates and the Cold Storage Commission with a view to re – position them
towards productivity.
Government should evaluate the rise of dualism in agriculture. The pre – independence era dualism consisted of
rural farmers who were allocated low yielding agricultural land while the minority white farmers were allocated
most of the fertile land, the rising dualism consists of new farmers who are performing as employees in the cities
and are part time farmers. This has a double impact where it involves senior civil servants as there is a natural
inclination to use state resources to support a private venture which may be paying better. Also there is divided
attention as employees may be spending time at work but attending to personal business using state infrastructure.
There is a need for transparency in contract farming under both cropping and livestock. New farmers think they
are being taken as junior partners and are overcharged for inputs by financiers. Lack of transparency was also
raised by fertilizer manufacturers who stated that the tender system by contracting merchants is not transparent
and is tailored to support imports.
Policy makers are recommended to commission a study whose terms of reference will be to come up with a
strategy that will re – structure the sector so that possession and control meets the requirements of various non -
governmental agencies and to allow private sector participation. In particular a PPP arrangement with ARDA and
the Cold Storage Commission would go a long way to entice private sector participation. The restructuring of the
ARDA and CSC debts and management would be imperative to facilitate PPP.
Government should provide budgetary support to institutions supporting agriculture. Of note is the fertilizer
industry which is in dire need of support and an essential element in the robust performance of the sector.
Government should make budgetary allocations agricultural research institutes.
Cost Reduction Initiatives
Introduction of subsidies on inputs in fertilizer production ( See case study fertilizer manufacturing)
Elimination of ZINWA water charges to farmers to encourage winter farming
Preferential electricity charges for agriculture
Deliberate strategy to increase yields through support schemes such as agricultural extension services and
training of farmers.
Availability of structured long term finance for re – capitalization and rehabilitation of irrigation
infrastructure.
Grain marketing Board to remain as buyer of last resort and allow market forces to operate efficiently.
Re – establish Zimbabwe Commodity Exchange (ZIMACE)
Government should improve the extension support services to improve yields on farms and livestock
breeding and management.
Government should set up team that will continuously investigate the integration of Zimbabwean
agricultural sector with such agencies as the Bill Gates Foundation, European Development Fund (EDF),
The Global Environment Facility (GEF), Alliance for Green Revolution in Africa (AGRA) and Food
Agricultural Organization (FAO), NORAD, NEPAD and other agencies so as to benefit from their
programs.
The government should come up with a mechanism to deal with the emerging dualism of part time
farmers. Conveniently overlooking the realities can only prolong the recovery of the sector with its
negative effects on the general economy.
95
The government should whilst supporting the evolving capabilities of the new farmers towards improving
productivity build a critical mass that safeguards the general interests of the economy. Capital, skills, technology
should be re – grouped through public – private – participation through ARDA, and CSC and other initiatives.
Some stakeholders consulted suggested that emerging farmers that were allocated farms that were part of large
scale farming could be grouped to operate as one farm sharing resources and infrastructure. This should reduce
the re – capitalization requirements and improve productivity on the farms.
It is doubtful that the new farmers can manage the risk of frequent weather changes and volatile international
market prices. Attracting capital and skills is particularly important in view of the economic circumstances that
the general economy needs to overcome. Contract farming seems to be a practice of convenience that is seasonal,
financiers could be encouraged to take a long term view through joint ventures or formation of private companies
which are equity funded. This should result in a more permanent and sustainable practice.
Zimbabwe should review The Agriculture Policy Framework which was launched in 1996 as part of vision 1995
– 2020. This should contextualize the policy and strategy based on existing realities.
96
ANNEX 7: LACK OF CHANGE
Zimbabwe has been saddled with the change problem since dollarization. Retailers have been offering consumers
credit notes, tokens, bubble gums, sweets, ball point pens and other low denominated goods to settle small
change. Certain products are sold at prices which are rounded up to a convenient possible level of change. Whilst
this does not directly affect competitiveness it negatively affects pricing efficiency, mostly making goods more
expensive than they should be. The practice as prevailing supresses demand and skews distribution of household
incomes. Whilst this has been lessened by South African coins in circulation, the problem however, remains
largely not addressed.
The impact on the lack of change and its negative effect on efficient allocation of resources and its impact on
capacity utilization should be understood as measured by the number of transactions per day countrywide
multiplied by time. This represents a large number of transactions involving a lot of money which is being
misallocated and distorts the pricing of goods and services. Normally firms cost their products accurately which
should be encouraged.
The Bankers Association of Zimbabwe made a proposal in 2012 for the country to mint its own coins for change.
According to the proposal, the coins were to be exchanged on a dollar per dollar basis; enabling people to redeem
coins for notes should they accumulate large quantities of coins.
The idea of importing coins from the United States of America was abandoned after it proved that the exercise
would be expensive and is not a viable option. According to the Bankers Association of Zimbabwe it is estimated
that 1 400 tons of coins would have to be imported. Importing of United States bank notes is already costly
affecting competitiveness as evidenced by high bank charges on cash withdrawal from banks. The cost of insuring
and transporting cash from outside Zimbabwe is costly and the prevailing bank charges discourage banking.
In a modern economy coins are required for the purpose of efficient small value transactions. Banks do not get
much benefit from it, but is an imperative service to the transacting public. The issuance of coins is only
profitable to the issuing bank, the central bank. It is generally said that coins make 13% of a nation’s currency,
about 1.5 - 2% of Gross Domestic Product (GDP) and based on GDP of about 11 billion United States Dollars this
should be about 200 million US dollars.
In the circumstance of Zimbabwe, there are options that can be adopted:
Ascertain small denominators of the abandoned Zimbabwean Dollars held at the Reserve Bank of
Zimbabwe and introduce the required amount at an exchange rate of US$ 1 for Zim $1. This is the
cheaper route as the money is already held in the country and there are no costs to be incurred.
Mint new coins
Mint new coins and print new notes of lower values.
The last two options are costly and would be unnecessary expenses if there are sufficient quantities held at the
Reserve Bank. The use of coins and notes held would bring a windfall to those who are holding onto the disused
currency. The windfall which would be a stimulus would be of little significance but would help to ignite
economic activity. The introduction of the local dollars would enhance the relevance of the Reserve Bank which
is currently curtailed by undercapitalization. The adoption and implementation of corrective measures
97
recommended together with this recommendation would constitute a package of measures to stimulate the
economy, redirect consumer spending to be more efficient, improve capacity utilization and contribute to reducing
unit cost of products. The local dollars would give guarantee of a certain degree of trading in the economy that is
not subjected to the inadequacies of other currencies.
Panama which is the largest dollarized economy and has been under this regime for over seventy years has its
local dollars to facilitate the transacting of small value products. The key requirement is that the local dollars
should be easily exchangeable to other currencies when need arise as when one has accumulated too many coins.
It is therefore recommended that the RBZ evaluates the amount of lower denominated coins and notes ( US$5 and
below) that is held at the bank to be introduced into circulation.

98
ANNEX 8: PRACTICE IN DETERMINING NATIONAL EMPLOYMENT COUNCIL WAGES
The Labour Act provides for the formation of the Employment Councils (Part VIII), whose major role is to assist
in the negotiation of acceptable Collective Bargaining Agreements (CBA) for an Industrial sector and also ensures
that the CBA negotiated at that level is adhered to within the industry or sector it covers.
Section 25A of the same Act provides for the formation of the Works Council, which is a joint body made up of
an equal number of representatives of the Workers Committee and of management. The Works Council’s function
is to focus on best possible use of resources, foster good industrial relations, promote common interest and
promote participation by employees at the workplace/firm.
The Works Council is intended for internal communication to deal with matters specific to that company. It is not
a forum for sector-wide issues.
Obviously, it is at Works Council that issues pertaining to a particular firm are well understood and articulated,
unlike at Employment Council level. The current situation in the country is whereby the NEC determines salary
levels for all firms in that particular sector and those firms who cannot afford the salary scales have to apply for
exemption with the NEC Exemption Committee. The application can be successful or turned down.
The Employment Council is formed when a registered employers’ organization and the registered trade union get
together, agree on a constitution and apply to the Minister to have an employment council formed.
It is at employment council wage negotiations that, the Union uses the PDL as an argument point. The PDL is
now being misconstrued to be a minimum wage reflector. In Zimbabwe the PDL is computed on the assumption
of a family of 5 i.e,2 working adults and 3 dependent children. This therefore means that what is misconstrued as
the PDL determined minimum wage must be divided by two to have a realistic implication on both, the firm and
individuals working.
However in recent observations, in wage determination the courts are also in sync with reality in adjudicating
wage deadlocks as shown in the now famous Chamber of Mines Vs Mining Union judgment where the learned
Judge cited inflation and the need for the firm’s continuity in business than to allow a huge wage increase that
will close down the enterprise.
Basically the PDL issue is clouding wage negotiation issues of importance. These are productivity and capacity
utilization. These are determinants of the firm’s ability to pay and need a thorough examination. These affect the
firm’s output and its competitiveness in the market place. Again these arguments come along with the need to
educate employees from shop floor about factors affecting the firm’s success, financial position, market
dynamics, and its ability to pay wages. Above all a good level of honesty is also needed from employers in paying
more when the firm does well and also employees taking the brunt when the firm performs badly.
All these issues cannot be addressed at employment council level but at firm level through the works council. It is
at this level that the employees and management of a particular firm can negotiate a realistic wage and that should
be binding on terms and conditions agreed at a works council. The Act should empower the Works Council and
do away with employment councils. The Labour Ministry as has been the case before, will monitor the adherence
to these workplace agreements and not at an extra cost to both the employer and employees. These parties are
currently paying government taxes, employers organization dues, union dues and employment council dues.
Employment councils are not compatible with prevailing situation in the country.
Stakeholders view the structure of employment councils as being too broad. Large scale companies are grouped
with small operators. For example the in the commercial sector, covering the retail sector, companies on the stock
exchange, OK Stores, Edgars, TM Supermakets, and Truworths have to agree wages which bind a one employee

99
shop. In mining large scale mining CBAs bind a small scale miner. In the bakeries sector a small bakery is bound
by the CBA as a small bakery. The classification as it stands now is broad and should be re- structured to reflect
level of capital, sales, number of employees and other relevant criteria to define the size of a firm. It will be easier
for firms of the same size to define affordable levels of pay.

100
ANNEX 9: LIST OF STAKEHOLDERS INTERVIEWED
NAME ORGANISATION & POSITION
1. Executive Committee Confederation of Zimbabwe Industries Harare
2. Mr. K Chikonzo Zimbabwe National Chamber of Commerce President
3. Mrs Malaba Delta Supply Chains Manager
4. Mr T. Ndebele Truworths Limited Chief Executive Officer
5. Dr. R Dafana Zimbabwe Fertilizer Company Managing Director 6. Mr R. Gurira Zimbabwe Fertilizer Company, Technical Services Manager
7. Mr L. Zembe
8. Mrs C. Malaba Delta Southern Region General Manager
9. Mr. N. Ndudzo Industrial Development Corporation General Manager & Group Chief Executive Officer
10. Mr. P. Kuipa Zimbabwe Farmers Union Chief Economist
11. Mr J. Chigwende Chemplex Financial Director
12. Mr E. Ndlovu National Income and Pricing Commission Chief Executive Officer
13. Mr. J Musariri Shipping and forwarding Agents Association of Zimbabwe Chief Executive Officer
14. Mr. K Kaseke Zimbabwe Tourism Authority Chief Executive Officer
15. Zimbabwe Energy Regulatory Authority
16. Mr. G. Mudimu Zim ACP
17. Mr Mbaiwa Zimbabwe Investment Authority Chief Executive Officer
18. Dr J. Kanyekanye Allied Timbers holdings Limited Chief Executive Officer
20. Mr. N. Chinogaramombe Cold Storage Commission Chief Executive Officer
21. Executive Committee Zimbabwe National Chamber of Commerce Bulawayo
22. Mr L. Robby Transport Operators Association Chief Executive Officer
23. Mr Chiradza , Mr Kuzvinzwa and Mr
Mapfeka
Zimbabwe Revenue Authority Commissioners for Domestic Taxes and Customs, and Operations
Manager
24. Executive Committee Confederation of Zimbabwe Industries Bulawayo
25. Mr S. Abel and Mr C. Mphambela Bankers Association of Zimbabwe
26. Mr. I. Sheasby Pretoria Portland Cement Zimbabwe Finance Director
27. Mr J. Murehwa
Sable Chemicals Limited Chief Executive Officer
28. Mr. T. A, Mashingaidze ZimPhos General Manager
29. Mr Rundogo Windmill
30. Mr. Sabure and Mr Matiza Reserve Bank of Zimbabwe
31. Ms H. Mutsekwa, Mr P Chaibva, Ms R.
Panevanhu, and Mr Munyaradzi
Postal and Telecommunications Regulatory Authority of Zimbabwe , Department of Economics
and Tariffs
32. Mr Seedwell Hove World Bank Economist
33. Vimbai Mushongera Zimbabwe Congress of Trade Unions Parliamentary Affairs And Advocacy Officer
34. Dr G Kanyenze Labour and Economic Development Research Institute f Zimbabwe (LEDRIZ)
35. Mr L. A. Mukwada National Railways of Zimbabwe Director (Technical Services)and Acting General Manager
37. T Ngwenya Zimbabwe Energy Regulatory Authority
38. Mr. Mandiziba Zimbabwe National Water Authority, Assistant to the Chief Executive Officer
39. Mr K. Kaseke Zimbabwe Tourism Authority