cost-effectiveness analysis november 2002 aude lenders, cesse – ulb
Post on 19-Dec-2015
217 views
TRANSCRIPT

Cost-effectiveness analysis
November 2002
Aude Lenders, CESSE – ULB

November 26th, 2002 2
Cost-Effectiveness Analysis
1. Introduction2. Results
a) Presentationb) Benefit indicatorsc) Short-term versus long-termd) Cost variationse) Effectiveness variations
3. Conclusions

November 26th, 2002 3
1. IntroductionCost-effectiveness analysis spreadsheet:• Inputs:
– Population exposure per scenario (« Instantaneous benefit ») as an output from EURANO or from the Extrapolation module.
– Programme : set of noise reduction measures (=scenario) + implementation schedule (within a 10-years period).
– Parameters : lifetime, costs, discount rates

November 26th, 2002 4
• Outputs: – Net Present value of the Benefits = Number of
persons who have gained a noise reduction thanks to the measures applied. [Persons*years] “Effectiveness”
• People exposed to noise above 60dB(A)
• Annoyed people
• Weighted people ( factor)– Net Present Value of the Costs in Euros– Efficiency = Present Benefits / Present Costs

November 26th, 2002 5
Benefit FunctionPB = Net Present Value of
Benefits of each measure+ Interactions between measures
For each year of the modeled periodInterpolation of EURANO output: evolution
of the benefits when supplementary units of the measure are implemented.

November 26th, 2002 6
Cost FunctionPC = Net Present Value of
Investment
years 1 to 10+Maintenance
during lifetime of the measure +Removal
at the end of the lifetime

November 26th, 2002 7
2. Results21 European countries, PC/PB
0
50
100
150
200
250
0 10000 20000 30000 40000 50000 60000 70000 80000 90000
Mill
ion
s
MillionsCosts [€]
Be
ne
f [re
d p
ers
>6
0
dB
*ye
ars
]
freight -10 dB k-blocks grindingtuned absorbers 2m barriers max. 4 m barriersK-Bl. Opt. Wh. Tuned abs k-bl, tuned abs. k-bl, 2 m barriergrinding, 2 m barrier k-bl, opt.wh, tun.abs, 2 m
Costs without windows insulation
Best efficiency
Worst efficiency
14’0
00’0
00
Pers
ons
> 60
dB
700’
000

November 26th, 2002 8
b) Two indicators for the benefits : same results
Extrapolation to 21 European countries, PC/PB (people>60dB)
0
50.000
100.000
150.000
200.000
250.000
€ 0 € 20.000 € 40.000 € 60.000 € 80.000 € 100.000
Costs [Millions €]
Be
ne
fits
: R
ed
p
ers
on
s>
60
dB
[th
ou
sa
nd
pe
rso
ns
*ye
ars
]
Extrapolation to 21 European countries, PC/PB (annoyed people)
0
20.000
40.000
60.000
80.000
100.000
€ 0 € 20.000 € 40.000 € 60.000 € 80.000 € 100.000
Costs [Millions €]
Be
ne
fits
: a
nn
oy
ed
pe
rso
ns
[t
ho
us
an
d p
ers
on
s*y
ea
rs]
Same results for different indicators
November 26th, 2002 9
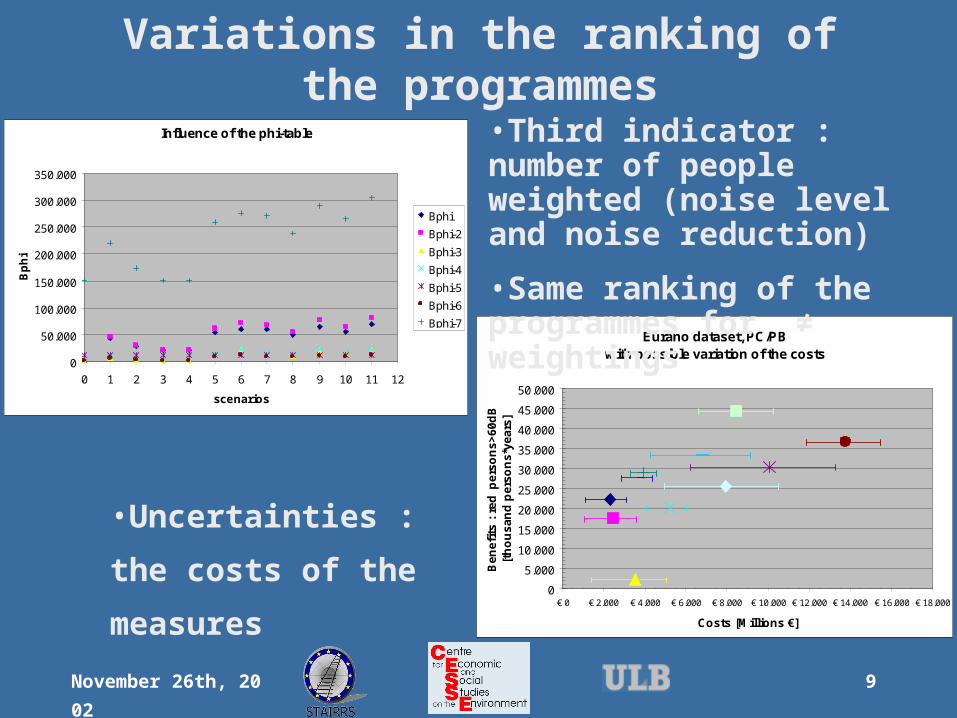
Variations in the ranking of the programmes
Eurano dataset, PC/PBwith possible variation of the costs
0
5.000
10.000
15.000
20.000
25.000
30.000
35.000
40.000
45.000
50.000
€ 0 € 2.000 € 4.000 € 6.000 € 8.000 € 10.000 € 12.000 € 14.000 € 16.000 € 18.000
Costs [Millions €]
Be
ne
fits
: r
ed
pe
rso
ns
>6
0d
B[t
ho
us
an
d p
ers
on
s*y
ea
rs]
Influence of the phi-table
0
50.000
100.000
150.000
200.000
250.000
300.000
350.000
0 1 2 3 4 5 6 7 8 9 10 11 12
scenarios
Bp
hi
Bphi
Bphi-2
Bphi-3
Bphi-4
Bphi-5
Bphi-6
Bphi-7
•Third indicator : number of people weighted (noise level and noise reduction)
•Same ranking of the programmes for ≠ weightings
•Uncertainties : the costs of
the measures

November 26th, 2002 10
Extrapolation to Finland, PC/PB (Short-term approach)
0
200
400
600
800
1.000
1.200
1.400
1.600
1.800
€ 0 € 100 € 200 € 300 € 400 € 500 € 600 € 700 € 800
Costs [Millions €]
Be
ne
fits
: R
ed
p
ers
on
s>
60
dB
[th
ou
sa
nd
pe
rso
ns
*ye
ars
]
Extrapolation to Finland, PPC/PPB (Long-term approach)
0200400600800
1.0001.2001.4001.6001.8002.000
€ 0 € 200 € 400 € 600 € 800 € 1.000 € 1.200
Costs [Millions €]
Be
ne
fits
: R
ed
pe
rso
ns
>6
0d
B
[th
ou
sa
nd
pe
rso
ns
*ye
ars
]
c) Two different approaches

November 26th, 2002 11
d) Costs variation
according to the
number of freight
wagons (-25%)
Extrapolation to Belgium (13'952 wagons), PC/PB
0
2.000
4.000
6.000
8.000
10.000
12.000
€ 0 € 500 € 1.000 € 1.500 € 2.000 € 2.500
Costs [Millions €]
Be
ne
fits
: R
ed
p
ers
on
s>
60
dB
[th
ou
sa
nd
pe
rso
ns
*ye
ars
]
Extrapolation to Belgium (18'632 wagons), PC/PB
0
2.000
4.000
6.000
8.000
10.000
12.000
€ 0 € 500 € 1.000 € 1.500 € 2.000 € 2.500
Costs [Millions €]
Be
ne
fits
: R
ed
p
ers
on
s>
60
dB
[th
ou
sa
nd
pe
rso
ns
*ye
ars
]

November 26th, 2002 12
d) Variation
according to the
ratio “number of
wagons/ km urban
areas”
Extrapolation to Denmark, PC/PB
0
500
1.000
1.500
2.000
2.500
3.000
3.500
4.000
€ 0 € 200 € 400 € 600 € 800 € 1.000 € 1.200 € 1.400
Costs [Millions €]
Be
ne
fits
: R
ed
pe
rso
ns
>6
0d
B[t
ho
us
an
d p
ers
on
s*y
ea
rs]
Extrapolation to France, PC/PB
0
2.000
4.000
6.000
8.000
10.000
12.000
€ 0 € 1.000 € 2.000 € 3.000 € 4.000 € 5.000
Costs [Millions €]
Be
ne
fits
: R
ed
pe
rso
ns
>6
0d
B[t
ho
us
an
d p
ers
on
s*y
ea
rs]

November 26th, 2002 13
e) Benefits variation:% freight trains & distribution of people
Extrapolation to Netherlands, PC/PB (Short-term approach)
0
2.000
4.000
6.000
8.000
10.000
12.000
14.000
€ 0 € 500 € 1.000 € 1.500 € 2.000 € 2.500 € 3.000
Costs [Millions €]
Ben
efits
: R
ed
per
son
s>60
dB
[th
ou
san
d p
erso
ns*
year
s]
Extrapolation to Sweden, PC/PB (Short-term approach)
0
1.000
2.000
3.000
4.000
5.000
€ 0 € 200 € 400 € 600 € 800 € 1.000 € 1.200 € 1.400 € 1.600
Costs [Millions €]
Be
ne
fits
: R
ed
p
ers
on
s>
60
dB
[th
ou
sa
nd
pe
rso
ns
*ye
ars
]

November 26th, 2002 14
Conclusions
• Despite these small variations, all the graphs have generally the same appearance the results seem reliable.
• Further study : – Other noise reducing measures – Other scenarios (combination of measures)