council improvement proposal - berrigan shire
TRANSCRIPT
1
Template 2
Council Improvement Proposal
(Existing structure)
2
Getting started . . .
Before you commence this template, please check the following:
You have chosen the correct template – only councils that have sufficient scale and capacity and who do not intend to merge or become a Rural Council should complete this template (Template 2)
You have obtained a copy of the guidance material for Template 2 and instructions for completing each question
You have completed the self-assessment of your current performance, using the tool provided
You have completed any supporting material and prepared attachments for your Proposal as PDF
documents. Please limit the number of attachments and ensure they are directly relevant to your proposal. Specific references to the relevant page and/or paragraph in the attachments should also be included.
Your Proposal has been endorsed by a resolution of your Council.
3
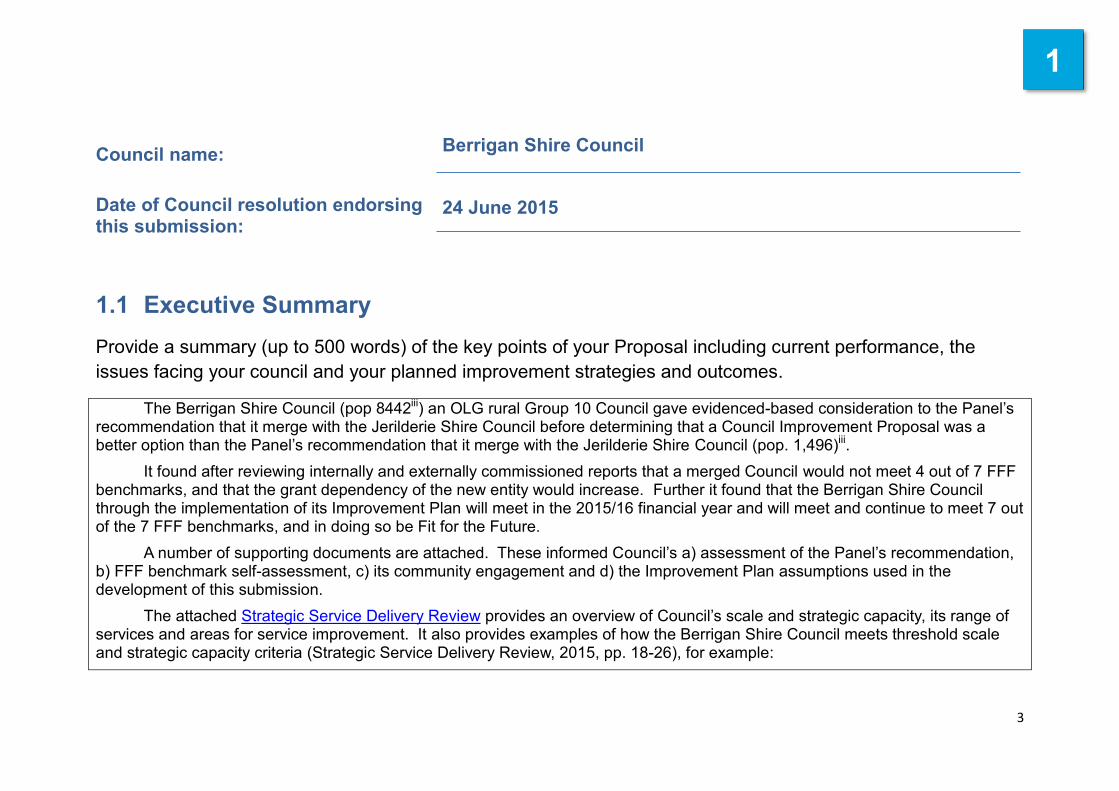
Council name: Berrigan Shire Council
Date of Council resolution endorsing this submission:
24 June 2015
1.1 Executive Summary Provide a summary (up to 500 words) of the key points of your Proposal including current performance, the issues facing your council and your planned improvement strategies and outcomes.
The Berrigan Shire Council (pop 8442iii) an OLG rural Group 10 Council gave evidenced-based consideration to the Panel’s recommendation that it merge with the Jerilderie Shire Council before determining that a Council Improvement Proposal was a better option than the Panel’s recommendation that it merge with the Jerilderie Shire Council (pop. 1,496)iii.
It found after reviewing internally and externally commissioned reports that a merged Council would not meet 4 out of 7 FFF benchmarks, and that the grant dependency of the new entity would increase. Further it found that the Berrigan Shire Council through the implementation of its Improvement Plan will meet in the 2015/16 financial year and will meet and continue to meet 7 out of the 7 FFF benchmarks, and in doing so be Fit for the Future.
A number of supporting documents are attached. These informed Council’s a) assessment of the Panel’s recommendation, b) FFF benchmark self-assessment, c) its community engagement and d) the Improvement Plan assumptions used in the development of this submission.
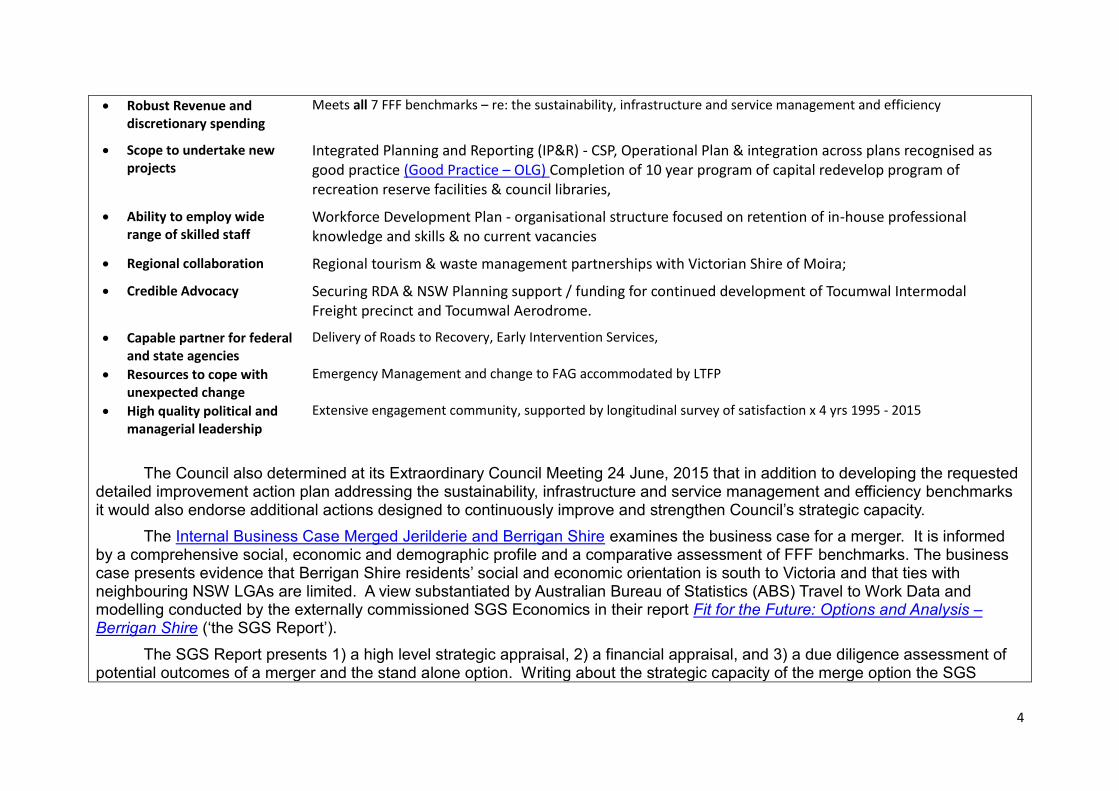
The attached Strategic Service Delivery Review provides an overview of Council’s scale and strategic capacity, its range of services and areas for service improvement. It also provides examples of how the Berrigan Shire Council meets threshold scale and strategic capacity criteria (Strategic Service Delivery Review, 2015, pp. 18-26), for example:
1
4
Robust Revenue and discretionary spending
Meets all 7 FFF benchmarks – re: the sustainability, infrastructure and service management and efficiency
Scope to undertake new projects
Integrated Planning and Reporting (IP&R) - CSP, Operational Plan & integration across plans recognised as good practice (Good Practice – OLG) Completion of 10 year program of capital redevelop program of recreation reserve facilities & council libraries,
Ability to employ wide range of skilled staff
Workforce Development Plan - organisational structure focused on retention of in-house professional knowledge and skills & no current vacancies
Regional collaboration Regional tourism & waste management partnerships with Victorian Shire of Moira;
Credible Advocacy Securing RDA & NSW Planning support / funding for continued development of Tocumwal Intermodal Freight precinct and Tocumwal Aerodrome.
Capable partner for federal and state agencies
Delivery of Roads to Recovery, Early Intervention Services,
Resources to cope with unexpected change
Emergency Management and change to FAG accommodated by LTFP
High quality political and managerial leadership
Extensive engagement community, supported by longitudinal survey of satisfaction x 4 yrs 1995 - 2015
The Council also determined at its Extraordinary Council Meeting 24 June, 2015 that in addition to developing the requested
detailed improvement action plan addressing the sustainability, infrastructure and service management and efficiency benchmarks it would also endorse additional actions designed to continuously improve and strengthen Council’s strategic capacity.
The Internal Business Case Merged Jerilderie and Berrigan Shire examines the business case for a merger. It is informed by a comprehensive social, economic and demographic profile and a comparative assessment of FFF benchmarks. The business case presents evidence that Berrigan Shire residents’ social and economic orientation is south to Victoria and that ties with neighbouring NSW LGAs are limited. A view substantiated by Australian Bureau of Statistics (ABS) Travel to Work Data and modelling conducted by the externally commissioned SGS Economics in their report Fit for the Future: Options and Analysis – Berrigan Shire (‘the SGS Report’).
The SGS Report presents 1) a high level strategic appraisal, 2) a financial appraisal, and 3) a due diligence assessment of potential outcomes of a merger and the stand alone option. Writing about the strategic capacity of the merge option the SGS

5
Report, in its strategic appraisal, notes that ‘an amalgamation would result in an area developing in quite opposite directions: one area with population growth and related increases in property values and the rate base, while the remainder would experience population decline and a weak or deteriorating rate base’ (SGS Economics and Planning, 2015, p. 2).
The SGS Report also notes that it commissioned an independent review of ‘the reasonableness of the key assumptions adopted in the long term financial planning of BSC, which has been prepared on a standalone basis stating that ‘At a global level, the global assumptions applied appear reasonable, and given that these assumptions hold true, it is likely that the performance against OLG financial benchmarks will improve in future (SGS Economics and Planning, 2015, p. 1). Financial modelling of potential merge savings ‘scenario 3’ the most likely scenario (SGS Economics and Planning, 2015, pp. 3-5) suggest that the savings over a 10-year period will be less than the savings realised from replacing the General Managers at Jerilderie and Berrigan Shire Council with one General Manager. This indicates that costs of delivering services may also increase. Further no consideration was given to modelling loss of strategic skills, knowledge and experience and its impact on the new organisation’s strategic capacity.
A formal program of consultation was also undertaken with our community. This program included Council’s 4-yearly community and business satisfaction survey (NEXUS Research Pty Ltd) questions about Council amalgamation. The full details of Council’s engagement program, the information provided to our community, survey questions and community feedback are included in Council’s FFF Community Engagement Report (15 June 2015).
Finally, Council’s improvement strategies and action plan have been formulated to improve Council’s performance against FFF benchmarks and in doing so contributes to a) positively to our system of local government and b) Berrigan Shire 2023 Strategic Outcomes. Section 5 of this Improvement plan maps FFF benchmarks and improvement plan strategies and actions to Council’s Strategic Planning Framework ensuring that Improvement Plan actions are embedded in Council’s integrated planning and Enterprise Risk Management Framework..
6
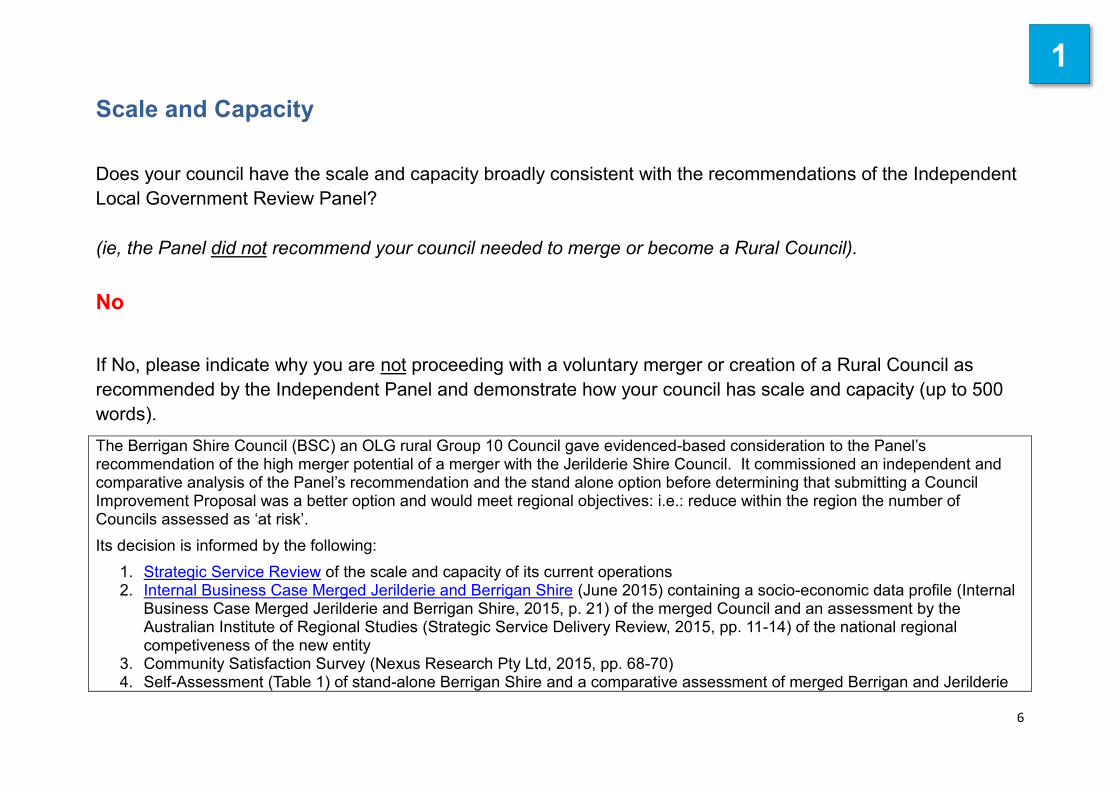
Scale and Capacity
Does your council have the scale and capacity broadly consistent with the recommendations of the Independent Local Government Review Panel? (ie, the Panel did not recommend your council needed to merge or become a Rural Council). No If No, please indicate why you are not proceeding with a voluntary merger or creation of a Rural Council as recommended by the Independent Panel and demonstrate how your council has scale and capacity (up to 500 words). The Berrigan Shire Council (BSC) an OLG rural Group 10 Council gave evidenced-based consideration to the Panel’s recommendation of the high merger potential of a merger with the Jerilderie Shire Council. It commissioned an independent and comparative analysis of the Panel’s recommendation and the stand alone option before determining that submitting a Council Improvement Proposal was a better option and would meet regional objectives: i.e.: reduce within the region the number of Councils assessed as ‘at risk’. Its decision is informed by the following:
1. Strategic Service Review of the scale and capacity of its current operations 2. Internal Business Case Merged Jerilderie and Berrigan Shire (June 2015) containing a socio-economic data profile (Internal
Business Case Merged Jerilderie and Berrigan Shire, 2015, p. 21) of the merged Council and an assessment by the Australian Institute of Regional Studies (Strategic Service Delivery Review, 2015, pp. 11-14) of the national regional competiveness of the new entity
3. Community Satisfaction Survey (Nexus Research Pty Ltd, 2015, pp. 68-70) 4. Self-Assessment (Table 1) of stand-alone Berrigan Shire and a comparative assessment of merged Berrigan and Jerilderie
1

7
Shire Councils against Fit for the Future Benchmarks (June 2015) using publicly available data. 5. The SGS Report Fit for the Future: Options and Analysis - Berrigan Shire which found the global assumptions applied
appear reasonable, and given that these assumptions hold true, it is likely that the performance against OLG financial benchmarks will improve in future (SGS Economics and Planning, 2015, p. 1).
6. FFF Community Engagement Report summarising community comment on Council’s position that ‘a merger will not strengthen our communities’ or meet ‘ NSW government regional objectives for the scale and capacity of NSW local government’iv
Table 1: Fit for the Future Benchmarks – Global LTFP Assumptions for BSC tested by (SGS Economics and Planning, 2015)
Fit for the Future Benchmarks Compared 2017/18 - 2019/20 Current BSC Stand Alone Merged Council* 13/14
RESULT MEETS FFTF BENCHMARK RESULT MEETS FFTF BENCHMARK
Operating Performance Ratio (greater or equal to break-even average over 3 years) 0.047 YES -0.080 NO x
Own Source Revenue Ratio (greater than 60% average over 3 years)exc. FAG 74.90% YES 71.57% YES
Building and Infrastructure Asset Renewal Ratio (greater than 100% average over 3
years) 103.39% YES 74.64% NO x
Infrastructure Backlog Ratio (less than 2%) 0.98% YES 1.46% YES
Asset Maintenance Ratio (greater than 100% average over 3 years) 102.05% YES 111.17% YES
Debt Service Ratio (greater than 0 and less than or equal to 20% average over 3 years)
1.45% YES 1.70% YES
A decrease in Real Operating Expenditure per capita over time Decreasing YES Increasing NO x
8
2. Your council’s current position
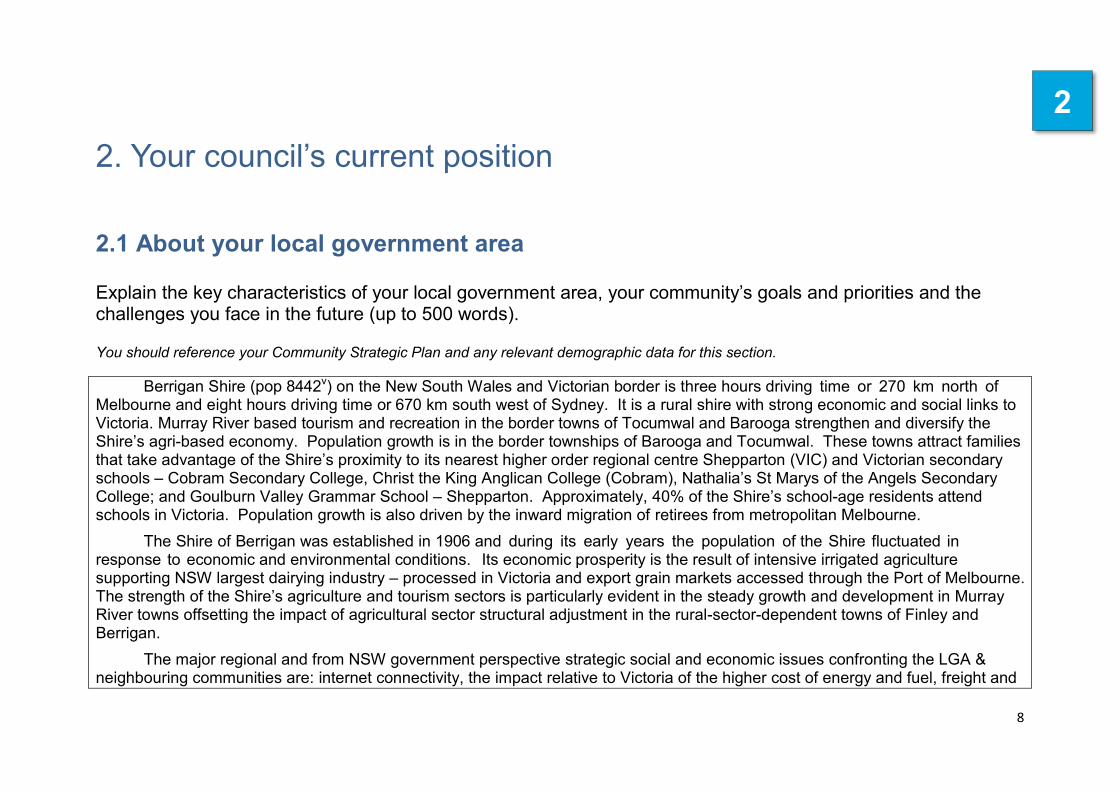
2.1 About your local government area Explain the key characteristics of your local government area, your community’s goals and priorities and the challenges you face in the future (up to 500 words). You should reference your Community Strategic Plan and any relevant demographic data for this section.
Berrigan Shire (pop 8442v) on the New South Wales and Victorian border is three hours driving time or 270 km north of Melbourne and eight hours driving time or 670 km south west of Sydney. It is a rural shire with strong economic and social links to Victoria. Murray River based tourism and recreation in the border towns of Tocumwal and Barooga strengthen and diversify the Shire’s agri-based economy. Population growth is in the border townships of Barooga and Tocumwal. These towns attract families that take advantage of the Shire’s proximity to its nearest higher order regional centre Shepparton (VIC) and Victorian secondary schools – Cobram Secondary College, Christ the King Anglican College (Cobram), Nathalia’s St Marys of the Angels Secondary College; and Goulburn Valley Grammar School – Shepparton. Approximately, 40% of the Shire’s school-age residents attend schools in Victoria. Population growth is also driven by the inward migration of retirees from metropolitan Melbourne.
The Shire of Berrigan was established in 1906 and during its early years the population of the Shire fluctuated in response to economic and environmental conditions. Its economic prosperity is the result of intensive irrigated agriculture supporting NSW largest dairying industry – processed in Victoria and export grain markets accessed through the Port of Melbourne. The strength of the Shire’s agriculture and tourism sectors is particularly evident in the steady growth and development in Murray River towns offsetting the impact of agricultural sector structural adjustment in the rural-sector-dependent towns of Finley and Berrigan.
The major regional and from NSW government perspective strategic social and economic issues confronting the LGA & neighbouring communities are: internet connectivity, the impact relative to Victoria of the higher cost of energy and fuel, freight and
2
9
transport infrastructure on the competiveness of Shire businesses and access to social support services: mental health, child care for young families and allied health services. These strategic issues are compounded by centralisation of freight and transport, health and social services planning, the location of energy and telecommunications network providers, broadband internet data shaping in rural areas, mobile network black spots and congestion during peak holiday periods. These strategic planning issues will for the foreseeable future impact on the economic competiveness of the Shire and the realization of its growth potential situated on a national highway on the NSW / Victorian Border.
Detailed social and economic profiling has been undertaken by BSC as part of the development of our communities’ Community Strategic Plan Berrigan Shire 2023 and the Council’s Liveability and Healthy Ageing Strategy a strategy which commissioned an economic assessment by the AEG Group – Economic Profile 2014 – 2031 of the economic benefits and likely impacts of the Shire’s ageing population on its future growth and development.
Council also has, in addition to its web-hosted subscription to profile id.data, developed detailed Health and Wellbeing profiles and a Disability Profile. These profiles capture and reference data at a cross-border, regional and local government area level and provide data to our communities and interested agencies in a format that is LGA and cross border specific. The need for this reflects the Shire’s location on the border, and the social and economic orientation of residents to Victoria. Census data, NSW Dept Planning Demographic Unit, Victorian Community Indicators data base, and Murrumbidgee Health Service data profiles informed the development of these profiles and are used by BSC to inform Council planning and the selection of strategies which contribute to the top 5 preferred futures of our communities that in 2023:
1.Families with young children will want to live in or come to the area. 2.People will be more concerned about their health and wellbeing. 3.Tourists will go out of their way to come to the area. 4.There will be more business owned and run by local people. 5.Transport connections between here and other places will be faster and or busier (Berrigan Shire 2023 p 13).
10
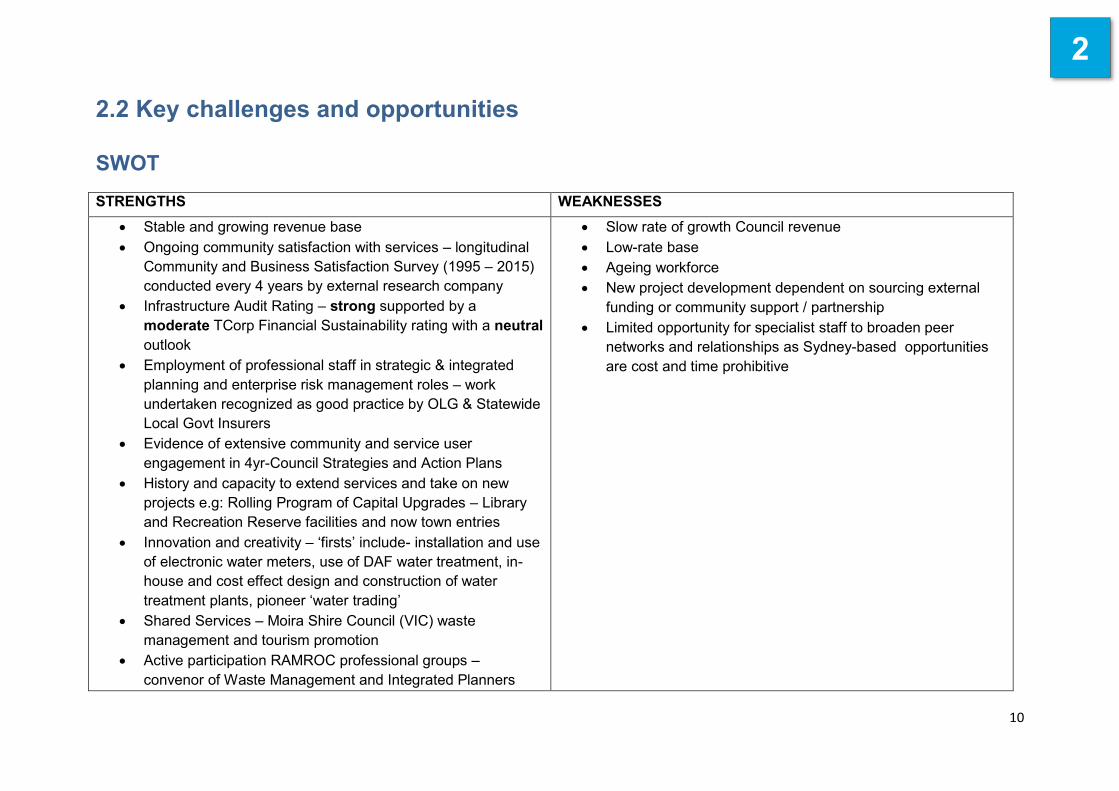
2.2 Key challenges and opportunities SWOT STRENGTHS WEAKNESSES
Stable and growing revenue base Ongoing community satisfaction with services – longitudinal
Community and Business Satisfaction Survey (1995 – 2015) conducted every 4 years by external research company
Infrastructure Audit Rating – strong supported by a moderate TCorp Financial Sustainability rating with a neutral outlook
Employment of professional staff in strategic & integrated planning and enterprise risk management roles – work undertaken recognized as good practice by OLG & Statewide Local Govt Insurers
Evidence of extensive community and service user engagement in 4yr-Council Strategies and Action Plans
History and capacity to extend services and take on new projects e.g: Rolling Program of Capital Upgrades – Library and Recreation Reserve facilities and now town entries
Innovation and creativity – ‘firsts’ include- installation and use of electronic water meters, use of DAF water treatment, in-house and cost effect design and construction of water treatment plants, pioneer ‘water trading’
Shared Services – Moira Shire Council (VIC) waste management and tourism promotion
Active participation RAMROC professional groups – convenor of Waste Management and Integrated Planners
Slow rate of growth Council revenue Low-rate base Ageing workforce New project development dependent on sourcing external
funding or community support / partnership Limited opportunity for specialist staff to broaden peer
networks and relationships as Sydney-based opportunities are cost and time prohibitive
2

11
STRENGTHS WEAKNESSES Group
History of active representation and evidence based submissions to State and Commonwealth Inquiries and funding bodies
Council diversity – reflects community demographic – age, disability and gender
Proximity to a capital city (Melb) and facilities – attractive to professionals wanting a work and life balance
Active promotion of economic diversity and evidence of rate base growth through industrial and aviation subdivision.
Availability of off-budget development funds S355 management of community facilities and reserve – cost
effective service delivery – and coproduced service delivery Local recognition of Councillors and their role – Community
Satisfaction Survey 2015
12
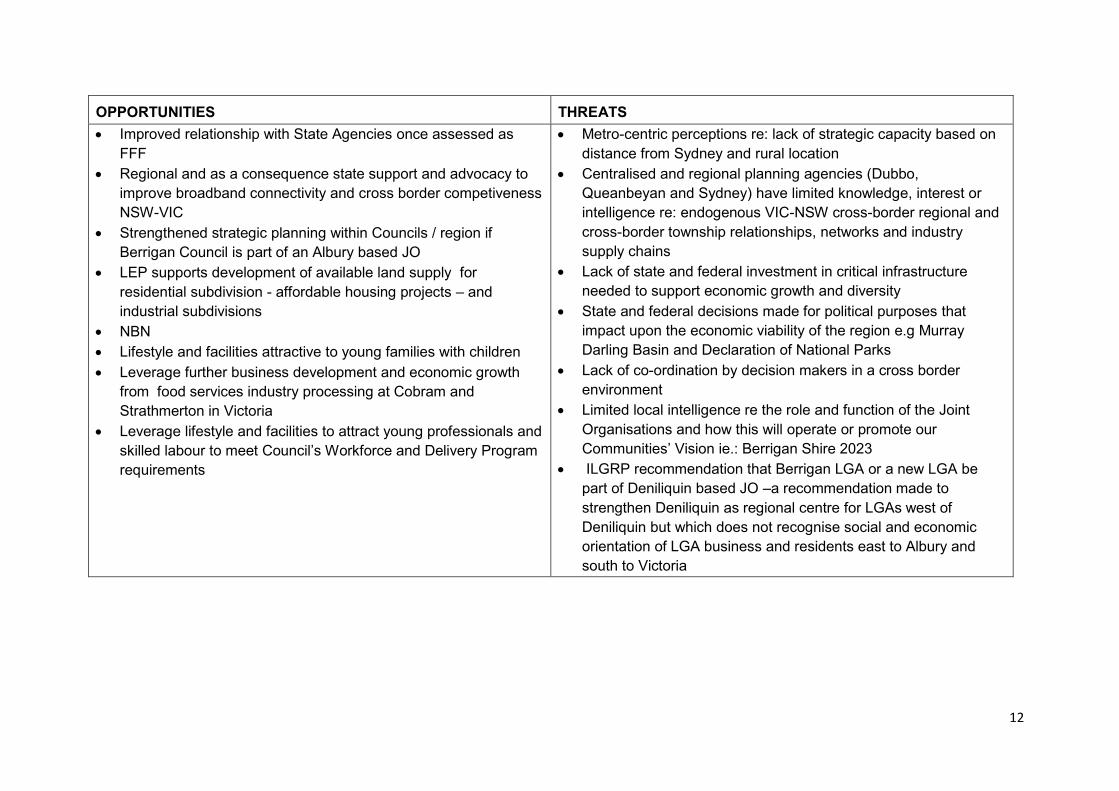
OPPORTUNITIES THREATS Improved relationship with State Agencies once assessed as
FFF Regional and as a consequence state support and advocacy to
improve broadband connectivity and cross border competiveness NSW-VIC
Strengthened strategic planning within Councils / region if Berrigan Council is part of an Albury based JO
LEP supports development of available land supply for residential subdivision - affordable housing projects – and industrial subdivisions
NBN Lifestyle and facilities attractive to young families with children Leverage further business development and economic growth
from food services industry processing at Cobram and Strathmerton in Victoria
Leverage lifestyle and facilities to attract young professionals and skilled labour to meet Council’s Workforce and Delivery Program requirements
Metro-centric perceptions re: lack of strategic capacity based on distance from Sydney and rural location
Centralised and regional planning agencies (Dubbo, Queanbeyan and Sydney) have limited knowledge, interest or intelligence re: endogenous VIC-NSW cross-border regional and cross-border township relationships, networks and industry supply chains
Lack of state and federal investment in critical infrastructure needed to support economic growth and diversity
State and federal decisions made for political purposes that impact upon the economic viability of the region e.g Murray Darling Basin and Declaration of National Parks
Lack of co-ordination by decision makers in a cross border environment
Limited local intelligence re the role and function of the Joint Organisations and how this will operate or promote our Communities’ Vision ie.: Berrigan Shire 2023
ILGRP recommendation that Berrigan LGA or a new LGA be part of Deniliquin based JO –a recommendation made to strengthen Deniliquin as regional centre for LGAs west of Deniliquin but which does not recognise social and economic orientation of LGA business and residents east to Albury and south to Victoria

13
2.3 Performance against the Fit for the Future benchmarks
Sustainability
Measure/ benchmark
2013 / 2014 performance
Achieves FFTF benchmark?
Forecast 2016 / 2017 performance
Achieves FFTF benchmark?
Operating Performance Ratio (Greater than or equal to break-even average over 3 years) -0.030 No 0.059 Yes
Own Source Revenue Ratio (Greater than 60% average over 3 years) 75.29% Yes 73.36% Yes
Building and Infrastructure Asset Renewal Ratio (Greater than 100% average over 3 years)
80.67% No 101.37% Yes
2
14
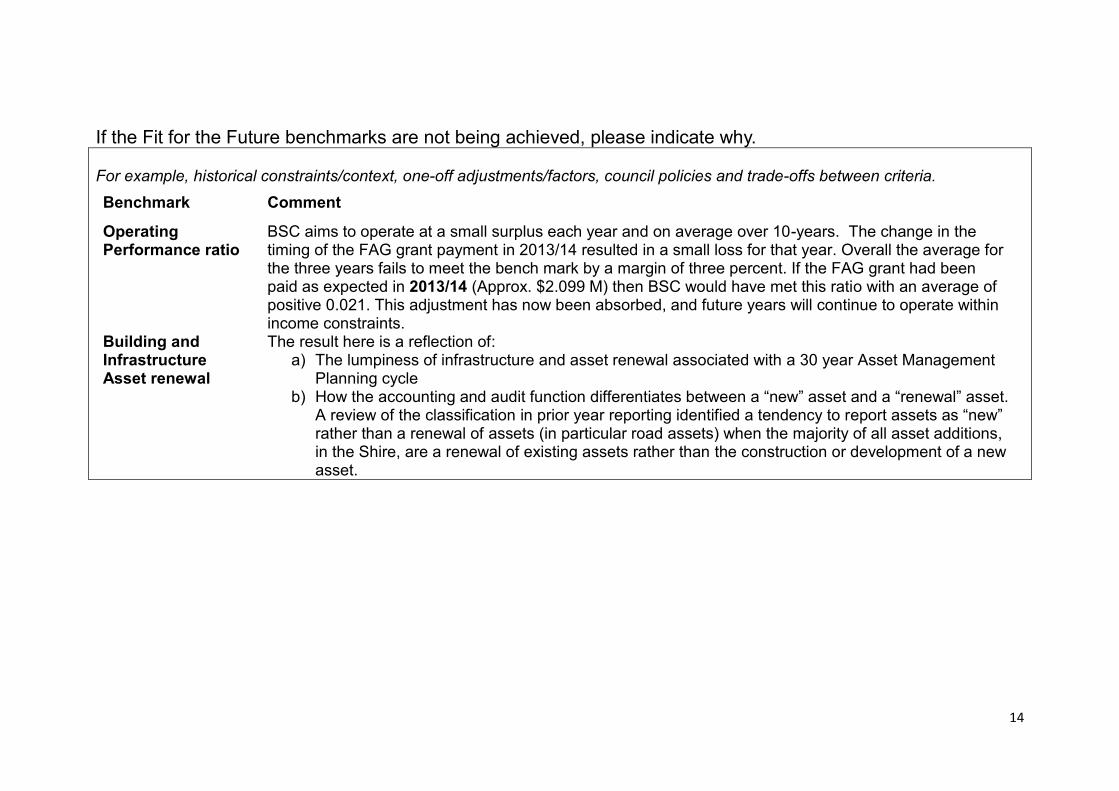
If the Fit for the Future benchmarks are not being achieved, please indicate why. For example, historical constraints/context, one-off adjustments/factors, council policies and trade-offs between criteria.
Benchmark Comment
Operating Performance ratio
BSC aims to operate at a small surplus each year and on average over 10-years. The change in the timing of the FAG grant payment in 2013/14 resulted in a small loss for that year. Overall the average for the three years fails to meet the bench mark by a margin of three percent. If the FAG grant had been paid as expected in 2013/14 (Approx. $2.099 M) then BSC would have met this ratio with an average of positive 0.021. This adjustment has now been absorbed, and future years will continue to operate within income constraints.
Building and Infrastructure Asset renewal
The result here is a reflection of: a) The lumpiness of infrastructure and asset renewal associated with a 30 year Asset Management
Planning cycle b) How the accounting and audit function differentiates between a “new” asset and a “renewal” asset.
A review of the classification in prior year reporting identified a tendency to report assets as “new” rather than a renewal of assets (in particular road assets) when the majority of all asset additions, in the Shire, are a renewal of existing assets rather than the construction or development of a new asset.
15
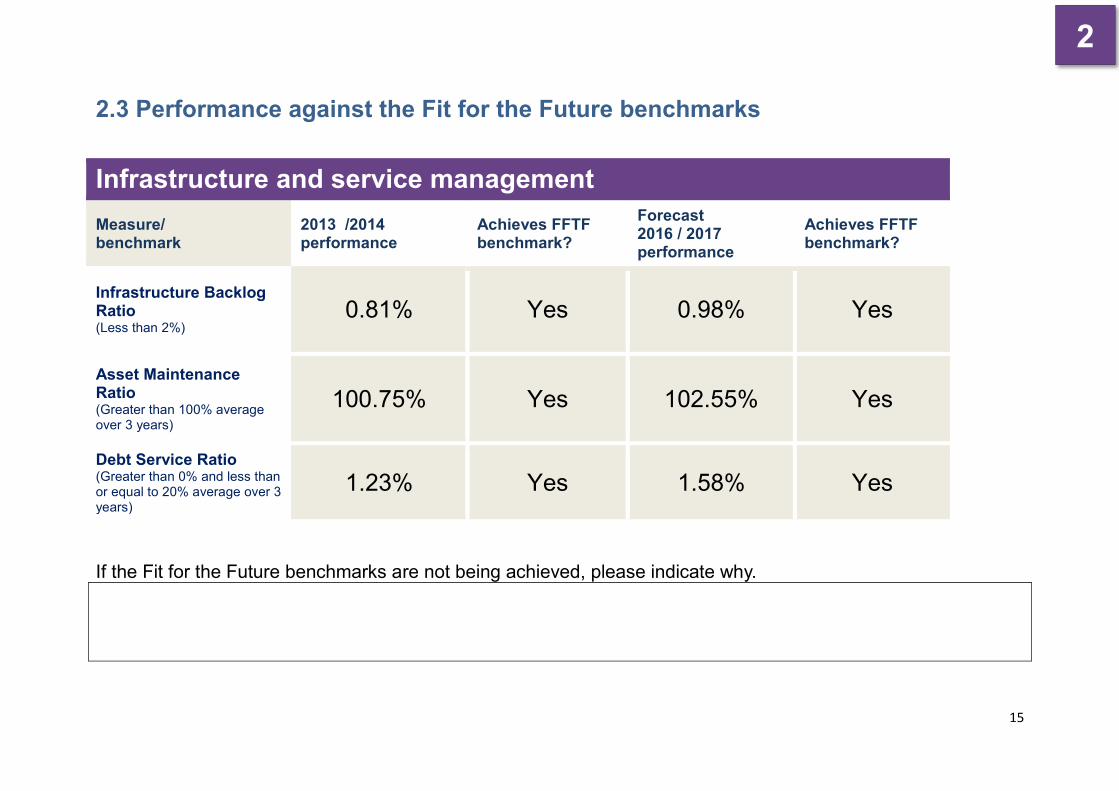
2.3 Performance against the Fit for the Future benchmarks
Infrastructure and service management Measure/ benchmark
2013 /2014 performance
Achieves FFTF benchmark?
Forecast 2016 / 2017 performance
Achieves FFTF benchmark?
Infrastructure Backlog Ratio (Less than 2%) 0.81% Yes 0.98% Yes
Asset Maintenance Ratio (Greater than 100% average over 3 years)
100.75% Yes 102.55% Yes
Debt Service Ratio (Greater than 0% and less than or equal to 20% average over 3 years)
1.23% Yes 1.58% Yes
If the Fit for the Future benchmarks are not being achieved, please indicate why.
2
16
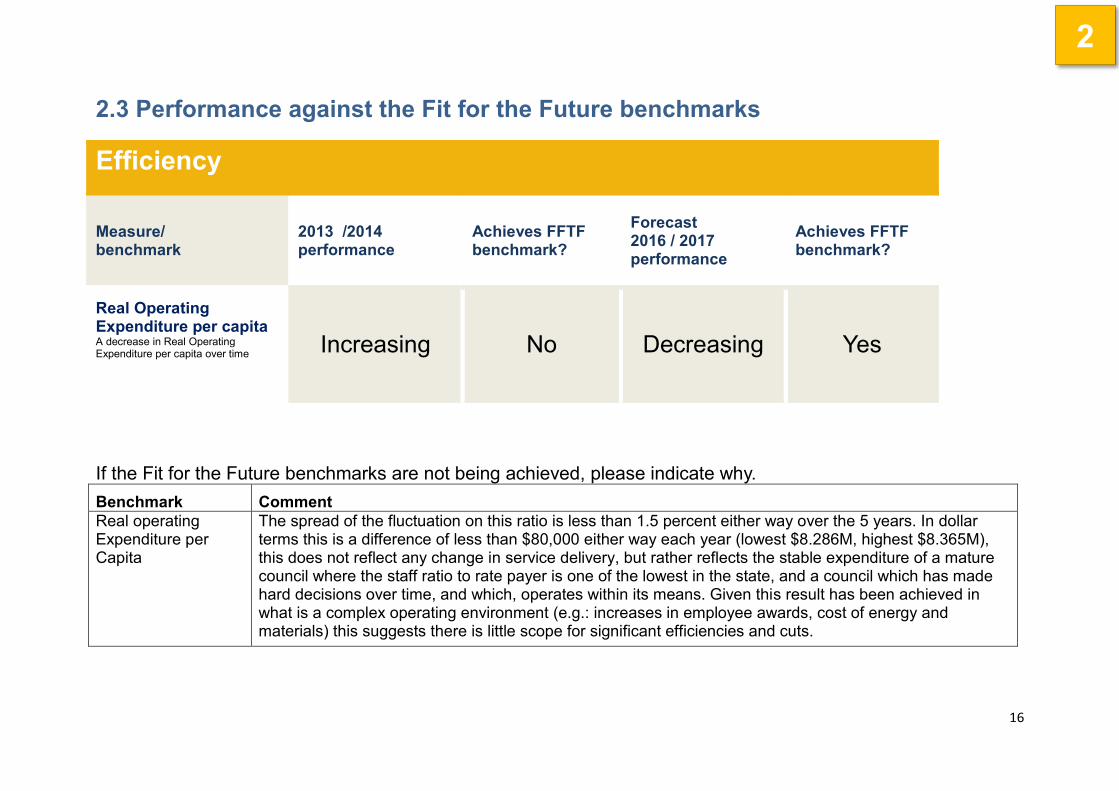
2.3 Performance against the Fit for the Future benchmarks
Efficiency
Measure/ benchmark
2013 /2014 performance
Achieves FFTF benchmark?
Forecast 2016 / 2017 performance
Achieves FFTF benchmark?
Real Operating Expenditure per capita A decrease in Real Operating Expenditure per capita over time
Increasing No Decreasing Yes
If the Fit for the Future benchmarks are not being achieved, please indicate why. Benchmark Comment Real operating Expenditure per Capita
The spread of the fluctuation on this ratio is less than 1.5 percent either way over the 5 years. In dollar terms this is a difference of less than $80,000 either way each year (lowest $8.286M, highest $8.365M), this does not reflect any change in service delivery, but rather reflects the stable expenditure of a mature council where the staff ratio to rate payer is one of the lowest in the state, and a council which has made hard decisions over time, and which, operates within its means. Given this result has been achieved in what is a complex operating environment (e.g.: increases in employee awards, cost of energy and materials) this suggests there is little scope for significant efficiencies and cuts.
2
17
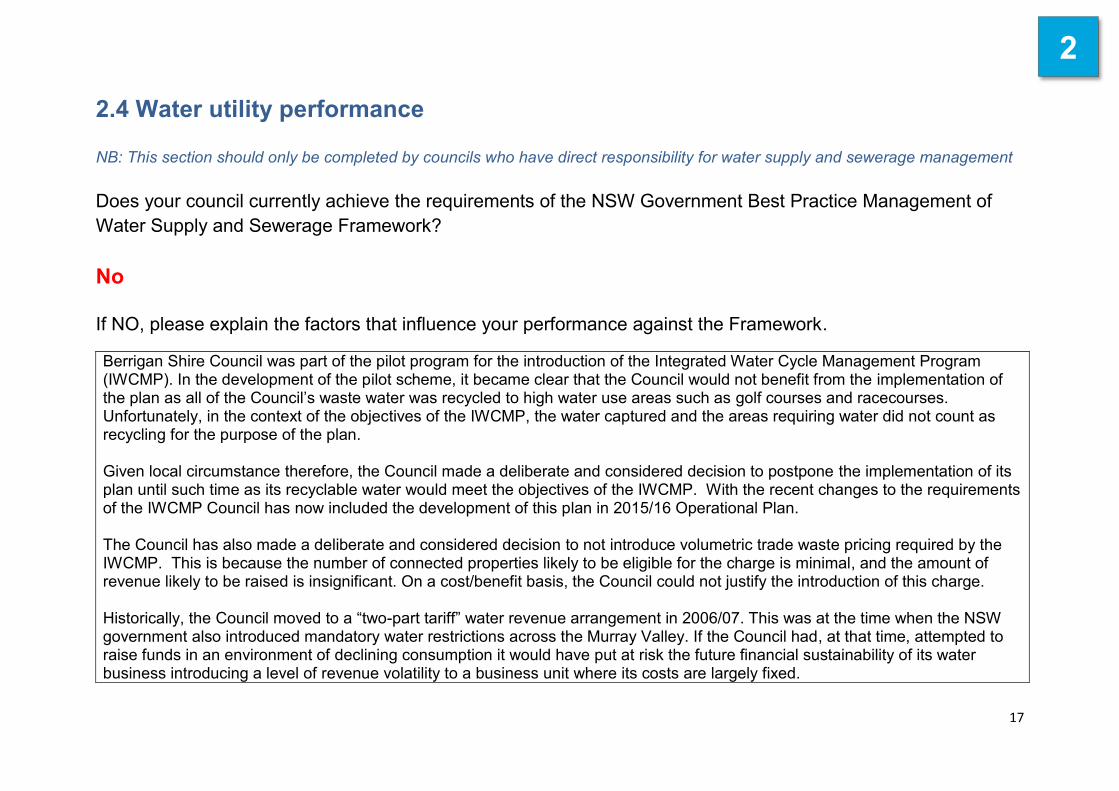
2.4 Water utility performance NB: This section should only be completed by councils who have direct responsibility for water supply and sewerage management Does your council currently achieve the requirements of the NSW Government Best Practice Management of Water Supply and Sewerage Framework? No If NO, please explain the factors that influence your performance against the Framework.
Berrigan Shire Council was part of the pilot program for the introduction of the Integrated Water Cycle Management Program (IWCMP). In the development of the pilot scheme, it became clear that the Council would not benefit from the implementation of the plan as all of the Council’s waste water was recycled to high water use areas such as golf courses and racecourses. Unfortunately, in the context of the objectives of the IWCMP, the water captured and the areas requiring water did not count as recycling for the purpose of the plan. Given local circumstance therefore, the Council made a deliberate and considered decision to postpone the implementation of its plan until such time as its recyclable water would meet the objectives of the IWCMP. With the recent changes to the requirements of the IWCMP Council has now included the development of this plan in 2015/16 Operational Plan. The Council has also made a deliberate and considered decision to not introduce volumetric trade waste pricing required by the IWCMP. This is because the number of connected properties likely to be eligible for the charge is minimal, and the amount of revenue likely to be raised is insignificant. On a cost/benefit basis, the Council could not justify the introduction of this charge. Historically, the Council moved to a “two-part tariff” water revenue arrangement in 2006/07. This was at the time when the NSW government also introduced mandatory water restrictions across the Murray Valley. If the Council had, at that time, attempted to raise funds in an environment of declining consumption it would have put at risk the future financial sustainability of its water business introducing a level of revenue volatility to a business unit where its costs are largely fixed.
2
18
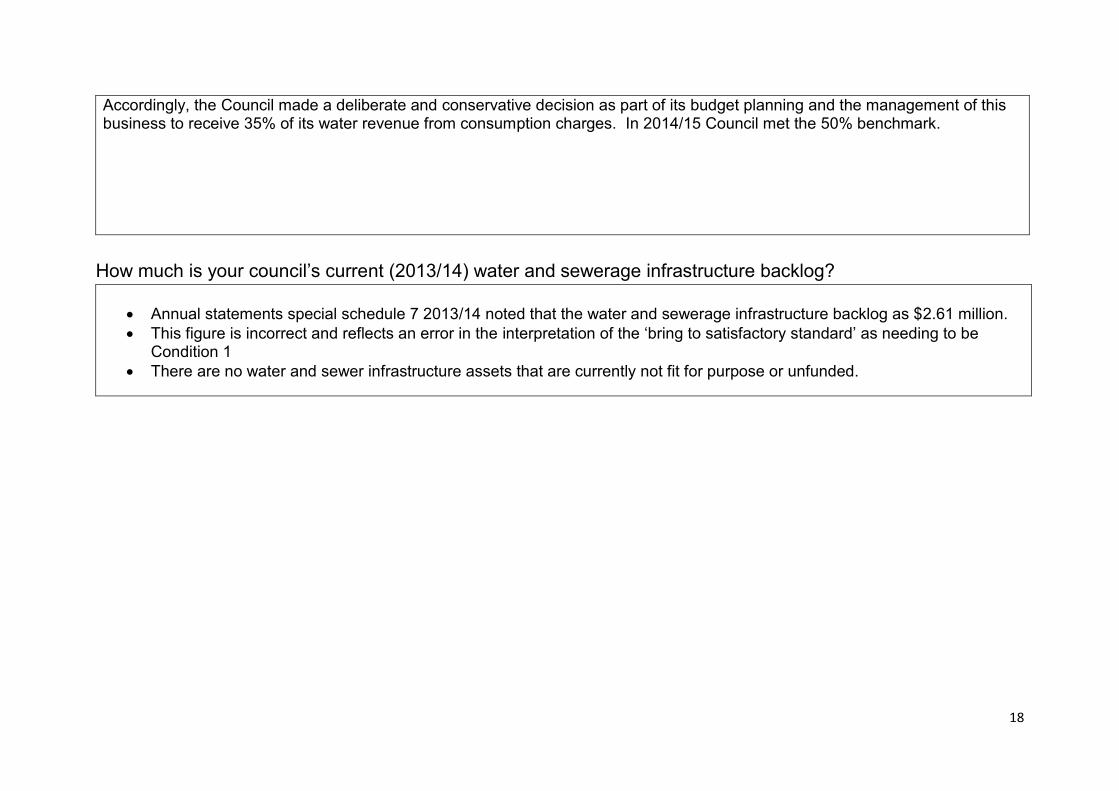
Accordingly, the Council made a deliberate and conservative decision as part of its budget planning and the management of this business to receive 35% of its water revenue from consumption charges. In 2014/15 Council met the 50% benchmark.
How much is your council’s current (2013/14) water and sewerage infrastructure backlog?
Annual statements special schedule 7 2013/14 noted that the water and sewerage infrastructure backlog as $2.61 million. This figure is incorrect and reflects an error in the interpretation of the ‘bring to satisfactory standard’ as needing to be
Condition 1 There are no water and sewer infrastructure assets that are currently not fit for purpose or unfunded.

19
2.4 Water utility performance Identify any significant capital works (>$1m) proposed for your council’s water and sewer operations during the 2016-17 to 2019-20 period and any known grants or external funding to support these works.
Capital works
Proposed works Timeframe Cost Grants or external funding
Meter and cybal replacement program and software upgrades 2017 - 2020 $ 2.35 million NIL
Refurbishment of Water Treatment Plants – Barooga, Tocumwal, Finley and Berrigan
2020 $ 2 million NIL
2

20
2.4 Water utility performance
Does your council currently manage its water and sewerage operations on at least a break-even basis? Yes If No, please explain the factors that influence your performance.
2
21
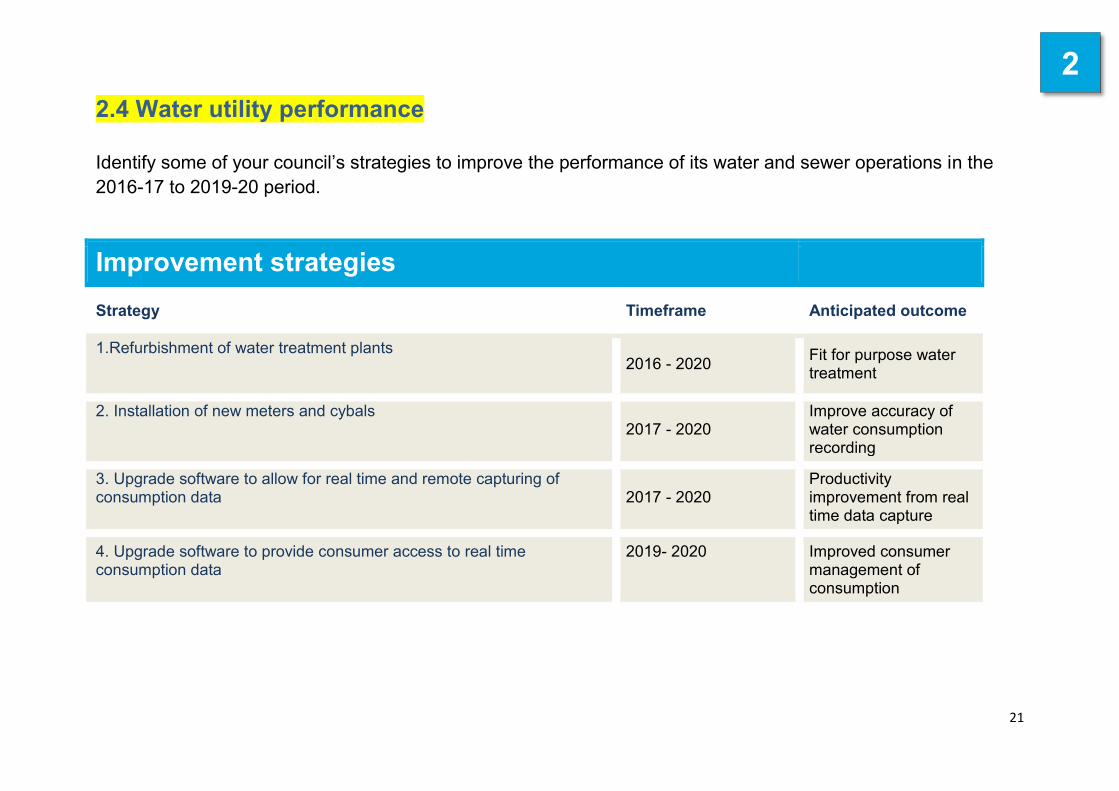
2.4 Water utility performance Identify some of your council’s strategies to improve the performance of its water and sewer operations in the 2016-17 to 2019-20 period.
Improvement strategies
Strategy Timeframe Anticipated outcome 1.Refurbishment of water treatment plants
2016 - 2020 Fit for purpose water treatment
2. Installation of new meters and cybals 2017 - 2020
Improve accuracy of water consumption recording
3. Upgrade software to allow for real time and remote capturing of consumption data 2017 - 2020
Productivity improvement from real time data capture
4. Upgrade software to provide consumer access to real time consumption data
2019- 2020 Improved consumer management of consumption
2

22
3. How will your council become/remain Fit for the Future? 3.1 Sustainability Summarise your council’s key strategies to improve performance against the Sustainability benchmarks in the 2016-20 period, including the outcomes you expect to achieve. Key Strategies
Continue Council’s commitment to ongoing improvement and organisational development
Increase the financial and environmental efficiency of Council facilities
Improve governance of Council operations and reporting
Coordination and quarterly review of Council investments, financial management and financial operations and processing
Continue to leverage loan funds from Sewer Reserves to maximise returns on those funds whilst concurrently reducing cost
of debt
Outcomes 1. Continue to meet or exceed FFF benchmarks
2. Contribute to Berrigan Shire 2023 Outcome: Good Government
3. Meet BSC Delivery Program 2013 – 2017 Strategic Objective:
a. Effective governance by Council of Council operations and reporting
4. Improvement Strategy specific outcomes described section 3.1
3
23
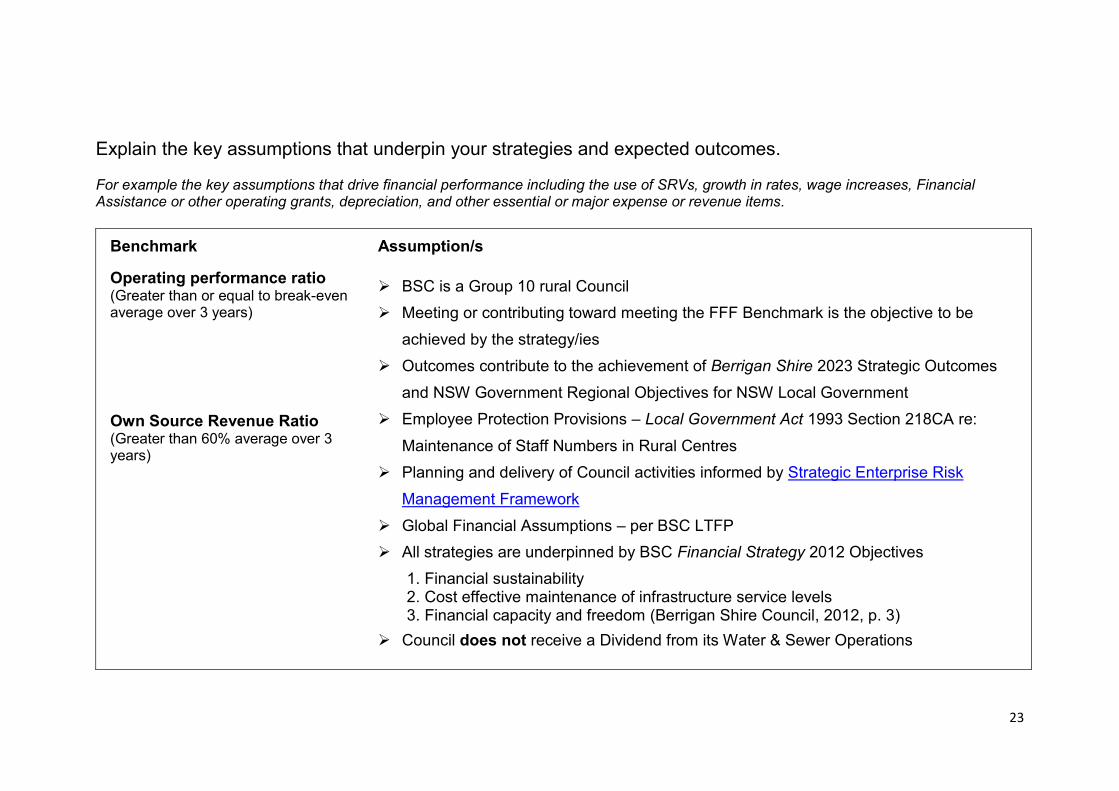
Explain the key assumptions that underpin your strategies and expected outcomes. For example the key assumptions that drive financial performance including the use of SRVs, growth in rates, wage increases, Financial Assistance or other operating grants, depreciation, and other essential or major expense or revenue items.
Benchmark Assumption/s
Operating performance ratio (Greater than or equal to break-even average over 3 years)
BSC is a Group 10 rural Council Meeting or contributing toward meeting the FFF Benchmark is the objective to be
achieved by the strategy/ies Outcomes contribute to the achievement of Berrigan Shire 2023 Strategic Outcomes
and NSW Government Regional Objectives for NSW Local Government Employee Protection Provisions – Local Government Act 1993 Section 218CA re:
Maintenance of Staff Numbers in Rural Centres Planning and delivery of Council activities informed by Strategic Enterprise Risk
Management Framework
Global Financial Assumptions – per BSC LTFP All strategies are underpinned by BSC Financial Strategy 2012 Objectives
1. Financial sustainability 2. Cost effective maintenance of infrastructure service levels 3. Financial capacity and freedom (Berrigan Shire Council, 2012, p. 3)
Council does not receive a Dividend from its Water & Sewer Operations
Own Source Revenue Ratio (Greater than 60% average over 3 years)
24
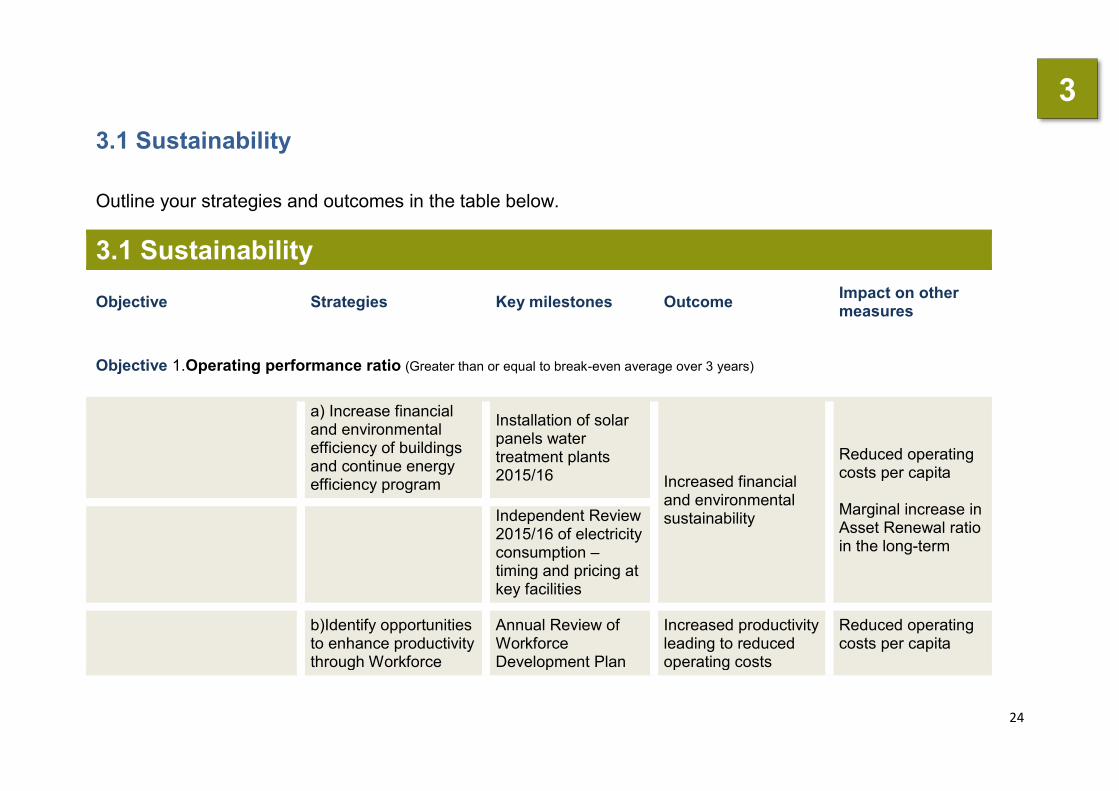
3.1 Sustainability
Outline your strategies and outcomes in the table below.
3.1 Sustainability
Objective Strategies Key milestones Outcome Impact on other measures
Objective 1.Operating performance ratio (Greater than or equal to break-even average over 3 years)
a) Increase financial and environmental efficiency of buildings and continue energy efficiency program
Installation of solar panels water treatment plants 2015/16 Increased financial
and environmental sustainability
Reduced operating costs per capita Marginal increase in Asset Renewal ratio in the long-term
Independent Review 2015/16 of electricity consumption – timing and pricing at key facilities
b)Identify opportunities to enhance productivity through Workforce
Annual Review of Workforce Development Plan
Increased productivity leading to reduced operating costs
Reduced operating costs per capita
3
25
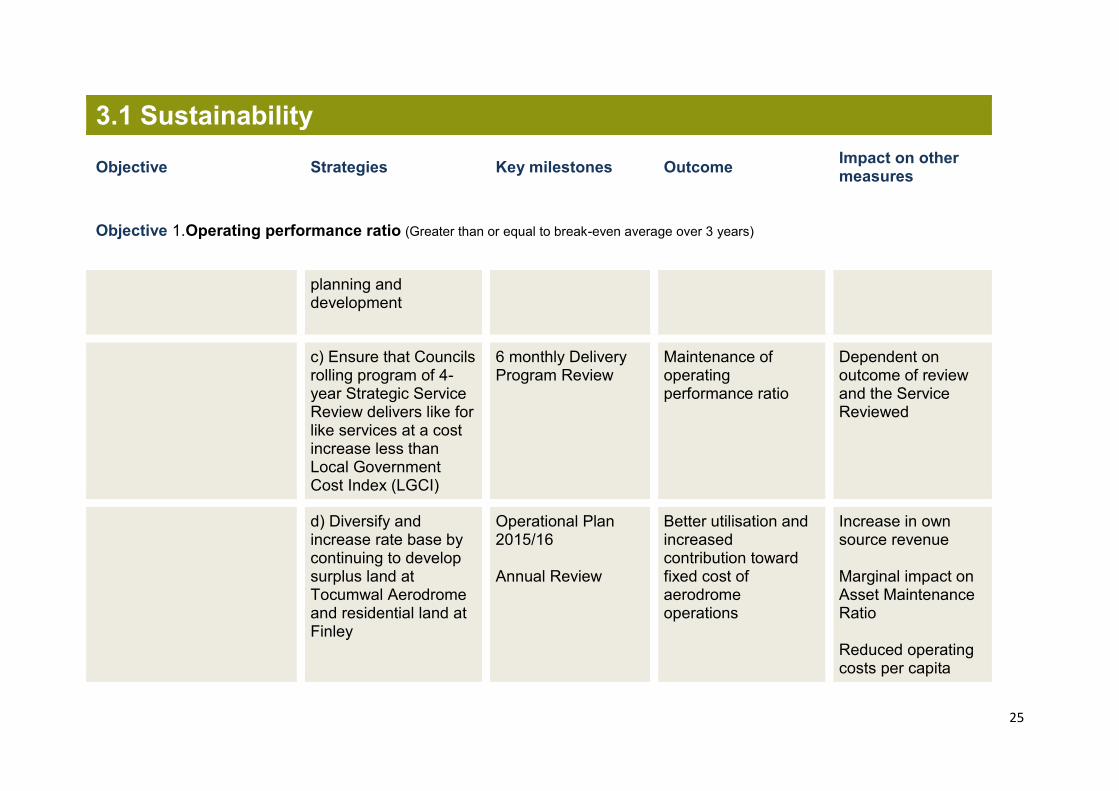
3.1 Sustainability
Objective Strategies Key milestones Outcome Impact on other measures
Objective 1.Operating performance ratio (Greater than or equal to break-even average over 3 years)
planning and development
c) Ensure that Councils rolling program of 4-year Strategic Service Review delivers like for like services at a cost increase less than Local Government Cost Index (LGCI)
6 monthly Delivery Program Review
Maintenance of operating performance ratio
Dependent on outcome of review and the Service Reviewed
d) Diversify and increase rate base by continuing to develop surplus land at Tocumwal Aerodrome and residential land at Finley
Operational Plan 2015/16 Annual Review
Better utilisation and increased contribution toward fixed cost of aerodrome operations
Increase in own source revenue Marginal impact on Asset Maintenance Ratio Reduced operating costs per capita
26
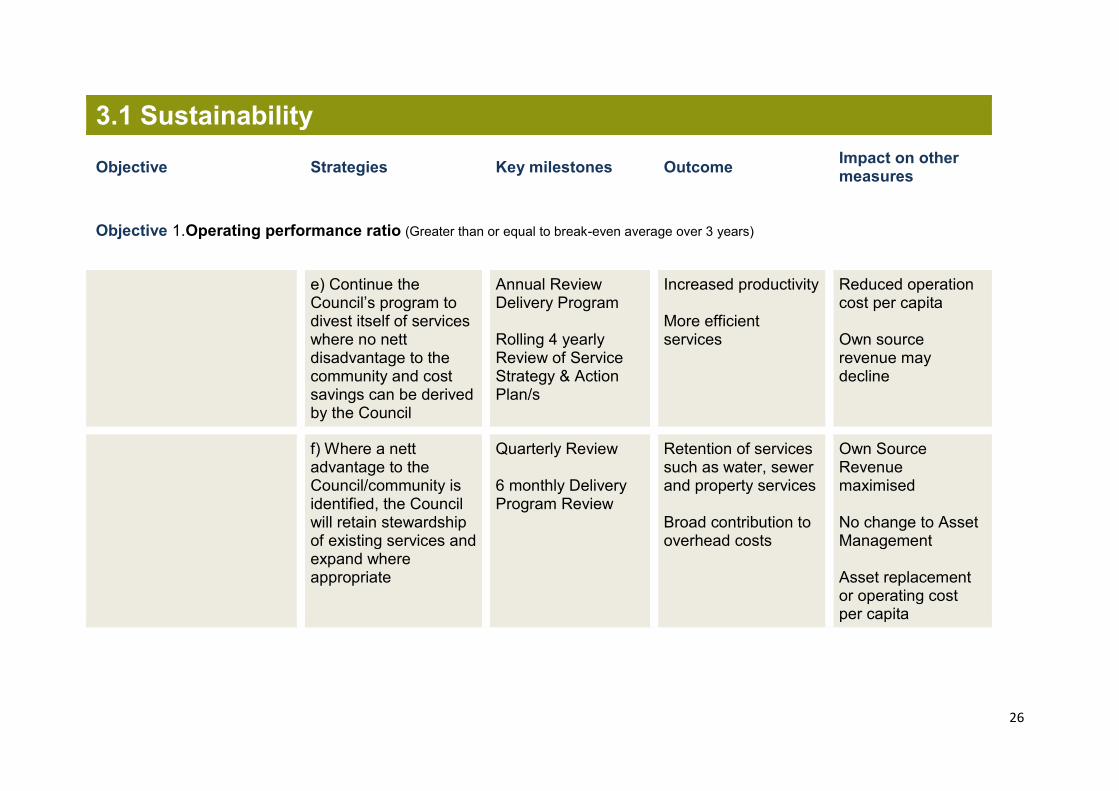
3.1 Sustainability
Objective Strategies Key milestones Outcome Impact on other measures
Objective 1.Operating performance ratio (Greater than or equal to break-even average over 3 years)
e) Continue the Council’s program to divest itself of services where no nett disadvantage to the community and cost savings can be derived by the Council
Annual Review Delivery Program Rolling 4 yearly Review of Service Strategy & Action Plan/s
Increased productivity More efficient services
Reduced operation cost per capita Own source revenue may decline
f) Where a nett advantage to the Council/community is identified, the Council will retain stewardship of existing services and expand where appropriate
Quarterly Review 6 monthly Delivery Program Review
Retention of services such as water, sewer and property services Broad contribution to overhead costs
Own Source Revenue maximised No change to Asset Management Asset replacement or operating cost per capita
27
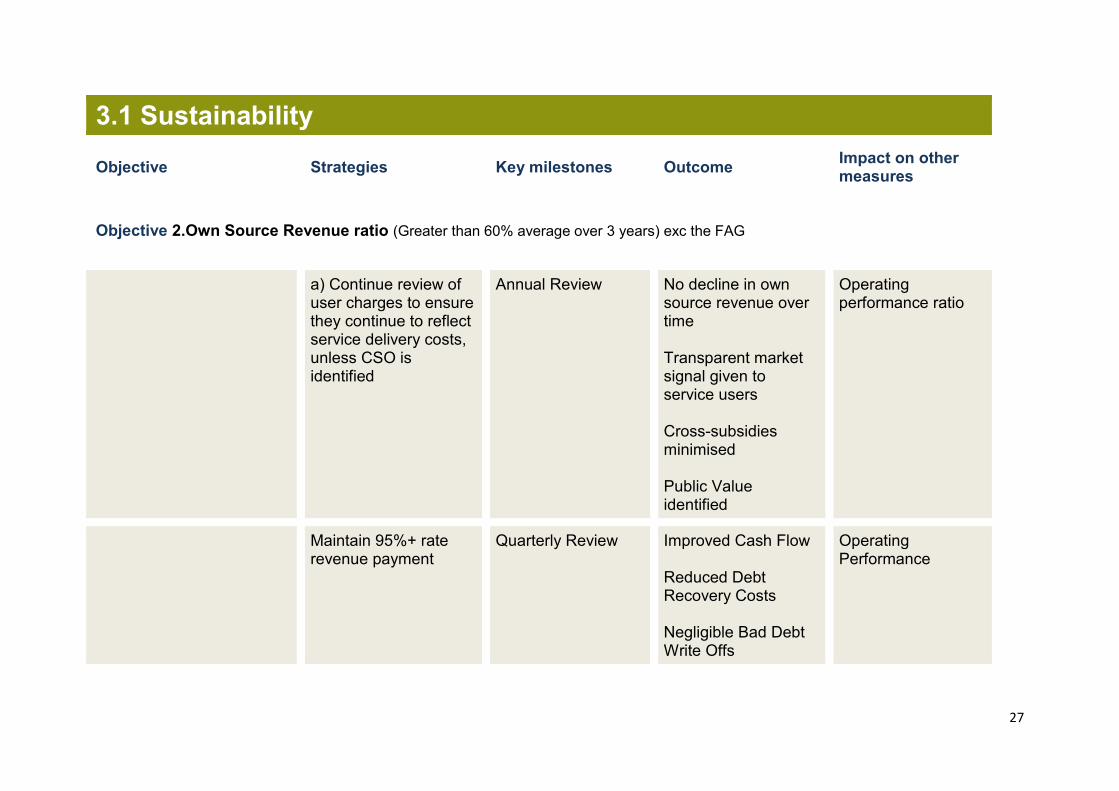
3.1 Sustainability
Objective Strategies Key milestones Outcome Impact on other measures
Objective 2.Own Source Revenue ratio (Greater than 60% average over 3 years) exc the FAG
a) Continue review of user charges to ensure they continue to reflect service delivery costs, unless CSO is identified
Annual Review No decline in own source revenue over time Transparent market signal given to service users Cross-subsidies minimised Public Value identified
Operating performance ratio
Maintain 95%+ rate revenue payment
Quarterly Review Improved Cash Flow Reduced Debt Recovery Costs Negligible Bad Debt Write Offs
Operating Performance
28
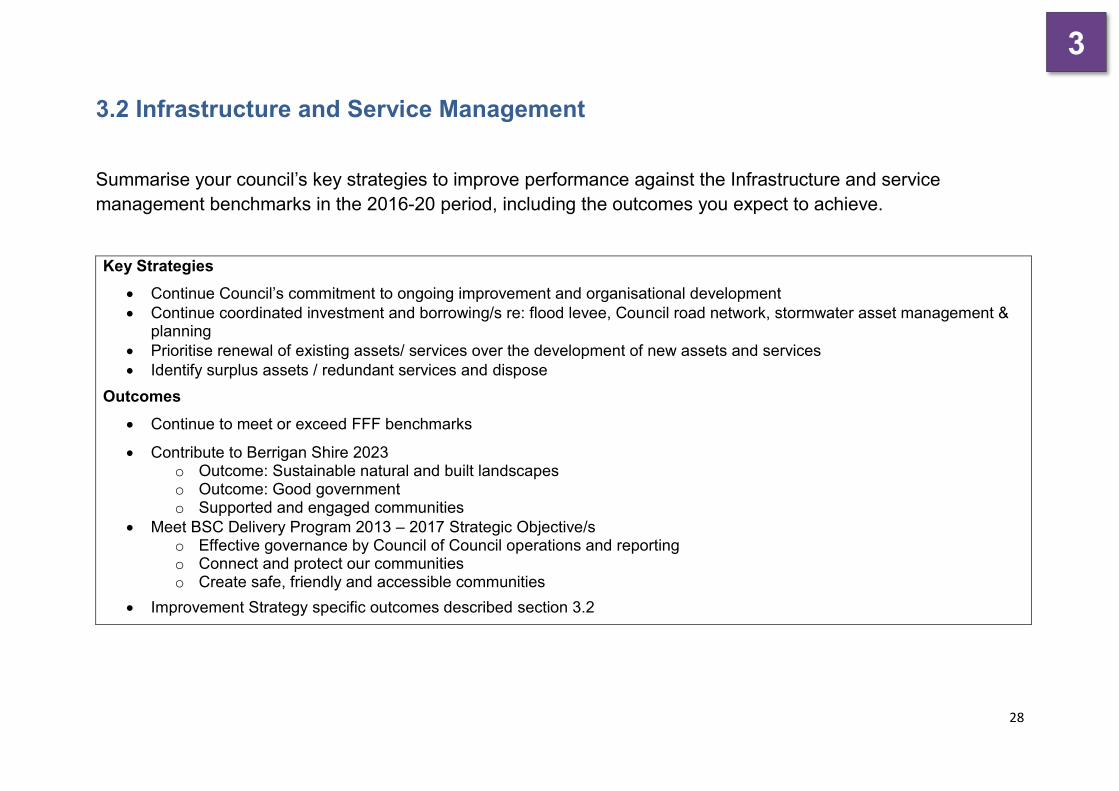
3.2 Infrastructure and Service Management
Summarise your council’s key strategies to improve performance against the Infrastructure and service management benchmarks in the 2016-20 period, including the outcomes you expect to achieve.
Key Strategies Continue Council’s commitment to ongoing improvement and organisational development Continue coordinated investment and borrowing/s re: flood levee, Council road network, stormwater asset management &
planning Prioritise renewal of existing assets/ services over the development of new assets and services Identify surplus assets / redundant services and dispose
Outcomes Continue to meet or exceed FFF benchmarks
Contribute to Berrigan Shire 2023 o Outcome: Sustainable natural and built landscapes o Outcome: Good government o Supported and engaged communities
Meet BSC Delivery Program 2013 – 2017 Strategic Objective/s o Effective governance by Council of Council operations and reporting o Connect and protect our communities o Create safe, friendly and accessible communities
Improvement Strategy specific outcomes described section 3.2
3
29
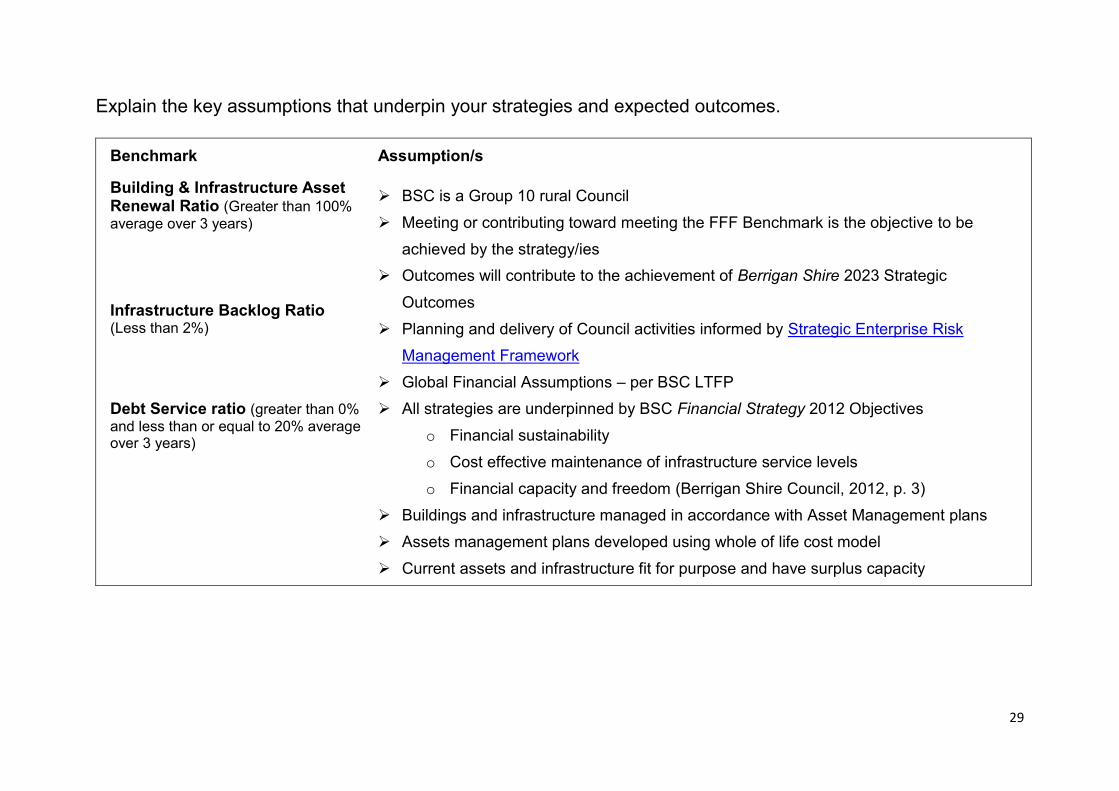
Explain the key assumptions that underpin your strategies and expected outcomes.
Benchmark Assumption/s
Building & Infrastructure Asset Renewal Ratio (Greater than 100% average over 3 years)
BSC is a Group 10 rural Council
Meeting or contributing toward meeting the FFF Benchmark is the objective to be
achieved by the strategy/ies Outcomes will contribute to the achievement of Berrigan Shire 2023 Strategic
Outcomes
Planning and delivery of Council activities informed by Strategic Enterprise Risk Management Framework
Global Financial Assumptions – per BSC LTFP All strategies are underpinned by BSC Financial Strategy 2012 Objectives
o Financial sustainability
o Cost effective maintenance of infrastructure service levels
o Financial capacity and freedom (Berrigan Shire Council, 2012, p. 3) Buildings and infrastructure managed in accordance with Asset Management plans
Assets management plans developed using whole of life cost model
Current assets and infrastructure fit for purpose and have surplus capacity
Infrastructure Backlog Ratio (Less than 2%)
Debt Service ratio (greater than 0% and less than or equal to 20% average over 3 years)
30
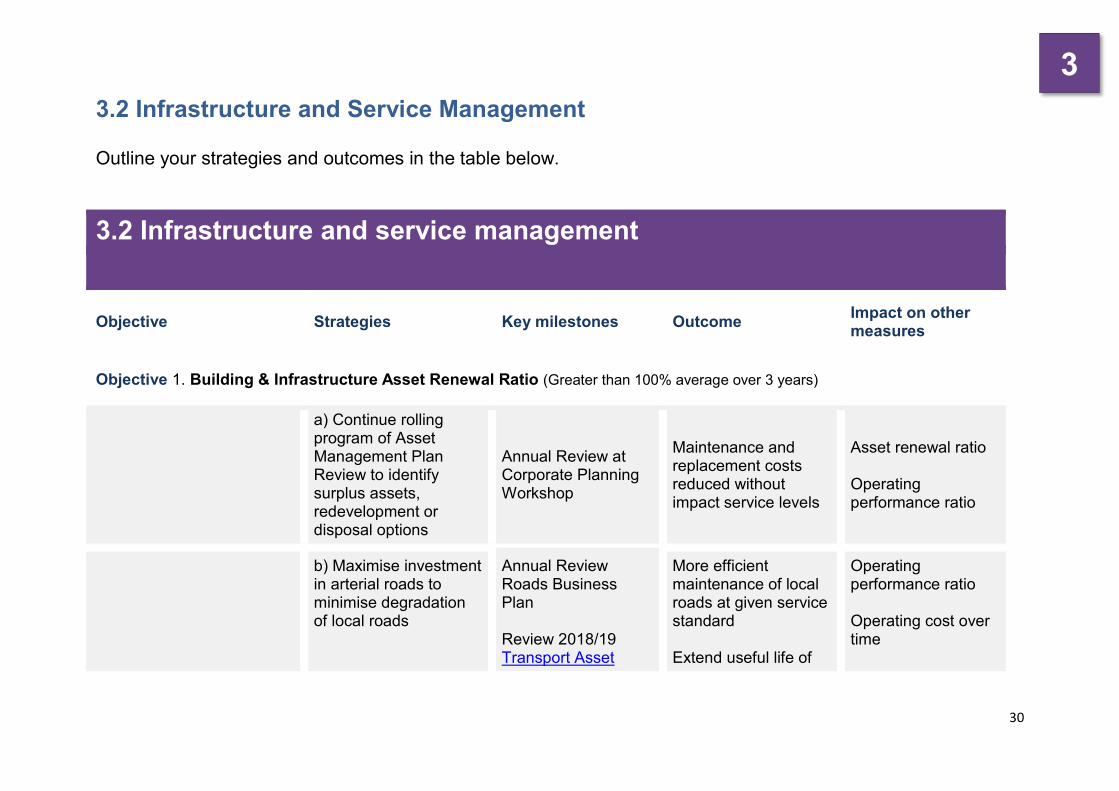
3.2 Infrastructure and Service Management Outline your strategies and outcomes in the table below.
3.2 Infrastructure and service management
Objective Strategies Key milestones Outcome Impact on other measures
Objective 1. Building & Infrastructure Asset Renewal Ratio (Greater than 100% average over 3 years)
a) Continue rolling program of Asset Management Plan Review to identify surplus assets, redevelopment or disposal options
Annual Review at Corporate Planning Workshop
Maintenance and replacement costs reduced without impact service levels
Asset renewal ratio Operating performance ratio
b) Maximise investment in arterial roads to minimise degradation of local roads
Annual Review Roads Business Plan Review 2018/19 Transport Asset
More efficient maintenance of local roads at given service standard Extend useful life of
Operating performance ratio Operating cost over time
3
3

31
3.2 Infrastructure and service management
Objective Strategies Key milestones Outcome Impact on other measures
Objective 1. Building & Infrastructure Asset Renewal Ratio (Greater than 100% average over 3 years)
Management Plan roads Infrastructure backlog ratio
c) Continue active preventative maintenance program on key assets defined in asset management plans
Continue rolling program of Asset Management Plan Review Quarterly Review and Reporting of Operational Plan
More efficient maintenance of assets to nominated service standard Extend useful life of assets Reduction in reactive maintenance
Operating performance ratio Operating cost over time Infrastructure backlog ratio
32
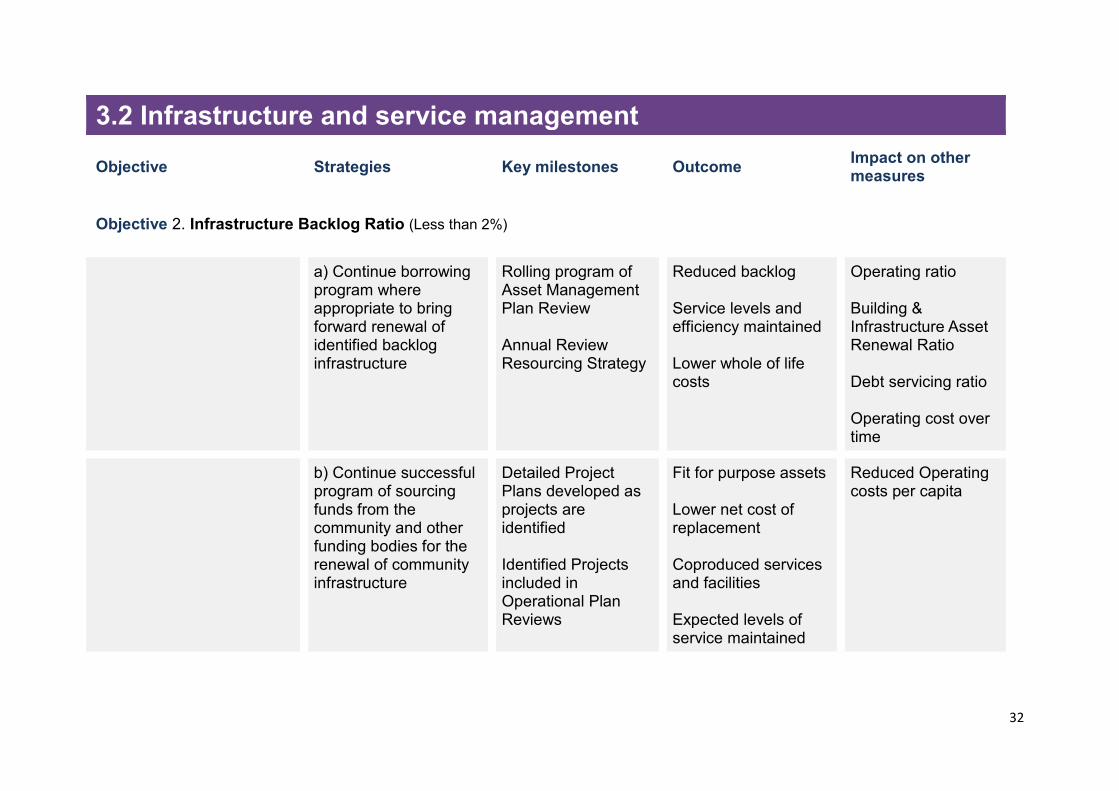
3.2 Infrastructure and service management
Objective Strategies Key milestones Outcome Impact on other measures
Objective 2. Infrastructure Backlog Ratio (Less than 2%)
a) Continue borrowing program where appropriate to bring forward renewal of identified backlog infrastructure
Rolling program of Asset Management Plan Review Annual Review Resourcing Strategy
Reduced backlog Service levels and efficiency maintained Lower whole of life costs
Operating ratio Building & Infrastructure Asset Renewal Ratio Debt servicing ratio Operating cost over time
b) Continue successful program of sourcing funds from the community and other funding bodies for the renewal of community infrastructure
Detailed Project Plans developed as projects are identified Identified Projects included in Operational Plan Reviews
Fit for purpose assets Lower net cost of replacement Coproduced services and facilities Expected levels of service maintained
Reduced Operating costs per capita
33
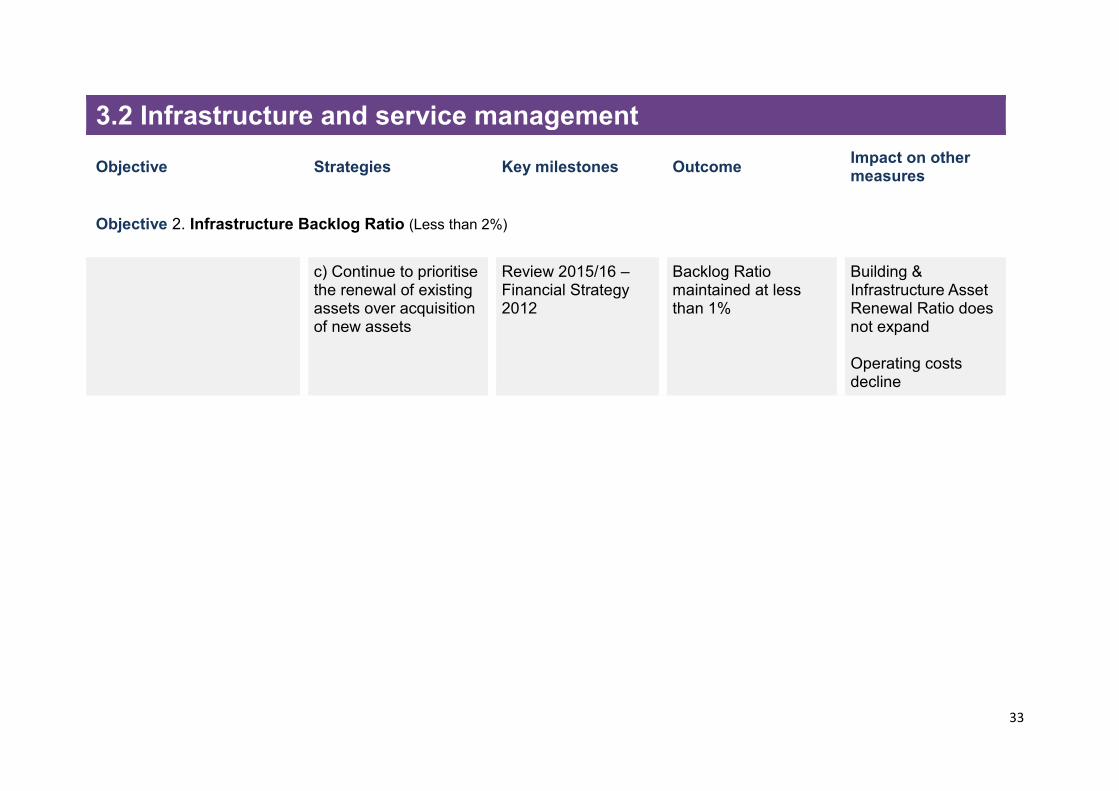
3.2 Infrastructure and service management
Objective Strategies Key milestones Outcome Impact on other measures
Objective 2. Infrastructure Backlog Ratio (Less than 2%)
c) Continue to prioritise the renewal of existing assets over acquisition of new assets
Review 2015/16 – Financial Strategy 2012
Backlog Ratio maintained at less than 1%
Building & Infrastructure Asset Renewal Ratio does not expand Operating costs decline
34
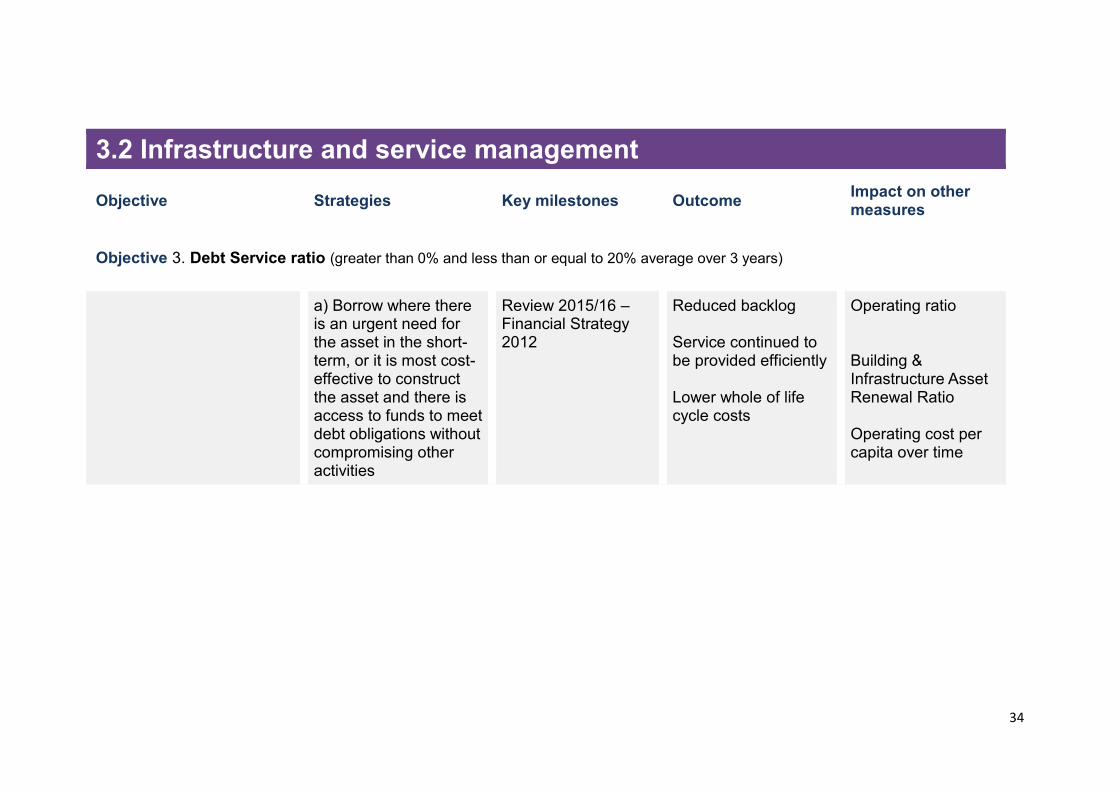
3.2 Infrastructure and service management
Objective Strategies Key milestones Outcome Impact on other measures
Objective 3. Debt Service ratio (greater than 0% and less than or equal to 20% average over 3 years)
a) Borrow where there is an urgent need for the asset in the short-term, or it is most cost-effective to construct the asset and there is access to funds to meet debt obligations without compromising other activities
Review 2015/16 – Financial Strategy 2012
Reduced backlog Service continued to be provided efficiently Lower whole of life cycle costs
Operating ratio Building & Infrastructure Asset Renewal Ratio Operating cost per capita over time
35
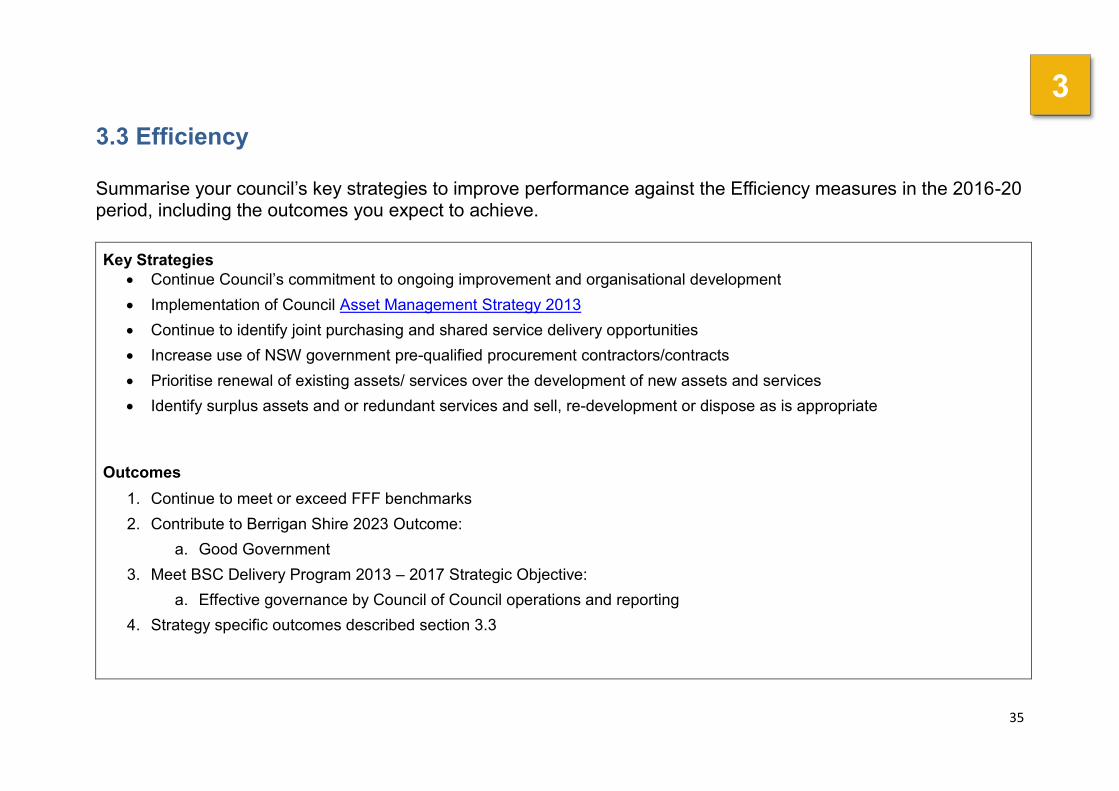
3.3 Efficiency Summarise your council’s key strategies to improve performance against the Efficiency measures in the 2016-20 period, including the outcomes you expect to achieve. Key Strategies
Continue Council’s commitment to ongoing improvement and organisational development Implementation of Council Asset Management Strategy 2013 Continue to identify joint purchasing and shared service delivery opportunities Increase use of NSW government pre-qualified procurement contractors/contracts Prioritise renewal of existing assets/ services over the development of new assets and services Identify surplus assets and or redundant services and sell, re-development or dispose as is appropriate
Outcomes 1. Continue to meet or exceed FFF benchmarks 2. Contribute to Berrigan Shire 2023 Outcome:
a. Good Government 3. Meet BSC Delivery Program 2013 – 2017 Strategic Objective:
a. Effective governance by Council of Council operations and reporting 4. Strategy specific outcomes described section 3.3
3
36
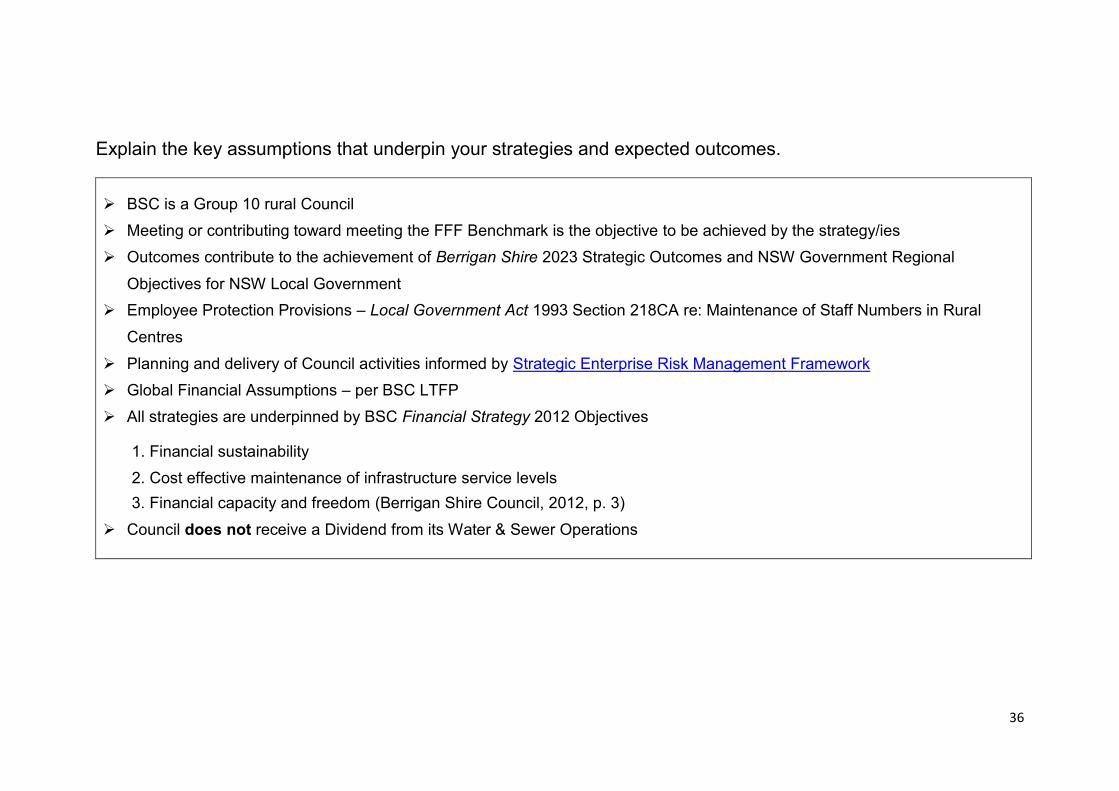
Explain the key assumptions that underpin your strategies and expected outcomes.
BSC is a Group 10 rural Council Meeting or contributing toward meeting the FFF Benchmark is the objective to be achieved by the strategy/ies Outcomes contribute to the achievement of Berrigan Shire 2023 Strategic Outcomes and NSW Government Regional
Objectives for NSW Local Government Employee Protection Provisions – Local Government Act 1993 Section 218CA re: Maintenance of Staff Numbers in Rural
Centres
Planning and delivery of Council activities informed by Strategic Enterprise Risk Management Framework Global Financial Assumptions – per BSC LTFP All strategies are underpinned by BSC Financial Strategy 2012 Objectives
1. Financial sustainability 2. Cost effective maintenance of infrastructure service levels 3. Financial capacity and freedom (Berrigan Shire Council, 2012, p. 3)
Council does not receive a Dividend from its Water & Sewer Operations
37
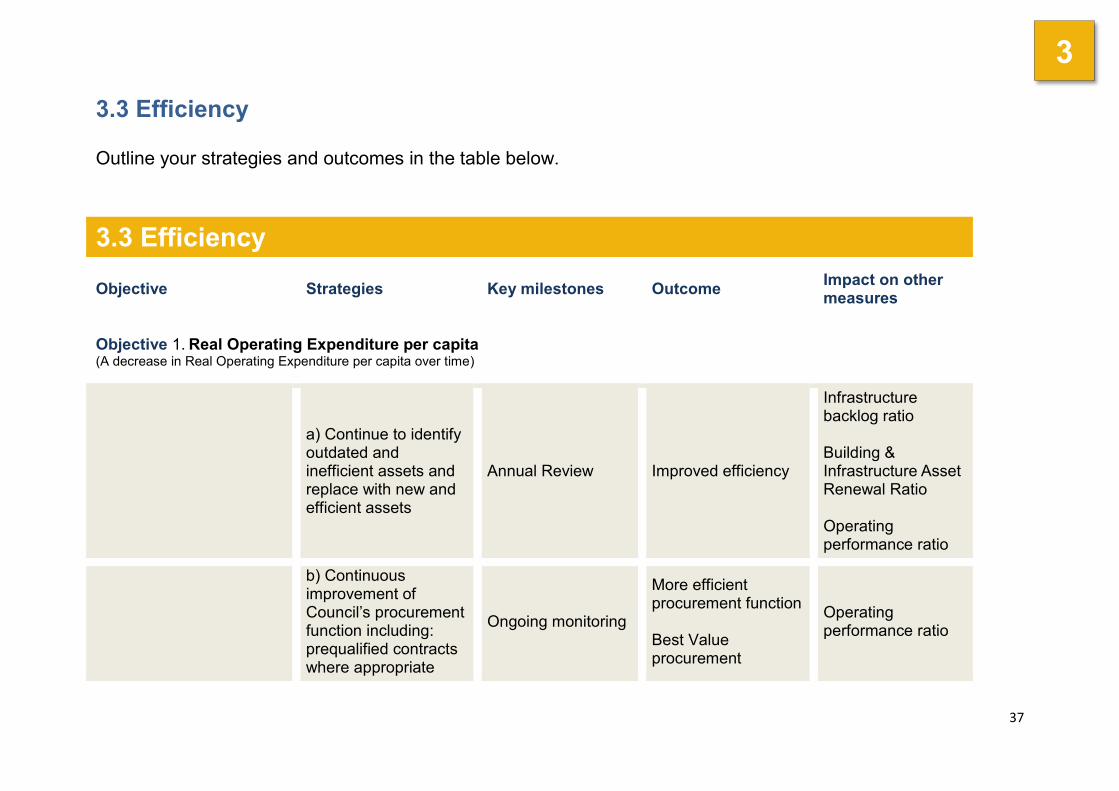
3.3 Efficiency
Outline your strategies and outcomes in the table below.
3.3 Efficiency
Objective Strategies Key milestones Outcome Impact on other measures
Objective 1. Real Operating Expenditure per capita (A decrease in Real Operating Expenditure per capita over time)
a) Continue to identify outdated and inefficient assets and replace with new and efficient assets
Annual Review Improved efficiency
Infrastructure backlog ratio Building & Infrastructure Asset Renewal Ratio Operating performance ratio
b) Continuous improvement of Council’s procurement function including: prequalified contracts where appropriate
Ongoing monitoring
More efficient procurement function Best Value procurement
Operating performance ratio
3
38
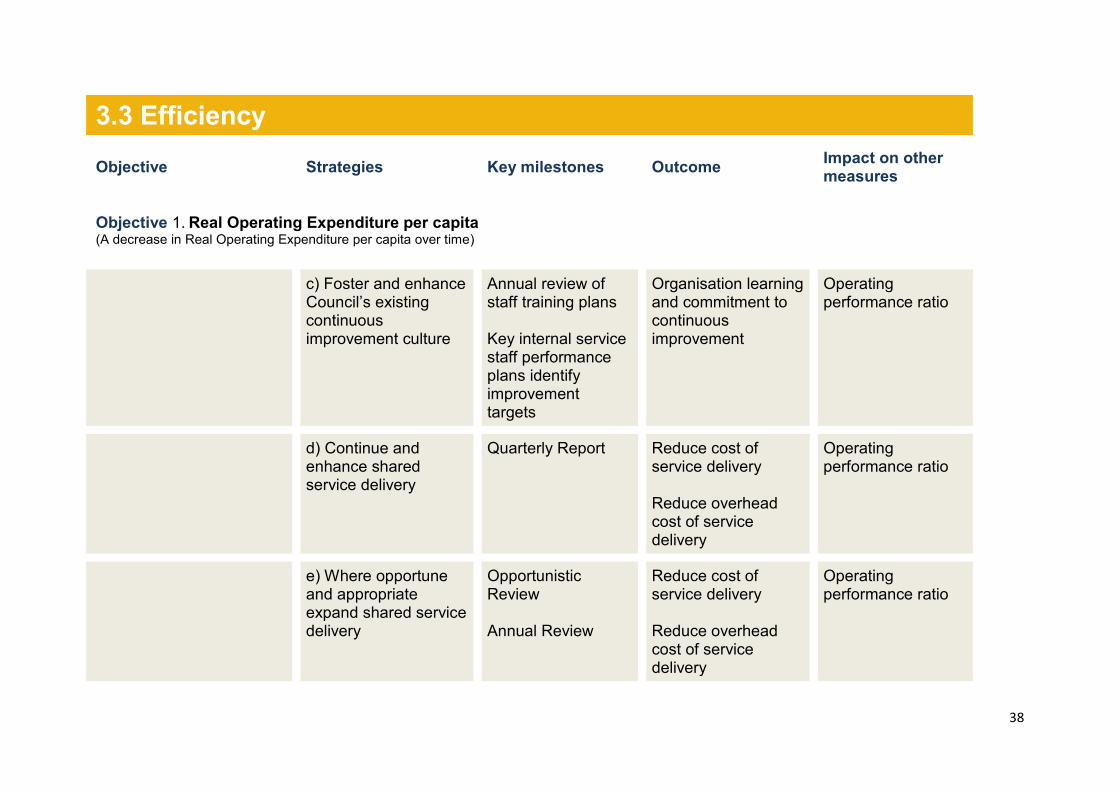
3.3 Efficiency
Objective Strategies Key milestones Outcome Impact on other measures
Objective 1. Real Operating Expenditure per capita (A decrease in Real Operating Expenditure per capita over time)
c) Foster and enhance Council’s existing continuous improvement culture
Annual review of staff training plans Key internal service staff performance plans identify improvement targets
Organisation learning and commitment to continuous improvement
Operating performance ratio
d) Continue and enhance shared service delivery
Quarterly Report Reduce cost of service delivery Reduce overhead cost of service delivery
Operating performance ratio
e) Where opportune and appropriate expand shared service delivery
Opportunistic Review Annual Review
Reduce cost of service delivery Reduce overhead cost of service delivery
Operating performance ratio
39
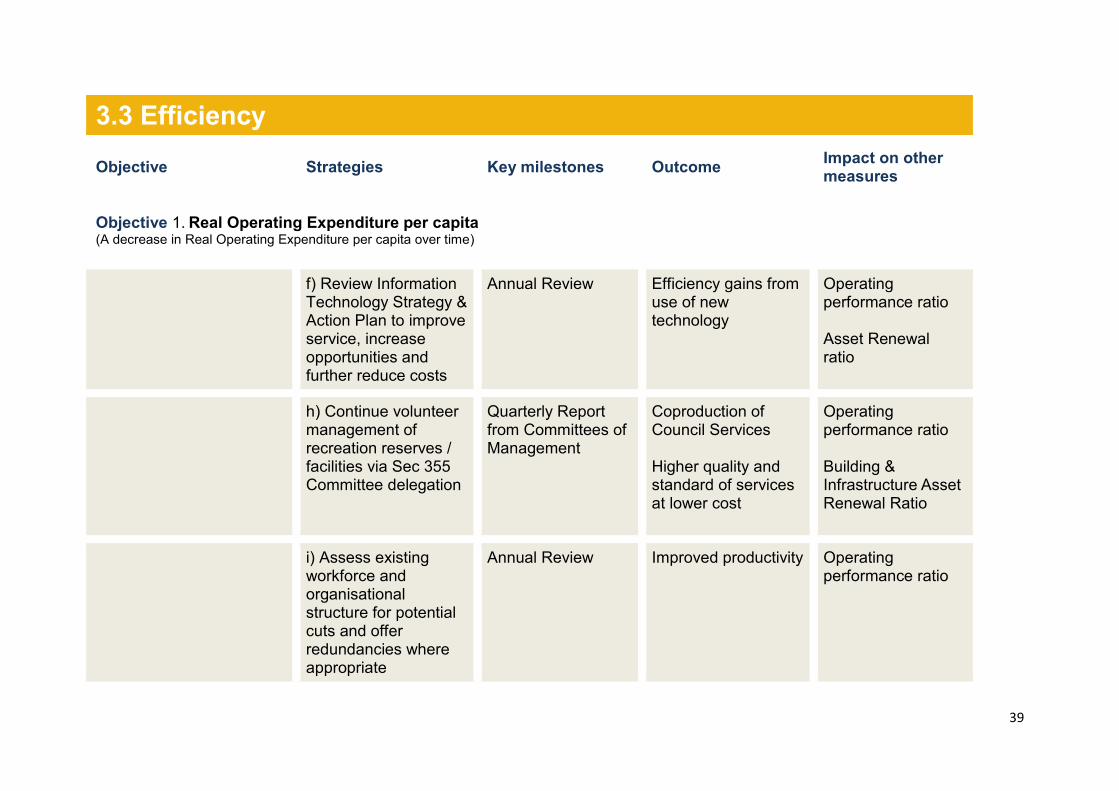
3.3 Efficiency
Objective Strategies Key milestones Outcome Impact on other measures
Objective 1. Real Operating Expenditure per capita (A decrease in Real Operating Expenditure per capita over time)
f) Review Information Technology Strategy & Action Plan to improve service, increase opportunities and further reduce costs
Annual Review Efficiency gains from use of new technology
Operating performance ratio Asset Renewal ratio
h) Continue volunteer management of recreation reserves / facilities via Sec 355 Committee delegation
Quarterly Report from Committees of Management
Coproduction of Council Services Higher quality and standard of services at lower cost
Operating performance ratio Building & Infrastructure Asset Renewal Ratio
i) Assess existing workforce and organisational structure for potential cuts and offer redundancies where appropriate
Annual Review Improved productivity Operating performance ratio

40
3.4 Improvement Action Plan Summarise the key improvement actions that will be achieved in the first year of your plan.
Action plan
Actions Milestones 1. Investigate use of solar power and install where appropriate
2015/16 Operational Plan
2. Assess existing workforce and organisational structure for potential cuts and offer redundancies where appropriate
2015/16 Workforce Development Pan
3. Eliminate programs that expose Council to excessive financial risk such as Home and Community Care Service
2015/16 Operational Plan Transfer Service to alternative provider
4. Identify outdated and inefficient assets and replace with new efficient assets Identify potential assets for disposal Consult stakeholder regarding proposed disposal 15/16
3
41
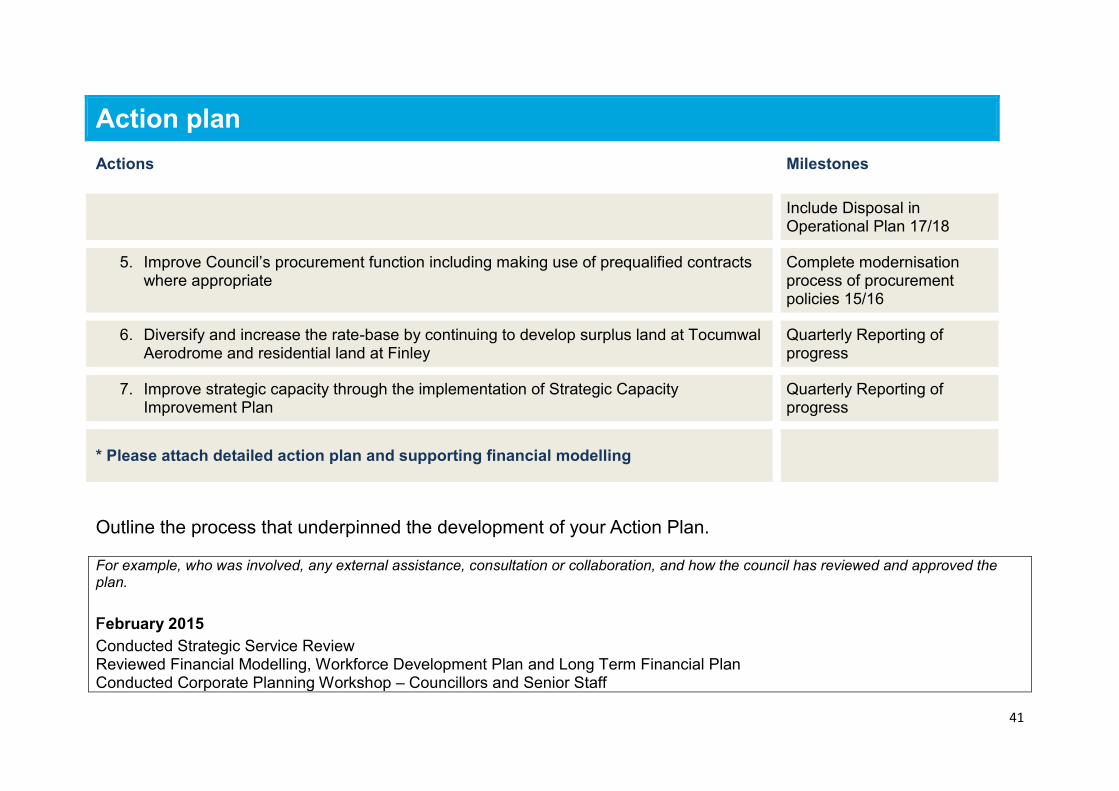
Action plan
Actions Milestones
Include Disposal in Operational Plan 17/18
5. Improve Council’s procurement function including making use of prequalified contracts where appropriate
Complete modernisation process of procurement policies 15/16
6. Diversify and increase the rate-base by continuing to develop surplus land at Tocumwal Aerodrome and residential land at Finley
Quarterly Reporting of progress
7. Improve strategic capacity through the implementation of Strategic Capacity Improvement Plan
Quarterly Reporting of progress
* Please attach detailed action plan and supporting financial modelling
Outline the process that underpinned the development of your Action Plan.
For example, who was involved, any external assistance, consultation or collaboration, and how the council has reviewed and approved the plan.
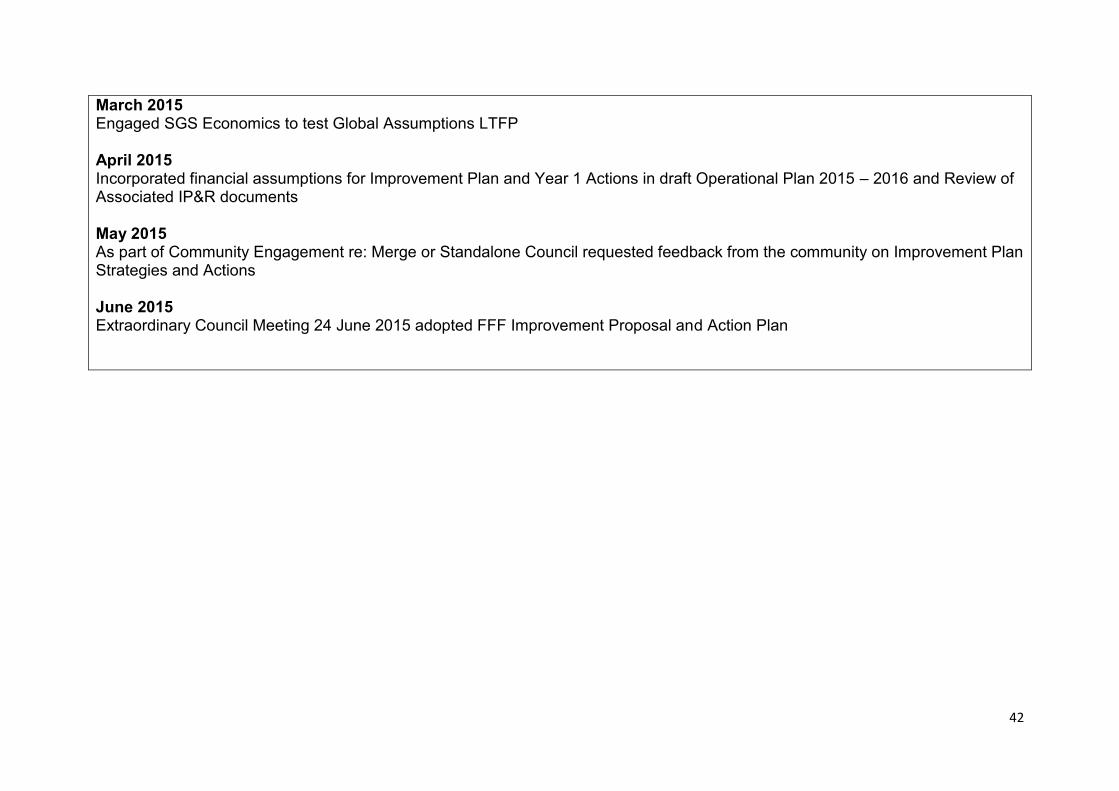
February 2015 Conducted Strategic Service Review Reviewed Financial Modelling, Workforce Development Plan and Long Term Financial Plan Conducted Corporate Planning Workshop – Councillors and Senior Staff
42
March 2015 Engaged SGS Economics to test Global Assumptions LTFP April 2015 Incorporated financial assumptions for Improvement Plan and Year 1 Actions in draft Operational Plan 2015 – 2016 and Review of Associated IP&R documents May 2015 As part of Community Engagement re: Merge or Standalone Council requested feedback from the community on Improvement Plan Strategies and Actions June 2015 Extraordinary Council Meeting 24 June 2015 adopted FFF Improvement Proposal and Action Plan
43
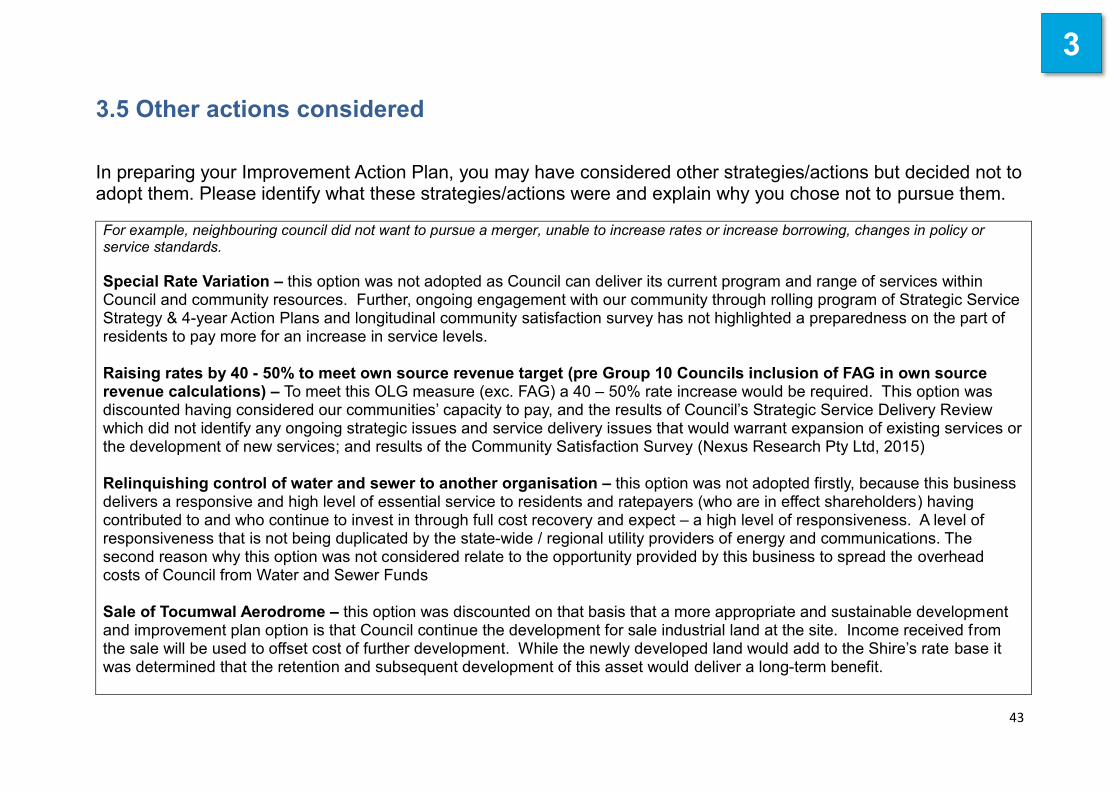
3.5 Other actions considered
In preparing your Improvement Action Plan, you may have considered other strategies/actions but decided not to adopt them. Please identify what these strategies/actions were and explain why you chose not to pursue them. For example, neighbouring council did not want to pursue a merger, unable to increase rates or increase borrowing, changes in policy or service standards. Special Rate Variation – this option was not adopted as Council can deliver its current program and range of services within Council and community resources. Further, ongoing engagement with our community through rolling program of Strategic Service Strategy & 4-year Action Plans and longitudinal community satisfaction survey has not highlighted a preparedness on the part of residents to pay more for an increase in service levels. Raising rates by 40 - 50% to meet own source revenue target (pre Group 10 Councils inclusion of FAG in own source revenue calculations) – To meet this OLG measure (exc. FAG) a 40 – 50% rate increase would be required. This option was discounted having considered our communities’ capacity to pay, and the results of Council’s Strategic Service Delivery Review which did not identify any ongoing strategic issues and service delivery issues that would warrant expansion of existing services or the development of new services; and results of the Community Satisfaction Survey (Nexus Research Pty Ltd, 2015) Relinquishing control of water and sewer to another organisation – this option was not adopted firstly, because this business delivers a responsive and high level of essential service to residents and ratepayers (who are in effect shareholders) having contributed to and who continue to invest in through full cost recovery and expect – a high level of responsiveness. A level of responsiveness that is not being duplicated by the state-wide / regional utility providers of energy and communications. The second reason why this option was not considered relate to the opportunity provided by this business to spread the overhead costs of Council from Water and Sewer Funds Sale of Tocumwal Aerodrome – this option was discounted on that basis that a more appropriate and sustainable development and improvement plan option is that Council continue the development for sale industrial land at the site. Income received from the sale will be used to offset cost of further development. While the newly developed land would add to the Shire’s rate base it was determined that the retention and subsequent development of this asset would deliver a long-term benefit.
3
44
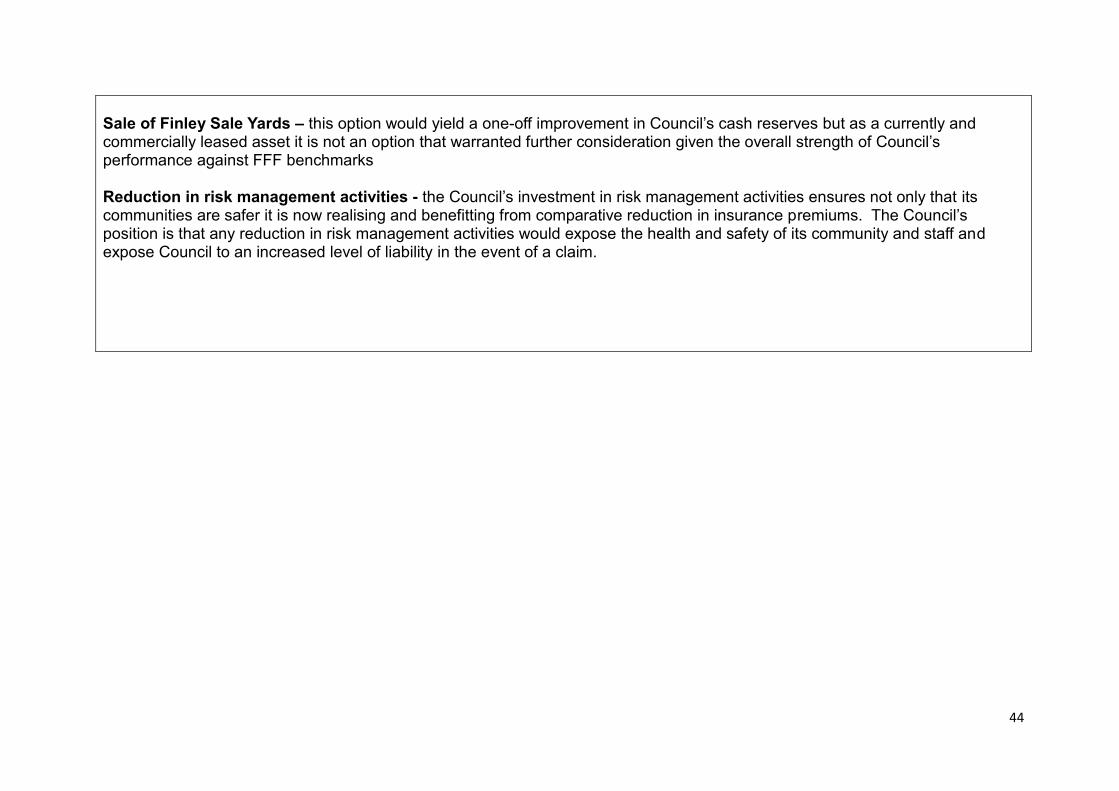
Sale of Finley Sale Yards – this option would yield a one-off improvement in Council’s cash reserves but as a currently and commercially leased asset it is not an option that warranted further consideration given the overall strength of Council’s performance against FFF benchmarks Reduction in risk management activities - the Council’s investment in risk management activities ensures not only that its communities are safer it is now realising and benefitting from comparative reduction in insurance premiums. The Council’s position is that any reduction in risk management activities would expose the health and safety of its community and staff and expose Council to an increased level of liability in the event of a claim.
45
4. How will your plan improve performance?
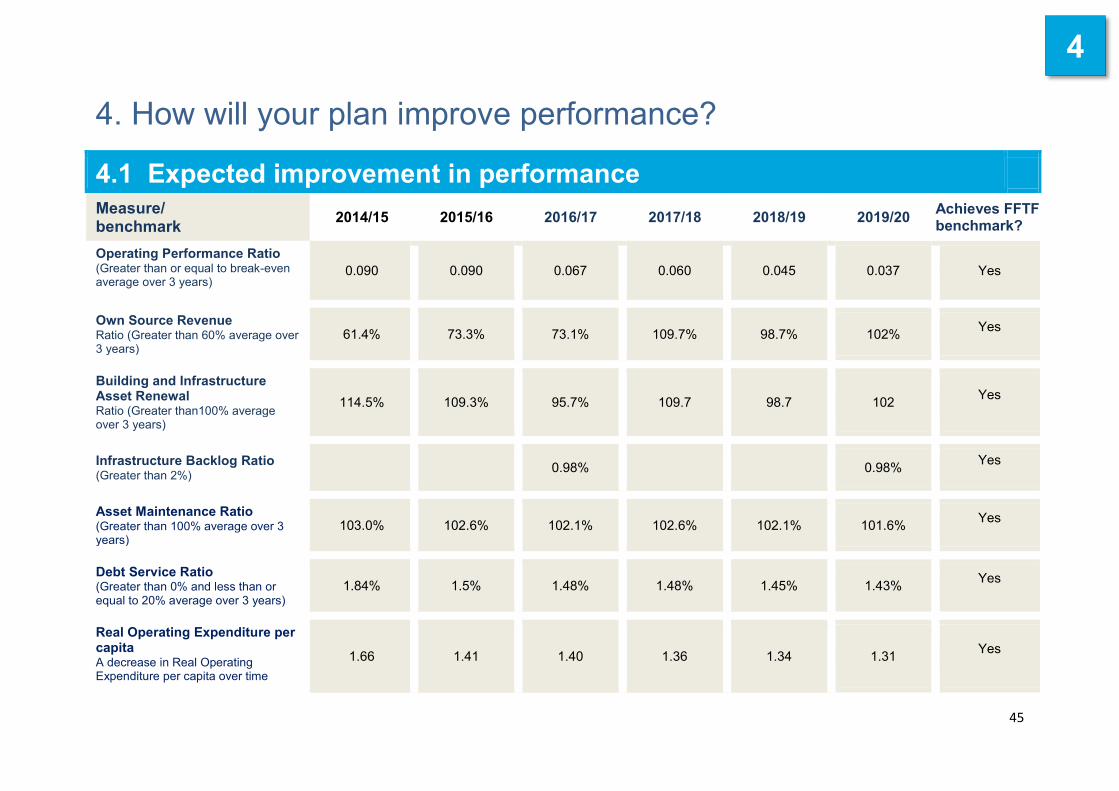
4.1 Expected improvement in performance Measure/ benchmark 2014/15 2015/16 2016/17 2017/18 2018/19 2019/20 Achieves FFTF
benchmark?
Operating Performance Ratio (Greater than or equal to break-even average over 3 years) 0.090 0.090 0.067 0.060 0.045 0.037 Yes
Own Source Revenue Ratio (Greater than 60% average over 3 years) 61.4% 73.3% 73.1% 109.7% 98.7% 102% Yes
Building and Infrastructure Asset Renewal Ratio (Greater than100% average over 3 years)
114.5% 109.3% 95.7% 109.7 98.7 102 Yes
Infrastructure Backlog Ratio (Greater than 2%) 0.98% 0.98% Yes
Asset Maintenance Ratio (Greater than 100% average over 3 years) 103.0% 102.6% 102.1% 102.6% 102.1% 101.6% Yes
Debt Service Ratio (Greater than 0% and less than or equal to 20% average over 3 years) 1.84% 1.5% 1.48% 1.48% 1.45% 1.43% Yes
Real Operating Expenditure per capita A decrease in Real Operating Expenditure per capita over time
1.66 1.41 1.40 1.36 1.34 1.31 Yes
4
46
4.1 Expected improvement in performance
If, after implementing your plan, your council may still not achieve all of the Fit for the Future benchmarks, please explain the likely reasons why. For example, historical constraints, trade-offs between criteria, longer time required.
4
47
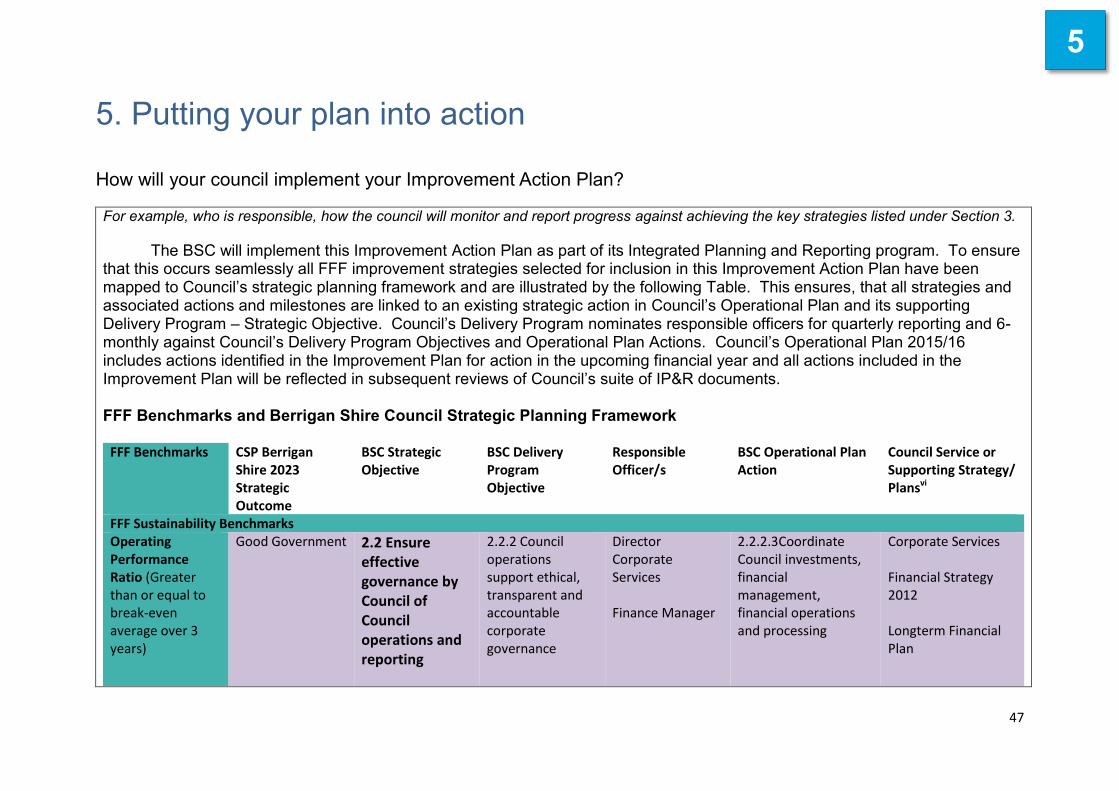
5. Putting your plan into action How will your council implement your Improvement Action Plan? For example, who is responsible, how the council will monitor and report progress against achieving the key strategies listed under Section 3.
The BSC will implement this Improvement Action Plan as part of its Integrated Planning and Reporting program. To ensure that this occurs seamlessly all FFF improvement strategies selected for inclusion in this Improvement Action Plan have been mapped to Council’s strategic planning framework and are illustrated by the following Table. This ensures, that all strategies and associated actions and milestones are linked to an existing strategic action in Council’s Operational Plan and its supporting Delivery Program – Strategic Objective. Council’s Delivery Program nominates responsible officers for quarterly reporting and 6-monthly against Council’s Delivery Program Objectives and Operational Plan Actions. Council’s Operational Plan 2015/16 includes actions identified in the Improvement Plan for action in the upcoming financial year and all actions included in the Improvement Plan will be reflected in subsequent reviews of Council’s suite of IP&R documents. FFF Benchmarks and Berrigan Shire Council Strategic Planning Framework
FFF Benchmarks CSP Berrigan Shire 2023 Strategic Outcome
BSC Strategic Objective
BSC Delivery Program Objective
Responsible Officer/s
BSC Operational Plan Action
Council Service or Supporting Strategy/ Plansvi
FFF Sustainability Benchmarks Operating Performance Ratio (Greater than or equal to break-even average over 3 years)
Good Government 2.2 Ensure effective governance by Council of Council operations and reporting
2.2.2 Council operations support ethical, transparent and accountable corporate governance
Director Corporate Services Finance Manager
2.2.2.3Coordinate Council investments, financial management, financial operations and processing
Corporate Services Financial Strategy 2012 Longterm Financial Plan
5
48
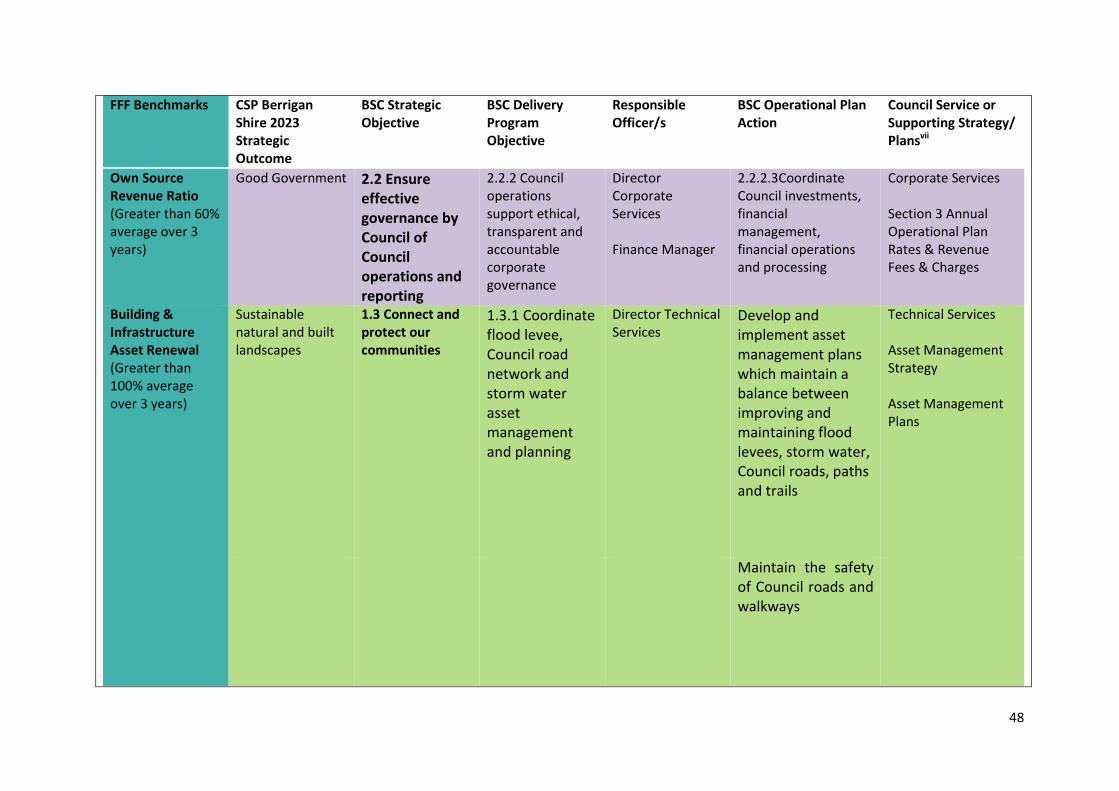
FFF Benchmarks CSP Berrigan Shire 2023 Strategic Outcome
BSC Strategic Objective
BSC Delivery Program Objective
Responsible Officer/s
BSC Operational Plan Action
Council Service or Supporting Strategy/ Plansvii
Own Source Revenue Ratio (Greater than 60% average over 3 years)
Good Government 2.2 Ensure effective governance by Council of Council operations and reporting
2.2.2 Council operations support ethical, transparent and accountable corporate governance
Director Corporate Services Finance Manager
2.2.2.3Coordinate Council investments, financial management, financial operations and processing
Corporate Services Section 3 Annual Operational Plan Rates & Revenue Fees & Charges
Building & Infrastructure Asset Renewal (Greater than 100% average over 3 years)
Sustainable natural and built landscapes
1.3 Connect and protect our communities
1.3.1 Coordinate flood levee, Council road network and storm water asset management and planning
Director Technical Services
Develop and implement asset management plans which maintain a balance between improving and maintaining flood levees, storm water, Council roads, paths and trails
Technical Services Asset Management Strategy Asset Management Plans
Maintain the safety of Council roads and walkways

49
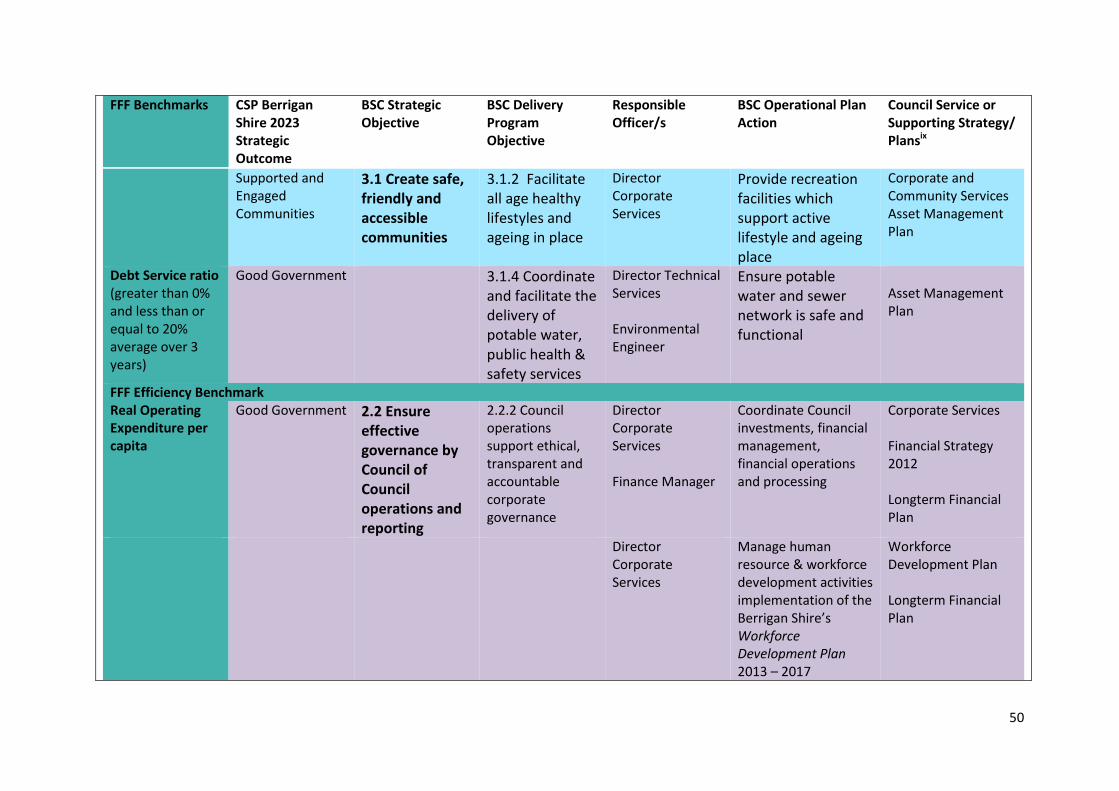
FFF Benchmarks CSP Berrigan Shire 2023 Strategic Outcome
BSC Strategic Objective
BSC Delivery Program Objective
Responsible Officer/s
BSC Operational Plan Action
Council Service or Supporting Strategy/ Plansviii
Building & Infrastructure Asset Renewal (Greater than 100% average over 3 years)
Supported and Engaged Communities
3.1 Create safe, friendly and accessible communities
3.1.2 Facilitate all age healthy lifestyles and ageing in place
Director Corporate Services
Provide recreation facilities which support active lifestyle and ageing place
Corporate and Community Services Asset Management Plan
3.1.4 Coordinate and facilitate the delivery of potable water, public health and safety services
Director Technical Services Environmental Engineer
Ensure potable water and sewer network is safe and functional
Asset Management Plan Water Supply Asset Management Plan
FFF Infrastructure and service management Benchmarks Infrastructure backlog ratio (less than 2 %)
Sustainable natural and built landscapes
1.3 Connect and protect our communities
1.3.1 Coordinate flood levee, Council road network and storm water asset management and planning
Director Technical Services
Develop and implement asset management plans which maintain a balance between improving and maintaining flood levees, storm water, Council roads, paths and trails
Technical Services Asset Management Strategy Asset Management Plans-
50
FFF Benchmarks CSP Berrigan Shire 2023 Strategic Outcome
BSC Strategic Objective
BSC Delivery Program Objective
Responsible Officer/s
BSC Operational Plan Action
Council Service or Supporting Strategy/ Plansix
Supported and Engaged Communities
3.1 Create safe, friendly and accessible communities
3.1.2 Facilitate all age healthy lifestyles and ageing in place
Director Corporate Services
Provide recreation facilities which support active lifestyle and ageing place
Corporate and Community Services Asset Management Plan
Debt Service ratio (greater than 0% and less than or equal to 20% average over 3 years)
Good Government 3.1.4 Coordinate and facilitate the delivery of potable water, public health & safety services
Director Technical Services Environmental Engineer
Ensure potable water and sewer network is safe and functional
Asset Management Plan
FFF Efficiency Benchmark Real Operating Expenditure per capita
Good Government
2.2 Ensure effective governance by Council of Council operations and reporting
2.2.2 Council operations support ethical, transparent and accountable corporate governance
Director Corporate Services Finance Manager
Coordinate Council investments, financial management, financial operations and processing
Corporate Services Financial Strategy 2012 Longterm Financial Plan
Director Corporate Services
Manage human resource & workforce development activities implementation of the Berrigan Shire’s Workforce Development Plan 2013 – 2017
Workforce Development Plan Longterm Financial Plan
51
ii http://forecast.id.com.au/Berrigan accessed 9/1/2015
iii Australian Bureau of Statistics accessed 18/6/15 at
http://www.censusdata.abs.gov.au/census_services/getproduct/census/2011/quickstat/LGA14250?opendocument&navpos=220 iv Determined by Council as ‘A reduction in the number of Council’s in the region assessed as being ‘at risk’ by the ILGRP and evidenced by a Council’s performance against
FFF benchmarks.’ v http://forecast.id.com.au/Berrigan accessed 9/1/2015
vi Council Strategies and Supporting Plans nominated can be accessed Council’s Website
http://www.berriganshire.nsw.gov.au/Council/Documents/ManagementPlansCodesReports.aspx vii
Council Strategies and Supporting Plans nominated can be accessed Council’s Website http://www.berriganshire.nsw.gov.au/Council/Documents/ManagementPlansCodesReports.aspx viii
Council Strategies and Supporting Plans nominated can be accessed Council’s Website http://www.berriganshire.nsw.gov.au/Council/Documents/ManagementPlansCodesReports.aspx ix Council Strategies and Supporting Plans nominated can be accessed Council’s Website
http://www.berriganshire.nsw.gov.au/Council/Documents/ManagementPlansCodesReports.aspx