country analysis brief: united kingdom - eia.gov · flat to increasing (figure 3). the uk has been...
TRANSCRIPT
1
Country Analysis Brief: United Kingdom
Last Updated: March 19, 2018
Overview The United Kingdom (UK) is the second-largest producer of oil and the third-largest producer of natural gas in OECD Europe.
United Kingdom (UK) oil and natural gas production have grown on average almost 9% and 4% per year, respectively, from 2014 through 2016. Among European countries in the Organization for Economic Cooperation and Development (OECD), the UK was the second-largest producer of petroleum and other liquids in 2016; only Norway produced more. The UK was the third-largest producer of natural gas in OECD Europe, surpassed only by Norway and the Netherlands. High oil and natural gas prices through late 2014 encouraged high levels of investment in the industry and have led to recent production increases. However, since then prices and investment have declined, and production is likely to return to its long-term declining trend.
The UK is the fifth-largest economy in the world in terms of gross domestic product. Following years as a net exporter of crude oil and natural gas, the UK became a net importer of both fuels in 2004 and 2005, respectively, and in 2013 the UK became a net importer of petroleum products, making it a net importer of all fossil fuels for the first time.
On June 23, 2016, in a general referendum, the UK voted to leave the European Union (EU). Britain’s exit from the EU has been commonly termed Brexit. On June 19, 2017, the UK and the EU began negotiating the terms under which the UK would leave the EU. Among the concerns for the oil and natural gas industry are the potential for Brexit to impact tariffs on imports and exports and the potential impact on the employment of EU workers in the UK oil and natural gas industry.1
Renewable energy use, particularly in the electric power sector, has more than doubled in the UK over the past decade (2007–16). However, petroleum and natural gas continue to account for most of the UK's energy consumption. In 2016, petroleum and natural gas each accounted for 38% of total energy consumption (Figure 2).2 The share of coal in total energy consumption in the UK has declined rapidly over the past several years from 19% in 2012 to 6% in 2016.

2
Figure 1. Map of United Kingdom Source: Central Intelligence Agency, The World Factbook
petroleum38%
natural gas38%
coal6%
renewablesand
nuclear17%
other1%
Figure 2. United Kingdom total primary energy consumption by source, 2016
Source: U.S. Energy Information Administration based on Digest of UK Energy Statistics

3
Petroleum and other liquids The UK's oil production and consumption have been on a long-term declining trend, although since 2014, both have generally been flat or increasing.
Oil consumption in the UK peaked in 1973 at about 2.4 million barrels per day (b/d) before declining to 1.5 million b/d in 1983, and recovering to average 1.8 million b/d from the late 1980s through 2007. Since 2007, consumption has been gradually declining, reaching 1.5 million b/d in both 2013 and 2014. Petroleum and other liquids production peaked in 1999 at slightly less than 3.0 million b/d before declining to 0.9 million b/d in 2014. Since 2014, consumption and production have both been generally flat to increasing (Figure 3). The UK has been a net importer of crude oil since 2005, and in 2013, the country also became a net importer of petroleum products.
Sector organization
The UK government has decreased tax rates for the oil and natural gas sector to encourage investment by making UK projects more competitive.
The UK government does not hold a direct interest in oil production, but the sector remains important to the government because of its contributions to the overall economy. According to the UK’s Oil and Gas Authority (OGA), in 2016 the oil and natural gas industry spent nearly 9 billion British pounds sterling (GBP) on capital expenditures (more than US$12 billion) and more than GBP 8 billion on operations (more than US$11 billion).3 The OGA is a government-owned company charged with both regulating
0.0
0.2
0.4
0.6
0.8
1.0
1.2
1.4
1.6
1.8
2.0
2006 2007 2008 2009 2010 2011 2012 2013 2014 2015 2016 2017
Source: U.S. Energy Information Administration
Figure 3. United Kingdom petroleum and other liquids production and consumptionmillion barrels per day
consumption
production

4
and promoting the oil and natural gas industry in the UK. Its responsibilities include issuing oil and natural gas licenses, collecting data from license holders, and working with the government and private companies to promote investment, collaboration, and efficiency in the industry.
In 2011, the UK government implemented several changes in tax structures and rates that applied to production from the UK continental shelf (UKCS). Collectively, these changes significantly increased tax rates on the oil and natural gas industry in the UK. Higher tax rates, along with high operating and decommissioning costs for fields in the North Sea, made UKCS projects less competitive. A report commissioned by the UK government in 2013 recommended adopting a strategy for Maximizing Economic Recovery (MER) from the UKCS. The government’s implementation of the report’s recommendations included decreasing the maximum marginal tax rates on profits from oil and natural gas production from 81% to 40%.
Oil and natural gas taxes in the UK have two components, the Ring-Fence Corporation Tax (RFCT), with a maximum rate of 30%, and the Supplementary Charge (SC), with a maximum rate of 10%. Tax rates can be lower after credits for capital investment or other reductions are applied. A third part of oil and natural gas taxes, the Petroleum Revenue Tax (PRT), has been permanently reduced to zero, but companies may still claim losses (such as for decommissioning expenses) against past PRT payments, which can result in a tax refund.4 These taxes are in addition to the normal direct and indirect taxes that companies pay including employment taxes, value-added taxes (VAT), and customs duties.
For the 2016–17 fiscal year, UK government revenues from the oil and natural gas industry were the lowest since records began in the 1968–69 fiscal year. Revenues from the RFCT and SC amounted to GBP 336 million, but the PRT resulted in a charge to the government of GBP 654 million, which resulted in total net revenues of negative GBP 316 million.5 However, government revenues from customs duties, VAT, employment, and other taxes not separately reported for the oil and natural gas industry are estimated to have exceeded GBP 1 billion.6
Exploration and production
UK total petroleum and other liquids production grew on average almost 9% per year from 2014 through 2016.
Oil production peaked in 1999 at slightly less than 3.0 million b/d after oil companies developed a number of oil fields in the North Sea. After 1999, petroleum and other liquids production in the UK declined at an average annual rate of 8% through 2014, when production fell to 0.9 million b/d. From 2014 through 2016, production grew on average almost 9% per year.7 Production in 2017 was nearly the same as in 2016.
Much of the increase in production since 2014 is attributable to new fields brought online over the past couple years. Petroleum development projects in the North Sea generally have long lead times, meaning that production from a new field occurs several years after the decision to develop that field. Thus, the recent increases in production are mainly a result of investment decisions made several years ago, when Brent crude oil prices were much higher.
Although production in the UK has not yet responded to lower oil prices, investment in the UK’s oil and natural gas industry is declining. This decline will likely lead to lower production in the future.
According to the Oil & Gas Journal (OGJ), the UK had 2.1 billion barrels of proved crude oil reserves as of the end of 2017, almost 20% lower than the level at the end of 2016.8 Most of the UK's reserves are

5
located offshore on the UKCS, and most of the liquids production occurs in the central and northern sections of the North Sea.
Oil grades
Three main grades of oil are produced in the UK: Flotta, Forties, and Brent blends. They are generally light and sweet, which makes them attractive to foreign buyers. Flotta is the smallest and lowest-quality (36.64° API and 0.66% sulfur) stream produced in the UK. Flotta crude oil is loaded at the Repsol Sinopec Resources-operated Flotta terminal in the Orkney Islands, Scotland.9
Forties blend is made up of oil from more than 50 fields spread over a large area of the North Sea, the biggest of which is the Buzzard oil field. Forties blend is a light (about 39° API) sweet (about 0.7% sulfur) crude oil, but the overall quality can vary based on Buzzard field volumes, which are heavier (32.6° API) and more sour (1.44% sulfur) than the rest of the blend volumes. The Forties system occupies most of the Central North Sea, located south of the Brent complex and east of Flotta. Once produced, Forties blend is shipped via the 105-mile pipeline to Cruden Bay, Scotland, where it is pumped another 130 miles to Hound Point, at the Forties' loading port, which is also in Scotland.10
Brent blend is a light (40.1° API), sweet crude (0.35% sulfur).11 More than two dozen UK fields contribute to the blend, although very little production comes from the once-prolific Brent field, after which the stream was named. The Brent blend is transported to the Sullom Voe terminal via pipelines. This terminal, located in Scotland’s Shetland Islands, is operated by Enquest, which acquired a 3% stake and the operatorship of the terminal from BP in 2017.12 Despite the declining physical volumes associated with the Brent blend, its importance as a financial benchmark is increasing.
Brent benchmark crude
A benchmark crude is a specific crude oil that is widely and actively bought and sold, and to which other types of crude oil can be compared to determine a price by an agreed-upon differential. The Brent benchmark, the most widely-used global crude oil benchmark, is composed of five crude oil blends: Brent, Forties, Ekofisk, Oseberg (BFOE), and Troll, which was added January 1, 2018. The Brent and Forties blends are produced offshore in the waters of the UK, and the Ekofisk, Oseberg, and Troll blends are mainly produced offshore in the waters of Norway.
The Brent benchmark was originally based on the output of the Brent field, a single field in the UK’s sector of the North Sea. At its peak in 1984, the Brent field alone produced more than 400,000 b/d from four platforms. During the late 1980s, production declined rapidly, and after a brief resurgence in the early 1990s, the declines resumed. In 2014, production ceased from two of the three remaining, operating platforms in the Brent field. Production from the single remaining platform in 2016 averaged less than 1,000 b/d and is likely to be shut down in the near future, leaving the Brent blend to continue on with no Brent crude oil.
As production from the Brent field declined, other fields and blends were added. Although the benchmark itself accounts for only a small portion of total world crude oil production, it remains a key indicator for world crude oil pricing.
UK's oil fields and operators
In 2016, Nexen was the largest oil field operator in the UK in terms of oil production. Nexen is a wholly owned subsidiary of the China National Offshore Oil Corporation (CNOOC). In 2016, Nexen operated nine fields in the UK, which produced a total of about 235,000 b/d in 2016. Nexen-operated fields accounted for 24% of total UK production in 2016.
6
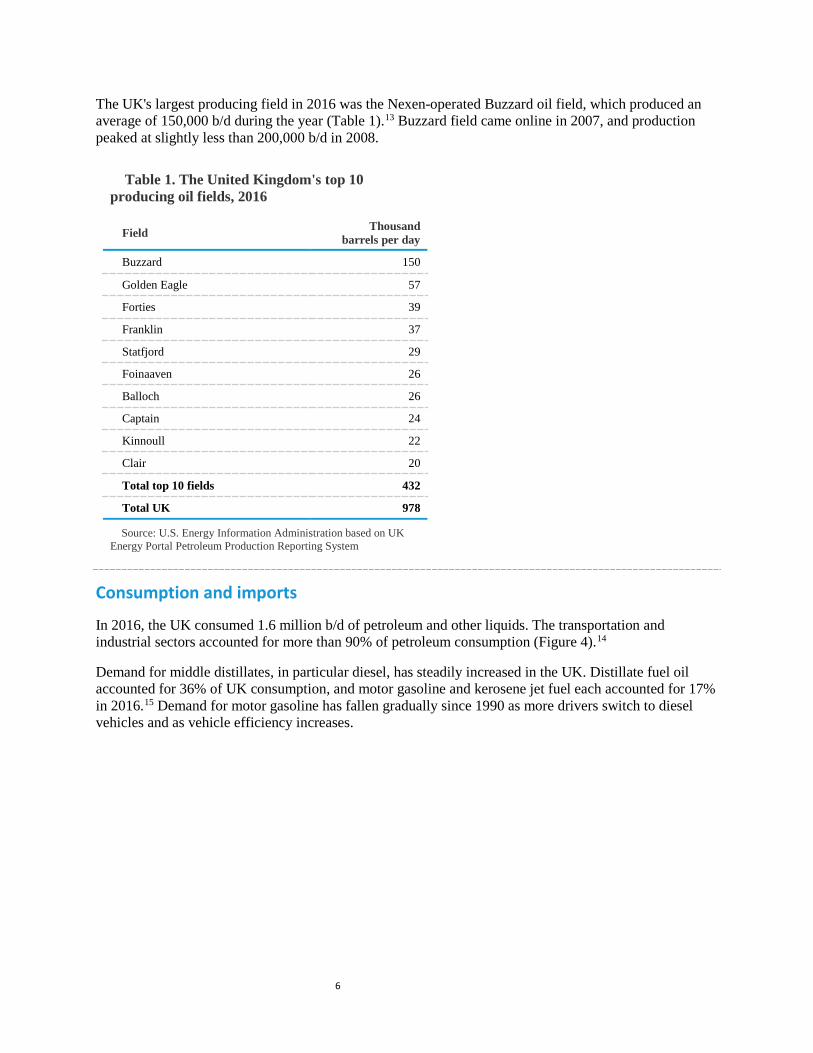
The UK's largest producing field in 2016 was the Nexen-operated Buzzard oil field, which produced an average of 150,000 b/d during the year (Table 1).13 Buzzard field came online in 2007, and production peaked at slightly less than 200,000 b/d in 2008.
Table 1. The United Kingdom's top 10 producing oil fields, 2016
Field Thousand barrels per day
Buzzard 150
Golden Eagle 57
Forties 39
Franklin 37
Statfjord 29
Foinaaven 26
Balloch 26
Captain 24
Kinnoull 22
Clair 20
Total top 10 fields 432
Total UK 978
Source: U.S. Energy Information Administration based on UK Energy Portal Petroleum Production Reporting System
Consumption and imports
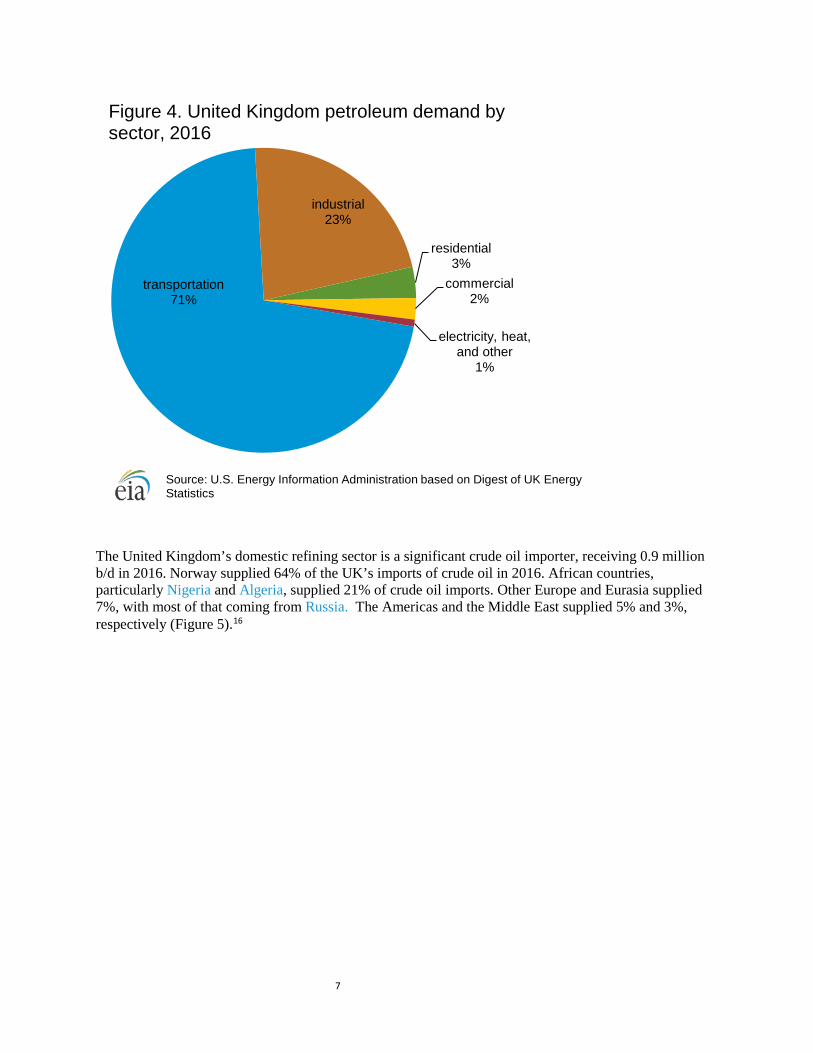
In 2016, the UK consumed 1.6 million b/d of petroleum and other liquids. The transportation and industrial sectors accounted for more than 90% of petroleum consumption (Figure 4).14
Demand for middle distillates, in particular diesel, has steadily increased in the UK. Distillate fuel oil accounted for 36% of UK consumption, and motor gasoline and kerosene jet fuel each accounted for 17% in 2016.15 Demand for motor gasoline has fallen gradually since 1990 as more drivers switch to diesel vehicles and as vehicle efficiency increases.
7
The United Kingdom’s domestic refining sector is a significant crude oil importer, receiving 0.9 million b/d in 2016. Norway supplied 64% of the UK’s imports of crude oil in 2016. African countries, particularly Nigeria and Algeria, supplied 21% of crude oil imports. Other Europe and Eurasia supplied 7%, with most of that coming from Russia. The Americas and the Middle East supplied 5% and 3%, respectively (Figure 5).16
transportation71%
industrial23%
residential3%
commercial2%
electricity, heat, and other
1%
Figure 4. United Kingdom petroleum demand by sector, 2016
Source: U.S. Energy Information Administration based on Digest of UK Energy Statistics

8
Exports
Despite the large declines in oil production over the past few years, the UK is still one of the largest petroleum producers and exporters in Europe. The country exported about 600,000 b/d of crude oil in 2016.
Once a major exporter of oil, UK exports have dropped along with decreasing domestic production. UK crude oil exports peaked in 2000 at 1.8 million b/d, declining to 0.6 million b/d in 2016.17 However, despite being a net importer of crude oil and petroleum products, the UK is still one of the largest petroleum producers and exporters in Europe.
Most of the country’s crude oil exports (72%) went to EU countries, mainly the Netherlands and Germany. The bulk of the exports to Germany are for refining and consumption there, while exports to the Netherlands include oil ultimately destined for other countries. Most of the non-EU export trade was with China (14%) and South Korea (8%) (Figure 6).18
Norway64%
Nigeria7%
Russia6%
Algeria5%
Saudi Arabia3%
Canada3%
Angola2%
Libya2%
United States1%
Equatorial Guinea1%
other4%
Figure 5. United Kingdom crude oil and condensate imports by origin, 2016
Source: U.S. Energy Information Administration based on UK TradeInfo

9
Netherlands35%
Germany18%
China14%
South Korea
8%
France7%
Spain5%
Italy3%
United States3%
Sweden2%Canada
2%other2%
Figure 6. United Kingdom crude oil and condensate exports by destination, 2016
Source: U.S. Energy Information Administration based on UK TradeInfo

10
Pipelines
The UK has an extensive network of pipelines that carry oil extracted from North Sea platforms to coastal terminals in Scotland and in northern England. The network includes six major pipelines (Table 2).19 Many smaller pipelines transport petroleum liquids from individual fields to the major pipelines for transport to shore. Pipelines in the UK are privately owned and operated; however, any qualified shipper can access the pipelines.
Table 2. United Kingdom's major crude and condensate pipelines
Facility Status
Capacity (million b/d)
Total length (miles) Origin Destination Details
Norpipe operating 0.8 220
Ekofisk area fields (Norway) with a spur to UK fields
Teesside, England oil terminal and refinery
started operations in 1975; operated by ConocoPhillips
Piper-Flotta operating 0.4 130
Piper, Claymore, Golden Eagle and other nearby fields
Flotta oil terminal, Orkney Islands, Scotland
started operations in 1976; operated by Repsol Sinopec Resources
Brent Pipeline System (BPS) operating 0.1 95
Cormorant-A platform Sullom Voe terminal
started operations in 1978; operated by TAQA
Ninian Pipeline System operating 0.9 109 Ninian area fields Sullom Voe terminal
started operations in 1978; operated by EnQuest which acquired a stake in the pipeline and operatorship of it from BP in 2017
Forties Pipeline System (FPS) operating 0.6 235 Forties area fields
Hound Point crude export terminal and Grangemouth refinery and petrochemical complex
started operations in 1975; operated by Ineos which acquired the pipeline from BP in 2017
Bruce-Forties operating 0.3 154 Bruce area fields Forties Pipeline System
started operations in 1993; operated by BP
Sources: U. S. Energy Information Administration based on ConocoPhillips, Repsol Sinopec Resources, TAQA, Enquest, Ineos, and BP

11
Refining sector
The UK had 1.4 million b/d of refining capacity at the end of 2017, according to OGJ.20 Refinery output decreased by 2% from 2015 to 2016.21
After a long period as a net exporter of petroleum products, the UK became a net importer of petroleum products in 2013, with total net product imports growing to 215,000 b/d in 2016. UK refineries produce more gasoline and fuel oil than is used domestically, so the UK remains a net exporter of these products. However, because UK refineries cannot meet local demand for many other fuels, including diesel, imports continue to grow. Net diesel imports in 2016 were 242,000 b/d, up about 10% from the 2015 level. In 2016, net imports of diesel accounted for 48% of total UK diesel demand.22 The largest source of imported diesel was the United States, accounting for 24% of total diesel imports in 2016. Russia accounted for 21% of UK diesel imports, and the Netherlands accounted for 19%.23
Hydrocarbon gas liquids UK production of hydrocarbon gas liquids (HGL) has been generally declining, reflecting the downward trend in UK natural gas production and refinery output. HGL refers to both the natural gas liquids (paraffins or alkanes such as ethane, propane, and butanes) and to olefins (alkenes) produced by natural gas processing plants, fractionators, crude oil refineries, and condensate splitters but excludes liquefied natural gas and aromatics. HGL are produced in association with both natural gas and petroleum products.
0
10
20
30
40
50
60
70
80
90
100
Source: U.S. Energy Information Administration based on Digest of UK Energy Statistics
Figure 7. United Kingdom ethane supplythousand barrels per day
production
imports
12
As a result of falling natural gas production in the North Sea, UK domestic ethane production declined from a peak of 93,000 b/d in 1999 down to 16,000 b/d in 2015 (Figure 7).24 UK petrochemical producers which require ethane as a feedstock, began importing ethane from Norway in 2007, but supplies proved insufficient. One petrochemical plant, the INEOS Train 2 ethylene cracker at Grangemouth, was shut.25 More recent imports from the United States, starting in September 2016, have allowed both a restart of the INEOS Train 2 plant as well as the increase or re-introduction of ethane as feedstock to other ethylene crackers in the UK, including the ExxonMobil/Shell plant at Mossmorran and the SABIC plant at Wilton.26
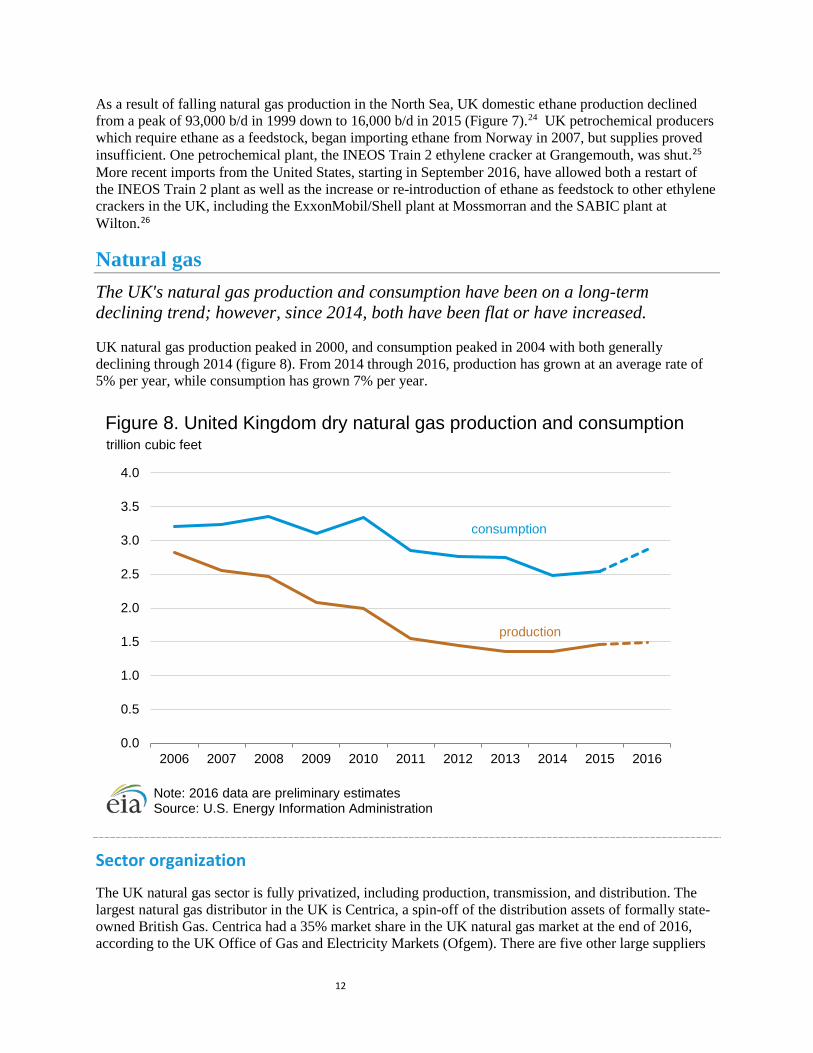
Natural gas The UK's natural gas production and consumption have been on a long-term declining trend; however, since 2014, both have been flat or have increased.
UK natural gas production peaked in 2000, and consumption peaked in 2004 with both generally declining through 2014 (figure 8). From 2014 through 2016, production has grown at an average rate of 5% per year, while consumption has grown 7% per year.
Sector organization
The UK natural gas sector is fully privatized, including production, transmission, and distribution. The largest natural gas distributor in the UK is Centrica, a spin-off of the distribution assets of formally state-owned British Gas. Centrica had a 35% market share in the UK natural gas market at the end of 2016, according to the UK Office of Gas and Electricity Markets (Ofgem). There are five other large suppliers
0.0
0.5
1.0
1.5
2.0
2.5
3.0
3.5
4.0
2006 2007 2008 2009 2010 2011 2012 2013 2014 2015 2016
Note: 2016 data are preliminary estimatesSource: U.S. Energy Information Administration
Figure 8. United Kingdom dry natural gas production and consumptiontrillion cubic feet
consumption
production

13
(SSE, E. On, Scottish Power, RWE nPower, and EDF) that each had a market share of between 8% and 12%.27
The UK natural gas distribution sector underwent a major change in 2005, when National Grid Gas sold four of the eight gas distribution networks to Scotia Gas Networks, Wales and West Utilities, and Northern Gas Networks. Prior to this sale, National Grid controlled the domestic natural gas distribution system.
Exploration and production
According to the OGJ, the UK held an estimated 6.2 trillion cubic feet (Tcf) of proved natural gas reserves as of January 2018.28 Indigenous UK natural gas production accounted for 47% of total natural gas supply in 2016 (Figure 9).29
Most of the UK's natural gas production comes from offshore liquids fields, accounting for 66% of total gross natural gas production in 2016. Natural gas production from these associated fields increased by 14% from 2015 to 2016. Natural gas from offshore dry gas fields accounted for slightly more than 33% of production in 2016, and onshore fields accounted for less than 1% of total gross natural gas production.30
UK natural gas production peaked in 2000 at 3.8 Tcf. From 2000 to 2014, production declined at an average rate of 7% per year. High oil and natural gas prices before and during 2014 helped spur high levels of investment in North Sea assets over the past several years. Investments made during the past few years have resulted in production increases since 2014. From 2014 to 2016, production increased at an average rate of 5% per year (Figure 8).
Shale
Estimates of natural gas and liquids resources in shale formations in the UK vary considerably. Shale testing is still at an early phase in the UK, and, compared with North America, the shale geology of the UK is considerably more complex. The two formations that have received the most attention so far are the Bowland shales, which are present throughout parts of northwest, central, and eastern England, and the Weald basin in southern England. The Bowland shales are more likely to hold natural gas, and the Weald is more likely to hold liquid hydrocarbons.
In 2011, hydraulic fracturing at a shale well in the Bowland basin triggered two minor earthquakes. After this incident, the UK government imposed a moratorium on hydraulic fracturing. In December 2012, the government imposed additional requirements for monitoring and controls and then allowed shale drilling and fracturing to resume. Companies must receive permission from the UK government as well as from local council governments before they can drill or fracture any new wells. Although the UK government is generally supportive of shale exploration and development activities, companies have faced opposition from local councils or environmental groups, with the first new shale well since the moratorium not drilled until 2017.
The Scottish energy minister announced a ban on hydraulic fracturing in Scotland in 2015, and in 2017, the Scottish parliament also voted for a ban, further strengthening the ban and extending it indefinitely.

14
Consumption, imports, and exports
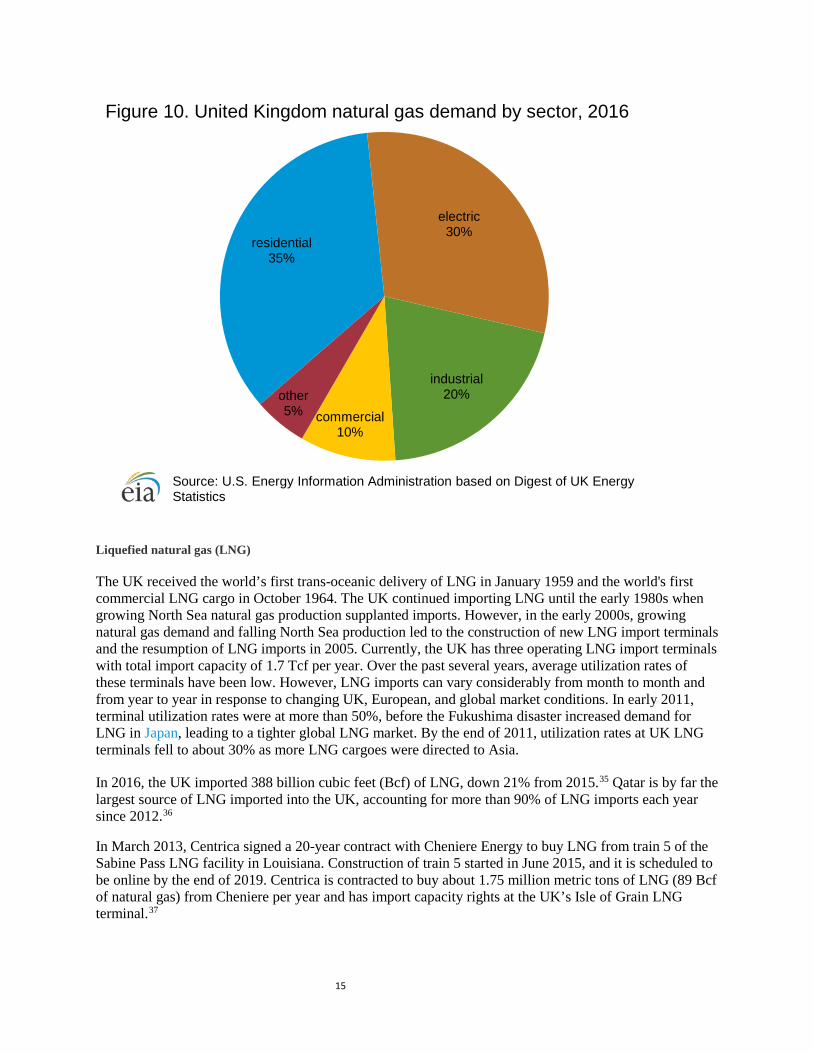
Natural gas consumption in the UK was slightly less than 2.9 Tcf in 2016, a 13% increase from the level in 2015. Residential natural gas consumption, much of which is for home heating, accounted for 35% of total consumption in 2016 (Figure 10).31 Natural gas consumption in the public electricity sector increased by more than 45% from 2015 to 2016. This large increase in natural gas use is mainly because of declining coal use in the electric sector. From 2015 to 2016, coal-fired electric capacity declined by 23%,32 and generation from coal declined by 60%.33
In 2004, the UK became a net importer of natural gas. The UK imported 1.7 Tcf of natural gas in 2016, with 77% coming by pipeline and the rest imported as liquefied natural gas (LNG). Imports from Norway and Qatar combined accounted for 87% of total imports. The UK also exports natural gas to the European continent and to the Republic of Ireland via pipeline. In 2016, UK natural gas exports totaled 0.4 Tcf.34
Norway35%
domestic production
47%
Qatar (LNG)11%
Netherlands5%
other2%
Source: U.S. Energy Information Administration based on Digest of UK Energy Statistics
Figure 9. United Kingdom natural gas supply mix, 2016
15
Liquefied natural gas (LNG)
The UK received the world’s first trans-oceanic delivery of LNG in January 1959 and the world's first commercial LNG cargo in October 1964. The UK continued importing LNG until the early 1980s when growing North Sea natural gas production supplanted imports. However, in the early 2000s, growing natural gas demand and falling North Sea production led to the construction of new LNG import terminals and the resumption of LNG imports in 2005. Currently, the UK has three operating LNG import terminals with total import capacity of 1.7 Tcf per year. Over the past several years, average utilization rates of these terminals have been low. However, LNG imports can vary considerably from month to month and from year to year in response to changing UK, European, and global market conditions. In early 2011, terminal utilization rates were at more than 50%, before the Fukushima disaster increased demand for LNG in Japan, leading to a tighter global LNG market. By the end of 2011, utilization rates at UK LNG terminals fell to about 30% as more LNG cargoes were directed to Asia.
In 2016, the UK imported 388 billion cubic feet (Bcf) of LNG, down 21% from 2015.35 Qatar is by far the largest source of LNG imported into the UK, accounting for more than 90% of LNG imports each year since 2012.36
In March 2013, Centrica signed a 20-year contract with Cheniere Energy to buy LNG from train 5 of the Sabine Pass LNG facility in Louisiana. Construction of train 5 started in June 2015, and it is scheduled to be online by the end of 2019. Centrica is contracted to buy about 1.75 million metric tons of LNG (89 Bcf of natural gas) from Cheniere per year and has import capacity rights at the UK’s Isle of Grain LNG terminal.37
residential35%
electric30%
industrial20%
commercial10%
other5%
Figure 10. United Kingdom natural gas demand by sector, 2016
Source: U.S. Energy Information Administration based on Digest of UK Energy Statistics

16
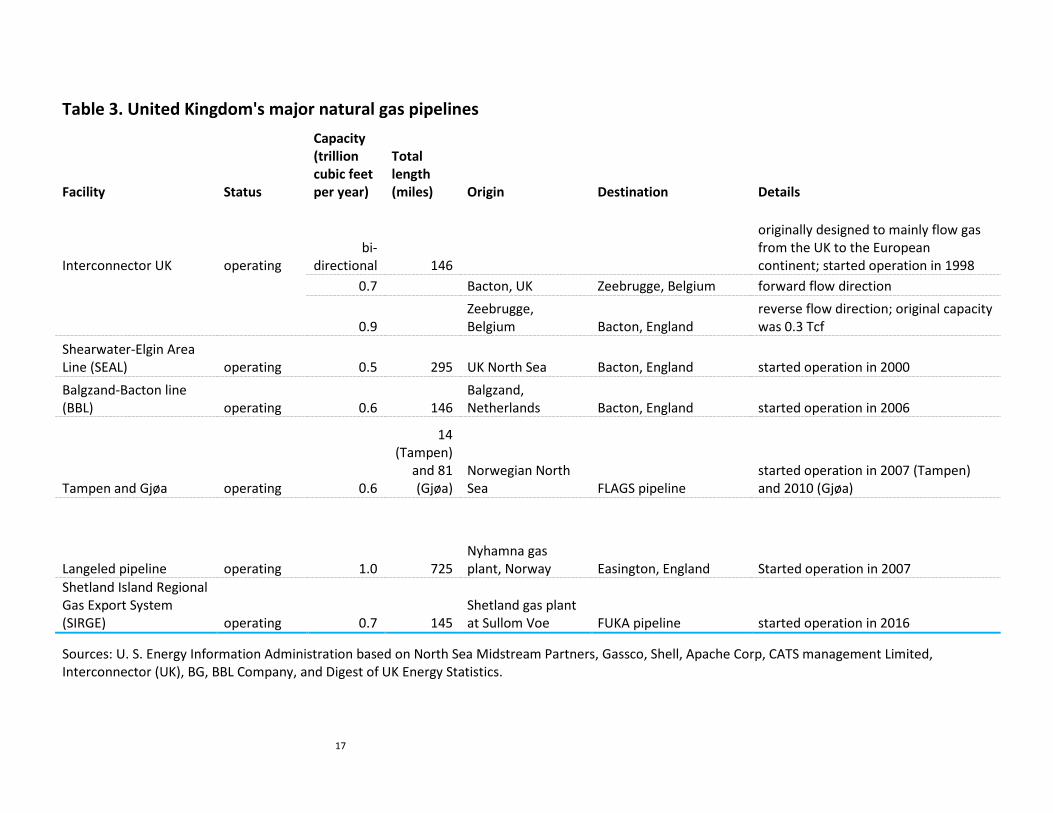
Pipelines
Several pipeline systems carry natural gas from UK and Norwegian offshore platforms to coastal landing terminals (Table 3).38 The UK also has two natural gas pipeline interconnections with the Republic of Ireland, an undersea link from Scotland, and a smaller-capacity link from Northern Ireland. The UK also has two pipeline connections with continental Europe, including the Interconnector pipeline, which is bi-directional.
Table 3. United Kingdom's major natural gas pipelines
Facility Status
Capacity (trillion cubic feet per year)
Total length (miles) Origin Destination Details
Frigg Pipeline System (FUKA) operating 0.5 225
UK and Norwegian North Sea St. Fergus, Scotland started operation in 1977
Vesterled operating 0.5 224 Norwegian North Sea St. Fergus, Scotland
started operation in 1978 as the Frigg Norwegian Pipeline; was extended and renamed Vesterled in 2001
Far north Liquids and Associated Gas System (FLAGS) operating 0.4 280
UK and Norwegian North Sea St. Fergus, Scotland started operation in 1982
Scottish Area Gas Evacuation (SAGE) operating 0.4 201
UK and Norwegian North Sea St. Fergus, Scotland started operation in 1992
Central Area Transmission System (CATS) operating 0.6 251 UK North Sea Teesside, England started operation in 1993 UK-Eire Interconnector operating 0.4 120 Moffat, Scotland Republic of Ireland started operation in 1993
17
Table 3. United Kingdom's major natural gas pipelines
Facility Status
Capacity (trillion cubic feet per year)
Total length (miles) Origin Destination Details
Interconnector UK operating bi-
directional 146
originally designed to mainly flow gas from the UK to the European continent; started operation in 1998
0.7 Bacton, UK Zeebrugge, Belgium forward flow direction
0.9 Zeebrugge, Belgium Bacton, England
reverse flow direction; original capacity was 0.3 Tcf
Shearwater-Elgin Area Line (SEAL) operating 0.5 295 UK North Sea Bacton, England started operation in 2000 Balgzand-Bacton line (BBL) operating 0.6 146
Balgzand, Netherlands Bacton, England started operation in 2006
Tampen and Gjøa operating 0.6
14 (Tampen)
and 81 (Gjøa)
Norwegian North Sea FLAGS pipeline
started operation in 2007 (Tampen) and 2010 (Gjøa)
Langeled pipeline operating 1.0 725 Nyhamna gas plant, Norway Easington, England Started operation in 2007
Shetland Island Regional Gas Export System (SIRGE) operating 0.7 145
Shetland gas plant at Sullom Voe FUKA pipeline started operation in 2016
Sources: U. S. Energy Information Administration based on North Sea Midstream Partners, Gassco, Shell, Apache Corp, CATS management Limited, Interconnector (UK), BG, BBL Company, and Digest of UK Energy Statistics.

18
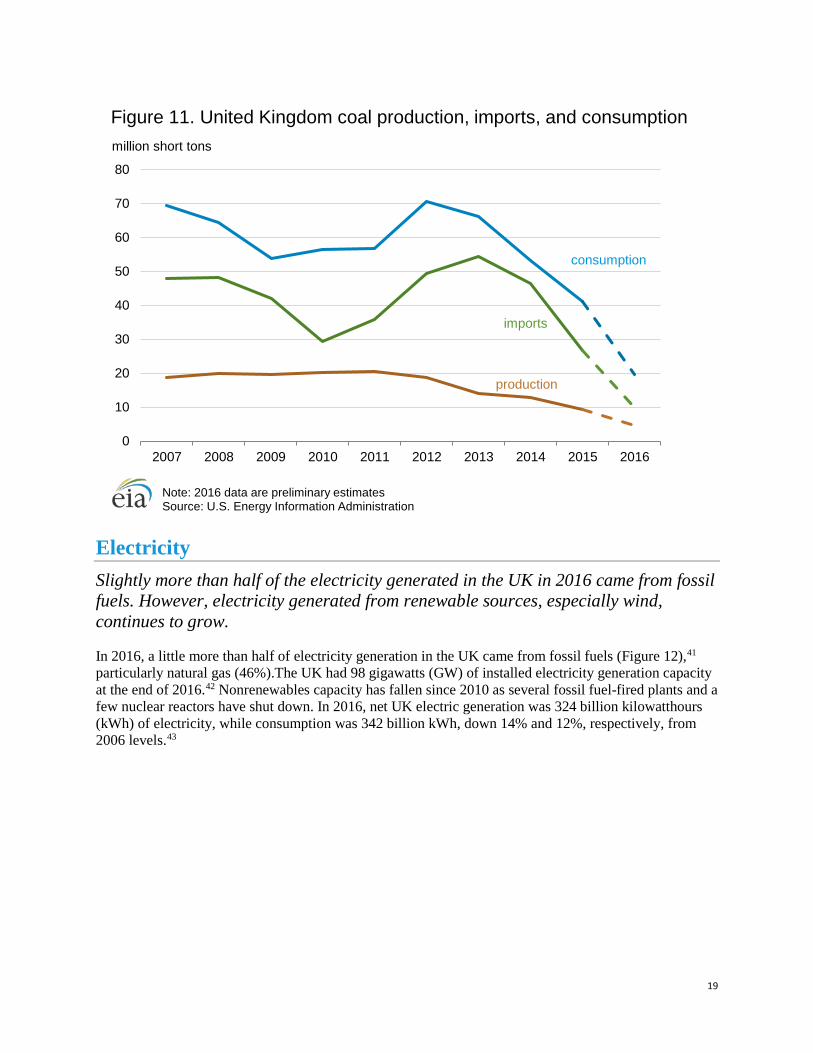
Coal Coal production in the UK is declining as a result of environmental regulations and falling consumption.
Coal production in the UK has generally been declining since the early 1900s, falling from 322 million short tons (MMst) in 1913 (the first year for which annual data are available) to a record low of 5 MMst in 2016 (Figure 11).
Coal consumption in the UK peaked at 244 MMst in 1956, the year in which the UK enacted the Clean Air Act. The Clean Air Act—prompted by the great London smog of 1952—prohibited the emission of dark smoke from industrial buildings, private homes, and railroad locomotives. At the time, industrial coal use accounted for more than half of total UK coal consumption, and railroad and home use accounted for almost a quarter of total coal consumption. The remaining coal consumption was mainly in the electric sector where coal consumption did not peak until the 1980s at slightly less than 100 MMst. Coal consumption in 2016 was 20 MMst, two-thirds of which was used in the electric sector.39
Environmental regulations, competing fuels, and competing foreign coal supply sources have been the main drivers of coal’s long decline in the UK. Natural gas began replacing coal in the 1970s when natural gas production began in the North Sea. In the 1990s, coal’s displacement by natural gas accelerated as regulatory changes opened the electric sector to more investment in natural gas-fired generation capacity. Coal consumption experienced a brief resurgence in 2012, growing 14 MMst from 2011 levels. This resurgence in demand did not extend to UK coal production but was instead accompanied by an uptick in imports. The availability of cheap coal from the United States was one of the main drivers in the growth of coal consumption, along with relatively high natural gas prices and low carbon prices. Coal consumption resumed its decline in 2013, falling an average of more than 25% per year from 2012 through 2016, as natural gas prices declined and as the UK’s Carbon Price Floor policy increased the cost of carbon emissions.
The UK had an estimated 77 MMst of recoverable coal reserves at the end of 2016, according to BP’s Statistical Review of World Energy 2017.40 Deep coal mines had been operating in the UK since the 1800s, however the last deep coal mine in the UK closed in December 2015. Several surface mines remain in operation in the UK and are mainly located in central and northern England, south Wales, and central and southern Scotland.
19
Electricity Slightly more than half of the electricity generated in the UK in 2016 came from fossil fuels. However, electricity generated from renewable sources, especially wind, continues to grow.
In 2016, a little more than half of electricity generation in the UK came from fossil fuels (Figure 12),41 particularly natural gas (46%).The UK had 98 gigawatts (GW) of installed electricity generation capacity at the end of 2016.42 Nonrenewables capacity has fallen since 2010 as several fossil fuel-fired plants and a few nuclear reactors have shut down. In 2016, net UK electric generation was 324 billion kilowatthours (kWh) of electricity, while consumption was 342 billion kWh, down 14% and 12%, respectively, from 2006 levels.43
0
10
20
30
40
50
60
70
80
2007 2008 2009 2010 2011 2012 2013 2014 2015 2016
Note: 2016 data are preliminary estimatesSource: U.S. Energy Information Administration
Figure 11. United Kingdom coal production, imports, and consumptionmillion short tons
consumption
production
imports

20
Sector organization
The UK has a privatized electricity sector, where electric generators and marketers operate in a competitive environment. EDF Energy, a subsidiary of Électricité de France, was the largest supplier of electricity to the national transmission system in 2016, accounting for 24% of generation. The retail electric market is dominated by six large providers, with British Gas accounting for about one-quarter of the total market. The share of independent providers in the retail market is growing, accounting for about 15% of the market at the end of 2016, up from 1% at the beginning of 2012.44
The UK electric transmission system is regulated and is managed by independent system operators. The electric transmission systems of England, Wales, and Scotland are fully integrated and are operated as a single market by National Grid Electricity Transmission plc (National Grid), which also owns the electric transmission system in England and Wales. The electricity grid in Northern Ireland is integrated with the grid of the Republic of Ireland, and the combined system is operated by the Single Electricity Market Operator (SEMO). The UK transmission system has two interconnections with the Irish system—one between Scotland and Northern Ireland and one between Wales and the Republic of Ireland. The UK system also has two interconnections with continental Europe—one each with France and the Netherlands.45
The UK government’s energy policies have long sought to encourage the use of low-carbon sources of energy to generate electricity. The UK’s Non Fossil Fuel Obligation (NFFO) was introduced in 1990 to support nuclear and renewables generation. In 2002, the UK replaced the NFFO with the Renewables Obligation (RO), which continued support for renewables generation but did not include support for nuclear generation. The government is phasing out the RO support system, and beginning in 2017, the main method of renewables support will be via feed-in tariffs (FIT) implemented as contracts for
0%
10%
20%
30%
40%
50%
60%
biomass wind/solar hydro nuclearnatural gas coal oil and other
* note 2017 values are estimates based on data through September
Source: U.S. Energy Information Administration based on Digest of UK Energy Statistics and National Statistics: Energy Trends
Figure 12. United Kingdom electricity generation share by fuel source

21
difference (CfD). A FIT offers a guaranteed price for electricity generated by qualifying generation projects. FITs can be implemented in several ways (see Feed in Tariff). Under the UK support system, once the government establishes a FIT—also called a strike price—for a project, the government and the project developer sign a long-term CfD contract. Under the CfD, when the market price for electricity is lower than the FIT price, the government pays the generation company the difference. If the market price is higher than the FIT price, the generation company must pay the government the difference. Projects that can qualify for support under this new system include renewables generation facilities as well as projects to build nuclear power plants and carbon capture and storage facilities.
Another government program that supports the use of renewables and other low carbon sources of electricity generation is the UK’s Carbon Price Floor (CPF), established in April 2013 for the 2013–14 tax year. The UK’s CPF works in combination with the EU’s Emissions Trading System (ETS). If the EU ETS carbon price is lower than the UK CPF, electric generators have to buy credits from the UK Treasury to make up the difference. The CPF applies to both generators that produce electricity for the grid and companies that produce electricity for their own use. Since the beginning of 2012, the EU ETS carbon price has stayed below 10 Euro per metric ton of carbon (below GBP 8 per metric ton or below US$13 per metric ton). The UK CPF has gradually risen to GBP 18 per ton of carbon (about US$25 per ton), where it will remain at least through the 2019–20 fiscal year. The CPF was originally designed to rise to GBP 30 per ton of carbon in 2020 and GBP 70 per ton of carbon in 2030 (about US$40 and US$95 per ton, respectively), but was it capped to limit the impact on businesses.46
Fossil fuel generation
The share of electricity from the burning of fossil fuels is declining as renewables generation increases.
For most of the past 20 years, fossil fuels have accounted for about 70% to 80% of total electric generation, and they continue to provide most of the electricity supply in the UK. In 2008, fossil fuel-fired generation peaked at 81% of total electricity supply and has since declined to 56% in 2016. At the same time, renewables generation has grown from 5% of total generation to almost 20% of total generation.
Natural gas-fired generation provides most of the UK’s electricity, accounting for 46% of total generation in 2016. Coal and natural gas have long competed for share of the electric generation market. The relative price of the two fuels and the costs for complying with environmental regulations at any given time have been the major factors influencing the relative market shares of each fuel.
From 2009 to 2012, U.S. coal exports more than doubled, helping to push down global coal prices. Over the same period, UK natural gas prices nearly doubled, and carbon prices halved. Consequently, the share of coal-fired generation in total electricity generation increased by 12%, while the share of natural gas declined by 17%. Since 2012, coal-fired generation has lost market share as the CPF has increased the costs of carbon emissions and as several coal-fired power plants have been shut down or converted to burn biomass which is not subject to the CPF. Oil-fired power plants continue to provide minor amounts of electricity, accounting for less than 1% of total generation in 2016.

22
Nuclear
Currently accounting for one-fifth of total electricity generation, nuclear power plants are central to the UK government plans for future electricity generation.
At the end of 2017, the UK had 15 operating nuclear reactors, with a current capacity of slightly less than 9 gigawatt electric (GWe), according to the World Nuclear Association. All 15 operating reactors are owned and operated by EDF Energy. Most of the existing nuclear capacity started operations in the 1970s or 1980s and is due to be shut down by 2025.47 Nuclear power generation accounted for 20% of the country's total gross generation in 2016.48
In the 1990s and early 2000s, the UK government viewed new nuclear capacity as unappealing because of its economic costs and the problem of disposing of nuclear waste.49 Government policies began to shift toward support for new nuclear capacity, beginning in 2006, with the release of a government energy white paper declaring that nuclear generation could make a significant contribution to meeting the country’s energy goals. Recent government policy statements project that the UK will need an additional 25 GWe of new nonrenewable generating capacity by 2030 and that a significant portion of this capacity should come from new nuclear facilities.
The Hinkley Point C project is expected to be the first new nuclear facility to come online in the UK since 1995. The Hinkley Point C project is being led by EDF Energy with China General Nuclear Power Corporation (CGN) taking a minority stake in the project. The project includes building two new reactors at the existing Hinkley Point nuclear site. The two reactors will have a combined capacity of 3.2 GWe. The target start date for the first reactor was originally 2017, but the schedule has slipped pushing the likely startup date to 2026. In October 2013, the UK government agreed a CfD with EDF Energy guaranteeing a price of GBP 92.50 per MWh (about US$140 per MWh) for power generated by the Hinkley Point C project. In 2015, wholesale power prices in the UK were less than GBP 50 per MWh (about US$75 per MWh).
A total of 13 new nuclear units are planned or proposed for the UK with a total capacity of almost 18 GWe of generating capacity.50
Notes • Data in the text are the most recent available as of March 19, 2018. • Data are EIA estimates unless otherwise noted.
1 Oil & Gas UK, Economic Report 2017, (accessed January 19, 2018), pp. 31-36. 2 UK Department for Business, Energy & Industrial Strategy, Digest of UK Energy Statistics (DUKES), Energy: Chapter 1, Table 1.1 – 1.3: Aggregate energy balances, (updated July 27, 2017). 3 UK Oil and Gas Authority, Income from and Expenditure on UKCS Exploration, Development and Operating Activities - 1970 to 2016, (accessed (January 23, 2018). 4 Oil & Gas UK, Economic Report 2017, (accessed January 19, 2018), p. 55. 5 UK HM Revenue & Customs, Statistics of government revenues from UK oil and gas production, including data for fields subject to Petroleum Revenue Tax (PRT), Table 11.11 Government revenues from UK oil and gas production 1968-69 to 2016-17, (updated June 30, 2017). 6 Oil & Gas UK, Economic Report 2017, (accessed January 19, 2018), p. 59.
23
7 UK Department for Business, Energy & Industrial Strategy, Crude oil and petroleum: production, imports and exports 1890 to 2016, (updated July 27, 2017). 8 Oil & Gas Journal, "Worldwide Look at Reserves and Production," (December 4, 2017), p. 20. 9 Repsol Sinopec Resources, Flotta Terminal, (updated May 2017) 10 Ineos, Forties Blend Quality, (accessed January 22, 2018). 11 ExxonMobil, Brent blend, (accessed January 22, 2018). 12 BP Press Release, BP to sell part of interests in Magnus field and Sullom Voe terminal in UK North Sea to EnQuest, (January 24, 2017). 13 UK Oil and Gas Authority, Petroleum production reporting system (accessed January 23, 2018). 14 UK Department for Business, Energy & Industrial Strategy, Digest of UK Energy Statistics (DUKES), Petroleum: Chapter 3, Table 3.2 Petroleum products: commodity balances, (updated July 27, 2017). 15 UK Department for Business, Energy & Industrial Strategy, Energy Trends section 3: oil and oil products, Table 3.3 Supply and use of petroleum products, (updated December 21, 2017). 16 HM Revenue & Customs, UKtradeinfo, (accessed November 30, 2017). 17 UK Department for Business, Energy & Industrial Strategy, Digest of UK Energy Statistics (DUKES), Petroleum: Chapter 3, Table 3.1au: Primary oil: commodity balances - alternative units, barrels & litres, (updated July 27, 2017). 18 HM Revenue & Customs, UKtradeinfo, (accessed November 30, 2017). 19 ConocoPhillips Norway, The Pipelines, (accessed December 21, 2017); Repsol Sinopec Resources, Flotta Terminal, (updated May 2017); Taqa Global, United Kingdom Overview (accessed December 21, 2017); EnQuest, Ninian Pipeline System (accessed December 21, 2017); Ineos, Pipeline transportation, (accessed December 21, 2017); and BP, Bruce, (accessed December 21, 2017). 20 Oil & Gas Journal, "Worldwide Refineries—Capacities as of January 1, 2018," (December 4, 2017), p. 2. 21 UK Department for Business, Energy & Industrial Strategy, Energy Trends section 3: oil and oil products, Table 3.12 Refinery throughput and output of petroleum products, (updated December 21, 2017). 22 UK Department for Business, Energy & Industrial Strategy, Digest of UK Energy Statistics (DUKES), Petroleum: Chapter 3, Table 3.2 – 3.4au Petroleum products: commodity balances - alternative units, (updated July 27, 2017). 23 UK Department for Business, Energy & Industrial Strategy, Digest of UK Energy Statistics (DUKES), Petroleum: Chapter 3, Table 3.9 Imports of crude oil & petroleum products by country of origin, (updated July 27, 2017). 24 UK Department for Business, Energy & Industrial Strategy, Digest of UK Energy Statistics (DUKES), Petroleum: Chapter 3, Table 3.1 Primary oil: commodity balances, (updated July 27, 2017). 25 BBC News, Mothballed manufacturing unit at Ineos Grangemouth to be revived, (March 29, 2016). 26 Williams, Dede, Ineos Preparing to Restart Idled Cracker Train, CHEManager, (March 30, 2016). 27 UK Office of gas and electricity markets (Ofgem), Monitoring the Market, Retail market indicators, accessed January 9, 2018. 28 Oil & Gas Journal, "Worldwide Look at Reserves and Production," (December 4, 2017), p. 20. 29 UK Department for Business, Energy & Industrial Strategy, Digest of UK Energy Statistics (DUKES), Natural gas: Chapter 4, Table 4.2: Supply and consumption of natural gas and colliery methane and Table 4.5: Natural gas imports and exports, (updated July 27, 2017). 30 UK Department for Business, Energy & Industrial Strategy, Digest of UK Energy Statistics (DUKES), Natural gas: Chapter 4, Table F.2: Gas production, (updated July 27, 2017). 31 UK Department for Business, Energy & Industrial Strategy, Digest of UK Energy Statistics (DUKES), Natural gas: Chapter 4, Table 4.2: Supply and consumption of natural gas and colliery methane and Table 4.5: Natural gas imports and exports, (updated July 27, 2017). 32 UK Department for Business, Energy & Industrial Strategy, Digest of UK Energy Statistics (DUKES), Electricity, Chapter 5, Table 5.7 Plant capacity – United Kingdom, (updated July 27, 2017) 33 UK Department for Business, Energy & Industrial Strategy, Digest of UK Energy Statistics (DUKES), Electricity, Chapter 5, Table 5.6: Electricity fuel use, generation and supply, (updated July 27, 2017) 34 UK Department for Business, Energy & Industrial Strategy, Energy Trends section 4: gas, Table 4.3 Natural gas imports and exports, and Table 4.4 Natural gas imports, (updated December 21, 2017). 35 UK Department for Business, Energy & Industrial Strategy, Energy Trends section 4: gas, Table 4.3 Natural gas imports and exports, (updated December 21, 2017).

24
36 UK Department for Business, Energy & Industrial Strategy, Energy Trends section 4: gas, Table 4.4 Natural gas imports, (updated December 21, 2017). 37 Centrica, Centrica signs long-term US LNG export deal with Cheniere, (posted March 25, 2013) and Cheniere Energy, Sabine Pass Trains 5 and 6, Project Schedule, (updated June 13, 2016). 38 U.S. Energy Information Administration based on North Sea Midstream Partners, FUKA Technical Description and SIRGES (accessed December 27, 2017); Gassco, Pipelines and Platforms, (accessed December 27, 2017); Shell, SEGAL System Pipelines, (accessed December 27, 2017); Apache, SAGE, (accessed January 20, 2016); CATS Management Limited, Fast Facts, (accessed December 27, 2017); UK Department for Business, Energy & Industrial Strategy, Digest of UK Energy Statistics (DUKES), Natural gas: Chapter 4, Table 4.4: Gas storage sites and import/export facilities in the United Kingdom, (updated July 27, 2017); Interconnector (UK), Who we are, (accessed December 27, 2017); Shell, North Sea Operated Assets, (accessed December 27, 2017); and BBL Company, About BBL, (accessed December 27, 2017) 39 UK Department for Business, Energy & Industrial Strategy, Historical coal data: coal production, availability and consumption 1853 to 2016, (updated July 17, 2017). 40 BP Statistical Review of World Energy 2017, Underpinning data, (accessed December 28, 2017). 41 UK Department for Business, Energy & Industrial Strategy, Digest of UK Energy Statistics (DUKES), Electricity, Chapter 5, Table 5.5: Electricity fuel use, generation and supply, (updated July 27, 2017) and UK Department for Business, Energy & Industrial Strategy, Energy Trends, Section 5: Electricity, Table 5.1: Fuel Used in electricity generation and electricity supplied, (updated December 21, 2017). 42 UK Department for Business, Energy & Industrial Strategy, Digest of UK Energy Statistics (DUKES), Chapter 5: Electricity, Table 5.7: Plant capacity - United Kingdom and Table 6.4: Capacity of, and electricity generated from, renewable sources, (updated July 27, 2017). 43 UK Department for Business, Energy & Industrial Strategy, Digest of UK Energy Statistics (DUKES), Chapter 5: Electricity, Table 5.1: Electricity commodity balances, (updated July 27, 2017). 44 UK Office of gas and electricity markets (Ofgem), Monitoring the Market, Wholesale market indicators and Retail market indicators, accessed January 9, 2018. 45 UK Department for Business, Energy & Industrial Strategy, Digest of UK Energy Statistics (DUKES), Chapter 5: Electricity, (updated July 27, 2017), pp. 126-7. 46 Hirst, David, Carbon Price Floor (CPF) and the price support mechanism, House of Commons Library, Briefing Paper, Number 09527 (January 8, 2018). 47 World Nuclear Association, Nuclear power in the United Kingdom (updated December 2017). 48 UK Department for Business, Energy & Industrial Strategy, Digest of UK Energy Statistics (DUKES), Chapter 5: Electricity, Table 5.6: Electricity fuel use, generation and supply, (updated July 27, 2017). 49 UK Department of Trade and Industry, Our Energy Future - Creating a Low Carbon Economy (February 24, 2003). 50 World Nuclear Association, Nuclear power in the United Kingdom (updated December 2017).