€¦ · court statistics project staff. director. richard y. schauffler. senior court research...
TRANSCRIPT

NATIONAL CENTER FOR STATE COURTS
Examining the Work of State Courts: An Analysis of 2008 State Court Caseloads
www.courtstatistics.org


COURT STATISTICS PROJECT STAFF
Director
Richard Y. Schauffler
Senior court reSearch analyStS
Robert C. LaFountain Shauna M. Strickland
court reSearch analyStS
Chantal G. BromageSarah A. Gibson Ashley N. Mason
PRoGRAM SPeCiALiSt
Brenda G. otto
iNFoRMAtioN DeSiGN
Neal B. Kauder, VisualResearch, inc.
NATIONAL CENTER FOR STATE COURTS
Examining the Work of State Courts: An Analysis of 2008 State Court Caseloads
www.courtstatistics.org
A joint project of the Conference of State Court Administrators, the Bureau of Justice Statistics, and the National Center for State Courts.

R. LaFountain, R. Schauffler, S. Strickland, C. Bromage, S. Gibson & A. Mason
Examining the Work of State Courts: An Analysis of 2008 State Court Caseloads (National Center for State Courts 2010)
© Copyright 2010National Center for State CourtsISBN 978-0-89656-278-6
This project was supported by Grant No. 2009-BJ-CX-K057, awarded by the Bureau of Justice Statistics, Office of Justice Programs, U.S. Department of Justice. Points of view in this document are those of the authors and do not necessarily represent the official position or policies of the U.S. Department of Justice.
Suggested Citation

The Court Statistics Project (CSP) is made possible by the continued support of state court administrators. We owe a special debt of gratitude to the staff of the administrative offices of the courts and of the appellate courts who serve as liaisons between their offices and the CSP and who continuously seek to improve the quality, depth, and consistency of their state court data.
In our continued attempt to recognize the efforts of states that improve their statistical reporting, the CSP is again awarding the CSP Reporting Excellence Award. This icon will appear on pages that highlight particular states whose data reflects the counting rules, case type definitions, and case status categories defined in the State Court Guide to Statistical Reporting. These feature pages will highlight some of the benefits and insights that these complete data make possible.
A number of other states also made improvements in the level of detail provided by their trial courts. The enhancements to these data come as a result of implementing the data definitions, counting rules, and reporting framework published in the State Court Guide to Statistical Reporting.
We would like to acknowledge the work of the offices of the state court administrator in the following states for their important data improvement efforts: Alabama (juvenile), Arizona (civil), Colorado (juvenile), Connecticut (juvenile), District of Colombia (criminal, traffic/ordinance, and domestic relations), Georgia (criminal, traffic/ordinance), Idaho (civil), Indiana (criminal), Iowa (domestic relations), Kansas (limited jurisdiction court data), Maryland (criminal), Massachusetts (civil, criminal, traffic/ordinance), Minnesota (civil, criminal, juvenile, domestic relations, traffic/ordinance), New Hampshire (criminal), New York (domestic relations), Oklahoma (civil, domestic relations, criminal, juvenile, traffic/ordinance), South Carolina (civil, criminal), South Dakota (civil, juvenile), Tennessee (domestic relations, juvenile), Utah (civil).
This year also marks the second year since implementation of the new reporting framework for appellate court caseload statistics. We appreciate the active involvement of staff from the administrative offices of the courts and appellate courts who continue to strive toward accurately reporting appellate data.
The content and design of CSP’s reports and Web site are guided by the members of the Court Statistics Committee of the Conference of State Court Administrators (COSCA). The committee members have given generously of their time, talent, and experience, and their participation has been invaluable to project staff.
The Court Statistics Project is funded through a cooperative agreement with the Bureau of Justice Statistics (BJS). The authors wish to acknowledge the editorial review and helpful comments provided by Duren Banks at BJS.
Special thanks again to Neal Kauder of VisualResearch, Inc., for his innovative information design.
Acknowledgments
i

Donald D. Goodnow, Chair (2000 to present), Director, Administrative office of the Courts, New Hampshire
Ron titus, Vice-Chair (2005 to present), State Court Administrator, Nevada
Daniel Becker (2008 to present), State Court Administrator, Supreme Court of Utah
Hugh M. Collins (1982 to present), Judicial Administrator, Supreme Court of Louisiana
Debra Dailey (2005 to present), Manager of Research and evaluation, State Court Administrator’s office, Minnesota
theodore eisenberg (2002 to present), Professor, Cornell Law School, New York
James D. Gingerich (2009 to present), Director, Administrative office of the Courts, Arkansas
Steven C. Hollon (2008 to present), Administrative Director, Supreme Court of ohio
Collins ijoma (2005 to present), trial Court Administrator, Superior Court of New Jersey
Gerald A. Marroney (2003 to present), State Court Administrator, Supreme Court of Colorado
Hon. Aaron Ment (1991 to present), Senior Judge, Supreme Court of Connecticut
John t. olivier (1991 to present), Clerk, Supreme Court of Louisiana
Beth Riggert (2007 to present), Communications Counsel, Supreme Court of Missouri
Robert Wessels (1995 to present), Court Manager, County Criminal Courts at Law, Houston, texas
Wallace B. Jefferson, Chair, Chief Justice, Supreme Court of texas
Lilia G. Judson, Vice-Chair, executive Director, Division of State Court Administration, indiana Supreme Court
eric t. Washington, Chair-elect, Chief Judge, District of Columbia Court of Appeals
Rosalyn W. Frierson, Vice Chair-elect, State Court Administrator, South Carolina Court Administration
Christine M. Durham, Chief Justice, Supreme Court of Utah
George S. Frazza, esq., Patterson Belknap Webb & tyler LLP, New York, New York
Richard Godfrey, Kirkland & ellis LLP, Chicago, illinois
Donald D. Goodnow, Director, Administrtive office of the Courts, Supreme Court of New Hampshire
Steven C. Hollon, Administrative Director, Supreme Court of ohio
eileen A. Kato, Judge, King County District Court, Seattle, Washington
Rufus G. King, iii, Senior Judge, Superior Court of District of Columbia
Dale R. Koch, Senior Judge, Circuit Court, Portland, oregon
Alphonse F. La Porta, Ambassador (Retired), Washington, DC
W. Mark Lanier, esq., the Lanier Law Firm, Houston, texas
Charles W. Matthews, Jr., executive Vice President & General Counsel (Retired), exxonMobil Corporation, Dallas, texas
Manuel A. Medrano, Reporter, KtLA News, Los Angeles, California
Donna D. Melby, esq., Paul Hastings Janofsky & Walker, LLP, Los Angeles, California
edward W. Mullins, Jr., esq., Nelson Mullins Riley & Scarborough LLP, Columbia, South Carolina
Barbara R. Mundell, Presiding Judge, Maricopa County Superior Court, Arizona
theodore B. olson, esq., Gibson, Dunn & Crutcher LLP, Washington, DC
Robert S. Peck,esq., President, Center for Constitutional Litigation, P.C. Washington, DC
Peggy A. Quince, Justice, Supreme Court of Florida
Ronald B. Robie, Associate Justice, Court of Appeal, third Appellate District, Sacramento, California
Myron t. Steele, Chief Justice, Supreme Court of Delaware
Suzanne H. Stinson, Court Administrator, 26th Judicial District Court, Benton, Louisiana
Larry D. thompson, Senior Vice President & General Counsel, PepsiCo, Purchase, New York
Mary Campbell McQueen, President, National Center for State Courts, Williamsburg, Virginia
Court Statistics Committee, Conference of State Court Administrators
Board of Directors, National Center for State Courts
ii

The Court Statistics Project (CSP) provides the most comprehensive, up-to-date information regarding the nation’s state courts through its annual print publication, Examining the Work of State Courts, and on-line publication, State Court Caseload Statistics. These reference works are supplemented by the Caseload Highlights and Notes from the Field series. All of these publications are available at the Courts Statistics Project’s Web site, www.courtstatistics.org.
The purpose of Examining the Work of State Courts is to provide a concise, graphically oriented volume that makes state court statistics highly accessible. Examining the Work of State Courts has been designed to be interactive, giving the reader on-line access in its interactive PDF version to information that cannot reasonably be included in the text of the document. The links provided in this format encourage the use of the Web and provide the reader with additional resources that help to facilitate the understanding of the work of state courts.
State Court Caseload Statistics is a discrete on-line reference volume, containing structure charts, statewide aggregate caseload data and reporting practices, population trends, and a detailed explanation of the Court Statistics Project methodology. State Court Caseload Statistics is exclusively available on the Web at www.courtstatistics.org.
The Caseload Highlights series continues to provide short, periodic reports on specific, significant, and timely issues. Notes from the Field is a platform for use by practitioners from the state courts from which they can share their experiences and knowledge of court statistics and the implementation of data systems. The CSP recognizes that informed judges and court managers want information on a range of policy-relevant topics and want it in a timely fashion and in a condensed, readable format.
These publications are developed through a cooperative agreement with and generous support from the Bureau of Justice Statistics (BJS), part of the Office of Justice Planning at the U.S. Department of Justice.
Detailed descriptive information on court structure is provided by another National Center for State Courts (NCSC) and BJS joint project, State Court Organization. Topics covered include the number of courts and judges, judicial selection, jury qualifications and verdict rules, and processing and sentencing procedures of criminal cases. Court structure diagrams summarize the key features of each state’s court organization. The most recent edition is available through BJS and at www.ojp.usdoj.gov/bjs/abstract/sco04.htm.
Finally, the CSP continues to promote the implementation and use of the State Court Guide to Statistical Reporting (hereafter referred to as the Guide). Developed with support from the State Justice Institute and with close guidance from the Conference of State Court Administrators’ Court Statistics Committee, the Guide is a tool for improving court administration by providing a national model for data reporting with concise descriptions and definitions of case types and disposition types as well as a standardized framework in which to report these categories. The recently revised version of the Guide is available in PDF on the NCSC Web site at www.courstatistics.org.
Statistics should never say, “Look at me.” they should say, “Look at this.”– Anonymous
Foreword
iii
Approximately 95 percent of all legal cases initiated in the United States are filed in state courts, and Examining the Work of State Courts is the authoritative analysis of the best available data on cases processed in those courts. Whether the reader’s objective is to assess the current legal landscape, to improve the management of a court or a state court system, to develop public policy, or to gain a better understanding of the work of our third branch of government, this publication provides the independent interpretation of reliable data that will speak to the reader’s need. In fact, without the benefit of this foundational data and its expert analysis, state court leaders and managers, policy makers, and the media are too often left with little more than random anecdote and unsupported opinion as the basis for their work.
The analysis in this publication is provided by the staff of the Court Statistics Project of the National Center for State Courts. With over thirty years of experience in the collection, compilation, and interpretation of state court data, the Court Statistics Project has no peer.
State court administrators from the 50 states, the District of Columbia, and Puerto Rico have all contributed to the data that are presented in this publication. The commitment of these state court leaders and their staff to the accuracy and consistency of these data ensures the integrity of the data and analysis reported here.
While anecdote and opinion may have been useful in the past, the demand today is for accountability, performance measures, and evidence-based programs. Reliable empirical data provide the basis for the modern tools of court administration, including workload studies, performance measures like the CourTools developed by the National Center for State Courts, and the analysis of court process and outcome that can lead to improved administration of justice, enhanced service to the public, and informed public policy.
In the current era of declining state revenues and shrinking state court budgets, the need for reliable data and for the expert analysis of those data is greater than ever. Examining the Work of State Courts illustrates the value of good data and dependable analysis and offers a high-level perspective of the current work and prevailing trends in state courts.
This publication, like much of the work of the Court Statistics Project since 1982, has benefitted from the keen insights and shrewd analysis of Dr. Hugh Collins, Judicial Administrator, Supreme Court of Louisiana. For almost three decades, Hugh has encouraged development of reliable empirical data concerning court operations through his hard work, leadership, hospitality, and good humor. With sincere respect and affection this volume of Examining the Work of State Courts is dedicated to Hugh Collins.
Don Goodnow
Chair, Court Statistics Committee Conference of State Court Administrators
A Comment from the Chair
iv

Table of Contents
Glossary of Terms ........................................................................... vi
What Follows: A Print and Electronic Document Design ............ vii
Appellate CourtsAppellate Caseloads ......................................................................... 1
Appeal Caseloads ............................................................................ 7
Death Penalty Caseloads ................................................................. 12
Original Proceeding/Other Appellate Matter Caseloads .............. 13
Reporting Excellence Award — Tennessee ............................ 14
Trial CourtsOverview ......................................................................................... 19
Civil Caseloads ................................................................................ 24
Reporting Excellence Award — Minnesota ............................ 37
Domestic Relations Caseloads ........................................................ 38
Criminal Caseloads ......................................................................... 45
Juvenile Caseloads ........................................................................... 51
Traffic/Violations Caseloads ........................................................... 56
Reporting Excellence Award — Arizona ................................ 58
Appendices Index of States Included in Section Graphics ................................. 62
Court Statistics Project Methodology ............................................. 68
State Court Caseload Statistics ....................................................... 69
v
Begin Pending - Active—A count of cases that, at the start of the reporting period, are awaiting disposition.
Begin Pending - Inactive—A count of cases that, at the start of the reporting period, have been administratively classified as inactive. Business rules for this classification may be defined by a rule of court or administrative order.
Incoming Cases—The sum of the count of New Filing, Reopened, and Reactivated cases.
New Filing—A count of cases that have been filed with the court for the first time during the reporting period.
Reopened—A count of cases in which a judgment has previously been entered but which have been restored to the court’s pending caseload during the reporting period. These cases come back to the court due to the filing of a request to modify or enforce that existing judgment and a hearing before a judicial officer is requested to review the status of the case or initiate further proceedings in the case.
Reactivated—A count of cases that had previously been Placed on Inactive Status, but have been restored to the court’s control during the reporting period. Further court proceedings in these cases can now be resumed during the reporting period and these cases can once again proceed toward disposition.
Outgoing Cases—The sum of the count of Entry of Judgment, Reopened Dispositions, and Placed on Inactive Status cases counted during the reporting period.
Entry of Judgment—A count of cases for which an original entry of judgment has been filed during the reporting period. For cases involving multiple parties/issues, the disposition should not be reported until all parties/issues have been resolved.
Reopened Dispositions—A count of cases that were disposed of by a modification to, and/or enforcement of, the original judgment of the court during the reporting period. For cases involving multiple parties/issues, the disposition should not be reported until all parties/issues have been resolved.
Placed on Inactive Status—A count of cases whose status has been administratively changed to inactive during the reporting period due to events beyond the court’s control. These cases have been removed from court control, and the court can take no further action until an event restores the case to the court’s active pending caseload.
End Pending - Active—A count of cases that, at the end of the reporting period, are awaiting disposition.
End Pending - Inactive—A count of cases that, at the end of the reporting period, have been administratively classified as inactive. Business rules for this classification may be defined by rule of court or administrative order.
Set for Review—A count of cases that, following an initial Entry of Judgment, are awaiting regularly scheduled reviews involving a hearing before a judicial officer.
Glossary of Terms
vi
For the third year, Examining the Work of State Courts (EWSC) is being published in both a print and electronic format. By closely aligning their designs, the printed and electronic documents provide the user with an efficient on-line experience by delivering an interactive and seamless transition from one reading platform to another. The user still has complete access to the printed document, but also has a portable electronic document (PDF) that gives instant access to underlying data and links to external resources that give broader context to traditional Court Statistics Project data analysis. The added functionality will be seen by readers through special symbols and icons on EWSC pages (in both printed and PDF formats). Features and the corresponding navigation aides are as follows:
Bookmarks—a listing of section headings, tables, and charts located in a separate window on the left side of the electronic (PDF) file which allows quick and efficient navigation throughout the document.
Data Icon—clicking the ‘Excel’ icon opens a file containing the raw data for the graphic.
US Map Icon—The map indicates which states are included in the adjacent information graphic, when state names are not listed in the table or chart.
Hot Links—integrated into the text with programmed Web site destinations. Hot links are indicated by blue underlined type and supplement the subject being discussed.
CSP Reporting Excellence Award—appears on pages that highlight particular states whose data reflects the counting rules, case type definitions, and case status categories defined in the State Court Guide to Statistical Reporting. These feature pages will highlight the benefits and insights that these complete data make possible.
What Follows: A Print and Electronic Document Design
vii

Examining the Work of State Courts: An Analysis of 2008 State Court CaseloadsAppellate Courts: Appellate Caseloads

Summary
• AppellatecourtcaseloadsconsistofAppealbyRight, Appeal by Permission, Death Penalty, and Original Proceeding/Other Appellate Matter cases.
• Appellatecaseloadsareinfluencedbyanumberoffactors, including the route of appeal and the appellate court structure. For example, states that permit rulings from limited jurisdiction courts to be appealed directly to an appellate court can see larger appellate caseloads while states that do not have an intermediate appellate court will see larger caseloads in their court of last resort.
• Approximately300,000incomingappellatecaseswerereportedinstate courts in 2008, with nearly two-thirds processed in intermediate appellate courts.
• Appealsbyrightrepresent57percentofincomingappellatecases.
• Courtsoflastresortprocessmorecivilappeals(45%)while intermediateappellatecourtsprocessmorecriminalappeals(51%).
• Overhalfofcasesdisposedofinintermediateappellatecourts are fully briefed and decided on the merits.
• Mostdecidedcasesinintermediateappellatecourts(52%)have a full opinion issued while courts of last resort issue full opinions inlessthanhalfofdecidedcases(46%).Thismaybedueto the need for intermediate appellate courts to produce more explanatory opinions in the event that the case is appealed to the court of last resort.
• Nearlytwiceasmanydecisionreversalsareissuedindeathpenalty cases than in all other case types (31 percent of death penalty versus only 17 percent of all appellate cases).
Special Recognition:
Tennessee Appellate Courts
Tennessee Appellate Courts Recognized
Two years after the release of the appellate section of the State Court Guide to Statistical Reporting (Guide), many appellate courts are providing data in greater detail, consistent with Guide definitions. Tennessee, for example, provides complete statewide manner of disposition, type of court opinion, and case outcome data for all major case type categories and nearly complete caseload summary data.
Tennessee’s accomplishment in reporting this data is even more impressive considering the state’s unusual appellate court structure. Tennessee is one of only five states that has one court of last resort and two intermediate appellate courts. Together, the jurisdiction of the two IACs is similar to that seen in more traditionally structured states (i.e., one COLR and one IAC), and this similarity manifests itself in caseload composition. Both appellate court levels in Tennessee show incoming caseload compositions comparable to those of states with a traditional appellate court structure. One exception to this is death penalty jurisdiction. Tennessee’s Court of Criminal Appeals has jurisdiction over death penalty appeals by right, applications for writ (excluding habeas corpus), and other death penalty matters. This is a unique characteristic of an IAC, and only one other state (Alabama) shares it.
The success of Tennessee’s data reporting is largely attributable to the hard work of staff from the Tennessee Administrative Office of the Courts (AOC) who supply data to the Court Statistics Project (CSP). In an effort to ensure data accuracy, the AOC staff requested technical assistance from CSP staff to map their data into the CSP reporting categories. As a result, the detail and quality of Tennessee’s data allows for a more accurate and in-depth look at the state’s appellate courts.
Tennessee
Tennessee reports detailed data for all three appellate courts
Caseload Data Reported by Tennessee’s Appellate Courts, 2008
Appeal by Right
Appeal by Permission
Death Penalty
Original/Other Proceedings
Begin Pending - ActiveBegin Pending - InactiveFiled ✓ ✓ ✓ ✓
Reactivated ✓ ✓ ✓ ✓
Disposed ✓ ✓ ✓ ✓
Placed Inactive ✓ ✓ ✓ ✓End pending - ActiveEnd Pending - InactiveInterlocutory n/j ✓ n/a n/aDecided ✓ ✓ ✓ ✓
Permission Denied ✓ ✓ ✓ ✓Dismissed Prior to Decision ✓ ✓ ✓ ✓
Settled/ Withdrawn ✓ ✓ ✓ ✓
Court ADR n/j n/j n/a n/aTransferred ✓ ✓ ✓ ✓
Other Resolution ✓ ✓ ✓ ✓Full Opinion ✓ ✓ ✓ ✓
Memorandum ✓ ✓ ✓ ✓
Summary/ Dispositional Order n/j n/j n/j n/jOther Opinion ✓ ✓ ✓ ✓
Affirmed ✓ ✓ ✓ ✓Reversed ✓ ✓ ✓ ✓
Modified ✓ ✓ ✓ ✓
Dismissed ✓ ✓ ✓ ✓
Other Outcome ✓ ✓ ✓ ✓
Notes: blank = not reported. n/a = caseload data are not applicable for this case status. n/j = no jurisdiction.
Tennessee Appellate Court Structure
Court of Appeals (3 divisions)CSP Case Types:• Appeal by right civil and administrative agency (except workers’ compensation).• Appeal by permission civil and administrative agency (except workers’ compensation).• Interlocutory appeals in civil and administrative agency.
Court of Criminal Appeals (3 divisions)CSP Case Types:• Appeal by right criminal and death penalty.• Appeal by permission criminal. Interlocutory appeals in criminal.• Original proceeding application for writ (excluding habeas corpus; including death penalty application for writ).
Supreme CourtCSP Case Types:• Appeal by right workers’ compensation and death penalty.• Appeal by permission criminal, civil, administrative agency, and death penalty. Interlocutory appeals in criminal, civil, and administrative agency.• Original proceeding bar admission, bar discipline/eligibility, and certified question.
Route of Appeal
Examining the Work of State Courts: An Analysis of 2008 State Court CaseloadsAppellate Courts — Reporting Excellence Award — Tennessee14 Examining the Work of State Courts: An Analysis of 2008 State Court Caseloads
Appellate Courts — Reporting Excellence Award — Tennessee
Despite Tennessee’s unique structure, the caseloads in the court of last resort and intermediate appellate courts resemble the caseload of states with a traditional two court appellate structure
Caseload Composition for Courts of Last Resort, 2008 Caseload Composition for Intermediate Appellate Courts, 2008
Complete statewide data illuminates the distribution of caseloads across appellate courts
Incoming Caseload Distribution in Tennessee, 2008
n Supreme Court n Court of Criminal Appeals n Court of Appeals*
* The Court of Appeals does not have jurisdiction over death penalty cases or original proceedings.
Total IncomingCases
AppellateCourt Caseload Distribution
Appeal by Right 2,392
Appeal by Permission 1,015
Death Penalty* 12
Original Proceedings* 140
0% 25% 50% 75% 100%
Appeal by Right
Appeal by Permission
Death Penalty
11%11%
76%68%
0.5%1%
13%20%
Original/Other Proceedings
Appeal by Right
Appeal by Permission
Death Penalty
91%72%
8%14%
0.3%
0.3%15%
Original/Other Proceedings
Court of Criminal Appeals Death Penalty Caseload, 2008Caseload Summary Incoming CasesAppeals by Right 3Appeals by Permission n/jHabeas Corpus Writs n/jOther Writs 0Other Matter 4
n/j = no jurisdiction.
n Tennessee (1 COLR, 2 IACs) n COLRs in 9 states (1 COLR, 1 IAC) n Tennessee (1 COLR, 2 IACs) n IACs in 17 states (1 COLR, 1 IAC)
Examining the Work of State Courts: An Analysis of 2008 State Court CaseloadsAppellate Courts — Reporting Excellence Award — Tennessee
Examining the Work of State Courts: An Analysis of 2008 State Court CaseloadsAppellate Courts — Reporting Excellence Award — Tennessee 15
The manner of disposition is influenced by case type
Manner of Disposition by Case Category in Tennessee’s Appellate Courts, 2008
Number Disposed Decided
Permission Denied
Dismissed Prior to Decision
Settled/ Withdrawn Transferred
Other Resolution
Appeal by RightSupreme Court 151 56% n/a 2% 38% 3% 0%Court of Criminal Appeals 1,133 81% n/a 8% 7% 1% 2%Court of Appeals 1,150 63% n/a 17% 15% 2% 3%
Appeal By PermissionSupreme Court 731 6% 89% 4% 1% 0% 1%Court of Criminal Appeals 92 9% 85% 5% 1% 0% 0%Court of Appeals 115 21% 74% 1% 3% 1% 0%
Death PenaltySupreme Court 6 33% 50% 17% 0% n/j 0%Court of Criminal Appeals 10 80% 20% 0% 0% 0% 0%Court of Appeals n/j n/j n/j n/j n/j n/j n/j
Original ProceedingsSupreme Court 149 1% 2% 0% 0% n/j 97%Court of Criminal Appeals 8 0% 100% 0% 0% 0% 0%Court of Appeals n/j n/j n/j n/j n/j n/j n/jStatewide Total 3,545 51% 23% 9% 9% 1% 6%
Notes: n/j = no jurisdiction. n/a = if an appeal is by right, denying permission is not possible.
Tennessee (continued)
51%
23%
9%9%
1%6%
Examining the Work of State Courts: An Analysis of 2008 State Court CaseloadsAppellate Courts — Reporting Excellence Award — Tennessee16 Examining the Work of State Courts: An Analysis of 2008 State Court Caseloads
Appellate Courts — Reporting Excellence Award — Tennessee
Appeals by Permission are reversed more often than Appeals by Right, and the Supreme Court has the highest reversal rate (52%)
Case Outcome by Case Category in Tennessee’s Appellate Courts, 2008
Appeal by Right Cases
Appeal by Permission Cases
Death Penalty Cases
AffirmedReversedModifiedDismissedOther Outcome
93%5%
1%0%1%
Supreme CourtCase Type
80%8%7%
3%3%
Court of Criminal Appeals
AffirmedReversedModifiedDismissedOther Outcome
24%52%
21%0%
2%
38%38%
25%0%0%
21%38%
29%0%
13%
63%13%14%
1%9%
Court of Appeals
(85 Cases) (917 Cases)
(42 Cases) (8 Cases) (24 Cases)
(728 Cases)
2 Affirmed 7 Affirmed1 Reversed
no jurisdiction
Original Proceedings Cases 2 Other Outcomes no cases decided no jurisdiction
Examining the Work of State Courts: An Analysis of 2008 State Court CaseloadsAppellate Courts — Reporting Excellence Award — Tennessee
Examining the Work of State Courts: An Analysis of 2008 State Court CaseloadsAppellate Courts — Reporting Excellence Award — Tennessee 17
Appellate CaseloadsAppellate Courts
Appellate courts processed nearly 300,000 cases in 2008
Examining the Work of State Courts: An Analysis of 2008 State Court CaseloadsAppellate Courts: Appellate Caseloads 1

Route of appeal and court structure can greatly impact appellate caseloads
States that Permit Appeals Directly from Limited Jurisdiction Courts in Addition to the General Jurisdiction Court(s)
one limited jurisdiction court with direct appeals two or more limited jurisdiction courts with direct appeals
Appellate court structure
1 CoLR, no iAC 1 CoLR, 1 iAC 1 CoLR, 2 iACs 2 CoLRs, 1 iAC
Total Incoming Cases in Appellate Courts, 2008
StateTotal
Incoming CasesPopulation
Rank
California 35,720 1Florida 28,440 4texas 21,087 2New York 16,141 3Pennsylvania 14,932 6ohio 13,866 7illinois 10,885 5Louisiana 10,792 25Michigan 9,338 8New Jersey 8,004 11Puerto Rico 7,079 27Washington 5,743 13Virginia 5,723 12Alabama 5,283 23Georgia 5,252 9Arizona 4,781 14oregon 4,460 28Colorado 4,410 22Missouri 4,265 18Wisconsin 4,088 20indiana 4,026 16oklahoma 3,822 29Massachusetts 3,688 15tennessee 3,559 17Kentucky 3,479 26North Carolina 3,189 10South Carolina 3,175 24iowa 3,163 31Maryland 3,102 19Minnesota 2,915 21Kansas 2,742 34West Virginia 2,411 38Nevada 2,248 36Nebraska 1,979 39Arkansas 1,916 33Mississippi 1,809 32District of Columbia 1,757 51New Mexico 1,696 37Utah 1,443 35Connecticut 1,399 30idaho 1,024 40New Hampshire 964 42Maine 755 41Hawaii 747 43Montana 699 45Delaware 670 46Alaska 648 48Vermont 503 50South Dakota 361 47North Dakota 342 49Rhode Island 323 44Wyoming 284 52Total 281,127
Note: States in Bold do not have an intermediate Appellate Court (iAC).
Examining the Work of State Courts: An Analysis of 2008 State Court CaseloadsAppellate Courts: Appellate Caseloads2 Examining the Work of State Courts: An Analysis of 2008 State Court Caseloads
Appellate Courts: Appellate Caseloads
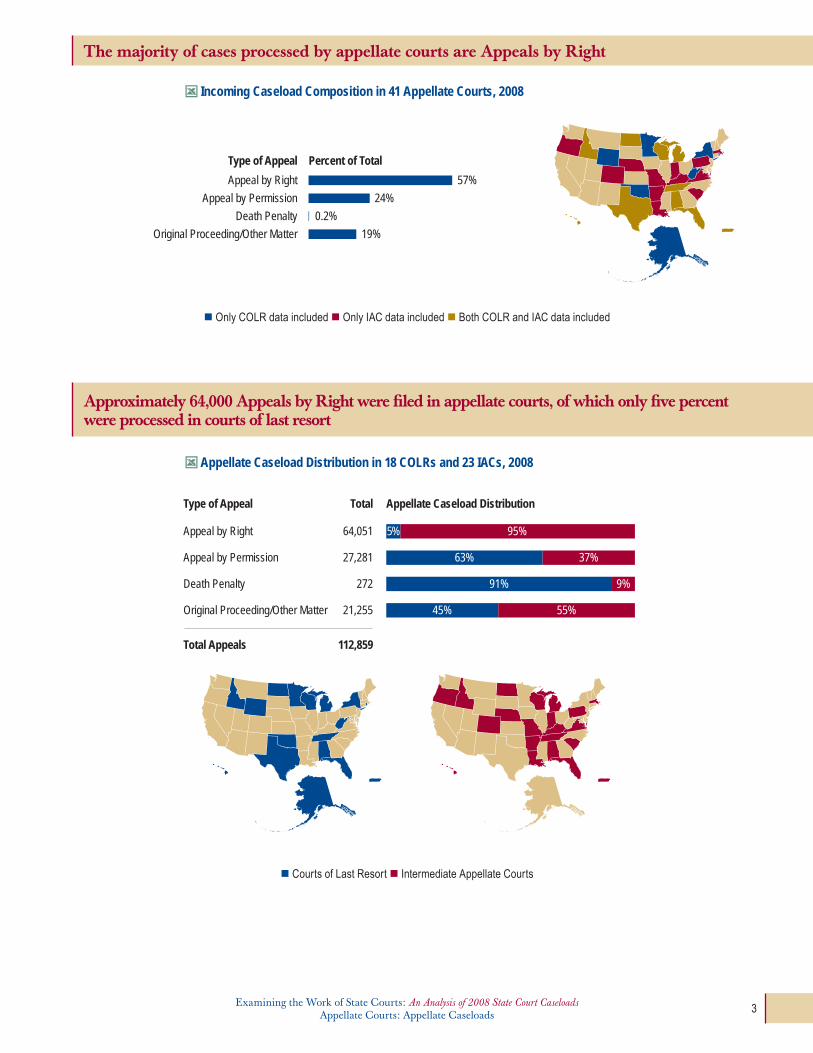
The majority of cases processed by appellate courts are Appeals by Right
Approximately 64,000 Appeals by Right were filed in appellate courts, of which only five percent were processed in courts of last resort
Incoming Caseload Composition in 41 Appellate Courts, 2008
only CoLR data included only iAC data included Both CoLR and iAC data included
Appellate Caseload Distribution in 18 COLRs and 23 IACs, 2008
Courts of Last Resort intermediate Appellate Courts
57%
24%
0.2%
19%
Appeal by Right
Appeal by Permission
Death Penalty
Original Proceeding/Other Matter
Type of Appeal Percent of Total
Type of Appeal Total Appellate Caseload Distribution
Appeal by Right 64,051
Appeal by Permission 27,281
Death Penalty 272
Original Proceeding/Other Matter 21,255
Total Appeals 112,859
5% 95%
63% 37%
91% 9%
45% 55%
Examining the Work of State Courts: An Analysis of 2008 State Court CaseloadsAppellate Courts: Appellate Caseloads
Examining the Work of State Courts: An Analysis of 2008 State Court CaseloadsAppellate Courts: Appellate Caseloads 3

The manner by which cases are disposed is influenced by the type of appellate court
Manner of Disposition in 13 Appellate Courts, 2008
CoLRs (8 Courts: 25,157 Cases Disposed) iACs (5 Courts: 10,598 Cases Disposed)
Notes: only 2 of the 13 courts (1 iAC and 1 CoLR) have an ADR program and neither disposed of any cases this way. Mississippi does not have appeal by permission jurisdiction
Comparison of Decided Cases in 9 States, 2008
State CourtPercent of Total
Dispositions Decided
Alaska Supreme Court 49%Court of Appeals 71%
Florida Supreme Court 25%District Courts of Appeal 62%
Michigan Supreme Court 13%Court of Appeals 44%
Minnesota Supreme Court 25%Court of Appeals 86%
New York* Court of Appeals 5%Appellate terms of Supreme Court 63%
Puerto Rico Supreme Court 15%Circuit Court of Appeals 58%
tennessee Supreme Court 13%Court of Criminal Appeals 75%Court of Appeals 59%
Washington Supreme Court 10%Court of Appeals 48%
Wisconsin Supreme Court 12%Court of Appeals 66%
Notes: * New York has 2 iACs, but only one is represented in the table. table only includes data from those states with 2 or more appellate courts.
Permission Denied
Dismissed Prior to Decision
Transferred
Settled/Withdrawn
Other Resolution
Decided
64%
13%
12%
5%
4%
3%
25%
12%
53%
0%
8%
2%
Examining the Work of State Courts: An Analysis of 2008 State Court CaseloadsAppellate Courts: Appellate Caseloads4 Examining the Work of State Courts: An Analysis of 2008 State Court Caseloads
Appellate Courts: Appellate Caseloads

The composition of opinions is similar for courts of last resort and intermediate appellate courts
Type of Court Opinion in 23 Appellate Courts, 2008
CoLRs (12 Courts) iACs (11 Courts, tennessee has 2)
46%52%
26%29%
26%
19%
2%0%
Full Opinion Memorandum Summary/Dispositional Order Other Opinion
Percent of Decided Cases with Full Opinion in 26 Courts, 2008
Courts of Last Resort Percent with Full Opinion
Wyoming 95%Colorado 91%Rhode Island 84%Alaska 76%Hawaii 68%New York 64%Minnesota 59%tennessee 40%Florida 39%Vermont 29%Michigan 22%West Virginia 20%Delaware 16%oregon 14%
Intermediate Appellate Courts Percent with Full Opinion
tennessee Court of Appeals 100%tennessee Court of Criminal Appeals 93%Minnesota 87%Michigan 83%Virginia 77%Wisconsin 55%Alabama Court of Civil Appeals* 46%Alaska 36%New Mexico 21%Massachusetts 19%illinois 15%Hawaii 14%
Note: * Alabama has 2 iACs, but only one is represented in this table.
Note: States in Bold do not have an iAC.
Examining the Work of State Courts: An Analysis of 2008 State Court CaseloadsAppellate Courts: Appellate Caseloads
Examining the Work of State Courts: An Analysis of 2008 State Court CaseloadsAppellate Courts: Appellate Caseloads 5

Percent of Total Decided Cases, by Case Outcome, in 33 Appellate Courts, 2008
Total Decided Cases Affirmed Reversed Modified Dismissed Other Outcome
Courts of Last Resort
Florida 650 76% 14% 6% 3% 2%
texas Court of Criminal Appeals 496 56% 28% 1% 13% 2%
Delaware 454 88% 7% 2% 2%
North Dakota 292 71% 20% 8% 1% 0%
Kansas 248 47% 12% 19% 8% 0%
Mississippi 225 48% 25%Alaska 221 60% 17% 14% 0%
Minnesota 187 40% 14% 9% 5% 32%
Puerto Rico 185 21% 70% 9% 0% 0%
texas Supreme Court 159 17% 49% 14% 8% 12%
Wyoming 159 67% 18% 8% 1% 5%
iowa 143 36% 22% 7% 0% 24%
tennessee 131 69% 20% 8% 0% 3%
Rhode Island 129 71% 19% 3%
Colorado 109 34% 54% 9% 0% 3%
Total 3,788 59% 22% 7% 3% 7%
Intermediate Appellate Courts
Florida 15,725 81% 13% 4% 2% 0%
illinois 5,274 73% 16% 8% 3% 0%
Puerto Rico 3,273 53% 37% 10% 0% 0%
Minnesota 2,046 64% 16% 8% 12% 0%
Wisconsin 2,028 52% 10%
Alabama Court of Criminal Appeals 1,652 68% 2% 0% 28% 0%
Maryland 1,400 73% 12% 0% 5% 10%
Massachusetts 1,330 81% 13% 0% 0% 7%
Kansas 1,265 62% 14% 16% 9% 0%
New York Appellate terms of Sup. Ct.* 1,171 54% 30% 8% 5% 4%
iowa 1,014 77% 12% 10%
tennessee Court of Criminal Appeals 933 80% 8% 7% 3% 2%
New Mexico 759 68% 15% 8% 8% 0%
tennessee Court of Appeals 752 61% 14% 15% 1% 9%
Virginia 726 73% 12% 0%
Alabama Court of Civil Appeals 656 64% 15% 7% 14%
Mississippi 540 79% 16%
Alaska 175 71% 16% 3% 0% 10%
Total 40,719 72% 15% 6% 4% 3%
Notes: * New York has 2 iACs, but only one court is represented in the table. States in Bold do not have an iAC. Blank cells indicate incomplete data.
Affirmed cases outnumber reversals more than two-to-one in courts of last resort and more than four-to-one in intermediate appellate courts
Examining the Work of State Courts: An Analysis of 2008 State Court CaseloadsAppellate Courts: Appellate Caseloads6 Examining the Work of State Courts: An Analysis of 2008 State Court Caseloads
Appellate Courts: Appeal Caseloads

Courts of last resort process a higher percentage of civil Appeals by Right
Appeal CaseloadsAppellate Courts
Appeal by Right Caseload in 15 Courts of Last Resort, 2008
Total Incoming Criminal CivilAdministrative
Agency Other
District of Columbia 1,614 48% 34% 15% 3%
Utah 328 14% 82% 4% 0%
North Dakota 311 41% 53% 5% 0%
Wyoming 241 38% 52% 10% 0%
Rhode Island 182 30% 70% 1% 0%tennessee 118 n/j n/j 96% 4%Minnesota 85 51% 14% 35% 0%Puerto Rico 83 n/j 100% 0% n/j
Colorado 61 41% 59% n/j 0%
Missouri 57 7% 54% n/j 39%
Florida 42 45% 50% 5% 0%
Hawaii 38 63% 34% 3% 0%
New Mexico 28 50% n/j 14% 36%
indiana 6 100% 0% n/j 0%
oregon 4 n/j n/j 100% n/j
Notes: States in Bold do not have an iAC. n/j = Court does not have jurisdiction over the case type.
38%45%
14%
3%
Examining the Work of State Courts: An Analysis of 2008 State Court CaseloadsAppellate Courts: Appellate Caseloads
Examining the Work of State Courts: An Analysis of 2008 State Court CaseloadsAppellate Courts: Appeal Caseloads 7

Appeal by Right Caseload in 13 Intermediate Appellate Courts, 2008
Total Incoming Criminal CivilAdministrative
Agency Other
Florida 20,309 61% 30% 9% 0%
Puerto Rico 3,606 7% 49% 44% 0%
oregon 3,225 55% 32% 13% 0%
Colorado 2,753 43% 49% 8% 0%
Arizona 2,582 37% 59% 3% 0%Kentucky 2,181 32% 64% 4% 0%Massachusetts 2,083 50% 48% 3% 0%Alabama Court of Criminal Appeals* 1,750 91% 1% n/j 8%
tennessee Court of Criminal Appeals* 1,211 100% n/j n/j 0%
Utah 839 19% 20% 8% 53%
Virginia 618 n/j 41% 35% 24%
Hawaii 527 39% 57% 3% 0%
indiana 72 n/j n/j 100% n/j
Notes: * State has 2 iACs but only one court is represented. n/j = Court does not have jurisdiction over the case type.
51%
36%
11%2%
Intermediate appellate courts process a higher percentage of criminal Appeals by Right
Examining the Work of State Courts: An Analysis of 2008 State Court CaseloadsAppellate Courts: Appeal Caseloads8 Examining the Work of State Courts: An Analysis of 2008 State Court Caseloads
Appellate Courts: Appeal Caseloads

Appeal by Right Clearance Rates in 10 States, 2008
Notes: States in Bold do not have an iAC. * State has more than one iAC. Data shown is combined total for both iACs.
Small caseloads often lead to high clearance rates
Clearance RateIncomingAppealsState
Louisiana
Tennessee*
Oregon
Alaska
Colorado
Florida
Alabama*
Puerto Rico
Idaho
Missouri
Median
■ IAC■ COLR
50% 100% 150% 200%
132,671
1182,274
43,225
212239
612,753
4220,309
6412,986
833,606
310504
573,000
Clearance Rates for Additional States
Courts of Last Resort Percentohio 118% North Dakota 110% Rhode Island 104% Georgia 103% illinois 100% Nevada 90% Wyoming 85% Minnesota 84% indiana 83% New Mexico 82%
Intermediate Appellate Courts Kentucky 110% Arkansas 108% California 104% Nebraska 104% Michigan 101% Wisconsin 99% Arizona 98% indiana tax Court 96% Massachusetts 91% Hawaii 89%South Carolina 89%
Examining the Work of State Courts: An Analysis of 2008 State Court CaseloadsAppellate Courts: Appeal Caseloads
Examining the Work of State Courts: An Analysis of 2008 State Court CaseloadsAppellate Courts: Appeal Caseloads 9

Appeal by Right Reversals in 8 Appellate Courts, 2008
Reversals occur in less than a quarter of decided appeal by right cases
Reversed60%
20%19%
13%5%
8%
20%9%
1554271
Courts of Last Resort Appeal by Right Reversal Rate
3
Decided
Total Appeals Decided and Reversed
25267144
864
ColoradoNorth DakotaWyoming
5361,334
70
Intermediate Appellate Courts2,739
14,565917
Indiana Court of Appeals*FloridaTennessee Court of Criminal Appeals*
FloridaMinnesota
0%
86%20%
11%3%
13%8%
6%
Number122171
Courts of Last Resort Criminal Reversal Rate
0
ColoradoNorth DakotaWyoming
19670
598
Intermediate Appellate CourtsIndiana Court of Appeals*Tennessee Court of Criminal Appeals*Florida
MinnesotaFlorida
0%
44%28%
8%
24%14%
Number8520
Courts of Last Resort Administrative Agency Reversal Rate
n/j
WyomingNorth DakotaMinnesota
11106
n/j
Intermediate Appellate CourtsIndiana Court of Appeals*FloridaTennessee Court of Criminal Appeals*
FloridaColorado
18%13%
0%
18%
27%
36%
Number
Administrative Agency Reversed
Civil Reversed
32812
1
Courts of Last Resort Civil Reversal Rate
0
ColoradoNorth DakotaWyoming
259630
n/j
Intermediate Appellate CourtsIndiana Court of Appeals*FloridaTennessee Court of Criminal Appeals*
FloridaMinnesota
19%
Criminal Reversed
Notes: States in Bold do not have an iAC. * State has 2 iACs, but only one is shown. n/j = Court does not have jurisdiction over the case type.
12 of the 15 reversals in Colorado are
interlocutory appeals concerning the
suppression of evidence.
Examining the Work of State Courts: An Analysis of 2008 State Court CaseloadsAppellate Courts: Appeal Caseloads10 Examining the Work of State Courts: An Analysis of 2008 State Court Caseloads
Appellate Courts: Appeal Caseloads
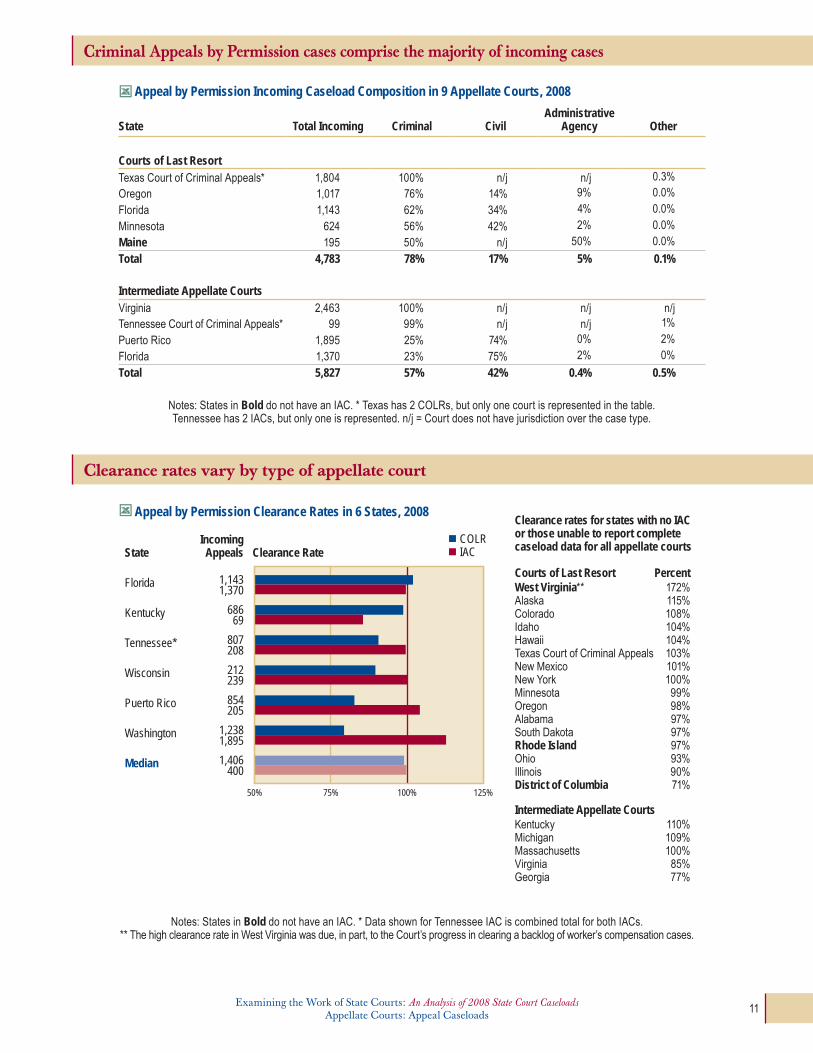
Criminal Appeals by Permission cases comprise the majority of incoming cases
Appeal by Permission Incoming Caseload Composition in 9 Appellate Courts, 2008
State Total Incoming Criminal CivilAdministrative
Agency Other
Courts of Last Resorttexas Court of Criminal Appeals* 1,804 100% n/j n/j 0.3%
oregon 1,017 76% 14% 9% 0.0%
Florida 1,143 62% 34% 4% 0.0%
Minnesota 624 56% 42% 2% 0.0%
Maine 195 50% n/j 50% 0.0%
Total 4,783 78% 17% 5% 0.1%
Intermediate Appellate CourtsVirginia 2,463 100% n/j n/j n/jtennessee Court of Criminal Appeals* 99 99% n/j n/j 1%
Puerto Rico 1,895 25% 74% 0% 2%
Florida 1,370 23% 75% 2% 0%
Total 5,827 57% 42% 0.4% 0.5%
Notes: States in Bold do not have an iAC. * texas has 2 CoLRs, but only one court is represented in the table. tennessee has 2 iACs, but only one is represented. n/j = Court does not have jurisdiction over the case type.
Appeal by Permission Clearance Rates in 6 States, 2008
Notes: States in Bold do not have an iAC. * Data shown for tennessee iAC is combined total for both iACs. ** the high clearance rate in West Virginia was due, in part, to the Court’s progress in clearing a backlog of worker’s compensation cases.
Clearance rates vary by type of appellate court
Clearance RateIncomingAppealsState
Florida
Kentucky
Tennessee*
Wisconsin
Puerto Rico
Washington
Median
50% 75% 100% 125%
1,1431,370
68669
807208
212239
854205
1,2381,895
1,406400
Clearance rates for states with no IAC or those unable to report complete caseload data for all appellate courts
Courts of Last Resort PercentWest Virginia** 172% Alaska 115% Colorado 108% idaho 104% Hawaii 104% texas Court of Criminal Appeals 103% New Mexico 101% New York 100% Minnesota 99% oregon 98% Alabama 97% South Dakota 97% Rhode Island 97% ohio 93% illinois 90% District of Columbia 71%
Intermediate Appellate Courts Kentucky 110% Michigan 109% Massachusetts 100% Virginia 85% Georgia 77%
colr iac
Examining the Work of State Courts: An Analysis of 2008 State Court CaseloadsAppellate Courts: Appeal Caseloads
Examining the Work of State Courts: An Analysis of 2008 State Court CaseloadsAppellate Courts: Appeal Caseloads 11

Death Penalty CaseloadsAppellate Courts
Nearly half of death penalty cases are affirmed, but they have a higher rate of reversal than all cases types
Death penalty cases represent a very small number of appellate cases
Death Penalty Caseload Composition in 9 Appellate Courts, 2008
Type of Case
State Total IncomingTotal Death
Penalty CasesAppeals By Right/
By Permission Writs Other
Courts of Last Resorttexas Court of Criminal Appeals 9,191 114 15 83 16
Florida 2,541 95 67 19 9
California 10,521 55 17 38 0
Alabama 1,745 21 21 n/j 0
idaho 474 11 0 11 0tennessee 1,063 5 2 n/j 3
Wyoming 284 1 0 1 0
Intermediate Appellate CourtsAlabama Court of Criminal Appeals 2,302 18 18 0 0tennessee Court of Criminal Appeals 1,324 7 3 0 4
Notes: States in Bold do not have an iAC. n/j = Court does not have jurisdiction over the case type.
Death Penalty Case Outcomes in 5 Appellate Courts, 2008
Total Death Penalty Decided Affirmed Reversed Modified Dismissed Other Outcome
Florida Supreme Court 93 62% 27% 9% 2% 0%
texas Court of Criminal Appeals 77 19% 39% 0% 31% 10%
tennessee Court of Criminal Appeals* 8 88% 13% 0% 0% 0%
tennessee Supreme Court 2 100% 0% 0% 0% 0%
Wyoming Supreme Court 2 50% 0% 0% 0% 50%
Notes: * tennessee Court of Criminal Appeals is the only iAC represented in the table. only one other state (Alabama) has an iAC with death penalty jurisdiction.
46%
72%
31%
17%
4% 6%14%
4% 5% 1%
Death penalty cases All case types
Examining the Work of State Courts: An Analysis of 2008 State Court CaseloadsAppellate Courts: Death Penalty Caseloads12 Examining the Work of State Courts: An Analysis of 2008 State Court Caseloads
Appellate Courts: Original Proceeding/Other Appellate Matter Caseloads

Death Penalty Caseloads Original Proceeding/Other Appellate Matter CaseloadsAppellate Courts
Applications for writ represent the overwhelming majority of original proceeding/other appellate cases
Original Proceeding/Other Appellate Matter Caseload Composition in 29 Appellate Courts, 2008
1%
0.4%
Applications for Writ
Bar/Judiciary Proceedings
Additional Original Proceedings*
Other
0%
0%
89%
9%
1%
100%
Note: None of the included IACs has jurisdiction over Bar/Judiciary or Additional Original Proceedings.
CoLRs (17 Courts) iACs (12 Courts)
Roughly half the states have original proceeding/other appellate matter clearance rates above 100%
Original Proceeding Clearance Rates in 12 COLRs and 10 IACs, 2008
Notes: States in Bold do not have an iAC. * State has 2 iACs but only one is represented in the table.
80% 90% 100% 110% 120%
80% 90% 100% 110% 120%
Courts of Last ResortIncoming Original/Other Proceedings Clearance Rate
Tennessee 133Vermont 28Wyoming 42Texas Supreme Court 261Minnesota 65Florida 1,261Hawaii 72Alabama 339West Virginia 296Texas Court of Criminal Appeals 6,182Idaho 127Wisconsin 132Median
Intermediate Apellate Courts
Idaho 46Tennessee Court of Criminal Appeals* 7Virginia 27Missouri 482Puerto Rico 124Minnesota 61Florida 4,220Alabama Court of Criminal Appeals* 534Wisconsin 207Michigan 134Median
Examining the Work of State Courts: An Analysis of 2008 State Court CaseloadsAppellate Courts: Death Penalty Caseloads
Examining the Work of State Courts: An Analysis of 2008 State Court CaseloadsAppellate Courts: Original Proceeding/Other Appellate Matter Caseloads 13

Tennessee Appellate Courts Recognized
two years after the release of the appellate section of the State Court Guide to Statistical Reporting (Guide), many appellate courts are providing data in greater detail, consistent with Guide definitions. tennessee, for example, provides complete statewide manner of disposition, type of court opinion, and case outcome data for all major case type categories and nearly complete caseload summary data.
tennessee’s accomplishment in reporting this data is even more impressive considering the state’s unusual appellate court structure. tennessee is one of only five states that has one court of last resort and two intermediate appellate courts. together, the jurisdiction of the two iACs is similar to that seen in more traditionally structured states (i.e., one CoLR and one iAC), and this similarity manifests itself in caseload composition. Both appellate court levels in tennessee show incoming caseload compositions comparable to those of states with a traditional appellate court structure. one exception to this is death penalty jurisdiction. tennessee’s Court of Criminal Appeals has jurisdiction over death penalty appeals by right, applications for writ (excluding habeas corpus), and other death penalty matters. this is a unique characteristic of an iAC, and only one other state (Alabama) shares it.
the success of tennessee’s data reporting is largely attributable to the hard work of staff from the tennessee Administrative office of the Courts (AoC) who supply data to the Court Statistics Project (CSP). in an effort to ensure data accuracy, the AoC staff requested technical assistance from CSP staff to map their data into the CSP reporting categories. As a result, the detail and quality of tennessee’s data allows for a more accurate and in-depth look at the state’s appellate courts.
Tennessee
Tennessee reports detailed data for all three appellate courts
Caseload Data Reported by Tennessee’s Appellate Courts, 2008
Appeal by Right
Appeal by Permission
Death Penalty
Original/Other Proceedings
Begin Pending - ActiveBegin Pending - inactiveFiled ✓ ✓ ✓ ✓
Reactivated ✓ ✓ ✓ ✓
Disposed ✓ ✓ ✓ ✓
Placed inactive ✓ ✓ ✓ ✓
end pending - Activeend Pending - inactiveinterlocutory n/j ✓ n/a n/aDecided ✓ ✓ ✓ ✓
Permission Denied ✓ ✓ ✓ ✓Dismissed Prior to Decision ✓ ✓ ✓ ✓
Settled/ Withdrawn ✓ ✓ ✓ ✓
Court ADR n/j n/j n/a n/atransferred ✓ ✓ ✓ ✓
other Resolution ✓ ✓ ✓ ✓
Full opinion ✓ ✓ ✓ ✓
Memorandum ✓ ✓ ✓ ✓
Summary/ Dispositional order n/j n/j n/j n/jother opinion ✓ ✓ ✓ ✓
Affirmed ✓ ✓ ✓ ✓Reversed ✓ ✓ ✓ ✓
Modified ✓ ✓ ✓ ✓
Dismissed ✓ ✓ ✓ ✓
other outcome ✓ ✓ ✓ ✓
Notes: blank = not reported. n/a = caseload data are not applicable for this case status. n/j = no jurisdiction.
Tennessee Appellate Court Structure
Court of Appeals (3 divisions)CSP Case Types:• Appeal by right civil and administrative agency (except workers’ compensation).• Appeal by permission civil and administrative agency (except workers’ compensation).• Interlocutory appeals in civil and administrative agency.
Court of Criminal Appeals (3 divisions)CSP Case Types:• Appeal by right criminal and death penalty.• Appeal by permission criminal. Interlocutory appeals in criminal.• Original proceeding application for writ (excluding habeas corpus; including death penalty application for writ).
Supreme CourtCSP Case Types:• Appeal by right workers’ compensation and death penalty.• Appeal by permission criminal, civil, administrative agency, and death penalty. Interlocutory appeals in criminal, civil, and administrative agency.• Original proceeding bar admission, bar discipline/eligibility, and certified question.
Route of Appeal
Examining the Work of State Courts: An Analysis of 2008 State Court CaseloadsAppellate Courts — Reporting Excellence Award — Tennessee14 Examining the Work of State Courts: An Analysis of 2008 State Court Caseloads
Appellate Courts — Reporting Excellence Award — Tennessee

Despite Tennessee’s unique structure, the caseloads in the court of last resort and intermediate appellate courts resemble the caseload of states with a traditional two court appellate structure
Caseload Composition for Courts of Last Resort, 2008 Caseload Composition for Intermediate Appellate Courts, 2008
Complete statewide data illuminates the distribution of caseloads across appellate courts
Incoming Caseload Distribution in Tennessee, 2008
n Supreme Court n Court of Criminal Appeals n Court of Appeals*
* the Court of Appeals does not have jurisdiction over death penalty cases or original proceedings.
Total IncomingCases
AppellateCourt Caseload Distribution
Appeal by Right 2,392
Appeal by Permission 1,015
Death Penalty* 12
Original Proceedings* 140
0% 25% 50% 75% 100%
Appeal by Right
Appeal by Permission
Death Penalty
11%11%
76%68%
0.5%1%
13%20%
Original/Other Proceedings
Appeal by Right
Appeal by Permission
Death Penalty
91%72%
8%14%
0.3%
0.3%15%
Original/Other Proceedings
Court of Criminal Appeals Death Penalty Caseload, 2008Caseload Summary Incoming CasesAppeals by Right 3Appeals by Permission n/jHabeas Corpus Writs n/jother Writs 0other Matter 4
n/j = no jurisdiction.
n tennessee (1 CoLR, 2 iACs) n CoLRs in 9 states (1 CoLR, 1 iAC) n tennessee (1 CoLR, 2 iACs) n iACs in 17 states (1 CoLR, 1 iAC)
Examining the Work of State Courts: An Analysis of 2008 State Court CaseloadsAppellate Courts — Reporting Excellence Award — Tennessee
Examining the Work of State Courts: An Analysis of 2008 State Court CaseloadsAppellate Courts — Reporting Excellence Award — Tennessee 15

The manner of disposition is influenced by case type
Manner of Disposition by Case Category in Tennessee’s Appellate Courts, 2008
Number Disposed Decided
Permission Denied
Dismissed Prior to Decision
Settled/ Withdrawn Transferred
Other Resolution
Appeal by RightSupreme Court 151 56% n/a 2% 38% 3% 0%Court of Criminal Appeals 1,133 81% n/a 8% 7% 1% 2%Court of Appeals 1,150 63% n/a 17% 15% 2% 3%
Appeal By PermissionSupreme Court 731 6% 89% 4% 1% 0% 1%Court of Criminal Appeals 92 9% 85% 5% 1% 0% 0%Court of Appeals 115 21% 74% 1% 3% 1% 0%
Death PenaltySupreme Court 6 33% 50% 17% 0% n/j 0%Court of Criminal Appeals 10 80% 20% 0% 0% 0% 0%Court of Appeals n/j n/j n/j n/j n/j n/j n/j
Original ProceedingsSupreme Court 149 1% 2% 0% 0% n/j 97%Court of Criminal Appeals 8 0% 100% 0% 0% 0% 0%Court of Appeals n/j n/j n/j n/j n/j n/j n/jStatewide Total 3,545 51% 23% 9% 9% 1% 6%
Notes: n/j = no jurisdiction. n/a = if an appeal is by right, denying permission is not possible.
Tennessee (continued)
51%
23%
9%9%
1%6%
Examining the Work of State Courts: An Analysis of 2008 State Court CaseloadsAppellate Courts — Reporting Excellence Award — Tennessee16 Examining the Work of State Courts: An Analysis of 2008 State Court Caseloads
Appellate Courts — Reporting Excellence Award — Tennessee

Appeals by Permission are reversed more often than Appeals by Right, and the Supreme Court has the highest reversal rate (52%)
Case Outcome by Case Category in Tennessee’s Appellate Courts, 2008
Appeal by Right Cases
Appeal by Permission Cases
Death Penalty Cases
AffirmedReversedModifiedDismissedOther Outcome
93%5%
1%0%1%
Supreme CourtCase Type
80%8%7%
3%3%
Court of Criminal Appeals
AffirmedReversedModifiedDismissedOther Outcome
24%52%
21%0%
2%
38%38%
25%0%0%
21%38%
29%0%
13%
63%13%14%
1%9%
Court of Appeals
(85 Cases) (917 Cases)
(42 Cases) (8 Cases) (24 Cases)
(728 Cases)
2 Affirmed 7 Affirmed1 Reversed
no jurisdiction
Original Proceedings Cases 2 Other Outcomes no cases decided no jurisdiction
Examining the Work of State Courts: An Analysis of 2008 State Court CaseloadsAppellate Courts — Reporting Excellence Award — Tennessee
Examining the Work of State Courts: An Analysis of 2008 State Court CaseloadsAppellate Courts — Reporting Excellence Award — Tennessee 17

Examining the Work of State Courts: An Analysis of 2008 State Court CaseloadsTrial Courts: Overview

More incoming cases were reported by state trial courts in 2008 than at any other time in the 35 year history of the Court Statistics Project—a record 106 million cases. Though the overall increase since 2007 was slightly over 2 percent, civil cases—likely spurred by the faltering economy—increased by 1.3 million, or 7 percent.
Total Incoming Cases in State Courts, All States, 1999-2008
Total Incoming Cases in State Courts by Case Category, All States, 1999-2008
Domestic relations and criminal caseloads held steady in 2008 while juvenile caseloads actually declined by 5 percent. The increase in reported traffic/ordinance violations cases equaled that of the overall increase (2.2 percent), clearly showing the influence of those huge numbers (57.5 million cases) on the total.
106 million incoming trial court cases in 2008—the most ever reported
Trial Courts
0
20
40
60
80
100
120
1999 2002 2005 2008
Mill
ions
+12%
Overview
Note: The maximum values on the scales for these five charts vary so that the changes along the trend line can be more easliy seen across case types.
Traffic
0
20
40
60
1999 2002 2005 2008
+9%
+29%
Civil
0
10
20
30
1999 2002 2005 2008
Criminal
0
10
20
30
1999 2002 2005 2008
+9%
Juvenile
0
1
2
3
1999 2002 2005 2008
-4%
Domestic Relations
0
10
20
30
1999 2002 2005 2008
+8%
Mill
ions
Mill
ions
Examining the Work of State Courts: An Analysis of 2008 State Court CaseloadsTrial Courts: Overview 19

Thou
sand
s
0
5
10
15
20
1999 2002 2005 2008
+651
+268
Limited JurisdictionDespite overall gains, limited jurisdiction
courts reported 240 fewer judges in 2008 than in 2006.
Unified/General Jurisdiction
Thou
sand
s
0
1
2
3
4
1999 2002 2005 2008
When combined with continually increasing caseloads, recent reductions in the number of limited jurisdiction judges have contributed to a noticeable
rise in the rate of cases per judge in limited jurisdiction courts.
Unified/General Jurisdiction
Total Judicial Officers+3%
+8%
+12%Limited Jurisdiction
Limited jurisdiction courts are losing judges
Total Incoming Cases in State Courts, by Jurisdiction, 2008 (in millions)
Jurisdiction
Total Percent Change,
2007-2008Case Categories Unified General Unified & General Limited
traffic/Violations 12.2 1.9 14.1 43.5 57.5 +2.2%
Criminal 3.2 3.3 6.6 14.7 21.3 -0.6%
Civil 3.5 5.2 8.7 10.8 19.4 +7.3%
Domestic Relations 1.0 3.1 4.1 1.6 5.7 +0.2%
Juvenile 0.4 1.0 1.4 0.7 2.1 -5.3%
All Cases 20.2 14.5 34.7 71.3 106.0 +2.2%
Total Incoming Cases per Judicial Officer, by Jurisdiction, 1999-2008
Judicial Officers in General and Limited Jurisdiction Courts, 1999-2008
Examining the Work of State Courts: An Analysis of 2008 State Court CaseloadsTrial Courts: Overview20 Examining the Work of State Courts: An Analysis of 2008 State Court Caseloads
Trial Courts: Overview

Full-Time Judges in Unified and General Jurisdiction Courts, 2008
Number of Full-time Judges Incoming Non-TrafficCases per Judge Population RankState Total Per 100,000 Population
Unified CourtsSouth Dakota 39 4.8 2,886 47North Dakota 42 6.5 2,394 49Connecticut 179 5.1 2,326 30California 1,614 4.4 2,157 1Wisconsin 246 4.4 2,101 20District of Columbia 62 10.5 1,968 51Missouri 334 5.6 1,890 18Kansas 163 5.8 1,829 34Minnesota 289 5.5 1,780 21iowa 196 6.5 1,702 31illinois 898 7.0 1,475 5Puerto Rico 326 8.2 726 27Median 5.7 1,929
General JurisdictionSouth Carolina1 46 1.0 4,842 24North Carolina1 109 1.2 3,384 10New Jersey 411 4.7 3,253 11Florida 599 3.3 2,939 4indiana 308 4.8 2,719 16Maine 53 4.0 2,543 41Utah2 71 2.6 2,479 35Georgia 202 2.1 2,196 9Nevada 64 2.5 2,130 36oregon 174 4.6 2,059 28ohio 391 3.4 2,041 7Maryland 153 2.7 2,022 19texas 444 1.8 1,982 2tennessee2 154 2.5 1,979 17Vermont 32 5.2 1,968 50Virginia2 157 2.0 1,858 12Arkansas 118 4.1 1,816 33Arizona 174 2.7 1,644 14Washington 188 2.9 1,622 13Louisiana 231 5.2 1,600 25Alabama 143 3.1 1,570 23Pennsylvania 439 3.5 1,564 6oklahoma 241 6.6 1,546 29Delaware1 19 2.2 1,438 46New Mexico 88 4.4 1,432 37Michigan 221 2.2 1,415 8Kentucky 146 3.4 1,332 26New Hampshire 19 1.4 1,312 42Colorado 153 3.1 1,232 22New York2 455 2.3 1,109 3Hawaii 46 3.6 1,056 43Montana 45 4.7 961 45Rhode island1 22 2.1 800 44Nebraska2 55 3.1 778 39Wyoming 22 4.1 778 52West Virginia 65 3.6 771 38Alaska 40 5.8 512 48Mississippi1 51 1.7 497 32idaho 43 2.8 475 40Massachusetts1 82 1.3 384 15Median 3.1 1,585
1 these states do not have domestic relations or juvenile jurisdiction in their general jurisdiction courts.2 these states do not have domestic relations jurisdiction in their general jurisdiction courts.
Incoming cases per general jurisdiction judge typically reach into the thousands
Examining the Work of State Courts: An Analysis of 2008 State Court CaseloadsTrial Courts: Overview
Examining the Work of State Courts: An Analysis of 2008 State Court CaseloadsTrial Courts: Overview 21

States that Reported Reopened/Reactivated Caseloads in One or More Case Categories, 2008
1 or 2 Categories 3 or 4 Categories All 5 Categories
General Jurisdiction Courts Reporting Pending Caseloads, 2008
1 or 2 Categories 3 or 4 Categories All 5 Categories
Reporting of reopened/reactivated and pending caseloads is still sporadic
the CSP project uses the term “Categories” to refer to the five main groups of trial court cases. they include Civil, Criminal, Domestic Relations, Juvenile, and traffic/Violations.For definitions of reopened and reactivated cases, see the glossary on page vi.
Examining the Work of State Courts: An Analysis of 2008 State Court CaseloadsTrial Courts: Overview22 Examining the Work of State Courts: An Analysis of 2008 State Court Caseloads
Trial Courts: Overview

The way states organize their court systems varies almost as much as the states themselves. Some states have a single trial court (“structurally unified”) in which all cases are processed, but most states have a two-tiered system with separate limited and general jurisdiction courts. Among those states, systems can range from a simple two-tiered structure with just one limited and one general jurisdiction court to more complex systems with multiple limited and general jurisdiction courts. Despite all the combinations, one thing is universally applicable to every state court system in the U.S.—each one has at least one court of general jurisdiction.
The eight states below are being highlighted by virtue of having reported complete caseloads from all of their trial courts in all of the five major categories of cases. With the exception of the island of Puerto Rico, traffic caseloads dominated overall caseload composition. Puerto Rico was also unusual due to high proportions of civil and domestic relations cases.
Caseload Composition in 8 States, 2008
Individual statewide caseload composition shows subtle variation
0%
25%
50%
75%
100%Illinois — 1 Trial Court
15%
Civil
3%
DomesticRelations
12%
Criminal Juvenile
1%
69%
Traffic
Iowa — 1 Trial Court
68%
0%
25%
50%
75%
100%
1%
Civil
18%
DomesticRelations
4%
Criminal
9%
Juvenile Traffic
Arizona — 4 Trial Courts
0%
25%
50%
75%
100%
1%
Civil
12%
DomesticRelations
5%
Criminal
26%
Juvenile Traffic
56%
Puerto Rico — 1 Trial Court
0%
25%
50%
75%
100%
Civil
47%
DomesticRelations
Criminal
31%
Juvenile
3%
Traffic
4%14%
Florida — 2 Trial Courts
0%
25%
50%
75%
100%
Civil
26%
DomesticRelations
9%
Criminal
28%
Juvenile
4%
Traffic
4%
33%
0%
25%
50%
75%
100%Hawaii — 2 Trial Courts
Civil
5%
DomesticRelations
2%
Criminal
18%
Juvenile Traffic
71%
3%
Michigan — 5 Trial Courts
0%
25%
50%
75%
100%
Civil
19%3%
DomesticRelations
Criminal
23%
1%
Juvenile Traffic
54%
Utah — 3 Trial Courts
0%
25%
50%
75%
100%
Civil
16%
DomesticRelations
Criminal
14%
Juvenile
6%
Traffic
62%
3%
Examining the Work of State Courts: An Analysis of 2008 State Court CaseloadsTrial Courts: Overview
Examining the Work of State Courts: An Analysis of 2008 State Court CaseloadsTrial Courts: Overview 23

Civil CaseloadsTrial Courts
0
5
10
15
20
25
1999 2002 2005 2008
Mill
ions
+29%
+32%+26%
+5% per annum
Unified/General Jurisdiction
Limited Jurisdiction
Total Civil Caseloads1.3 million more civil cases entered the state court systems in 2008 than in 2007
(+7%). In fact, civil caseloads have increased by an average of over 5 percent in each of the three most recent years.
0
2
3
1
4
5
6
7
1999 2002 2005 2008
Thou
sand
s
+16%
Total Civil CaseloadsEven after controlling for the effects
of increasing populations, the incoming rates of civil cases have risen sharply
over the last three years. In 2005, the rate of incoming civil cases
was 5,564 per 100,000 population in the U.S. The 2008 figure rose
to over 6,300 per 100,000.
Record civil caseloads in 2008
Civil actions—those that involve tort, contract, real property, small claims, probate, mental health, and civil appeals cases—are increasing at a time when many courts are struggling due to diminished resources. The same recession that is applying pressure to the courts through tightening budgets also appears to be driving up caseloads. Nowhere is this more apparent than in the civil arena, where state courts reported 1.3 million more cases in 2008 than in the previous year.
Incoming Civil Caseloads, 1999-2008
Incoming Civil Cases per 100,000 Population, 1999-2008
Special Recognition:
Minnesota is Recognized for Increasing Civil Case Type Reporting
Minnesota is Recognized for Increasing Civil Case Type Reporting
The CSP Reporting Excellence Awards are designed to recognize successful efforts of administrative offices of the courts to improve their statistical reporting. This year’s award in Civil goes to the Minnesota State Court Administrator’s Office (SCAO), whose staff made a concerted effort to expand the number of civil case types it reports and thus improve the national picture of the work of the state courts.
States do not report complete caseload data for a variety of reasons. In the case of Minnesota, the data for many civil case types were being collected, but the statistical reporting system had not been set up to distinguish or report these specific data. For decades, the SCAO has engaged in data-driven court research, case management, and statewide judicial administration. Minnesota has at its disposal a wealth of court data with which it can, among other things, generate the foundational information for judicial and staff workload assessments and measure court performance. Thus, it was surprising that Minnesota historically reported caseload data for fewer than half of the civil case types outlined in the Guide. SCAO staff investigated and discovered that data for many of the “missing” case types were indeed available from their data warehouse, but the necessary code to retrieve these data had never been written. The staff at the SCAO then took the time to generate the code to extract these data and literally doubled the number of civil case types that they report. As a result, the CSP recognizes the Minnesota State Court Administrator’s Office with this year’s Reporting Excellence Award for Civil.
Minnesota
Minnesota now reports over 80% of civil case types
Civil Case TypePrior Case
Types ReportedCase Types
Now Reported
Automobile Tort
Malpractice – medical ✓
Malpractice – legal ✓
Malpractice – other ✓ ✓
Premises liability
Product liability – asbestos ✓
Product liability – tobacco
Product liability – other ✓
Slander/libel/defamation ✓
Other tort ✓ ✓
Buyer plaintiff
Employment – discrimination ✓
Employment – other ✓ ✓
Fraud
Landlord/tenant – Unlawful detainer ✓ ✓
Landlord/tenant – Other ✓
Mortgage Foreclosure ✓
Seller plaintiff (debt collection) ✓
Other contract ✓ ✓
Eminent domain ✓ ✓
Other real property ✓
Small Claims ✓ ✓
Guardianship – adult ✓ ✓
Guardianship – juvenile ✓
Conservatorship/trusteeship ✓ ✓
Probate/wills/intestate ✓ ✓
Other probate/estate ✓ ✓
Total Mental Health ✓ ✓
Administrative agency appeals ✓
Other civil appeals ✓ ✓
Habeas corpus ✓
Non-dom. rel. restraining order ✓ ✓
Tax cases ✓
Writ involving prison conditions
Other writs
Total Other Civil ✓ ✓
Total Case Types Reported 15 29
Examining the Work of State Courts: An Analysis of 2008 State Court CaseloadsTrial Courts: Civil Caseloads
Examining the Work of State Courts: An Analysis of 2008 State Court CaseloadsTrial Courts: Civil Caseloads — Reporting Excellence Award — Minnesota 37
Examining the Work of State Courts: An Analysis of 2008 State Court CaseloadsTrial Courts: Civil Caseloads24 Examining the Work of State Courts: An Analysis of 2008 State Court Caseloads
Trial Courts: Civil Caseloads

Most states still lack the ability to report reopened and reactivated caseloads
Nearly one in 5 trial court cases is civil in nature
Total Incoming Civil Caseloads and Rates in 29 States, 2008
StateTotal Incoming
Civil CasesCivil Cases Per
100,000 Population
States that do not report separate Reopened/Reactivated Caseloads
New York 1,852,112 9,503
indiana 512,956 8,044
Delaware 65,265 7,475
Connecticut 260,218 7,432
Nebraska 119,386 6,694
Kentucky 284,899 6,673
Colorado 324,301 6,566
oklahoma 209,142 5,742
idaho 82,253 5,398
Missouri 318,115 5,381
Wisconsin 300,005 5,331
Arkansas 140,867 4,933
Utah 133,650 4,884
Washington 307,898 4,701
Minnesota 236,782 4,536
New Hampshire 55,361 4,207
Hawaii 32,116 2,493
Median 5,398
States that report separate Reopened/Reactivated Caseloads Percent Reopened/Reactivated
Florida 1,419,204 7,743North Dakota 33,727 5,258Puerto Rico 116,918 2,957Illinois 642,701 4,982
ohio 915,127 7,967
New Jersey 918,527 10,579
Vermont 27,677 4,455
District of Columbia 69,104 11,676
Michigan 824,665 8,244
Arizona 354,566 5,455
Kansas 195,021 6,960
Iowa 184,370 6,140
Median 6,550
Note: States in Bold have a unified court system.
20%18%
4.4%4.2%
3.1%2.7%
2.3%2.1%
1.8%
1.4%1.4%
0.2%2.5%
Total Incoming Cases in State Courts, by Jurisdiction, 2008 (in millions)
Jurisdiction Percentof TotalCase Categories Unified General Unified & General Limited Total
traffic/Violations 12.2 1.9 14.1 43.5 57.5 54.3%
Criminal 3.2 3.3 6.6 14.7 21.3 20.1%
Civil 3.5 5.2 8.7 10.8 19.4 18.3%
Domestic Relations 1.0 3.1 4.1 1.6 5.7 5.4%
Juvenile 0.4 1.0 1.4 0.7 2.1 2.0%
All Cases 20.2 14.5 34.7 71.3 106.0 100.0%
Increase in Number of Civil Cases Since 2007 0.3 0.5 0.8 0.6 1.3
Note: totals may not sum due to rounding.
The State Court Guide to Statistical Reporting recommends that all state courts capture and report reopened and reactivated caseload data. Reopened cases are those that have previously reached a disposition but have unexpectedly returned to the court for further judicial action. Reactivated cases have not been disposed; instead, they are placed on inactive status while the case is out of the court’s control, such as during a bankruptcy proceeding. When the case is ready to resume movement toward a disposition, it is reactivated and assumes its place on the court’s active docket. Since most states presently do not or cannot distinguish these two case status categories, they are aggregated here to provide more consistency to the analysis.
Examining the Work of State Courts: An Analysis of 2008 State Court CaseloadsTrial Courts: Civil Caseloads
Examining the Work of State Courts: An Analysis of 2008 State Court CaseloadsTrial Courts: Civil Caseloads 25

If present trends continue, civil caseloads may soon outnumber criminal caseloads
Criminal caseloads are somewhat different than other categories of cases in that, in two-tiered court systems, felony cases can be legitimately counted twice—once in the limited jurisdiction court for a preliminary hearing and again if it is bound over to the general jurisdiction court for trial. Though these are recommended counts of cases for each level of court, it does exaggerate the actual number of defendants in the criminal court system. Since most states have two-tiered systems and count criminal cases at both levels of court, it is conceivable that civil cases have already exceeded the number of criminal defendants being processed in state courts.
Total Incoming Civil and Criminal Caseloads, 2004-2008
+15%+3%
0
5
10
15
20
25
2004 2005 2006 2007 2008
Mill
ions
Total Civil Caseloads
Total Criminal Caseloads
Until 2006, criminal caseloads typically exceeded civil caseloads by 3.5 to 4.5 million cases each year. In 2008, the difference had fallen to about 1.85 million cases.
Incoming Civil Caseload Composition in 7 States, 2007 vs. 2008
Contracts comprise an increasingly large share of civil caseloads
Note: in 2008, contract and small claims cases combined for 73 percent of all civil cases in these 7 states (up 4% from 2007) while tort cases comprised less than 5 percent.
Contract
Small Claims
Tort
Mental Health
Probate
19%19%
54%50%
15%16%
4.4%6.0%
2.0%2.3%
Civil Appeals
Real Property
Other
1.1%1.3%
1.1%1.2%
4.1%3.9%
n 2008n 2007
Examining the Work of State Courts: An Analysis of 2008 State Court CaseloadsTrial Courts: Civil Caseloads26 Examining the Work of State Courts: An Analysis of 2008 State Court Caseloads
Trial Courts: Civil Caseloads

Contract and Tort Caseloads in 13 General Jurisdiction Courts, 1999-2008
Incoming Tort and Contract Rates in 11 States, 2008
IncomingTort
Cases
IncomingContract
CasesStateProportion of Tort to Contract Cases
North Dakota 320
Kansas 3,342 155,756
Utah 2,535 72,156
Minnesota 5,537 118,054
Missouri 13,727 216,508
New Jersey 54,418 581,000
Mississippi 5,545 43,456
Iowa 3,611 26,311
Hawaii 2,142 14,441
Puerto Rico 8,280 45,564
Connecticut 15,240 70,782
Median
0 10% 20% 30% 40% 50% 60% 70% 90%80% 100%
■ Percent Tort ■ Percent Contract
98%
98%
97%
96%
94%
91%
89%
88%
87%
85%
82%
91%
19,590
Contract caseloads continue to climb
Incoming contract cases are nine times that of torts
Thou
sand
s
0
200
400
600
800
1,000
1,200
1,400
1999 2002 2005 2008
+63%
-25%
Contract Caseloads increased 2007 to 2008 (+27%).
Tort Caseloads continued to fall during that
same period (-6%).
Note: States in Bold have a unified court system.
When tort and contract caseloads are examined side by side, contracts dominate in every jurisdiction. With the overall and median proportion of contracts in these 11 states above 90 percent, and given their growing numbers, contract case processing is doubtless an increasing concern for all state courts.
Examining the Work of State Courts: An Analysis of 2008 State Court CaseloadsTrial Courts: Civil Caseloads
Examining the Work of State Courts: An Analysis of 2008 State Court CaseloadsTrial Courts: Civil Caseloads 27
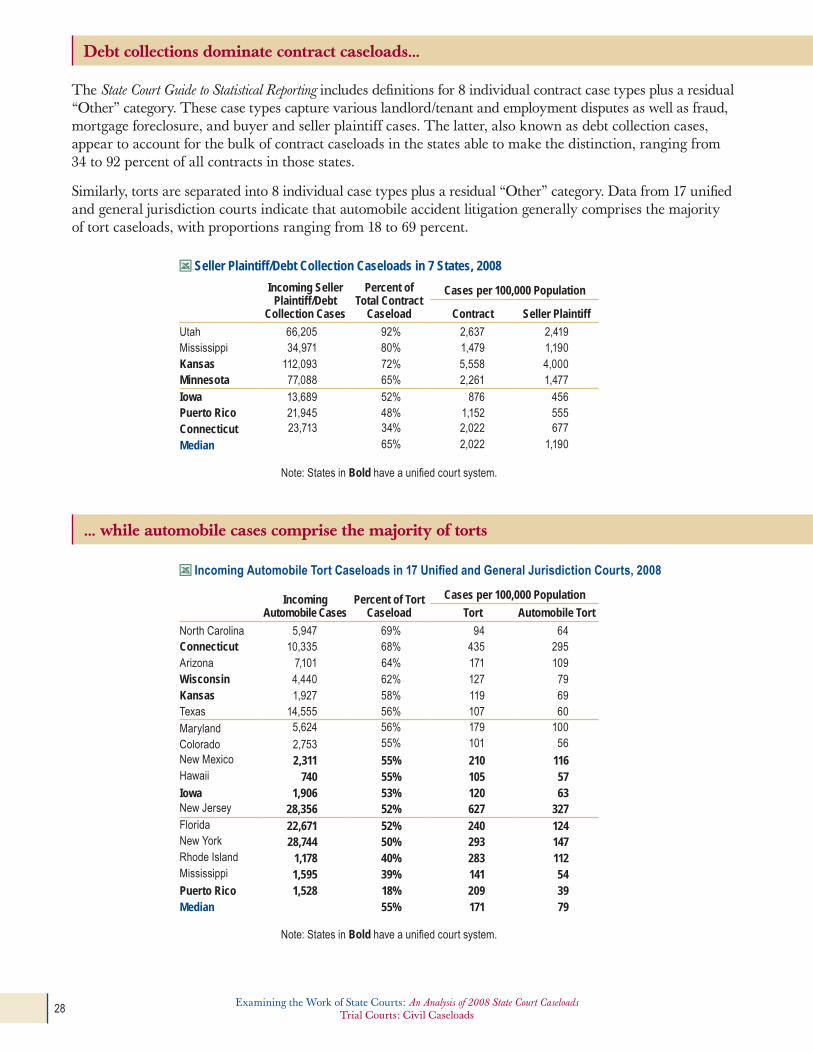
The State Court Guide to Statistical Reporting includes definitions for 8 individual contract case types plus a residual “Other” category. These case types capture various landlord/tenant and employment disputes as well as fraud, mortgage foreclosure, and buyer and seller plaintiff cases. The latter, also known as debt collection cases, appear to account for the bulk of contract caseloads in the states able to make the distinction, ranging from 34 to 92 percent of all contracts in those states.
Similarly, torts are separated into 8 individual case types plus a residual “Other” category. Data from 17 unified and general jurisdiction courts indicate that automobile accident litigation generally comprises the majority of tort caseloads, with proportions ranging from 18 to 69 percent.
Seller Plaintiff/Debt Collection Caseloads in 7 States, 2008
Incoming Seller Plaintiff/Debt
Collection Cases
Percent of Total Contract
Caseload
Cases per 100,000 Population
Contract Seller Plaintiff
Utah 66,205 92% 2,637 2,419Mississippi 34,971 80% 1,479 1,190Kansas 112,093 72% 5,558 4,000Minnesota 77,088 65% 2,261 1,477Iowa 13,689 52% 876 456Puerto Rico 21,945 48% 1,152 555Connecticut 23,713 34% 2,022 677
Median 65% 2,022 1,190
Note: States in Bold have a unified court system.
Incoming Automobile Tort Caseloads in 17 Unified and General Jurisdiction Courts, 2008
Incoming Automobile Cases
Percent of Tort Caseload
Cases per 100,000 Population
Tort Automobile Tort
North Carolina 5,947 69% 94 64Connecticut 10,335 68% 435 295Arizona 7,101 64% 171 109Wisconsin 4,440 62% 127 79Kansas 1,927 58% 119 69texas 14,555 56% 107 60
Maryland 5,624 56% 179 100
Colorado 2,753 55% 101 56New Mexico 2,311 55% 210 116Hawaii 740 55% 105 57Iowa 1,906 53% 120 63New Jersey 28,356 52% 627 327Florida 22,671 52% 240 124New York 28,744 50% 293 147Rhode island 1,178 40% 283 112Mississippi 1,595 39% 141 54Puerto Rico 1,528 18% 209 39Median 55% 171 79
Note: States in Bold have a unified court system.
Debt collections dominate contract caseloads...
... while automobile cases comprise the majority of torts
Examining the Work of State Courts: An Analysis of 2008 State Court CaseloadsTrial Courts: Civil Caseloads28 Examining the Work of State Courts: An Analysis of 2008 State Court Caseloads
Trial Courts: Civil Caseloads

A clearance rate is calculated by dividing the number of outgoing cases (disposed or placed inactive) by the number of incoming cases (newly filed, reopened, or reactivated). Increasing numbers of contract cases, already known to comprise the preponderance of civil caseloads, appear to be having a negative effect on some courts’ civil clearance rates. Of the 28 unified and general jurisdiction courts shown below, only 7 have achieved rates at or above 100 percent.
Civil Caseload Clearance Rates in 28 Unified and General Jurisdiction Courts, 2008
IncomingCasesState Unified Courts Clearance Rate
General Jurisdiction Courts Clearance Rate
90% 95% 100% 105%
90% 95% 100% 105%
116,918Puerto Rico
300,005Wisconsin
195,021Kansas
33,727North Dakota
190,492Connecticut
184,370Iowa
642,701Illinois
318,115Missouri
Median
285,622Ohio
17,204Delaware
907,768New Jersey
365,061New York
9,711Hawaii
114,660Utah
70,240Tennessee
149,650Washington
31,680West Virginia
212,742Texas
8,298New Hampshire
209,142Oklahoma
22,470Vermont
51,863Alabama
52,278New Mexico
95,937Arizona
70,833Kentucky
9,392Idaho
54,939Arkansas
97,452South Carolina
Median
Some courts are struggling to clear their civil caseloads
Examining the Work of State Courts: An Analysis of 2008 State Court CaseloadsTrial Courts: Civil Caseloads
Examining the Work of State Courts: An Analysis of 2008 State Court CaseloadsTrial Courts: Civil Caseloads 29

Contract clearance rates are consistently lower than those for tort caseloads
Examination of two of the aforementioned components of civil caseloads—contract and tort cases—confirms that increasing contract caseloads may be hampering courts’ efforts to clear civil cases. The median clearance rates for the larger contract caseloads in 13 unified and general jurisdiction courts are under100percent(99%and96%,respectively)whileboth types of courts were more successful clearing the smaller (although sometimes more complex) tort caseloads, with medians above 100 percent.
Contract Clearance Rates in 13 Unified and General Jurisdiction Courts, 2008
IncomingCasesState Unified Courts Clearance Rate
General Jurisdiction Courts Clearance Rate
80% 90% 100% 110%
80% 90% 100% 110%
116,918Wisconsin19,590North Dakota
155,756Kansas45,564Puerto Rico26,311Iowa
216,508MissouriMedian
76,387Oregon72,156Utah43,812Texas
581,000New Jersey15,104New York31,572Washington53,789Kentucky
Median
Tort Clearance Rates in 22 Unified and General Jurisdiction Courts, 2008
IncomingCasesState Unified Courts Clearance Rate
130%80% 90% 100% 110% 120%
130%80% 90% 100% 110% 120%
North Dakota 320Missouri 13,727Kansas 3,342Puerto Rico 8,280Iowa 3,611Wisconsin 7,158Connecticut 15,240Median
New Jersey 54,418Kentucky 5,102Ohio 22,545New York 57,023Utah 2,535Indiana 10,410Idaho 928Hawaii 1,352North Carolina 8,675Arizona 11,092Washington 9,872Oregon 6,810New Mexico 4,172Maryland 10,074Rhode Island 2,970Median
General Jurisdiction Courts Clearance Rate
Examining the Work of State Courts: An Analysis of 2008 State Court CaseloadsTrial Courts: Civil Caseloads30 Examining the Work of State Courts: An Analysis of 2008 State Court Caseloads
Trial Courts: Civil Caseloads

Just as torts typically represent a single-digit proportion of civil caseloads, medical malpractice cases comprise a similar proportion of torts. Despite their continued notoriety, rarely does a medical malpractice caseload exceed a few hundred cases in any one state in one year.
Incoming Medical Malpractice Cases in General Jurisdiction Courts in 7 States, 1999-2008
Like other torts, medical malpractice claims continue to decline
StateIncoming
Cases Percent of Tort Caseload
Kansas 248 7.4%
Puerto Rico 496 6.0%
Iowa 168 4.7%
Mississippi 241 4.3%
New Jersey 1,249 2.3%
Wisconsin 139 1.9%
Connecticut 272 1.8%
Oregon 49 0.7%
Minnesota 37 0.7%
Total 3,437 2.8%
7-State Total
1999 2002 2005 2008
-15% -22%
Arizona
1999 2002 2005 2008
Connecticut
1999 2002 2005 2008
-30%
-45%
Mississippi
1999 2002 2005 2008
New Jersey
1999 2002 2005 2008
-30%-1%
New York
1999 2002 2005 2008
Rhode Island
1999 2002 2005 2008
-34% -42%
Oregon
1999 2002 2005 2008
Num
ber o
f Cas
es
0
250
500
750
0
2,000
4,000
6,000
8,000
10,000
0
1,000
2,000
3,000
4,000
5,000
0
200
400
600
800
1,000
0
500
1,000
1,500
2,000
0
20
40
60
80
100
0
100
200
300
400
0
50
100
150
200
As was seen in Mississippi in 2003, the enactment of tort reform legislation can profoundly affect the filing patterns of medical malpractice caseloads. However, medical malpractice caseloads are often so small that a change of as few as 50 or 100 filings can create a similar effect.
Incoming Medical Malpractice Cases in 9 States, 2008
Note: States in Bold have a unified court system.
Examining the Work of State Courts: An Analysis of 2008 State Court CaseloadsTrial Courts: Civil Caseloads
Examining the Work of State Courts: An Analysis of 2008 State Court CaseloadsTrial Courts: Civil Caseloads 31

0
5,000
10,000
15,000
0
30,000
60,000
90,000
20,000
25,000
30,000
Connecticut: 25,202 (+114%)
Puerto Rico: 11,812 (+33%)
Kansas: 10,484 (+11%)
New Jersey: 1,903 (+89%)Utah: 1,201 (+117%)Oregon: 1,065 (+155%)North Dakota: 779 (+27%)
Iowa: 10,913 (+36%)
Wisconsin: 25,476 (+55%)
2006 2007 2008
2006 2007 2008
9-State Total: 88,835 (+55%)
Num
ber o
f Cas
es
Not all states process all mortgage foreclosure cases in their state courts. This fact, coupled with the different
ways in which the economy influences housing markets, may explain some of the disparities seen here.
Incoming Mortgage Foreclosure Caseloads in 9 States, 2006-2008
Mortgage foreclosure cases—increasing everywhere, but at vastly different rates
Examining the Work of State Courts: An Analysis of 2008 State Court CaseloadsTrial Courts: Civil Caseloads32 Examining the Work of State Courts: An Analysis of 2008 State Court Caseloads
Trial Courts: Civil Caseloads
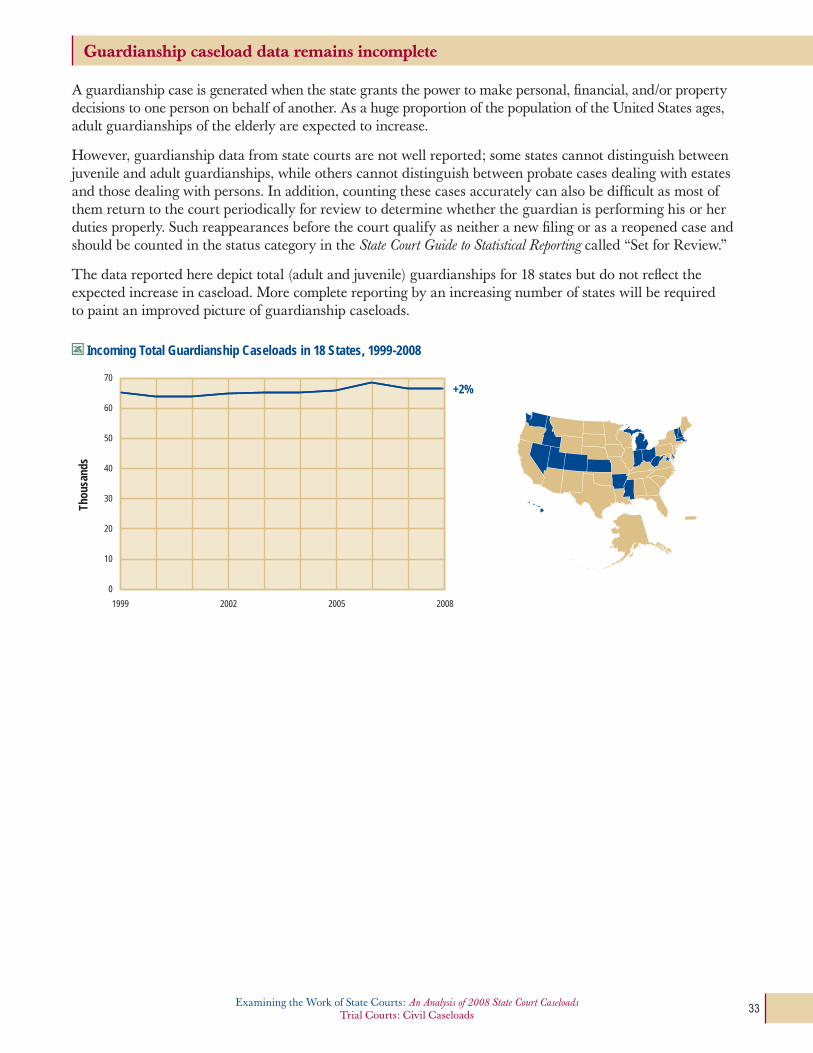
A guardianship case is generated when the state grants the power to make personal, financial, and/or property decisions to one person on behalf of another. As a huge proportion of the population of the United States ages, adult guardianships of the elderly are expected to increase.
However, guardianship data from state courts are not well reported; some states cannot distinguish between juvenile and adult guardianships, while others cannot distinguish between probate cases dealing with estates and those dealing with persons. In addition, counting these cases accurately can also be difficult as most of them return to the court periodically for review to determine whether the guardian is performing his or her duties properly. Such reappearances before the court qualify as neither a new filing or as a reopened case and should be counted in the status category in the State Court Guide to Statistical Reporting called “Set for Review.”
The data reported here depict total (adult and juvenile) guardianships for 18 states but do not reflect the expected increase in caseload. More complete reporting by an increasing number of states will be required to paint an improved picture of guardianship caseloads.
Incoming Total Guardianship Caseloads in 18 States, 1999-2008
Guardianship caseload data remains incomplete
Thou
sand
s
0
10
20
30
40
50
60
70
1999 2002 2005 2008
+2%
Examining the Work of State Courts: An Analysis of 2008 State Court CaseloadsTrial Courts: Civil Caseloads
Examining the Work of State Courts: An Analysis of 2008 State Court CaseloadsTrial Courts: Civil Caseloads 33
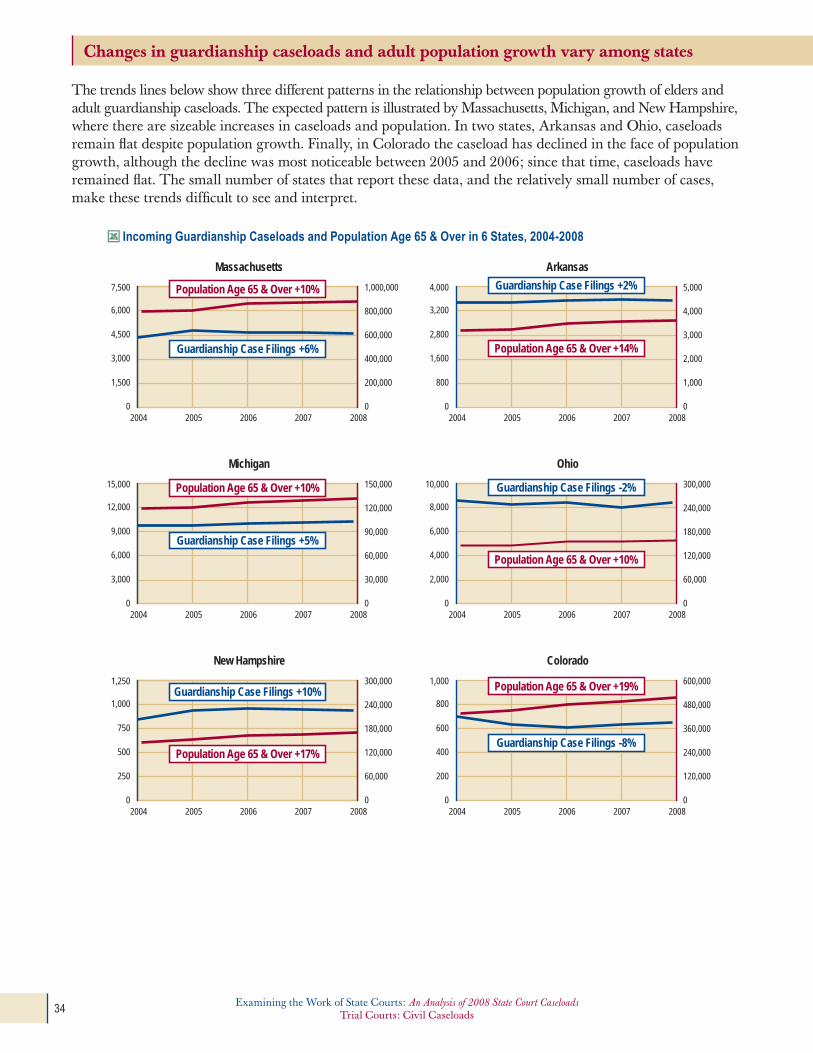
The trends lines below show three different patterns in the relationship between population growth of elders and adult guardianship caseloads. The expected pattern is illustrated by Massachusetts, Michigan, and New Hampshire, where there are sizeable increases in caseloads and population. In two states, Arkansas and Ohio, caseloads remain flat despite population growth. Finally, in Colorado the caseload has declined in the face of population growth, although the decline was most noticeable between 2005 and 2006; since that time, caseloads have remained flat. The small number of states that report these data, and the relatively small number of cases, make these trends difficult to see and interpret.
Incoming Guardianship Caseloads and Population Age 65 & Over in 6 States, 2004-2008
Changes in guardianship caseloads and adult population growth vary among states
New Hampshire
0
250
500
750
2004 2005 2006 2007 2008
1,000
1,250
0
60,000
120,000
180,000
240,000
300,000
Arkansas
0
800
1,600
2,800
2004 2005 2006 2007 2008
3,200
4,000
0
1,000
2,000
3,000
4,000
5,000Guardianship Case Filings +2%
Population Age 65 & Over +14%
Colorado
0
200
400
600
2004 2005 2006 2007 2008
800
1,000
0
120,000
240,000
360,000
480,000
600,000
Guardianship Case Filings -8%
Population Age 65 & Over +19%
Michigan
0
3,000
6,000
9,000
2004 2005 2006 2007 2008
12,000
15,000
0
30,000
60,000
90,000
120,000
150,000
Guardianship Case Filings +5%
Population Age 65 & Over +10%
Guardianship Case Filings +10%
Population Age 65 & Over +17%
Ohio
0
2,000
4,000
6,000
2004 2005 2006 2007 2008
8,000
10,000
0
60,000
120,000
180,000
240,000
300,000Guardianship Case Filings -2%
Population Age 65 & Over +10%
Massachusetts
0
1,500
3,000
4,500
2004 2005 2006 2007 2008
6,000
7,500
0
200,000
400,000
600,000
800,000
1,000,000
Guardianship Case Filings +6%
Population Age 65 & Over +10%
Examining the Work of State Courts: An Analysis of 2008 State Court CaseloadsTrial Courts: Civil Caseloads34 Examining the Work of State Courts: An Analysis of 2008 State Court Caseloads
Trial Courts: Civil Caseloads

Incoming Guardianship Caseloads in 20 States, 2008
Notes: States in Bold have a unified court system. Adult and juvenile guardianship cases compose total guardianships.
Incoming Guardianship Caseloads in 14 States, 2008
Incoming Guardianship
CasesPopulation
Rank
Percent of Guardianship Caseloads Adult Cases per 100,000 Adults Age 65 & Over
Juvenile Casesper 100,000JuvenilesAdult Juvenile
Arkansas 3,544 33 99% 1% 872 2
Michigan 16,977 8 59% 41% 772 266
Vermont 1,165 50 47% 53% 630 410
Wisconsin 6,106 20 77% 23% 628 98
District of Columbia 455 51 90% 10% 583 37
New Hampshire 2,238 42 42% 58% 550 398
Massachusetts 10,125 15 45% 55% 522 364
idaho 1,295 40 71% 29% 501 88
ohio 9,577 7 70% 30% 425 99
Missouri 5,869 18 49% 51% 357 199
Kansas 1,670 34 54% 46% 244 104
Utah 1,433 35 33% 67% 193 109
Delaware 515 46 45% 55% 192 131
Colorado 1,216 22 53% 47% 126 45
Median 53% 47% 512 107
Note: States in Bold have a unified court system.
The adult and juvenile guardianship case mix is as diverse as the states themselves
StateTotal Incoming
Guardianship CasesTotal
Population Incoming Cases per 100,000 Population
Vermont 1,165 621,270 188
New Hampshire 2,238 1,315,809 170
Michigan 16,977 10,003,422 170
Massachusetts 10,125 6,497,967 156
Arkansas 3,544 2,855,390 124
Oklahoma 4,347 3,642,361 119
Indiana 7,190 6,376,792 113
Wisconsin 6,106 5,627,967 108
Missouri 5,869 5,911,605 99
Idaho 1,295 1,523,816 85
Ohio 9,577 11,485,910 83
Nevada 2,074 2,600,167 80
District of Columbia 455 591,833 77
Hawaii 833 1,288,198 65
Kansas 1,670 2,802,134 60
Delaware 515 873,092 59
West Virginia 979 1,814,468 54
Utah 1,433 2,736,424 52
Washington 2,861 6,549,224 44
Colorado 1,216 4,939,456 25
Median 80,057,305 84
Examining the Work of State Courts: An Analysis of 2008 State Court CaseloadsTrial Courts: Civil Caseloads
Examining the Work of State Courts: An Analysis of 2008 State Court CaseloadsTrial Courts: Civil Caseloads 35

Tort, contract, and real property cases valued below a maximum statutory amount are usually termed “small claims” cases. However, due to the variation in the limits that states use for small claims cases, there is little state-to-state consistency in the cases included in these caseloads. For example, Kentucky has a maximum value limit of $1,500 for small claims cases while Alaska caps theirs at $10,000. Most states’ limits fall in between with a median of $5,000. The result is that a case valued at $4,500 in one state may be filed as a small claims case there, while the same case could be filed as a “limited civil” case in another state and still as a “general civil” case elsewhere. States will occasionally change (increase) the maximum allowable amount for small claims cases and consequently increase their small claims caseload.
Small Claims Caseloads in 27 States, 1999-2008
Incoming Small Claims Cases in 33 States, 2008
Despite their inherent similarities, small claims are not increasing like contracts
Thou
sand
s
1999 2002 2005 2008
+3%
0
500
1,000
1,500
2,000
2,500
Small Claims Caseloads seemed to decrease ahead of the current economic downturn, but
have since climbed to levels equaling their highest in the last 10 years.
IncomingCasesState Per 100,000 Population
IncomingCasesState Per 100,000 Population
South Carolina 214,662
Indiana 291,182
Iowa 112,264
Wisconsin 186,105
North Carolina 268,256
Oklahoma 95,127
Alabama 116,783
West Virginia 44,975
Florida 378,461
New Mexico 40,821
Rhode Island 21,346
Massachusetts 123,544
Vermont 11,786
District of Columbia 10,088
Utah 39,606
Connecticut 96,434
New Hampshire 17,839
Idaho 20,090
Wyoming 6,913
Illinois 153,750
Minnesota 57,736
Michigan 79,692
Ohio 84,499
North Dakota 4,710
Arkansas 19,505
New Jersey 52,224
Arizona 28,081
Washington 23,938
Kentucky 15,369
Nebraska 6,260
Kansas 9,634
Hawaii 3,769
Missouri 14,332
Median
4,792
4,566
3,739
3,307
2,909
2,612
2,505
2,479
2,065
2,057
2,031
1,901
1,897
1,705
1,447
1,377
1,356
1,318
1,298
1,192
1,106
797
736
734
683
601
432
366
360
351
344
293
242
1,356
increased 4 percent from 1,298 in 2007.
Note: States in Bold have a unified court system.
Examining the Work of State Courts: An Analysis of 2008 State Court CaseloadsTrial Courts: Civil Caseloads36 Examining the Work of State Courts: An Analysis of 2008 State Court Caseloads
Trial Courts: Civil Caseloads — Reporting Excellence Award — Minnesota

Minnesota is Recognized for Increasing Civil Case Type Reporting
the CSP Reporting excellence Awards are designed to recognize successful efforts of administrative offices of the courts to improve their statistical reporting. this year’s award in Civil goes to the Minnesota State Court Administrator’s office (SCAo), whose staff made a concerted effort to expand the number of civil case types it reports and thus improve the national picture of the work of the state courts.
States do not report complete caseload data for a variety of reasons. in the case of Minnesota, the data for many civil case types were being collected, but the statistical reporting system had not been set up to distinguish or report these specific data. For decades, the SCAo has engaged in data-driven court research, case management, and statewide judicial administration. Minnesota has at its disposal a wealth of court data with which it can, among other things, generate the foundational information for judicial and staff workload assessments and measure court performance. thus, it was surprising that Minnesota historically reported caseload data for fewer than half of the civil case types outlined in the Guide. SCAo staff investigated and discovered that data for many of the “missing” case types were indeed available from their data warehouse, but the necessary code to retrieve these data had never been written. the staff at the SCAo then took the time to generate the code to extract these data and literally doubled the number of civil case types that they report. As a result, the CSP recognizes the Minnesota State Court Administrator’s office with this year’s Reporting excellence Award for Civil.
Minnesota
Minnesota now reports over 80% of civil case types
Civil Case TypePrior Case
Types ReportedCase Types
Now Reported
Automobile tort
Malpractice – medical ✓
Malpractice – legal ✓
Malpractice – other ✓ ✓
Premises liability
Product liability – asbestos ✓
Product liability – tobacco
Product liability – other ✓
Slander/libel/defamation ✓
other tort ✓ ✓
Buyer plaintiff
employment – discrimination ✓
employment – other ✓ ✓
Fraud
Landlord/tenant – Unlawful detainer ✓ ✓
Landlord/tenant – other ✓
Mortgage Foreclosure ✓
Seller plaintiff (debt collection) ✓
other contract ✓ ✓
eminent domain ✓ ✓
other real property ✓
Small Claims ✓ ✓
Guardianship – adult ✓ ✓
Guardianship – juvenile ✓
Conservatorship/trusteeship ✓ ✓
Probate/wills/intestate ✓ ✓
other probate/estate ✓ ✓
total Mental Health ✓ ✓
Administrative agency appeals ✓
other civil appeals ✓ ✓
Habeas corpus ✓
Non-dom. rel. restraining order ✓ ✓
tax cases ✓
Writ involving prison conditions
other writs
total other Civil ✓ ✓
Total Case Types Reported 15 29
Examining the Work of State Courts: An Analysis of 2008 State Court CaseloadsTrial Courts: Civil Caseloads
Examining the Work of State Courts: An Analysis of 2008 State Court CaseloadsTrial Courts: Civil Caseloads — Reporting Excellence Award — Minnesota 37

Domestic Relations Caseloads
Domestic relations caseloads comprise 12 percent of all non-traffic cases
Support, custody, and protection order caseloads continue to increase
Domestic relations caseloads include divorce/dissolution, paternity, custody, support, visitation, adoption, and civil protection/restraining order cases.
Total Incoming Cases in State Courts, by Jurisdiction, 2008 (in millions)
Jurisdiction Percentof Total
Percent of Non-Traffic TotalCase Categories Unified General Unified & General Limited Total
traffic/Violations 12.2 1.9 14.1 43.5 57.5 54.3% --
Criminal 3.2 3.3 6.6 14.7 21.3 20.1% 43.9%
Civil 3.5 5.2 8.7 10.8 19.4 18.3% 40.1%
Domestic Relations 1.0 3.1 4.1 1.6 5.7 5.4% 11.8%
Juvenile 0.4 1.0 1.4 0.7 2.1 2.0% 4.3%
All Cases 20.2 14.5 34.7 71.3 106.0 100.0% 100.0%
Note: totals may not sum due to rounding.
Domestic Relations Caseloads, 1999-2008
Trial Courts
Support (11 States)
0
1999 2002 2005 2008
250,000
500,000
750,000
1,000,000
1,250,000
+ 26%
1999 2002 2005 2008
250,000
500,000
750,000
1,000,000
1,250,000Adoption (30 States)
0 -14%1999 2002 2005 2008
250,000
500,000
750,000
1,000,000
1,250,000Divorce (33 States)
0
-8%
1999 2002 2005 2008
250,000
500,000
750,000
1,000,000
1,250,000Civil Protection Order (25 States)
0
+14%
1999 2002 2005 2008
250,000
500,000
750,000
1,000,000
1,250,000Paternity (18 States)
0- 6%
1999 2002 2005 2008
250,000
500,000
750,000
1,000,000
1,250,000Custody (6 States)
0
+20%
Num
ber
of C
ases
Examining the Work of State Courts: An Analysis of 2008 State Court CaseloadsTrial Courts: Domestic Relations Caseloads38 Examining the Work of State Courts: An Analysis of 2008 State Court Caseloads
Trial Courts: Domestic Relations Caseloads

Despite noticeable declines, divorce cases usually dominate domestic relations caseloads
Percent of Total Incoming Domestic Relations Caseloads by Case Type in 23 States, 2008
State Divorce CPO Support Paternity Adoption Custody Visitation
Utah 60% 22% 1% 6% 8% 3%
Colorado 51% 14% 14% 6% 6% 9%
Puerto Rico 46% 39% 1% 1% 5% 3%
Washington 43% 27% 0% 10% 5% 2%
Hawaii 43% 34% 3% 15% 5%
Wyoming 41% 15% 26% 10% 5% 1%
illinois 41% 35% 1% 3%
Wisconsin 40% 15% 14% 27% 4%
Arkansas 39% 18% 18% 12% 4% 7%
Connecticut 38% 24% 15% 5% 4% 11% 1%
Minnesota 34% 23% 22% 10% 4% 5%
Michigan 34% 21% 20% 15% 4% 2%
Iowa 33% 15% 10% 16% 4% 4%
Maryland 29% 24% 16% 2%
Missouri 25% 46% 14% 9% 3% 1%
New Mexico 25% 27% 27% 15% 2% 2%
West Virginia 22% 60% 6% 3% 2% 2%
Arizona 22% 30% 31% 1%
ohio 20% 8% 41% 6% 2% 15% 1%
Florida 19% 23% 37%
North Dakota 13% 5% 69% 10% 2% 2%
New York 9% 8% 48% 6% 1% 28% Reported as one aggregate caseload.
idaho 20% 16% 4%
Median 34% 22% 17% 10% 4% 3% 1%
Number of States Reporting 22 22 22 19 22 15 4
Notes: States in Bold have a unified court system. Blank cells indicate the state did not report data for this case type. CPo = Civil Protection order.
Examining the Work of State Courts: An Analysis of 2008 State Court CaseloadsTrial Courts: Domestic Relations Caseloads
Examining the Work of State Courts: An Analysis of 2008 State Court CaseloadsTrial Courts: Domestic Relations Caseloads 39
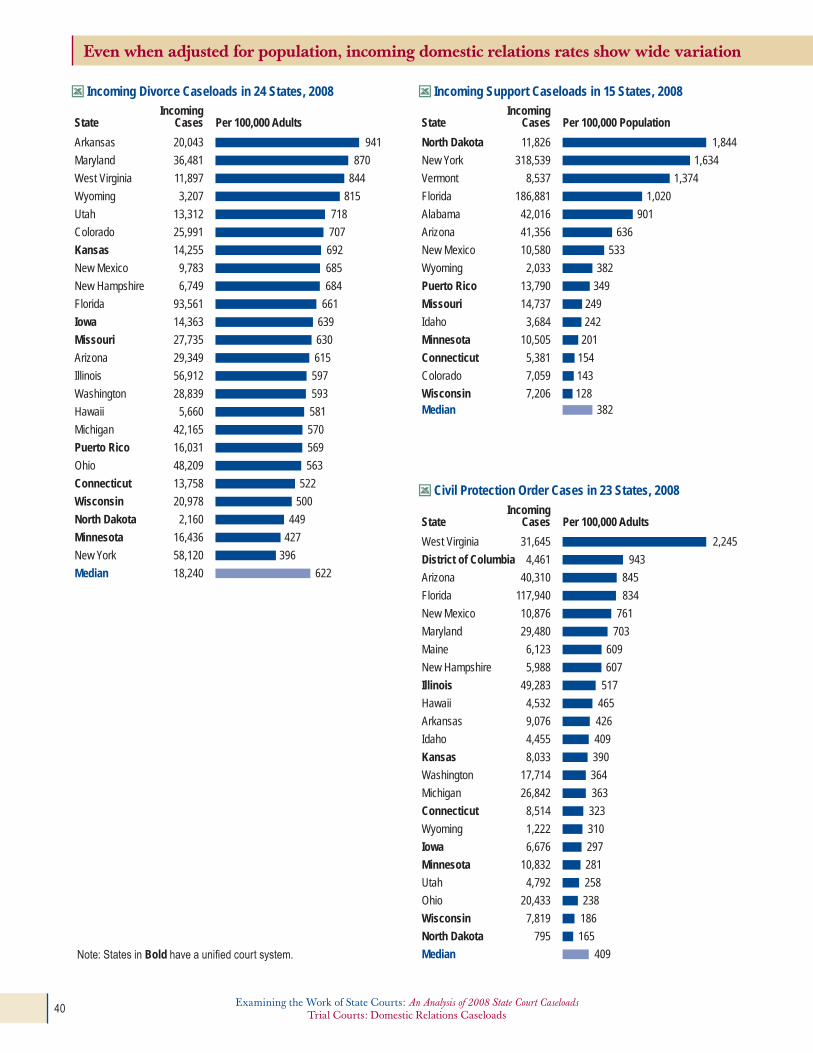
Even when adjusted for population, incoming domestic relations rates show wide variation
IncomingCasesState Per 100,000 Adults
Arkansas 20,043
Maryland 36,481
West Virginia 11,897
Wyoming 3,207
Utah 13,312
Colorado 25,991
Kansas 14,255
New Mexico 9,783
New Hampshire 6,749
Florida 93,561
Iowa 14,363
Missouri 27,735
Arizona 29,349
Illinois 56,912
Washington 28,839
Hawaii 5,660
Michigan 42,165
Puerto Rico 16,031
Ohio 48,209
Connecticut 13,758
Wisconsin 20,978
North Dakota 2,160
Minnesota 16,436
New York 58,120
Median 18,240
941
870
844
815
718
707
692
685
684
661
639
630
615
597
593
581
570
569
563
522
500
449
427
396
622
IncomingCasesState Per 100,000 Population
Median
North Dakota 11,826
New York 318,539
Vermont 8,537
Florida 186,881
Alabama 42,016
Arizona 41,356
New Mexico 10,580
Wyoming 2,033
Puerto Rico 13,790
Missouri 14,737
Idaho 3,684
Minnesota 10,505
Connecticut 5,381
Colorado 7,059
Wisconsin 7,206
1,844
1,634
1,374
1,020
901
636
533
382
349
249
242
201
154
143
128382
IncomingCasesState Per 100,000 Adults
West Virginia 31,645
District of Columbia 4,461
Arizona 40,310
Florida 117,940
New Mexico 10,876
Maryland 29,480
Maine 6,123
New Hampshire 5,988
Illinois 49,283
Hawaii 4,532
Arkansas 9,076
Idaho 4,455
Kansas 8,033
Washington 17,714
Michigan 26,842
Connecticut 8,514
Wyoming 1,222
Iowa 6,676
Minnesota 10,832
Utah 4,792 258
Ohio 20,433 238
Wisconsin 7,819
North Dakota 795
Median
2,245
943
845
834
761
703
609
607
517
465
426
409
390
364
363
323
310
297
281
186
165
409
Incoming Divorce Caseloads in 24 States, 2008 Incoming Support Caseloads in 15 States, 2008
Civil Protection Order Cases in 23 States, 2008
Note: States in Bold have a unified court system.
Examining the Work of State Courts: An Analysis of 2008 State Court CaseloadsTrial Courts: Domestic Relations Caseloads40 Examining the Work of State Courts: An Analysis of 2008 State Court Caseloads
Trial Courts: Domestic Relations Caseloads

Note: States in Bold have a unified court system.
IncomingCasesState Per 100,000 Adults
IncomingCasesState Per 100,000 Juveniles
Maryland 20,168
New Mexico 6,084
North Dakota 1,629
Wisconsin 13,962
Iowa 7,155
Arkansas 6,152
New York 39,653
Michigan 19,283
Kansas 4,787
Missouri 9,554
Hawaii 1,942
Wyoming 783
Ohio 14,683
Washington 6,866
Minnesota 5,007
Colorado 2,898
Utah 1,252
Connecticut 1,773
New Hampshire 337
Puerto Rico 324
Median
481
426
339
333
318
289
270
261
232
217
199
199
171
141
130
79
67
67
34
11
208
Arkansas 2,133
Kansas 2,097
Wyoming 386
Iowa 1,937
West Virginia 1,010
District of Columbia 274
Colorado 2,873
Hawaii 675
Maryland 3,070
Nebraska 992
New Hampshire 687
Idaho 900
Utah 1,769
Michigan 5,074
North Dakota 299
Washington 3,058
Missouri 2,734
New York 8,524
Connecticut 1,517
Ohio 4,824
Wisconsin 2,219
Minnesota 2,025
Louisiana 1,510
New Mexico 694
Illinois 4,193
Arizona 1,785
Puerto Rico 324
Median
294
282
278
257
250
230
227
215
213
211
209
207
201
194
186
182
181
177
175
165
155
148
125
125
125
103
29
194
IncomingCasesState Per 100,000 Juveniles
Delaware 877
Ohio 3,371
Puerto Rico 1,112
Missouri 618
New Hampshire 41
Utah 39
Median
405
116
98
41
12
4
69
IncomingCasesState Per 100,000 Population
Colorado 4,488
Iowa 1,574
Minnesota 2,605
Puerto Rico 1,901
Washington 1,538
Michigan 2,119
Median 2,010
355
209
190
168
91
81
179
Incoming Paternity Caseloads in 20 States, 2008
Incoming Visitation Caseloads in 6 States, 2008
Incoming Adoption Caseloads in 27 States, 2008
Incoming Child Custody Caseloads in 6 States, 2008
Note: States in Bold have a unified court system.
States still have difficulty reporting visitation and child custody caseloads
Examining the Work of State Courts: An Analysis of 2008 State Court CaseloadsTrial Courts: Domestic Relations Caseloads
Examining the Work of State Courts: An Analysis of 2008 State Court CaseloadsTrial Courts: Domestic Relations Caseloads 41

Eight states report a reopened/reactivated domestic relations caseload
Wyoming reports new filings for each of the seven domestic relations case types; Ohio can also distinguish new filings from reopened/reactivated caseloads
Proportion of New Filings to Reopened/Reactivated Caseloads in 8 States, 2008
Domestic Relations Caseload Composition in Wyoming, 2008 Domestic Relations Caseload Composition in Ohio, 2008
State
0 20% 40% 60% 80% 100%
■ New Filing ■ Reopened/Reactivated
98%
97%
94%
80%
76%
75%
Wisconsin
Illinois
Michigan
District of Columbia
Puerto Rico
New Mexico
Florida
North Dakota
98%
99%
IncomingCasesCase Type Percent of Domestic Caseload
IncomingCasesCase Type Percent of Domestic Caseload
Divorce 3,207
Support 2,033
Adoption 386
CPO 1,222
Paternity 783
Custody 89
Visitation 35
Grand Total Domestic 7,895
41%
26%
16%
16%
10%
1.1%
0.4%
Support 100,218
Divorce 48,209
Custody 35,839
CPO 20,433
Paternity 14,683
Adoption 4,824
Visitation 3,371
Grand Total Domestic 243,594■ New Filing■ Reopened/Reactivated
41%
20%
15%
8%
6%
2%
1.4%
Certain domestic relations actions—such as support, custody, visitation, and even civil protection order cases—have an increased likelihood of requiring occasional revisiting by the court. Child or spousal support amounts may need to be adjusted, custody agreements can be revised, and a temporary civil protection orders may need to be renewed upon expiration. each of these events would necessitate that the court “reopen” the case to modify the existing judgment. the Guide recommends that reopened cases, along with new filings and reactivated cases, be counted as the elements of a court’s incoming caseloads.
Note: States in Bold have a unified court system.
Note: CPo = Civil Protection order
Examining the Work of State Courts: An Analysis of 2008 State Court CaseloadsTrial Courts: Domestic Relations Caseloads42 Examining the Work of State Courts: An Analysis of 2008 State Court Caseloads
Trial Courts: Domestic Relations Caseloads
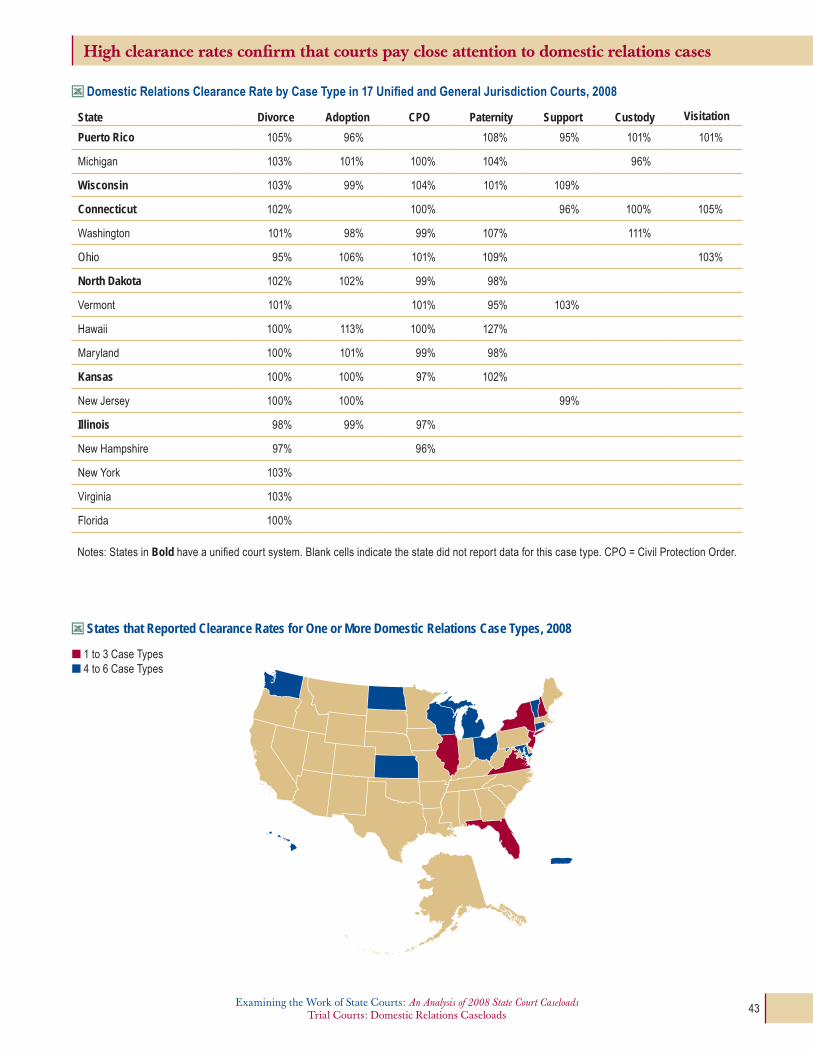
High clearance rates confirm that courts pay close attention to domestic relations cases
Domestic Relations Clearance Rate by Case Type in 17 Unified and General Jurisdiction Courts, 2008
State Divorce Adoption CPO Paternity Support Custody Visitation
Puerto Rico 105% 96% 108% 95% 101% 101%
Michigan 103% 101% 100% 104% 96%
Wisconsin 103% 99% 104% 101% 109%
Connecticut 102% 100% 96% 100% 105%
Washington 101% 98% 99% 107% 111%
ohio 95% 106% 101% 109% 103%
North Dakota 102% 102% 99% 98%
Vermont 101% 101% 95% 103%
Hawaii 100% 113% 100% 127%
Maryland 100% 101% 99% 98%
Kansas 100% 100% 97% 102%
New Jersey 100% 100% 99%
Illinois 98% 99% 97%
New Hampshire 97% 96%
New York 103%
Virginia 103%
Florida 100%
Notes: States in Bold have a unified court system. Blank cells indicate the state did not report data for this case type. CPo = Civil Protection order.
States that Reported Clearance Rates for One or More Domestic Relations Case Types, 2008
n 1 to 3 Case types n 4 to 6 Case types
Examining the Work of State Courts: An Analysis of 2008 State Court CaseloadsTrial Courts: Domestic Relations Caseloads
Examining the Work of State Courts: An Analysis of 2008 State Court CaseloadsTrial Courts: Domestic Relations Caseloads 43

Approximately half of the support cases in Missouri, New York, and Vermont qualify for Title IV-D financial support
Support Composition in Three States, 2008
47%53%
Missouri(14,737 Cases)
86%
14%
New York(318,539 Cases)
62%
33%
5%
Vermont(8,537 Cases)
■ IV-D Cases ■ Non IV-D Cases ■ Other Support Cases
title iV-D of the Social Security Act is a state-run child support enforcement program that helps locate noncustodial parents, establish paternity, and establish and enforce support orders. Under title iV-D, states are required to provide child support services in order to receive federal funding. title iV-D assistance is available to all who request it, regardless of a child’s eligibility for other state or federally funded programs.
For the purposes of the CSP, iV-D cases are defined as those cases that request maintenance of a parent/guardian or minor child by a person living in the same state (“iV-D intrastate”) or different state (Uniform interstate Family Support Act— “UiFSA”) who is required, under title iV-D of the Social Security Act of 1973, to provide such maintenance. Non iV-D cases are support cases filed to request maintenance of a parent/guardian or a minor child by a person who is required by law, but who is not under the auspices of title iV-D of the Social Security Act of 1973, to provide such maintenance.
Examining the Work of State Courts: An Analysis of 2008 State Court CaseloadsTrial Courts: Domestic Relations Caseloads44 Examining the Work of State Courts: An Analysis of 2008 State Court Caseloads
Trial Courts: Criminal Caseloads

Criminal Caseloads
Over 21 million criminal cases were reported in 2008
Over the past decade, population-adjusted criminal caseloads have declined slightly
Though aggregate criminal caseloads have traditionally exceeded civil caseloads by a wide margin, the recent flat trend in criminal case filings has allowed increasing civil caseloads to catch up; there are now less than 2 million cases separating criminal and civil caseloads. The effect of the economy on criminal cases is not clearly known, but according to the FBI, the number of arrests has fallen slightly in each of the last four years.
Total Incoming Cases in State Courts, by Jurisdiction, 2008 (in millions)
Jurisdiction Percentof TotalCase Categories Unified General Unified & General Limited Total
traffic/Violations 12.2 1.9 14.1 43.5 57.5 54.3%
Criminal 3.2 3.3 6.6 14.7 21.3 20.1%
Civil 3.5 5.2 8.7 10.8 19.4 18.3%
Domestic Relations 1.0 3.1 4.1 1.6 5.7 5.4%
Juvenile 0.4 1.0 1.4 0.7 2.1 2.0%
All Cases 20.2 14.5 34.7 71.3 106.0 100.0%
Note: totals may not sum due to rounding.
Incoming Criminal Caseloads in State Courts, 1999-2008 Incoming Criminal Cases per 100,000 Population, 1999-2008
Trial Courts
0
3
6
9
12
15
18
1999 2002 2005 2008
Mill
ions
+13%
+10%
Incoming Misdemeanor Cases
Incoming Felony Cases
0
2.5
5
7.5
10
1999 2002 2005 2008
Thou
sand
s -2%
Incoming Criminal Cases
Examining the Work of State Courts: An Analysis of 2008 State Court CaseloadsTrial Courts: Domestic Relations Caseloads
Examining the Work of State Courts: An Analysis of 2008 State Court CaseloadsTrial Courts: Criminal Caseloads 45

Limited jurisdiction courts typically process 5 times as many criminal cases as do their general jurisdiction counterparts
Incoming Criminal Caseloads and Rates in 19 States, 2008Incoming Criminal Cases
Total
Criminal Cases Per 100,000 Adults
TotalStateGeneral
JurisdictionLimited
JurisdictionGeneral
JurisdictionLimited
Jurisdiction
Unified Courts
illinois 512,133 512,133 5,372 5,372
Missouri 189,227 189,227 4,297 4,297
iowa 91,962 91,962 4,089 4,089
Puerto Rico 76,655 76,655 2,719 2,719
Median 4,193 4,193
Two-Tiered Courts
Virginia 186,261 976,965 1,163,226 3,180 16,678 19,857
Arizona 61,322 701,716 763,038 1,285 14,708 15,993
Michigan 70,941 941,425 1,012,366 960 12,735 13,694
idaho 10,832 122,863 133,695 994 11,277 12,271
Hawaii 7,537 104,672 112,209 774 10,748 11,522
Louisiana 161,855 202,905 364,760 5,047 6,328 11,375
Florida 392,338 1,111,647 1,503,985 2,773 7,856 10,629
New Hampshire 12,685 65,089 77,774 1,285 6,596 7,881
Kentucky 31,950 219,302 251,252 993 6,813 7,805
Washington 44,976 313,487 358,463 924 6,442 7,367
Utah 39,267 82,655 121,922 2,116 4,455 6,572
indiana 256,628 50,647 307,275 5,431 1,072 6,503
Rhode island 5,739 36,544 42,283 715 4,552 5,267
oklahoma 110,209 n/j 110,209 4,083 n/j 4,083
Vermont 17,862 n/j 17,862 3,793 n/j 3,793
Median 1,285 6,813 7,881
Notes: n/j = Court does not have jurisdiction over the case type. Blank cells indicate incomplete data.
Examining the Work of State Courts: An Analysis of 2008 State Court CaseloadsTrial Courts: Criminal Caseloads46 Examining the Work of State Courts: An Analysis of 2008 State Court Caseloads
Trial Courts: Criminal Caseloads

Misdemeanor cases comprise the overwhelming majority of criminal caseloads
Property cases account for one-third of the felony caseload
Criminal Caseload Composition in 11 States, 2008
State Misdemeanor Felony Other Criminal
Hawaii 93% 7% 0%
Arizona 89% 11% 0%
Washington 87% 12% 1%
Utah 81% 18% 1%
Vermont 81% 19% 0%
New Hampshire 75% 24% 1%
Florida 74% 26% 0%
Iowa 74% 26% 0%
Rhode island 69% 31% 1%
Missouri 68% 31% 1%
Puerto Rico 57% 43% 0%
Note: States in Bold have a unified court system.
Felony Caseload Composition in 5 States, 2008
21%
79%
0.3%
32%
25%23%
6%
14%
Property Drug Person Motor Vehicle Other
Examining the Work of State Courts: An Analysis of 2008 State Court CaseloadsTrial Courts: Criminal Caseloads
Examining the Work of State Courts: An Analysis of 2008 State Court CaseloadsTrial Courts: Criminal Caseloads 47

Incoming Felony Caseloads and Rates in 34 Unified and General Jurisdiction Courts, 2008
Unified and general jurisdiction courts report about one felony case for every 92 adults
IncomingCasesState Per 100,000 Adults
Unified Courts
North Dakota 6,785 1,410Missouri 57,973 1,316Puerto Rico 33,239 1,179Iowa 24,126 1,073Kansas 19,933 968Minnesota 34,026 883Wisconsin 33,581 801Median 1,073
IncomingCasesState Per 100,000 Adults
General Jurisdiction Courts
Florida 391,603 2,768Arkansas 57,218 2,686Virginia 128,934 2,201Tennessee 88,033 1,879Louisiana 56,634 1,766Oklahoma 44,191 1,637New Mexico 23,168 1,622Indiana 76,113 1,611Texas 276,939 1,586North Carolina 110,083 1,579Arizona 59,385 1,245Utah 21,874 1,179Ohio 95,153 1,110Colorado 40,492 1,102Oregon 29,373 1,029New Hampshire 9,344 947Michigan 69,912 946Idaho 9,530 875New Jersey 54,416 833Washington 40,268 828Vermont 3,411 724Rhode Island 5,499 685Nevada 11,787 609Wyoming 1,978 502West Virginia 6,265 444Hawaii 3,668 377Massachusetts 5,617 113Median 1,102
Examining the Work of State Courts: An Analysis of 2008 State Court CaseloadsTrial Courts: Criminal Caseloads48 Examining the Work of State Courts: An Analysis of 2008 State Court Caseloads
Trial Courts: Criminal Caseloads

Half of unified and general jurisdiction courts reported felony clearance rates of 100 percent or more
IncomingCasesState Unified Courts Clearance Rate
General Jurisdiction Courts Clearance Rate
85% 90% 95% 100% 105% 110% 115% 120%
85% 90% 95% 100% 105% 110% 115% 120%
Wisconsin 33,581
Puerto Rico 33,239
Missouri 57,973
Kansas 19,933
North Dakota 6,785
Median
Idaho 9,530
Oregon 29,373
Colorado 40,492
Massachusetts 5,617
New Jersey 54,416
Rhode Island 5,499
Vermont 3,411
Ohio 95,153
Tennessee 88,033
Arkansas 57,218
Michigan 69,912
New Mexico 23,168
Utah 21,874
Texas 276,939
New Hampshire 9,344
Indiana 76,113
North Carolina 110,083
Oklahoma 44,191
Washington 40,268
Arizona 59,385
West Virginia 6,265
Hawaii 3,668
Median
Felony Clearance Rates in Unified and General Jurisdiction Courts in 27 States, 2008
Examining the Work of State Courts: An Analysis of 2008 State Court CaseloadsTrial Courts: Criminal Caseloads
Examining the Work of State Courts: An Analysis of 2008 State Court CaseloadsTrial Courts: Criminal Caseloads 49
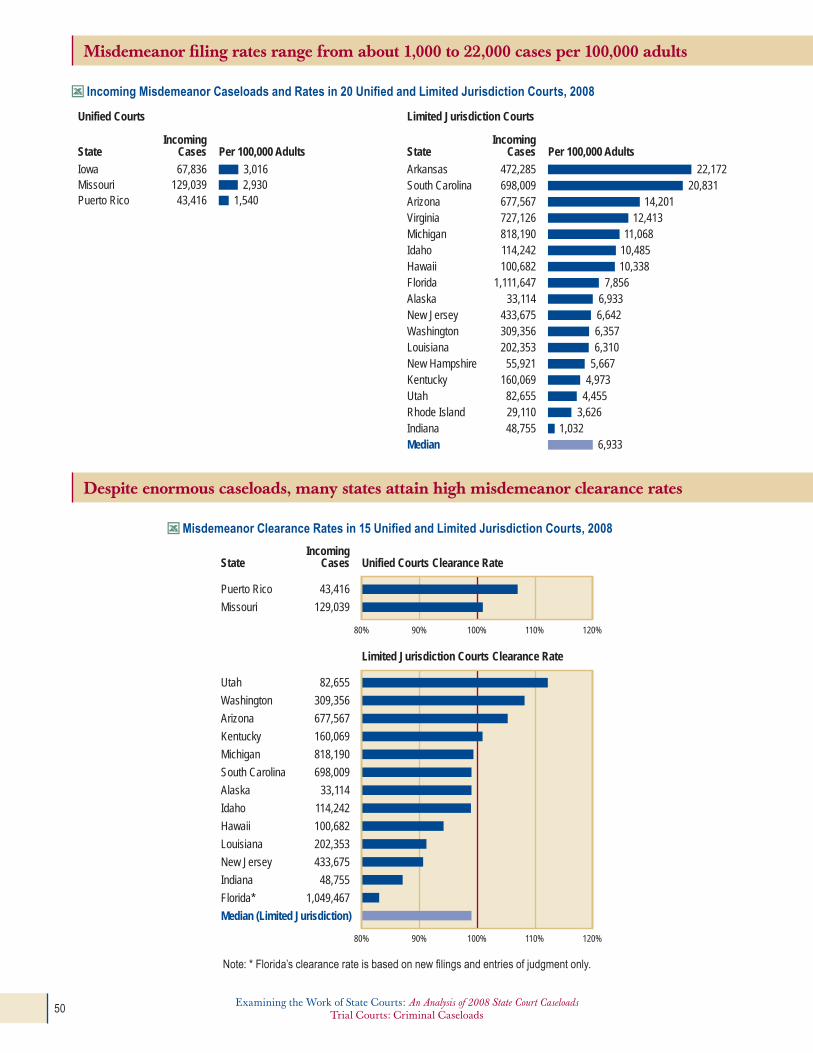
Misdemeanor filing rates range from about 1,000 to 22,000 cases per 100,000 adults
Iowa 67,836Missouri 129,039Puerto Rico 43,416
3,0162,930
1,540
Arkansas 472,285South Carolina 698,009Arizona 677,567Virginia 727,126Michigan 818,190Idaho 114,242Hawaii 100,682Florida 1,111,647Alaska 33,114New Jersey 433,675Washington 309,356Louisiana 202,353New Hampshire 55,921Kentucky 160,069Utah 82,655Rhode Island 29,110Indiana 48,755Median
22,17220,831
14,20112,413
11,06810,48510,338
7,8566,9336,6426,3576,310
5,6674,973
4,4553,626
1,0326,933
IncomingCasesState Per 100,000 Adults
Unified Courts
IncomingCasesState Per 100,000 Adults
Limited Jurisdiction Courts
Incoming Misdemeanor Caseloads and Rates in 20 Unified and Limited Jurisdiction Courts, 2008
Despite enormous caseloads, many states attain high misdemeanor clearance rates
Misdemeanor Clearance Rates in 15 Unified and Limited Jurisdiction Courts, 2008
IncomingCasesState Unified Courts Clearance Rate
Limited Jurisdiction Courts Clearance Rate
Puerto Rico 43,416
Missouri 129,039
Utah 82,655
Washington 309,356
Arizona 677,567
Kentucky 160,069
Michigan 818,190
South Carolina 698,009
Alaska 33,114
Idaho 114,242
Hawaii 100,682
Louisiana 202,353
New Jersey 433,675
Indiana 48,755
Florida* 1,049,467
Median (Limited Jurisdiction)
80% 90% 100% 110% 120%
80% 90% 100% 110% 120%
Note: * Florida’s clearance rate is based on new filings and entries of judgment only.
Examining the Work of State Courts: An Analysis of 2008 State Court CaseloadsTrial Courts: Criminal Caseloads50 Examining the Work of State Courts: An Analysis of 2008 State Court Caseloads
Trial Courts: Juvenile Caseloads

Juvenile CaseloadsTrial Courts
Juvenile caseloads make up the smallest share of all incoming cases
Total Incoming Cases in State Courts, by Jurisdiction, 2008 (in millions)
Jurisdiction Percentof TotalCase Categories Unified General Unified & General Limited Total
traffic/Violations 12.2 1.9 14.1 43.5 57.5 54.3%
Criminal 3.2 3.3 6.6 14.7 21.3 20.1%
Civil 3.5 5.2 8.7 10.8 19.4 18.3%
Domestic Relations 1.0 3.1 4.1 1.6 5.7 5.4%
Juvenile 0.4 1.0 1.4 0.7 2.1 2.0%
All Cases 20.2 14.5 34.7 71.3 106.0 100.0%
Notes: includes all 50 states, District of Columbia and Puerto Rico. totals may not sum due to rounding.
Incoming Juvenile Cases in 36 States, 2008
North Dakota 9,806
Hawaii 18,063
Utah 50,570
Ohio 166,671
South Dakota 11,787
Virginia 100,315
Alabama 59,012
Florida 196,204
Rhode Island 9,878
Minnesota 53,287
Idaho 16,150
District of Columbia 4,407
New Jersey 76,420
Connecticut 30,611
Arkansas 25,357
Maryland 40,007
Washington 46,364
Kansas 20,025
Nebraska 12,623
New York 125,734
West Virginia 9,571
Michigan 59,787
North Carolina 40,945
Colorado 22,157
Oklahoma 15,706
Iowa 12,215
Wisconsin 19,748
Alaska 2,853
New Mexico 7,576
Vermont 2,042
Arizona 21,355
Wyoming 1,708
Missouri 15,270
Montana 2,420
Illinois 29,248
Puerto Rico 7,827
Median
6,115
5,747
5,739
5,713
5,469
5,249
5,003
4,695
3,983
3,896
3,719
3,705
3,549
3,540
3,496
2,774
2,755
2,697
2,691
2,612
2,365
2,290
1,820
1,752
1,665
1,621
1,376
1,367
1,364
1,358
1,235
1,229
1,013
981
869
690
2,694
IncomingCasesState Per 100,000 Juveniles
IncomingCasesState Per 100,000 Juveniles
Note: States in Bold have a unified court system.
Examining the Work of State Courts: An Analysis of 2008 State Court CaseloadsTrial Courts: Criminal Caseloads
Examining the Work of State Courts: An Analysis of 2008 State Court CaseloadsTrial Courts: Juvenile Caseloads 51

Caseload compositions are similar regardless of the jurisdiction hearing the case
Although courts may opt to grant jurisdiction for delinquency, dependency, and status offense cases to specific courts or court levels within their state, caseload compositions among unified, general and limited jurisdiction courts are similar.
Incoming Juvenile Caseload Composition in 23 States, by Jurisdiction, 2008
Unified Courts (6 States)
45%
32%
22%
1%
Delinquency
Dependency
Status Offense
Other
General Jurisdiction Courts (11 States)
70%
13%
12%
5%
Delinquency
Dependency
Status Offense
Other
Limited Jurisdiction Courts (7 States)
Delinquency
Dependency
Status Offense
Other
49%
35%
11%
4%
Examining the Work of State Courts: An Analysis of 2008 State Court CaseloadsTrial Courts: Juvenile Caseloads52 Examining the Work of State Courts: An Analysis of 2008 State Court Caseloads
Trial Courts: Juvenile Caseloads

■ Delinquency ■ Dependency ■ Status Offense ■ Other Juvenile
0% 10% 20% 30% 40% 50% 60% 70% 80% 90% 100%
New Mexico
Maryland
New Jersey
Utah
Ohio
Virginia
Kansas
North Dakota
Colorado
North Carolina
Arkansas
Wyoming
Vermont
Alabama
Iowa
Missouri
Washington
Minnesota
Connecticut
New York
Juvenile Caseload Composition in 20 States, 2008
Overall, delinquency cases outnumber all other juvenile cases at least three to one
Examining the Work of State Courts: An Analysis of 2008 State Court CaseloadsTrial Courts: Juvenile Caseloads
Examining the Work of State Courts: An Analysis of 2008 State Court CaseloadsTrial Courts: Juvenile Caseloads 53

Detailed reporting of delinquency case types permits more meaningful comparisons
Most states clear 100 percent of their delinquency caseloads
Note: States in Bold have a unified court system.
Juvenile Delinquency Caseload Composition in Three States, 2008
Delinquency Clearance Rates in 21 States, 2008
35% 34%
26%
Property
28%
11%
22%
Person
19%
26%
17%
Public Order
13%
8% 9%
Drug
5%
21%
26%
Other
North Carolina 23,662
Alabama 30,584
Vermont 1,063
New Mexico 6,859
Connecticut 10,625
Kansas 13,248
Indiana 24,246
Ohio 119,296
Virginia 67,553
New Jersey 63,811
Kentucy 17,850
Washington 19,890
Utah 36,695
Oklahoma 8,888
Texas 47,856
New York 20,565
Delaware 7,857
Arkansas 14,297
Maryland 35,221
South Dakota 10,799
Illinois 22,755
Median
IncomingCasesState Delinquency Clearance Rate
80% 90% 95%85% 100% 105% 110%
n Utah n Colorado n Kansas
Examining the Work of State Courts: An Analysis of 2008 State Court CaseloadsTrial Courts: Juvenile Caseloads54 Examining the Work of State Courts: An Analysis of 2008 State Court Caseloads
Trial Courts: Juvenile Caseloads

Clearing status offense caseloads proved slightly more difficult
Status Offense Clearance Rates in 17 States, 2008
IncomingCasesState Dependency Clearance Rate
80% 100%90% 110% 120% 130%
Maryland 4,072North Carolina 12,500Rhode Island 2,074Alabama 14,069Utah 4,784Puerto Rico 1,239Ohio 18,443Vermont 725Virginia 10,839New Mexico 702Washington 8,614Kansas 3,888Michigan 7,878New Jersey 6,482New York 97,384Wisconsin 6,708Indiana 16,423Montana 1,030Arkansas 4,387Missouri 7,781Idaho 1,293District of Columbia 871Median
IncomingCasesState Status Offense Clearance Rate
85% 95% 100%90% 105% 110% 115%
Alabama 8,286Vermont 254Indiana 5,333Connecticut 2,586Washington 15,578New York 7,785Ohio 20,869Virginia 14,746Arkansas 6,544Utah 7,220New Jersey 919Kentucky 6,276Oklahoma 598Kansas 2,889Missouri 717Maryland 246Hawaii 7,665Median
Note: States in Bold have a unified court system.
Note: States in Bold have a unified court system.
Over half of these states cleared 100 percent of their dependency caseloads
Dependency Clearance Rates in 22 States, 2008
Examining the Work of State Courts: An Analysis of 2008 State Court CaseloadsTrial Courts: Juvenile Caseloads
Examining the Work of State Courts: An Analysis of 2008 State Court CaseloadsTrial Courts: Juvenile Caseloads 55

Traffic/Violations CaseloadsTrial Courts
Traffic/Violations cases invariably dominate caseloads in state trial courts
One traffic, parking, or ordinance violation case is filed for every 5 people in the U.S.
Total Incoming Cases in State Courts, by Jurisdiction, 2008 (in millions)
JurisdictionPercentof TotalCase Categories Unified General
Unified & General Limited Total
Traffic/Violations 12.2 1.9 14.1 43.5 57.5 54.3%
Criminal 3.2 3.3 6.6 14.7 21.3 20.1%
Civil 3.5 5.2 8.7 10.8 19.4 18.3%
Domestic Relations 1.0 3.1 4.1 1.6 5.7 5.4%
Juvenile 0.4 1.0 1.4 0.7 2.1 2.0%
All Cases 20.2 14.5 34.7 71.3 106.0 100.0%
Incoming Traffic/Violations Caseloads in 16 States, 2008
IncomingCasesState Per 100,000 Population
New Jersey 5,899,404
Hawaii 431,791
Arizona 1,645,410
Iowa 716,597
Michigan 2,375,543
Illinois 2,977,677
Arkansas 655,334
Vermont 124,589
Virginia 1,544,485
Utah 524,488
Indiana 1,057,144
Alaska 74,951
Florida 1,808,304
Kentucky 384,180
New Hampshire 72,395
Puerto Rico 10,687
Median
67,945
33,519
25,313
23,866
23,747
23,080
22,951
20,054
19,880
19,167
16,578
10,921
9,866
8,999
5,502
270
19,967
Note: States in Bold have a unified court system.
Special Recognition:
Arizona’s Limited Jurisdiction Courts
Arizona’s Limited Jurisdiction Courts Recognized
Last year, the Court Statistics Project recognized Hawaii for having used the State Court Guide to Statistical Reporting as the template for reporting its Traffic/Violations caseload. Hawaii expended considerable resources mapping their traffic and ordinance violations caseloads into all of the Guide case types and status categories, simultaneously becoming the first state to do so and the first state to be the recipient of the CSP Reporting Excellence Award for Traffic/Violations caseloads.
Had it not been for the outstanding achievements of Hawaii that year, the award most likely would have been presented to this year’s recipient, Arizona. Arizona has been reporting nearly all of the Traffic/Violations case type and status category data from both of its limited jurisdiction venues—the Justice of the Peace and Municipal courts—since 2000, before the advent of the Guide and its recommendations. Their achievement is all the more remarkable when the size of their caseload is considered. Arizona is the 14th most populous state, but the 1.6 million Traffic/Violations cases they reported for 2008 ranked them 3rd in cases per 100,000 population among the 16 states that report total incoming Traffic caseloads.
Arizona
Most Traffic/Violations cases in Arizona are processed in the Municipal Court
91.5%
Non-Criminal Traffic Violations/Infractions
(1,505,686 Cases)
6.8%
Parking Violations(111,810 Cases)
1.7%
Ordinance Violations(27,914 Cases)
25%Justice of the Peace
Municipal Court75%
99.6%
89%
Non-Criminal Traffic Violations/Infractions
0.4%9%
Parking Violations
0.01% 2%
Ordinance Violations
■ Justice of the Peace (408,998 Cases) ■ Municipal Court (1,236,412 Cases)
Traffic/Violations Caseload Composition in Arizona, by Court, 2008
Traffic/Violations Caseload Distribution in Arizona, by Court, 2008
Incoming Traffic/Violations Caseloads in Arizona, 2008
Examining the Work of State Courts: An Analysis of 2008 State Court CaseloadsTrial Courts: Traffic/Violations Caseloads — Reporting Excellence Award — Arizona58 Examining the Work of State Courts: An Analysis of 2008 State Court Caseloads
Trial Courts: Traffic/Violations Caseloads — Reporting Excellence Award — Arizona
Complete data allows for policy analysis and better management of court operations
When a court collects complete caseload data by case type, the possibility exists for numerous types of analyses, including clearance rate calculations and the determination of increases or decreases in pending caseloads.
Pending, Filing, and Entry of Judgment Caseloads, 2008
1500,000
0
30,000
60,000
90,000
1200,000
1,500,000
0
300,000
600,000
900,000
1,200,000
0
100,000
200,000
300,000
400,000
500,000 1,500,000
0
300,000
600,000
900,000
1,200,000
2,000
0
400
800
1,200
1,600
50
0
10
20
30
40
BeginPending
NewFiling
Entry ofJudgment
EndPending
0
6,000
12,000
18,000
24,000
30,000
0
100,000
200,000
300,000
400,000
500,000
Municipal Court Caseloads
Non-Criminal Traffic Violations
Total Traffic/Violations
Parking Violations
Ordinance Violations
Non-Criminal Traffic Violations
Justice of the Peace Court Caseloads
Total Traffic/Violations
Parking Violations
Ordinance Violations
+7%
+8%
+2%
+10%
-3%
+29%
-17%
-3%
BeginPending
NewFiling
Entry ofJudgment
EndPending
Examining the Work of State Courts: An Analysis of 2008 State Court CaseloadsTrial Courts: Traffic/Violations Caseloads — Reporting Excellence Award — Arizona
Examining the Work of State Courts: An Analysis of 2008 State Court CaseloadsTrial Courts: Traffic/Violations Caseloads — Reporting Excellence Award — Arizona 59
Examining the Work of State Courts: An Analysis of 2008 State Court CaseloadsTrial Courts: Traffic/Violations Caseloads56 Examining the Work of State Courts: An Analysis of 2008 State Court Caseloads
Trial Courts: Traffic/Violations Caseloads

Many states are able to achieve high clearance rates despite huge incoming caseloads
IncomingCasesState Traffic/Violations Clearance Rate
90% 95% 100% 105% 110%
Utah 524,488
Puerto Rico 10,687
Arizona 1,645,410
Michigan 2,375,543
Vermont 124,589
Alaska 74,951
Kentucky 384,180
Virginia 1,544,485
New Jersey 5,899,404
Iowa 716,597
Illinois 2,977,677
Hawaii 431,791
Indiana 1,057,144
Median
Note: States in Bold have a unified court system.
Clearance Rates for Traffic/Violations in 13 States, 2008
Non-criminal motor vehicle cases comprise the majority of Traffic/Violations caseloads
Traffic/Violations Caseload Composition in Four States, 2008
Illinois(1,645,410 Cases)
95%
5%
Arizona(431,791 Cases)
92%
7%2%
Michigan(2,977,677 Cases)
2%
75%
22%
Hawaii(2,356,869)
54%45%
1%
Parking violation cases are handled administratively outside of the court system
n Non-Criminal Motor Vehicle n Parking n ordinance Violation
Examining the Work of State Courts: An Analysis of 2008 State Court CaseloadsTrial Courts: Traffic/Violations Caseloads
Examining the Work of State Courts: An Analysis of 2008 State Court CaseloadsTrial Courts: Traffic/Violations Caseloads 57

Arizona’s Limited Jurisdiction Courts Recognized
Last year, the Court Statistics Project recognized Hawaii for having used the State Court Guide to Statistical Reporting as the template for reporting its traffic/Violations caseload. Hawaii expended considerable resources mapping their traffic and ordinance violations caseloads into all of the Guide case types and status categories, simultaneously becoming the first state to do so and the first state to be the recipient of the CSP Reporting excellence Award for traffic/Violations caseloads.
Had it not been for the outstanding achievements of Hawaii that year, the award most likely would have been presented to this year’s recipient, Arizona. Arizona has been reporting nearly all of the traffic/Violations case type and status category data from both of its limited jurisdiction venues—the Justice of the Peace and Municipal courts—since 2000, before the advent of the Guide and its recommendations. their achievement is all the more remarkable when the size of their caseload is considered. Arizona is the 14th most populous state, but the 1.6 million traffic/Violations cases they reported for 2008 ranked them 3rd in cases per 100,000 population among the 16 states that report total incoming traffic caseloads.
Arizona
Most Traffic/Violations cases in Arizona are processed in the Municipal Court
91.5%
Non-Criminal Traffic Violations/Infractions
(1,505,686 Cases)
6.8%
Parking Violations(111,810 Cases)
1.7%
Ordinance Violations(27,914 Cases)
25%Justice of the Peace
Municipal Court75%
99.6%
89%
Non-Criminal Traffic Violations/Infractions
0.4%9%
Parking Violations
0.01% 2%
Ordinance Violations
■ Justice of the Peace (408,998 Cases) ■ Municipal Court (1,236,412 Cases)
Traffic/Violations Caseload Composition in Arizona, by Court, 2008
Traffic/Violations Caseload Distribution in Arizona, by Court, 2008
Incoming Traffic/Violations Caseloads in Arizona, 2008
Examining the Work of State Courts: An Analysis of 2008 State Court CaseloadsTrial Courts: Traffic/Violations Caseloads — Reporting Excellence Award — Arizona58 Examining the Work of State Courts: An Analysis of 2008 State Court Caseloads
Trial Courts: Traffic/Violations Caseloads — Reporting Excellence Award — Arizona

Complete data allows for policy analysis and better management of court operations
When a court collects complete caseload data by case type, the possibility exists for numerous types of analyses, including clearance rate calculations and the determination of increases or decreases in pending caseloads.
Pending, Filing, and Entry of Judgment Caseloads, 2008
1500,000
0
30,000
60,000
90,000
1200,000
1,500,000
0
300,000
600,000
900,000
1,200,000
0
100,000
200,000
300,000
400,000
500,000 1,500,000
0
300,000
600,000
900,000
1,200,000
2,000
0
400
800
1,200
1,600
50
0
10
20
30
40
BeginPending
NewFiling
Entry ofJudgment
EndPending
0
6,000
12,000
18,000
24,000
30,000
0
100,000
200,000
300,000
400,000
500,000
Municipal Court Caseloads
Non-Criminal Traffic Violations
Total Traffic/Violations
Parking Violations
Ordinance Violations
Non-Criminal Traffic Violations
Justice of the Peace Court Caseloads
Total Traffic/Violations
Parking Violations
Ordinance Violations
+7%
+8%
+2%
+10%
-3%
+29%
-17%
-3%
BeginPending
NewFiling
Entry ofJudgment
EndPending
Examining the Work of State Courts: An Analysis of 2008 State Court CaseloadsTrial Courts: Traffic/Violations Caseloads — Reporting Excellence Award — Arizona
Examining the Work of State Courts: An Analysis of 2008 State Court CaseloadsTrial Courts: Traffic/Violations Caseloads — Reporting Excellence Award — Arizona 59

Examining the Work of State Courts: An Analysis of 2008 State Court CaseloadsAppendices

Summary
• IndexofStatesIncludedinSectionGraphics
• CourtStatisticsProjectMethodology
• StateCourtCaseloadStatistics
Appendices
Examining the Work of State Courts: An Analysis of 2008 State Court CaseloadsAppendices 61

Examining the Work of State Courts: An Analysis of 2008 State Court CaseloadsAppendices62 Examining the Work of State Courts: An Analysis of 2008 State Court Caseloads
Appendices
index of States included in Section Graphics al AK aZ ar CA co CT De DC FL GA hi iD IL in IA KS KY la Me MD MA Mi MN MS MO Mt ne nV nh NJ NM ny nc ND oh oK or Pa PR ri Sc SD tn tX ut Vt Va WA WV WI WY total
Appellate Courts
total incoming Cases in Appellate Courts, 2008 n n n n n n n n n n n n n n n n n n n n n n n n n n n n n n n n n n n n n n n n n n n n n n n n n n n n 52
States that Permit Appeals Directly from Limited Jurisdiction Courts in Addition to the General Jurisdiction Court(s) n n n n n n n n n n n n n n n n n n n 19
Appellate Court Structure n n n n n n n n n n n n n n n n n n n n n n n n n n n n n n n n n n n n n n n n n n n n n n n n n n n n 52
incoming Caseload Composition in 41 Appellate Courts, 2008 n n n n n n n n n n n n n n n n n n n n n n n n n n n n n 29
Appellate Caseload Distribution in 18 CoLRs and 23 iACs, 2008 n n n n n n n n n n n n n n n n n n n n n n n n n n n n n 29
Manner of Disposition in 13 Appellate Courts, 2008 n n n n n n n n n n n 11
Comparison of Decided Cases in 9 States, 2008 n n n n n n n n n 9
type of Court opinion in 23 Appellate Courts, 2008 n n n n n n n n n n n n n n n 15
Percent of Decided Cases with Full opinion in 26 Courts, 2008 n n n n n n n n n n n n n n n n n n n n 20
Percent of total Decided Cases, by Case outcome, in 33 Appellate Courts, 2008 n n n n n n n n n n n n n n n n n n n n n n 22
Appeal by Right Caseload in 15 Courts of Last Resort, 2008 n n n n n n n n n n n n n n n 15
Appeal by Right Caseload in 13 intermediate Appellate Courts, 2008 n n n n n n n n n n n n n 13
Appeal by Right Clearance Rates in 10 States, 2008 n n n n n n n n n n n n n n n n n n n n n n n n n n n n n n 30
Appeal by Right Reversals in 8 Appellate Courts, 2008 n n n n n n 6
Appeal by Permission incoming Caseload Composition in 9 Appellate Courts, 2008 n n n n n n n n 8
Appeal by Permission Clearance Rates in 6 States, 2008 n n n n n n n n n n n n n n n n n n n n n n n n n n 26
Death Penalty Caseload Composition in 9 Appellate Courts, 2008 n n n n n n n 7
Death Penalty Case outcomes in 5 Appellate Courts, 2008 n n n n 4
original Proceeding/other Appellate Matter Caseload Composition in 29 Appellate Courts, 2008 n n n n n n n n n n n n n n n n n n n n n 21
original Proceeding Clearance Rates in 12 CoLRs and 10 iACs, 2008 n n n n n n n n n n n n n n n 15
Caseload Data Reported by tennessee’s Appellate Courts, 2008 n 1
incoming Caseload Distribution in tennessee, 2008 n 1
Caseload Composition for Courts of Last Resort, 2008 n n n n n n n n n 9
Caseload Composition for intermediate Appellate Courts, 2008 n n n n n n n n n n n n n n n n n 17
Court of Criminal Appeals Death Penalty Caseload, 2008 n 1
Manner of Disposition by Case Category in tennessee’s Appellate Courts, 2008 n 1
Case outcome by Case Category in tennessee’s Appellate Courts, 2008 n 1
total Appearances in Appellate Section 13 14 3 7 4 14 2 6 4 21 5 14 11 8 8 4 4 9 6 3 4 11 14 16 5 9 2 7 3 3 3 8 12 2 11 5 5 11 4 15 12 7 3 25 13 6 5 12 4 10 13 14
index of States included in Section Graphics al AK aZ ar CA co CT De DC FL GA hi iD IL in IA KS KY la Me MD MA Mi MN MS MO Mt ne nV nh NJ NM ny nc ND oh oK or Pa PR ri Sc SD tn tX ut Vt Va WA WV WI WY total
Trial Courts
Overview
total incoming Cases in State Courts, All States, 1999-2008 n n n n n n n n n n n n n n n n n n n n n n n n n n n n n n n n n n n n n n n n n n n n n n n n n n n n 52
total incoming Cases in State Courts by Case Category, All States, 1999-2008 n n n n n n n n n n n n n n n n n n n n n n n n n n n n n n n n n n n n n n n n n n n n n n n n n n n n 52
total incoming Cases in State Courts, by Jurisdiction, 2008 (in millions) n n n n n n n n n n n n n n n n n n n n n n n n n n n n n n n n n n n n n n n n n n n n n n n n n n n n 52
Judicial officers in General and Limited Jurisdiction Courts, 1999-2008 n n n n n n n n n n n n n n n n n n n n n n n n n n n n n n n n n n n n n n n n n n n n n n n n n n n n 52
total incoming Cases per Judicial officer, by Jurisdiction, 1999-2008 n n n n n n n n n n n n n n n n n n n n n n n n n n n n n n n n n n n n n n n n n n n n n n n n n n n n 52
Full-time Judges in Unified and General Jurisdiction Courts, 2008 n n n n n n n n n n n n n n n n n n n n n n n n n n n n n n n n n n n n n n n n n n n n n n n n n n n n 52
States that Reported Reopened/Reactivated Caseloads in one or More Case Categories, 2008 n n n n n n n n n n n n n n n n n n n n n n n n n n n n 28
General Jurisdiction Courts Reporting Pending Caseloads, 2008 n n n n n n n n n n n n n n n n n n n n n n n n n n n 27
Caseload Composition in 8 States, 2008 n n n n n n n n 8
total Appearances in overview Section 7 6 8 8 7 6 7 6 8 8 7 9 7 9 7 8 8 6 6 6 6 8 9 6 7 7 6 6 7 6 8 8 8 7 7 8 7 7 8 9 6 8 6 7 8 7 8 8 7 7 8 6
Note: States in Bold have a unified court system.

Examining the Work of State Courts: An Analysis of 2008 State Court CaseloadsAppendices
Examining the Work of State Courts: An Analysis of 2008 State Court CaseloadsAppendices 63
index of States included in Section Graphics al AK aZ ar CA co CT De DC FL GA hi iD IL in IA KS KY la Me MD MA Mi MN MS MO Mt ne nV nh NJ NM ny nc ND oh oK or Pa PR ri Sc SD tn tX ut Vt Va WA WV WI WY total
Appellate Courts
total incoming Cases in Appellate Courts, 2008 n n n n n n n n n n n n n n n n n n n n n n n n n n n n n n n n n n n n n n n n n n n n n n n n n n n n 52
States that Permit Appeals Directly from Limited Jurisdiction Courts in Addition to the General Jurisdiction Court(s) n n n n n n n n n n n n n n n n n n n 19
Appellate Court Structure n n n n n n n n n n n n n n n n n n n n n n n n n n n n n n n n n n n n n n n n n n n n n n n n n n n n 52
incoming Caseload Composition in 41 Appellate Courts, 2008 n n n n n n n n n n n n n n n n n n n n n n n n n n n n n 29
Appellate Caseload Distribution in 18 CoLRs and 23 iACs, 2008 n n n n n n n n n n n n n n n n n n n n n n n n n n n n n 29
Manner of Disposition in 13 Appellate Courts, 2008 n n n n n n n n n n n 11
Comparison of Decided Cases in 9 States, 2008 n n n n n n n n n 9
type of Court opinion in 23 Appellate Courts, 2008 n n n n n n n n n n n n n n n 15
Percent of Decided Cases with Full opinion in 26 Courts, 2008 n n n n n n n n n n n n n n n n n n n n 20
Percent of total Decided Cases, by Case outcome, in 33 Appellate Courts, 2008 n n n n n n n n n n n n n n n n n n n n n n 22
Appeal by Right Caseload in 15 Courts of Last Resort, 2008 n n n n n n n n n n n n n n n 15
Appeal by Right Caseload in 13 intermediate Appellate Courts, 2008 n n n n n n n n n n n n n 13
Appeal by Right Clearance Rates in 10 States, 2008 n n n n n n n n n n n n n n n n n n n n n n n n n n n n n n 30
Appeal by Right Reversals in 8 Appellate Courts, 2008 n n n n n n 6
Appeal by Permission incoming Caseload Composition in 9 Appellate Courts, 2008 n n n n n n n n 8
Appeal by Permission Clearance Rates in 6 States, 2008 n n n n n n n n n n n n n n n n n n n n n n n n n n 26
Death Penalty Caseload Composition in 9 Appellate Courts, 2008 n n n n n n n 7
Death Penalty Case outcomes in 5 Appellate Courts, 2008 n n n n 4
original Proceeding/other Appellate Matter Caseload Composition in 29 Appellate Courts, 2008 n n n n n n n n n n n n n n n n n n n n n 21
original Proceeding Clearance Rates in 12 CoLRs and 10 iACs, 2008 n n n n n n n n n n n n n n n 15
Caseload Data Reported by tennessee’s Appellate Courts, 2008 n 1
incoming Caseload Distribution in tennessee, 2008 n 1
Caseload Composition for Courts of Last Resort, 2008 n n n n n n n n n 9
Caseload Composition for intermediate Appellate Courts, 2008 n n n n n n n n n n n n n n n n n 17
Court of Criminal Appeals Death Penalty Caseload, 2008 n 1
Manner of Disposition by Case Category in tennessee’s Appellate Courts, 2008 n 1
Case outcome by Case Category in tennessee’s Appellate Courts, 2008 n 1
total Appearances in Appellate Section 13 14 3 7 4 14 2 6 4 21 5 14 11 8 8 4 4 9 6 3 4 11 14 16 5 9 2 7 3 3 3 8 12 2 11 5 5 11 4 15 12 7 3 25 13 6 5 12 4 10 13 14
index of States included in Section Graphics al AK aZ ar CA co CT De DC FL GA hi iD IL in IA KS KY la Me MD MA Mi MN MS MO Mt ne nV nh NJ NM ny nc ND oh oK or Pa PR ri Sc SD tn tX ut Vt Va WA WV WI WY total
Trial Courts
Overview
total incoming Cases in State Courts, All States, 1999-2008 n n n n n n n n n n n n n n n n n n n n n n n n n n n n n n n n n n n n n n n n n n n n n n n n n n n n 52
total incoming Cases in State Courts by Case Category, All States, 1999-2008 n n n n n n n n n n n n n n n n n n n n n n n n n n n n n n n n n n n n n n n n n n n n n n n n n n n n 52
total incoming Cases in State Courts, by Jurisdiction, 2008 (in millions) n n n n n n n n n n n n n n n n n n n n n n n n n n n n n n n n n n n n n n n n n n n n n n n n n n n n 52
Judicial officers in General and Limited Jurisdiction Courts, 1999-2008 n n n n n n n n n n n n n n n n n n n n n n n n n n n n n n n n n n n n n n n n n n n n n n n n n n n n 52
total incoming Cases per Judicial officer, by Jurisdiction, 1999-2008 n n n n n n n n n n n n n n n n n n n n n n n n n n n n n n n n n n n n n n n n n n n n n n n n n n n n 52
Full-time Judges in Unified and General Jurisdiction Courts, 2008 n n n n n n n n n n n n n n n n n n n n n n n n n n n n n n n n n n n n n n n n n n n n n n n n n n n n 52
States that Reported Reopened/Reactivated Caseloads in one or More Case Categories, 2008 n n n n n n n n n n n n n n n n n n n n n n n n n n n n 28
General Jurisdiction Courts Reporting Pending Caseloads, 2008 n n n n n n n n n n n n n n n n n n n n n n n n n n n 27
Caseload Composition in 8 States, 2008 n n n n n n n n 8
total Appearances in overview Section 7 6 8 8 7 6 7 6 8 8 7 9 7 9 7 8 8 6 6 6 6 8 9 6 7 7 6 6 7 6 8 8 8 7 7 8 7 7 8 9 6 8 6 7 8 7 8 8 7 7 8 6
Note: States in Bold have a unified court system.

Examining the Work of State Courts: An Analysis of 2008 State Court CaseloadsAppendices64 Examining the Work of State Courts: An Analysis of 2008 State Court Caseloads
Appendices
index of States included in Section Graphics (continued) al AK aZ ar CA co CT De DC FL GA hi iD IL in IA KS KY la Me MD MA Mi MN MS MO Mt ne nV nh NJ NM ny nc ND oh oK or Pa PR ri Sc SD tn tX ut Vt Va WA WV WI WY total
Trial Courts
Civil Caseloads
incoming Civil Caseloads, 1999-2008 n n n n n n n n n n n n n n n n n n n n n n n n n n n n n n n n n n n n n n n n n n n n n n n n n n n n 52
incoming Civil Cases per 100,000 Population, 1999-2008 n n n n n n n n n n n n n n n n n n n n n n n n n n n n n n n n n n n n n n n n n n n n n n n n n n n n 52
total incoming Cases in State Courts, by Jurisdiction, 2008 (in millions) n n n n n n n n n n n n n n n n n n n n n n n n n n n n n n n n n n n n n n n n n n n n n n n n n n n n 52
total incoming Civil Caseloads and Rates in 29 States, 2008 n n n n n n n n n n n n n n n n n n n n n n n n n n n n n 29
total incoming Civil and Criminal Caseloads, 2004-2008 n n n n n n n n n n n n n n n n n n n n n n n n n n n n n n n n n n n n n n n n n n n n n n n n n n n n 52
incoming Civil Caseloads Composition in 7 States, 2007 vs. 2008 n n n n n n n 7
Contract and tort Caseloads in 13 General Jurisdiction Courts, 1999-2008 n n n n n n n n n n n n n 13
incoming tort and Contract Cases in 11 States, 2008 n n n n n n n n n n n 11
Seller Plaintiff/Debt Collection Caseloads in 7 States, 2008 n n n n n n n 7
incoming Automobile tort Caseloads in 17 Unified and General Jurisdiction Courts, 2008 n n n n n n n n n n n n n n n n n 17
Civil Caseload Clearance Rates in 28 Unified and General Jurisdiction Courts, 2008 n n n n n n n n n n n n n n n n n n n n n n n n n n n n 28
Contract Clearance Rates in 13 Unified and General Jurisdiction Courts, 2008 n n n n n n n n n n n n n 13
tort Clearance Rates in 22 Unified and General Jurisdiction Courts, 2008 n n n n n n n n n n n n n n n n n n n n n n 22
incoming Medical Malpractice Cases in 9 States, 2008 n n n n n n n n n 9
incoming Medical Malpractice Cases in General Jurisdiction Courts in 7 States, 1999-2008 n n n n n n n 7
incoming Mortgage Foreclosure Caseloads in 9 States, 2005-2008 n n n n n n n n n 9
incoming total Guardianship Caseloads in 18 States, 1999-2008 n n n n n n n n n n n n n n n n n n 18
incoming Guardianship Caseloads and Population Age 65 & over in 6 States, 2004-2008 n n n n n n 6
incoming total Guardianship Cases in 20 States, 2008 n n n n n n n n n n n n n n n n n n n n 20
incoming Guardianship Cases in 14 States, 2008 n n n n n n n n n n n n n n 14
Small Claims Caseloads in 27 States, 1999-2008 n n n n n n n n n n n n n n n n n n n n n n n n n n n 27
incoming Small Claims Cases in 33 States, 2008 n n n n n n n n n n n n n n n n n n n n n n n n n n n n n n n n n 33
Minnesota Civil Case type Reporting Before and After n 1
total Appearances in Civil Section 7 4 12 12 4 10 17 9 10 7 4 14 12 8 10 15 19 10 4 5 6 10 11 12 11 15 4 7 6 11 17 9 11 8 14 13 8 10 4 13 8 7 4 6 7 17 11 5 12 8 16 5
al AK aZ ar CA co CT De DC FL GA hi iD IL in IA KS KY la Me MD MA Mi MN MS MO Mt ne nV nh NJ NM ny nc ND oh oK or Pa PR ri Sc SD tn tX ut Vt Va WA WV WI WY total
Domestic Relations Caseloads
total incoming Cases in State Courts, by Jurisdiction, 2008 (in millions) n n n n n n n n n n n n n n n n n n n n n n n n n n n n n n n n n n n n n n n n n n n n n n n n n n n n 52
Domestic Relations Caseloads, 1999-2008 n n n n n n n n n n n n n n n n n n n n n n n n n n n n n n n n n n n n n n n n n n 42
Percent of total incoming Domestic Relations Caseloads by Case type in 23 States, 2008 n n n n n n n n n n n n n n n n n n n n n n n 23
incoming Divorce Caseloads in 24 States, 2008 n n n n n n n n n n n n n n n n n n n n n n n n 24
incoming Support Caseloads in 15 States, 2008 n n n n n n n n n n n n n n n 15
Civil Protection order Cases in 23 States, 2008 n n n n n n n n n n n n n n n n n n n n n n n 23
incoming Paternity Caseloads in 20 States, 2008 n n n n n n n n n n n n n n n n n n n n 20
incoming Adoption Caseloads in 27 States, 2008 n n n n n n n n n n n n n n n n n n n n n n n n n n n 27
incoming Visitation Caseloads in 6 States, 2008 n n n n n n 6
incoming Child Custody Caseloads in 6 States, 2008 n n n n n n 6
Proportion of New Filings to Reopened/Reactivated Caseloads in 8 States, 2008 n n n n n n n n 8
Domestic Caseload Composition in Wyoming, 2008 n 1
Domestic Caseload Composition in ohio, 2008 n 1
Domestic Relations Clearance Rate by Case type in 17 Unified and General Jurisdiction Courts, 2008 n n n n n n n n n n n n n n n n n 17
States that Reported Clearance Rates for one or More Domestic Relations Case types, 2008 n n n n n n n n n n n n n n n n n 17
Support Composition in three States, 2008 n n n 3
total Appearances in Domestic Relations Section 3 2 7 7 2 8 10 3 5 9 1 9 6 9 2 8 8 2 3 3 8 3 11 9 1 9 2 3 2 8 4 9 10 2 11 11 1 2 1 12 2 1 1 2 1 8 6 4 10 5 11 8
Note: States in Bold have a unified court system.

Examining the Work of State Courts: An Analysis of 2008 State Court CaseloadsAppendices
Examining the Work of State Courts: An Analysis of 2008 State Court CaseloadsAppendices 65
index of States included in Section Graphics (continued) al AK aZ ar CA co CT De DC FL GA hi iD IL in IA KS KY la Me MD MA Mi MN MS MO Mt ne nV nh NJ NM ny nc ND oh oK or Pa PR ri Sc SD tn tX ut Vt Va WA WV WI WY total
Trial Courts
Civil Caseloads
incoming Civil Caseloads, 1999-2008 n n n n n n n n n n n n n n n n n n n n n n n n n n n n n n n n n n n n n n n n n n n n n n n n n n n n 52
incoming Civil Cases per 100,000 Population, 1999-2008 n n n n n n n n n n n n n n n n n n n n n n n n n n n n n n n n n n n n n n n n n n n n n n n n n n n n 52
total incoming Cases in State Courts, by Jurisdiction, 2008 (in millions) n n n n n n n n n n n n n n n n n n n n n n n n n n n n n n n n n n n n n n n n n n n n n n n n n n n n 52
total incoming Civil Caseloads and Rates in 29 States, 2008 n n n n n n n n n n n n n n n n n n n n n n n n n n n n n 29
total incoming Civil and Criminal Caseloads, 2004-2008 n n n n n n n n n n n n n n n n n n n n n n n n n n n n n n n n n n n n n n n n n n n n n n n n n n n n 52
incoming Civil Caseloads Composition in 7 States, 2007 vs. 2008 n n n n n n n 7
Contract and tort Caseloads in 13 General Jurisdiction Courts, 1999-2008 n n n n n n n n n n n n n 13
incoming tort and Contract Cases in 11 States, 2008 n n n n n n n n n n n 11
Seller Plaintiff/Debt Collection Caseloads in 7 States, 2008 n n n n n n n 7
incoming Automobile tort Caseloads in 17 Unified and General Jurisdiction Courts, 2008 n n n n n n n n n n n n n n n n n 17
Civil Caseload Clearance Rates in 28 Unified and General Jurisdiction Courts, 2008 n n n n n n n n n n n n n n n n n n n n n n n n n n n n 28
Contract Clearance Rates in 13 Unified and General Jurisdiction Courts, 2008 n n n n n n n n n n n n n 13
tort Clearance Rates in 22 Unified and General Jurisdiction Courts, 2008 n n n n n n n n n n n n n n n n n n n n n n 22
incoming Medical Malpractice Cases in 9 States, 2008 n n n n n n n n n 9
incoming Medical Malpractice Cases in General Jurisdiction Courts in 7 States, 1999-2008 n n n n n n n 7
incoming Mortgage Foreclosure Caseloads in 9 States, 2005-2008 n n n n n n n n n 9
incoming total Guardianship Caseloads in 18 States, 1999-2008 n n n n n n n n n n n n n n n n n n 18
incoming Guardianship Caseloads and Population Age 65 & over in 6 States, 2004-2008 n n n n n n 6
incoming total Guardianship Cases in 20 States, 2008 n n n n n n n n n n n n n n n n n n n n 20
incoming Guardianship Cases in 14 States, 2008 n n n n n n n n n n n n n n 14
Small Claims Caseloads in 27 States, 1999-2008 n n n n n n n n n n n n n n n n n n n n n n n n n n n 27
incoming Small Claims Cases in 33 States, 2008 n n n n n n n n n n n n n n n n n n n n n n n n n n n n n n n n n 33
Minnesota Civil Case type Reporting Before and After n 1
total Appearances in Civil Section 7 4 12 12 4 10 17 9 10 7 4 14 12 8 10 15 19 10 4 5 6 10 11 12 11 15 4 7 6 11 17 9 11 8 14 13 8 10 4 13 8 7 4 6 7 17 11 5 12 8 16 5
al AK aZ ar CA co CT De DC FL GA hi iD IL in IA KS KY la Me MD MA Mi MN MS MO Mt ne nV nh NJ NM ny nc ND oh oK or Pa PR ri Sc SD tn tX ut Vt Va WA WV WI WY total
Domestic Relations Caseloads
total incoming Cases in State Courts, by Jurisdiction, 2008 (in millions) n n n n n n n n n n n n n n n n n n n n n n n n n n n n n n n n n n n n n n n n n n n n n n n n n n n n 52
Domestic Relations Caseloads, 1999-2008 n n n n n n n n n n n n n n n n n n n n n n n n n n n n n n n n n n n n n n n n n n 42
Percent of total incoming Domestic Relations Caseloads by Case type in 23 States, 2008 n n n n n n n n n n n n n n n n n n n n n n n 23
incoming Divorce Caseloads in 24 States, 2008 n n n n n n n n n n n n n n n n n n n n n n n n 24
incoming Support Caseloads in 15 States, 2008 n n n n n n n n n n n n n n n 15
Civil Protection order Cases in 23 States, 2008 n n n n n n n n n n n n n n n n n n n n n n n 23
incoming Paternity Caseloads in 20 States, 2008 n n n n n n n n n n n n n n n n n n n n 20
incoming Adoption Caseloads in 27 States, 2008 n n n n n n n n n n n n n n n n n n n n n n n n n n n 27
incoming Visitation Caseloads in 6 States, 2008 n n n n n n 6
incoming Child Custody Caseloads in 6 States, 2008 n n n n n n 6
Proportion of New Filings to Reopened/Reactivated Caseloads in 8 States, 2008 n n n n n n n n 8
Domestic Caseload Composition in Wyoming, 2008 n 1
Domestic Caseload Composition in ohio, 2008 n 1
Domestic Relations Clearance Rate by Case type in 17 Unified and General Jurisdiction Courts, 2008 n n n n n n n n n n n n n n n n n 17
States that Reported Clearance Rates for one or More Domestic Relations Case types, 2008 n n n n n n n n n n n n n n n n n 17
Support Composition in three States, 2008 n n n 3
total Appearances in Domestic Relations Section 3 2 7 7 2 8 10 3 5 9 1 9 6 9 2 8 8 2 3 3 8 3 11 9 1 9 2 3 2 8 4 9 10 2 11 11 1 2 1 12 2 1 1 2 1 8 6 4 10 5 11 8
Note: States in Bold have a unified court system.

Examining the Work of State Courts: An Analysis of 2008 State Court CaseloadsAppendices66 Examining the Work of State Courts: An Analysis of 2008 State Court Caseloads
Appendices
index of States included in Section Graphics (continued) al AK aZ ar CA co CT De DC FL GA hi iD IL in IA KS KY la Me MD MA Mi MN MS MO Mt ne nV nh NJ NM ny nc ND oh oK or Pa PR ri Sc SD tn tX ut Vt Va WA WV WI WY total
Trial Courts
Criminal Caseloads
total incoming Cases in State Courts, by Jurisdiction, 2008 (in millions) n n n n n n n n n n n n n n n n n n n n n n n n n n n n n n n n n n n n n n n n n n n n n n n n n n n n 52
incoming Criminal Caseloads in State Courts, 1999-2008 n n n n n n n n n n n n n n n n n n n n n n n n n n n n n n n n n n n n n n n n n n n n n n n n n n n n 52
incoming Criminal Cases per 100,000 Population, 1999-2008 n n n n n n n n n n n n n n n n n n n n n n n n n n n n n n n n n n n n n n n n n n n n n n n n n n n n 52
total incoming Criminal Caseloads and Rates in 19 States, 2008 n n n n n n n n n n n n n n n n n n n 19
Criminal Caseload Composition in 11 States, 2008 n n n n n n n n n n n 11
Felony Caseload Composition in 5 States, 2008 n n n n n 5
incoming Felony Caseloads and Rates in 34 Unified and General Jurisdiction Courts, 2008 n n n n n n n n n n n n n n n n n n n n n n n n n n n n n n n n n n 34
Felony Clearance Rates in Unified and General Jurisdiction Courts in 27 States, 2008 n n n n n n n n n n n n n n n n n n n n n n n n n n n 27
incoming Misdemeanor Caseloads and Rates in 20 Unified and Limited Jurisdiction Courts, 2008 n n n n n n n n n n n n n n n n n n n n 20
Misdemeanor Clearance Rates in 15 Unified and Limited Jurisdiction Courts, 2008 n n n n n n n n n n n n n n n 15
total Appearances in Criminal Section 3 5 9 6 3 5 3 3 3 8 3 10 8 4 8 7 6 6 7 3 3 5 8 5 3 9 3 3 4 9 7 5 3 5 5 5 6 5 3 9 8 5 3 5 5 10 7 6 9 5 5 4
al AK aZ ar CA co CT De DC FL GA hi iD IL in IA KS KY la Me MD MA Mi MN MS MO Mt ne nV nh NJ NM ny nc ND oh oK or Pa PR ri Sc SD tn tX ut Vt Va WA WV WI WY total
Juvenile Caseloads
total incoming Cases in State Courts, by Jurisdiction, 2008 (in millions) n n n n n n n n n n n n n n n n n n n n n n n n n n n n n n n n n n n n n n n n n n n n n n n n n n n n 52
incoming Juvenile Cases in 36 States, 2008 n n n n n n n n n n n n n n n n n n n n n n n n n n n n n n n n n n n n 36
incoming Juvenile Caseload Composition in 23 States, by Jurisdiction, 2008 n n n n n n n n n n n n n n n n n n n n n n n 23
Juvenile Caseload Composition in 20 States, 2008 n n n n n n n n n n n n n n n n n n n n 20
Juvenile Delinquency Caseload Composition in three States, 2008 n n n 3
Delinquency Clearance Rates in 21 States, 2008 n n n n n n n n n n n n n n n n n n n n n 21
Dependency Clearance Rates in 22 States, 2008 n n n n n n n n n n n n n n n n n n n n n n 22
Status offense Clearance Rates in 17 States, 2008 n n n n n n n n n n n n n n n n n 17
total Appearances in Juvenile Section 7 2 2 7 1 5 6 2 3 2 1 3 4 3 3 4 8 4 2 1 7 1 3 4 1 6 3 2 1 1 7 6 7 6 4 7 4 1 1 3 3 1 3 1 2 8 7 7 7 3 3 4
al AK aZ ar CA co CT De DC FL GA hi iD IL in IA KS KY la Me MD MA Mi MN MS MO Mt ne nV nh NJ NM ny nc ND oh oK or Pa PR ri Sc SD tn tX ut Vt Va WA WV WI WY total
Traffic/Violations Caseloads
total incoming Cases in State Courts, by Jurisdiction, 2008 (in millions) n n n n n n n n n n n n n n n n n n n n n n n n n n n n n n n n n n n n n n n n n n n n n n n n n n n n 52
incoming traffic/Violations Caseloads in 16 States, 2008 n n n n n n n n n n n n n n n n 16
Clearance Rates for traffic/Violations in 13 States, 2008 n n n n n n n n n n n n n 13
traffic/Violations Caseload Composition in Four States, 2008 n n n n 4
incoming traffic/Violations Caseloads in Arizona, 2008 n 1
traffic/Violations caseload Distribution in Arizona, by Court, 2008 n 1
traffic/Violation Caseload Composition in Arizona, by Court, 2008 n 1
Pending, Filing, and Disposition Caseloads, 2008 n 1
total Appearances in traffic Section 1 3 8 2 1 1 1 1 1 2 1 4 1 4 3 3 1 3 1 1 1 1 4 1 1 1 1 1 1 2 3 1 1 1 1 1 1 1 1 3 1 1 1 1 1 3 3 3 1 1 1 1
al AK aZ ar CA co CT De DC FL GA hi iD IL in IA KS KY la Me MD MA Mi MN MS MO Mt ne nV nh NJ NM ny nc ND oh oK or Pa PR ri Sc SD tn tX ut Vt Va WA WV WI WY
Grand Total Appearances
total number of times state appears throughout all sections 41 36 49 49 22 49 46 30 34 57 22 63 49 45 41 49 54 40 29 22 35 39 60 53 29 56 21 29 24 40 49 46 52 31 53 50 32 37 22 64 40 30 21 47 37 59 47 45 50 39 57 42
Note: States in Bold have a unified court system.

Examining the Work of State Courts: An Analysis of 2008 State Court CaseloadsAppendices
Examining the Work of State Courts: An Analysis of 2008 State Court CaseloadsAppendices 67
index of States included in Section Graphics (continued) al AK aZ ar CA co CT De DC FL GA hi iD IL in IA KS KY la Me MD MA Mi MN MS MO Mt ne nV nh NJ NM ny nc ND oh oK or Pa PR ri Sc SD tn tX ut Vt Va WA WV WI WY total
Trial Courts
Criminal Caseloads
total incoming Cases in State Courts, by Jurisdiction, 2008 (in millions) n n n n n n n n n n n n n n n n n n n n n n n n n n n n n n n n n n n n n n n n n n n n n n n n n n n n 52
incoming Criminal Caseloads in State Courts, 1999-2008 n n n n n n n n n n n n n n n n n n n n n n n n n n n n n n n n n n n n n n n n n n n n n n n n n n n n 52
incoming Criminal Cases per 100,000 Population, 1999-2008 n n n n n n n n n n n n n n n n n n n n n n n n n n n n n n n n n n n n n n n n n n n n n n n n n n n n 52
total incoming Criminal Caseloads and Rates in 19 States, 2008 n n n n n n n n n n n n n n n n n n n 19
Criminal Caseload Composition in 11 States, 2008 n n n n n n n n n n n 11
Felony Caseload Composition in 5 States, 2008 n n n n n 5
incoming Felony Caseloads and Rates in 34 Unified and General Jurisdiction Courts, 2008 n n n n n n n n n n n n n n n n n n n n n n n n n n n n n n n n n n 34
Felony Clearance Rates in Unified and General Jurisdiction Courts in 27 States, 2008 n n n n n n n n n n n n n n n n n n n n n n n n n n n 27
incoming Misdemeanor Caseloads and Rates in 20 Unified and Limited Jurisdiction Courts, 2008 n n n n n n n n n n n n n n n n n n n n 20
Misdemeanor Clearance Rates in 15 Unified and Limited Jurisdiction Courts, 2008 n n n n n n n n n n n n n n n 15
total Appearances in Criminal Section 3 5 9 6 3 5 3 3 3 8 3 10 8 4 8 7 6 6 7 3 3 5 8 5 3 9 3 3 4 9 7 5 3 5 5 5 6 5 3 9 8 5 3 5 5 10 7 6 9 5 5 4
al AK aZ ar CA co CT De DC FL GA hi iD IL in IA KS KY la Me MD MA Mi MN MS MO Mt ne nV nh NJ NM ny nc ND oh oK or Pa PR ri Sc SD tn tX ut Vt Va WA WV WI WY total
Juvenile Caseloads
total incoming Cases in State Courts, by Jurisdiction, 2008 (in millions) n n n n n n n n n n n n n n n n n n n n n n n n n n n n n n n n n n n n n n n n n n n n n n n n n n n n 52
incoming Juvenile Cases in 36 States, 2008 n n n n n n n n n n n n n n n n n n n n n n n n n n n n n n n n n n n n 36
incoming Juvenile Caseload Composition in 23 States, by Jurisdiction, 2008 n n n n n n n n n n n n n n n n n n n n n n n 23
Juvenile Caseload Composition in 20 States, 2008 n n n n n n n n n n n n n n n n n n n n 20
Juvenile Delinquency Caseload Composition in three States, 2008 n n n 3
Delinquency Clearance Rates in 21 States, 2008 n n n n n n n n n n n n n n n n n n n n n 21
Dependency Clearance Rates in 22 States, 2008 n n n n n n n n n n n n n n n n n n n n n n 22
Status offense Clearance Rates in 17 States, 2008 n n n n n n n n n n n n n n n n n 17
total Appearances in Juvenile Section 7 2 2 7 1 5 6 2 3 2 1 3 4 3 3 4 8 4 2 1 7 1 3 4 1 6 3 2 1 1 7 6 7 6 4 7 4 1 1 3 3 1 3 1 2 8 7 7 7 3 3 4
al AK aZ ar CA co CT De DC FL GA hi iD IL in IA KS KY la Me MD MA Mi MN MS MO Mt ne nV nh NJ NM ny nc ND oh oK or Pa PR ri Sc SD tn tX ut Vt Va WA WV WI WY total
Traffic/Violations Caseloads
total incoming Cases in State Courts, by Jurisdiction, 2008 (in millions) n n n n n n n n n n n n n n n n n n n n n n n n n n n n n n n n n n n n n n n n n n n n n n n n n n n n 52
incoming traffic/Violations Caseloads in 16 States, 2008 n n n n n n n n n n n n n n n n 16
Clearance Rates for traffic/Violations in 13 States, 2008 n n n n n n n n n n n n n 13
traffic/Violations Caseload Composition in Four States, 2008 n n n n 4
incoming traffic/Violations Caseloads in Arizona, 2008 n 1
traffic/Violations caseload Distribution in Arizona, by Court, 2008 n 1
traffic/Violation Caseload Composition in Arizona, by Court, 2008 n 1
Pending, Filing, and Disposition Caseloads, 2008 n 1
total Appearances in traffic Section 1 3 8 2 1 1 1 1 1 2 1 4 1 4 3 3 1 3 1 1 1 1 4 1 1 1 1 1 1 2 3 1 1 1 1 1 1 1 1 3 1 1 1 1 1 3 3 3 1 1 1 1
al AK aZ ar CA co CT De DC FL GA hi iD IL in IA KS KY la Me MD MA Mi MN MS MO Mt ne nV nh NJ NM ny nc ND oh oK or Pa PR ri Sc SD tn tX ut Vt Va WA WV WI WY
Grand Total Appearances
total number of times state appears throughout all sections 41 36 49 49 22 49 46 30 34 57 22 63 49 45 41 49 54 40 29 22 35 39 60 53 29 56 21 29 24 40 49 46 52 31 53 50 32 37 22 64 40 30 21 47 37 59 47 45 50 39 57 42
Note: States in Bold have a unified court system.

Court Statistics Project Methodology
Information for the CSP’s national caseload databases comes from published and unpublished sources supplied by state court administrators and appellate court clerks. Published data are typically taken from official state court annual reports and Web sites. Data from published sources are often supplemented by unpublished data received from the state courts in many formats, including internal management reports and computer-generated output. States report and verify data electronically through spreadsheet templates provided by the Court Statistics Project.
The CSP data collection effort to build a comprehensive statistical profile of the work of state appellate and trial courts nationally is underway throughout the year. Extensive telephone contacts and follow-up correspondence are used to collect missing data, confirm the accuracy of available data, and verify the legal jurisdiction of each court. Information is also collected on the number of judges per court or court system (from annual reports, offices of state court administrators, and appellate court clerks); the state population (based on U.S. Bureau of the Census revised estimates); and special characteristics regarding subject matter jurisdiction and court structure.
Examining the Work of State Courts is intended to enhance the potential for meaningful state court caseload comparisons. Because this volume examines 50 states, the District of Columbia, and the Commonwealth of Puerto Rico (and thus 52 different court systems) the biggest challenge is to organize the data for valid state-to-state comparison among states and over time.
The Court Statistics Project can provide advice and clarification on the use of the statistics from this and previous reports. Project staff can also provide the full range of information available from each state. Most states provide far more detailed caseload information than can be presented in project publications. Information from the CSP is also available on the NCSC Web site at: www.courtstatistics.org.
Comments, corrections, suggestions, and requests for information from readers of Examining the Work of State Courts, State Court Caseload Statistics, and the Caseload Highlights series are invited; please submit on the form on the CSP Web page at: www.courtstatistics.org.
Court Statistics Project
ABOUT US CONTACT US SUPPORT US SEARCH OUR SITE
Helping Courts Anticipate Change and Better Serve the Public
Search
Create Chart
CSP Main
Examining the Work of State Courts
State Court Caseload Statistics
Interactive Statistics Query
State Court Guide to Statistical ReportingStatus Reports
State Court Guide to Statistical Reporting
Caseload Highlights/Notes from the Field
Project Staff
Tech Assistance
Detailed information and descriptions of state court systems and caseloads.
Past State Court Caseload Statistics
Revised version 1.3 released May 2009 contains the new appellate court caseload reporting section along with expanded CSP definitions and recommended case counting rules.
Query the State Court General Jurisdiction Statistics database by state or geographic area using five easy steps:
Select StateHold down the CTRL key to choose multiple selections.
Select Type of FilingsTotal
Civil
Felony
Domestic Relations
Criminal
Traffic
Juvenile
Select PopulationTotal
Civil
State Neighbors
Adult
Juvenile
Caseload Highlights: The New Appellate Section of the State Court Guide to Statistical Reporting
Association Resolutions in support of the Guide
Implement the Civil section of the Guide by using a civil case cover sheet to enforce classification of cases in to appropriate case types. See examples from states, including Kansas which has fully implemented the Guide in its coversheet, here.
For a downloadable prototype that you can customize, click here.
Latest Caseload Hightlights:Creating and Sustaining Data Quality. View
Medical Malpractice on Appeal is now available. View
Caseload Highlights targets specific and significant issues and disseminates the findings in short reports. View
Notes from the Field details initiatives to improve the quality, use, and understanding of state court data. View
State Court Structure Charts
Detailed diagrams of each states' court system (US territories included)
Want ALL the data?
Complete trial and appellate court CSP data can be obtained from the Inter-University Consortium for Political and Social Research - ICPSR
Other Resources
State Court Organization 2004 edition is now available online.The Bureau of Justice Statistics' Special Report State Court Organization, 1987-2004 is now available online.
The Bureau of Justice Statistics' Civil Justice Statistics are available online, providing information on civil case filings, dispositions, and appeals including the Civil Justice Surveys. Their latest publication Civil Bench and Jury Trials in State Courts, 2005 examines tort, contract, and real property cases that resulted in a trial in 2005 and is available here.
The status reports for each state align court structure with jurisdiction over specific case types, and indicate data currently reported by court and case type, as defined by the Guide. See the Guide links above on this page for additional detail defining these caseload statistics.
Alabama
California
Colorado
Connecticut
Florida
Hawaii
Kansas
Louisiana
Maryland
Michigan
Montana
Nevada
New Hampshire
North Dakota
Ohio
Texas
Utah
Washington
Wisconsin
2007 FULL REPORT
Introduction State Court Structure Charts
Jurisdiction & State Court Reporting Practices
State Court Caseload Tables:
Trial Court
Appellate Court
Appendices
Comprehensive analysis of the business of state trial and appellate courts
NEW!LATEST REPORT(2007 DATA)
Introduction
What Follows
Civil
Domestic Relations
Criminal
Juvenile
Traffic/Violations
Appellate
Appendices
Past Reports
Step 1
Step 2
Step 3
Step 4
AlabamaAlaskaArizonaArkansasCalifornia
By State
The Court Statistics Project (CSP) collects and analyzes data relating o the work of our nation’s state courts
AccessCharts
Examining the Work of State Courts: An Analysis of 2008 State Court CaseloadsAppendices68 Examining the Work of State Courts: An Analysis of 2008 State Court Caseloads
Appendices

State Court Caseload Statistics
Examining the Work of State Courts: An Analysis of 2008 State Court CaseloadsAppendices
Examining the Work of State Courts: An Analysis of 2008 State Court CaseloadsAppendices 69
The analysis presented in Examining the Work of State Courts is derived in part from the data found in State Court Caseload Statistics. State Court Caseload Statistics is published exclusively online at the Court Statistics Project’s Web site: www.courtstatistics.org. This Web-based format allows users to take advantage of improved functionality and make possible electronic access to the data.
The information and tables found in State Court Caseload Statistics are intended to serve as a detailed reference on the work of the nation’s state courts and are organized in the following manner:
State Court Structure Charts display the overall structure of each state court system on a one-page chart. Each state’s chart identifies all the courts in operation in that state during 2008, describes their geographic and subject matter jurisdiction, notes the number of authorized judicial positions, indicates whether funding is primarily local or state, outlines the routes of appeal between courts, and provides links to each court with its own Web site. Readers can access the state court structure charts through the map located on the CSP’s Web site.
Jurisdiction and State Court Reporting Practices review basic information that affects the comparability of caseload information reports by the courts. Information is also provided that defines what constitutes a case in each court, making it possible to determine which appellate and trial courts compile caseload statistics on a similar basis. Finally, the numbers of judges and justices working in state trial and appellate courts are displayed.
State Court Caseload Tables contain detailed information from the nation’s state courts. Seven tables detail information on appellate courts, and an additional nine tables contain data on trial courts. Other tables describe trends in the volume of incoming and outgoing cases for the period 1999-2008. The tables also indicate the extent of standardization in the data for each state and the comparability of caseload information across the states.

National Center for State Courts
WILLIAMSBURG, VA300 Newport AvenueWilliamsburg, VA 23185-4747
DENVER, CO707 Seventeenth Street, Suite 2900Denver, Co 80202-3429
ARLINGTON, VA 2425 Wilson Boulevard, Suite 350Arlington, VA 22201
Association Services 800.616.6165
Consulting 800.466.3063
Education 800.616.6206
Government Relations 800.532.0204
Information 800.616.6164
International Programs 800.797.2545
Publications888.228.6272
Research 800.616.6109
Technology888.846.6746
The National Center for State Courts is an independent, nonprofit, tax-exempt organization in accordance with Section 501(c)(3) of the Internal Revenue code. To find out about supporting the work and mission of the National Center, contact the National Center’s Development Office by phone at 800.616.6110 or by email at: [email protected]


reSearch DiViSion 800.616.6109
www.courtstatistics.org
Court Statistics ProjectSince 1975, the Court Statistics Project has provided a comprehensive analysis of the work of state courts by gathering caseload data and creating meaningful comparisons for identifying trends, comparing caseloads, and highlighting policy issues.
© Copyright 2010National Center for State CourtsISBN 978-0-89656-278-6
A joint project of the Conference of State Court Administrators, the Bureau of Justice Statistics, and the National Center for State Courts.