cover toc eia drilling statoil - · pdf fileeia drilling prepared for: wisma pondok indah ii,...
TRANSCRIPT

Delivering sustainable solutions in a more competitive world
Final Report EIA Drilling
Prepared for:
Wisma Pondok Indah II, Suite 602 Jl. Sultan Iskandar Muda, Kav. V-TA Jakarta 12310, Indonesia
October 2010

ENVIRONMENTAL RESOURCES MANAGEMENT STATOIL EIA DRILLING
i
TABLE OF CONTENTS
TABLE OF CONTENTS ..........................................................................................i LIST OF TABLES.....................................................................................................v LIST OF FIGURES ..............................................................................................viii LIST OF APPENDICES .........................................................................................ix
1 INTRODUCTION......................................................................................1-1 1.1 GENERAL INTRODUCTION TO THE PROJECT ...............................................1-1 1.2 GENERAL INFORMATION ABOUT STATOIL ..................................................1-3 1.3 POLICY, LEGISLATIVE AND ADMINISTRATIVE FRAMEWORK......................1-3 1.4 IMPACT ASSESSMENT APPROACH METHODOLOGY....................................1-6
1.4.1 Scoping ........................................................................................1-10 1.4.2 Describing the Baseline .............................................................1-10 1.4.3 Impact Prediction.......................................................................1-10 1.4.4 Evaluating the Significance of a Predicted Impact................1-11 1.4.5 Mitigation & Benefit Enhancement .........................................1-12 1.4.6 Residual Impacts ........................................................................1-13 1.4.7 Management & Monitoring......................................................1-13
2 PROJECT DESCRIPTION........................................................................2-1 2.1 INTRODUCTION .............................................................................................2-1
2.2 PROJECT OVERVIEW AND LOCATION ..........................................................2-2 2.3 PRINCIPLE PROJECT ACTIVITIES ...................................................................2-2
2.3.1 Positioning of the Drill Ship .......................................................2-2 2.3.2 Drilling Activities.........................................................................2-2 2.3.3 Drilling Mud & Cement Usage ..................................................2-6 2.3.4 Cuttings & Mud Disposal ...........................................................2-7 2.3.5 Well Testing and Clean Up.........................................................2-7 2.3.6 Well Abandonment......................................................................2-7 2.3.7 Supply, Support Logistics...........................................................2-8
2.4 DRILL SHIP SPECIFICATIONS.........................................................................2-8 2.4.1 Storage facilities ...........................................................................2-9 2.4.2 Electrical Power Generation .......................................................2-9 2.4.3 Cooling Water and Drilling Water Supply...............................2-9 2.4.4 Sewage Treatment........................................................................2-9 2.4.5 Drainage System ........................................................................2-10
2.5 DRILLING SCHEDULE ..................................................................................2-10 2.6 EMISSIONS, DISCHARGES, WASTE & NOISE EMISSIONS............................2-10
2.6.1 Air Emissions..............................................................................2-10

ENVIRONMENTAL RESOURCES MANAGEMENT STATOIL EIA DRILLING
ii
2.6.2 Discharges to Sea .......................................................................2-11 2.6.3 Hazardous and Non-hazardous Waste Generation..............2-13 2.6.4 Noise ............................................................................................2-13
3 CHARACTERIZATION OF THE INFLUENCED AREA ...................3-1 3.1 PETROSEA OFFSHORE SUPPLY BASE (POSB) ...............................................3-1
3.1.1 Climate ..........................................................................................3-1 3.1.2 Socio Economy and Cultural......................................................3-3
3.2 PROJECT LOCATION FOR DRILLING ACTIVITY-KARAMA BLOCK...............3-5 3.2.1 Defining the Project Zone of Influence .....................................3-5 3.2.2 Meteorology..................................................................................3-7 3.2.3 Tectonics and Geology ................................................................3-7 3.2.4 Oceanography ..............................................................................3-7 3.2.5 Water and Sediment Quality....................................................3-16 3.2.6 Marine Flora and Fauna............................................................3-21 3.2.7 Fish...............................................................................................3-22 3.2.8 Marine Mammals .......................................................................3-22 3.2.9 Turtles..........................................................................................3-24 3.2.10 Sea Birds in Open seas and Coastal areas...............................3-26 3.2.11 Coastal habitats ..........................................................................3-28 3.2.12 Mangrove Forest ........................................................................3-28 3.2.13 Coastal Forest .............................................................................3-29 3.2.14 Social Characterization..............................................................3-33 3.2.15 Custom and Religion.................................................................3-37 3.2.16 Education and Literacy .............................................................3-38 3.2.17 Public and Private Infrastructure ............................................3-40 3.2.18 Socio-Economics and Livelihood.............................................3-44 3.2.19 Health ..........................................................................................3-57 3.2.20 Stakeholder Identification and Engagement..........................3-60 3.2.21 Statoil CSR Program ..................................................................3-64 3.2.22 Identification and Characterization of Indigenous
Groups .........................................................................................3-67
4 IMPACT EVALUATION AND CONTROL .........................................4-1 4.1 SCOPING.........................................................................................................4-1 4.2 AIR QUALITY .................................................................................................4-4
4.2.1 Sources of Impact .........................................................................4-4 4.2.2 Assessment Approach.................................................................4-4 4.2.3 Evaluation of Impacts..................................................................4-5 4.2.4 Mitigation Measures & Residual Impacts ................................4-6
4.3 NOISE LEVELS................................................................................................4-6 4.3.1 Sources of Impact .........................................................................4-6

ENVIRONMENTAL RESOURCES MANAGEMENT STATOIL EIA DRILLING
iii
4.3.2 Assessment Approach.................................................................4-6 4.3.3 Evaluation of Impacts..................................................................4-7 4.3.4 Mitigation Measures & Residual Impacts ................................4-9
4.4 WASTE GENERATION AND DISPOSAL..........................................................4-9 4.4.1 Sources of Impact .........................................................................4-9 4.4.2 Assessment Approach.................................................................4-9 4.4.3 Evaluation of Impacts................................................................4-11 4.4.4 Mitigation Measures & Residual Impacts ..............................4-12
4.5 WATER QUALITY.........................................................................................4-12 4.5.1 Sources of Impact .......................................................................4-12 4.5.2 Assessment Approach...............................................................4-13 4.5.3 Evaluation of Impacts................................................................4-13 4.5.4 Mitigation Measures & Residual Impacts ..............................4-14
4.6 SEABED & BENTHIC COMMUNITIES ...........................................................4-15 4.6.1 Sources of Impact .......................................................................4-15 4.6.2 Assessment Approach...............................................................4-15 4.6.3 Evaluation of Impacts................................................................4-16 4.6.4 Mitigation Measures & Residual Impacts ..............................4-16
4.7 FISHERIES .....................................................................................................4-17 4.7.1 Sources of Impact .......................................................................4-17 4.7.2 Assessment Approach...............................................................4-17 4.7.3 Evaluation of Impacts................................................................4-17 4.7.4 Mitigation Measures & Residual Impacts ..............................4-18
4.8 UNPLANNED EVENTS .................................................................................4-19 4.8.1 Sources of Impact .......................................................................4-19 4.8.2 Assessment Approach...............................................................4-19 4.8.3 Evaluation of Impacts................................................................4-20 4.8.4 Mitigation Measures & Residual Impacts ..............................4-22
4.9 SOCIO-ECONOMIC BENEFITS ......................................................................4-23 4.9.1 Sources of Impacts .....................................................................4-23 4.9.2 Assessment Approach...............................................................4-23 4.9.3 Evaluation of Impacts................................................................4-23 4.9.4 Mitigation Measures & Residual Impact ................................4-24
5 ENVIRONMENTAL MANAGEMENT PLAN.....................................5-1 5.1 INTRODUCTION .............................................................................................5-1 5.2 STATOIL’S HSE PRINCIPLES..........................................................................5-1 5.3 ENVIRONMENTAL MANAGEMENT PLAN ....................................................5-2 5.4 ROLES AND RESPONSIBILITIES ......................................................................5-7
5.4.1 Role of Statoil Project Team........................................................5-7

ENVIRONMENTAL RESOURCES MANAGEMENT STATOIL EIA DRILLING
iv
5.4.2 Role of Drilling Contractor .........................................................5-8 5.5 COMPETENCIES AND TRAINING...................................................................5-8 5.6 INSPECTION, AUDIT AND CORRECTIVE ACTIONS .......................................5-9
5.6.1 Daily Inspections..........................................................................5-9 5.6.2 Fortnightly Audits .......................................................................5-9 5.6.3 Ad-hoc Audits ............................................................................5-10 5.6.4 Audit Reporting .........................................................................5-10
5.7 REPORTING AND STAKEHOLDER COMMUNICATION................................5-10 5.8 ENVIRONMENTAL MONITORING ...............................................................5-10
5.8.1 Seabed Sediments/ Benthic Community ...............................5-11 5.8.2 Drilling Waste.............................................................................5-11 5.8.3 Waste Management ...................................................................5-12 5.8.4 Accidental Events/ Upset Conditions ....................................5-12
5.9 OIL SPILL CONTINGENCY/ RESPONSE PLAN ............................................5-12 5.10 REVIEW AND REVISION...............................................................................5-13 6 CONCLUSIONS ..............................................................................................6-1 6.1 INTRODUCTION .............................................................................................6-1 6.2 ENVIRONMENTAL CONCERNS ......................................................................6-1 6.3 OUTCOME OF THE IMPACT ASSESSMENT......................................................6-1 6.4 SUMMARY CONCLUSION...............................................................................6-2
ENVIRONMENTAL RESOURCES MANAGEMENT STATOIL EIA DRILLING
v
LIST OF TABLES
Table 1-1 List of Regulation and Governing Documents concerning Offshore Operations of Statoil......................................................... 1-3
Table 1-2 Definitions Used in this IA .............................................................. 1-9
Table 2-1 Typical Mud Types and Quantities for each Hole Section.......... 2-6
Table 2-2 Likely Mud Types to be Used for the Karama Drilling Program .............................................................................................. 2-6
Table 2-3 Vessel & Manning Requirements during Drilling........................ 2-8
Table 2-4 Bulk Storage Facilities....................................................................... 2-9
Table 2-5 Proposed Drilling Schedule........................................................... 2-10
Table 2-6 Drilling Air Emissions .................................................................... 2-11
Table 2-7 Estimated Volumes of Cuttings Discharged ............................... 2-12
Table 2-8 Estimated Volumes of Operational Discharges to Sea............... 2-12
Table 2-9 Typical Development Drilling Wastes ......................................... 2-13
Table 2-10 Sound Sources from Various Maritime Activities...................... 2-14
Table 3-1 Variation of mean monthly surface current vector within Karama Block from January to December ................................... 3-12
Table 3-2 Some migratory birds in western Sulawesi (Holmes and Phillips, 1999)................................................................................... 3-26
Table 3-3 Sea Birds in Western Sulawesi (Holmes and Phillips, 1999)..... 3-27
Table 3-4 Birds Found in Mangrove Forrest of Western Sulawesi............ 3-28
Table 3-5 Population Development and Growth of Mamuju Regency, 2000-2007 .......................................................................................... 3-34
Table 3-6 Population Distribution and Density of Mamuju Regency 2004 and 2007................................................................................... 3-34
Table 3-7 Gender Ratio of Mamuju Regency, 2006 and 2007..................... 3-35
Table 3-8 Population Composition Based on Age and Gender in Mamuju Regency, 2004 and 2006.................................................. 3-36
Table 3-9 Population Structure Based on Religion in Mamuju Regency . 3-38
Table 3-10 Number of Schools. Teachers and Students in Mamuju in 2007.................................................................................................... 3-38
Table 3-11 Universities and Academies in West Sulawesi Province .......... 3-39
Table 3-12 Transportation Facilities in West Sulawesi Province ................. 3-40
Table 3-13 Road Length by Government Responsibility per Type of Surface in Mamuju Regency, 2007 (in Km) ................................. 3-41
Table 3-14 Road Condition by Government Responsibility per Conditions in Mamuju Regency. 2007 (in Km)........................... 3-41
ENVIRONMENTAL RESOURCES MANAGEMENT STATOIL EIA DRILLING
vi
Table 3-15 Number of Telephone Lines Based on Customers Categories in Mamuju Regency ........................................................................ 3-43
Table 3-16 Number of Facilities of Trading and Services in Mamuju Regency ............................................................................................ 3-43
Table 3-17 Population Structure Based on Employment in Mamuju Regency ............................................................................................ 3-44
Table 3-18 Minimum Wages in West Sulawesi Province, 2005 - 2009........ 3-45
Table 3-19 Land Used of Mamuju Regency, 2006......................................... 3-45
Table 3-20 Spatial Distribution of Forest Function in Mamuju Regency, 2006.................................................................................................... 3-46
Table 3-21 Local and Scientific Names and Value of Mainly Fish Caught in 2006 ................................................................................. 3-46
Table 3-22 Number of Production in West Sulawesi .................................... 3-47
Table 3-23 Commodity of high economic value in 2006 and 2007 .............. 3-48
Table 3-24 Numbers of fishing vessel by regencies in 2006 and 2007 (unit).................................................................................................. 3-48
Table 3-25 Numbers and type of fishing gears in West Sulawesi (unit) .... 3-49
Table 3-26 Category and Numbers of FAD in Karama Block, 2008............ 3-51
Table 3-27 Summary of Fishing Activities in Mamuju District ................... 3-52
Table 3-28 Potential areas of seaweed, production and numbers of households ....................................................................................... 3-55
Table 3-29 Number of Patient and Death by Kind of Disease In Mamuju Regency, 2005-2007 ......................................................... 3-58
Table 3-30 Number of live births per District in Mamuju Regency, 2005-2007 .......................................................................................... 3-58
Table 3-31 Number of Health Facilities per District in Mamuju Regency, 2007................................................................................... 3-59
Table 3-32 Number of Paramedic by Kinds of Paramedic per Sub-District in Mamuju Regency, 2007 ................................................ 3-59
Table 3-33 Stakeholder Identification and Areas of Interest........................ 3-62
Table 4-1 Evaluation of Impact Significance .................................................. 4-2 Table 4-2 Air Emission Standards.................................................................... 4-4 Table 4-3 Magnitude Criteria for Assessing Air Emissions ......................... 4-5 Table 4-4 Receptor/ Resource Sensitivity for Assessment of Air
Emissions............................................................................................ 4-5 Table 4-5 Magnitude Criteria for Impacts on Noise Levels ......................... 4-7 Table 4-6 Receptor/Resource Sensitivity for Assessment of Noise
Levels .................................................................................................. 4-7

ENVIRONMENTAL RESOURCES MANAGEMENT STATOIL EIA DRILLING
vii
Table 4-7 Requirements for the Management and Disposal of Drill Muds and Cuttings ......................................................................... 4-10
Table 4-8 Magnitude Criteria for Waste Generation and Disposal........... 4-11
Table 4-9 Receptor/ Resource Sensitivity for Waste Generation and Disposal .................................................................................... 4-11
Table 4-10 Magnitude Criteria for Water Quality Impacts .......................... 4-13 Table 4-11 Receptor/ Resource Sensitivity for Water Quality
Impacts ............................................................................................. 4-13 Table 4-12 Magnitude Criteria for Sediment Quality and Impacts
on Benthic Community .................................................................. 4-15 Table 4-13 Receptor/Resource Sensitivity for Sediment Quality and
Impacts on Benthic Community ................................................... 4-15
Table 4-14 Magnitude Criteria for Impacts on Fisheries .............................. 4-17 Table 4-15 Receptor/ Resource Sensitivity for Impacts on Fisheries.......... 4-17 Table 4-16 Magnitude Criteria for for Impacts resulting from
Unplanned Events........................................................................... 4-19 Table 4-17 Receptor/ Resource Sensitivity for Impacts resulting
from Unplanned Events ................................................................. 4-20
Table 4-18 Summary of Model Results ........................................................... 4-21 Table 4-19 Magnitude Criteria for Assessment of Socio-Economic
Impacts ............................................................................................. 4-23
Table 5-1 Environmental Management Plan.................................................. 5-3
Table 5-2 Monitoring of Sediments/ Benthic Community ........................ 5-11
Table 5-3 Monitoring of Drilling Mud & Chemical Use: Drilling OCN Reports.................................................................................... 5-12

ENVIRONMENTAL RESOURCES MANAGEMENT STATOIL EIA DRILLING
viii
LIST OF FIGURES
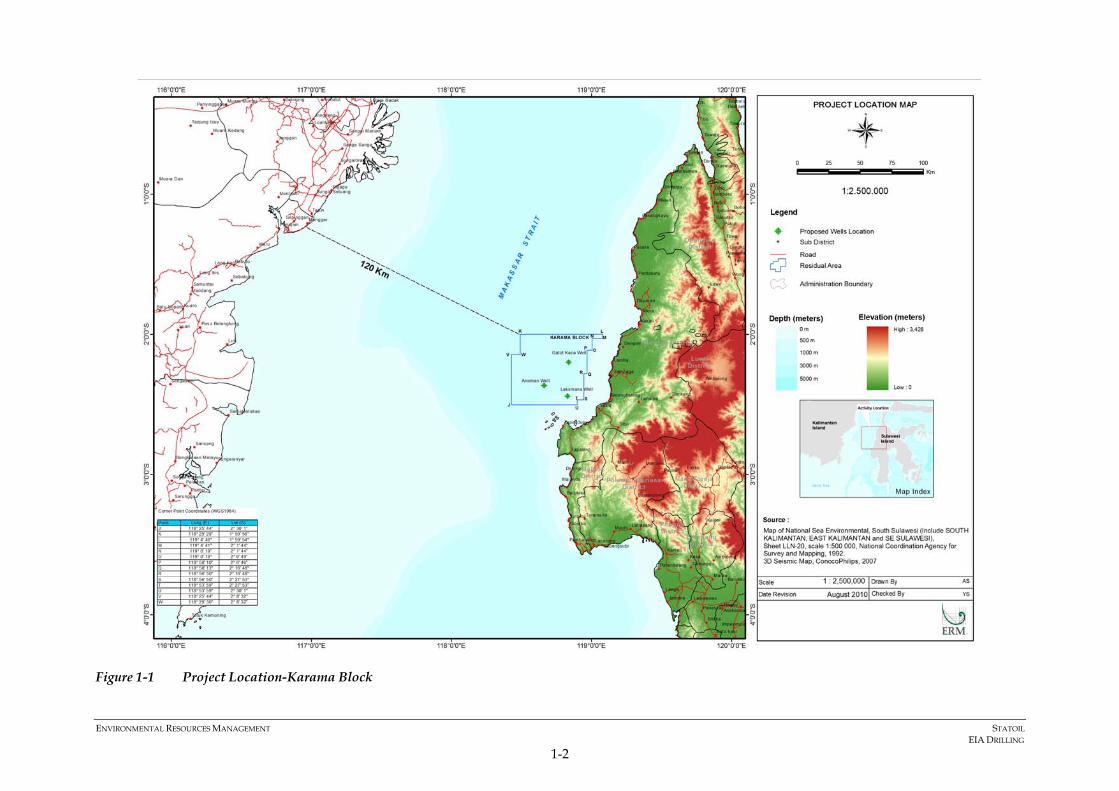
Figure 1-1 Project Location-Karama Block .................................................. 1-2
Figure 1-2 Overview of IA Approach .......................................................... 1-8
Figure 1-3 Evaluation of Impact Significance ........................................... 1-12
Figure 2-1 GSF Explorer Drill Ship............................................................... 2-1
Figure 2-2 Proposed Location of the Three Exploration Wells................. 2-4
Figure 2-3 Proposed Well Design ................................................................. 2-5
Figure 3-1 Project Zone of Influence) ............................................................3-6
Figure 3-2 Windrose in the study area (left March 2008 and right October 2008 windrose)................................................................3-8
Figure 3-3 Bathymetry of Karama Block.......................................................3-9
Figure 3-4 Vertical profile at Makassar Strait (a) Temperature (b) Salinity ..........................................................................................3-10
Figure 3-5 Stick plot of the current vector at several depths at MAK I (west mooring) measured during Arlindo experiment at Labani Channel from July 2005 – June 2006........................3-12
Figure 3-6 Time series of wave characteristics: (i) significant wave height (upper), (ii) mean wave period (middle), and (iii) mean wave direction (lower) along a north-south section acquired from European Climate Moderate Range Weather Forecast (ECMWF) ..........................................3-14
Figure 3-7 Comparison between tide measurement (blue) and results of tide prediction (red) at Mamuju from 1 – 22 April 2009. ....................................................................................3-15
Figure 3-8 Water column and sediment quality sampling locations......3-19
Figure 3-9 Eel Spawning Area......................................................................3-23
Figure 3-10 Sea Turtle Map.............................................................................3-25
Figure 3-11 Typical Narrow Band of Mangrove Ecosystem Found in Mamuju due to Steep Topography at Coast of Mamuju .......3-29
Figure 3-12 Pescaprae Formation around Coast of Mamuju .....................3-30
Figure 3-13 Baringtonia Formation of Mamuju ...........................................3-30
Figure 3-14 Location of Mampie Lampoko Reservation ............................3-32
Figure 3-15 Karampuang Island (A) and Main Activities: (B) Inhabitant/Village, (C) Recreational Resort run by local government, and (D) Floating net aquaculture ......................3-33
Figure 3-16 Participation of the education level ..........................................3-39
Figure 3-17 Transportation lines ....................................................................3-42
Figure 3-18 Working Population based on Education Level in Mamuju Regency in 2007 ...........................................................3-44

ENVIRONMENTAL RESOURCES MANAGEMENT STATOIL EIA DRILLING
ix
Figure 3-19 Potential fishing areas.................................................................3-50
Figure 3-20 Rumpon location .........................................................................3-54
Figure 3-21 Seaweed cultivation area............................................................3-56
Figure 4-1 Scoping Matrix...............................................................................4-3
LIST OF APPENDICES
Appendix 1: Oil Spill and Drilling Cuttings Modelling Result
Appendix 2: Analytical Result of Seawater Quality
Appendix 3: Analytical Result of Seabed Sediment Quality
Appendix 4: Stakeholder Engagement Meeting
Appendix 5: Master Impact Tables
Appendix 6: Drilling Chemical Characteristics

Final Report EIA Drilling
PT. ERM Indonesia Wisma Aldiron Dirgantara 2nd floor, Suite 238-239 Jl. Gatot Subroto Kav. 72 Jakarta 12870 Indonesia Telephone +62 21 7918 1904 Facsimile +62 21 7918 1905 Website: www.erm.com
Client.
Project No. 0103283
Summary. Date. 22 October 2010
Included in this report.
Approved by
Paul Douglass President Director ERM Indonesia
Revision Description By Checked Approved Date
This report has been prepared by Environmental Resources Management with all reasonable skill, care and diligence within the terms of the Contract with the client, incorporating our General Terms and Conditions of Business and taking account of the resources devoted to it by agreement with the client. We disclaim any responsibility to the client and others in respect or any matters outside the scope of the above. This report is confidential to the client and we accept no responsibility of whatsoever nature to any third parties to whom this report, or any part thereof, is made known. Any such party relies upon the report at their own risk.
Distribution
Internal Public Confidential

ENVIRONMENTAL RESOURCES MANAGEMENT STATOIL EIA DRILLING
1-1
1 INTRODUCTION
1.1 GENERAL INTRODUCTION TO THE PROJECT
Statoil Indonesia Karama As (Statoil) and partner Pertamina plan to undertake an exploration drilling program of three deep-water exploration wells at Karama Block in the Makassar Strait, offshore West Sulawesi Province in 2011. The purpose of this project is to discover the oil or gas targets identified from interpretation of 3D seismic survey data.
The Karama Block is located in the Makassar Strait. The nearest land is around 12 km (7.5 miles) West of Mamuju Regency, West Sulawesi province. According to the Government Regulation No. 32 of 2004 regarding Regional Government, some of the activity locations in Karama Block are, administratively, under the authority of the West Sulawesi Province Government (4-12 miles) and most of the locations are under the Central Government authority (>12 miles).
The exploration block is consist of an area of approximately 4,287 km2 from north to south (Figure 1-1) in water depths ranging from 1,660-1,825 m. Drilling operations are currently planned to begin in early January and February 2011 for the first and second wells and in July 2011 for the third well.
An Environmental Impact Assessment (EIA or AMDAL) is not required under Indonesian Regulation for exploration drilling activities. This IA is being completed in line with Statoil’s corporate requirements and covers only the exploration drilling activities for the Karama Block. Currently, the exact locations of the three exploration wells have not yet been determined; final locations of the wells will be determined based on the interpretation of data gathered during the 3D seismic survey of the area (which is currently in progress).
ENVIRONMENTAL RESOURCES MANAGEMENT STATOIL EIA DRILLING
1-2
Figure 1-1 Project Location-Karama Block

ENVIRONMENTAL RESOURCES MANAGEMENT STATOIL EIA DRILLING
1-3
1.2 GENERAL INFORMATION ABOUT STATOIL
Statoil is an international energy company with over 35 years experience on the Norwegian continental shelf, today with operations in 40 countries. The company is headquartered in Norway with 29,000 employees worldwide, and are listed on the New York and Oslo stock exchanges.
Statoil is a global leader in subsea developments, and is widely recognized as a pioneer in deepwater drilling, increased oil recovery (IOR), and carbon capture and storage (CCS).
Statoil Indonesia Karama AS is a wholly owned subsidiary of Statoil ASA, which established an Indonesian office in August 2007. Currently the Statoil Indonesia office is located in Wisma Pondok Indah II, Suite 602, Jl. Sultan Iskandar Muda, Kav. V-TA, Jakarta 12310, Indonesia.
Statoil has a Production Sharing Contract (PSC) with BPMIGAS that allows Statoil to conduct exploration activities of the Karama block. The contract agreement is for 30 years (2007-2037). The three commitment wells in the Karama PSC will be drilled in 2011.
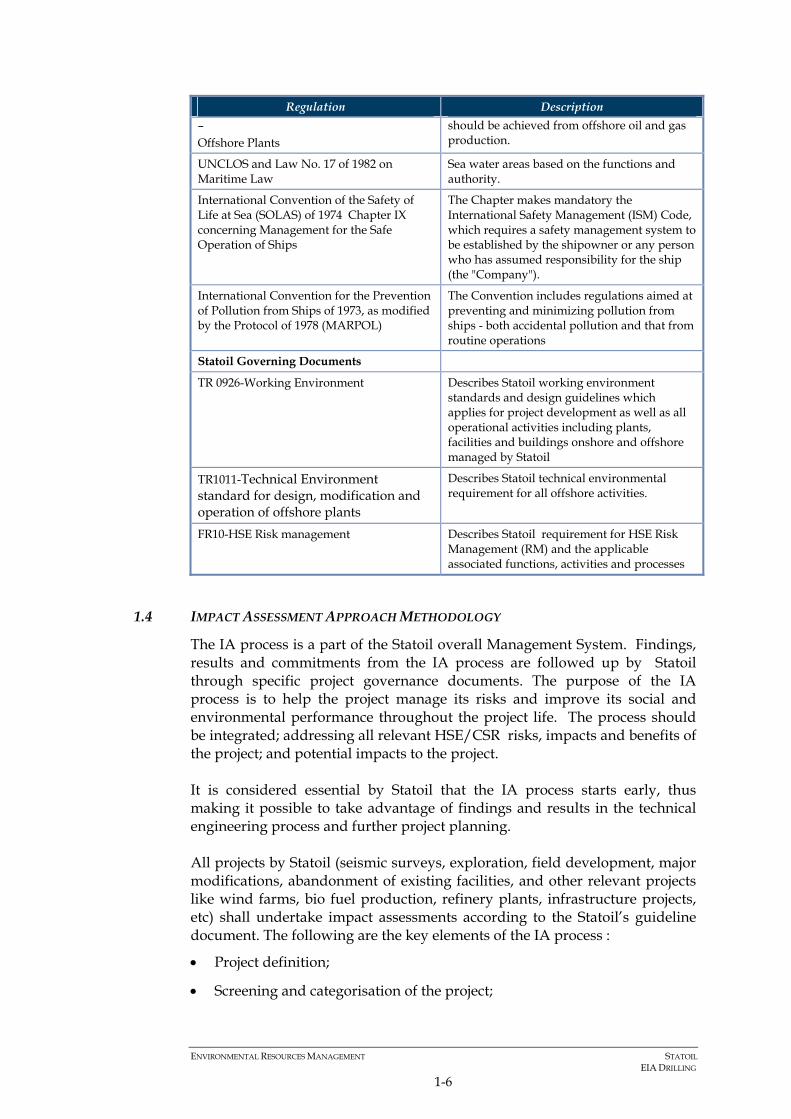
1.3 POLICY, LEGISLATIVE AND ADMINISTRATIVE FRAMEWORK
Environmental regulations concerning Statoil’s offshore operations that have to be placed as top priorities to comply with among others are listed in the table below.
Table 1-1 List of Regulation and Governing Documents concerning Offshore Operations of Statoil
Regulation Description
National Regulations
Act No. 1 of 1973 on Indonesian Continental Shelf
Regulation on border and sea territory based on continental shelf and pollution control
Act No. 5 of 1983 on Indonesian Exclusive Economic Zone
Adopts the rule in UNCLOS 1982 of determining the borderlines as areas further then 200 miles
Act No. 6 of 1996 on Indonesian Water Activities of usage, management, protection and preservation of the Indonesian water environment
Act No. 5 of 1990 regarding Natural Resource Conservation and Ecosystem
The project proponent needs to refer to this regulation when dealing with natural resource conservation and ecosystems within the project area.
Act No. 6 of 1994 regarding Ratification on the UN Convention on Climate Change
Project activities may potentially generate greenhouse gasses, hence shall refer to this Convention.
Act No. 27 of 2007 concerning Coastal Zone and Small Islands Management
The management of coastal zone and small islands refers to this Act

ENVIRONMENTAL RESOURCES MANAGEMENT STATOIL EIA DRILLING
1-4
Regulation Description
Act No 32 of 2004 concerning Regional Government
Authority, responsibility and obligation of the Regional Government is regulated in this Act
Act No. 17 of 2004 concerning the Enactment of the Kyoto Protocol to the United Nations Framework Convention on Climate Change
Project activities may potentially generate greenhouse gasses, hence shall refer to this Protocol
Act No. 32 of 2009 concerning Environmental Protection and Management
Environmental matters related to the project activities shall comply with this Act. Company shall follow guidance stipulated in this act on conducting environmental protection and management activity.
Act No. 45 of 2009 jo 31 of 2004 concerning Fisheries
Fisheries management including optimizing the management of fish resources, the preservation of fish resources, fish cultivation and spatial planning refer to this Act.
Government Regulation No. 27 of 1999 concerning Environmental Impact Assessment (AMDAL)
Requirement of activities/businesses that have significant impacts to the environment to conduct an AMDAL study
Government Regulation No. 7 of 1999 concerning Flora and Fauna Conservation
Conservation of protected flora and fauna within project area shall refer to this Regulation.
Government Regulation No. 18 of 1999; and No. 85of 1999 concerning Hazardous and Toxic Waste Management
Guidance of identification and management of hazardous and toxic waste (B3). Hazardous and toxic waste generated from the activity shall refer to this Regulation.
Government Regulation No. 41 of 1999 concerning Air Pollution Control
Project potentially emits gaseous pollutant that may influence the ambient air quality hence control of air pollution shall refer to this Regulation
Government Regulation No. 25 of 2000 concerning Government Authority and the Authority of Province as a Region with Autonomy
Administration of the project to government should consider authority portions of local/ regional and central government as stipulated by this Regulation.
Government Regulation No. 74 of 2001 concerning Hazardous and Toxic Material Management
Project activities will use chemicals therefore management of the chemicals (transportation, handling, and storage) shall comply to this Regulation.
Presidential Regulation No. 109 of 2006 concerning Emergencies Response for Oil Spillage in the Sea
Emergency response and handling of oil spill at sea should follow this Regulation
Presidential Decree Number 32 Year 1990 regarding Management of Protection Areas
This decree lists type of protection areas (sensitive areas) and their management. Liquid and solid wastes disposal are not allowed in the protection areas
Ministry of Environment Decree No. KEP-48/MENLH/11/1996 concerning Noise Standard.
Noise should be managed and monitored in order to meet prevailing environmental noise standards
Ministry of Environment Decree No. 200 of 2004 concerning Standard Criteria for Environmental Damage and Guidelines for the Determination of Status of Sea Grass Colonies
Determination of environmental damage and status of sea grass colonies shall refer to this Regulation.
Ministry of Environment Decree No. 201 of 2004 concerning Standard Criteria for
Determination of environmental and mangrove ecosystem damage shall refer to

ENVIRONMENTAL RESOURCES MANAGEMENT STATOIL EIA DRILLING
1-5
Regulation Description Environmental Damage and Guidelines for the Determining the Extent of Damage to Mangroves
this Regulation.
Ministry of Environment Decree No. 51 of 2004 concerning Sea Water Quality Standard
Sea water quality in the project area shall refer to this Regulation.
Ministry of Environment Regulation No. 8 of 2006 concerning Guidelines to Prepare Environmental Impact Assessment.
This Regulation provides guidelines for compilation of the KA, ANDAL, RKL, RPL and Executive Summary documents.
Ministry of Environment Regulation No. 11 of 2006 concerning Sort of Business and/or Activities Plan that Require to Conduct Environmental Impact Assessment.
Mandatory to conduct an AMDAL study for a prescribed list of activities and /or business
Ministry of Environment Regulation No. 12 of 2006 concerning Terms and Permitting Procedures for Effluent Disposal to the Marine Environment.
Effluent water discharge to marine environment shall refer to this Regulation.
Ministry of Environment Regulation No. 04 of 2007 concerning Effluent Water Standard for Offshore Oil and Gas Exploration and Production
Water effluent discharged from the activity should comply with this Regulation.
Ministry of Mining and Energy Decree No. KEP-103.K/008/M.PE/1989 concerning Supervision on Environmental Management and Monitoring Plan in the Field of Mining and Energy.
Environmental Management and Monitoring Plan implementation will be inspected by an assigned Mine Inspector
Ministry of Mining and Energy Decree No. 1457K/28/MEM/2000 concerning Technical Guidelines of Environmental Management in Mine and Energy Sector.
EIA preparation in mining and energy sector shall refer to this Decree
Ministry of Energy and Mineral Resources Regulation No. 045 Year 2006 concerning Management of Drilling Mud, Drilling Mud Waste, and Cuttings in the Oil and Gas Drilling Activity
Management of Drilling Mud Waste and Cuttings in the Oil and Gas Drilling Activity shall follow this regulation
Head of Impact Control Agency Decree No. 056/BAPEDAL/03/1994 concerning Guidelines to Determine Scale of Significance Environmental Impacts.
The scale of impacts should be clearly stated in the environmental impact assessment documents referring to this Decree.
Head of Impact Control Agency Decree No. KEP-01/BAPEDAL/09/1995 concerning Procedures and Requirements for Storage and Collection of Hazardous and Toxic Waste.
Hazardous waste generated by the project should be stored and collected in accordance with this Decree.
Head of Impact Control Agency Decree No. 8 of 2000 concerning Community Involvement and Information Disclosure in the Process of Environmental Impact Assessment
Community involvement and information disclosure in relation to the AMDAL process shall refer to this regulation.
International Regulations
World Bank Group Emission Level TR1011 – Offshore Plants
World Bank Group liquid effluent levels which should be achieved from offshore oil and gas production.
World Bank Group Emission Level TR1011 World Bank Group air emission levels which
ENVIRONMENTAL RESOURCES MANAGEMENT STATOIL EIA DRILLING
1-6
Regulation Description – Offshore Plants
should be achieved from offshore oil and gas production.
UNCLOS and Law No. 17 of 1982 on Maritime Law
Sea water areas based on the functions and authority.
International Convention of the Safety of Life at Sea (SOLAS) of 1974 Chapter IX concerning Management for the Safe Operation of Ships
The Chapter makes mandatory the International Safety Management (ISM) Code, which requires a safety management system to be established by the shipowner or any person who has assumed responsibility for the ship (the "Company").
International Convention for the Prevention of Pollution from Ships of 1973, as modified by the Protocol of 1978 (MARPOL)
The Convention includes regulations aimed at preventing and minimizing pollution from ships - both accidental pollution and that from routine operations
Statoil Governing Documents
TR 0926-Working Environment Describes Statoil working environment standards and design guidelines which applies for project development as well as all operational activities including plants, facilities and buildings onshore and offshore managed by Statoil
TR1011-Technical Environment standard for design, modification and operation of offshore plants
Describes Statoil technical environmental requirement for all offshore activities.
FR10-HSE Risk management Describes Statoil requirement for HSE Risk Management (RM) and the applicable associated functions, activities and processes
1.4 IMPACT ASSESSMENT APPROACH METHODOLOGY
The IA process is a part of the Statoil overall Management System. Findings, results and commitments from the IA process are followed up by Statoil through specific project governance documents. The purpose of the IA process is to help the project manage its risks and improve its social and environmental performance throughout the project life. The process should be integrated; addressing all relevant HSE/CSR risks, impacts and benefits of the project; and potential impacts to the project. It is considered essential by Statoil that the IA process starts early, thus making it possible to take advantage of findings and results in the technical engineering process and further project planning. All projects by Statoil (seismic surveys, exploration, field development, major modifications, abandonment of existing facilities, and other relevant projects like wind farms, bio fuel production, refinery plants, infrastructure projects, etc) shall undertake impact assessments according to the Statoil’s guideline document. The following are the key elements of the IA process : • Project definition;
• Screening and categorisation of the project;

ENVIRONMENTAL RESOURCES MANAGEMENT STATOIL EIA DRILLING
1-7
Wind Parks DG2 DG3DG0
Project definition
Screening and categorisation
Scoping
Stakeholder idenitfication and analysis
Gathering and analysis of baseline data
Stakeholder engagement
Risk and impact identification and analysisIdentification and assessment of mitigation and enhancement measures
Follow up
DG0 DG1DGC
DG4RTDE
AP1
DG1
DG2
Impa
ct a
sses
smen
t pha
ses
ExplorationField development DG3
• Scoping of the IA process;
• Stakeholder identification and analysis;
• Gathering and analysis of relevant baseline data;
• Stakeholder engagement;
• Risk and impact identification and analysis;
• Identification and assessment of mitigation and enhancement measures and actions;
• Follow up: Implementation of measures, monitoring and reporting.
Typical time-line for IA processes for exploration and oil and gas field development by Statoil is as follow:
Following project screening process (project categorization) in accordance with Indonesia Ministry of Environment Regulation Number 11 Year 2006, oil and gas exploration drilling activity is considered as project that does not require a full AMDAL (EIA) study but UKL-UKL (Environmental Management Effort and Environmental Monitoring Effort) document is obliged to be prepared by Statoil.
Statoil has conducted stakeholder identification and analysis which is described in detail in Chapter 3. This then was followed by Public Consultation/Socialization attended by key stakeholders in the project area and related institutions in West Sulawesi Province. Public consultation was particularly intended:
• To gather suggestions, opinions, and responses concerning the oil and gas exploration activity as part of scoping process
• To protect public interest surrounding the activity area from potential impact that may arise from the project.
• To establish an atmosphere of equal partnerhip between the parties interest in oil and gas exploration activity in Karama Block.

ENVIRONMENTAL RESOURCES MANAGEMENT STATOIL EIA DRILLING
1-8
• To respect the right of all parties to obtain information relating to oil and gas exploration activities in the Karama Block.
During Public Consultation/Socialization, the participants were actively involved in providing critical inputs associated with oil and gas exploration drilling plan in Karama Block. Summary of key issues raised by the participants are as follow :
• Water quality aspect related to drilling cutting and drilling mud management.
• Social and Economics aspect related to job opportunity for local people, community development program and compensation to rumpon owner and fishing group affected by the activity.
• More comprehensive socialization activities involving communities proximity to the project location.
Those steps then followed by IA of the planned oil and gas exploration drilling activity in Karama Block. In this report, the impact assessment has been undertaken following a systematic process that predicts and evaluates the impacts the proposed exploration drilling program is expected to have on aspects of the physical, biological, and socio-economic environment, and identifies measures that Statoil will take to avoid, reduce, remedy, offset or compensate for adverse impacts, and to provide benefits, as far as is practicable.
The overall approach followed is shown schematically in Figure 1-2 while the key steps taken are described in subsequent sections. Definitions used throughout this impact assessment are described in Table 1-2.
Stakeholder engagement
Inte
ract
ion
with
pro
ject
pla
nnin
g an
d de
sign
Bas
elin
e st
udie
s (e
xist
ing
data
co
llect
ion
and
new
sur
veys
)
Predict magnitude of impacts
Evaluate their significance
Investigate options for mitigation
Reassess residual impact (as required)
Assessment
Management Plans
Scoping
Reporting and Disclosure
Figure 1-2 Overview of IA Approach

ENVIRONMENTAL RESOURCES MANAGEMENT STATOIL EIA DRILLING
1-9
Table 1-2 Definitions Used in this IA
Term Definition
Project The Project is defined as including all those actions and activities which are a necessary part of the Exploration Drilling campaign, including those aspects without which the Project cannot proceed. This includes presence of chase boats; the drilling, disposal/ discharges of wastes, etc.
Area of Influence
Impacts have been assessed throughout the Area of Influence of the Project. This varies depending on the type of impact being considered but includes all that area within which it is considered significant impacts could occur, taking into account: (a) the physical footprint of the proposed Project and (b) the nature of the baseline environment and manner in which impacts are likely to be propagated beyond the Project boundary. For this Project, most impacts are expected to be mainly localized and are not expected to extend across national boundaries. However, in the case of the generation of greenhouse gases, the area of influence extends globally.
Type of Impact
The assessment has considered both positive and negative impacts of the Project. Positive or beneficial impacts are those that are considered to present an improvement to the baseline or to introduce a new, desirable factor. Negative or adverse impacts are the reverse.
Resources & Receptors
The term resources is used to describe features of the environment such as water resources, clean air and habitats etc, which are valued by society for their intrinsic worth and/or their social or economic contribution. The term receptors is used to define people and communities who may be affected by the Project.
Environment Aspects of the environment in the context of this Project include: The physical environment, including climate, air, underwater noise; The biological or natural environment, including marine habitats, biodiversity at the community, species and genetic levels; protected areas and ecosystem values; The social and socio-economic environment including people and their livelihood, their health, welfare, amenity, safety and security; employment and incomes; local, regional and national economies.
Timeframe of Impact
Impacts include: permanent impacts that will arise from irreversible changes in conditions such as the removal of a natural feature; temporary impacts, ie. those that arise from short term activities such as unplanned events; and longer term impacts that will arise over the duration of Project activities. Short and long term impacts will cease on completion of the relevant activities although there may be a period before the environment returns to its previous condition. Given the nature of Exploration Drilling, no longer term impacts are expected to occur. Within each of the above categories, the assessment considers impacts which are one-off or recurrent, and continuous or intermittent. If intermittent, the impacts occur at varying frequency, and at regular, or irregular intervals (eg. depending on operating or weather conditions).
Nature of Impact
The assessment includes direct impacts arising from activities associated with the Project (primary impacts) and impacts that follow on as a consequence of these (secondary impacts). So, for example, the release of drill cuttings/ muds into the sea will have a direct affect on water quality. A change in water quality can then lead to a secondary effect on marine organisms. The Project can also have an induced impact by stimulating other developments to take place which are not directly within the scope of or essential to the development of the Project. Whilst these associated developments are not part of the Project, their induced impacts are caused at least in part by the Project and they are therefore considered in the assessment.

ENVIRONMENTAL RESOURCES MANAGEMENT STATOIL EIA DRILLING
1-10
Term Definition
Cumulative Impacts
The Project may also be taking place at the same time as other developments causing impacts affecting the same resources or receptors, such that there will be cumulative effects with the proposed Project.
Routine and Non-Routine Impacts
Finally, this IA has assessed both routine impacts resulting from planned activities of the Project; and non-routine impacts that could arise from unplanned or accidental events within the Project such as accidental spills of drilling fluids or a well blow out. The impact of non-routine events is assessed in terms of Risk, ie. taking into account both the consequence of the event and the probability of occurrence (Risk = probability x consequence).
1.4.1 Scoping
The first stage of the assessment involved identifying the likely significant impacts of the Project that require further investigation. This aims to focus the assessment on the likely significant impacts. This involved the systematic consideration of the potential for interaction between activities involved in the Project and aspects of the physical, biological, socio-economic environment that may be affected. The results of scoping are presented in Section 4.
1.4.2 Describing the Baseline
To provide a baseline against which the impacts of the Project can be assessed, a description of physical, biological and socio-economic conditions that will prevail in the absence of the Project has been prepared as presented in Section 3. Due to the screening classification, baseline data for this assessment have been derived from secondary, publically available data sources and monitoring data gathered in the Block between September and October 2009.
1.4.3 Impact Prediction
The assessment describes what could happen to the existing baseline as a result of the project by predicting the magnitude of impacts. The term ‘magnitude’ is used as shorthand to encompass all the dimensions of the predicted impact including:
• The nature of the change (what is affected and how);
• Its size, scale or intensity;
• Its geographical extent and distribution;
• Its duration, frequency, reversibility, etc; and
• Where relevant, the probability of the impact occurring as a result of accidental or unplanned events.

ENVIRONMENTAL RESOURCES MANAGEMENT STATOIL EIA DRILLING
1-11
It also includes any uncertainty about the occurrence of scale of the impact, expressed as ranges, confidence limits or likelihood (1). Impacts have then been graded as being of small, medium or large magnitude according to criteria developed for each aspect and presented in Section 4.
1.4.4 Evaluating the Significance of a Predicted Impact
Though there is statutory definition of significance of impacts in accordance with Head of Impact Control Agency Decree No. 056/BAPEDAL/03/1994 regarding Guidelines to Determine Scale of Significance Environmental Impacts.; however, it is relevant for use in AMDAL compilation following Ministry of Environment Regulation No. 08 of 2006 regarding AMDAL Compilation Guidelines. Therefore the following practical definition of significant of impact is used in this impact assessment:
An impact is significant if, in isolation or in combination with other impacts, it should, in the judgment of the EIA team, be reported in the EIA report so that it can be taken into account in decision making on whether the Project should proceed and if so under what conditions.
This recognizes that evaluation requires an exercise of judgment and that judgments may vary between parties in the process. The evaluation of impacts that is presented in this Report is based on the judgment of the impact assessment team, informed by reference to Indonesia’s legal standards and government policy, international good practice and the views of stakeholders.
Where standards are not available or provide insufficient information on their own to allow grading of significance, significance has been evaluated taking into account the magnitude of the impact and the value or sensitivity of the affected resource or receptor. The value of a resource is judged taking into account its quality and its importance as represented, for example, by its local, regional, national or international designation, its importance to the local or wider community, or its economic value. The sensitivity of receptors, for example a household, community or wider social group, will take into account their likely response to the change and their ability to adapt to and manage the effects of the impact. Where receptor sensitivity has been considered in impact evaluation, criteria used to establish sensitivity have been included in Section 4.
(1) A distinction is made here between the probability of impact arising from a non-routine event such as an accidental spill or fire, and the likelihood of an uncertain impact; for example it may not be certain that health will be affected by air emissions or that jobs will be obtained by local people.

ENVIRONMENTAL RESOURCES MANAGEMENT STATOIL EIA DRILLING
1-12
Magnitude and value/sensitivity are looked at in combination to evaluate whether an impact is significant and if so its degree of significance. The principle is illustrated in Figure 1-3.
Magnitude of Impact
Evaluation of Significance
Low Medium High
Low Not significant
Minor Moderate
Medium Minor Moderate Moderate-
Major
Value/ Sensitivity of resources/ receptor
High Moderate Moderate-
Major Major
Figure 1-3 Evaluation of Impact Significance
1.4.5 Mitigation & Benefit Enhancement
Where significant impacts could occur or opportunities to enhance benefits identified, practical ways of mitigating those impacts or enhancing benefits as far as possible have been included.
Where a significant negative impact is identified, a hierarchy of options for mitigation has been considered to identify the preferred approach:
• Avoid at source – remove the source of the impact;
• Abate at source – reduce the source of the impact;
• Attenuate – reduce the impact between the source and the receptor;
• Abate at the receptor – reduce the impact at the receptor;
• Remedy – repair the damage after it has occurred; and
• Compensate / Offset – replace in kind or with a different resource of equal value.
Mitigation and benefit enhancement recommendations are described in Section 4 of this report.

ENVIRONMENTAL RESOURCES MANAGEMENT STATOIL EIA DRILLING
1-13
1.4.6 Residual Impacts
In some cases, it may only be possible to reduce the impact to a certain degree. These impacts are therefore ‘residual’ in the sense that they remain after mitigation measures have been designed into the intended activity. The degree of significance attributed to residual impacts is related to the weight the impact assessment team considers should be given to them in reaching a decision on the Project:
• Any residual impacts of major significance, whether positive or negative, are considered to warrant substantial weight in decision making on whether (and if so how) the Project should proceed, when compared with other environmental, social or economic costs and benefits. If the Project is approved to proceed, conditions should be imposed to ensure adverse impacts are strictly controlled and monitored and beneficial impacts are fully delivered;
• Residual impacts of moderate significance are considered to be of reducing importance to decision-making on how the Project should proceed, but still warrant careful attention to conditions regarding mitigation and monitoring, to ensure best available techniques are used to keep adverse impacts to as low as reasonably practicable (ALARP) for the Project, and to ensure beneficial impacts are delivered;
• Residual impacts of minor significance should be brought to the attention of the decision-maker but are identified as warranting little if any weight in the decision of whether and how the Project should proceed. Mitigation can be achieved using normal good practice and monitoring should be carried out to confirm that impacts do not exceed predicted levels;
• Not significant residual impacts are those that, after assessment, are found not to be significant to the decision making about the Project; and
• Where the residual impact is of more than minor significance, this assessment explains how the impact has been reduced to as low as reasonably practicable (ALARP) for the Project.
1.4.7 Management & Monitoring
A wide range of different measures to mitigate and manage impacts have been identified through this assessment. Furthermore, where uncertainty exists about the significance of an impact, monitoring has been recommended. These mitigation, management and monitoring measures are set out in Sections 5.

ENVIRONMENTAL RESOURCES MANAGEMENT STATOIL EIA DRILLING
2-1
2 PROJECT DESCRIPTION
2.1 INTRODUCTION
This section provides a description of the proposed exploration drilling program operations in the Karama licence area including the following:
• Project overview and location;
• Descriptions of the principal activities and well design;
• Details of the drilling rig;
• A summary of the principal emissions, effluents and wastes generated during key activities; and
• An implementation schedule for the drilling program.
This assessment has been prepared on the basis that drilling will be conducted using the drill ship GSF Explorer operated by Transocean. A photograph of the GSF Explorer is shown in Figure 2-1.
Figure 2-1 GSF Explorer Drill Ship

ENVIRONMENTAL RESOURCES MANAGEMENT STATOIL EIA DRILLING
2-2
2.2 PROJECT OVERVIEW AND LOCATION
Statoil are planning to drill three exploration wells (Anoman, Laksmana and Gatot-kaca) within the Karama Block in the Makassar Strait, offshore West Sulawesi (see Figure 2-2). The wells will be drilled in water depths ranging between 1,660–1,825 m. The nearest distance to shoreline of the outermost island or to mainland for for each of the wells is Anoman well 34 km (to mainland), Laksmana well 19 km (to Karampuan Island) and Gatot-kaca 35 km (to mainland).
The supply base for the exploration drilling activities will be the Petrosea Offshore Supply Base (POSB) at Balikpapan, which is located approximately 185 km (120 miles – see Figure 1-1) from the Karama Block. POSB is well equipped with a deepwater quay for large platform supply vessels (PSVs).
2.3 PRINCIPLE PROJECT ACTIVITIES
2.3.1 Positioning of the Drill Ship
The GSF Explorer is a dynamically positioned (DP) drill ship designed to operate at water depths of up to 2,300 m. Several thrusters are mounted around the base of the drill ship which will be used to maintain the position of the ship precisely on the well location. These thrusters will be controlled by a computer that determines the exact position of the ship from special sensors attached to the well and on the drill ship itself. The drill ship will be supported by two large PSVs, one high speed support vessel and one helicopter.
2.3.2 Drilling Activities
2.3.2.1 Drilling Process
Once in position at the designated well-site, drilling will commence. Wells are drilled by using a bit that chips off pieces of rock, called cuttings. The drill bit is connected to the surface by segments of hollow pipe, which together are called the drill string. Drilling mud is pumped down through the centre of the drill string and returned to the surface through the space between the drill string and the rock formations or casing, known as the annulus. Often the top section of the well (or top-hole) is drilled without a riser in place and the drill cuttings and environmental-friendly water-based mud are discharged directly on the seabed in proximity of the well.
The function of drilling mud includes cooling and lubricating the drill bit, removing and transporting cuttings to the surface, counterbalancing formation pressure to prevent formation fluids (ie. liquid hydrocarbons, gas and water) from entering the well prematurely and preventing the open (uncased) wellbore from caving in. As the well is drilled, metal casing is

ENVIRONMENTAL RESOURCES MANAGEMENT STATOIL EIA DRILLING
2-3
placed inside the well to line it and stabilize the hole to prevent it caving in. The casing also isolates aquifers and hydrocarbon bearing zones through which the well passes, thus preventing liquids or gases entering the well prematurely. After each casing string has been installed, it is cemented in place. The casing also provides a firm point for the attachment of the blowout preventor (BOP) stack.

ENVIRONMENTAL RESOURCES MANAGEMENT STATOIL EIA DRILLING
2-4
Figure 2-2 Proposed Location of the Three Exploration Wells

ENVIRONMENTAL RESOURCES MANAGEMENT STATOIL EIA DRILLING
2-5
2.3.2.2 Karama Drilling Plan
The well drilling will involve 3 (three) wells with the average well depth of 5,425 m. Water based muds (WBMs) will be used to drill the initial phase (ie. as indicated in Figure 2-3) while the remainder of the well will be drilled using synthetic based muds (SBMs). The first step in the drilling sequence will be to drill a 36” top hole section into the seabed into which the conductor pipe is cemented.
A 30” diameter hole will then be drilled to a depth of ~ 2,300 as an optional plan. If the 36” conductor casing cannot be set as planned depth, a 26” casing will then be set A 26” diameter hole will be drilled to a total depth of 2,612 m and a 20” casing run into the hole and set in place. The BOP stack and riser will then be installed. This is followed by drilling a 20”, 17-1/2” hole and a 14-1/2” hole. A 12-1/4” hole will then be drilled to a depth of about 4,593 m; the 9-5/8” liner will be run into the hole and set in place. Finally an 8-1/2” hole will then be drilled to the planned total depth (TD) of approximately 5,425 m.
A schematic representation of the casing design for the well is shown in Figure 2-3.
2400
35503600
Open Hole @ 5,425 m
36” Conductor Casing @ 1,970 m
20” Surface Casing @ 2,612 m
16” Protective Liner @ 3,374 m
13 5/8” Intermediate Casing @ 3,648 m
11 3/4” Protective Liner @ 3,983 m
9 5/8” Drilling Liner @ 4,593 m
26” Surface Casing @ 2,300 m
Hole Size Casing Size @ TVD Mud Type
36”
30”
26”
20”
17 1/2”
14 1/2”
12 1/4”
8 1/2”
WBM
WBM
WBM
SBM
SBM
SBM
SBM
SBM
2400
35503600
Open Hole @ 5,425 m
36” Conductor Casing @ 1,970 m 36” Conductor Casing @ 1,970 m
20” Surface Casing @ 2,612 m 20” Surface Casing @ 2,612 m
16” Protective Liner @ 3,374 m 16” Protective Liner @ 3,374 m
13 5/8” Intermediate Casing @ 3,648 m 13 5/8” Intermediate Casing @ 3,648 m
11 3/4” Protective Liner @ 3,983 m 11 3/4” Protective Liner @ 3,983 m
9 5/8” Drilling Liner @ 4,593 m 9 5/8” Drilling Liner @ 4,593 m
26” Surface Casing @ 2,300 m 26” Surface Casing @ 2,300 m
Hole Size Casing Size @ TVD Mud Type
36”
30”
26”
20”
17 1/2”
14 1/2”
12 1/4”
8 1/2”
WBM
WBM
WBM
SBM
SBM
SBM
SBM
SBM
Source: Drilling Well Design, September 2009
Figure 2-3 Proposed Well Design
ENVIRONMENTAL RESOURCES MANAGEMENT STATOIL EIA DRILLING
2-6
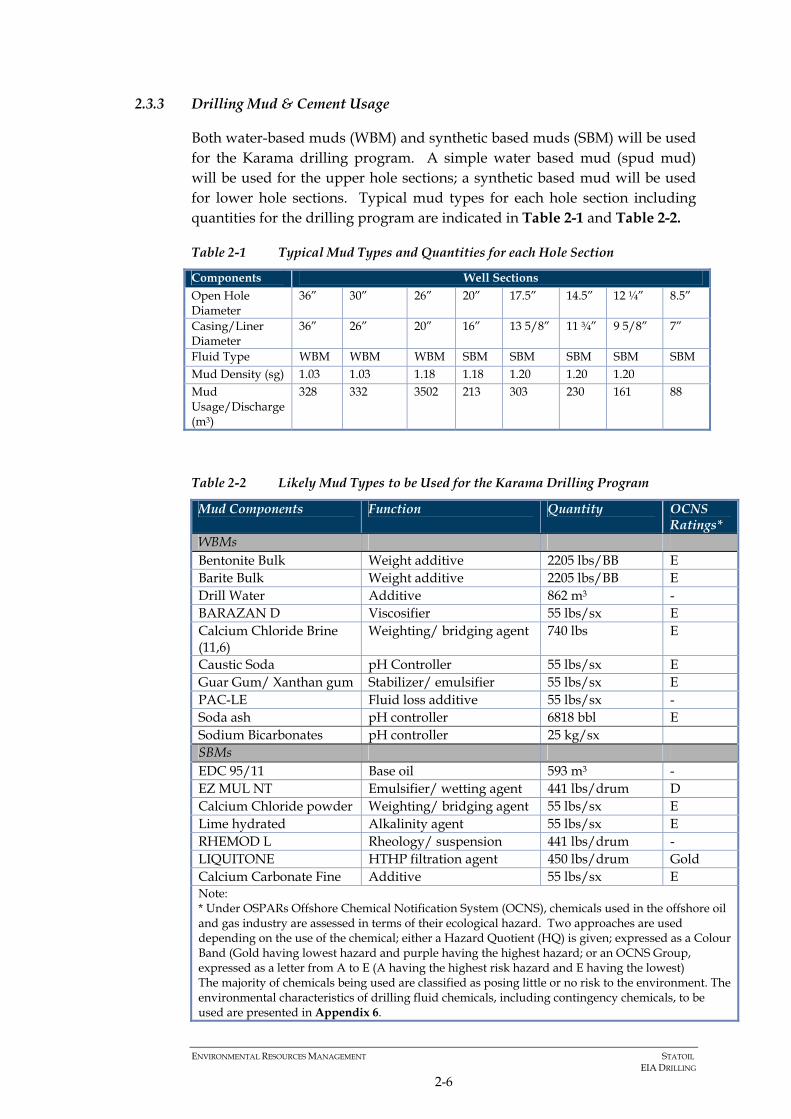
2.3.3 Drilling Mud & Cement Usage
Both water-based muds (WBM) and synthetic based muds (SBM) will be used for the Karama drilling program. A simple water based mud (spud mud) will be used for the upper hole sections; a synthetic based mud will be used for lower hole sections. Typical mud types for each hole section including quantities for the drilling program are indicated in Table 2-1 and Table 2-2.
Table 2-1 Typical Mud Types and Quantities for each Hole Section
Components Well Sections Open Hole Diameter
36” 30” 26” 20” 17.5” 14.5” 12 ¼” 8.5”
Casing/Liner Diameter
36” 26” 20” 16” 13 5/8” 11 ¾” 9 5/8” 7”
Fluid Type WBM WBM WBM SBM SBM SBM SBM SBM Mud Density (sg) 1.03 1.03 1.18 1.18 1.20 1.20 1.20 Mud Usage/Discharge (m3)
328 332 3502 213 303 230 161 88
Table 2-2 Likely Mud Types to be Used for the Karama Drilling Program
Mud Components Function Quantity OCNS Ratings*
WBMs Bentonite Bulk Weight additive 2205 lbs/BB E Barite Bulk Weight additive 2205 lbs/BB E Drill Water Additive 862 m3 - BARAZAN D Viscosifier 55 lbs/sx E Calcium Chloride Brine (11,6)
Weighting/ bridging agent 740 lbs E
Caustic Soda pH Controller 55 lbs/sx E Guar Gum/ Xanthan gum Stabilizer/ emulsifier 55 lbs/sx E PAC-LE Fluid loss additive 55 lbs/sx - Soda ash pH controller 6818 bbl E Sodium Bicarbonates pH controller 25 kg/sx SBMs EDC 95/11 Base oil 593 m3 - EZ MUL NT Emulsifier/ wetting agent 441 lbs/drum D Calcium Chloride powder Weighting/ bridging agent 55 lbs/sx E Lime hydrated Alkalinity agent 55 lbs/sx E RHEMOD L Rheology/ suspension 441 lbs/drum - LIQUITONE HTHP filtration agent 450 lbs/drum Gold Calcium Carbonate Fine Additive 55 lbs/sx E Note: * Under OSPARs Offshore Chemical Notification System (OCNS), chemicals used in the offshore oil and gas industry are assessed in terms of their ecological hazard. Two approaches are used depending on the use of the chemical; either a Hazard Quotient (HQ) is given; expressed as a Colour Band (Gold having lowest hazard and purple having the highest hazard; or an OCNS Group, expressed as a letter from A to E (A having the highest risk hazard and E having the lowest) The majority of chemicals being used are classified as posing little or no risk to the environment. The environmental characteristics of drilling fluid chemicals, including contingency chemicals, to be used are presented in Appendix 6.

ENVIRONMENTAL RESOURCES MANAGEMENT STATOIL EIA DRILLING
2-7
During SBM drilling, the drilling mud is circulated in a closed loop system which recycles the drilling fluid and removes the drilling wastes (cuttings). During drilling, the returns from downhole (mud and cuttings) are routed to the solids control system (shaleshakers, sand trap, hydrocyclones, centrifuge etc.) which physically separate the drill cuttings and sand from the drilling mud. SBM drill mud is collected for re-conditioning and reuse whilst the separated cuttings are discharged overboard.
Cement is usually prepared on board the drill rig in marginally greater quantity than is expected to be required. Any left-over cement is typically discharged overboard. It is estimated that approximately 421 m3 of cement will be used for each well. During the casing of the 26” hole section, surplus cement (~ 15 m3) will be released directly into the sea at seabed level from the top of the well. There will be no planned discharge from the other sections of the well.
2.3.4 Cuttings & Mud Disposal
Top-hole drilling will be conducted using seawater and Hi–Vis Sweeps (WBM). During drilling of the 36” and 30” top-hole section, drill cuttings and WBM will be discharged directly onto the seabed. Once the section is complete and the 36” conductor and 26” casing set, mud and cuttings will be periodically disposed into the sea through a discharge chute located ~ 12 m below the water surface.
SBMs will be used to drill the remainder of the well. During SBM drilling, a closed system will be used whereby the mud and cuttings are separated on board the drill ship, by routing returns from downhole (mud and cuttings) to the solid control system which physically separate the drill cuttings and sand from the drilling mud. Once separated, the cuttings will be dried (to about 30 -50 g/kg oil content or 3 - 5%) in a separate cuttings dryer system and disposed of overboard through the discharge chute. The muds will be reused and once drilling is complete the muds will be returned to the POSB at Balikpapan for storage.
Estimated quantities of drill cuttings and muds generated during exploration drilling are provided in Section 2.6.
2.3.5 Well Testing and Clean Up
No testing of the wells is currently planned.
2.3.6 Well Abandonment
The wells will be permanently plugged with cement after drilling according to Statoil requirements and Indonesian legislations. This includes the following:

ENVIRONMENTAL RESOURCES MANAGEMENT STATOIL EIA DRILLING
2-8
• Cement plugs with a minimum length of 100 m will be set to isolate hydrocarbon bearing and / or permeable zones in open hole;
• Cement plugs will extend a minimum of 50 m from the top of the permeable zone and upwards, or 50 m from the potential flow point and upwards; and
• The cementing of perforated intervals will be evaluated where there exists the possibility of undesirable cross flow from the perforations or poor annular cementation directly above the perforations.
The wellheads will however remain in place; ie 2 m above seabed or to leave the wellheads on the seafloor, the wellheads, casing, piling and other obstructions will be removed to a depth of 4.6 m below the seafloor and all obstructions removed.
2.3.7 Supply, Support Logistics
Personnel will be transferred to the drill ship by Helicopter (which can take 10 passengers at a time) from the POSB at Balikpapan. Approximately 2 flights a day are expected (during the day only; night trips will only be conducted in an emergency).
The drill ship will be supported by two (2) PSVs and one (1) fast boat. It is estimated that six (6) supply trips per week will be required to transport materials and supplies from Balikpapan to the drill ship. Supplies (eg. diesel fuel, drill water, etc) required throughout drilling operations will be supplied from the POSB.
Typical vessel and manning requirements during drilling are summarized in Table 2-3.
Table 2-3 Vessel & Manning Requirements during Drilling
Vessel Requirements
No. of People on Board
Fuel Consumption Total Duration of Operation [Note 1] (Days)
Drill Rig 140 max 63 m3/ day (during transit to drill locations) 40 m3/ day during drilling
165
2 x PSVs 20 (10 each) 10 tonnes/ day 6 trips per week 1 x Fast Boat 8 10 tonnes/ day 165 Notes: [1] For all three wells, including mobilization/ demobilization
2.4 DRILL SHIP SPECIFICATIONS
Drill ships are special purpose - built ships which consist of all the equipment that you would find on a conventional drilling rig. A summary of the principal drill ship specifications is provided below and summarized in the following subsections:

ENVIRONMENTAL RESOURCES MANAGEMENT STATOIL EIA DRILLING
2-9
• Storage facilities for drill water, potable water, fuel oil, liquid mud, sack storage, bulk materials and cement;
• Drilling equipment consisting of a derrick, rotary table, top drive, drawworks, mud pumps, pipe handling system, solids controls, blowout preventor (BOP) stack, well control systems and equipment;
• Four cranes for materials handling (two rated at 65 tons and two at 25 tonnes capacity);
• Flare boom attachment positions for well test flaring operations; and
• Electrical power generation system – nine diesel fuel engines and one diesel emergency generator set.
2.4.1 Storage facilities
A summary of storage facilities provided on the GSF Explorer is shown in Table 2-4.
Table 2-4 Bulk Storage Facilities
Material Storage Capacity Fuel (diesel) 48,380 bbls Drilling mud 1,429 bbls (active system), 4,800 bbls (reserve system) Base oil 1, 618 bbls Sack storage 7,000 sx Bulk (barite/ bentonite) 36,000 cubic feet: 10 tanks (3,600 cubic feet each) Cement 11,130 cubic feet: 6 tanks (1,855 cubic feet each)
2.4.2 Electrical Power Generation
The main power generation system consists of nine diesel generators (five at 4900 HP and four at 3070 HP). Fuel consumption is about 40 m3/day during drilling operations (including on standby). Diesel will be supplied from the POSB.
An emergency diesel engine driven generator is also provided to power essential loads during abnormal operations.
2.4.3 Cooling Water and Drilling Water Supply
Seawater will be used for cooling the ship engines while drill water will be supplied from the POSB at Balikpapan.
2.4.4 Sewage Treatment
All grey water (includes laundry, kitchen, bathroom faucets, baths and showers) generated on board the drill ship will not pass the Omnipure but will be discharged overboard into the sea.

ENVIRONMENTAL RESOURCES MANAGEMENT STATOIL EIA DRILLING
2-10
Toilets flushing water in the Explorer Drilling Ship get its water directly from sea water suplly line. Black water (i.e. waste water from toilets) will be treated in the Omnipure. The treated balck water will be discharged directly overboard into the sea .
2.4.5 Drainage System
Areas that contain oil will be drained to a storage tank for shipment to and disposal on shore. Rainwater in clean areas will be drained into the sea.
2.5 DRILLING SCHEDULE
Exploration drilling activities are proposed to begin in early January to February for the first and second well, and in July 2011 for the third well. It is estimated that the drilling of each well will take approximately < 60 days. The estimated duration of drilling for each well is provided in Table 2-5.
Table 2-5 Proposed Drilling Schedule
Activity Duration (days)* Drilling of well 1 54 Drilling of well 2 56 Drilling of well 3 55 Total 165 Note: * Includes mobilization/ transit to each well
2.6 EMISSIONS, DISCHARGES, WASTE & NOISE EMISSIONS
This section provides an estimated inventory of air emissions, discharges to sea and wastes generated during key project activities. It should be noted that emissions and discharge data should be taken to be indicative and preliminary in nature. Assumptions, where used, have been made on a conservative basis.
2.6.1 Air Emissions
The principal emissions to atmosphere during exploration drilling will comprise products of combustion discharged from the power generation equipment on the drill ship. Other air emission sources will include:
• Supply and support vessel exhausts;
• Helicopter flights;
• Fugitive emissions of hydrocarbons from a range of sources including fuel bunkering/ transfer operations, drill mud de-gassing etc.
• Particulate (dust) emissions during bulk materials transfer operations (eg. barite, cement etc. loading) from the bulk handling system vents;
ENVIRONMENTAL RESOURCES MANAGEMENT STATOIL EIA DRILLING
2-11
• Releases of ozone depleting substances (ODS) during maintenance of HVAC systems as well as from fugitive sources associated with such equipment.
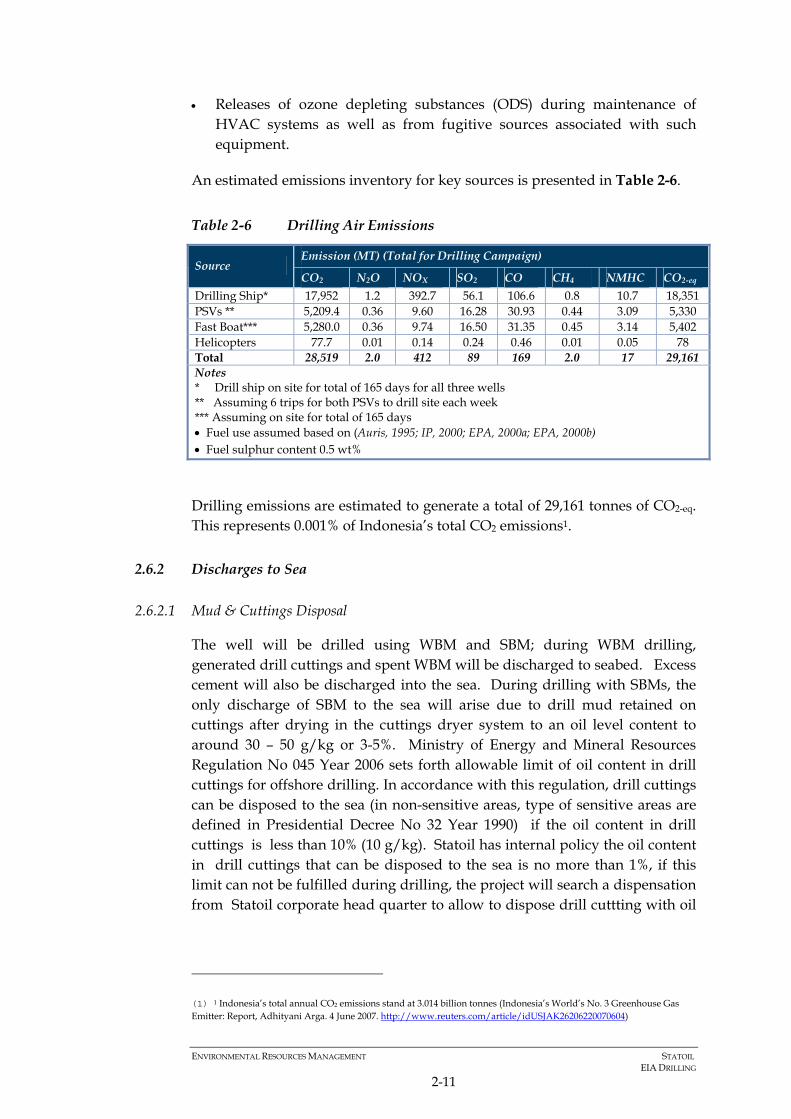
An estimated emissions inventory for key sources is presented in Table 2-6.
Table 2-6 Drilling Air Emissions
Emission (MT) (Total for Drilling Campaign) Source
CO2 N2O NOX SO2 CO CH4 NMHC CO2-eq Drilling Ship* 17,952 1.2 392.7 56.1 106.6 0.8 10.7 18,351 PSVs ** 5,209.4 0.36 9.60 16.28 30.93 0.44 3.09 5,330 Fast Boat*** 5,280.0 0.36 9.74 16.50 31.35 0.45 3.14 5,402 Helicopters 77.7 0.01 0.14 0.24 0.46 0.01 0.05 78 Total 28,519 2.0 412 89 169 2.0 17 29,161 Notes * Drill ship on site for total of 165 days for all three wells ** Assuming 6 trips for both PSVs to drill site each week *** Assuming on site for total of 165 days • Fuel use assumed based on (Auris, 1995; IP, 2000; EPA, 2000a; EPA, 2000b) • Fuel sulphur content 0.5 wt%
Drilling emissions are estimated to generate a total of 29,161 tonnes of CO2-eq. This represents 0.001% of Indonesia’s total CO2 emissions1.
2.6.2 Discharges to Sea
2.6.2.1 Mud & Cuttings Disposal
The well will be drilled using WBM and SBM; during WBM drilling, generated drill cuttings and spent WBM will be discharged to seabed. Excess cement will also be discharged into the sea. During drilling with SBMs, the only discharge of SBM to the sea will arise due to drill mud retained on cuttings after drying in the cuttings dryer system to an oil level content to around 30 – 50 g/kg or 3-5%. Ministry of Energy and Mineral Resources Regulation No 045 Year 2006 sets forth allowable limit of oil content in drill cuttings for offshore drilling. In accordance with this regulation, drill cuttings can be disposed to the sea (in non-sensitive areas, type of sensitive areas are defined in Presidential Decree No 32 Year 1990) if the oil content in drill cuttings is less than 10% (10 g/kg). Statoil has internal policy the oil content in drill cuttings that can be disposed to the sea is no more than 1%, if this limit can not be fulfilled during drilling, the project will search a dispensation from Statoil corporate head quarter to allow to dispose drill cuttting with oil
(1) 1 Indonesia’s total annual CO2 emissions stand at 3.014 billion tonnes (Indonesia’s World’s No. 3 Greenhouse Gas Emitter: Report, Adhityani Arga. 4 June 2007. http://www.reuters.com/article/idUSJAK26206220070604)

ENVIRONMENTAL RESOURCES MANAGEMENT STATOIL EIA DRILLING
2-12
content higher than 1% but no more than 10% to the sea; if not the drill cutttings will be transported to shorebase in Balikpapan for further process.
The estimated volumes of cuttings discharged are indicated in Table 2-7.
Table 2-7 Estimated Volumes of Cuttings Discharged
Components Estimated Cuttings Volume for each Well Section Open Hole Diameter
36” 30” 26” 20” 17.5” 13.25” 12.25”
8.5” 6”
Fluid Type WBM WBM WBM SBM SBM SBM SBM SBM SBM Cuttings discharge (m3)
66 151 1 71 78 53 30 15 5
Total (m3) 218 252
2.6.2.2 Cement Disposal
Cement is usually prepared on board the drill rig in marginally greater quantity than is expected to be required. Left-over cement is typically discharged overboard. The estimated volume of cement to be used and discharged from the Karama drilling programme is:
Components Estimated Cement Volume for each Well Section Open Hole Diameter (“)
36 30 26 20 17.5 13.25 12.25 8.5 6
Cement Volume to be used (m3)
48 (base), 59 (down hole)
221 (base), 20
47 26 - - - - -
Excess cement (%) 200 100 & 20 30 30 - - - - - Excess cement (m3) 214 225 14.1 7.8 - - - - -
2.6.2.3 Wastewater Discharges
Other discharges to sea from the drill ship, standby and support vessels will comprise bilge water, cooling water, deck drainage, sewage and grey water (eg laundry/showers etc.). Indicative sewage and domestic wastewater discharge rates for typical offshore operations are presented in Table 2-8.
Table 2-8 Estimated Volumes of Operational Discharges to Sea
Discharges to Sea (m3) Type of Vessel Duration No. of Personnel
Onboard Domestic Effluent (Grey Water)
Sewage (Black Water)
1 X Drill ship 165 140 2,541 1,733 2 X PSVs 141 20 310 212 1 X Fast Boat 165 8 145 99 Total 168 2,996 2,043 Data Sources/ Assumptions: Domestic effluent generation rate 0.11 m3/person/day Sewage generation rate 0.075 m3/person/day

ENVIRONMENTAL RESOURCES MANAGEMENT STATOIL EIA DRILLING
2-13
2.6.3 Hazardous and Non-hazardous Waste Generation
Drilling activities generate a variety of non-hazardous and hazardous wastes. A waste handling and storage procedure is implemented on board the GSF Explorer and, with the exception of grey water, kitchen wastes and drilling waste (drill cuttings) which will be treated and disposed of into the sea, all other waste types will be returned to shore for disposal.
A list of typical wastes potentially generated during drilling is presented in Table 2-9.
Table 2-9 Typical Development Drilling Wastes
Non-hazardous • Galley (food) waste • Garbage (paper, packaging, rags, plastic, glass) • Wooden crates, pallets and timber cuts • Sacks and bags • Containers and drums (metal & plastic) • Scrap metal (ferrous & non-ferrous) Hazardous • Drums & containers contaminated with oil, chemicals etc. • Lube oil, grease, hydraulic fluids • Paints, thinners and coating products • Solvents and de-greasers • Slop oil (oil/water mixture) • Oily rags and other inert oil contaminated materials • Off-spec chemicals
2.6.4 Noise
Noise emissions associated with the project will be generated by the drill ship, support and supply vessels. Helicopter flights will also be a further source of transient noise.
Drill ship noise will be generated by the ships engines, propellers and thrusters, power generation equipment, pumps, shale shakers, draw-works, hydraulic power packs, cranes, air compressors etc.). Noise from support shipping (ie. the PSVs and fast boat) will be generated by the engines, propellers and thrusters.
Noise level generated by using dynamic positioning is indicated at 196 dB/1mPa at frequencies between 20 – 25 kHz. Indicative underwater noise frequencies, source levels and attenuation levels associated with a drill ship are presented in Table 2-10. For comparison sake, noise frequencies, source levels and attenuation levels for other offshore activities are also listed.
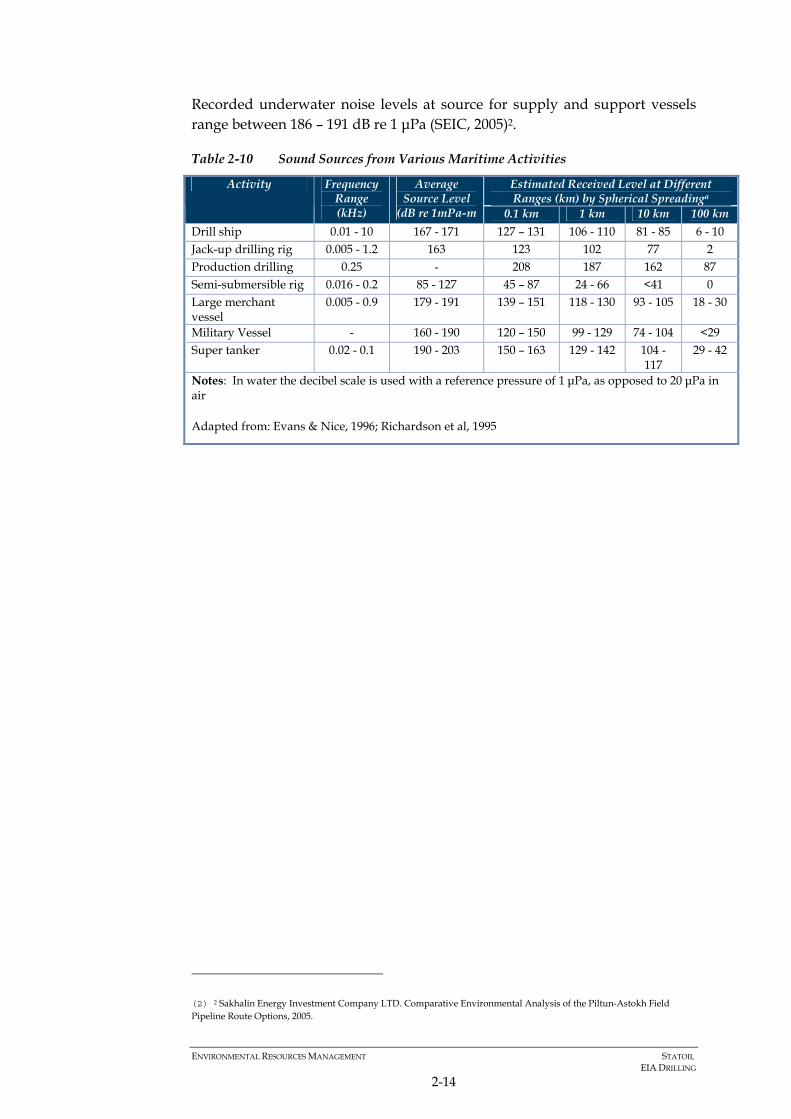
ENVIRONMENTAL RESOURCES MANAGEMENT STATOIL EIA DRILLING
2-14
Recorded underwater noise levels at source for supply and support vessels range between 186 – 191 dB re 1 μPa (SEIC, 2005)2.
Table 2-10 Sound Sources from Various Maritime Activities
Estimated Received Level at Different Ranges (km) by Spherical Spreadinga
Activity Frequency Range (kHz)
Average Source Level
(dB re 1mPa-m 0.1 km 1 km 10 km 100 km Drill ship 0.01 - 10 167 - 171 127 – 131 106 - 110 81 - 85 6 - 10 Jack-up drilling rig 0.005 - 1.2 163 123 102 77 2 Production drilling 0.25 - 208 187 162 87 Semi-submersible rig 0.016 - 0.2 85 - 127 45 – 87 24 - 66 <41 0 Large merchant vessel
0.005 - 0.9 179 - 191 139 – 151 118 - 130 93 - 105 18 - 30
Military Vessel - 160 - 190 120 – 150 99 - 129 74 - 104 <29 Super tanker 0.02 - 0.1 190 - 203 150 – 163 129 - 142 104 -
117 29 - 42
Notes: In water the decibel scale is used with a reference pressure of 1 μPa, as opposed to 20 μPa in air
Adapted from: Evans & Nice, 1996; Richardson et al, 1995
(2) 2 Sakhalin Energy Investment Company LTD. Comparative Environmental Analysis of the Piltun-Astokh Field Pipeline Route Options, 2005.

ENVIRONMENTAL RESOURCES MANAGEMENT STATOIL EIA DRILLING
3-1
3 CHARACTERIZATION OF THE INFLUENCED AREA
3.1 PETROSEA OFFSHORE SUPPLY BASE (POSB)
PSOB is located in and as part of the integrated Tanjung Batu Harbour in Balikpapan. This area is far from the residential area and has had an Integrated AMDAL and Environmental-based Development Feasibility Study by Ministry of Environment Decree No. 545/2007 for Offshore Supply Base activities.
PSOB is located far from the residential area therefore it will be likely less interaction with the community in Balikpapan. In terms of environmental impacts, it will be into the operational mode when drilling activities occurs in Karama Blocks. This will include liquid mud plant operation, tubular maintenance and harbour operation. Most of the activities are conducted within the supply base accept to those of shipping operations to Karama Block.
All environmental impacts will be managed and monitor within the supply base in Balikpapan. Petrosea has developed standard operation procedure for environmental management to be enacted to ensure that the POSB meets contractual, legal and environmental requirements. Further, this is also to meet the requirements of ISO 14001:2004 which include the need of continual improvements. These SOPs include: Waste Management Procedure (POSB-HSE-PR-G-0005), Environmental Management Plan for Tanjung Batu Supply Base (POSB-HSE-PL-G-0002) and POSB Waste Management Plan (POSB-HSE-PL-G-0002).
The environmental and social components baseline of the area excerpted from Integrated AMDAL of PSOB document, are as follow:
3.1.1 Climate
Data on climatic conditions in the Balikpapan during the period from 2000 to 2005 was obtained from the Meteorological and Geo-physics station of Sepinggan, Balikpapan City. Data includes temperature, humidity, rainfall and wind speed and direction. The data shows that this region has a tropical climate of A type, with average rainfall > 204.8 mm/month.
3.1.1.1 Air Temperature
The highest average temperature occurred in April – May, accounting for 34.5oC and minimum air temperature occurs in August, with the average of 21.4oC. The increase trend of temperature by year, is predicted as the result of development, land clearing and illegal logging throughout Kalimantan.
ENVIRONMENTAL RESOURCES MANAGEMENT STATOIL EIA DRILLING
3-2
3.1.1.2 Humidity
In Balikpapan, the humidity is influenced by degree of evaporation caused by hot air stream from sea surface or coast. Based on data from Sepinggan Meteorological Station for period 2000-2005, the average humidity fluctuates between 55% to 97% where the lowest occured in April and the highest is in November.
3.1.1.3 Rainfall
The highest rainfall occured from September to January, with the monthly average of 252.2 mm while the lowest occured in July with 160.7 mm in average. The daily fluctuations may vary between one month to the other month.
3.1.1.4 Wind speed and direction
Wind speed and direction in Balikpapan varies, depending on monsoon and temporal condition (night or day). Wind data from Balikpapan Meteorological and Go-physics Station during 2000-2005 showed in general, during rainy season, the wind blows from North-West for Southeast direction while on dry season is mostly to Northeast direction. The highest wind absolute velocity occured in May 2003 with 50 knots while the slowest of 14 knots, occured in April 2003. Speed and wind direction pattern affect the monthly water flow movement in the Makassar Strait.
3.1.1.5 Bathymetry
The Tanjung Batu waters in Balikpapan Bay has a moderate slope os shallow water until 0,5 mile and reaching 3 m deep in 0.6 mile from nearshore, followed by 6-12 m deep at the range of 1 mile from shore. The depth is relatively stable as the result of low sedimentation, represented by granite boulders on the seabed and water clarity within 1 mile radius from shore.
3.1.1.6 Tide
Based on Balikpapan Port Authority analysis in 1984 (Stage II: Rehabilitation of Balikpapan No. l Terminal) shows that the highest tide is 267 cm and the lowest was 5 cm. the average of sea mean level during the observation was 135 cm. The analysis result also shows that Tanjung Batu waters has a mix tide type with semidiurnal prevailing. High tide occurs twice in a day with different range. Mean sea level was 1.40 m above the ebb line and high water spring happens 2.8 m above the ebb line.
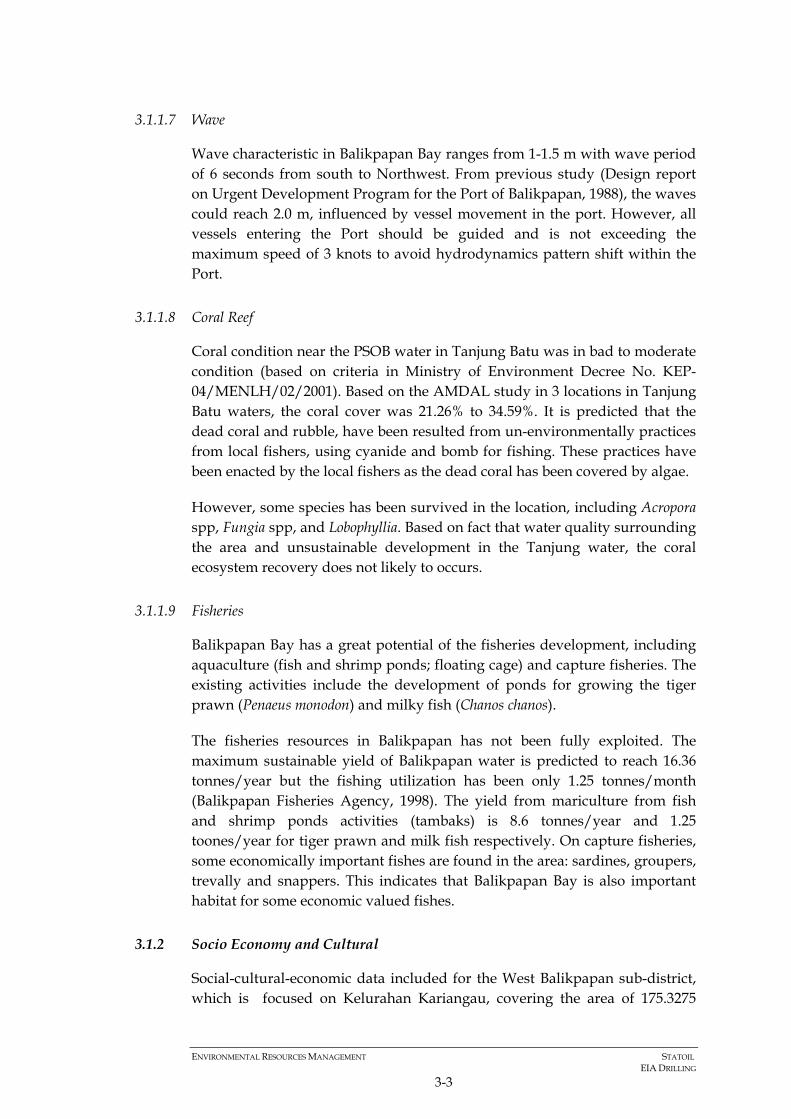
ENVIRONMENTAL RESOURCES MANAGEMENT STATOIL EIA DRILLING
3-3
3.1.1.7 Wave
Wave characteristic in Balikpapan Bay ranges from 1-1.5 m with wave period of 6 seconds from south to Northwest. From previous study (Design report on Urgent Development Program for the Port of Balikpapan, 1988), the waves could reach 2.0 m, influenced by vessel movement in the port. However, all vessels entering the Port should be guided and is not exceeding the maximum speed of 3 knots to avoid hydrodynamics pattern shift within the Port.
3.1.1.8 Coral Reef
Coral condition near the PSOB water in Tanjung Batu was in bad to moderate condition (based on criteria in Ministry of Environment Decree No. KEP-04/MENLH/02/2001). Based on the AMDAL study in 3 locations in Tanjung Batu waters, the coral cover was 21.26% to 34.59%. It is predicted that the dead coral and rubble, have been resulted from un-environmentally practices from local fishers, using cyanide and bomb for fishing. These practices have been enacted by the local fishers as the dead coral has been covered by algae.
However, some species has been survived in the location, including Acropora spp, Fungia spp, and Lobophyllia. Based on fact that water quality surrounding the area and unsustainable development in the Tanjung water, the coral ecosystem recovery does not likely to occurs.
3.1.1.9 Fisheries
Balikpapan Bay has a great potential of the fisheries development, including aquaculture (fish and shrimp ponds; floating cage) and capture fisheries. The existing activities include the development of ponds for growing the tiger prawn (Penaeus monodon) and milky fish (Chanos chanos).
The fisheries resources in Balikpapan has not been fully exploited. The maximum sustainable yield of Balikpapan water is predicted to reach 16.36 tonnes/year but the fishing utilization has been only 1.25 tonnes/month (Balikpapan Fisheries Agency, 1998). The yield from mariculture from fish and shrimp ponds activities (tambaks) is 8.6 tonnes/year and 1.25 toones/year for tiger prawn and milk fish respectively. On capture fisheries, some economically important fishes are found in the area: sardines, groupers, trevally and snappers. This indicates that Balikpapan Bay is also important habitat for some economic valued fishes.
3.1.2 Socio Economy and Cultural
Social-cultural-economic data included for the West Balikpapan sub-district, which is focused on Kelurahan Kariangau, covering the area of 175.3275

ENVIRONMENTAL RESOURCES MANAGEMENT STATOIL EIA DRILLING
3-4
km2, as this village is adjacent to the POSB and Tanjung Batu Port. In general, the Kariangau villagers earn the living from fishing, farming and servicing.
3.1.2.1 Demography
The Balikpapan Barat monographs (2006) reported the population of Kariangau was 3.050 people, living in most of the 97% of this sub district area. Residence density was the lowest from all subdistricts in Balikpapan, accounting for 17 people/km2. Household composition is on the average of 4 people per family, i.e father, mother and 2 children.
Sex ratio in this Subdistrict is dominated by man with the percentage of 100 to 117,70. The productive age is 82% of the population, representing that 33 of non productive person is under responsibility of 152 productive workers.
Ethnic composition are dominated by Bugis-Makasarese, Torajan and Butonese and some are Javanaese. The people from Sulawesi are mostly working as workers in logging companies while the Javanese are more into servicing activities, such as opening restaurants and as traders.
3.1.2.2 Economic Activities
Livelihood of local community in Balikpapan Barat sub district are mostly fisherman, followed by government employee and labour at port. Few of them are working in Army and in private sectors. Most of the village dweller are highly dependent on the local natural resources as part of their economic activities. This can be shown in the composition of the villagers: fisherman 28% and farmer, aquaculture fisher, seaweed farmer are 2% each; while labour and army are 6% and 2% respectively, from the total dwellers. Unemployment in this subdistrict is categorized the lowest, accounted for 16% of the total population.
The fisheries activities, capture and aquaculture, are the major livelihood in Kariangau village, as of 30% of the villagers are still depending on this natural resources. However, this livelihood will be highly impacted due to the development PSOB. In the last 5-10 years, the fishing yield has been declining by 24%, from IDR 19,285,714 to IDR 14,571,285. Interview conducted with the local communities during the PSOB AMDAL study revealed that the decline was as the result of pollution from some industrial activities nearby, combined with high and busy marine traffic in Balikpapan bay. Some exclusive zones by the industries are also limit the resources access. This is worsened by the increase of the fuel price.
3.1.2.3 Community perception
Community perception on the PSOB activities are mostly positive. Based on the surveyed conducted during the AMDAL study showed that 96% of the
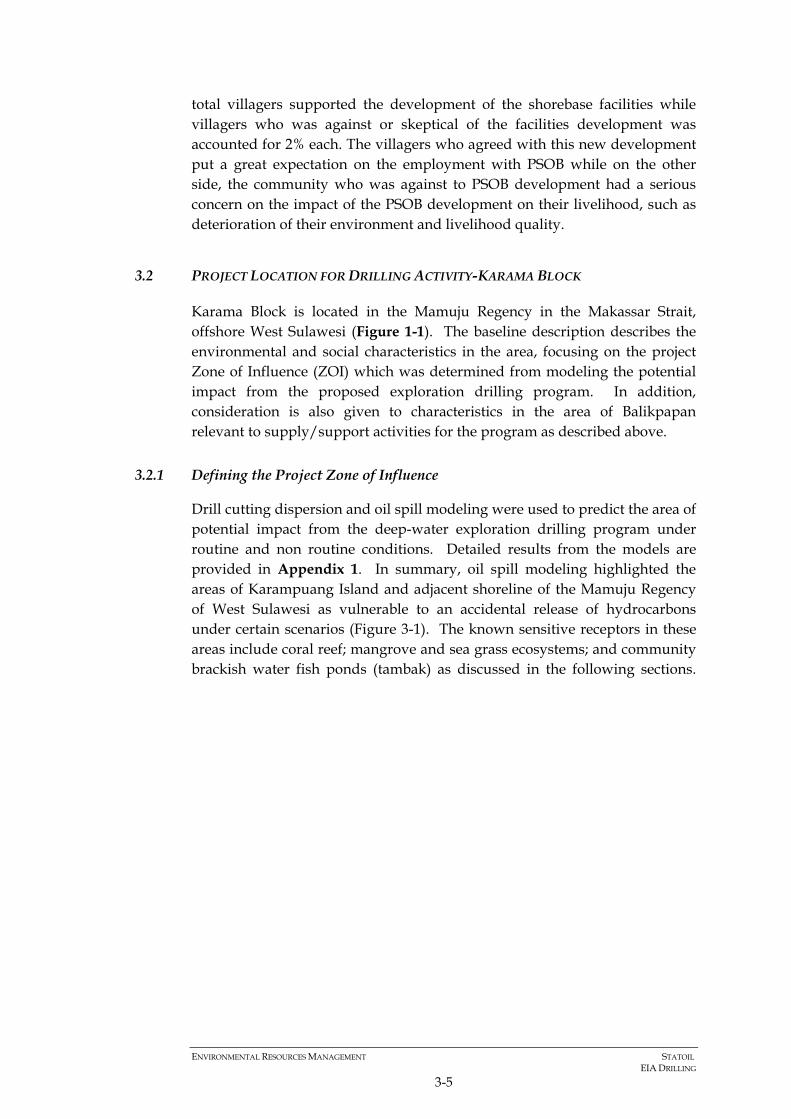
ENVIRONMENTAL RESOURCES MANAGEMENT STATOIL EIA DRILLING
3-5
total villagers supported the development of the shorebase facilities while villagers who was against or skeptical of the facilities development was accounted for 2% each. The villagers who agreed with this new development put a great expectation on the employment with PSOB while on the other side, the community who was against to PSOB development had a serious concern on the impact of the PSOB development on their livelihood, such as deterioration of their environment and livelihood quality.
3.2 PROJECT LOCATION FOR DRILLING ACTIVITY-KARAMA BLOCK
Karama Block is located in the Mamuju Regency in the Makassar Strait, offshore West Sulawesi (Figure 1-1). The baseline description describes the environmental and social characteristics in the area, focusing on the project Zone of Influence (ZOI) which was determined from modeling the potential impact from the proposed exploration drilling program. In addition, consideration is also given to characteristics in the area of Balikpapan relevant to supply/support activities for the program as described above.
3.2.1 Defining the Project Zone of Influence
Drill cutting dispersion and oil spill modeling were used to predict the area of potential impact from the deep-water exploration drilling program under routine and non routine conditions. Detailed results from the models are provided in Appendix 1. In summary, oil spill modeling highlighted the areas of Karampuang Island and adjacent shoreline of the Mamuju Regency of West Sulawesi as vulnerable to an accidental release of hydrocarbons under certain scenarios (Figure 3-1). The known sensitive receptors in these areas include coral reef; mangrove and sea grass ecosystems; and community brackish water fish ponds (tambak) as discussed in the following sections.

ENVIRONMENTAL RESOURCES MANAGEMENT STATOIL EIA DRILLING
3-6
Figure 3-1 Project Zone of Influence)

ENVIRONMENTAL RESOURCES MANAGEMENT STATOIL EIA DRILLING
3-7
3.2.2 Meteorology
Climate data is provided for the Mamuju Regency. Average temperature is 25-28°C where the maximum temperature ranges from 31 to 34°C and the minimum temperature ranges from 20 to 24°C (Mamuju in Numbers, 2008).
The area has a high occurrence of rainfall with only 0-2 dry months a year. Rainfall levels are highest from November to March with average rainfall is 4,000 mm, while from June to October average rainfall is 1,400 mm. Average humidity of the Mamuju Regency is between 75 to 80% (West Sulawesi in Numbers, 2005-2006).
Local meteorological data (winds) were obtained from the Asia Pacific Data Research Center (APDRC) for coordinates 118.6° E Longitude, 2.1º S Latitude. While both March and October had significant winds from the east and west, wind rose diagrams (Figure 3-2) showed an additional strong influence of winds from the southwest in March 2008 and from the northeast in October. Average wind velocity ranges from 5 to 16 km/hour. Maximum wind velocity is typically 29-67 km/hour.
3.2.3 Tectonics and Geology
The Makassar Strait occupies the continental shelf, slope and rise areas between the islands of Kalimantan and Sulawesi, forming a distinct physiographic border between the western Indonesia landmass and the eastern Indonesia archipelago. The strait is roughly 100–200 km wide and 300 km long.
The Makassar Strait is bounded towards the north by a long lateral fault (the Palu-Koro fault), which separates this basin from the Sulawesi sea. The Makassar Strait is divided into the North Makassar and South Makassar basin by another lateral fault (Paternoster fault). The occurrence of these two faults is clearly reflected by the steep gradients indicated by the bathymetric contours. A thick sequence of relatively undisturbed Neogene and probably Paleogene sediments showing good lateral continuity were deposited in the basin (Darman, 2000).
3.2.4 Oceanography
The Makassar Straits are the main passage in the transfer of water and heat from the Pacific to the Indian Ocean, via the Indonesian seas. This transfer of Pacific water into the Indian Ocean through the Indonesian seas affects the heat and freshwater budgets of both oceans as well as having an effect on global climate (Ffield, et al., 2000).
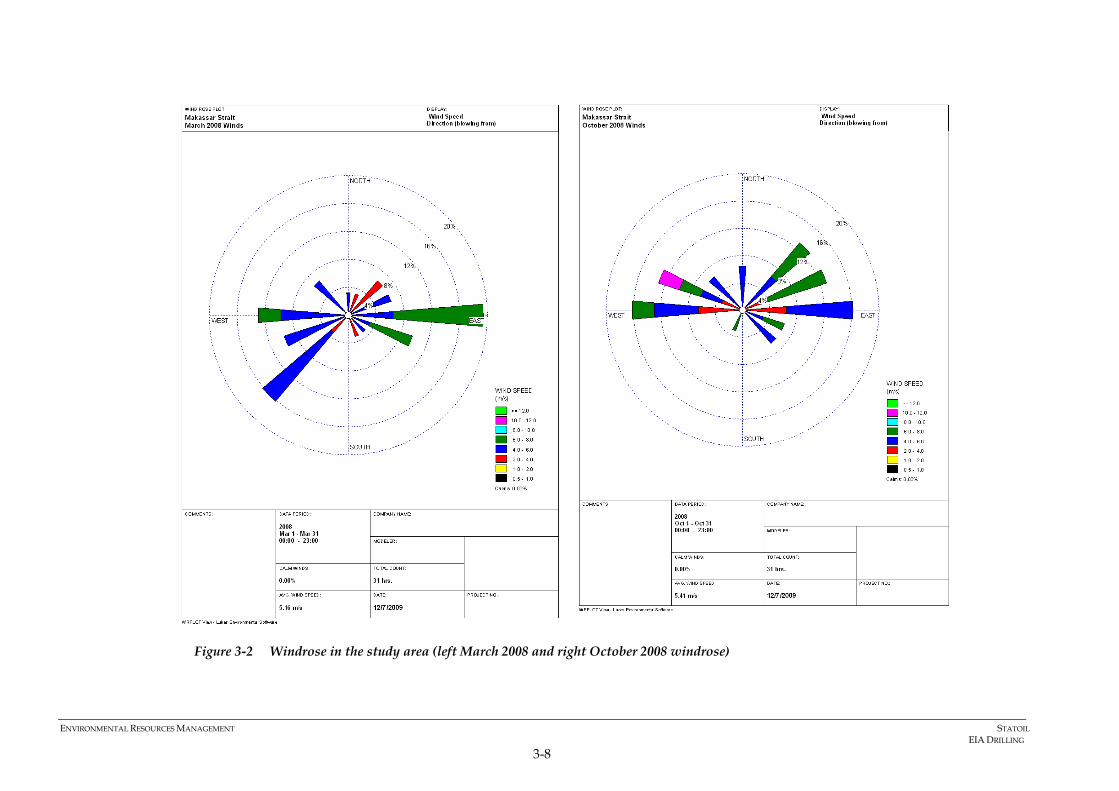
ENVIRONMENTAL RESOURCES MANAGEMENT STATOIL EIA DRILLING
3-8
Figure 3-2 Windrose in the study area (left March 2008 and right October 2008 windrose)
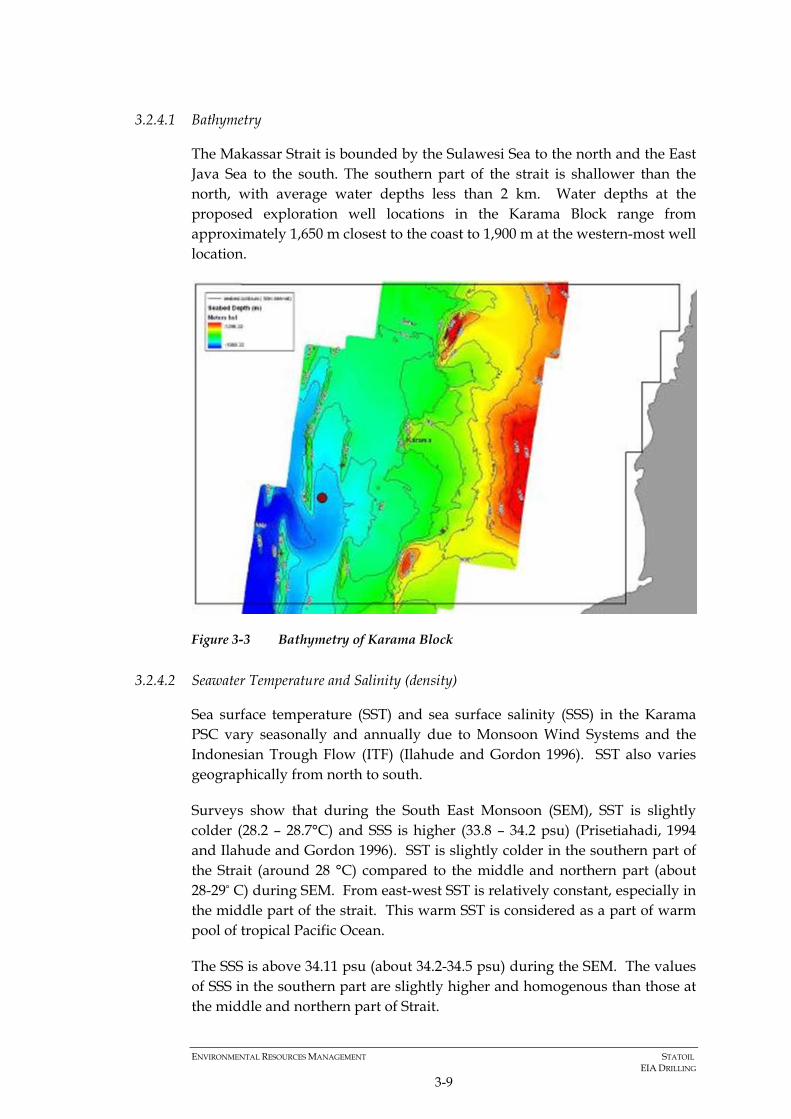
ENVIRONMENTAL RESOURCES MANAGEMENT STATOIL EIA DRILLING
3-9
3.2.4.1 Bathymetry
The Makassar Strait is bounded by the Sulawesi Sea to the north and the East Java Sea to the south. The southern part of the strait is shallower than the north, with average water depths less than 2 km. Water depths at the proposed exploration well locations in the Karama Block range from approximately 1,650 m closest to the coast to 1,900 m at the western-most well location.
Figure 3-3 Bathymetry of Karama Block
3.2.4.2 Seawater Temperature and Salinity (density)
Sea surface temperature (SST) and sea surface salinity (SSS) in the Karama PSC vary seasonally and annually due to Monsoon Wind Systems and the Indonesian Trough Flow (ITF) (Ilahude and Gordon 1996). SST also varies geographically from north to south.
Surveys show that during the South East Monsoon (SEM), SST is slightly colder (28.2 – 28.7°C) and SSS is higher (33.8 – 34.2 psu) (Prisetiahadi, 1994 and Ilahude and Gordon 1996). SST is slightly colder in the southern part of the Strait (around 28 °C) compared to the middle and northern part (about 28-29° C) during SEM. From east-west SST is relatively constant, especially in the middle part of the strait. This warm SST is considered as a part of warm pool of tropical Pacific Ocean.
The SSS is above 34.11 psu (about 34.2-34.5 psu) during the SEM. The values of SSS in the southern part are slightly higher and homogenous than those at the middle and northern part of Strait.

ENVIRONMENTAL RESOURCES MANAGEMENT STATOIL EIA DRILLING
3-10
During the North West Monsoon (NWM), SST is about 0.8°C higher, with values between 29.1 – 30.0° C. As during the SEM, the SST in the southern part of the strait is colder than those at the northern part. The SSS is slightly lower (31.6 - 33.8 psu) during the NEM than those during the SEM (Ilahude and Gordon 1996 and Kusbiandary, 2000). These values are reduced considerably during the NEM, especially in the middle part where SSS is about 2.6 psu less that those during the SEM.
The vertical distribution of temperature and salinity within and around Karama Block, Makassar Strait also varies seasonally. During the SEM, the surface mixed layers extend to 25 to 60 m depth and deeper toward the southern part of the strait. The thermocline is seen from 60 m to depths of 225 to 300 m. The temperatures at these layers decrease from 27°C to 10/12°C. Beyond 300 m water depth temperature decrease slowly to about 6°C at a depth of 1000 m.
Vertical salinity profiles during the SEM show that salinity increases from about 33.8-33.8 psu at the surface to 34.5-34.7 psu at a depth of 100-150 m. Seawater at this depth is believed to be of North Pacific origin and is called North Pacific Subtropical Water (NPSW). Beyond this depth salinity decreases to 34.0- 34.6 psu at 250-450 m (North Pacific Intermediate Water (NPIW)) and approximately 34.5 psu at 1000 m (Wyrtki, 1961; Prisetiahadi, 1994; and Ilahude and Gordon 1996). Indicative vertical temperature and salinity profiles during SEM are depicted in Figure 3-4.
Figure 3-4 Vertical profile at Makassar Strait (a) Temperature (b) Salinity

ENVIRONMENTAL RESOURCES MANAGEMENT STATOIL EIA DRILLING
3-11
During the NWM, the surface mixed layer extends to 50 - 60 m depth and water temperature is 28° C, falling to 12°C in the thermocline layer to 250 m. Below this layer to water depths of 1000m, the temperature falls to 5°C. The vertical profile of salinity during NWM displays a salinity increase to about 34.6-34.8 psu at the depth of 120-200 m (NPSW). Below this depth, salinity displays a minimum value of less than 34.45 psu at a depth of 300-400 m (NPIW) (Wyrtki, 1961, Ilahude and Gordon 1996 and Kusbiandary, 2000).
Horizontal mean monthly SST and SSS within and around Karama Block computed from data for the period 1929 to 2004 (available from NODC, NOAA, USA and JODC, Japan) show similar values. The mean monthly SST around the Karama Block varied from 28°C to 30.3°C and was slightly colder during the SEM than the NWM. Mean monthly SSS are slightly lower during the NWM (January and February) with the values of 30.5 – 33 psu, and slightly higher (32.2 – 34.5 psu) during the SEM (July and August). At both seasons, surface salinity at the Karama Block consistently shows a decrease towards the coast. This may be attributable to river drainage from the land into the nearshore waters.
3.2.4.3 Ocean Currents (Direction and Velocity – Horizontal and Vertical Profile)
The description of Ocean Currents within the Karama Block, Makassar Strait is based on:
• In situ current data set from JODC, Japan from alternate year starting from 1902 to 1997 (JODC, 2009).
• A three year dataset of ocean currents within Labani Channel, a 45 km constriction near 2°52’S (Susanto and Gordon, 2005; Gordon, 2008), approximately 30 nm south-southwest of the center of the Karama block.
• The results of ocean models developed at the US Naval Research Laboratory (NRL, 2009).
Visual observation of horizontal distributions of monthly mean current vectors within Karama Block show that the currents vary in speed and direction temporally and spatially (Table 3-1). The characters of ocean currents in the Makassar Strait and within Karama Block are consistent with the results of Naval Research Laboratory model as mentioned by Gordon (2008). The main flows are mainly toward south-southeast especially in the west of the Karama Block. During certain months such as March and December (see Table 3-1) eddies occur especially at eastern site of Karama Block closed to the coast in which the flows directed toward northeast- north. Such eddies were also found in the results of the US Naval Research Laboratory (NRL, 2009)
The stick plot of the current vector at MAK I (west mooring) measured during Arlindo experiment at Labani Channel is presented in Figure 3-5 (Susanto and Gordon 2005). The length of the stick equates to the value of the

ENVIRONMENTAL RESOURCES MANAGEMENT STATOIL EIA DRILLING
3-12
speed of the current and the angle of the stick measured from the upward vertical line (i.e. north direction) is the direction of the current vector. The speed and direction of the surface currents shown in Figure 3-5 are consistent with those mean monthly surface ocean current presented in Table 3-1. The maximum speed was found at the thermocline layer and current direction was mainly south-southeast to south east.
Figure 3-5 Stick plot of the current vector at several depths at MAK I (west mooring) measured during Arlindo experiment at Labani Channel from July 2005 – June 2006.
Table 3-1 Variation of mean monthly surface current vector within Karama Block from January to December
Month Speed (m/sec)
Direction Description
January 0.1 – 0.2 South, southeast Weaker at coastal side February 0.15 -0.3 South, south-southeast Almost homogeneous spatially March 0.15 – 0.4 South, southeast, east,
northeast, north Eddy counter clockwise, southward at seaside and northward at the coast
April 0.05 – 0.2 Northeast, north-northeast
Irregular motion, very slow in the center
May 0.2 – 0.5 South, south-southeast, south-southwest
Slightly stronger at coastal site
June 0.05 – 0.4 South, west, southwest Stronger southward at coast, weaker in middle west-southwestward
July 0.15 – 0.4 South, southwest Weaker at the sea site
A OS N D J F M A M JJ
A OS N D J F M A M JJ
A OS N D J F M A M JJ
A OS N D J F M A M JJ
A OS N D J F M A M JJ
A OS N D J F M A M JJ
A OS N D J F M A M JJ
0.15 0.2 0.25 0.3 0.35 0.4 0.45 0.5 0.55 0.6 0.65 0.7 0.75 0.8 0.85
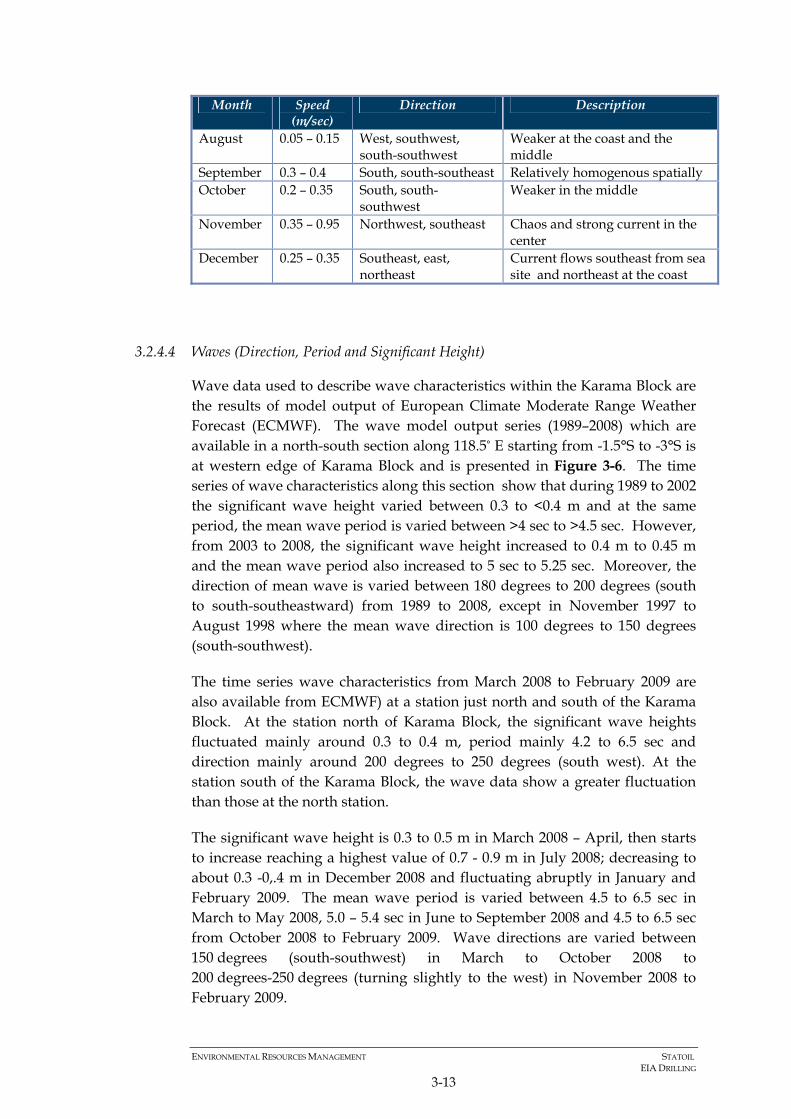
ENVIRONMENTAL RESOURCES MANAGEMENT STATOIL EIA DRILLING
3-13
Month Speed (m/sec)
Direction Description
August 0.05 – 0.15 West, southwest, south-southwest
Weaker at the coast and the middle
September 0.3 – 0.4 South, south-southeast Relatively homogenous spatially October 0.2 – 0.35 South, south-
southwest Weaker in the middle
November 0.35 – 0.95 Northwest, southeast Chaos and strong current in the center
December 0.25 – 0.35 Southeast, east, northeast
Current flows southeast from sea site and northeast at the coast
3.2.4.4 Waves (Direction, Period and Significant Height)
Wave data used to describe wave characteristics within the Karama Block are the results of model output of European Climate Moderate Range Weather Forecast (ECMWF). The wave model output series (1989–2008) which are available in a north-south section along 118.5° E starting from -1.5°S to -3°S is at western edge of Karama Block and is presented in Figure 3-6. The time series of wave characteristics along this section show that during 1989 to 2002 the significant wave height varied between 0.3 to <0.4 m and at the same period, the mean wave period is varied between >4 sec to >4.5 sec. However, from 2003 to 2008, the significant wave height increased to 0.4 m to 0.45 m and the mean wave period also increased to 5 sec to 5.25 sec. Moreover, the direction of mean wave is varied between 180 degrees to 200 degrees (south to south-southeastward) from 1989 to 2008, except in November 1997 to August 1998 where the mean wave direction is 100 degrees to 150 degrees (south-southwest).
The time series wave characteristics from March 2008 to February 2009 are also available from ECMWF) at a station just north and south of the Karama Block. At the station north of Karama Block, the significant wave heights fluctuated mainly around 0.3 to 0.4 m, period mainly 4.2 to 6.5 sec and direction mainly around 200 degrees to 250 degrees (south west). At the station south of the Karama Block, the wave data show a greater fluctuation than those at the north station.
The significant wave height is 0.3 to 0.5 m in March 2008 – April, then starts to increase reaching a highest value of 0.7 - 0.9 m in July 2008; decreasing to about 0.3 -0,.4 m in December 2008 and fluctuating abruptly in January and February 2009. The mean wave period is varied between 4.5 to 6.5 sec in March to May 2008, 5.0 – 5.4 sec in June to September 2008 and 4.5 to 6.5 sec from October 2008 to February 2009. Wave directions are varied between 150 degrees (south-southwest) in March to October 2008 to 200 degrees-250 degrees (turning slightly to the west) in November 2008 to February 2009.

ENVIRONMENTAL RESOURCES MANAGEMENT STATOIL EIA DRILLING
3-14
The impact of storm events can not be seen from the results of the ECMWF model output in 1989-2008 (Figure 3-6) and March 2008 to February 2009. The reason for this is that the wind data used to predict the wave height represent weekly averaged winds. Consequently, storm events which usually take place over a relatively short duration are averaged out.
Figure 3-6 Time series of wave characteristics: (i) significant wave height (upper), (ii) mean wave period (middle), and (iii) mean wave direction (lower) along a north-south section acquired from European Climate Moderate Range Weather Forecast (ECMWF)
3.2.4.5 Tide Regime
Tide data records are available from measurement (1–22 April 2009) at Mamuju (118.91667 E - 2.68333 S) just south of Karama Block coast and as predicted data using a Global Tidal Model and Nested Regional Tidal Model (BPPT) validated with surface height measured by Topex/Poseidon, ERS-1 and ERS-2. The results of this model can be acquired at many locations around Karama Block such as those at the northern and southern parts of the Karama Block.
A comparison between tide measurements and the results of the tide prediction model at Mamuju is provided in Figure 3-7. The results of tide prediction using admiralty methods compare very well with those of tide measurement. The results show that the type of tide in Mamuju and Karama Block is mixed and predominantly semi-diurnal. This means that there 2 distinct high and low water occurrences a day (24 hours) but the tidal range

ENVIRONMENTAL RESOURCES MANAGEMENT STATOIL EIA DRILLING
3-15
between these two events is significantly different for neap and spring tides. During the time of measurement at Mamuju (1–22 April 2009) the tidal range varied between 0.74 m during the neap tide (5 April 2009) to 1.83 m during the spring tide (12 April 2009), while the predicted tide at the Karama Block over the period 1–31 May 2009 shows a varying range between 0.4 m during neap tide to 2.1 m during spring tide. Both sets of results are comparable and a similar tide regime has been reported by earlier studies for the Makassar Strait in Wyrtki, 1961.
Figure 3-7 Comparison between tide measurement (blue) and results of tide prediction (red) at Mamuju from 1 – 22 April 2009.
3.2.4.6 Characterization of Extreme Conditions (Storms) (Winds, Waves and Currents).
Extreme conditions are usually caused by storms. As storms pass by, then wind will be stronger, wave height will be higher, wave periods will be longer and may it cause chaotic and strong surface currents. There is limited wave model prediction data for storm conditions in the Makassar Strait. This report describes some of the available data on extreme wind conditions which may be considered as “storms”.
Methods of observation and modelling to produce the wind data include:
• Satellite Dataset,
• Merge Optimal Interpolation (IO) Dataset,
• Model output from Cersat IFREMER, France and
• Validation from BMGK Data set.
Wind conditions in the Makassar Strait were characterized from the above sources for the period 1 to 24 April 2009 with 4 wind condition each day (at hours of 00.00, 06.00, 12.00 and 18.00). Visual observation of this period at 4 times each day showed moderate wind conditions within or nearby the Karama Block. These include:
• April 2009 at 00.06 hours where the wind speed was >9 m/sec to the southwest.

ENVIRONMENTAL RESOURCES MANAGEMENT STATOIL EIA DRILLING
3-16
• 13 April 2009, 06.00 with a location just north of Karama Block, where the wind speed was 6.5 m/sec with an eastward direction.
• 17 April 2009, 00.60 at locations in the northern and eastern part of the Karama Block where wind speed was 6.5 – 7.0 m/sec with an eastward direction.
During April 2009, extreme wind conditions around the Karama Block were infrequent but several occurrences were observed at the eastern side of Makassar Strait, especially around the Balikpapan coast.
The occurrence of storms (wind speed > 20 m/s) in the Makassar Strait is infrequent. This influenced by the location of the Strait at the equator and the shielding effect of Kalimantan and Sulawesi. Furthermore, this area lies between two tropical storm belts (generally located between 5°–27° N and S latitudes). The area is largely unaffected by tropical cyclones and is characterized by localized squalls (Gill, 1982). Extreme events are rare but monsoon storm events have been recorded and winds up to 80 miles/hr (approximately 36 m/s) have occurred in exceptional circumstances.
3.2.5 Water and Sediment Quality
Water quality within the Karama Block was studied through sea water column sampling conducted by ELNUSA during the period September to October 2009. Sediment samples were also taken during the period. Water quality sampling were conducted at three sampling locations as presented in Figure 3-8 (one near the shoreline-point 4, and two located offshore-points 1B and 2). Water samples were collected from different depth, resulting fourteen sampling station (1B-a, 1B-b, 1B-c1, 1B-c2, 1B-d, 1B-e, 2-a, 2-b, 2-c1, 2-c2, 2-d, 2-e, 4-a, 4-b).
3.2.5.1 Water Quality
Seawater samples were collected from the following depths in the water column:
• Surface water sample at 10m;
• Surface-mid water sample at 400m;
• Mid water column sample at 620m;
• Middle-bottom water sample at 1,200m; and
• Bottom water sample at 1,600m.
The water quality of surrounding project location is largely in compliance to Seawater standard regulated in Minister of Environment Decree No. 51 of 2004. Detailed results from the water quality analyses are provided in Appendix 2.

ENVIRONMENTAL RESOURCES MANAGEMENT STATOIL EIA DRILLING
3-17
The sea water was physically clear, with high light intensity at the surface and turbidity and Total Suspended Solid (TSS) values well below the standards threshold. Temperatures were relatively warm at the surface, which are in average double of the temperatures at depths.
Dissolved Oxygen (DO) at the surface of all sampling stations was slightly lower than the standard threshold. This may be attributable to the relatively higher temperature driving the equilibrium towards a gaseous phase. DO also decrease with increasing depth due to less contact with the atmosphere.
There was a low level of Bio-chemical Oxygen Demand 5 Days (BOD5) as well as non-detectable pollutant levels of Poly-cyclic Aromatic Hydrocarbon (PAH), Poly Chlorinated Biphenyl (PCB), Tri Butyl Tin (TBT) and pesticides in all of the samples.
The BOD concentration of the samples taken generally was below the stipulated concentration stated in MoE 51-2004 that is 20 mg/L. This low BOD is considered to show good condition where little pollution occurred at the studied location. Influences of possible anthropogenic pollutants from domestic activities (e.g. shipping and/or human activities at shores) were indicated by the presence of phosphate, nitrate and surfactants, as well as oil and grease parameters.
Total organic carbon (TOC) and total hydrocarbon were detected in all sampling points. TOC representing all combustible organic compounds in water was detected ranging from 0.69 to 3.74 mg/L. TOC is not regulated in MoE 51-2004. Total hydrocarbon was detected in all sampling points ranged from 0.4 t0 3.0 mg/L. In accordance with MoE 51-2004, threshold limit of total hydrocarbon for marine water in port area is 1 mg/L, but total hydrocarbon is not regulated for marine tourism and marine biota.
Oil and grease was detected in all sampling locations ranged from 2.2 to 7.0 mg/L. MoE 51-2004 stipulates threshold limit for marine water in port area is 5 mg/L and for marine tourism and marine biota is 1 mg/L. Based on this limit, oil and grease concentrations in all samplings stations exceeded threshold limit for marine tourism and marine biota.
Metals and heavy metals were generally in compliance with the standards, except for Cr (VI), Pb and Ni. Cr (VI) was detected in all sampling locations ranged from 0.009 to 0.130 mg/L (threshold limit 0.005 mg/L), Pb was detected ranged from 0.194 to 0.300 mg/L (threshold limit 0.008 mg/L) and Ni concentration in all sampling locations was detected ranged from 0.037 to 0.378 mg/L (threshold limit 0.05 mg/L). Other metals, such as Ba, Se, Al and V have no standard threshold values. The concentrations had similar values in all locations and depths, possibly because these metals are naturally present in the sea water.

ENVIRONMENTAL RESOURCES MANAGEMENT STATOIL EIA DRILLING
3-18
Three type of radioisotops were analyzed from water samples during the study i.e. 226Ra, 228Ra, and 210Pb. Radioactivity analytical result showed 210Pb was detected in the range between <200 to 3900 mBq/L, while 226Ra was detected ranging from 1.1 to 3.9 mBq/L and 228Ra ranged from 0.8 to 3.0 mBq/L. The radioactivity is considered well below the standard threshold limit.

ENVIRONMENTAL RESOURCES MANAGEMENT STATOIL EIA DRILLING
3-19
Figure 3-8 Water column and sediment quality sampling locations

ENVIRONMENTAL RESOURCES MANAGEMENT STATOIL EIA DRILLING
3-20
3.2.5.2 Sediment Quality
Sediment samples were collected in the same locations as water quality samples (see Figure 3-8), consisted of near shoreline and off shore near the Anoman Well.
Sediment characteristic of the project location based on the analysis of the samples are classified as silt and silty-clay with low content of sand and gravel. The near shoreline (location point 4) majority is silt, with some clay and low sand content. Sediments near the Anoman well, location point 1B and 2 are dominated by silt and clay with low content of sand.
Redox potential of the sediment samples showed positive value, ranging from +68 to +115 mV. This value showed a good sign where the positive redox potential means adequate oxygen presents in the vicinity. Data on more than 1,000 samples of bottom deposits indicate Eh values ranging from +350 to -500 mV have been observed in samples of recent sediments in which the pH ranged from 6.4 to 9.5 (www.aapg.org). Positive Eh values are generally characteristic of bottom deposits which are well oxygenated, those which consist of coarse sediments, or those which are poor in organic matter. Negative Eh values are characteristic of bottom deposits rich in organic matter and which consist largely of fine sediments. An abundance of readily decomposable organic matter appears to promote reducing conditions. In the presence of organic matter, bacteria and allied microorganisms create reducing conditions. Such conditions are maintained by certain organic compounds, ferrous iron, reduced manganese, hydrogen sulphide, and other inorganic constituents of sediment.
TOC (Total Organic Carbon) as an indicator of the organic matter content of a system and the presence of food for benthic organisms ranged from 27.45 to 36.50%. No criteria is found in literature for optimal range of TOC in sediment, as mentioned above there is a positive correlation between organic content in the sediment and redox potential.
The metal content of sediment samples were of a similar range for each sampling point. The highest levels of: Al, Fe, Pb, Cu, Ni, Cd, V, Co, Se and Ag were recorded at sampling point 2; Ba, Hg, and Zn were higher at sampling point 1B and Mn was highest at sampling point 4 (Appendix 3).
Currently, Indonesia does not have standard for sediment quality, the analytical result is compared to OSPAR background concentration to have information on sediment quality of the studied area.
Of the metals on the OSPAR BC list (Hg, Cd, Cr, Pb, As, Zn, Ni and Cu), concentration of Hg at all sampling points was higher than OSPAR BC and EAC limit while Ni and Cu were higher than OSPAR BC but still within the

ENVIRONMENTAL RESOURCES MANAGEMENT STATOIL EIA DRILLING
3-21
OSPAR EAC limit. The concentration of Cr, Zn, and As was within the OSPAR BC and OSPAR EAC limit.
3.2.6 Marine Flora and Fauna
3.2.6.1 Plankton
Aquatic biota samples were also collected during the water column/sediment sampling program (three sampling location, fourteen sampling station 1B-a, 1B-b, 1B-c1, 1B-c2, 1B-d, 1B-e, 2-a, 2-b, 2-c1, 2-c2, 2-d, 2-e, 4-a, 4-b) as shown in Figure 3-8.
Chlorophyll-a is the green pigment content that is produced by phytoplankton and this can be used as an indication of the density of the phytoplankton in the water. Analysis results (Appendix 2) confirmed that in all samples, Chlorophyll-a was found to be between 0.21 (station #4-b) to 2.08mg/l (station #1B-c2). In general, the sampled sea water possessed a rich plankton biomass but there was no indication of plankton blooms.
The analytical results (Appendix 2) showed maximum concentrations of plankton at station #1B-a where 19,594 individuals/litre were recorded. In stations #1B-d, #1B-e, #2-c1, #2-c2 and #2-d five classes of plankton consisting of twenty seven species were found; phytoplankton (Bacillariophyceae and Chromonadea) and zooplankton (Annelida, Cilliata and Crustacea). Most of water samples originated from deep water (1,600 to 1,800 m). In such depths the low availability of light intensity prevents abundance of phytoplankton. The most is Bacillariophyceae. The low recorded level of BOD5 is also a factor affecting the amount of plankton.
Using the classification of biodiversity indices documented in Odum (1971) low, intermediate and high biodiversity are indicated by Shannon indices of <2.3, between 2.3 and 6.9 and >6.9. According to these criteria, five out of the eight sampling station sampled fall in the low biodiversity category. Only three out of eight sites fall into the intermediate biodiversity category. Six out of the entire fourteen sites did not indicate presence of identified species. As such, biodiversity diversity in the sampled sites is relatively low overall. Given the results of the biomass analysis, this suggests the dominance of a particular species.
3.2.6.2 Benthic Communities
Benthic analysis results of the sediment samples showed 30,698 individuals/m2 at sampling location 1B, 2,674 at sampling location 4 and no individuals in location 2. Two classes were found; namely Bivalvia (Corbula, Arctica, Bivalvia, Ensis, Cuspidaria and Thyassira) and Annelida (Polychaeta).

ENVIRONMENTAL RESOURCES MANAGEMENT STATOIL EIA DRILLING
3-22
All sampling locations displayed a low biodiversity based on Shannon indices (Odum, 1971) that was below 2.3 (1.15 at location 1B; 0 at location 2 and 1.06 at location 4).
3.2.7 Fish
3.2.7.1 Eel (Anguilla sp)
Based on research conducted by LIPI (Lembaga Ilmu Pengetahuan Indonesia/The Indonesian Institute of Sciences) from the research ship Baruna Jaya VII in 2001, the Makassar Strait hosts important spawning areas for eels. Eels spawning area near the Karama Block are more abundant in the southern part than that in the north as showed in Figure 3-9.
Small eels have a spawning season around April-May, while the larger spawn before April. Makasar Straits is a known spawning area for eels, but the most significant spawning areas are in Tomini Bay out of the Karama Block area. The eels spawning in the sea areas in the gulf then return to fresh water around the Tomini Bay. The distribution of larval eels (leptochepalus) correlates with the distribution of adult eels which inhabit freshwater habitats.
3.2.7.2 Nener (milkfish larvae)
The coastal waters around West Sulawesi province (Sulawesi Barat) and especially around Majene are spawning areas for nener (milkfish larval). Milkfish larval abundance is estimated at 2 million larval per 2 km long beach during the fishing season in March-April and August to January (Directorate General of Fisheries 2007).
3.2.8 Marine Mammals
The oceanic conditions of the ALKI (Alur Laut Kepulauan Indonesia/Indonesian Through Flow) through the Sulawesi and Makassar Strait carried larvae and plankton from the Pacific to the Indian Ocean and is likely to represent a migratory pathway for whales and dolphin species (Kreb and Budiono, 2005). Studies along East Kalimantan marine water have found an abundance of cetaceans and whilst data for the Makassar Strait and West Sulawesi is limited it may be expected that cetaceans, especially dolphin species may be encountered in the offshore waters of the Karama Block and around adjacent islands. Offshore, such species may include the bottlenose dolphin (Tursiops truncatus), spinner dolphin (Stenella longirostris), dwarf spinner dolphin (Stenella l. roseiventris) and Indo-Pacific bottlenose dolphin (Tursiops aduncus). Nearshore and around islands, this may include Irrawaddy dolphin, false killer whale (Pseudorca crassidens) and finless porpoise (Neophocaena phocaenoides).

ENVIRONMENTAL RESOURCES MANAGEMENT STATOIL EIA DRILLING
3-23
Figure 3-9 Eel Spawning Area

ENVIRONMENTAL RESOURCES MANAGEMENT STATOIL EIA DRILLING
3-24
3.2.9 Turtles
In Indonesia there are 6 species of sea turtles, green turtle (Chelonia mydas), hawksbill turtle (Eretmochelys imbricata), leatherback turtle (Dermochelys coriacea) olive ridley turtle (Lepidchelys olivacea), loggerhead turtle (Caretta caretta) and flatback turtle (Natator depressa). All six sea turtle species existing in Indonesia has been reserved No. 5 of 1990 concerning the Conservation of Natural Resources and Ecosystem with Government Regulation No. implementing regulations No. 7 of 1999 concerning The Preservation of Plants and Animals.
A number of turtle species occur in the area of West Sulawesi and Makassar Strait; the Leatherback (Dermochelys coriacea), Green (Chelonia mydas) and Hawksbill turtle (Eretmochelys imbricate). All species of sea turtles are endangered by the IUCN status. Turtle nesting sites are generally along the fine sandy beaches, there are no reports of sea turtle nesting along the coast of Mamuju. Turtle nesting season has a different time between places with one another. In Indonesia turtle nesting season lasts all year round with peak season vary by region. Turtle nesting season on the island of Sulawesi is generally in the month of December to April.
Nesting beaches are outside of the area of the Karama Block and known migration rotes suggest that the turtles concentrate along the coast of East Kalimantan and South Sulawesi for nesting sites in the south and in the waters in the North Makassar basin, north of Kalimantan and Sulawesi (Figure 3-10). However, due to the location of the East Kalimantan breeding sites these turtle species may be encountered in the vicinity of the Karama Block and in the waters between Balikpapan and the PSC area.
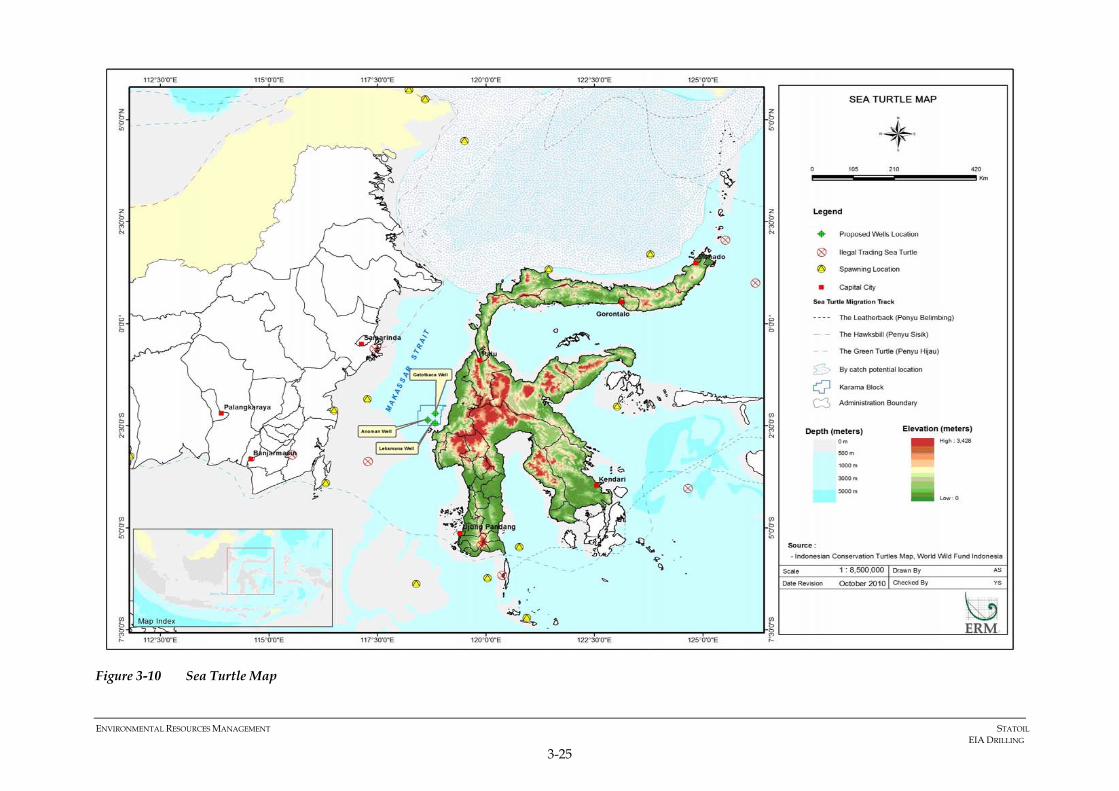
ENVIRONMENTAL RESOURCES MANAGEMENT STATOIL EIA DRILLING
3-25
Figure 3-10 Sea Turtle Map
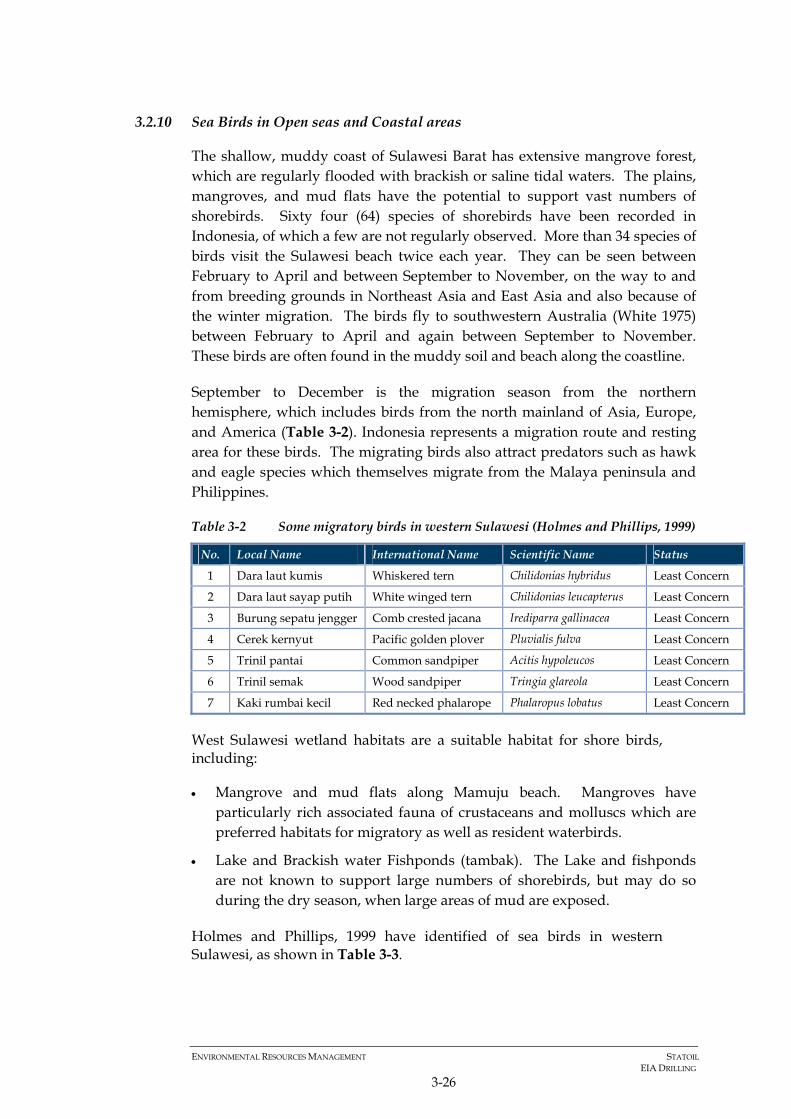
ENVIRONMENTAL RESOURCES MANAGEMENT STATOIL EIA DRILLING
3-26
3.2.10 Sea Birds in Open seas and Coastal areas
The shallow, muddy coast of Sulawesi Barat has extensive mangrove forest, which are regularly flooded with brackish or saline tidal waters. The plains, mangroves, and mud flats have the potential to support vast numbers of shorebirds. Sixty four (64) species of shorebirds have been recorded in Indonesia, of which a few are not regularly observed. More than 34 species of birds visit the Sulawesi beach twice each year. They can be seen between February to April and between September to November, on the way to and from breeding grounds in Northeast Asia and East Asia and also because of the winter migration. The birds fly to southwestern Australia (White 1975) between February to April and again between September to November. These birds are often found in the muddy soil and beach along the coastline.
September to December is the migration season from the northern hemisphere, which includes birds from the north mainland of Asia, Europe, and America (Table 3-2). Indonesia represents a migration route and resting area for these birds. The migrating birds also attract predators such as hawk and eagle species which themselves migrate from the Malaya peninsula and Philippines.
Table 3-2 Some migratory birds in western Sulawesi (Holmes and Phillips, 1999)
No. Local Name International Name Scientific Name Status
1 Dara laut kumis Whiskered tern Chilidonias hybridus Least Concern
2 Dara laut sayap putih White winged tern Chilidonias leucapterus Least Concern
3 Burung sepatu jengger Comb crested jacana Irediparra gallinacea Least Concern
4 Cerek kernyut Pacific golden plover Pluvialis fulva Least Concern
5 Trinil pantai Common sandpiper Acitis hypoleucos Least Concern
6 Trinil semak Wood sandpiper Tringia glareola Least Concern
7 Kaki rumbai kecil Red necked phalarope Phalaropus lobatus Least Concern
West Sulawesi wetland habitats are a suitable habitat for shore birds, including:
• Mangrove and mud flats along Mamuju beach. Mangroves have particularly rich associated fauna of crustaceans and molluscs which are preferred habitats for migratory as well as resident waterbirds.
• Lake and Brackish water Fishponds (tambak). The Lake and fishponds are not known to support large numbers of shorebirds, but may do so during the dry season, when large areas of mud are exposed.
Holmes and Phillips, 1999 have identified of sea birds in western Sulawesi, as shown in Table 3-3.

ENVIRONMENTAL RESOURCES MANAGEMENT STATOIL EIA DRILLING
3-27
Table 3-3 Sea Birds in Western Sulawesi (Holmes and Phillips, 1999)
No Local Name International Name Scientific Name Status
1 Cikalang kecil Lesser frigatebird Fregata ariel LC
2 Pecuk padi belang Little pied cormorant Phalacrocorax melanoleucos LC
3 Pecuk padi hitam Little black cormorant Phalacrocorax sulcirostris LC
4 Pecuk ular asia Oriental darter Anhinga melanogaster NT
5 Angsa batu coklat Brown booby Sula leucogaster LC
6 Cangak merah Purple Heron Ardea purpurea LC
7 Cangak laut Great-billed Heron Ardea sumatrana LC
8 Kuntul kerbau Cattle egret Bubulcus ibis LC
9 Blekok sawah Javan pond heron Ardeola speciosa LC
10 Kuntul besar Great egret Casmerodius albus LC
11 Kuntul perak Intermediate egret Egreta intermedia/ Mesophoyx intermedia LC
12 Kuntul kecil Little egret Egreta garzetta LC
13 Kuntul belang Pied heron Egreta picata/Ardea picata LC
14 Kokokan laut Striated heron Butorides striatus NT
15 Kowak malam merah Rufous night heron Nycticorax caledonicus LC
16 Bambangan merah Cinnamon bittern Ixobrychus cinnamomeus LC
17 Bambangan kuning Yellow bittern Ixobrychus sinensis LC
18 Bambangan hitam Black bittern Ixobrychus flavicollis LC
19 Bangau sandang lawe Wolly-necked stork Ciconia episcopus LC
20 Bangau bluwok Milky stork Mycteria cinerea VU
21 Ibis rokoroko Glossy ibis Plegadis falcinellus LC
22 Elang tiram Osprey Pandion haliaetus LC
23 Elang laut perut putih White bellied sea eagle Haliaeetus leucogaster LC
24 Elang paria Black kite Milvus migrans LC
25 Itik benjut Sunda teal Anas gibberirfons LC
26 Itik gunung Pacific black duck Anas superciliosa LC
27 Maleo Maleo Macrocephalon maleo EN
28 Wili-wili besar Beach thick knee Esacus magnirostis/Esacus giganteus NT
29 Dara laut batu Bridled Tern Sterna anaethetus LC
30 Dara laut jambul besar Great crested tern Sterna bergii LC
31 Dara laut benggala Lesser crested tern Sterna bengalensis LC
32 Dara laut tengkuk hitam Black napped tern Sterna sumatrana LC
33 Dara laut kecil Little tern Sterna albifrons LC Notes: EX Extinct EW Extinct in the Wild CR Critically Endangered EN Endangered VU Vulnerable NT Near Threatened LC Least Concern DD Data Deficient NE Not evaluated

ENVIRONMENTAL RESOURCES MANAGEMENT STATOIL EIA DRILLING
3-28
3.2.11 Coastal habitats
Coastal areas are the border between marine and terrestrial ecosystems. In a coastal forests ecosystem, plants are clustered and formed specific units according to their habitat. A unit of vegetation in a specific habitat is called formation. Each formation is named according to the most dominant plant species.
In the project zone of influence there are two types of forest found along the coastal zone of Sulawesi Barat, namely coastal forest and mangrove. The coastal zone is backed by a wide distribution of rainforest which is outside the project area and zone of influence and so is not discussed here.
3.2.12 Mangrove Forest
The mangrove ecosystem structure found in West Sulawesi displays a comprehensive growth of vegetation on the seedlings, saplings, and trees overall (Figure 3-11).
Regeneration and sustainability of the mangroves is dependent on low levels of disturbance or disruption of the ecosystem and areas of the mangrove have species that are categorized as low at all levels of vegetation growth. These are dominated by Bruguiera, Rhizophora apiculata and Rhizophora mucronata. In addition to these species, Avicennia alba, Ceriops tagal, Casuarina equisetifolia, Sonneratia caseolaris, Avicennia marina, and Lumnitzera racemosa are present.
Mangroves form an important habitat for a number of species, supporting spawning grounds for fish and other marine species, providing feeding areas for birds, reptiles, invertebrates and large mammals such as primates due to the availability of nutrients and food throughout the year.
The species of birds found in mangrove forests are listed in Table 3-4.
Table 3-4 Birds Found in Mangrove Forrest of Western Sulawesi
No Local Name International Name Scientific Name Status
1 Cangak merah Purple Heron Ardea purpurea LC
2 Kuntul kecil Heron Reef Egretta sacra LC
3 Kuntul kerbau Cattle Egret Bubulcus ibis LC
4 Cekakak china Black-capped Kingfisher Halcyon pileata LC
5 Cekakak sungai Collared Kingfisher Todirhamphus chloris LC
6 Raja udang kalung biru Blue-banded Kingfisher Alcedo euryzona VU
7 Trinil bedaran Terek Sandpiper Tringa cinereus LC
8 Elang bondol Brahminy Kite Haliastur Indus LC
9 Blekok sawah Javan pond heron Ardeola speciosa LC
10 Kacer Oriental Magpie Robin Copsychus saularis LC
11 Kacamata laut Lemon-bellied White-eye Zosterops chloris LC

ENVIRONMENTAL RESOURCES MANAGEMENT STATOIL EIA DRILLING
3-29
No Local Name International Name Scientific Name Status
12 Cinenen merah Rufous-tailed Tailorbird Orthotomus sericeus LC
13 Cabai polos Plain Flowerpecker Dicaeum concolor LC
14 Bambangan coklat Schrenck's Bittern Ixobrychus eurhythmus NR
15 Cinenen kelabu Ashy Tailorbird Orthotomus ruficeps LC
16 Kekep Babi White-breasted Woodswallow Artamus leucorynchus LC
17 Itik benjut Sunda Teal Anas gibberifrons LC
Figure 3-11 Typical Narrow Band of Mangrove Ecosystem Found in Mamuju due to Steep Topography at Coast of Mamuju
3.2.13 Coastal Forest
Coastal forest consists of the Pes-Caprae and the Baringtonia formation.
3.2.13.1 Pescaprae Formation
In the Pescaprae formation, the dominant plants are Ipomoea pres-caprae, Vigna, Spinifex littoreus (grass wind), Canavalia maritime, Euphorbia atoto, Pandanus tectorius (pandanus), Crinum asiaticum (daffodils) and Scaevola frutescens (babakoan). The Pescaprae formation is evenly distributed around the coast of Mamuju (Figure 3-12).

ENVIRONMENTAL RESOURCES MANAGEMENT STATOIL EIA DRILLING
3-30
Figure 3-12 Pescaprae Formation around Coast of Mamuju
3.2.13.2 Baringtonia Formation
The dominant vegetation in this formation is the Baringtonia tree. Other plants characterizing the habitat include Callophylum inophylum (nyamplung), Erythrina, Hernandia, Hibiscus tiliaceus (sea hibiscus), Terminalia cattapa (ketapang) (Figure 3-13).
Figure 3-13 Baringtonia Formation of Mamuju
3.2.13.3 Important, Rare, Endemic or Endangered Species (Flora and Fauna) both Onshore and Offshore
Sulawesi Island is a very specific island; therefore the discussion of flora and fauna can not be limited to West Sulawesi but to cover the entire Sulawesi Island. There are 165 species of endemic mammals in Indonesia, almost half of them (46%) are found in Sulawesi. Out of 127 species of mammal found in Sulawesi, 79 species (62%) are endemic. On mainland Sulawesi there are 233 species of birds, 84 of them are endemic to Sulawesi. This number accounts
ENVIRONMENTAL RESOURCES MANAGEMENT STATOIL EIA DRILLING
3-31
for more than one third of the 256 endemic bird species in Indonesia. Sulawesi is inhabited by as many as 104 species of reptile and nearly 29 are endemic species, which means, out of the 150 recorded endemic reptiles in Indonesia, 20% are found on the island of Sulawesi.
West Sulawesi Province has more than 670,000 ha of protection forest (protected forest administered by the Province) and about ten forest concessions companies operates in the region totalling more than 430,000 ha (including one adjacent concession in neighbouring Sulawesi Tengah).
Some endemic animals found in West Sulawesi are high land anoa, low land anoa, deer, maleo bird, and Sulawesi black monkey. According to Sujatnika (1995) some endemic birds exist are 'elang alap kecil' (Accipter nanus), 'maleo senkawor' (Macrocephalon maleo), 'mandar dengkur' (Aramidopsis plateni), 'kareo Sulawesi' (Amauromis isabellina), 'pergam tutu' (Ducula forsteni), 'delimukan Sulawesi' (Gallicomba tristigmata), 'serindit paruh merah' (Loriculus exllis), 'pungguk oker' (Ninox ochracea), 'cekakak hutan tungging hijau' (Actenoides monachus), 'cirik-cirik pasa' (Meropogon forsteni), 'kepodang-sungu biru' (Coracina temminckii), 'sikatan leher merah' (Ficedula rufigula), 'kacamata perut pucat' (Zosterops consobrinorum), and 'raja perling Sulawesi' (Basilornis celebensis).
3.2.13.4 Conservation Areas in the Project Zone of Influence
In the Government Regulation No. 26 of 2008 regarding the National Spatial Plan in Annex VIII, there is only one area listed as Wildlife Refuge, namely Suaka Margasatwa Mampie Lampoko (Lampoko Mampie Reservation).
Lampoko Mampie Reservation is a wildlife reserve park located on the island of Sulawesi, with an area of nearly 2.000 ha. This reservation is located precisely in the western part of South Sulawesi Province, in Polewali Mamasa Regency (Figure 3-14).
The condition of the Wildlife Park consists of wetland and marshy areas which include 300 ha of secondary forest, swamp forest and mangrove areas. This wildlife reserve is a very important area for plants and animals especially for Mandar Sulawesi birds or Ballidae or Celebes Rails (Aramidopsis plateni) and Ibis hitam (Plegadis fascinelus) which are endemic, as well as being a refuge for migratory birds.

ENVIRONMENTAL RESOURCES MANAGEMENT STATOIL EIA DRILLING
3-32
Figure 3-14 Location of Mampie Lampoko Reservation
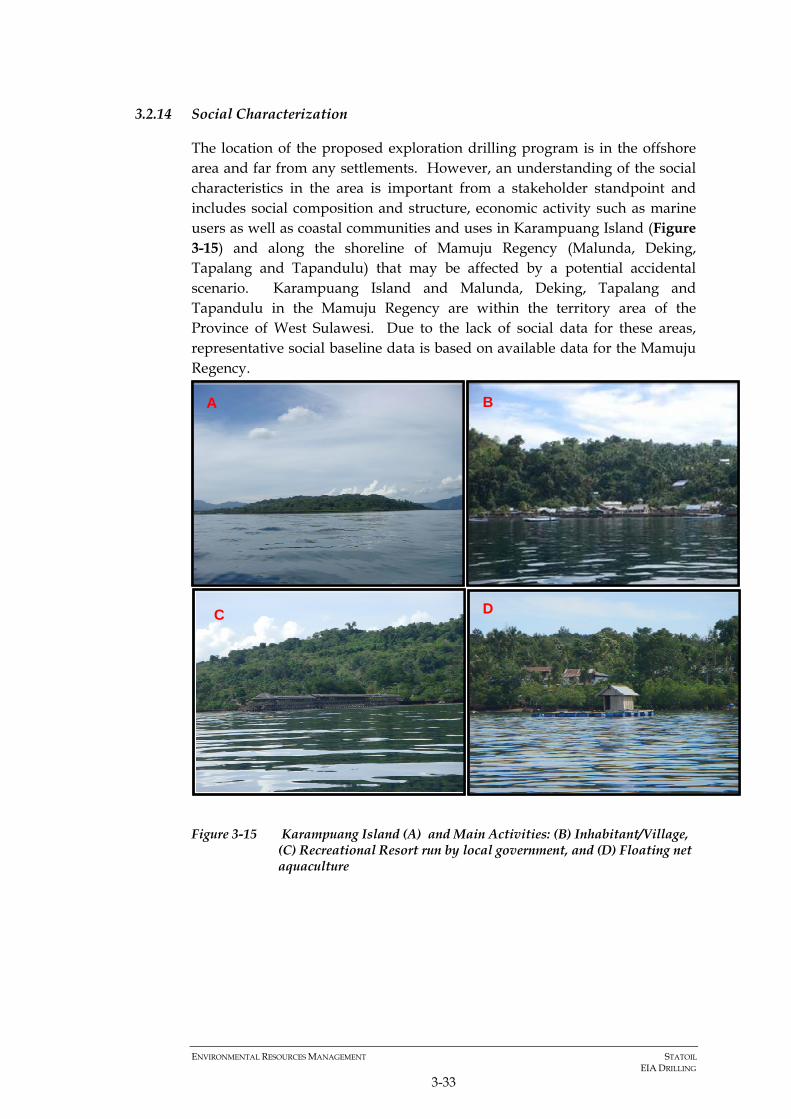
ENVIRONMENTAL RESOURCES MANAGEMENT STATOIL EIA DRILLING
3-33
3.2.14 Social Characterization
The location of the proposed exploration drilling program is in the offshore area and far from any settlements. However, an understanding of the social characteristics in the area is important from a stakeholder standpoint and includes social composition and structure, economic activity such as marine users as well as coastal communities and uses in Karampuang Island (Figure 3-15) and along the shoreline of Mamuju Regency (Malunda, Deking, Tapalang and Tapandulu) that may be affected by a potential accidental scenario. Karampuang Island and Malunda, Deking, Tapalang and Tapandulu in the Mamuju Regency are within the territory area of the Province of West Sulawesi. Due to the lack of social data for these areas, representative social baseline data is based on available data for the Mamuju Regency.
Figure 3-15 Karampuang Island (A) and Main Activities: (B) Inhabitant/Village, (C) Recreational Resort run by local government, and (D) Floating net aquaculture
A
D
B
C
A
D
B
C
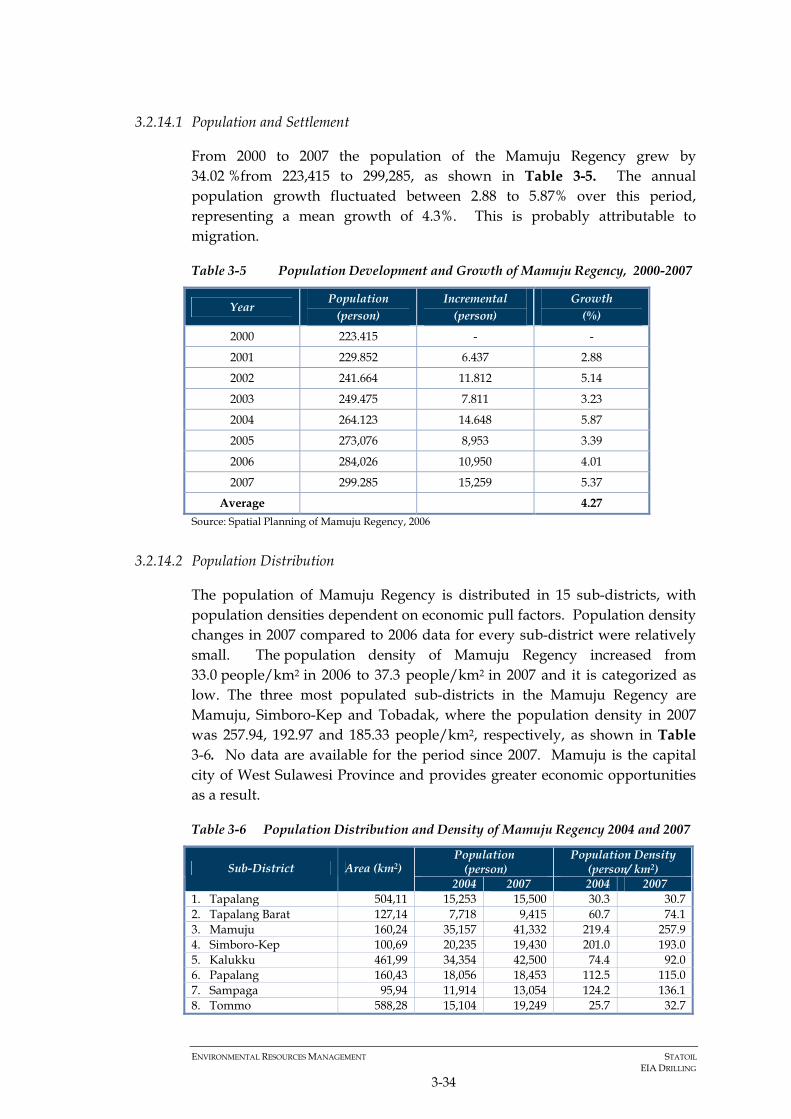
ENVIRONMENTAL RESOURCES MANAGEMENT STATOIL EIA DRILLING
3-34
3.2.14.1 Population and Settlement
From 2000 to 2007 the population of the Mamuju Regency grew by 34.02 %from 223,415 to 299,285, as shown in Table 3-5. The annual population growth fluctuated between 2.88 to 5.87% over this period, representing a mean growth of 4.3%. This is probably attributable to migration.
Table 3-5 Population Development and Growth of Mamuju Regency, 2000-2007
Year Population
(person) Incremental
(person) Growth
(%)
2000 223.415 - -
2001 229.852 6.437 2.88
2002 241.664 11.812 5.14
2003 249.475 7.811 3.23
2004 264.123 14.648 5.87
2005 273,076 8,953 3.39
2006 284,026 10,950 4.01
2007 299.285 15,259 5.37
Average 4.27 Source: Spatial Planning of Mamuju Regency, 2006
3.2.14.2 Population Distribution
The population of Mamuju Regency is distributed in 15 sub-districts, with population densities dependent on economic pull factors. Population density changes in 2007 compared to 2006 data for every sub-district were relatively small. The population density of Mamuju Regency increased from 33.0 people/km2 in 2006 to 37.3 people/km2 in 2007 and it is categorized as low. The three most populated sub-districts in the Mamuju Regency are Mamuju, Simboro-Kep and Tobadak, where the population density in 2007 was 257.94, 192.97 and 185.33 people/km2, respectively, as shown in Table 3-6. No data are available for the period since 2007. Mamuju is the capital city of West Sulawesi Province and provides greater economic opportunities as a result.
Table 3-6 Population Distribution and Density of Mamuju Regency 2004 and 2007
Population (person)
Population Density (person/ km2) Sub-District Area (km2)
2004 2007 2004 2007 1. Tapalang 504,11 15,253 15,500 30.3 30.7 2. Tapalang Barat 127,14 7,718 9,415 60.7 74.1 3. Mamuju 160,24 35,157 41,332 219.4 257.9 4. Simboro-Kep 100,69 20,235 19,430 201.0 193.0 5. Kalukku 461,99 34,354 42,500 74.4 92.0 6. Papalang 160,43 18,056 18,453 112.5 115.0 7. Sampaga 95,94 11,914 13,054 124.2 136.1 8. Tommo 588,28 15,104 19,249 25.7 32.7

ENVIRONMENTAL RESOURCES MANAGEMENT STATOIL EIA DRILLING
3-35
Population (person)
Population Density (person/ km2) Sub-District Area (km2)
2004 2007 2004 2007 9. Kalumpung 1,778, 21 9,921 12,375 5.6 7.0 10. Bonehau 950,76 6,927 9,398 7.3 9.9 11. Budong-Budong 1,140,43 19,088 23,306 16.7 20.4 12. Pangale 232,52 12,464 12,522 53.6 53.9 13. Topoyo 543,88 19,910 22,166 36.6 40.8 14. Karossa 1,069,31 18,577 22,028 17.4 20.6 15. Tobadak 100,13 19,443 18,557 194.2 185.3 TOTAL 8,014,06 264,123 299,285 33.0 37.3
3.2.14.3 Gender Ratio
The gender ratio illustrates the proportion of men to women, expressed by the number of males per 100 women. The population composition of Mamuju Regency based on gender in comparison to the sub-districts for the years 2006 and 2007 is shown in Table 3-7.
According to available data, the overall gender ratio of the Mamuju Regency in 2006-2007 stabilized at 105, which means that the number of men is slightly higher than women, with the exception the of Sampaga Sub-district where the number of women is higher.
Table 3-7 Gender Ratio of Mamuju Regency, 2006 and 2007
2006 2007 Gender Gender Sub District
Male Female Total
Population Gender Ratio Male Female
Total Population
Gender Ratio
Tapalang 7.374 7.362 14.736 100,16 7,882 7,618 15,500 103,47
Tapalang Barat
3.513 3.479 6.992 100,98 4,950 4,465 9,415 110,86
Mamuju 19.060 18.791 37.851 106,88 20,538 20,794 41,332 98,77
Simboro Kep. 10.066 9.418 19.484 101,43 9,903 9,527 19,430 103,95
Kalukku 20.514 19.335 39.849 106,10 21,205 21,295 42,500 99,58
Papalang 9.921 10.128 20.049 97,96 9,454 8,999 18,453 105,06
Sampaga 6.454 6.689 13.143 96,49 6,393 6,661 13,054 95,98
Tommo 9.042 7.839 16.881 115,35 10,319 8,930 19,249 115,55
Kalumpang 6.505 6.284 12.789 103,51 6,303 6,072 12,375 103,80
Bonehau 4.934 3.822 8.756 129,09 4,970 4,428 9,398 112,24
Budong-Budong
9.761 9.839 19.600 99,21 12,176 11,130 23,306 109,40
Pangale 6.782 5.960 12.742 113,79 6,592 5,930 12,522 111,16
Topoyo 11.065 10.692 21.757 103,49 11,428 10,738 22,166 106,43
Karossa 10.279 9.315 19.594 110,35 11,694 10,334 22,028 113,16
Tobadak 10.833 8.970 19.803 120,77 9,829 8,728 18,557 112,16
TOTAL 146.103 137.923 284.026 105,93 153,636 145,649 299,285 105,48
Source: BPS - Statistics of Mamuju Regency, 2008. Calculated
3.2.14.4 Dependency Ratio
The population composition based on age and gender for the year 2004 and 2006 is shown in Table 3-8. The Department of Domestic Affairs of the Republic of Indonesia stated that a population is referred to as ‘young’ if the

ENVIRONMENTAL RESOURCES MANAGEMENT STATOIL EIA DRILLING
3-36
population in the 0–14 years old category accounts for more than 30% of the total population. Referring to this categorization, the population structure of the Mamuju Regency overall is categorized as relatively young (35% of the population is less than 15 years old), which contributes to a high dependency ratio.
Table 3-8 Population Composition Based on Age and Gender in Mamuju Regency, 2004 and 2006
2004 2006 Gender Gender
Age Group
Male Female Total %
Male Female Total %
0 – 4 18.467 17.187 35.654 13.50 16,860 14,689 31,549 11.11 5 – 9 18.382 18.301 36.683 13.89 17,737 16,537 34,274 12.07
10 – 14 18.430 14.232 32.662 12.37 19,534 16,633 36,167 12.73 15 – 19 11.466 13.057 24.523 9.28 12,404 14,110 26,514 9.34 20 – 24 9.192 10.029 19.221 7.28 11,454 11,696 23,150 8.15 25 – 29 10.333 12.516 22.849 8.65 11,980 13,448 25,428 8.95 30 – 34 11.277 10.820 22.097 8.37 11,104 10,592 21,696 7.64 35 – 39 10.448 9.668 20.114 7.62 12,726 10,578 23,304 8.20 40 – 44 8.387 6.890 15.277 5.78 6,955 9,047 16,002 5.63 45 – 49 6.181 5.098 11.279 4.27 8,006 5,848 13,854 4.88 50 – 54 5.079 3.576 8.655 3.28 5,830 5,434 11,264 3.97 55 – 59 3.060 2.190 5.250 1.98 3,273 3,807 7,080 2.49 60 – 64 2.586 1.935 4.521 1.71 3,506 2,152 5,658 1.99
65 + 3.361 1.977 5.338 2.02 4,734 3,352 8,086 2.85 Total 136,647 127,476 264,123 100.00 146,103 137,923 284,026 100.00
Source: BPS - Statistics of Mamuju Regency, 2008. Calculated
-20,000 -15,000 -10,000 -5,000 0 5,000 10,000 15,000 20,000
Population
0 – 4
10 – 14
20 – 24
30 – 34
40 – 44
50 – 54
60 – 64
Age
Gro
up
FemaleMale
Female -17,187 -18,301 -14,232 -13,057 -10,029 -12,516 -10,820 -9,668 -6,890 -5,098 -3,576 -2,190 -1,935 -1,977
Male 18,467 18,382 18,430 11,466 9,192 10,333 11,277 10,448 8,387 6,181 5,079 3,060 2,586 3,361
0 – 4 5 – 9 10 – 14 15 – 19 20 – 24 25 – 29 30 – 34 35 – 39 40 – 44 45 – 49 50 – 54 55 – 59 60 – 64 65 +

ENVIRONMENTAL RESOURCES MANAGEMENT STATOIL EIA DRILLING
3-37
-20,000-15,000-10,000 -5,000 0 5,000 10,000 15,000 20,000
Population ( 2006 )
0 – 4
10 – 14
20 – 24
30 – 34
40 – 44
50 – 54
60 – 64
Age
Gro
up
FemaleMale
Female -14,689 -16,537 -16,633 -14,110 -11,696 -13,448 -10,592 -10,578 -9,047 -5,848 -5,434 -3,807 -2,152 -3,352
Male 16,860 17,737 19,534 12,404 11,454 11,980 11,104 12,726 6,955 8,006 5,830 3,273 3,506 4,734
0 – 4 5 – 9 10 – 14 15 – 19 20 – 24 25 – 29 30 – 34 35 – 39 40 – 44 45 – 49 50 – 54 55 – 59 60 – 64 65 +
The dependency ratio (DR) is the ratio of the population of non-working age (under 15 years and older than 65 years) compared to the number of people available for the workforce (15 to 64 years). The dependency ratio is calculated using the following formula:
1006415
65140 ×+
=−
+−
PPP
DR
DR : Dependency Ratio P0-14 : Population in the 0 – 14 years P15-64 : Population in the 15 – 64 years P65+ : Population older than 65 years
A high number means a high dependency (i.e. predominance of a non working population). The dependency ratios for 2004 and 2006 were 71.75 and 63.28 respectively which are relatively high compared to Indonesia’s average dependency ratio of 54 based on the 2000 census. However Mamuju Regency ratio during 2004 to 2006 was decreased from 71.75 in 2004 to 63.28 in 2006 representing a relative increase number of the population of working age. The population pyramid only illustrates the population age structure and does not reflect the availability of work opportunities.
3.2.15 Custom and Religion
The religions present in the Mamuju Regency are Moslem, Christianity, Hinduism and Buddhism; consistent with those in Indonesia in general. The majority of people are Moslem, representing 227,228 people or 86.03%, while

ENVIRONMENTAL RESOURCES MANAGEMENT STATOIL EIA DRILLING
3-38
Buddhism forms the minority, with 181 people or 0.07%. The religious composition of the community is provided in Table 3-9.
Table 3-9 Population Structure Based on Religion in Mamuju Regency
No Religion Population(Person) (%) 1 Moslem 227,228 86.03 2 Rome Catholic 3.353 1.27 3 Protestant Christian 26.193 9.92 4 Hinduism 7.168 2.71 5 Buddhism 181 0.07 Total 264,123 100.00
Source: Spatial Plan of Mamuju Regency, 2006
3.2.16 Education and Literacy
A number of educational programs designed by government have provided a greater access to education for the local population. The literacy level for the segment of the population aged above 15 years old in the Mamuju Regency is 85.7% (SUSENAS 2005). Over 70% of education facilities available in the districts are Elementary Schools/Elementary Islamic Schools, totaling 375 (Table 3-10). Approximately 70% of the population has had an education to elementary level, while only 2% of the population is in higher education
Table 3-10 Number of Schools. Teachers and Students in Mamuju in 2007
Number of Schools Σ Students Level of Education
State Private Total Teachers
State Private Total Percent of Students
Elementary School (SD) 357 1 358 2,482 53,021 33 53,054 67.3 Islamic Elementary School 1 16 17 111 122 1,077 1,199 1.5 Junior High School (SMP) 36 17 53 795 10,953 2,098 13,051 16.5 Islamic Junior High School 1 26 27 339 429 1,794 2,223 2.8 Senior High School (SMA) 11 8 19 485 3,840 712 4,552 5.8 Islamic Senior High School 1 13 14 169 314 1,063 1,377 1.7 Vocational High School 6 9 15 268 946 1,066 2,012 2.5 University ‐ 6 6 734 ‐ 1,382 1,382 1.8 Total 78,850 100.0
Source: BPS Mamuju Regency 2008
At present, 13 colleges are available in West Sulawesi, comprising two universities and 11 academies/colleges. The two universities are West Sulawesi University located in Majene and Al Syariah University in Polewali Mandar. The West Sulawesi University (Unisbar) was established in 2007 and started enrolling students in July of 2008. Unisbar, which secured approval from the education minister in November 2007, is managed by Yayasan Pendidikan Indonesia Sulawesi Barat/West Sulawesi Indonesian Education Foundation (Yapisba). The college’s locations are concentrated in three areas; six are in the capital city of Mamuju, four in Majene and one in Polewali Mandar (Table 3-11).

ENVIRONMENTAL RESOURCES MANAGEMENT STATOIL EIA DRILLING
3-39
Table 3-11 Universities and Academies in West Sulawesi Province
Mamuju District Majene District Polewali Mandar District 1 Fatima Nursing Academy University of West Sulawesi Al Syariah University 2 Tomakaka College of Information
and Computer Management Bina Sehat Nusantara Midwife Academy
Bina Generasi College of Health Studies
3 Muhammadiyah College of Economics
Majene College of Health Studies
4 Tanratupattanabali College of Agriculture
Yapman Majene College of Economics
5 Tanratupattanabali College of Social and Political Sciences
Marendeng Majene College of Health Studies
6 Darud Da’wah Wal Irsyad College of Teaching and Education Studies
Source: BPS Mamuju Regency 2008
The declining number of people going to higher education has been translated into an indicator for Participation in Education. Figure 3-16 illustrates, as level of education increased community participation level decreased. This is largely attributable to the cost to attend higher level of education. The ever increasing expense of attending junior and senior high school diminishes the access of the poor to education.
Source: Regional Action Plan of PPDT for West Sulawesi, 2007 Notes: 1) SD/MI = Elementary School/Elementary Islamic School 2) SMP/MTS = Junior High School / Islamic Junior High School 3) SMA/MA = Senior High School / Islamic Senior High School
Figure 3-16 Participation of the education level

ENVIRONMENTAL RESOURCES MANAGEMENT STATOIL EIA DRILLING
3-40
3.2.17 Public and Private Infrastructure
Basic community infrastructure includes transportation systems (roads, airport, and seaport), telecommunication, market facilities, banking, warehousing, fuel supply, electricity and clean water.
3.2.17.1 Transportation and Traffic
Transportation infrastructure (land, sea and air) in West Sulawesi is adequate and supports intra-province flows of people and goods, input-output of agricultural products, plantation and access to maritime activities (Table 3-12 and Table 3-13). However, the transportation infrastructure is basic and needs to be improved to be able to support industries such as mining (as among others coal and gold) and oil gas industries, West Sulawesi (Country and Regional Profile Report, 2008).
Table 3-12 Transportation Facilities in West Sulawesi Province
No. Types of Transportation Facility Description
• Trans Sulawesi Roads • Main Provincial Road connecting regencies in
West Sulawesi
1. Land
• Regency bridges connecting sub‐districts in West Sulawesi
• Ferry Port in Simboro Mamuju • Sea Port in Belang-Belang Bakengkeng Mamuju • Fish Port in Manakara Mamuju • Silopo Port in Polewali Mandar • Palippi Port in Majene • Pasang Kayu Port in Mamuju Utara
2 Sea
• Specialized Port of CPO (Crude Palm Oil) • Tampa Padang Airport in Kalukku 3. Air
• Accommodates turbo propeller aircraft, 4 times a week, route Mamuju - Makassar
Source: West Sulawesi PPDT Regional Action Plans, 2008-2009. The following subsections provide further detail on transportation infrastructure and traffic levels
Road Transportation
In 2007, the road coverage in the Mamuju Regency is 1,697.3 km, of this approximately 221.50 km of road was under the State authority, 154 km under province authority and 1,321.80 km under the regency authority. The majority of roads are gravel surfaced, with a small proportion with asphalt. The categorization road by type of surface and authority of control is shown on Table 3-13.
The condition of the road infrastructure is poor overall. Of the total road coverage in the Mamuju Regency reported only 50 % is in good condition, while 20 % is moderate, 25 % damaged and 5 % badly damaged (Table 3-14).
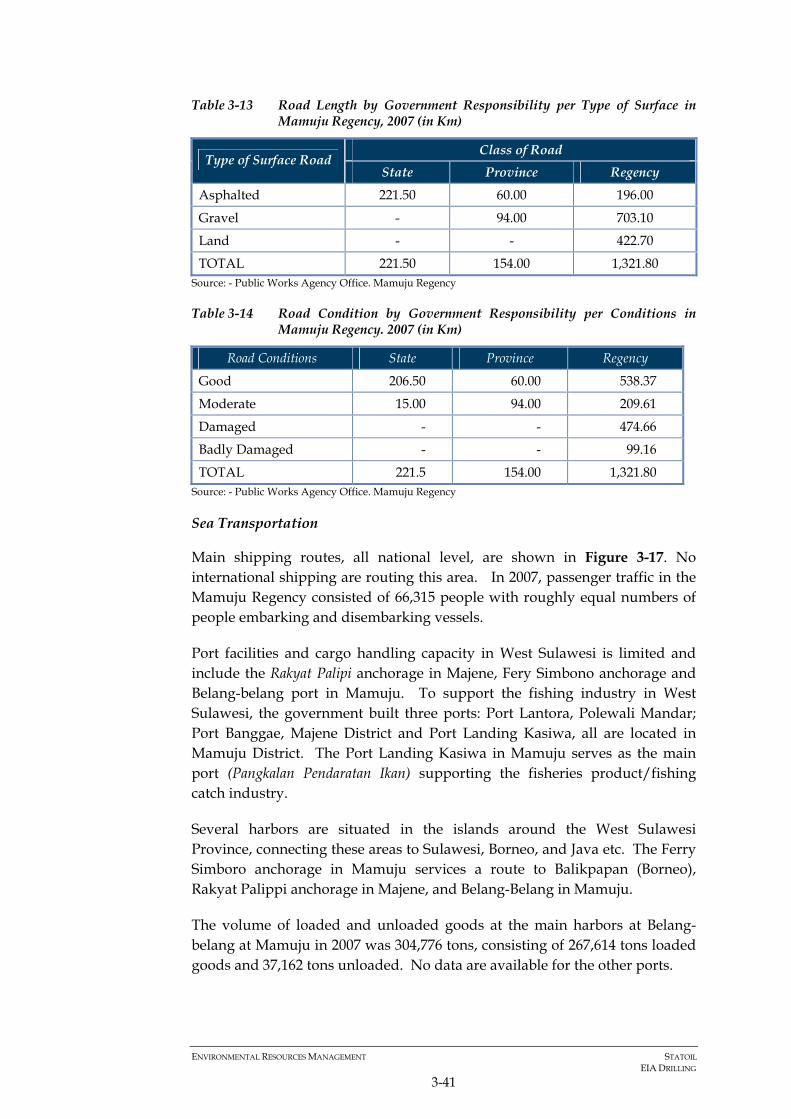
ENVIRONMENTAL RESOURCES MANAGEMENT STATOIL EIA DRILLING
3-41
Table 3-13 Road Length by Government Responsibility per Type of Surface in Mamuju Regency, 2007 (in Km)
Class of Road Type of Surface Road
State Province Regency
Asphalted 221.50 60.00 196.00
Gravel - 94.00 703.10
Land - - 422.70
TOTAL 221.50 154.00 1,321.80 Source: - Public Works Agency Office. Mamuju Regency
Table 3-14 Road Condition by Government Responsibility per Conditions in Mamuju Regency. 2007 (in Km)
Road Conditions State Province Regency
Good 206.50 60.00 538.37
Moderate 15.00 94.00 209.61
Damaged - - 474.66
Badly Damaged - - 99.16
TOTAL 221.5 154.00 1,321.80 Source: - Public Works Agency Office. Mamuju Regency
Sea Transportation
Main shipping routes, all national level, are shown in Figure 3-17. No international shipping are routing this area. In 2007, passenger traffic in the Mamuju Regency consisted of 66,315 people with roughly equal numbers of people embarking and disembarking vessels.
Port facilities and cargo handling capacity in West Sulawesi is limited and include the Rakyat Palipi anchorage in Majene, Fery Simbono anchorage and Belang-belang port in Mamuju. To support the fishing industry in West Sulawesi, the government built three ports: Port Lantora, Polewali Mandar; Port Banggae, Majene District and Port Landing Kasiwa, all are located in Mamuju District. The Port Landing Kasiwa in Mamuju serves as the main port (Pangkalan Pendaratan Ikan) supporting the fisheries product/fishing catch industry.
Several harbors are situated in the islands around the West Sulawesi Province, connecting these areas to Sulawesi, Borneo, and Java etc. The Ferry Simboro anchorage in Mamuju services a route to Balikpapan (Borneo), Rakyat Palippi anchorage in Majene, and Belang-Belang in Mamuju.
The volume of loaded and unloaded goods at the main harbors at Belang-belang at Mamuju in 2007 was 304,776 tons, consisting of 267,614 tons loaded goods and 37,162 tons unloaded. No data are available for the other ports.

ENVIRONMENTAL RESOURCES MANAGEMENT STATOIL EIA DRILLING
3-42
Figure 3-17 Transportation lines

ENVIRONMENTAL RESOURCES MANAGEMENT STATOIL EIA DRILLING
3-43
Air Transportation
In 2007, passengers from the Tampa Padang Airport were about 5,878 people, where the number of departed passenger is 3,061 people, and the number of arrived passenger is 2,817 people. The volume of unloaded baggage goods at the Tampa Padang Airport in 2007 was about 15,271 kg; meanwhile the volume of up loaded goods was 14,549 kg.
3.2.17.2 Telecommunication
The number of Telephone Lines Based on Customers Categories in Mamuju Regency is presented in Table 3-15.
Table 3-15 Number of Telephone Lines Based on Customers Categories in Mamuju Regency
Year Customer’s Category 2002 2003 2004
(%)
Residence 1,284 1,282 1,371 83.80 Hotel/Motel 15 15 15 0.92 Shopping Centre 79 81 84 5.13 Government & Private Company 102 105 110 6.72 Social Purposes - - - 0.00 Public Telephone 61 56 56 3.43 TOTAL 1,541 1,539 1,636 100.00 Source : Monography of Mamuju Regency, 2006
3.2.17.3 Commercial Infrastructure
The commercial infrastructure in the Mamuju Regency region is basic and includes markets, shops, restaurants, hotels/motels and post offices (Table 3-16).
Table 3-16 Number of Facilities of Trading and Services in Mamuju Regency
No Facility Number of Facility (Unit) (%)
1 Market 54 30.67 2 Shop 2 1.14 3 Restaurant (Small) 84 47.73 4 Hotel/Motel 30 17.05 5 Pos Office 6 3.41 Total 176 100.00
Source : Spatial Planning of Mamuju Regency. 2007
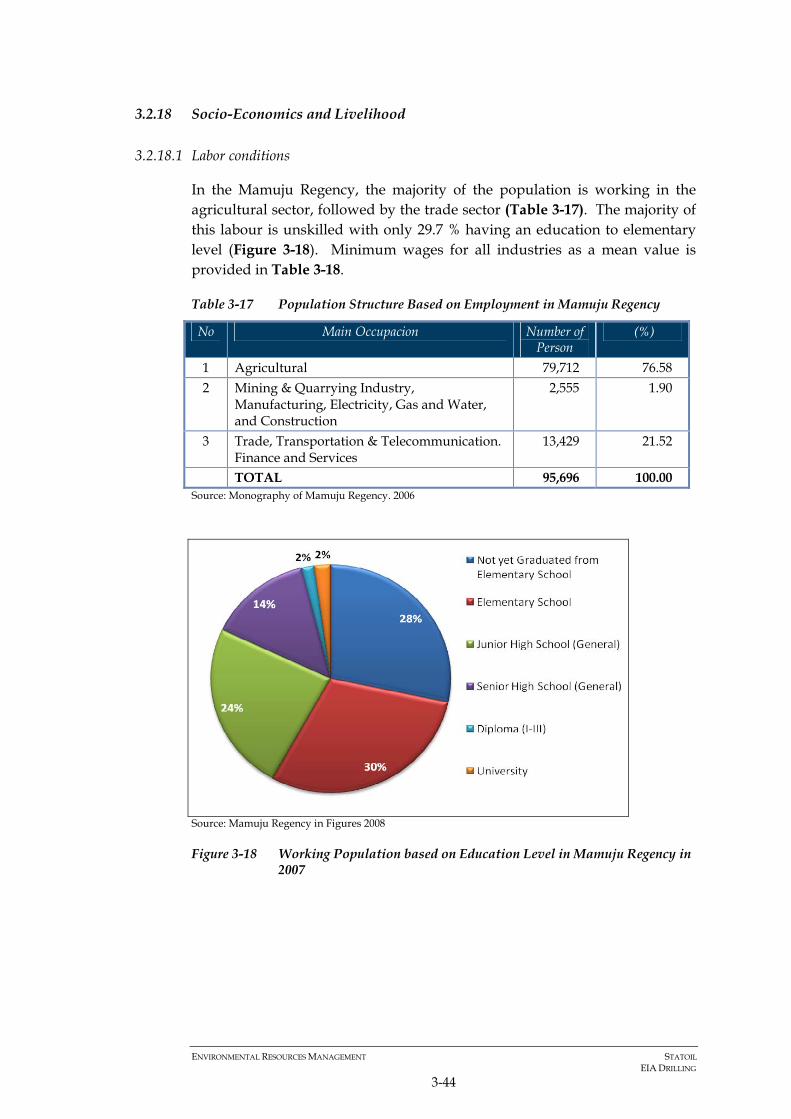
ENVIRONMENTAL RESOURCES MANAGEMENT STATOIL EIA DRILLING
3-44
3.2.18 Socio-Economics and Livelihood
3.2.18.1 Labor conditions
In the Mamuju Regency, the majority of the population is working in the agricultural sector, followed by the trade sector (Table 3-17). The majority of this labour is unskilled with only 29.7 % having an education to elementary level (Figure 3-18). Minimum wages for all industries as a mean value is provided in Table 3-18.
Table 3-17 Population Structure Based on Employment in Mamuju Regency
No Main Occupacion Number of Person
(%)
1 Agricultural 79,712 76.58 2
Mining & Quarrying Industry, Manufacturing, Electricity, Gas and Water, and Construction
2,555 1.90
3 Trade, Transportation & Telecommunication. Finance and Services
13,429 21.52
TOTAL 95,696 100.00 Source: Monography of Mamuju Regency. 2006
Source: Mamuju Regency in Figures 2008
Figure 3-18 Working Population based on Education Level in Mamuju Regency in 2007
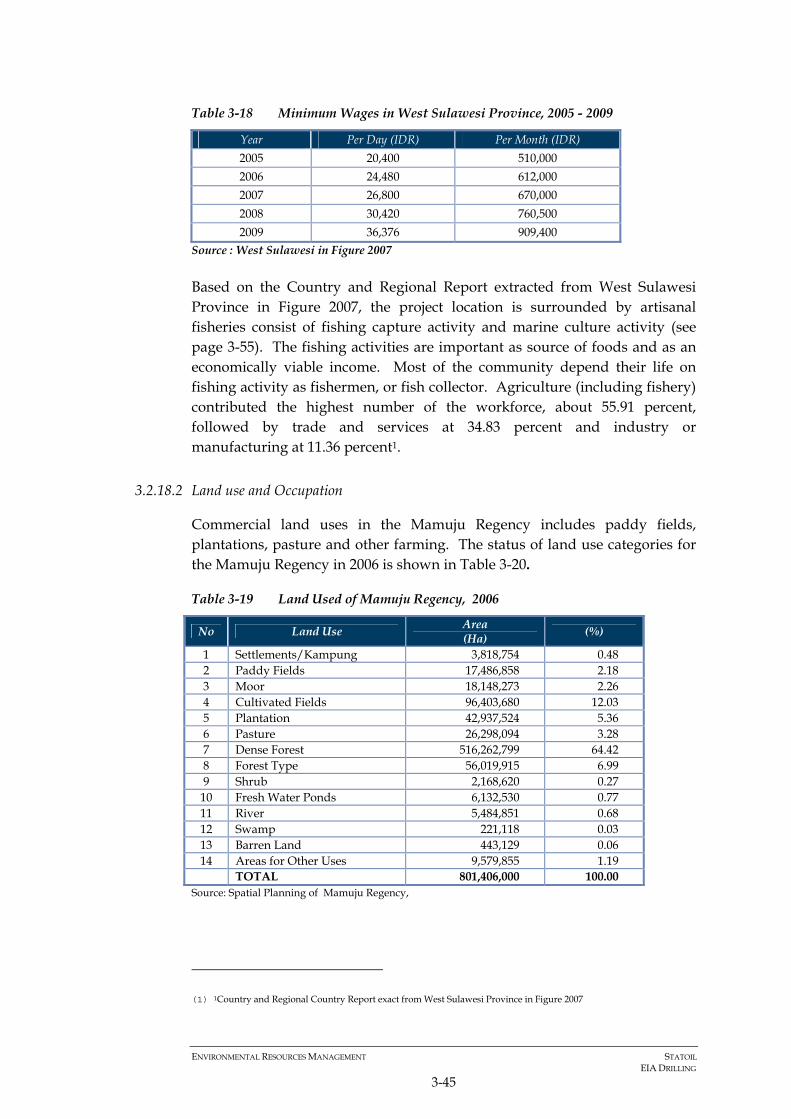
ENVIRONMENTAL RESOURCES MANAGEMENT STATOIL EIA DRILLING
3-45
Table 3-18 Minimum Wages in West Sulawesi Province, 2005 - 2009
Year Per Day (IDR) Per Month (IDR) 2005 20,400 510,000 2006 24,480 612,000 2007 26,800 670,000 2008 30,420 760,500 2009 36,376 909,400
Source : West Sulawesi in Figure 2007
Based on the Country and Regional Report extracted from West Sulawesi Province in Figure 2007, the project location is surrounded by artisanal fisheries consist of fishing capture activity and marine culture activity (see page 3-55). The fishing activities are important as source of foods and as an economically viable income. Most of the community depend their life on fishing activity as fishermen, or fish collector. Agriculture (including fishery) contributed the highest number of the workforce, about 55.91 percent, followed by trade and services at 34.83 percent and industry or manufacturing at 11.36 percent1.
3.2.18.2 Land use and Occupation
Commercial land uses in the Mamuju Regency includes paddy fields, plantations, pasture and other farming. The status of land use categories for the Mamuju Regency in 2006 is shown in Table 3-20.
Table 3-19 Land Used of Mamuju Regency, 2006
No Land Use Area (Ha) (%)
1 Settlements/Kampung 3,818,754 0.48 2 Paddy Fields 17,486,858 2.18 3 Moor 18,148,273 2.26 4 Cultivated Fields 96,403,680 12.03 5 Plantation 42,937,524 5.36 6 Pasture 26,298,094 3.28 7 Dense Forest 516,262,799 64.42 8 Forest Type 56,019,915 6.99 9 Shrub 2,168,620 0.27 10 Fresh Water Ponds 6,132,530 0.77 11 River 5,484,851 0.68 12 Swamp 221,118 0.03 13 Barren Land 443,129 0.06 14 Areas for Other Uses 9,579,855 1.19 TOTAL 801,406,000 100.00
Source: Spatial Planning of Mamuju Regency,
(1) 1Country and Regional Country Report exact from West Sulawesi Province in Figure 2007

ENVIRONMENTAL RESOURCES MANAGEMENT STATOIL EIA DRILLING
3-46
As shown in the above table, the predominant form of land cover is dense forest (64.42%) followed by cultivated fields or farming (12.03%). Based on forest maps, 34.7% of the forest coverage is designated as protection forests. Production forests account for 7.8% of the total forest area, convertible production forest 6.2 %, and limited production forest 31.5%, with 19% for other uses (Table 3-20). The majority of the protection forests are located in the eastern part of the regency far from the area of influence of the project.
Table 3-20 Spatial Distribution of Forest Function in Mamuju Regency, 2006
Type of Forest Area ( Ha ) Percent Protection Forest 257.543 34.7 Production Forest 57,781 7.8 Conversion Production 46,452 6.2 Limited Production 234,182 31.5 Lake/Water 3,685 0.5 Areas for Other Uses 143,389 19.3 TOTAL 743,032 100.0 Source: Country and Regional Profile Report, 2008 page III-10
3.2.18.3 Fishing
Species targeted
Fish species targeted in the area include pelagic, demersal and coral fish species. These fish are either sold fresh or processed. The economically important species are Skipjack tuna (Katsuwonus pelamis), Eastern little tuna (Euthunnus affinis), big eye tuna (Thunus obesus), albacore (Thunnus alalungga), yellow fine tuna (Thunnus albaceres), Cob (Auxis thazard), lacepede (Scromberamorus commerson), Baramundi (Lates calcalifer), and groupers such as honey comb groupers (Plectropoma leopardus), rabbit fish (Siganus gutatus), and red snappers (Lutjanus frontalis), banded grunts (Therapon theraps), rabbit fish (Siganus gutatus), grouper (Epinephelus tauvina), yellowtails (Caesio Erythrogaster), (Stolephorus spp). Other catches include sardinella (Clupea spp) and mackerel (Rastrelliger spp), Lola (Trochus spp), lobsters (Panulirus spp), sea cucumbers, and other types of molluscs.
Based on data from Department of Fisheries and Marine of Mamuju in 2006, the economically important species are shown in Table 3-21.
Table 3-21 Local and Scientific Names and Value of Mainly Fish Caught in 2006
No Local/Common name
English term Scientific name Production
(ton) Total Value (x Rp 1,000)
A. Type of Fish 1 Keraphu Grouper Epinephus sp 40 1,080,000
2 Cucut Shark Sphyma 25 315,000
3 Layang Sardine Decapterus russelli 970 3,395,000
4 Teri Anchovy Stolephorus sp. 38 114,000
5 Tembang Sardine Sardinella 72 180,000
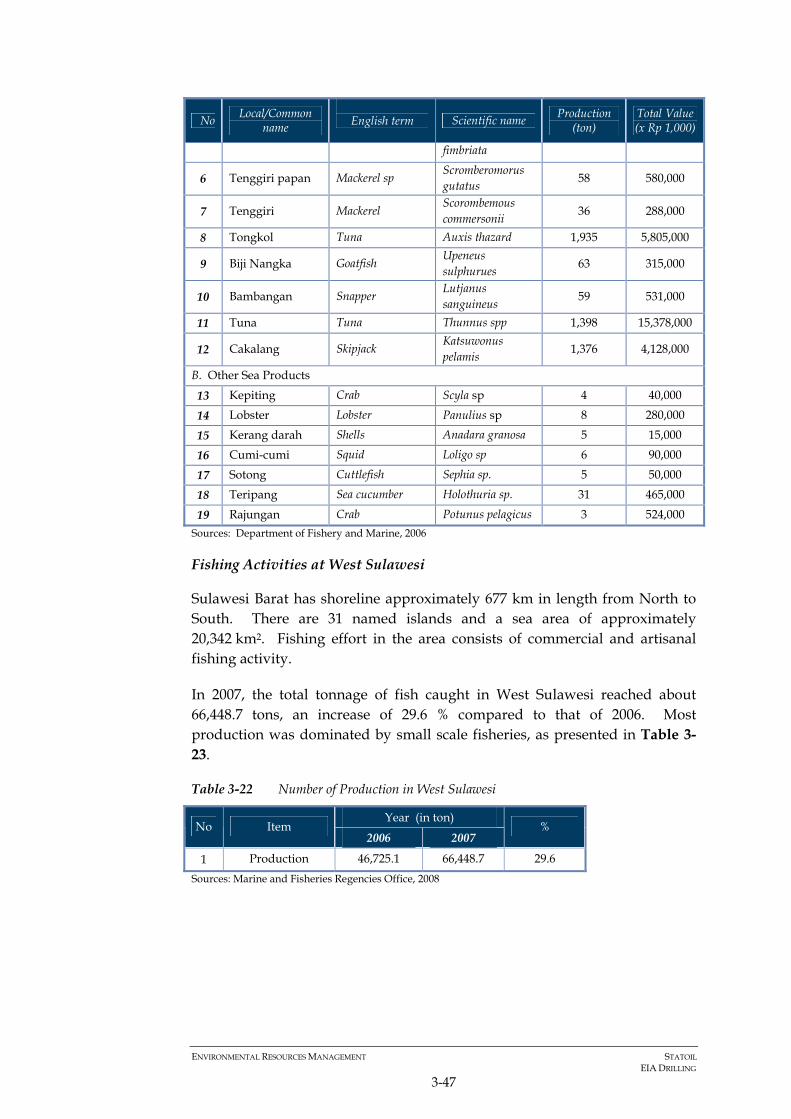
ENVIRONMENTAL RESOURCES MANAGEMENT STATOIL EIA DRILLING
3-47
No Local/Common name
English term Scientific name Production
(ton) Total Value (x Rp 1,000)
fimbriata
6 Tenggiri papan Mackerel sp Scromberomorus gutatus 58 580,000
7 Tenggiri Mackerel Scorombemous commersonii 36 288,000
8 Tongkol Tuna Auxis thazard 1,935 5,805,000
9 Biji Nangka Goatfish Upeneus sulphurues 63 315,000
10 Bambangan Snapper Lutjanus sanguineus 59 531,000
11 Tuna Tuna Thunnus spp 1,398 15,378,000
12 Cakalang Skipjack Katsuwonus pelamis 1,376 4,128,000
B. Other Sea Products
13 Kepiting Crab Scyla sp 4 40,000
14 Lobster Lobster Panulius sp 8 280,000
15 Kerang darah Shells Anadara granosa 5 15,000
16 Cumi-cumi Squid Loligo sp 6 90,000
17 Sotong Cuttlefish Sephia sp. 5 50,000
18 Teripang Sea cucumber Holothuria sp. 31 465,000
19 Rajungan Crab Potunus pelagicus 3 524,000 Sources: Department of Fishery and Marine, 2006
Fishing Activities at West Sulawesi
Sulawesi Barat has shoreline approximately 677 km in length from North to South. There are 31 named islands and a sea area of approximately 20,342 km2. Fishing effort in the area consists of commercial and artisanal fishing activity.
In 2007, the total tonnage of fish caught in West Sulawesi reached about 66,448.7 tons, an increase of 29.6 % compared to that of 2006. Most production was dominated by small scale fisheries, as presented in Table 3-23.
Table 3-22 Number of Production in West Sulawesi
Year (in ton) No Item
2006 2007 %
1 Production 46,725.1 66,448.7 29.6 Sources: Marine and Fisheries Regencies Office, 2008

ENVIRONMENTAL RESOURCES MANAGEMENT STATOIL EIA DRILLING
3-48
The fish capture production by regency is as follows:
Table 3-23 Commodity of high economic value in 2006 and 2007
Year (in ton) 2006 2007
No Type of fish
Mam
uju
Nor
th M
amuj
u
Maj
ene
Polew
ali U
tara
Mam
uju
Nor
th M
amuj
u
Maj
ene
Polew
ali U
tara
1 Tuna 2,145 10.5 782 3,126 13,869 356 1,135 3,129
2 Skipjack 2,911 4.0 694 3,161 2,978 381 754 3,161
3 Tuna sp 3,314 - 790 3,374 3,497 300 923 3,374
4 Mackerel 3,0 3.0 51 124 21 55 55 124
5 Grouper 78,0 - 43 55 139 - 56 55
6 Snapper 101 8.9 224 223 84 21 133 223
7 Sea Cucumber - - 7.6 2.1 103 - 11 2,1
Total 8.552 26.4 2,591 10,067 20,693 1,114 3,068 10,069 Sources: Marine and Fisheries Regencies Officer, 2008
Fishing effort in West Sulawesi is dominated by small boats which of < 5 tonnes, many without engine or with small outboard motors (Table 3-26). Fishing vessels may originate from Sulawesi or outside, e.g. Bala Balakang, is the one fishing ground that brings fishermen from outside Sulawesi e.g Pekalongan and Indramayu – Central Java. The location of fishing areas is shows in Figure 3-19 while numbers of fishing vessels are shown in Table 3-24.
Table 3-24 Numbers of fishing vessel by regencies in 2006 and 2007 (unit)
Year (in ton) 2006 2007
No Categories
Mam
uju
Nor
th M
amuj
u
Maj
ene
Pole
wal
i Uta
ra
Mam
uju
Nor
th M
amuj
u
Maj
ene
Pole
wal
i Uta
ra
1 Non-powered motores 1,450 - 1,472 573 1,450 - 1,472 593 2 Out-boards motors 621 1,191 830 733 621 1,191 830 789 3 Boats motors 4 < 5 Gross tonnage (GT) 521 288 702 398 521 288 702 351 5 5 – 10 Gross tonnage (GT) 52 - 236 81 52 - 236 82 Total 2,644 1,479 3,240 1,785 2,644 1,479 3,240 1,815
Sources: Marine and Fisheries Regencies Officer, 2008

ENVIRONMENTAL RESOURCES MANAGEMENT STATOIL EIA DRILLING
3-49
Fishing methods
There are various types of fishing activity in this area which are Purse Seine, Hooks and lines, stake trap, bamboo fish pond, lift Net, spearing gear, dredges and Lola (Trochus spp) fishing boat. The number of known fishing units in West Sulawesi is provided in Table 3-25.
Table 3-25 Numbers and type of fishing gears in West Sulawesi (unit)
No Name of fishing gears Total (unit) 1 Mini purse seine 522 2 Beach seine 269 3 Drift gill net 2,778 4 Encicling gill net 319 5 Set Gill net 598 6 Boat lift sets 72 7 Fish trap with lamp 58 8 Fish trap 72 9 Drift line 58 10 Troil line 27 11 Hand line 2,406 12 Hook 2,457 13 Set Rip Line 1,871 14 Other Pole and Line 777 15 Other Pole and line 1,270 16 Fish pots 66 17 Shell Fish Collection 104 18 Sea Cucumber Collection 62 19 Fish Plummet 3
Sources: Marine and Fisheries Regencies Officer, 2008

ENVIRONMENTAL RESOURCES MANAGEMENT STATOIL EIA DRILLING
3-50
Figure 3-19 Potential fishing areas

ENVIRONMENTAL RESOURCES MANAGEMENT STATOIL EIA DRILLING
3-51
A summary of fishing activity by gear type for the Mamuju District is shown in Table 3-27. Fishermen indicated that they fished throughout the year. However, different types of fishing are used at different times of the year e.g. June to October is the season for Purse Seine, and December to January is the season for stake trap. On average, fishing activity occurs on 10 to 20 days per month.
Some fishers also practice the use of ‘rumpon’ or Fish Aggregation Devices (FAD) set at the fishing grounds to catch the fish. Based on seismic data in 2008, approximately 81 rumpon were identified in the Karama Block and its vicinity (Figure 3-20 and Table 3-26). Most of the rumpon are owned by fishermen originally from Mamuju, Kaluku, Pasang Kayu, and Baras. Rumpon in Karama Block and its vicinity are located whithin 6 to 40 miles from shoreline. The main aqua culture were identified as extending approximately 2-10 meter from the shore lines and distributed 3-8 meters depth.
Table 3-26 Category and Numbers of FAD in Karama Block, 2008
No FAD Category Numbers
1 Inside Karama Block 35 2 Outside Karama Block 46 Total 81
Sources: Environmental Management and Monitoring Effort Document – Offshore 3D Seismic Survey in Kuma and Karama Blocks, Makasar Strait, 2008

ENVIRONMENTAL RESOURCES MANAGEMENT STATOIL EIA DRILLING
3-52
Table 3-27 Summary of Fishing Activities in Mamuju District
Type of Fishing Gear (Activity)
Parameter Surrounding nets (Purse Seine)
Hooks and lines
Seine nets (stake trap)
Traps (bamboo fish
pond)
Failing gear (Lift Net)
Grappling and wounding
gears (Spearing
gear)
Dredges
*Lola (Trochus spp) fishing
boat)
Approximate number of fishermen
Not defined Not defined Not defined Not defined Not defined Not defined Not defined Not defined
Fishing time One day fishing (carried out at night)
One day fishing
2 to 3 days One day fishing
3 month
Fishing frequency (trip/month)
22 20 4 trip/week 10 20 10 /month 15
characterization of vessels (dimension of the boat in meters)
( 12 x 2.5 x 1.5 ) - Small boat (Katinting)
(15 x 1.5 x 1.5) m
Number of personnel per boat
14 - 2 4-7
Species captured Skipjack tuna (Katsuwonus pelamis) and Eastern little tuna (Euthunnus affinis)
Groupers (Epinephelus tauvina), honey comb groupers (Plectropoma leopardus), rabbit fish (Siganus gutatus), and red snappers (Lutjanus frontalis)
banded grunts (Therapon theraps), rabbit fish (Siganus gutatus), groupers (Epinephelus tauvina), squid (Illex argentinus) and others
groupers (Epinephelus tauvina), honey comb groupers (Plectropoma leopardus), rabbit fish (Siganus gutatus), red snappers (Lutjanus frontalis), and yellowtails (Caesio Erythrogaster)
anchovies (Stolephorus spp), Beside anchovies, other catches include sardinella (Clupea spp) and mackerel (Rastrelliger spp)
groupers (Epinephelus tauvina), honey comb groupers (Plectropoma leopardus, rabbit fish (Siganus gutatus), and red snappers (Lutjanus frontalis)
groupers (Epinephelus tauvina), rabbit fish (Siganus gutatus), and other coral reef fish
Lola (Trochus spp), lobsters (Panulirus spp), sea cucumbers, and other types of mollusks
Estimate of catches (kg)
300 -2,000 1-4 fish 1-4 or 1-10 bundles
25-50 2-3 quintals
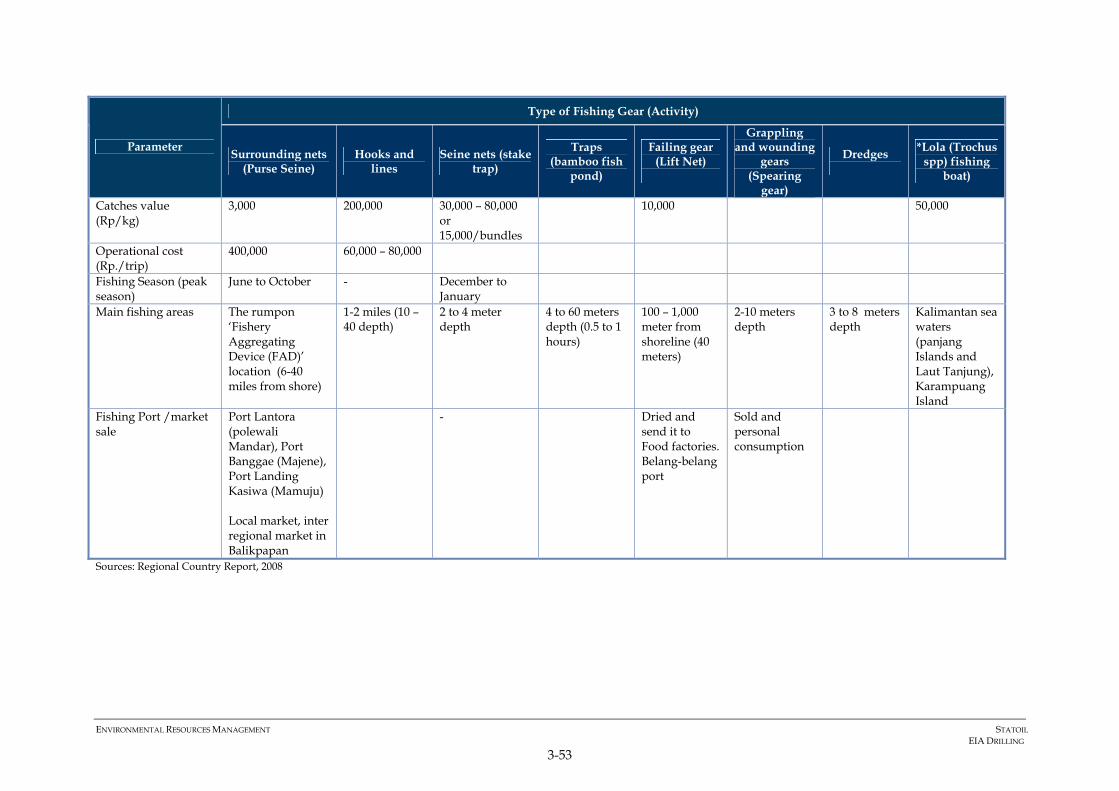
ENVIRONMENTAL RESOURCES MANAGEMENT STATOIL EIA DRILLING
3-53
Type of Fishing Gear (Activity)
Parameter Surrounding nets (Purse Seine)
Hooks and lines
Seine nets (stake trap)
Traps (bamboo fish
pond)
Failing gear (Lift Net)
Grappling and wounding
gears (Spearing
gear)
Dredges
*Lola (Trochus spp) fishing
boat)
Catches value (Rp/kg)
3,000 200,000 30,000 – 80,000 or 15,000/bundles
10,000 50,000
Operational cost (Rp./trip)
400,000 60,000 – 80,000
Fishing Season (peak season)
June to October - December to January
Main fishing areas The rumpon ‘Fishery Aggregating Device (FAD)’ location (6-40 miles from shore)
1-2 miles (10 – 40 depth)
2 to 4 meter depth
4 to 60 meters depth (0.5 to 1 hours)
100 – 1,000 meter from shoreline (40 meters)
2-10 meters depth
3 to 8 meters depth
Kalimantan sea waters (panjang Islands and Laut Tanjung), Karampuang Island
Fishing Port /market sale
Port Lantora (polewali Mandar), Port Banggae (Majene), Port Landing Kasiwa (Mamuju) Local market, inter regional market in Balikpapan
- Dried and send it to Food factories. Belang-belang port
Sold and personal consumption
Sources: Regional Country Report, 2008

ENVIRONMENTAL RESOURCES MANAGEMENT STATOIL EIA DRILLING
3-54
Figure 3-20 Rumpon location

ENVIRONMENTAL RESOURCES MANAGEMENT STATOIL EIA DRILLING
3-55
3.2.18.4 Marine Aquaculture
The potential area for marine aquaculture in West Sulawesi is about 150,125 ha spreading into 4 coastal regencies located along Makasar strait, comprising Mamuju, Majene, Polewali Mandar and North Mamuju. The potential area for seaweed aquaculture is about 20,300 ha. Up to 2008, about 755 ha have been exploited; however, fisheries using floating net cover an area of about 38,600 ha. There are around 19,159 ha still remaining as potential area for marine aquaculture. Data of brackish water pond are not available.
Seaweed cultivation occurs in the Mamuju Regency. The seaweed species cultivated in this area is Euchema cononii . The potential area of seaweed in Mamuju Regency is about 1,595 ha. The number of fishery households is about 365, with total production reaching 750 ton/year.
The main centers of seaweed cultivation are located in Mamuju, Tadui, Bamboo, and Karampuang villages (Mamuju and Babanga, Siyonyoi, and Belang-Belang villages (Kaluku District) (Table 3-28).
Table 3-28 Potential areas of seaweed, production and numbers of households
No District Potential Area (ha)
Seaweed operation
units
Production (tonnes)
Fisheries Household
1 Mamuju 685 150 225 113
2 Kaluku 300 200 300 150
3 Papalang 50 50 75 37
Sources: Department of Fisheries and Marine, 2008
Seaweed cultivation takes place at a distance of 100 m from the shore and a water depth of 1-3 m. Seedlings clusters approximately 60 grams in weight are tied by a rope at the location and placed in 25 cm intervals. The area of seaweed cultivation in relation to the Karama Block is presented in Figure 3-21.

ENVIRONMENTAL RESOURCES MANAGEMENT STATOIL EIA DRILLING
3-56
Figure 3-21 Seaweed cultivation area

ENVIRONMENTAL RESOURCES MANAGEMENT STATOIL EIA DRILLING
3-57
3.2.18.5 Tourist activities
Maritime tourism in West Sulawesi is focused on five popular beaches: Karampuang, Bakengkeng white sand, Datok Pangale, Gusung Toraja Island, Palipis and Labuang beaches. Two of these five beaches, Karampuang and Bakengkeng are located in the Mamuju Regency in the West Sulawesi Province. Tourist activities include diving and boat tours and sailing in traditional outriggers of various sizes; namely ‘Sandeq’ the biggest, ‘soppe-soppe’ the medium and ‘lepa-lepa’ the smallest. The main dive sites are outwith the Karama Block.
3.2.19 Health
3.2.19.1 Life Expectancy and General Health Conditions
Life expectancy (LE) in the region varies among provinces. Over the period 2000 to 2005 the lowest was in Nusa Tenggara Barat with 60.9 years and the highest was in Yogyakarta with 73.0 years. Life Expectancy in Sulawesi Barat was not reported, but can be predicted using the Sulawesi Selatan Province LE, which is 66.3 years and projected to be 70.9 years in 2010 – 2015.
3.2.19.2 Health Trends
The data of Mamuju Regency for the years 2005 - 2007 are provided in Table 3-29. The accuracy of health data is dependent upon a number of factors, not least the availability of medical facilities/resources, reporting and accuracy of medical diagnosis. However, such data can provide an indication of the main issues in the community. The occurrence of diarrhea including dysentery and suspected cholera are noteworthy because of their epidemic nature and link to poor sanitation conditions.
Similarly, infant mortality rates (IMR) are commonly included as a part of standard of living evaluations as an indicator of level of health or development, and as a component of the physical quality of life index. The standard definition of IMR is the number of deaths that occur in the first year of life for 1000 live births. Table 3-30 provides live birth data but this is only available for births at hospitals and health centers in the region and does not include data for infants under 1 year old. The IMR of 19 per 1000 live births is calculated from the data for 2007. Indonesia has an IMR of 26.6 (UN, 2006).

ENVIRONMENTAL RESOURCES MANAGEMENT STATOIL EIA DRILLING
3-58
Table 3-29 Number of Patient and Death by Kind of Disease In Mamuju Regency, 2005-2007
2005 2006 2007 Disease Patient Death Patient Death Patient Death
Dengue 6 2 2 - 2 - Cholera - - - - - - Diarrhea 3 595 6 1 560 3 14 963 4 Thypus 80 - 998 - 2 398 - Rabies 24 - - - 90 - Tuberculosis (TB C) 246 - 260 - 87 20 Tetanus - - - - - - Leprosy 37 - 40 - 34 Feverish 307 - 198 - - - Diphtheria - - - - - - Venereal 17 - 227 - 32 - Meningitis - - - - - - Encephalitis - - - - - - Source: Health Service of Mamuju Regency
Table 3-30 Number of live births per District in Mamuju Regency, 2005-2007
2005 2006 2007 Sub-District Life
Birth Died Life Birth Died Life Birth Died
Tapalang 350 - 207 2 (0.97) 145 4 (2.76) Tapalang Barat 90 - 82 1 (1.22) 151 7 (4.64) Mamuju 339 3 (0.88) 747 11 (1.47) 751 10 (1.33) Simboro Kep 382 - 367 8 (2.18) 408 5 (1.23) Kalukku 290 - 569 - 653 1 (0.15) Papalang 201 - 274 4 (1.46) 316 12 (3.80) Sampaga 411 3 (0.73) 217 1 (0.46) 203 6 (2.96) Tommo 140 3 (2.14) 220 1 (0.45) 281 3 (1.07) Kalumpang 109 - 138 2 (1.45) 226 6 (2.65) Bonehau 168 1 (0.60) 99 3 (3.03) 140 2 (1.43) Budong-Budong 171 - 301 5 (1.66) 276 8 (2.90) Pangale 277 3 (1.08) 164 1 (0.61) 142 3 (2.11) Topoyo 165 - 234 4 (1.71) 230 5 (2.17) Karossa 154 - 134 5 (3.73) 302 10 (3.31) Tobadak 182 1 (0.55) 330 5 (1.52) 306 7 (2.29) TOTAL 3,429 14 (0.41) 4,083 53 (1.30) 4,530 89 (1.96) Source: Health Service of Mamuju Regency
3.2.19.3 Health Facilities
The 2007 data indicate that health facilities in Mamuju Regency have improved since 2005. The health facilities in the sub-districts area consist of government funded village health centers and a new district health center. According to data from the Health Service of Mamuju Regency, the number

ENVIRONMENTAL RESOURCES MANAGEMENT STATOIL EIA DRILLING
3-59
of health facilities and staff in the villages are tabulated in (Table 3-31 and Table 3-32):
Table 3-31 Number of Health Facilities per District in Mamuju Regency, 2007
General Hospital
Sub-District
State Private
Public Health Center
Public Health
Sub Center
Medical Clinic
Pharmacy Storage
Private Medical Doctor
Village Medical
Unit
Tapalang - - 1 3 - - 2 3
Tapalang Barat - - 1 4 - - - 2
Mamuju 1 - 2 5 - 1 17 5
Simboro Kep - - 3 6 - - - 3
Kalukku - - 2 8 - - 3 2
Papalang - - 1 5 - - 1 2
Sampaga - - 1 5 - - 1 2
Tommo - - 2 7 - - 2 4
Kalumpang - - 1 5 - - 2 4
Bonehau - - 2 7 - - 1 5
Budong-Budong - - 1 9 - - 3 4
Pangale - - 2 6 - - - 3
Topoyo - - 1 12 - 1 2 3
Karossa - - 2 10 - - 2 6
Tobadak - - 1 7 - - 6 2
TOTAL - 2007 1 - 23 99 - 1 42 50
- 2006 1 - 18 91 - 29 1 -
- 2005 1 - 17 86 - 29 1 -
Source: Health Service of Mamuju Regency
As reported in 2007, there are 216 health facilities in Mamuju Regency, consisting of one Hospital, 23 of Puskesmas, 99 Ministrant Puskesmas, 1 pharmacy, 42 private clinic, and 50 Poskesdes (Table 3-32). Those facilities are still inadequate compared to the number of population to serve and the sub-province broad area which still remote and not entirely accessible.
Table 3-32 Number of Paramedic by Kinds of Paramedic per Sub-District in Mamuju Regency, 2007
Doctor Sub-District Medical
Doctor Dentist Specialis Doctor
Nurse Midwife Baby soothayer
Tapalang 3 - - 7 3 19 Tapalang Barat - 1 - 8 4 12 Mamuju 5 1 - 24 7 32 Simboro dan Kep. 2 - - 7 5 14 Kalukku 2 - - 19 7 53 Papalang 1 - - 9 1 21 Sampaga 1 2 - 10 2 13 Tommo - 2 - 15 4 27 Kalumpang - - - 7 1 20 Bonehau - - - 10 4 14 Budong-Budong - - - 13 4 16 Pangale - - - 9 - 13 Topoyo 3 - - 22 2 24 Karossa 2 - - 12 4 30 Tobadak - - - 6 1 16 TOTAL - 2007 19 2 - 178 49 324

ENVIRONMENTAL RESOURCES MANAGEMENT STATOIL EIA DRILLING
3-60
Doctor Sub-District Medical
Doctor Dentist Specialis Doctor
Nurse Midwife Baby soothayer
- 2006 43 9 - 126 67 282 - 2005 20 3 - 126 28 462 Source: Office of Religion Department of Mamuju Regency
3.2.20 Stakeholder Identification and Engagement
Stakeholders are persons or groups who are directly or indirectly affected by a project, as well as those who may have interests in a project and/or the ability to influence its outcome, either positively or negatively. Stakeholders may include locally affected communities or individuals and their formal and informal representatives, national or local government authorities, politicians, religious leaders, civil society organizations and groups with special interest, the academic community, or other businesses.
Information on stakeholders and particularly organizations is important in understanding stakeholder characteristics and potential opinions. Social organizations present in every region of the Mamuju Regency include women’s organizations, including the Family Welfare Movement, youth organizations such as the Forum of People and Police Partnership (FKPM), cooperative or gotong royong (mutual cooperation) groups and other Village Community Force Organizations (LKMD/LPM).
In 2004, cooperative movements in the Mamuju Regency consisted of 40 Village Unit Cooperatives or KUD (Koperasi Unit Desa) and 148 Non KUD (Source: Monography of Mamuju Regency, 2004). No data are available for other social organizations in the Mamuju Regency.
The identification and engagement of stakeholders is based on the criteria of national and international guidelines as follows:
3.2.20.1 National Requirements
Head of the Environmental Management Bureau/Bapedal No. 08 of 2000 addressed Community Engagement and information transparency in the EIA Process. Stakeholder identification is part of the assessment in the EIA process, as detailed in:
• Law No. 23 of 1997 regarding Environmental Management (replaced by Law No 32 of 2009), especially article 5 concerning Community Right, i.e. (1) Equally entitled to a good and healthy environment, (2) Entitled to information about the environment linked, such as EIA, and (3) Entitled to play a role in the framework of environmental management (role in decision making, discussion, etc),
• Government Regulation of Republic of Indonesia No. 27 of 1999 regarding Environment Impact Assessment, article 33 (3) state that within 30 (thirty) working days of the date of the announcement of the activities, interested

ENVIRONMENTAL RESOURCES MANAGEMENT STATOIL EIA DRILLING
3-61
members of the community have the right to propose suggestions, opinions and provide input regarding to the proponent,
• Decree of Head of Environmental Impact Management Agency No. 08 of 2000 regarding Community Involvement and Information Availability in The Process of An Environmental Impact Assessment,
• Regulation of The State Minister of Environment No. 08 of 2006 regarding Guidelines for the Compilation of The Analysis on Environmental Impacts.
3.2.20.2 International Requirements
Stakeholder engagement is an international best-practice approach to engaging with those most impacted by, or with interest in, a particular project or issue. Identifying and engaging with stakeholders on a range of environmental, economic and social issues creates value for a project through promoting a common understanding of issues and a collaborative approach to problem solving.
3.2.20.3 Stakeholders Mapping
Stakeholder mapping for the project included the following groups:
a. Executive Branch
• Ministry of Energy and Mineral Resources – specifically targeting the Directorate General of Oil and Gas
• The Implementing Body for Oil and Gas Upstream Sector (BP Migas)
• West and South Sulawesi Regional Offices of Energy and Mineral Resources
• West Sulawesi Regional Office of Marine Affairs and Fisheries
• West Sulawesi Regional Office of Local Planning
• Mamuju Regency Offices b. Legislative Branch
• House of Representatives (DPR) – specifically Commission VII (Energy, Mineral Resources, Research & Technology and Environment)
• West Sulawesi Regional and Provincial assemblies (i.e. DPRD Kota/Kabupaten) , Commissions C
c. Key Opinion Formers
• NGOs and independent organizations in West Sulawesi
• Two different political orientations of NGOs emerged in Mamuju: the ‘developmentalism’ or ’center’ ideologies and the ‘left leaning’ ideologies.

ENVIRONMENTAL RESOURCES MANAGEMENT STATOIL EIA DRILLING
3-62
The first types of NGOs are willing to cooperate and engage with government programs and companies. Whereas, the latter refuse to negotiate with both the government and private companies. Neither type of NGOs is independent in nature. All are the sub-ordinates of and/or former activists of the nationwide University Students Association.
• Community Groups in the area where Statoil operates (including religious, community and tribal leaders, and relevant farmer/fishermen associations).
3.2.20.4 Typical Stakeholders
The following stakeholders have been identified for the project (Table 3-33).
Table 3-33 Stakeholder Identification and Areas of Interest
Stakeholders Examples of Interest Examples of Stakeholder List Shareholders Profit, performance,
direction Statoil Global
Government Taxation, VAT, legislation, sustainability of natural resources
National, Provincial and regional governments
Workplace Performance, Targets, Wages, Job security, Working conditions
Senior management staff, Non-managerial staff, Labor Union
Community Jobs available, involvement, environmental and social issues
Villages in the surrounding proposed site
Marketplace Value for money, quality, customer care
Customers, suppliers, consumers
Environment, Sustainability, natural resources and systems
NGOs, Community (direct/indirect affected),
A broader mapping of a company's stakeholders may also include:
• Suppliers: Suppliers of a oil company supplies and utilities
• Government regulatory agencies: AMDAL committee and other related government agencies concerned with the regulatory and permit from the national level to local; Ministry of Environment, Ministry of Energy and Minerals Resources, BPH Migas, Ministry of Finance, Bapedalda, etc.
• Industry trade groups: also known as trade associations are organizations founded and funded by businesses that operate in a specific industry.
• Professional associations: this will include KADIN, GAPENSI, GAPEKNAS, INKINDO, etc.
• NGOs and other advocacy groups:
• Prospective employees and prospective Labor Unions: employees will be developed and hired from local communities; experienced professionals will be sourced from other regions of Indonesia and abroad.

ENVIRONMENTAL RESOURCES MANAGEMENT STATOIL EIA DRILLING
3-63
• Prospective customers: prospective customers will be from the West Sulawesi area, other regions of Indonesia and abroad.
• Local communities: fishermen and other villages’ communities in the potential surrounding area of Project.
• Public at large (Global Community): Society of Mamuju Regency, West Sulawesi Province and Indonesia as a whole nation.
• Schools: Local schools in the vicinity of the site and Mamuju Regency.
3.2.20.5 Public Consultation/Engagement
In order to support the implementation of oil and gas exploration (drilling) activities in the Karama Block, Statoil conducted public consultation as part of the internal Environmental Impact Assessment Study. Public consultation activities were implemented as one of the efforts in disseminating information about the plan of oil and gas exploration (drilling) activities which will take place in the area.
Statoil conducted the public consultation in coordination with BP Migas Kalsul representative office and West Sulawesi Province Energy and Mineral Office. The purpose of public consultation is to socialize and inform the plan of oil and gas exploration activity and explain of the potential environmental impact of the drilling activity in Karama Block.
In particular, public consultation is intended:
1) To gather suggestions, opinions, and responses concerning the oil and gas exploration activity.
2) To protect public interest surrounding the activity area from potential impact that may arise from the project.
3) To establish an atmosphere of equal partnerhip between the parties interest in oil and gas exploration activity in Karama Block.
4) To respect the right of all parties to obtain information relating to oil and gas exploration activities in the Karama Block.
Public consultation was conducted in Mamuju which is the nearest city to the project area as well Mamuju is the capital city of West Sulawesi Province and relatively accessible for the entire stakeholders.
Public consultation was attended by the stakeholders that were members of Coordinator/Facilitator/Mediator of the Implementation of Oil and Gas Exploration/Exploitation of West Sulawesi Province which consist of representative of government officials from related institutions in West Sulawesi Province. The public socialization also attended by media and NGO. Detail list of participants and documentation of the public consultation/socialization event are presented in Appendix 4. This public consultation is one model to engage stakeholder by giving them a description

ENVIRONMENTAL RESOURCES MANAGEMENT STATOIL EIA DRILLING
3-64
of the activities to be carried out by the project. The questions, remarks, concerns registered in the public consultation is presented in the Appendix 4.A.
During the public socialization discussion session, the participants were actively involved in providing critical inputs associated with the plan of oil and gas exploration drilling activity in Karama Block. The summary are as follows:
1) Water quality aspect related to drilling cutting and drilling mud management.
2) Social and Economics aspect related to job opportunity for local people, community development program and compensation to rumpon owner and fishing group affected by the activity.
3) More comprehensive socialization activities involving communities proximity to the project location.
3.2.21 Statoil CSR Program
Statoil implemented high standard at its operation regarding Corporate Social Responsibility (CSR) as stated in its governing document FR11 to cover certain aspects such as Social risk management, Human rights, Transparency and anti-corruption, Local spin-offs and Social investment management to be incorporated in the CSR plan. In Indonesia, this CSR plan known as Integrated Community Development Program (ICDP).
In mid 2008, Statoil began the first phase of its Integrated Community Development Program (ICDP) in Mamuju, West Sulawesi. The program was designed as an integrated, yet simple, achievable and measurable response to basic local community needs.
Consensus within Statoil’s Corporate Social Responsibility (CSR) Management Committee established the following principles for ICDP activities: (1) to contribute directly to poverty alleviation, (2) to promote active community participation and foster self-confidence, a sense of ownership, responsibility and transparency among the communities involved, (3) to be local resources-based for efficiency and effectiveness, (4) to promote sustainability by creating community self reliance, (5) to be innovative and provide added value to existing activities and approaches, and (6) to collaborate with the appropriate authorities, promote support and synergy and prevent overlapping functions.
Following more in-depth assessments and consultations with stakeholders in the field, the ICDP decided to address three sectors: (1) Health (2) Education and (3) Microeconomic development as main program to be implemented in Mamuju.

ENVIRONMENTAL RESOURCES MANAGEMENT STATOIL EIA DRILLING
3-65
Health
In this sector, the program was divided into 2 major activities: (1) empowerment for posyandu operators and traditional midwives through training, and (2) provision of a mobile health clinic for free healthcare services.
Statoil trough ICDP program conducted a training for posyandu operators with the support of two local doctors: Dr. Sardiana Salam and Dr. Lindawati Hariandja, the program has provided training for 10 traditional midwives from Bela village, 12 posyandu trainees from Saletto Village and 10 posyandu trainees from Bonehau Village. As the result of the training, the trained mindwives continued to serve Posyandu and community with better knowledge and proper apparatus.
Due to the lack of healthcare services in many areas, particularly more remote places, the ICDP established a mobile health clinic program to respond effectively to communities’ healthcare needs. The mobile health clinic provides easy access healthcare to villagers, who would otherwise need to travel for at least an hour along 10-15 km of difficult roads to the district hospital Village heads have praised the socialization that preceded mobile health clinic operations as well as its consistent and regular service. The district government recognizes that mobile services could be effective in reaching communities in more remote areas.
The mobile health clinic operates with help from a semi-volunteer doctor and assistants who provide free healthcare and free medicines, and disseminate information to communities on basic healthcare and how to handle illnesses. The mobile health clinic operates in areas with limited, or no access to pos yandu. With each visit it serves around 100 people, and in its operations, has helped more than 2800 people. It usually operates from school playgrounds, village heads’ homes or nearby land. Within less than 12 months of operations, the mobile health clinic has provided healthcare services to approximately 2860 people. The mobile clinic provided by the ICDP program did not operate only during the presidential election and the Islamic fasting month.
Education
In this sector the ICDP decided to implement 3 activities under this sector: (1) to renovate or build school classrooms, (2) to provide basic school equipment for students and (3)to combat illiteracy, particularly among adults.
As implementation of this program:
1) Statoil provided shoes, uniforms and books to around 150 students in 4 schools to increasing students’ motivation to attend schools.

ENVIRONMENTAL RESOURCES MANAGEMENT STATOIL EIA DRILLING
3-66
2) Build and renovated 5 schools in as follows constructed a modest new preschool building in Karampuang Simbar on Karampuang Island, renovation of the Keong Mas preschool on Karampuang Island, construction of a new elementary school building in Limbong Bassi in Simboro Archipelago Subdistrict, construction of a new junior high school in Tamalea, Bonehau Subdistrict and build a new classroom in Dongkait, West Tapalang
The evaluations showed that most of the projects have succeeded in increasing school attendance. Most students are now proud of their schools, and are happy to attend them. The new school in Tamalea, Bonehau Subdistrict has been a great help to the students due to its closeness to their homes and convenience ambient. Previously they should cram into small living rooms in community members’ homes who are willing to contribute for such a schooling process, due to unavailability of a school nearby. The nearest school was a one-hour walk away across dangerous, flood-prone terrain during the rainy season.
The illiteracy program began in December 2009 and will continue for 4 months, with 3 two-hour lessons a week. Eighty people from 4 groups are participating in the program, all of whom are farmers aged between 15 and 40 years old living in Karampuang, Batu Pannu, Pasabu and Bonehau villages. Most lessons are conducted in school buildings, including the ICDP supported schools in Bonehau and Karampuang. The tutors are all local teachers who have dedicated their time and energy to using the standard illiteracy.
Economics sector
Mamuju District has substantial natural resources potential. More than 50% of its populace depends on fishing and farming. However, poor management capacity had meant these had yet to provide any significant contributions to the local economy or development. Businesses with significant potential, but needing strengthening, included seaweed, coconut, cacao and coffee production. Community seaweed farming businesses, for instance, still had difficulties in terms of working capital and technical capacity.
Accordingly, the ICDP implemented a local community enterprise empowerment program, divided into several activities: (1) provision of training for selected businesses, (2) provision of additional working and investment capital (around IDR 25 million for each business) including provision of simple apparatus to enhance production efficiency. A selection process and criteria were applied to establish which enterprises would receive support. This process was necessary for avoiding conflict among community businesses and maintaining transparency among community members.
ENVIRONMENTAL RESOURCES MANAGEMENT STATOIL EIA DRILLING
3-67
Following careful assessment and evaluations of the criteria set up by the programme, the ICDP decided to support 3 community businesses. Two were the Anjoro and Marassa coconut cooking oil (known locally as mandar oil) production businesses in Kalukku, owned and managed by two women’s groups, each comprising 10 members. The other was involved in seaweed culture on Karampuang Island.
3.2.22 Identification and Characterization of Indigenous Groups
In terms of the criteria outlined in paragraph 5 of the World Bank’s OD 4.20 on indigenous People, is as follows:
a. A close attachment to ancestral territories and to natural resources in these areas.
b. Self-identification and identification by others as members of a distinct cultural group.
c. Often use a language different from the national language.
d. Presence of customary social and political institutions.
They have their own customary social and political institutions (as embodied in adat –‘customary law’). The Musyawarah, as commonly practiced in Indonesia was also found practiced by this local community.
e. Primarily subsistence-oriented production.
Previously this is the main economic activity of the vast majority of people in the project area. Today they had commercially cultivated the lands for cash crops such like coconut, cloves, coffee and others.
f. Vulnerability to being disadvantaged as social groups in the development process.
g. From the existing regulation applied in Indonesia the definition of ‘indigenous people’ is those who meet the government definition of ‘isolated communities’ under Ministerial Decree No. 5 of 1995.
h. Isolated communities are described in groups of people who live or wonder in dispersed isolated areas and follow a socio cultural system which is ‘isolated and left behind’ in comparison with the rest of Indonesian society. Isolated is understood in terms of both geography and culture where ‘left behind’ is understood in terms of such measures as health, education, housing, clothing and livelihood.
i. Other terms and some characteristic of isolated communities developed by Bappenas (National Planning and Development Agency) are as follows:

ENVIRONMENTAL RESOURCES MANAGEMENT STATOIL EIA DRILLING
3-68
• Nomadic or semi nomadic lifestyle or living in small dispersed bands;
• Livelihood system strongly dependent on the natural environment such as hunting, gathering, fishing or agricultural;
• Inadequate standards of personal hygiene or cleanliness of environment;
• Meager or no clothing;
• Low standard of housing;
• Very limited knowledge and low use of technology;
• Belief system that animistic;
• Strong attachment to their cultural and belief system, which make them cultural closed.
The Mamuju Regency can be categorized as a melting pot of people from various ethnic persuasions. The regency is also the place where people of Mandar, Bugis, Makassar, Toraja, Sa’dan, Manado and Java descent and ethnicity reside and work. Other and unique ethnic that lives in Mamuju Regency, among other are Karampuang Traditional Community.
Using identification criteria of indigenous group, it seems none can be categorized as indigenous in Mamuju even in West Sulawesi.

ENVIRONMENTAL RESOURCES MANAGEMENT STATOIL EIA DRILLING
3-69

ENVIRONMENTAL RESOURCES MANAGEMENT STATOIL EIA DRILLING
4-1
4 IMPACT EVALUATION AND CONTROL
The results of scoping are first presented in this section, followed by an assessment of those aspects of the project scoped as having a potentially significant impact on the environment and/or community. The assessment has been conducted in line with the approach and method described in Section 1.4.
4.1 SCOPING
Scoping aims to set the boundaries for the impact assessment, to identify potential interactions between the project and environmental and social receptors, identify the likely impacts of the Project that require further investigation and to prioritize these in terms of potential significance.
Scoping for the project was conducted in August 2009 in Jakarta involving key members of the project team and ERM consultants. During Scoping the potential for interaction between proposed project activities and aspects of the physical, biological, socio-economic environment was considered and a judgement made on the potential significance of the resultant impact. All those interactions considered to be not significant have been scoped out and not considered further in the impact assessment. The results of Scoping are presented in Figure 4-1 and summarised as:
• Impacts to air quality and climate change due to emissions from the transit of the drill ship to the site, operation of the drill ship, well clean-up/testing activities and from unplanned events (though this is discussed separately);
• Increased noise levels associated with the use of dynamic positioning, operation of the drill ship and helicopters;
• Impact to the seabed and benthic communities from well spudding activities;
• Impacts to water quality due to well spudding, disposal of drilling wastes and casing and cementing activities;
• Impacts on marine ecology (fish and pelagic flora and fauna, marine mammals and reptiles) resulting from increased underwater noise levels associated with the use of dynamic positioning, and from the movement and operation of the drill ship;
• Potential impacts to protected areas during the transit, including mobilization and demobilization of the drill ship;
• Impacts on waste disposal facilities due to wastes generated throughout project activities;
• Impact on fisheries from project activities; and
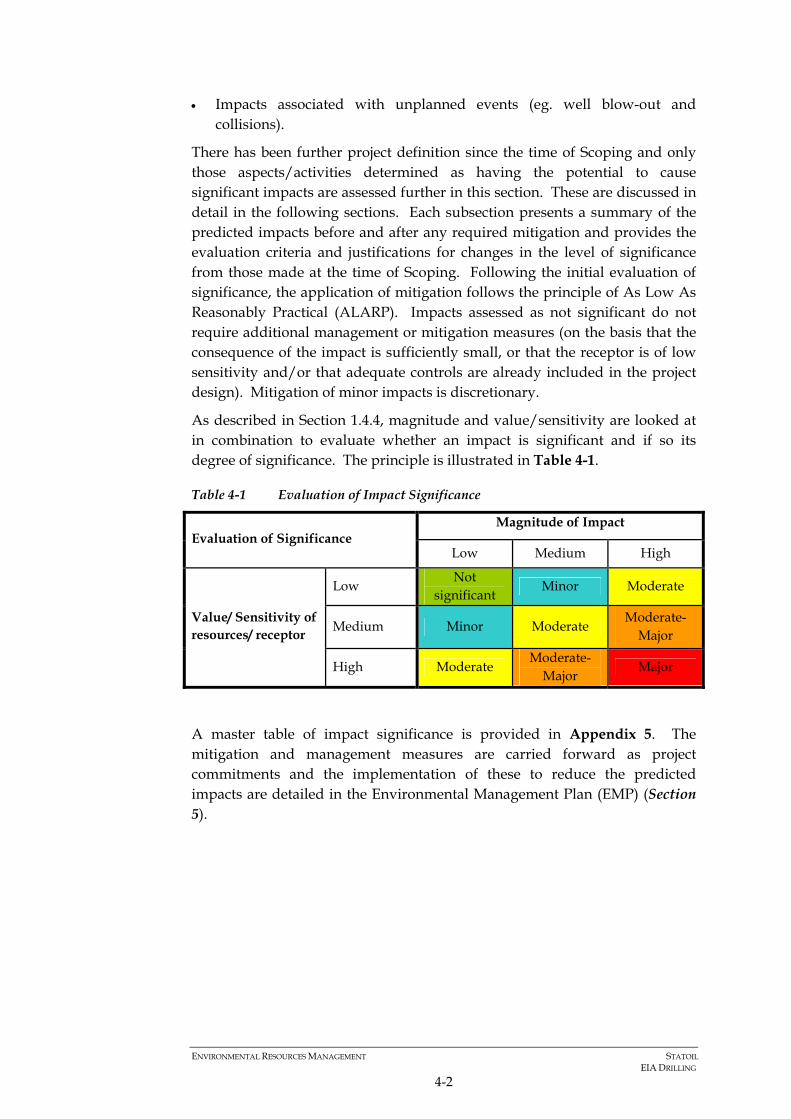
ENVIRONMENTAL RESOURCES MANAGEMENT STATOIL EIA DRILLING
4-2
• Impacts associated with unplanned events (eg. well blow-out and collisions).
There has been further project definition since the time of Scoping and only those aspects/activities determined as having the potential to cause significant impacts are assessed further in this section. These are discussed in detail in the following sections. Each subsection presents a summary of the predicted impacts before and after any required mitigation and provides the evaluation criteria and justifications for changes in the level of significance from those made at the time of Scoping. Following the initial evaluation of significance, the application of mitigation follows the principle of As Low As Reasonably Practical (ALARP). Impacts assessed as not significant do not require additional management or mitigation measures (on the basis that the consequence of the impact is sufficiently small, or that the receptor is of low sensitivity and/or that adequate controls are already included in the project design). Mitigation of minor impacts is discretionary.
As described in Section 1.4.4, magnitude and value/sensitivity are looked at in combination to evaluate whether an impact is significant and if so its degree of significance. The principle is illustrated in Table 4-1.
Table 4-1 Evaluation of Impact Significance
Magnitude of Impact Evaluation of Significance
Low Medium High
Low Not
significant Minor Moderate
Medium Minor Moderate Moderate-
Major Value/ Sensitivity of resources/ receptor
High Moderate Moderate-
Major Major
A master table of impact significance is provided in Appendix 5. The mitigation and management measures are carried forward as project commitments and the implementation of these to reduce the predicted impacts are detailed in the Environmental Management Plan (EMP) (Section 5).

ENVIRONMENTAL RESOURCES MANAGEMENT STATOIL EIA DRILLING
4-3
Figure 4-1 Scoping Matrix
ACTIVITY
Phys
ical
Pre
senc
e (P
erm
anen
t)
Phys
ical
Pre
senc
e (T
empo
rary
)
Phys
ical
Pre
senc
e (M
ovin
g)
Noi
se E
mis
sion
s
Pollu
tant
Em
issi
ons
to A
ir
Ligh
t em
issi
ons
Efflu
ent/
Dis
char
ges
to S
ea
Susp
ende
d So
lids
Was
te D
ispo
sal
Ener
gy U
sage
Acc
iden
tal E
vent
s (S
pills
/ Dro
pped
Obj
ects
)
Soci
o-Ec
onom
ic/ E
mpl
oym
ent
Am
bien
t Air
Qua
lity
Glo
bal C
limat
e
Noi
se L
evel
s (A
irbor
ne a
nd U
nder
wat
er)
Seab
ed
Hyd
rody
nam
ics
Wat
er Q
ualit
y
Ben
thic
Com
mun
ities
Fish
& P
elag
ic F
lora
& F
auna
Mar
ine
Mam
mal
s
Mar
ine
Rep
tiles
Bird
s/Se
abird
s
Cor
al O
utcr
ops
Prot
ecte
d A
reas
Empl
oym
ent &
Inco
me
Tour
ism
& R
ecre
atio
n
Seas
cape
&Vi
sual
Aes
thet
ic E
nviro
nmen
tal Q
ualit
y
Fish
ery
Aqu
acul
ture
Nav
igat
ion
Util
ities
(eg.
Lan
dfill
s, w
aste
trea
tmen
t etc
)
Publ
ic H
ealth
& S
afet
y
RIG MOBILISATION/DEMOBILISATION
Transit of drill ship to site
Dynamic positioning
Vessel movements ( AHV, supply etc)
Rig demobilisation/mobilisation between well sites
Rig demobilisation off site
EXPLORATION DRILLING
Well spudding
Drilling (including mud and cuttings disposal)
Well completion (casing and cementing)Drill ship operations (eg. Power generation, discharges, drainage, etc) assume drill shipVessel movements (supply, chase boat etc)
Helicopter movementsStorage, handling & use of materials (eg. chemicals, drilling fluids, etc)Well logging, wireline and VSP
Well abandonment
UNPLANNED EVENTS
Dropped objects to marine water
Well blow-out/ shallow gas
Spills & leaks during drilling/ bunkering
Collision events
KEYDescription of significance of interactions: An aspect of small magnitude Interaction which is positive An interaction that could be significant
An aspect of large magnitude An interaction but not significant An interaction that is significant
Resources & Receptors Susceptible to Impacts
Biological SocialPhysical
ASPECT

ENVIRONMENTAL RESOURCES MANAGEMENT STATOIL EIA DRILLING
4-4
4.2 AIR QUALITY
4.2.1 Sources of Impact
The primary air emissions will be products of combustion (eg. CO2, CO, NOX, SO2, particulates/smoke) and unburned hydrocarbons in the exhaust emissions from vessels/equipment involved in the movement of the drill ship to the project site; power generation on the drill ship, supply vessels, and helicopter transfers. As stated in Section 2.6, emissions to air from exploration drilling activities are estimated to be ~28,519 tonnes of CO2, ~412 tonnes of NOX, ~89 tonnes of SO2 and ~169 tonnes of CO and 17 tonnes of NMHC (see Table 2.6).
4.2.2 Assessment Approach
4.2.2.1 Existing Conditions & Legal Standards and Guidelines (where relevant)
Air pollution is a major environmental problem in Indonesia (UOG, 2008). Urban areas are mostly affected with transportation being the biggest (80%) sector causing air pollution, followed by the industry sector, forest fires and domestic activities.
Regulations of relevance to air emission standards for oil and gas activity in Indonesia is the State Minister of Environment No. 13 Year 2009 regarding Emission Standards from Stationary Sources for Oil and Gas Activity. Emission standards provided by this regulation which will be used as a benchmark for this assessment are indicated in Table 4-2.
Table 4-2 Air Emission Standards
Emission Standards (mg/Nm3)
TR1011 MOE Regulation No. 13 Year 2009
SO2 400 800 CO - 600 NOx as NO2 1,000 1,000 CH4 - -
Indonesia is also extremely vulnerable to climate change (UOG, 2008). Temperatures in Indonesia have increased by 0.3 oC since 1990 and are expected to increase further by ~ 1.5 – 3.7 oC by 2100 (UOG, 2008). Furthermore, changes is climate patterns have already been observed to affect the timing of seasons in Indonesia; and anticipated future trends are expected to result in a longer dry season and a more intense wet season (UOG, 2008). Indonesia ratified the Framework Convention on Climate Change in 1994. As part of this framework, Indonesia is required to mitigate climate change by limiting its anthropogenic emissions of greenhouse gases and protecting and enhancing its greenhouse gas sinks and reservoirs.

ENVIRONMENTAL RESOURCES MANAGEMENT STATOIL EIA DRILLING
4-5
4.2.2.2 Evaluation Criteria
The criteria used to define the magnitude and sensitivity of air quality impacts are presented in Table 4-3 and Table 4-4.
Table 4-3 Magnitude Criteria for Assessing Air Emissions
Magnitude Definition Low • Short-term reduction in air quality but within benchmark
emissions limits • Project GHG emissions represent <1% of Indonesian total annual
estimated CO2 emissions Medium • Occasional breach of the benchmark emissions limits over limited
periods • Project GHG emissions represent 1 – 5% of Indonesian total
annual estimated CO2 emissions High • Repeated breaches of benchmark emissions limits over extended
periods • Project GHG emissions represent >5% of Indonesian total annual
estimated CO2 emissions
Table 4-4 Receptor/ Resource Sensitivity for Assessment of Air Emissions
Sensitivity Definition Low • Existing airshed in good condition (air quality is good); and
• Sensitive receptor (i.e. coastal community) located > 1 km away from the air emissions source.
Medium • Existing airshed showing some signs of stress (air pollution is moderate); or
• Concentration of sensitive receptors (ie. coastal community) located within 0.1 – 1km from the air emissions source.
High • Existing airshed is degraded (air pollution is high); or • Sensitive receptors located within 100 m from the air emissions
source
4.2.3 Evaluation of Impacts
The potential well sites are located significantly offshore (i.e. the closest potential well site to the coast is located > 30 km offshore). Emissions to air will result in an increase in downwind air pollutant concentrations but exceedance of air quality criteria at sea level is not expected due to rapid dispersion and dilution of contaminants in the offshore environment.
The principal greenhouse gas (GHG) emissions from the project activities offshore will be carbon dioxide (CO2) and hydrocarbons. CO2-eq emissions from the exploration drilling program will be in the order of 29,161 tonnes for the whole duration of the drilling period. These emissions will contribute to Indonesia’s greenhouse gas emissions but this contribution is approximately 0.001% of total Indonesian annual GHG emissions of 3.014 billion tonnes.
Overall impacts are evaluated to be of Low magnitude but Medium sensitivity (due to the vulnerability of Indonesia to climate change impacts) with an overall impact of Minor Significance.
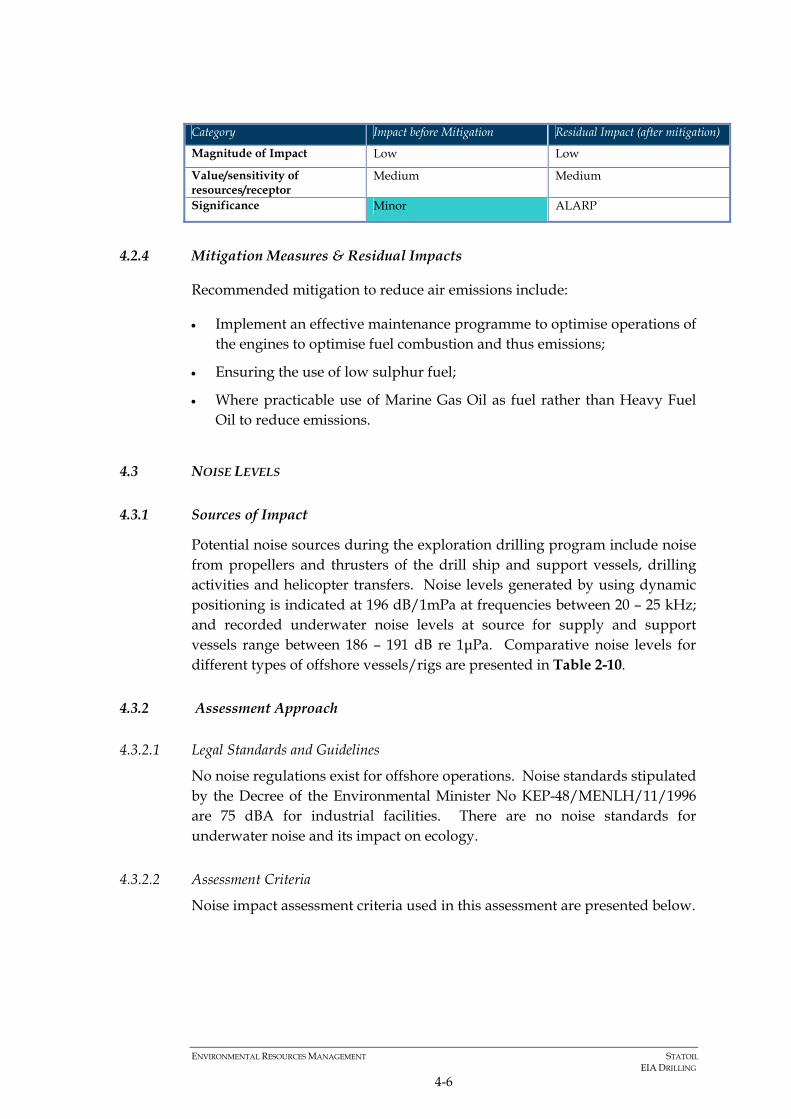
ENVIRONMENTAL RESOURCES MANAGEMENT STATOIL EIA DRILLING
4-6
Category Impact before Mitigation Residual Impact (after mitigation)
Magnitude of Impact Low Low
Value/sensitivity of resources/receptor
Medium Medium
Significance Minor ALARP
4.2.4 Mitigation Measures & Residual Impacts
Recommended mitigation to reduce air emissions include:
• Implement an effective maintenance programme to optimise operations of the engines to optimise fuel combustion and thus emissions;
• Ensuring the use of low sulphur fuel;
• Where practicable use of Marine Gas Oil as fuel rather than Heavy Fuel Oil to reduce emissions.
4.3 NOISE LEVELS
4.3.1 Sources of Impact
Potential noise sources during the exploration drilling program include noise from propellers and thrusters of the drill ship and support vessels, drilling activities and helicopter transfers. Noise levels generated by using dynamic positioning is indicated at 196 dB/1mPa at frequencies between 20 – 25 kHz; and recorded underwater noise levels at source for supply and support vessels range between 186 – 191 dB re 1μPa. Comparative noise levels for different types of offshore vessels/rigs are presented in Table 2-10.
4.3.2 Assessment Approach
4.3.2.1 Legal Standards and Guidelines
No noise regulations exist for offshore operations. Noise standards stipulated by the Decree of the Environmental Minister No KEP-48/MENLH/11/1996 are 75 dBA for industrial facilities. There are no noise standards for underwater noise and its impact on ecology.
4.3.2.2 Assessment Criteria
Noise impact assessment criteria used in this assessment are presented below.
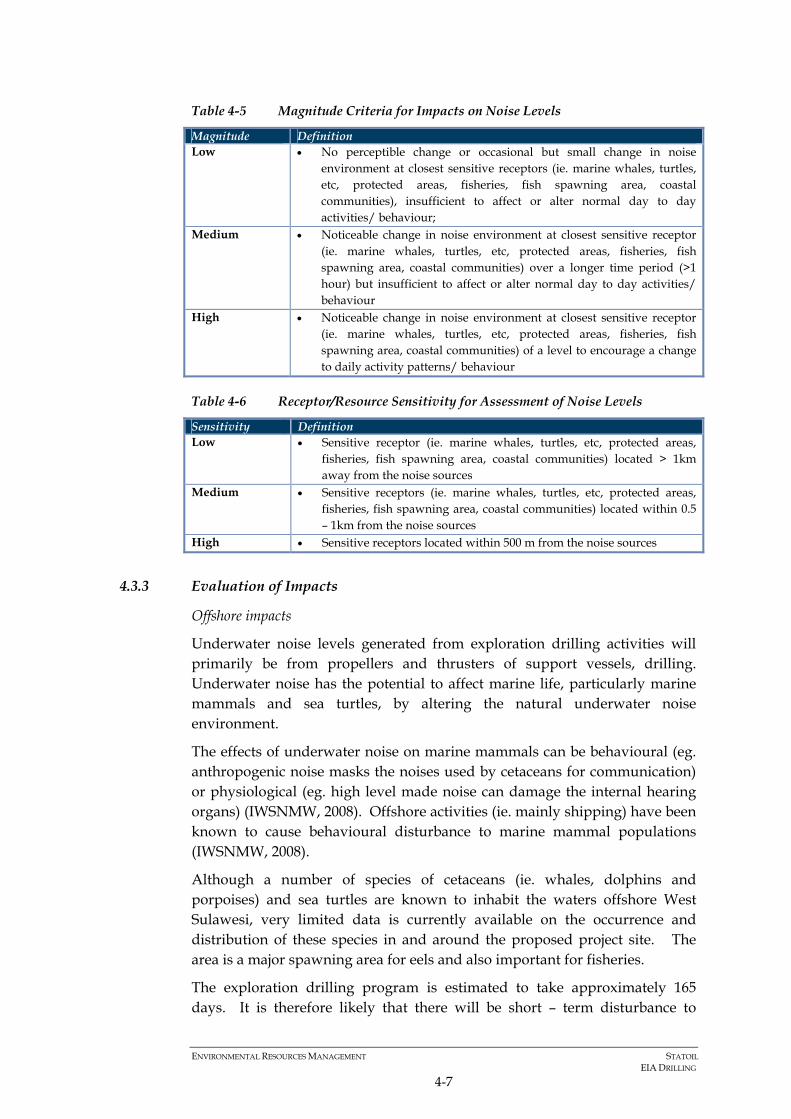
ENVIRONMENTAL RESOURCES MANAGEMENT STATOIL EIA DRILLING
4-7
Table 4-5 Magnitude Criteria for Impacts on Noise Levels
Magnitude Definition Low • No perceptible change or occasional but small change in noise
environment at closest sensitive receptors (ie. marine whales, turtles, etc, protected areas, fisheries, fish spawning area, coastal communities), insufficient to affect or alter normal day to day activities/ behaviour;
Medium • Noticeable change in noise environment at closest sensitive receptor (ie. marine whales, turtles, etc, protected areas, fisheries, fish spawning area, coastal communities) over a longer time period (>1 hour) but insufficient to affect or alter normal day to day activities/ behaviour
High • Noticeable change in noise environment at closest sensitive receptor (ie. marine whales, turtles, etc, protected areas, fisheries, fish spawning area, coastal communities) of a level to encourage a change to daily activity patterns/ behaviour
Table 4-6 Receptor/Resource Sensitivity for Assessment of Noise Levels
Sensitivity Definition Low • Sensitive receptor (ie. marine whales, turtles, etc, protected areas,
fisheries, fish spawning area, coastal communities) located > 1km away from the noise sources
Medium • Sensitive receptors (ie. marine whales, turtles, etc, protected areas, fisheries, fish spawning area, coastal communities) located within 0.5 – 1km from the noise sources
High • Sensitive receptors located within 500 m from the noise sources
4.3.3 Evaluation of Impacts
Offshore impacts
Underwater noise levels generated from exploration drilling activities will primarily be from propellers and thrusters of support vessels, drilling. Underwater noise has the potential to affect marine life, particularly marine mammals and sea turtles, by altering the natural underwater noise environment.
The effects of underwater noise on marine mammals can be behavioural (eg. anthropogenic noise masks the noises used by cetaceans for communication) or physiological (eg. high level made noise can damage the internal hearing organs) (IWSNMW, 2008). Offshore activities (ie. mainly shipping) have been known to cause behavioural disturbance to marine mammal populations (IWSNMW, 2008).
Although a number of species of cetaceans (ie. whales, dolphins and porpoises) and sea turtles are known to inhabit the waters offshore West Sulawesi, very limited data is currently available on the occurrence and distribution of these species in and around the proposed project site. The area is a major spawning area for eels and also important for fisheries.
The exploration drilling program is estimated to take approximately 165 days. It is therefore likely that there will be short – term disturbance to
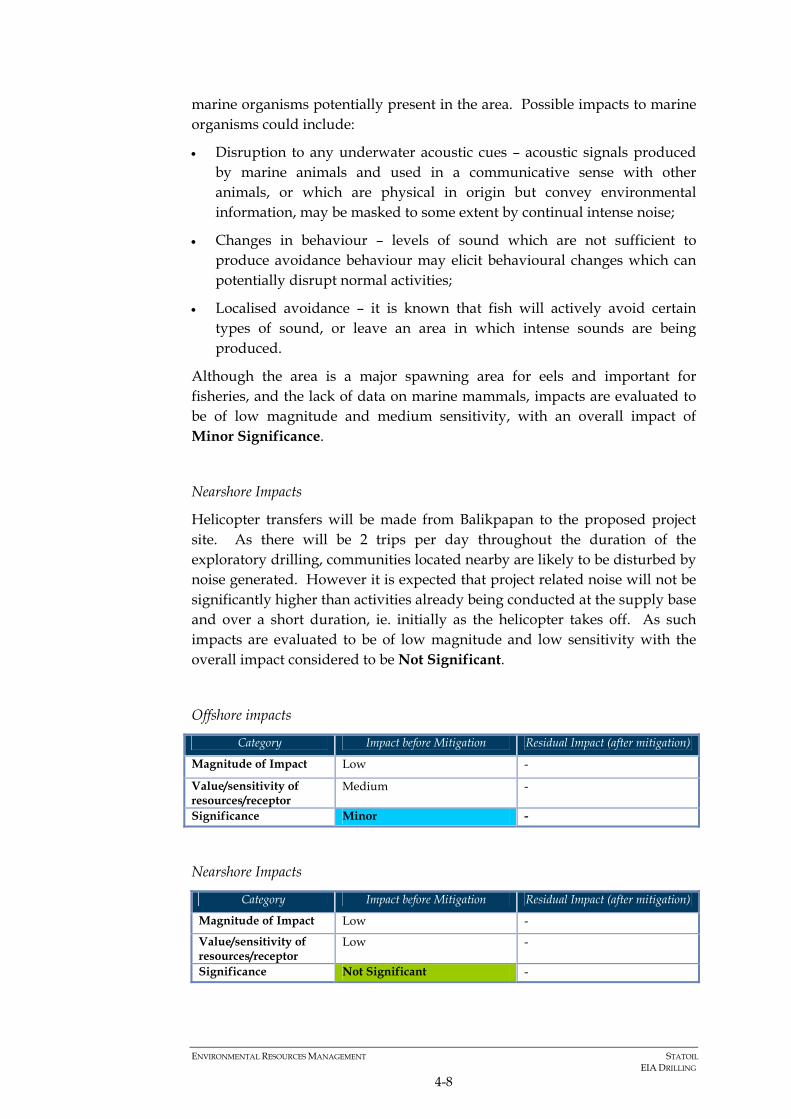
ENVIRONMENTAL RESOURCES MANAGEMENT STATOIL EIA DRILLING
4-8
marine organisms potentially present in the area. Possible impacts to marine organisms could include:
• Disruption to any underwater acoustic cues – acoustic signals produced by marine animals and used in a communicative sense with other animals, or which are physical in origin but convey environmental information, may be masked to some extent by continual intense noise;
• Changes in behaviour – levels of sound which are not sufficient to produce avoidance behaviour may elicit behavioural changes which can potentially disrupt normal activities;
• Localised avoidance – it is known that fish will actively avoid certain types of sound, or leave an area in which intense sounds are being produced.
Although the area is a major spawning area for eels and important for fisheries, and the lack of data on marine mammals, impacts are evaluated to be of low magnitude and medium sensitivity, with an overall impact of Minor Significance.
Nearshore Impacts
Helicopter transfers will be made from Balikpapan to the proposed project site. As there will be 2 trips per day throughout the duration of the exploratory drilling, communities located nearby are likely to be disturbed by noise generated. However it is expected that project related noise will not be significantly higher than activities already being conducted at the supply base and over a short duration, ie. initially as the helicopter takes off. As such impacts are evaluated to be of low magnitude and low sensitivity with the overall impact considered to be Not Significant.
Offshore impacts
Category Impact before Mitigation Residual Impact (after mitigation)
Magnitude of Impact Low -
Value/sensitivity of resources/receptor
Medium -
Significance Minor -
Nearshore Impacts
Category Impact before Mitigation Residual Impact (after mitigation)
Magnitude of Impact Low -
Value/sensitivity of resources/receptor
Low -
Significance Not Significant -

ENVIRONMENTAL RESOURCES MANAGEMENT STATOIL EIA DRILLING
4-9
4.3.4 Mitigation Measures & Residual Impacts
Noise on offshore is a given impact and no mitigation measures are available to reduce noise at the source during dynamic positioning. Nearshore noise impacts may be reduced by limiting operation of chopper during night time
4.4 WASTE GENERATION AND DISPOSAL
4.4.1 Sources of Impact
Inappropriate handling, storage and disposal of non-hazardous and hazardous wastes generated during drilling activities have the potential to result in fouling/ contamination of the marine and onshore environments. A typical waste inventory for drilling operations is presented in Section 2.6.
Wastes (including hazardous waste) generated offshore will include spent chemicals, lube oil, hydraulic oil and batteries. Spent SBM will be returned to shore for re-processing/ recycling (impacts from the discharge of drill cuttings is discussed separately).
Inappropriate hazardous waste management has the potential to cause a range of adverse effects including:
• Toxic effects or physical damage to marine organisms;
• Water pollution/ fouling/ contamination of the sea/ shoreline or onshore environment (onshore storage, transport and disposal activities);
• Risks of fire and explosion; and
• Risks to human health.
4.4.2 Assessment Approach
4.4.2.1 Legal Standards and Guidelines
The legal framework of relevance to the assessment of waste generation and disposal is based on:
• Government Regulation No. 19 Year 1999 regarding Marine Pollution and Damage Control: which states that everyone or company who is dumping waste to the sea is obliged to get permit from Minister of Environment.
• The Government Regulation No. 18 Year 1999 related to the disposal of hazardous and toxic waste: which states that hazardous and toxic wastes can be stored up to a maximum of 90 days after which it must be disposed at a suitable landfill facility; and
• Regulation by the Minister of Energy and Mineral Resources No 045 Year 2006 regarding the Management of Drilling Mud, Waste Mud and Drill

ENVIRONMENTAL RESOURCES MANAGEMENT STATOIL EIA DRILLING
4-10
Cuttings from oil and gas drilling activities. Requirements of this regulation are presented in Table 4-7.
Table 4-7 Requirements for the Management and Disposal of Drill Muds and Cuttings
Testing • For offshore drilling activity, the processing of mud waste shall include LC50 – 96 hours
test, and drill cuttings shall include oil content test. • LC50 – 96 Hours test shall be conducted at least 1 (once) for mud waste in each well drilling
activity. The limit is equal to or more than 30,000 ppm SPP (Suspended Particulate Phase) • Drill cuttings with 10% or less hydrocarbon concentrations can be disposed to drilling site.
If it is more than 10%, than it should be managed according to the regulations. Disposal Offshore • Final disposal of mud waste and drill cuttings may not be conducted in a sensitive area • Disposal of WBMS; should the result of the LC50 – 96 hours test be greater than or equal to
30,000 ppm, then mud waste may be disposed directly onto the sea. Should the test result be smaller then 30,000 ppm then the muds will require further treatment
• Disposal of SBMs & OBMs: SBMs and OBMs are to be reused and final disposal to be in line with the regulations
• Disposal of drill cuttings with an oil content less than or equal to 10% can be directly disposed at sea. If oil content exceeds 10%, further treatment is required.
Disposal Onshore • Wastes will need to be segregated; ie. solid from liquid wastes, oil from liquid wastes and
segregation of dissolved solids. • TCLP Test and oil content tests will need to be conducted to determine a suitable area for
the disposal of muds and cuttings.
Discharge of SBM to the sea will arise due to drill mud retained on cuttings after drying in the cuttings dryer system to an oil level content to around 30 – 50 g/kg or 3-5%. In accordance with Minister of Energy and Mineral Resources Regulation No 045 Year 2006, drill cuttings can be disposed to the sea (in non-sensitive areas, if the oil content in drill cuttings is less than 10% (10 g/kg). Statoil has internal policy (TR1011) drill cuttings can be disposed to the sea if oil content is no more than 1%. If this limit can not be fulfilled during drilling, the project will search a dispensation from Statoil corporate head quarter to allow to dispose drill cuttting with oil content higher than 1% but no more than 10% to the sea; if not, the drill cutttings will be transported to shorebase in Balikpapan for further process.
Other regulations of relevance that relate to the preservation of the Indonesia water environment are listed in Table 1-1.
4.4.2.2 Assessment Criteria
The magnitude of impact has been determined by considering the likely volume of wastes that will be generated and how they will be managed and disposed of to reduce impacts to the environment and society to ALARP (see criteria in Table 4-8). Receptor sensitivity criteria reflect the capacity of waste disposal services in Indonesia to cater for the wastes requiring disposal (see Table 4-9).

ENVIRONMENTAL RESOURCES MANAGEMENT STATOIL EIA DRILLING
4-11
Table 4-8 Magnitude Criteria for Waste Generation and Disposal
Magnitude Definition Low • Waste generated for disposal has been reduced to ALARP Medium • Only some of the wastes generated for disposal have been reduced to
ALARP. Waste disposal sites are likely to experience some pressure in dealing with the wastes generated (either due to type or quantity)
High • Little effort has been made to reduce waste generation to ALARP. Wastes disposal sites will experience substantial difficulty in dealing with the wastes generated.
Table 4-9 Receptor/ Resource Sensitivity for Waste Generation and Disposal
Sensitivity Definition Low • Waste collectors and disposal sites have sufficient capacity to treat
waste (no export of waste) Medium • Some constraints in the capacity of waste collectors and disposal sites
to handle and treat waste in an environmentally acceptable manner are foreseen for non-hazardous wastes
High • Significant constraints in the capacity of waste collectors and disposal sites to handle and treat waste in an environmentally acceptable manner are foreseen for all waste types
4.4.3 Evaluation of Impacts
The bulk of wastes that will be produced from the exploration drilling program are drill muds and cuttings. Spent WBMs and cuttings (both from WBM and SBM drilling – impacts of which are discussed in Section 4.5) will be discharged into the sea while spent SBM will be disposed of onshore at a suitable facility.
All hazardous and non-hazardous wastes generated will be disposed of at existing approved/licensed onshore facilities in Balikpapan. The only non-hazardous waste generated offshore that will be discharged into the sea will be galley food waste (food waste from kitchen and canteen) which will be macerated prior to discharge.
SBM muds to be disposed onshore will be managed according to the requirements of Regulation No 045 Year 2006. The exploration drilling activities are not expected to generate significant volumes of waste. It is not anticipated that pressure will be placed on exiting disposal facilities in Balikpapan. Impacts are therefore evaluated to be of Medium magnitude (taking a conservative approach to the likely volume of wastes which is currently unknown) and Low sensitivity with an overall impact of Minor Significance.
Category Impact before Mitigation Residual Impact (after mitigation)
Magnitude of Impact Medium Low Value/sensitivity of resources/receptor
Low Low
Significance Minor Not Significant

ENVIRONMENTAL RESOURCES MANAGEMENT STATOIL EIA DRILLING
4-12
4.4.4 Mitigation Measures & Residual Impacts
All wastes (non-hazardous and hazardous) generated offshore will be managed in accordance with Statoil’s HSE waste management requirements and legal requirements. Management of wastes should include:
• Waste minimisation at source;
• Waste segregation by type;
• Transport of wastes in suitable containers to avoid leaks, wind blown release of waste materials;
• Completion of transportation consignment notes to document the transfer of materials from offshore to onshore; and
• Recycling of waste where possible.
These waste management requirements should be reflected in the vessel’s Pollution Control and Waste Management Procedure. Furthermore management of waste on the drilling vessel, support and supply vessels will be conducted in compliance with MARPOL Annex V requirements, which includes the prohibition of disposal of garbage into the sea.
Provided wastes are managed appropriately, residual impacts associated with the generation and disposal of wastes are reduced to Not Significant.
4.5 WATER QUALITY
4.5.1 Sources of Impact
The drilling program will generate drilling wastes and excess cement which will be discharged into the sea. These include (as indicated in Section 2):
• Spent WBMs; ~ 4,162 m3/well;
• WBM and SBM cuttings: ~ 644 m3/well; and
• Excess cement: ~ 780 m3 in total. Drilling activities, including these discharges will result in increased suspended solids within the water column. Other discharges to water will include domestic and sanitary wastewater, macerated food waste, rainwater runoff and ballast water discharges (see Section 2). These also have the potential to reduce water quality in the immediate vicinity of the drill vessel. However these have been scoped as not having impacts of significance and not discussed further.

ENVIRONMENTAL RESOURCES MANAGEMENT STATOIL EIA DRILLING
4-13
4.5.2 Assessment Approach
4.5.2.1 Legal Standard & Guidelines
The legal framework of relevance to the assessment is based on the Regulation by the Minister of Energy and Mineral Resources No 045 Year 2006 regarding the Management of Drilling Mud, Waste Mud and Drill Cuttings from oil and gas drilling activities. Requirements of this regulation are presented in Table 4-7. The Statoil requirement is that discharge of cuttings should contain less than 1% oil content. If this limit can not be fulfilled during drilling, the project will search a dispensation from Statoil corporate head quarter to allow to dispose drill cuttting with oil content higher than 1% but no more than 10% to the sea; if not, the drill cutttings will be transported to shorebase in Balikpapan for further process
4.5.2.2 Assessment Criteria
Criteria to assess impacts on water quality are presented in Tables 4-10 and 4-11.
Table 4-10 Magnitude Criteria for Water Quality Impacts
Magnitude Definition
Low • Negligible change in water quality expected over a limited area with
water quality returning to background levels within a few meters; or • Discharges are well within specified limits
Medium • Temporary and localized change in water quality over a limited area
with water quality returning to background levels thereafter; or • Occasional breach of specified limits
High • Change in water quality lasts over the course of several months with
quality likely to cause secondary impacts on marine ecology; or • Routine exceedance of specified limits
Table 4-11 Receptor/ Resource Sensitivity for Water Quality Impacts
Sensitivity Definition
Low • Existing water quality is good and the ecological resources that it
supports are not sensitive to a change in water quality
Medium • Existing water quality is showing some signs of stress and/ or
supports some sensitive ecological resources that could be sensitive to change in water quality
High • Already under significant stress and/ or is fragile to change with
respect to the resources it supports, will cause secondary ecological impacts
4.5.3 Evaluation of Impacts
The waters within the Karama Block do support known sensitive receptors, particularly near Karampuang Island and the adjacent shoreline of the Mamuju Regency of West Sulawesi (see Figure 3-1), such as coral reef and

ENVIRONMENTAL RESOURCES MANAGEMENT STATOIL EIA DRILLING
4-14
mangrove ecosystems, community fish ponds and seagrass culture. On entering the sea, the discharge plume typically separates into an upper and lower plume. The lower plume contains the majority of cuttings and drill fluid mass while the upper plume comprises the liquid fraction and fine gained silts and clays. The upper plume will tend to separate both laterally and vertically and will be transported in the direction of the prevailing currents. Modelling of drill cuttings discharged was conducted for this study. The modelling was conducted for two different scenarios; ie. under March and October conditions (in terms of current and wind conditions). Key findings from the study indicated that (see Appendix 1 for full results):
• The drill cuttings and adhered muds would travel 30 to 40 km from the drill centre before settling on the seabed;
• Sedimentation rates would be orders of magnitude below 10 mg cm-2 day-
1 (which is the coral tolerance threshold criterion);
• Total suspended solid (TSS) concentrations will exceed the 50 mg/l threshold only at surface layers, while concentrations of TSS at the bottom layers were less than 1 mg/l.
Overall, for both scenarios sedimentation rates were low. Suspended solids in both cases were high (ie. above the 50 mg/l threshold for corals) for only a brief period of time (~1 hour) and only near the surface of the well location. Conclusions from the modelling study indicate that the discharge of mud and drill cuttings pose a low environmental risk. SBMs retained on cuttings will also be dried in the cuttings dryer system prior to discharge resulting in an oil level content of around 30 – 50 g/kg or 3-5% (see point 4.5.2.1). Based on the above explanation, impacts from the discharge of drilling wastes are therefore evaluated to be of Low magnitude and Medium sensitivity with an overall impact of Minor Significance. Category Impact before Mitigation Residual Impact (after mitigation)
Magnitude of Impact Low - Value/sensitivity of resources/receptor
Medium -
Significance Minor -
4.5.4 Mitigation Measures & Residual Impacts
Existing controls such as the cuttings dryer system together with Statoil and legislative compliance sufficiently manage this issue and no additional mitigation is required.
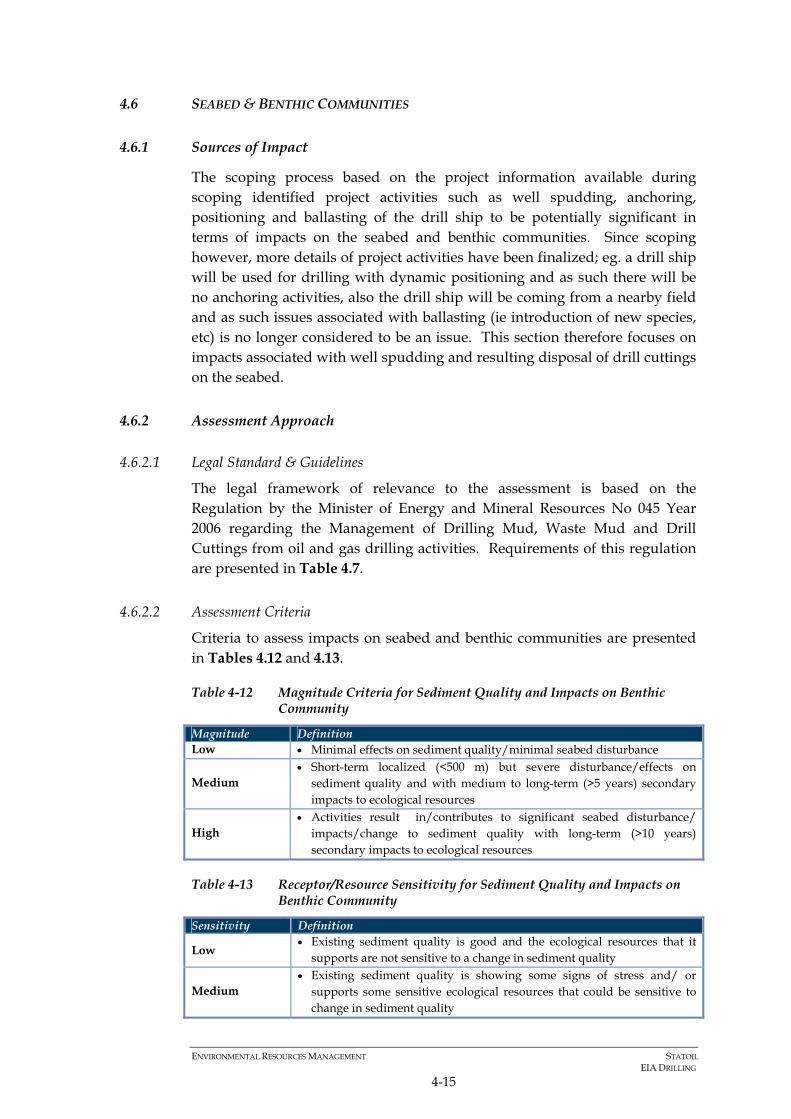
ENVIRONMENTAL RESOURCES MANAGEMENT STATOIL EIA DRILLING
4-15
4.6 SEABED & BENTHIC COMMUNITIES
4.6.1 Sources of Impact
The scoping process based on the project information available during scoping identified project activities such as well spudding, anchoring, positioning and ballasting of the drill ship to be potentially significant in terms of impacts on the seabed and benthic communities. Since scoping however, more details of project activities have been finalized; eg. a drill ship will be used for drilling with dynamic positioning and as such there will be no anchoring activities, also the drill ship will be coming from a nearby field and as such issues associated with ballasting (ie introduction of new species, etc) is no longer considered to be an issue. This section therefore focuses on impacts associated with well spudding and resulting disposal of drill cuttings on the seabed.
4.6.2 Assessment Approach
4.6.2.1 Legal Standard & Guidelines
The legal framework of relevance to the assessment is based on the Regulation by the Minister of Energy and Mineral Resources No 045 Year 2006 regarding the Management of Drilling Mud, Waste Mud and Drill Cuttings from oil and gas drilling activities. Requirements of this regulation are presented in Table 4.7.
4.6.2.2 Assessment Criteria
Criteria to assess impacts on seabed and benthic communities are presented in Tables 4.12 and 4.13.
Table 4-12 Magnitude Criteria for Sediment Quality and Impacts on Benthic Community
Magnitude Definition Low • Minimal effects on sediment quality/minimal seabed disturbance
Medium • Short-term localized (<500 m) but severe disturbance/effects on
sediment quality and with medium to long-term (>5 years) secondary impacts to ecological resources
High • Activities result in/contributes to significant seabed disturbance/
impacts/change to sediment quality with long-term (>10 years) secondary impacts to ecological resources
Table 4-13 Receptor/Resource Sensitivity for Sediment Quality and Impacts on Benthic Community
Sensitivity Definition
Low • Existing sediment quality is good and the ecological resources that it
supports are not sensitive to a change in sediment quality
Medium • Existing sediment quality is showing some signs of stress and/ or
supports some sensitive ecological resources that could be sensitive to change in sediment quality

ENVIRONMENTAL RESOURCES MANAGEMENT STATOIL EIA DRILLING
4-16
Sensitivity Definition
High • Already under significant stress and/ or is fragile to change with respect
to the resources it supports, will cause secondary ecological impacts
4.6.3 Evaluation of Impacts
The top hole section of each well will be drilled without a casing in place and as such drill cuttings and muds will be discharged directly on the seabed in proximity to the well. Only WBMs are being proposed for the top hole sections. Additionally, cuttings from both WBM and SBM drilling will be discharged into the sea. The seabed at the project site is classified as silt and silty-clay with low content of sand and gravel. The types of benthic species present in the area are not well understood. It is expected however that only a small area immediately surrounding the well will be affected from the drilling of the top hole section. During the drilling of the rest of the well sections, cutting will be discharged through a discharge chute located on the vessel (ie. 12 m below the water surface). As indicated in Section 4.5 above, modelling results have indicated that cuttings discharged will travel approximately 30 – 40 km and as such will be spread out over a wider area; impacts to benthic communities are therefore reduced. Considering that only WBMs will accumulate near the well surface, impacts are evaluated to be of Low magnitude and Medium sensitivity (as the type of benthic species present is currently unknown) with an overall impact of Minor Significance. Category Impact before Mitigation Residual Impact (after mitigation)
Magnitude of Impact Low Low
Value/sensitivity of resources/receptor
Medium Low
Significance Minor Not Significant
4.6.4 Mitigation Measures & Residual Impacts
Measures to reduce impacts on the seabed include:
• Conducting a comprehensive baseline of the area to determine the likely species present and their sensitivity prior to beginning project activities.
Provided implementation measures are effective and no species of significant ecological/ commercial value have been identified, residual impacts are considered to be not significant.

ENVIRONMENTAL RESOURCES MANAGEMENT STATOIL EIA DRILLING
4-17
4.7 FISHERIES
4.7.1 Sources of Impact
Project activities have the potential to impact fisheries in the area. Impacts associated with noise, discharged of drill muds and cuttings, and spills on fish stock are discussed in Sections 4.3, 4.5 and 4.8. This section focuses on the hazards posed by rig mobilization/transit to project site and presence of support vessels and suspended wellheads.
4.7.2 Assessment Approach
4.7.2.1 Legal Standard & Guidelines
Act No 45 year 2009 jo 31 year 2004 on Fisheries concerning fisheries management including optimize the management of fish resources, the preservation of fish resources, fish cultivation and spatial arrangement.
4.7.2.2 Assessment Criteria
Criteria to assess impacts on fisheries are presented in Tables 4.14 and 4.15.
Table 4-14 Magnitude Criteria for Impacts on Fisheries
Magnitude Definition Low • Activities will not affect/ cause constraints on resource users
Medium • Activities will result in limited interference/constraints on resource
users
High • Activities will result in significant interference/constraints on resource
users
Table 4-15 Receptor/ Resource Sensitivity for Impacts on Fisheries
Sensitivity Definition
Low • Low fishing activities in the area; or • Activities will result no loss of income.
Medium • Moderate fishing activities in the area; or • Activities will result in some loss of income.
High • Significant fishing activities in the area; or • Activities will result in significant loss of income.
4.7.3 Evaluation of Impacts
As indicated in Section 3.7.5, the project area is surrounded by artisanal fisheries. Fishing activities are an important source of food and income for communities in the area. Some fishers also practice the use of ‘rumpon’ or Fish Aggregation Devices (FAD); based on data collected during the seismic program in 2008, approximately 81 rumpon were identified in the Karama Block and its vicinity. The main fishing areas were identified as extending approximately 2 – 10 km from the shore.

ENVIRONMENTAL RESOURCES MANAGEMENT STATOIL EIA DRILLING
4-18
The drill ship will transit to the project site from a nearby field and as such it is not anticipated that it will impact fishing activities in a significant manner. Supporting vessels movement during drilling activity from and to Balikpapan will impact fishing activity in Karama Block and its vicinity. There is potential collision of drilling supporting vessel movement with rumpon and fishing gear might occur. Drilling activities however will be conducted over 165 days and during this period an exclusion zone around each well will be necessary. It is therefore likely that there may be disturbance/constraints on fishing activities from removal of rumpons and any trawling, long line activities but these would be temporary and once activities are concluded the exclusions zones removed.
Upon completion of drilling the wellheads will remain in place; ie 2 m above seabed that will be addressed in Drilling UKL-UPL document (provided approval is received from Ministry of Environment), which may pose a minor constraint to fishing activities. If approval is not received to leave the wellheads on the seafloor in UKL-UPL document, the wellheads, casing, piling and other obstructions will be removed to a depth of 15 ft below the seafloor and all obstructions removed.
Based on the above explanation, impacts from drilling activities are therefore evaluated to be of Medium magnitude and Medium sensitivity. Overall impacts are therefore considered to be of Moderate Significance. Category Impact before Mitigation Residual Impact (after mitigation)
Magnitude of Impact Medium Low
Value/sensitivity of resources/receptor
Medium Medium
Significance Moderate Minor
4.7.4 Mitigation Measures & Residual Impacts
The following mitigation measures are recommended to reduce/ manage potential impacts:
• Notify fishing authorities of planned activities;
• Maintain communication with local communities/fishermen notifying them of planned activities, location of wellheads and understanding their concerns;
• Ensure procedures are in place for dealing with claims for damaged fishing gear etc. from local fishermen; and

ENVIRONMENTAL RESOURCES MANAGEMENT STATOIL EIA DRILLING
4-19
• Conduct rumpon mapping and identify rumpon that should be removed within 1 km radius from drilling area.
The residual impact based on the effective implementation of these guidelines will reduce the significance of impacts from Moderate to Minor Significance.
4.8 UNPLANNED EVENTS
4.8.1 Sources of Impact
Unplanned events scoped as being of potential significance includes a blowout and collisions both of which can result in the uncontrolled release of hydrocarbons. These are discussed further in the following sections.
4.8.2 Assessment Approach
4.8.2.1 Legal Standard & Guidelines
Regulations of relevance include;
• Presidential Regulation No. 109 of 2006 concerning emergency response for oil spillage in the sea;
• Ministry of Environment Decree No. 200 of 2004 concerning standard criteria for environmental damage and guidelines for determination of status of sea grass colonies;
• Ministry of Environment Decree No. 201 of 2004 concerning standard criteria for environmental damage and guidelines for determining the extent of damage to mangroves.
4.8.2.2 Assessment Criteria
Criteria to assess impacts from unplanned events are presented in Tables 4-16 and 4-17.
Table 4-16 Magnitude Criteria for for Impacts resulting from Unplanned Events
Magnitude Definition Low • No. of receptors affected is limited to a few isolated individuals/
organisms/cases and they recover quickly with only short-term discomfort
Medium • No. if receptors affected extends to a wider area or receptors affected
sustain long-term environmental/ health impacts
High • No. of receptors affected is considerable or those that are affected
sustain permanent environmental/ health impacts or a fatality occurs

ENVIRONMENTAL RESOURCES MANAGEMENT STATOIL EIA DRILLING
4-20
Table 4-17 Receptor/ Resource Sensitivity for Impacts resulting from Unplanned Events
Sensitivity Definition
Low • Receptor can readily absorb/ adapt and recover quickly from the
impact
Medium • Receptor experiences some short-term difficulty in absorbing/
adapting and recovering from the impact
High • Receptor experiences considerable, long term difficulty in absorbing/
adapting and recovering from the impact
4.8.3 Evaluation of Impacts
In general oil spilled into the marine environment undergoes a number of physico-chemical changes depending on the type and volume of oil spilled, the prevailing weather and sea conditions. Typically evaporation and dispersion act to remove oil from the sea surface. Spilled oil containing light hydrocarbon fractions (eg. diesel) tend to evaporate quickly compared to heavier (crude) spills. The evaporation process will be enhanced by warm air temperatures and moderate winds and will produce considerable changes in density, viscosity and volume of the spill. Modelling was performed to assess potential environmental impacts in the event of an accidental release of hydrocarbons due to an annulus blowout at the Anoman Well (UTM easting 673819.520008, northing 9732223.28191, Zone 50S WGS84,). The model calculated the spatial extent of the oil released, the direction and time in which the spill may travel, the thickness of the surface slick (compared to significant thickness thresholds), and the magnitude and duration of potentially toxic dissolved aromatic component concentrations (compared to no-effect thresholds). Three release scenarios (for spills volumes between 3,000 – 10,800 m3/d) were evaluated for two separate months (March and October) and two separate wind conditions (at the end of the northwest monsoon season and end of the southeast monsoon season. In all scenarios the risk to the water column from aromatic concentrations were above the no-effect threshold limits (ie. a 96-hour toxicity threshold of 310 ppb) and therefore having the potential to affect marine organisms. Significant effects on fish are unlikely since mobile organisms will be able to avoid the areas where concentrations are at the highest. Benthic organisms are unlikely to be impacted by dissolved aromatics released by spills. At more risk are birds and other species, and coastal communities making contact with a surface hydrocarbon slick, particularly near the shoreline. Sensitive ecosystems exist in coastal area of Mamuju Regency which are susceptible to oil spill are thin strip of mangrove, coral reef, sea grass and aquaculture i.e. tambak (brackish water shrimp/fish culture) and sea grass cultivation.

ENVIRONMENTAL RESOURCES MANAGEMENT STATOIL EIA DRILLING
4-21
Impacts from oil released from an annulus blowout pose a medium to high risk impact to organisms which contact the surface oil, depending on the quantity released and time before any potential response efforts can contain the release. Spills of this nature pose a low risk of acute toxic effect to the aquatic biota. Several shorelines are however at risk within the first few days after a release. In all scenarios, spills ended up reaching the shoreline between one to five days from release (see Table 4-18). Though much of the oil was predicted to evaporate, the simulations indicate that oil components will persist, remaining on the water surface before eventually reaching the shorelines. The modelling predicts that the coastline of West Sulawesi will be hit first followed by areas (to a lesser extent) along the South Sulawesi coast. Karampuang Island was identified to be at high risk for shoreline impacts in all scenarios except Scenario 1-3 and Scenario 1-4; however, even in these two near-miss cases, the island could have been hit under slightly different conditions.
Table 4-18 Summary of Model Results
Scenario Release Month Winds
Shor
eline
A
ffect
ed
(km
)
Tim
e to
shor
e (hr
s)
Surfa
ce
Are
a A
ffect
ed
(km
2 )
1-1 8,000 m3/day for 5 days March Typical 171 41 1,703 1-2 8,000 m3/day for 5 days March Maximum 93 33 1,013 1-3 8,000 m3/day for 5 days October Typical 36 78 1,958 1-4 8,000 m3/day for 5 days October Maximum 84 26 1,447 2-1 3,000 m3/day for 120 days March Typical 504 51 1,478 2-2 3,000 m3/day for 120 days March Maximum 289 34 1,301 2-3 3,000 m3/day for 120 days October Typical 277 113 1,270 2-4 3,000 m3/day for 120 days October Maximum 299 44 1,157 3-1 10,800 m3/day for 120
days March Typical 592 51 1,944
3-2 10,800 m3/day for 120 days
March Maximum 316 108 1,342
3-3 10,800 m3/day for 120 days
October Typical 286 106 1,380
3-4 10,800 m3/day for 120 days
October Maximum 359 54 1,244
Fortunately the occurrence of a blowout is very rare, and extensive preventative/ control measures will be implemented to reduce the likelihood of such events. Based on statistics by the International Association of Oil & Gas Producers on blowout frequencies (for deep well), the likelihood of a blowout occurring would be in the order of 1 blowout for every 695 wells drilled (OGP, 2010). Average annual frequency of accidents related to drill ships between 1990 – 2003 was 6.3 (total number of accidents recorded within this period was 35).

ENVIRONMENTAL RESOURCES MANAGEMENT STATOIL EIA DRILLING
4-22
Statistics on oil spills occurring during offshore drilling activities indicate that the likelihood of a large spill is low (this is based on statistics for oils spills during drilling in Atlantic Margin between 1990 - 2002); the probability of an oil spill occurring is one spill in every 29.6 wells drilled (AHL, 2004). The most likely spills arise from loading and bunkering operations between the drill ship and supply vessels. Even with the application of the latest industry standards and consideration of the highest standards of safety, accidental events may still occur. Blowout/spills occurring within the Karama Block have the potential to have significant impacts on the environment including potential health impacts. An uncontrolled blow out could take many days or months to bring under control. Impacts are therefore evaluated to be of high magnitude and high sensitivity with an overall impact of Major Significance.
Category Impact before Mitigation Residual Impact (after mitigation)
Magnitude of Impact High Medium Value/sensitivity of resources/receptor
High Medium
Significance Major Moderate
4.8.4 Mitigation Measures & Residual Impacts
The following measures should be implemented to reduce the likelihood and consequence of accidents occurring:
• Development of an Oil Spill Contingency Plan that identifies responsibilities of relevant personnel, defines spill response actions (eg. for Tier 1, Tier 2 and Tier 3), describes actions to be taken in the event of a spill, communication procedures, reporting procedures, etc, including ensuring that spill response mechanisms are in place and located in a logistically suitable location (ie. based locally) that enables quick response time;
• Provision, implementation and training of all staff on an Emergency Prevention and Response Plans, including emergency training exercises;
• Ensure response equipment is available on site in areas identified as sensitive;
• Ensuring a model can be run live in case of a spill;
• Ensure of notices to other mariners of activities in the area; and
• Presence of support vessels to warn other vessels in the area. Provided mitigation measures are implemented and effective, residual impacts associated with accidental impacts are considered to be of Moderate Significance.

ENVIRONMENTAL RESOURCES MANAGEMENT STATOIL EIA DRILLING
4-23
4.9 SOCIO-ECONOMIC BENEFITS
4.9.1 Sources of Impacts
Socio-economic impacts that may occur due to the drilling exploration program is the creation of employment opportunities and demand for goods and services, ie. positive benefits from employment and service contracts.
4.9.2 Assessment Approach
Impacts have been assessed in terms of the likely duration and size of socio-economic change. There are no specific performance expectations of relevance to this assessment other than that project benefits on the community should be enhanced to the extent possible.
4.9.2.1 Evaluation Criteria
The magnitude used for the assessment on socio-economic impacts are presented in Table 4-19.
Table 4-19 Magnitude Criteria for Assessment of Socio-Economic Impacts
Magnitude Definition Low • Host population does not experience any socio-economic or socio-
cultural affects (positive or negative) as a result of the Project
Medium • Host population experiences some socio-economic or socio-cultural
affect in the short term but which leads to some change in their pre-Project situation
High • Host population experiences considerable socio-economic or socio-
cultural affects in the long term resulting in significant and permanent change in their pre-Project situation
4.9.3 Evaluation of Impacts
The Karama Block Drilling Exploration Program will require ~ 140 personnel (ie. on the drill vessel and supply and support vessels) who are likely to be skilled operators/ technicians. Thus the potential for the Project to directly engage the local people is limited. Indirectly however, the Project itself and the workforce will demand numerous services and supplies, both from specialist contractors and service providers (eg. mud supply and handling contractors, waste contractors etc.) and from the local market (eg. rental accommodation, food and transportation providers). This has the potential to positively impact the community surrounding the Balikpapan Supply Base however it is unlikely to bring benefit to the population in the Mamuju Regency. The extent of the Project and its duration means that any such benefits would however be temporary and of low to medium magnitude. Overall, the Project is expected to have at most a Minor Positive impact on the local economy.

ENVIRONMENTAL RESOURCES MANAGEMENT STATOIL EIA DRILLING
4-24
Category Impact before Mitigation Residual Impact (after mitigation)
Magnitude of Impact Low - Medium Medium Value/sensitivity of resources/receptor
- -
Significance Not – Significant - Minor Positive
Minor Positive
4.9.4 Mitigation Measures & Residual Impact
To enhance benefits from employment/ stimulation of the local economy it is recommended that engagement of Indonesian-based service and supply contractors are prioritised.

ENVIRONMENTAL RESOURCES MANAGEMENT STATOIL EIA DRILLING
4-25

ENVIRONMENTAL RESOURCES MANAGEMENT STATOIL DRILLING EIA
5-1
5 ENVIRONMENTAL MANAGEMENT PLAN
5.1 INTRODUCTION
The objective of an Environmental Management Plan (EMP) is to provide the delivery mechanism for the commitments made in this EIA study. To assist Statoil in implementing these recommendations, they have been brought together as a register of actions and management plans within this outline EMP. The aims of the EMP are:
• To ensure continuing compliance with legal requirements and Statoil policies/ Health, Safety and Environment (HSE) principles;
• To provide the initial mechanism for ensuring that measures identified in the EIA to mitigate potentially adverse impacts are implemented;
• To provide a framework for mitigating impacts during project execution;
• To provide assurance to regulators and stakeholders that their requirements with respect to environmental performance will be met;
• To undertake monitoring to demonstrate that predictions made within the EIA are valid; and
• To provide a framework for the compliance auditing and inspection programs that will enable Statoil to be assured that its aims with respect to environmental performance are being met.
5.2 STATOIL’S HSE PRINCIPLES
The HSE management system is an integral part of the Statoil total management system. Statoil’s aim is to have zero impact on the environment. Key environmental principles include:
• Acting according to the precautionary principle;
• Assessing all relevant environmental and social issues and minimizing negative impact on the environment;
• Complying with applicable legislations and regulations;
• Setting specific targets and improvement measures based on relevant knowledge of the affected area;
• Consulting and cooperating with relevant stakeholders;
• Working actively to limit the effects of fossil fuels on climate change by addressing energy efficiency, emissions trading, etc;
• Seeking to maintain biodiversity and key ecosystem functions and values; and

ENVIRONMENTAL RESOURCES MANAGEMENT STATOIL DRILLING EIA
5-2
• Minimising the generation of waste.
The Karama Block exploration program will be conducted in line with Statoil’s HSE management system.
5.3 ENVIRONMENTAL MANAGEMENT PLAN
Table 5-1 summarizes the key identified environmental impacts associated with the Karama Block exploration drilling program and mitigation measures that shall be implemented to prevent unacceptable impacts. For each issue, the mitigation, management and monitoring measures are presented along with specific actions required to implement these measures, responsibilities, timing and a means of verification.
The following should be noted when interpreting the table:
• The significance of residual impacts assumes that the recommended mitigation measures have been fully implemented and that they have been effective. Thus regardless of the level of significance presented, the mitigation measures are required; and
• Actions have been numbered sequentially for each row item. Responsibilities for implementing each numbered action, a timeframe and a means of verifying that the action has been completed are then presented with the same numbering (ie. Action # 1 is to be implemented by the # 1 responsible person etc.).

ENVIRONMENTAL RESOURCES MANAGEMENT STATOIL DRILLING EIA
5-3
Table 5-1 Environmental Management Plan
Issue Activity/ Source of Impact
Impact Mitigation/Enhancement Measures Significance of Residual
Impact
Required Actions Responsibility for
Implementation
Timing of Actions
Means of Verifying that Actions are
Complete A. Air Quality
Exhaust emissions from vessels, equipment, etc
Contribution to climate change
• Implement an effective maintenance programme to optimise operations of the engines to optimize fuel combustion and thus emissions;
• Ensure the use of low sulphur fuel; • Where practicable, ensure the use of
Marine Gas Oil as fuel rather than Heavy Fuel Oil to reduce emissions; and
Minor significance
(1) Incorporate all mitigation measures into the contractual documents of drilling contractor
(2) Translate requirements into operating instructions/ procedures and brief personnel involved
(3) Audit contractor’s adherence to the measures
(1) Statoil’s Procurement Manager
(2) Site contractors
(3) Statoil’s Exploration Manager
(1) Prior to contracting or starting drilling works
(2) Prior to site works starting
(3) Fortnightly throughout the drilling exploration program
(1) Requirements included in contract documents
(2) Requirements included in drilling program management instructions and procedures
(3) Audit records
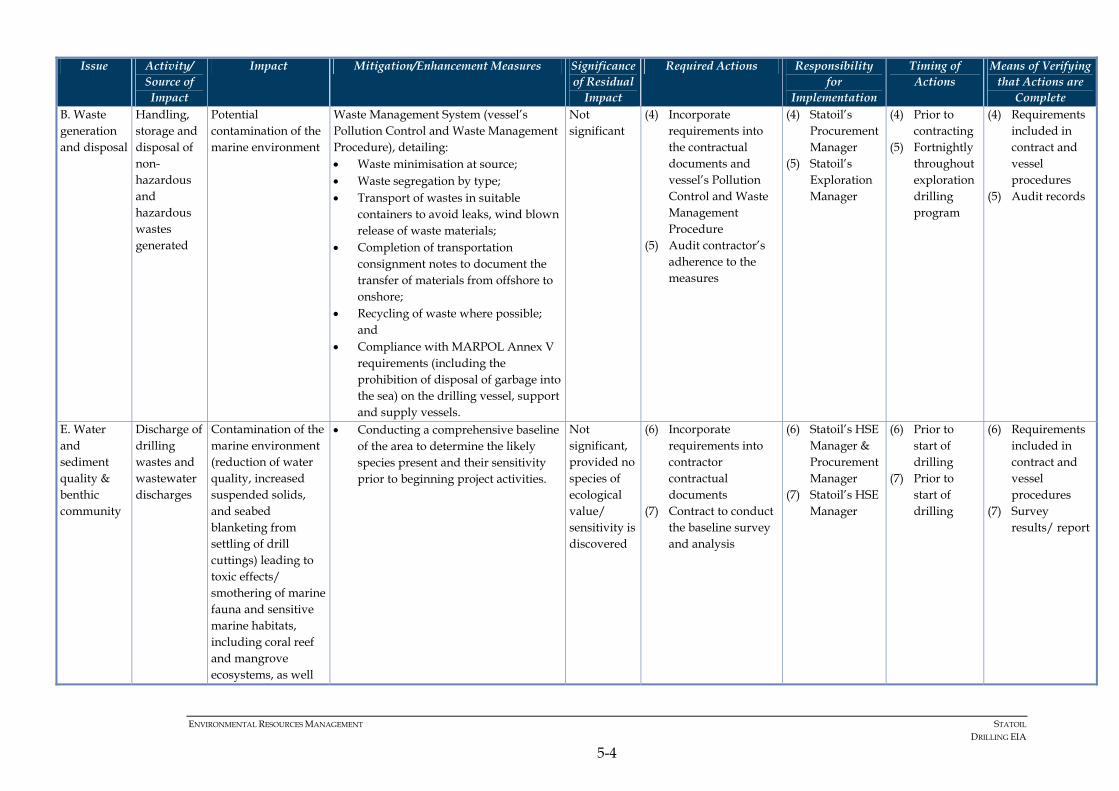
ENVIRONMENTAL RESOURCES MANAGEMENT STATOIL DRILLING EIA
5-4
Issue Activity/ Source of Impact
Impact Mitigation/Enhancement Measures Significance of Residual
Impact
Required Actions Responsibility for
Implementation
Timing of Actions
Means of Verifying that Actions are
Complete B. Waste generation and disposal
Handling, storage and disposal of non-hazardous and hazardous wastes generated
Potential contamination of the marine environment
Waste Management System (vessel’s Pollution Control and Waste Management Procedure), detailing: • Waste minimisation at source; • Waste segregation by type; • Transport of wastes in suitable
containers to avoid leaks, wind blown release of waste materials;
• Completion of transportation consignment notes to document the transfer of materials from offshore to onshore;
• Recycling of waste where possible; and
• Compliance with MARPOL Annex V requirements (including the prohibition of disposal of garbage into the sea) on the drilling vessel, support and supply vessels.
Not significant
(4) Incorporate requirements into the contractual documents and vessel’s Pollution Control and Waste Management Procedure
(5) Audit contractor’s adherence to the measures
(4) Statoil’s Procurement Manager
(5) Statoil’s Exploration Manager
(4) Prior to contracting
(5) Fortnightly throughout exploration drilling program
(4) Requirements included in contract and vessel procedures
(5) Audit records
E. Water and sediment quality & benthic community
Discharge of drilling wastes and wastewater discharges
Contamination of the marine environment (reduction of water quality, increased suspended solids, and seabed blanketing from settling of drill cuttings) leading to toxic effects/ smothering of marine fauna and sensitive marine habitats, including coral reef and mangrove ecosystems, as well
• Conducting a comprehensive baseline of the area to determine the likely species present and their sensitivity prior to beginning project activities.
Not significant, provided no species of ecological value/ sensitivity is discovered
(6) Incorporate requirements into contractor contractual documents
(7) Contract to conduct the baseline survey and analysis
(6) Statoil’s HSE Manager & Procurement Manager
(7) Statoil’s HSE Manager
(6) Prior to start of drilling
(7) Prior to start of drilling
(6) Requirements included in contract and vessel procedures
(7) Survey results/ report

ENVIRONMENTAL RESOURCES MANAGEMENT STATOIL DRILLING EIA
5-5
Issue Activity/ Source of Impact
Impact Mitigation/Enhancement Measures Significance of Residual
Impact
Required Actions Responsibility for
Implementation
Timing of Actions
Means of Verifying that Actions are
Complete as community fish ponds.
F. Fisheries Drill vessel mobilization / transit to project site and presence of support vessels
Constraints on fisheries in the area
• Notifying fishing authorities of planned activities;
• Acquisition and compensation of the rumpons will follow the Governors Decree
• Maintaining communication with local communities/ fishermen notifying them of planned activities and understanding their concerns;
• Conduct rumpon mapping and identify rumpon that should be removed within 1 km radius from drilling area; and
• Ensuring procedures are in place for dealing with claims for damaged fishing gear etc. from local fishermen.
Minor significance
(8) Incorporate within and implement a Stakeholder Engagement Plan
(9) Translate requirements into operating instructions/ procedures and relevant personnel
(8) Statoil’s HSE Manager, Public Relations Officer & Exploration Manager
(9) Statoil’s HSE Manager
(8) Prior to start of and during drilling activities
(9) Prior to start of and during drilling activities
(8) Stakeholder Engagement Plan
(9) Grievance mechanism
G. Unplanned events
Blowout/ collision resulting in spills
Marine pollution and secondary impacts on ecology and community health and safety
• Development of an Oil Spill Contingency Plan that identifies responsibilities of relevant personnel, defines spill response actions (eg. for Tier 1, Tier 2 and Tier 3), describes actions to be taken in the event of a spill, communication procedures, reporting procedures, etc, including ensuring that spill response mechanisms are in place and located in a logistically (ie. based locally) suitable location that enables quick response time;
• Provision, implementation and training of all staff on an Emergency Prevention and Response Plans, including emergency training
Reduced to ALARP
(10) Prepare Oil Spill Contingency Plan and circulate to contractors
(11) Provide the necessary logistics onshore required to manage a large spill
(12) Provide necessary training and conduct drills to support emergency prevention and response plan
(13) Provide necessary equipment on vessel to implement
(10) Statoil’s HSE Manager and Exploration Manager
(11) Statoil’s HSE Manager
(12) Drilling contractor
(13) Statoil’s Exploration Manager
(14) Statoil’s Exploration Manager
(10) Prior to start of drilling activities
(11) Prior to start of drilling activities
(12) Prior to start of and during drilling activities
(13) Prior to start of drilling activities
(10) Oil Spill Contingency Plan in place
(11) Temporary onshore logistical base to respond to spills
(12) Training records and daily tool box talk minutes
(13) Equipment on vessel/ logistical base
(14) Audit records

ENVIRONMENTAL RESOURCES MANAGEMENT STATOIL DRILLING EIA
5-6
Issue Activity/ Source of Impact
Impact Mitigation/Enhancement Measures Significance of Residual
Impact
Required Actions Responsibility for
Implementation
Timing of Actions
Means of Verifying that Actions are
Complete exercises;
• Ensuring a model can be run live in case of a spill;
• Ensure of notices to other mariners of activities in the area; and
• Presence of support vessels to warn other vessels in the area.
requirements (14) Audit contractors’
adherence to requirements
(14) Fortnightly throughout drilling activities

ENVIRONMENTAL RESOURCES MANAGEMENT STATOIL DRILLING EIA
5-7
5.4 ROLES AND RESPONSIBILITIES
5.4.1 Role of Statoil Project Team
Ultimate responsibility for environmental performance of the Project lies with Statoil. Statoil will have responsibility for monitoring the performance of the contractor and also the overall Project. Where the measures set out in the EIA/ EMP do not result in the achievement of objectives, Statoil will work with the contractor to refine the measures.
On a day to day level, implementation of HSE responsibilities shall be cascaded down throughout the organizational hierarchy incorporating all staff involved in the implementation of the Project. Key players referenced in this EMP as having day to day responsibilities for HSE management include:
• Exploration Manager – who shall have day to day responsibility for the
implementation of all aspects of this EMP; • Senior Coordinator Drilling Procurement – who shall be responsible for
ensuring relevant requirements are translated into contractual and service documents; reviewing the competency of contractors and service providers to implement the necessary HSE requirements and holding contractors and service providers to the implementation of these requirements through monitoring and evaluation;
• HSE Manager – who shall be responsible for overseeing the
implementation of this EMP by assisting the Exploration and Procurement Managers as relevant; preparing sub-management plans for implementation by contractors as outlined in Table 5-1; auditing and supervising contractors for adherence with the provisions of this EMP; liaising and cooperating with government authorities on environmental matters as relevant; preparing work and cost schedules for the monitoring program; arranging for reporting of the results of the monitoring; maintaining records and reports to document implementation; and periodically reviewing and if necessary revising the contents of this plan to ensure it fully reflects on site circumstances; and
• Government and Public Affair (GPA) Officer – who shall be responsible
for developing and implementing a Stakeholder Engagement Plan for the Project, maintaining regular and positive dialogue with stakeholders in line with this plan, documenting the results of engagement, recording and addressing grievances and managing compensation processes on behalf of Statoil.

ENVIRONMENTAL RESOURCES MANAGEMENT STATOIL DRILLING EIA
5-8
5.4.2 Role of Drilling Contractor
The contractor will be responsible for ensuring compliance with all relevant legislation, Statoil procedures as well as adherence to all environmental controls and mitigation measures specified in the EIA report. This includes:
• Ensuring drill vessel procedures and management practices reflect the requirements presented in this EMP and that the measures are fully implemented;
• Ensuring relevant personnel, including sub-contractors, are aware of and implement their responsibilities with respect to HSE management through induction, competency evaluation, job descriptions and employment contracts, training, briefings and disciplinary action;
• Assigning responsibility for HSE management on the drill vessel to a named individual and ensuring that they are equipped to complete their role with respect to this EMP;
• Conducting daily inspections of the drill vessel to check implementation of the measures presented in this EMP, identify any actual impacts and to remedy digressions immediately;
• Reporting any spills or identified impacts to Statoil immediately and assisting in developing and implementing subsequent mitigation actions;
• Managing materials, fuels, chemicals, wastes, wastewater and equipment etc on the drill vessel so as to prevent contamination of the marine environment or the generation of excessive air emissions, debris, waste, sediment, or noise;
• Managing, preventing and developing emergency plans in case of any accident or emergency; and
• Passing relevant requirements to sub-contractors and services providers and monitoring and enforcing their implementation.
Contractual documentation between Statoil and the contractor shall include a clear description of the contractors’ obligations to implement the proposed control and mitigation measures for the potential environmental impacts identified in the EIA and EMP for the project.
5.5 COMPETENCIES AND TRAINING
For implementation of this EMP, and project environmental performance to be successful, personnel responsible for its implementation will need to have the relevant competencies, capabilities and job descriptions to enable them to carry out their responsibilities efficiently and effectively. Taking into account the role descriptions presented in Section 5.4, competencies of allocated staff

ENVIRONMENTAL RESOURCES MANAGEMENT STATOIL DRILLING EIA
5-9
shall be reviewed in line with existing Human Resources and Training evaluations and development plans and programs implemented for individual staff members to address gaps.
In addition to competencies in environmental management, personnel involved in the implementation of this EMP shall also be required to have the following competencies:
• Good appreciation of the activities relevant to the Project (as relevant);
• Sound understanding of the Project HSE performance expectations; and
• Leadership and program execution skills.
5.6 INSPECTION, AUDIT AND CORRECTIVE ACTIONS
Regular audits and inspection (random spot checks) shall be undertaken throughout the execution of the Project as outlined in Table 5-1. The objectives of these reviews are to:
• Check that practices conform with planned arrangements including implementation of mitigation and management measures and compliance with legal and project commitments;
• Identify where existing planned arrangements (eg. measures outlined in the EMP) do not meet the needs of Statoil or can be improved; and
• Establish information which can be used by management to continually improve performance.
Three types of audits shall be undertaken: 1. Daily inspections by the Drill Vessel Master; 2. Fortnightly audits by Statoil personnel; and 3. Ad-hoc audits in response to accidental events.
5.6.1 Daily Inspections
Visual site inspections shall be conducted by the Drill Vessel Master on a daily basis. All results of site inspections shall be documented and submitted to Statoil.
5.6.2 Fortnightly Audits
Fortnightly conformance and compliance audits shall be conducted by Statoil. All results of audits shall be documented and retained. Instances of non-conformances shall be reported to the relevant Supervisors to ensure that appropriate corrective and/or preventive action is taken.

ENVIRONMENTAL RESOURCES MANAGEMENT STATOIL DRILLING EIA
5-10
5.6.3 Ad-hoc Audits
These shall be triggered by an incident and will specifically seek to understand the cause of the incident and identify a solution.
5.6.4 Audit Reporting
All audit findings shall be reviewed by the Statoil HSE Manager, and where corrective actions are deemed necessary, specific plans (with designated responsibility and timing) shall be developed aimed at addressing the specific finding, any underlying issues and ultimately achieving continuous improvement in performance.
5.7 REPORTING AND STAKEHOLDER COMMUNICATION
Contractors shall be required to report issues immediately to Statoil in the event that monitoring and/ or inspection identifies issues which need to be rectified immediately. Results of monitoring will indicate whether or not the mitigation measures are effective. If a particular mitigation measure is found to be ineffective, contractors shall be asked to stop work and take the necessary corrective actions. The results of monitoring, and any corrective actions implemented, shall be shared with relevant stakeholders. Dialogue with stakeholders will also be an important means of confirming impact severity, particularly with respect to impacts on fisheries. A Stakeholder Engagement Plan for the Project shall be prepared as stated in Table 5-1 and shall include engagement to monitor impacts.
5.8 ENVIRONMENTAL MONITORING
Some potential environmental effects can be predicted with a degree of precision. A number of effects can however only be accurately evaluated once the activity commences (through impact monitoring). Monitoring will be required in order to demonstrate compliance with legal limits and Statoil’s project requirements (compliance monitoring).
Monitoring will also provide verification of the overall design and effectiveness of the implemented control measures. The key objectives of Statoil’s proposed monitoring activities are as follows:
• To monitor discharges and emissions to ensure compliance with relevant standards and Statoil’s environmental objectives;
• To provide an early indication that any of the environmental control measures or practices are failing to achieve acceptable standards; and

ENVIRONMENTAL RESOURCES MANAGEMENT STATOIL DRILLING EIA
5-11
• To determine whether environmental changes are attributable to the Karama Block exploration drilling program, other activities or as a result of natural variation.
In developing the monitoring program, the following considerations and strategies have been applied:
• Consistent with internationally and locally acceptable practices;
• Responsive to detect environmental changes/ trends;
• Logistically practical; and
• Cost effective. The following sections outline the recommended monitoring activities for the exploration drilling program.
5.8.1 Seabed Sediments/ Benthic Community
It is recommended that a sediment/ benthic monitoring survey be conducted to determine the type of benthic communities present and if there are any sensitivities associated with these prior to beginning drilling activities. Indicative parameters to be monitored are presented in Table 5-2.
Table 5-2 Monitoring of Sediments/ Benthic Community
Parameter Specification Physico-chemical • Particle size distribution (PSD)
• Total organic carbon (TOC) • Redox potential
Hydrocarbons • Total hydrocarbons • Total petroleum hydrocarbons • Total extractable hydrocarbon • PAH (Poly Aromatic Hydrocarbons)
Metals • Ba, Cr, Hg, Ni, V & Zn Ecology • Macrobenthos - taxonomic name and numbers of
individuals of all identified species
5.8.2 Drilling Waste
Drilling wastes will be managed by Statoil’s Drilling Contractor. It is recommended that the following information will be inventoried during exploration drilling activities and presented to Statoil by the Drilling Contractor:
• Drilling muds and chemicals used to drill the well which should include the information provided in Table 5-3; and
• Collection of specific mud and cutting samples during drilling, for analysis as outlined in Table 5-3.

ENVIRONMENTAL RESOURCES MANAGEMENT STATOIL DRILLING EIA
5-12
Table 5-3 Monitoring of Drilling Mud & Chemical Use: Drilling OCN Reports
Parameter Specification Reporting parameters • Mud type (WBM /SBM & their application)
• WBM composition & concentration of use • SBM composition & concentration of use • Specific mud constituents including, mercury
compounds, cadmium compounds, persistent components (synthetic and hydrocarbons), and heavy metals
• Total quantity of each mud type used • Total quantity of each mud type discharged, loss to
formation and recovery plus estimation of total quantity of base oil discharged
• Lithology and estimated volume of cuttings discharged Analytical parameter • As indicated in Minister of Energy and Mineral Resources
Regulation No. 045 Year 2006 Responsible Person Drilling Contractor
5.8.3 Waste Management
Recommended monitoring requirements throughout drilling activities for waste generation include the following:
• An inventory of waste types and volumes generated and transported to shore for disposal will be maintained. A log of hazardous waste produced and sent to shore for disposal will also be kept; and
• Waste consignment notes for all wastes transferred to shore will be held.
5.8.4 Accidental Events/ Upset Conditions
A log of non-routine events, spills and accidents will be maintained throughout drilling operations and the necessary root cause analysis will be undertaken.
5.9 OIL SPILL CONTINGENCY/ RESPONSE PLAN
An Oil Spill Contingency Plan (OSCP) will be developed by Statoil for the Karama Block Exploration Drilling project, taking into account Presidential Regulation No. 109 of 2006 concerning emergency response for oil spillage in the sea, and incorporated in the drill ship’s Shipboard Oil Pollution Emergency Plan (SOPEP).
In the event of an oil spill, the response operations will be managed in accordance with a tiered approach outlined in the OSCP/SOPEP. Response measures will be managed/ directed from the emergency management coordination centre (ie. at a suitable logistical location in terms of being able

ENVIRONMENTAL RESOURCES MANAGEMENT STATOIL DRILLING EIA
5-13
to respond to a spill) and, depending of the size/volume of the spill, will include the following measures:
• Prevent, control or stop outflow of oil from the source;
• Deploy booms close to the source of the spill to contain the spread of oil;
• Monitor the movement and behaviour of the oil spill;
• Activate further response operations, to protect sensitive resources if necessary; and
• Determine appropriate clean-up priorities and other response measures.
All wastes generated during the oil spill response and clean-up operations will be disposed of according to the relevant legal requirements.
5.10 REVIEW AND REVISION
The EMP will be a “live” document. It will be reviewed by the Project team prior to start of and during project activities, in consultation with Statoil’s HSE department, on a periodic basis during the project. The EMP will be updated as needed to provide effective management of environmental issues associated with exploration drilling program.


ENVIRONMENTAL RESOURCES MANAGEMENT STATOIL EIA DRILLING
6-1
6 CONCLUSIONS
6.1 INTRODUCTION
Statoil Indonesia Karama As (Statoil) and partners plan to undertake an exploration drilling program of three deep-water exploration wells at Karama Block in the Makassar Strait, offshore West Sulawesi Province in 2011. The purpose of this project is to discover the oil or gas targets identified from interpretation of 3D seismic survey data.
An Environmental Impact Assessment (EIA or AMDAL) is not required under Indonesian Regulation for exploration drilling activities. This IA is being completed in line with Statoil’s corporate requirements and covers only the exploration drilling activities for the Karama Block.
6.2 ENVIRONMENTAL CONCERNS
The key environmental concerns identified as requiring consideration for impact assessment were:
• Air quality;
• Noise generation;
• Waste generation and disposal;
• Water quality;
• Fisheries;
• Unplanned events.
Baseline conditions of the project area covering physical, biological, and socio-economic environment were comprehensively described based on available secondary data. Data gaps were evident for information or secondary data sources on fisheries, benthic communities, sensitive marine receptors such as marine mammals, turtles, mangrove, coral reef and sea weed/sea grass ecosystems in the project area.
6.3 OUTCOME OF THE IMPACT ASSESSMENT
The outcome of the impact assessment is presented in Section 4 and is summarised as:
• Overall impacts to air quality are evaluated to be of Low Magnitude but Medium Sensitivity (due to the vulnerability of Indonesia to climate change impacts) with an overall impact of Minor Significance;
ENVIRONMENTAL RESOURCES MANAGEMENT STATOIL EIA DRILLING
6-2
• Offshore impacts from noise generation;
o As the area is a major spawning area for eels and important for fisheries, and taking a conservative approach due to the lack of information on fisheries and other sensitive marine receptors, impacts are evaluated to be of Medium Magnitude and High Sensitivity, with an overall impact of Moderate Significance with mitigation.
• Onshore impacts from noise generation
o Impacts are evaluated to be of Low Magnitude and Low Sensitivity with the overall impact considered to be Not Significant.
• Provided wastes are managed appropriately, residual impacts associated with the generation and disposal of wastes are reduced to Not Significant
• Impacts from the discharge of drilling wastes are evaluated to be of Medium Magnitude and Medium Sensitivity with an overall impact of Moderate Significance;
• Considering that only WBMs will accumulate near the well surface, impacts to seabed and benthic communities are evaluated to be of Low Magnitude and Medium Sensitivity (as the type of benthic species present is currently unknown) with an overall impact of Minor Significance;
• Impacts from drilling activities are therefore evaluated to be of Medium Magnitude and Medium Sensitivity. Overall impacts are therefore considered to be of Moderate Significance and with mitigation of Minor Significance.
• Even with the application of the latest industry standards and consideration of the highest standards of safety, accidental events may still occur. Blowout/ spills occurring within the Karama Block have the potential to have significant impacts on the environment including potential health impacts. An uncontrolled blow out could take many days or months to bring under control. Impacts are therefore evaluated to be of High Magnitude and High Sensitivity with an overall impact of Major Significance. However, provided mitigation measures are implemented and effective, residual impacts associated with accidental impacts are considered to be of Moderate Significance.
6.4 SUMMARY CONCLUSION
On the basis of this assessment, it is concluded that, provided the in-place mitigation and control measures are effective and all impacts associated with the Project are managed appropriately as suggested no significant impacts are anticipated for the drilling of the exploration wells in the Karama Block.

ENVIRONMENTAL RESOURCES MANAGEMENT STATOIL EIA DRILLING
6-3

APPENDICES
Appendix 1: Oil Spill and Drilling Cuttings Modeling Result
Appendix 2: Analytical Result of Seawater Quality
Appendix 3: Analytical Result of Seabed Sediment Quality
Appendix 4: Stakeholder Engagement Meeting
Appendix 5: Master Impact Tables
Appendix 6: Drilling Chemical Characteristics

APPENDIX 1
OIL SPILL AND DRILLING CUTTINGS
MODELING RESULT
ENVIRONMENTAL RESOURCES MANAGEMENT STATOIL APPENDIX 1
3
1 ACCIDENTAL OIL SPILLS
1.1 SIMULATION DESIGN
Modeling was performed to assess potential environmental impacts in the event of an accidental release of hydrocarbons due to an annulus blowout at the Anoman Well (UTM easting 673819.520008, northing 9732223.28191, Zone 50S WGS84,). The model calculated the spatial extent of the oil released, the directions spills may travel, the thickness of the surface slick (compared to significant thickness thresholds), the time of travel, and magnitudes and durations of potentially toxic dissolved aromatic component concentrations (compared to no-effect thresholds). The model assumes that there is no intervention to reduce and manage the magnitude of spill such as use of dispersants and recovery mechanisms.
A generic crude oil was assumed to be released from the sea floor. Three release scenarios were evaluated for two separate months and two separate wind conditions. The two months evaluated were March (the end of the northwest monsoon season), and October (the end of the southeast monsoon season). For each of the two months, typical and maximum wind scenarios were run. In the first four scenarios (Scenarios 1-1 through 1-4), the release was assumed to be 8000 m³/d over a period of five days. The models were run for 18 days to evaluate the fate of the five-day release. In the second four scenarios (Scenarios 2-1 through 2-4), the release was assumed to be 3000 m³/d for 112 days. In the third four scenarios (Scenarios 3-1 through 3-4), the release was assumed to be 10800 m³/d over a period of 112 days. These models were run for 120 days to assess the fate of the 112-day release.
Due to the unavailability of long period current meter records, deterministic modeling was chosen over stochastic modeling to examine the probable locations spills could travel. Modeled currents and metocean measurements were selected from 2008, a year when a complete data set was available. Though the results are limited to this representative year, and the conclusions lack the range of potential outcomes associated with a probabilistic assessment, the results are considered appropriate for an assessment of the risks and quantification of the impacts associated with an oil spill. The specific shorelines impacted and area of oil covering the water surface will naturally vary in an actual emergency based on the winds, currents, and release characteristics.

ENVIRONMENTAL RESOURCES MANAGEMENT STATOIL APPENDIX 1
4
Table 1-1 Spill modeling scenarios
Scenario Month Duration Volume (m³/d) Winds/Currents Scenario 1-1 March 5 days 8000 Typical Scenario 1-2 March 5 days 8000 Maximum Wind Scenario 1-3 October 5 days 8000 Typical Scenario 1-4 October 5 days 8000 Maximum Wind Scenario 2-1 March 112 days 3000 Typical Scenario 2-2 March 112 days 3000 Maximum Wind Scenario 2-3 October 112 days 3000 Typical Scenario 2-4 October 112 days 3000 Maximum Wind Scenario 3-1 March 112 days 10800 Typical Scenario 3-2 March 112 days 10800 Maximum Wind Scenario 3-3 October 112 days 10800 Typical Scenario 3-4 October 112 days 10800 Maximum Wind
Bathymetry was obtained from the US NOAA GEODAS Design-a-Grid system (NOAA 2009) providing depth measurements every 1.9 km. An oil spill grid (Figure 1-1) was constructed to cover an area 477 km in the north-south direction (349 grid cells), and 188 km in the east-west direction (149 grid cells). Each grid cell near shorelines was subdivided into 16 sub-grid cells (Figure 1-2) for higher resolution when modeling shoreline oiling.
Figure 1-1 Oil spill grid area (gray) and spill release loca-tion at the Anoman Well

ENVIRONMENTAL RESOURCES MANAGEMENT STATOIL APPENDIX 1
5
Figure 1-2 Close-up view of the oil spill grid with shoreline sub-grid
Using GEMSS® (Generalized Environmental Modeling System for Surfacewaters) and its oil spill module, COSIM (Chemical/Oil Spill Impact Module), each spill was simulated using 500 independent particles to represent the spill mass. Each particle was affected by currents, winds, randomized dispersion factors, and weathering. The GEMSS-COSIM modeling system produces time-varying mass balances and tracks the fate of the released chemical constituents into the various phases and forms including the surface slick, shoreline, atmosphere, water column (dissolved or entrained), and sediment deposition. Fate is computed for the following processes: advection, spreading, evaporation, dispersion, dissolution, emulsification, photo-oxidation, sinking, sedimentation, and biodegradation. Summaries of scenario results are provided in terms of the locations of surface oiling, time of travel for the surface oil, maximum dissolved concentrations of aromatics and the potential shoreline areas covered. The model was run until all oil mass had left the water surface onto the land, air, water column, or left the model domain.
COSIM performs simultaneous mass balances for a full suite of specific chemicals or groupings of chemicals with similar properties. This feature enables greater modeling precision by applying chemical specific rates for
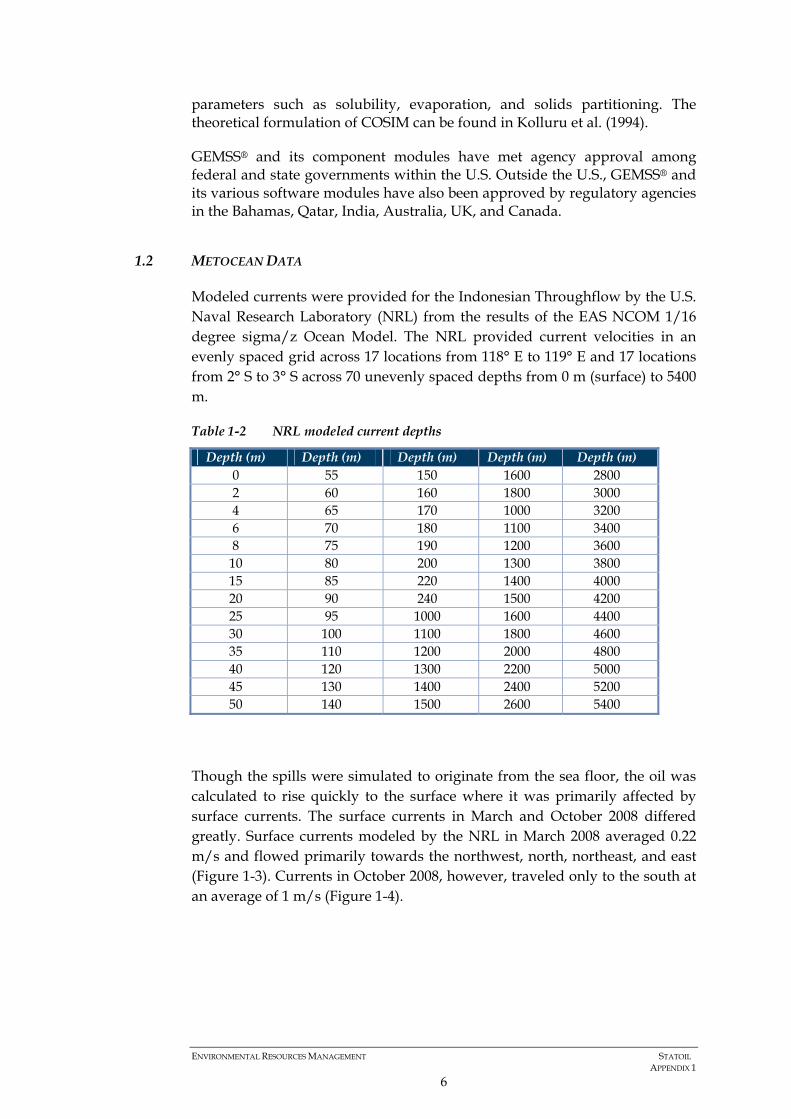
ENVIRONMENTAL RESOURCES MANAGEMENT STATOIL APPENDIX 1
6
parameters such as solubility, evaporation, and solids partitioning. The theoretical formulation of COSIM can be found in Kolluru et al. (1994).
GEMSS® and its component modules have met agency approval among federal and state governments within the U.S. Outside the U.S., GEMSS® and its various software modules have also been approved by regulatory agencies in the Bahamas, Qatar, India, Australia, UK, and Canada.
1.2 METOCEAN DATA
Modeled currents were provided for the Indonesian Throughflow by the U.S. Naval Research Laboratory (NRL) from the results of the EAS NCOM 1/16 degree sigma/z Ocean Model. The NRL provided current velocities in an evenly spaced grid across 17 locations from 118° E to 119° E and 17 locations from 2° S to 3° S across 70 unevenly spaced depths from 0 m (surface) to 5400 m.
Table 1-2 NRL modeled current depths
Depth (m) Depth (m) Depth (m) Depth (m) Depth (m) 0 55 150 1600 2800 2 60 160 1800 3000 4 65 170 1000 3200 6 70 180 1100 3400 8 75 190 1200 3600
10 80 200 1300 3800 15 85 220 1400 4000 20 90 240 1500 4200 25 95 1000 1600 4400 30 100 1100 1800 4600 35 110 1200 2000 4800 40 120 1300 2200 5000 45 130 1400 2400 5200 50 140 1500 2600 5400
Though the spills were simulated to originate from the sea floor, the oil was calculated to rise quickly to the surface where it was primarily affected by surface currents. The surface currents in March and October 2008 differed greatly. Surface currents modeled by the NRL in March 2008 averaged 0.22 m/s and flowed primarily towards the northwest, north, northeast, and east (Figure 1-3). Currents in October 2008, however, traveled only to the south at an average of 1 m/s (Figure 1-4).

ENVIRONMENTAL RESOURCES MANAGEMENT STATOIL APPENDIX 1
7
Figure 1-3 March 2008 current rose
The convention for current direction is “going to”, i.e., the direction the water is heading.
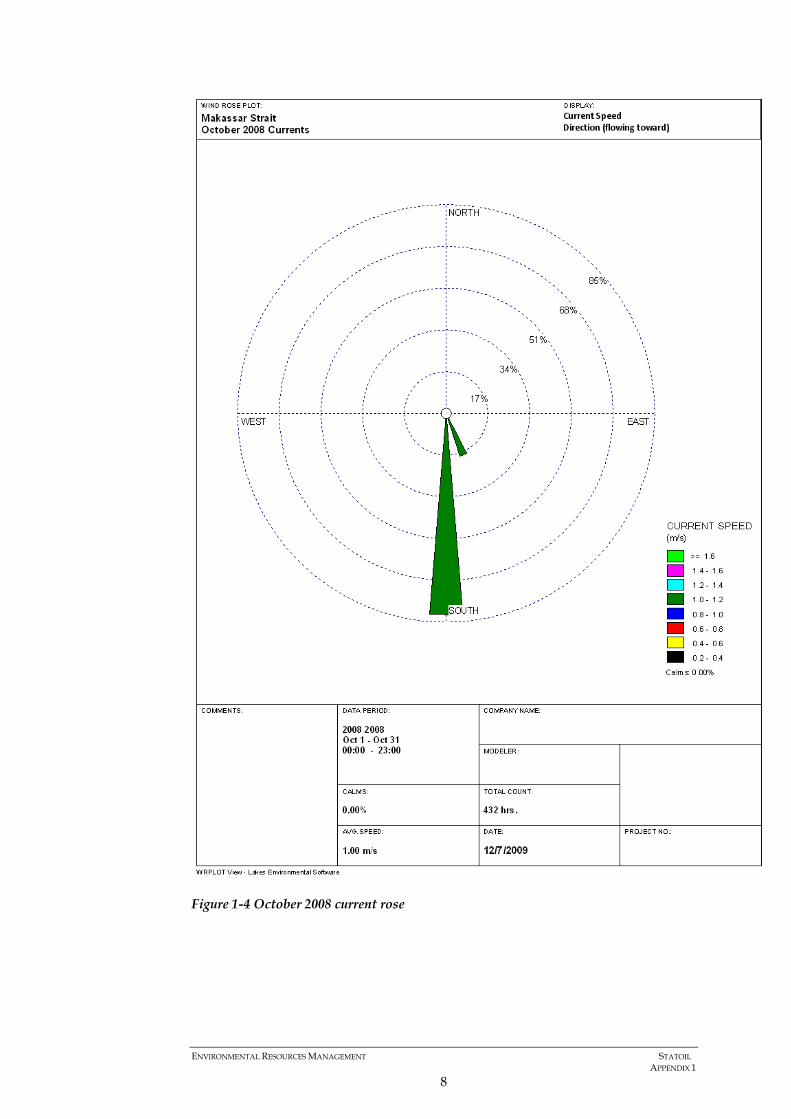
ENVIRONMENTAL RESOURCES MANAGEMENT STATOIL APPENDIX 1
8
Figure 1-4 October 2008 current rose

ENVIRONMENTAL RESOURCES MANAGEMENT STATOIL APPENDIX 1
9
Figure 1-5 Grid of NRL model output locations for current values
Local meteorological data (winds) were obtained from the Asia Pacific Data Research Center (APDRC) for coordinates 118.6° E Longitude, 2.1º S Latitude. While both March and October had significant winds from the east and west, wind rose diagrams (Figure 1-6 and Figure 1-7) showed an additional strong influence of winds from the southwest in March 2008 and from the northeast in October.
For maximum wind scenarios, winds were fixed at a constant direction heading east towards the shoreline. The wind speeds were calculated as the maximum value for the given scenario’s month (March or October) over all of the years available from the APDRC data (1999 through 2009).
Air temperature and dew point temperature were obtained from the U.S. Department of Energy’s National Renewable Energy Laboratory (NREL) for the Ujung Pandang-Hasanudin Airport (Station WAAA) in southwestern Sulawesi.

ENVIRONMENTAL RESOURCES MANAGEMENT STATOIL APPENDIX 1
10
Figure 1-6 March 2008 wind rose
The convention for wind direction is “coming from”.

ENVIRONMENTAL RESOURCES MANAGEMENT STATOIL APPENDIX 1
11
Figure 1-7 October 2008 wind rose
1.3 OIL PROPERTIES AND TOXICITY
In the absence of a site specific chemical assay, the modeled crude oil was based on a chemical assay of a crude oil from a confidential offshore drilling

ENVIRONMENTAL RESOURCES MANAGEMENT STATOIL APPENDIX 1
12
site. The oil chosen was an intermediate weight oil to represent properties as a mid-point between heavy and light crudes. A typical intermediate API gravity of 32.75 and a moderate viscosity of 8.2 cp at 25 °C were assigned to describe the whole oil for calculations of oil spreading and dispersion on the water surface. For calculations of the fate (evaporation, emulsification, entrainment, etc.) and water column dissolved concentrations, the oil was further described into specific components (“cuts”) based on chemical assays of the intermediate crude oil. The model’s cut-specific properties are listed in Table 1-3. COSIM calculates the fate and of each component of the oil separately. The total volume released is divided between each oil cut based on the mass proportions described in the assay. The mass proportions are converted into volumetric proportions based on each cut’s average density. The crude oil components’ properties are described by seven cuts:
• C6-C7 Aromatics
• C8-C9 Aromatics
• Naphthalenes
• nC4 Butane
• nC5 Pentane
• nC6 Hexane and other Paraffins
• Resins / Heavy Residuals
The C1-C5 aromatics together comprised less than 2.5% of the total mass and were combined into the C6-C7 category (though the properties of C6-C7 aromatics were used).
For the toxicological assessment, the sum of the dissolved aromatic hydrocarbons was calculated to assess the potential for acute aquatic impacts to biota from narcosis. Toxicity thresholds for aromatics are found in the literature as a function of 96-hour LC50 concentrations. According to recommendations by Nilsen et al. (2006), threshold values based on effect limits as a function of species sensitivity to specific dissolved oil components were determined. Using this methodology, the threshold for aromatics may be up to 99 ppb for PAHs, and 2523 ppb for monoaromatics. The toxicity of the dissolved components will change over time as various compounds will leave the dissolved state at different rates. For a conservative threshold, including components less likely to be solubilized, a weighted average of the each component’s threshold concentration was calculated to be 310 ppb, derived from the components found in the whole oil (Table 1-4). Threshold values would be higher if the proportioning was based on the dissolved components at each time step. Note that the geometric mean of the C6 and C7 threshold concentrations was taken to compute the C6-C7 aromatic threshold since the LC50 values from which the thresholds were derived are assumed to be log normally distributed. Similarly, geometric means were taken for C8-C9 aromatics and two categories of naphthalenes provided by Nilsen et al.

ENVIRONMENTAL RESOURCES MANAGEMENT STATOIL APPENDIX 1
13
Table 1-3 Properties of representative intermediate crude oil
Cut Name C6-C7 Aromat
ics
C8-C9 Aromatic
s
Naphthalenes
nC4 Butane
nC5 Pentane
nC6 Hexane Other
Paraffins
Resins and Heavy
Residuals
Boiling point (°C) 105.9 136.1 271.7 -0.5 36.1 68.7 400.0 Melting point (°C) N/A N/A 47.2 N/A N/A N/A 200.0 % volume in liquid 11.7 11.7 7.0 1.7 2.0 20.4 45.5
Solubility (mg/l) 25°C 719.0 169.0 6.0 72.0 0.0001 9.5 0.00025 Molecular
weight (g/mole) 90.0 106.2 170.3 58.1 72.2 86.0 350.0
Vapor pressure (Pa) 25°C
5.14E+03
1.28E+03 9.65E-01 1.15E+05 6.00E+04 6.89E+04 1.00E-03
Density (gm/cc) 0.868 0.867 0.997 0.584 0.626 0.664 0.985 Latent heat of liquid (KJ/Kg)
N/A N/A N/A 385.20 357.27 331.45 N/A
Dynamic Viscosity (cP) 0.583 0.703 0.780 0.210 0.217 0.314 N/A Diffusion coefficient 0.091 0.074 N/A 0.0971 0.086 0.0779 N/A
*Note: Unavailable (N/A) values were replaced internally by model calculated estimates
Table 1-4 Threshold concentrations by oil component cuts (whole oil)
Oil Cut % Volume Threshold 5% Lethal Risk
(ppb) C6-C7 Aromatics 11.7 1332.0 C8-C9 Aromatics 11.7 179.3
Naphthalenes 7.0 44.7 nC4 Butane 1.7 3100.0 nC5 Pentane 2.0 549.7
nC6 Hexane and other Paraffins 20.4 311.9
Resins and Heavy Residuals 45.5 4.4
1.4 RESULTS
The model results are presented as color contour maps representing locations that may have significant surface oiling or shoreline oiling at some point after a spill until the surface slick has all evaporated, hit shoreline, or left the model domain. Significant surface oiling is defined as any oil having a thickness above the minimum thickness threshold, a value that protects aquatic biota from being smothered. This threshold is calculated as 0.1 µm, an order of magnitude below a minimum smothering thickness of 1 µm (French et al, 1999; NOAA 1996). Thicknesses less than the 0.1 µm threshold are typically invisible to the eye (Koops, 1985). In COSIM, the threshold thickness is translated into units of mass per surface area (0.04 g/m²) calculated from the thickness threshold multiplied by the oil density. Model output is presented for those locations with surface oil mass per unit area equal to or greater than the 0.04 g/m² threshold.
Travel time diagrams use color contours to identify the time when oil was present at a given location on the water surface. The diagrams are adjusted to only show locations with significant surface oiling. Note that oil may contact the surface of a location, pass through, and then return back to the same

ENVIRONMENTAL RESOURCES MANAGEMENT STATOIL APPENDIX 1
14
location at a later time. The travel time color will be associated with the latest time the oil contacted that location.
Mass balance plots describe the fate of the oil as time-varying percentages of the total mass for the five primary phases: the surface oil, dissolved, entrained (whole oil droplets suspended in the water column), stranded on shorelines, and mass evaporated or volatilized into the atmosphere.
1.4.1 Scenario 1-1 – March (Typical Winds), 5 day release, 8000 m³/d
In the first scenario, during March a five day constant release of crude oil rose from the sea floor to the surface within a day and traveled to the east. Before contacting the shore, the trajectory spread both north and south from the well location until contacting shoreline after 40 hours (Figure 1-8). The shorelines of Karampuang Island were oiled within 6 days after the initial release. After a week from the initial release, the surface oil spread towards the shores of South Sulawesi. Some oil on saturated shorelines returned to the sea and oiled other shorelines to the south. A total of approximately 170 km of shoreline accumulated oil resulting from this release. The surface area with significant oil thickness is shown in Figure 1-9. Significantly thick oil contacted a cumulative area of 1703 km². The travel time diagram (Figure 1-10) shows significant oiling was estimated to be present up to 20 days after the release.
Aromatics dissolved into the water column are computed to exceed the toxicological threshold of 310 ppb, reaching maximum concentrations in many areas in the plume up to 1000 ppb. To quantify the amount of threshold exceedance, the highest concentrations at each grid cell location over depth and time were computed (Figure 1-11). In this scenario, 161 km² of surface area had concentrations that at some point exceeded the 310 ppb threshold. Vertically within the water column, besides at the release location, the largest dissolved concentrations were calculated mostly at the surface layers of the model beneath the surface slick before diluting with depth. Though the risk of exposure to benthic organisms is minimal, pelagic species remaining in the concentrated plume near the surface can be at risk of experiencing narcotic effects from dissolved aromatics. Exceeding a toxic threshold does not necessarily indicate an acute toxicological response will definitely occur, but that the risk of fish mortality is elevated. For mortality to occur, an organism needs to be exposed to lethal concentrations for a significant duration. Additionally, organisms have varying sensitivities such that an identical exposure may or may not cause mortality to the same species. The threshold was conservatively estimated and based on studies wherein test organisms died after a 96-hour exposure. Shorter durations correlate with exponentially larger concentrations necessary to cause an equivalent lethal effect. If organisms are only briefly exposed to lethal concentrations before traveling below or away from the area, mortality can be avoided.

ENVIRONMENTAL RESOURCES MANAGEMENT STATOIL APPENDIX 1
15
Figure 1-8 Scenario 1-1 – trajectory and shoreline oiling
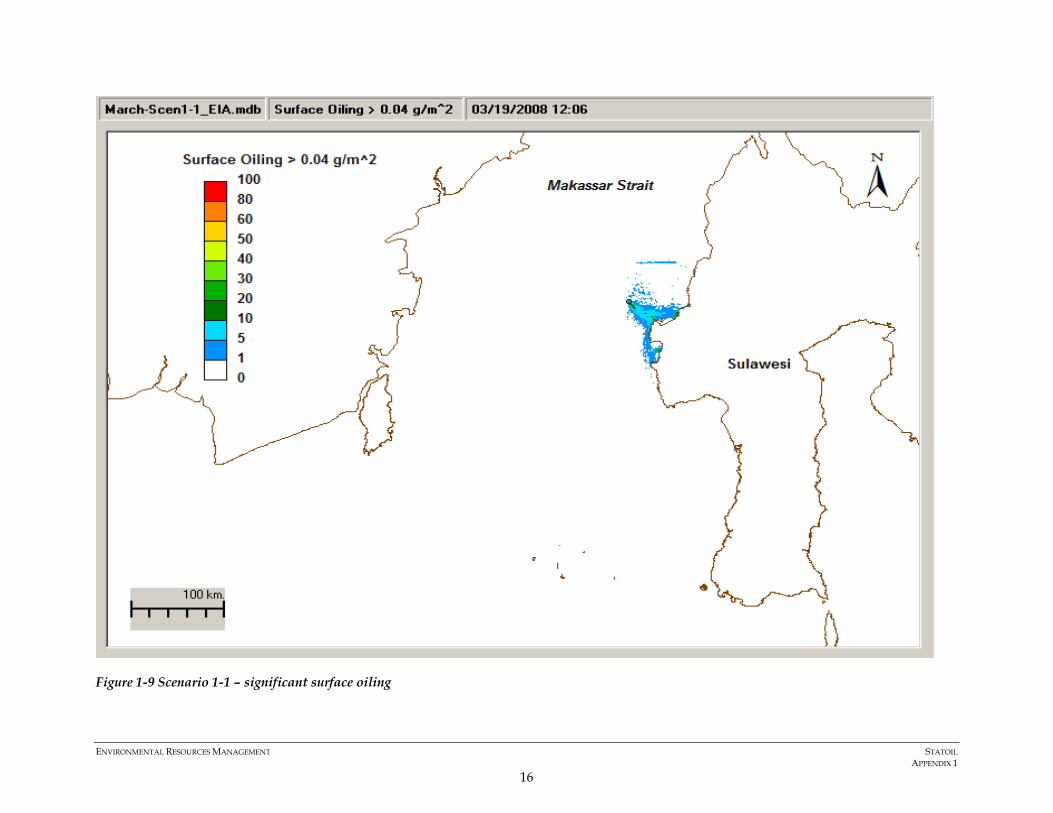
ENVIRONMENTAL RESOURCES MANAGEMENT STATOIL APPENDIX 1
16
Figure 1-9 Scenario 1-1 – significant surface oiling
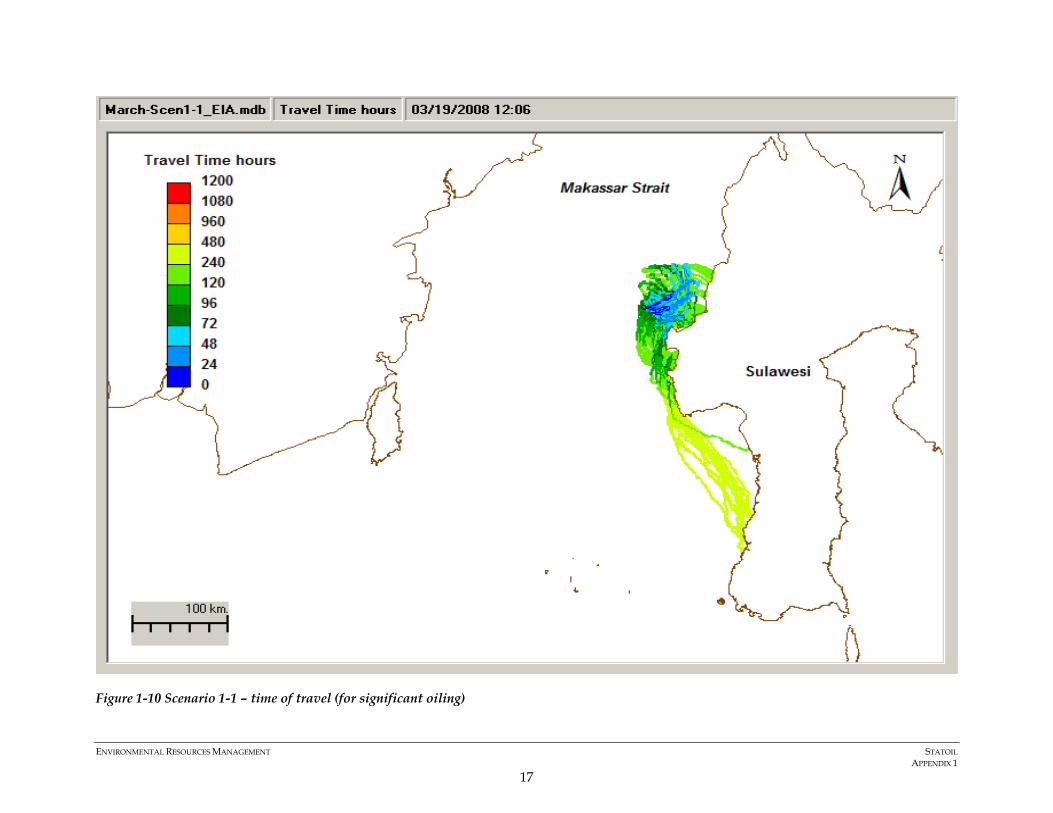
ENVIRONMENTAL RESOURCES MANAGEMENT STATOIL APPENDIX 1
17
Figure 1-10 Scenario 1-1 – time of travel (for significant oiling)
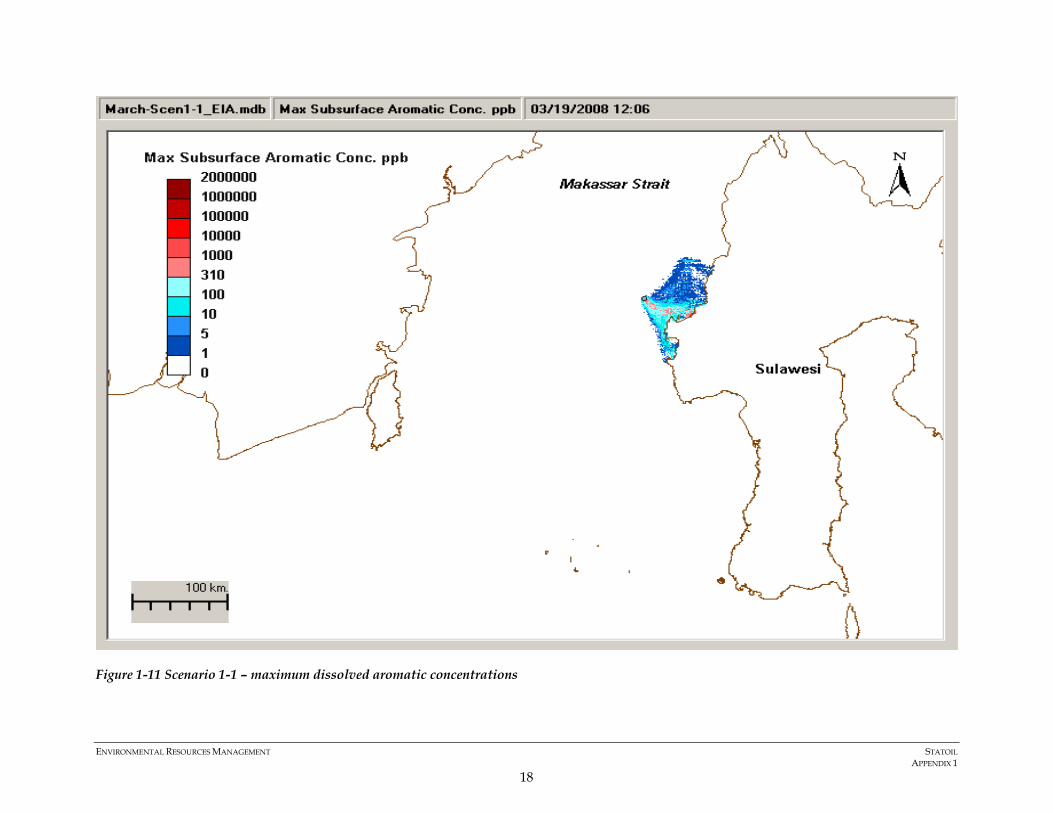
ENVIRONMENTAL RESOURCES MANAGEMENT STATOIL APPENDIX 1
18
Figure 1-11 Scenario 1-1 – maximum dissolved aromatic concentrations

ENVIRONMENTAL RESOURCES MANAGEMENT STATOIL APPENDIX 1
19
The mass balance plot (Figure 1-12) describes the fate of the oil over time transferring into various phases and forms. The model ended after 18 days when the final 8% of oil remaining on the water surface contacted shorelines adding to the 23% already on the shores. After 18 days, 18% of the initial mass had transferred to the atmosphere. The dissolved concentration reached a plateau around 26% of the total mass after a week. Entrained oil mass was initially 100% when first released from the sea floor, but decreased to negligible levels after 10 days. The remaining mass adsorbs to suspended solids and sinks to the sediments.
Scenario 1-1 Mass Balance
0
10
20
30
40
50
60
70
80
90
100
0 24 48 72 96 120 144 168 192 216 240 264 288 312 336 360 384 408 432 456
Hours from Release
% o
f Tot
al M
ass
SurfaceAtmosphereDissolvedShorelineEntrained
Figure 1-12 Scenario 1-1 – mass balance
1.4.2 Scenario 1-2 – March (Maximum Winds), 5 day release, 8000 m³/d
Scenario 1-2 was identical to Scenario 1-1 except the winds were held constant at 8.2 m/s, blowing towards the east. This speed is the maximum easterly wind speed in March measured over all 11 years of meteorological data (1999 through 2009). These high winds dominated the movement of oil on the surface, causing a more focused area of shoreline oiling within 33 hours after the initial release (Figure 1-13) including Karampuang Island. Three days after the 5-day release period ended, all of the oil had left the water surface. The total water surface area covered with a significant thickness of oil at some time during the 8-day event was 1013 km² (Figure 1-14). About 93 km of shoreline was oiled in all.
Figure 1-15 shows the travel time, indicating the northern part of the shoreline was contacted before the southern areas.
As in Scenario 1-1, the dissolved aromatics dissolved into the water column is computed to exceed the 310 ppb threshold (Figure 1-16) at locations typically beneath the surface slick, with maximum values ranging typically between 10

ENVIRONMENTAL RESOURCES MANAGEMENT STATOIL APPENDIX 1
20
ppb to 1000 ppb (Figure 1-16). Over the entire duration of the model simulation, and through all depths, 120 km² of surface area exceeded the threshold at some point in time.
The mass balance analysis (Figure 1-17) shows the shoreline oiling began after 33 hours until ultimately 23% of the mass was stranded on shore. The amount of oil evaporated or volatilized into the atmosphere rose steadily to 18% after 18 days. Dissolved oil reached a maximum of 26% of the total mass. Surface oil mass accounted for 7% to 8% of the total mass before ultimately transferring to the shoreline. The remaining mass adsorbs to suspended solids and sinks to the sediments.

ENVIRONMENTAL RESOURCES MANAGEMENT STATOIL APPENDIX 1
21
Figure 1-13 Scenario 1-2 – trajectory and shoreline oiling

ENVIRONMENTAL RESOURCES MANAGEMENT STATOIL APPENDIX 1
22
Figure 1-14 Scenario 1-2 – significant surface oiling

ENVIRONMENTAL RESOURCES MANAGEMENT STATOIL APPENDIX 1
23
Figure 1-15 Scenario 1-2 – travel time (for significant oiling)

ENVIRONMENTAL RESOURCES MANAGEMENT STATOIL APPENDIX 1
24
Figure 1-16 Scenario 1-2 – maximum dissolved aromatic concentrations

ENVIRONMENTAL RESOURCES MANAGEMENT STATOIL APPENDIX 1
25
Scenario 1-2 Mass Balance
0
10
20
30
40
50
60
70
80
90
100
0 24 48 72 96 120 144 168 192 216 240 264 288 312 336 360 384 408 432 456
Hours from Release
% o
f Tot
al M
ass
SurfaceAtmosphereDissolvedShorelineEntrained
Figure 1-17 Scenario 1-2 – mass balance
1.4.3 Scenario 1-3 – October (Typical Winds), 5 day release, 8000 m³/d
Scenario 1-3 is identical to Scenario 1-1 except the wind and current data are for October instead of March. The currents provided by the US Navy were radically different in October compared to March, because the October currents were predominantly directed towards the south. In this scenario, no shoreline was impacted until 78 hours after the initial release (Figure 1-18). The oil traveled south covering 1958 km² (Figure 1-19) after 18 days (Figure 1-20). Karampuang Island was not hit, though only by a near-miss. The travel time plot shows the oil generally moved from the west to the east as it traveled southward past Sulawesi. The maximum dissolved aromatic concentration typically ranged between 1 ppb and 1000 ppb under the surface slick trajectory from the release location towards West Sulawesi (Figure 1-21). Over the entire duration of the model simulation, and through all depths, 46 km² of surface area exceeded the 310 ppb threshold at some point in time. The mass balance plot (Figure 1-22) shows the various forms of the oil stabilized after the 5-day release to fairly constant values after 2-weeks: 33% on the surface, 13% in the atmosphere, 31% dissolved, 2% on the shore and a negligible amount entrained.
The remaining mass adsorbs to suspended solids and sinks to the sediments.

ENVIRONMENTAL RESOURCES MANAGEMENT STATOIL APPENDIX 1
26
Figure 1-18 Scenario 1-3 – trajectory and shoreline oiling
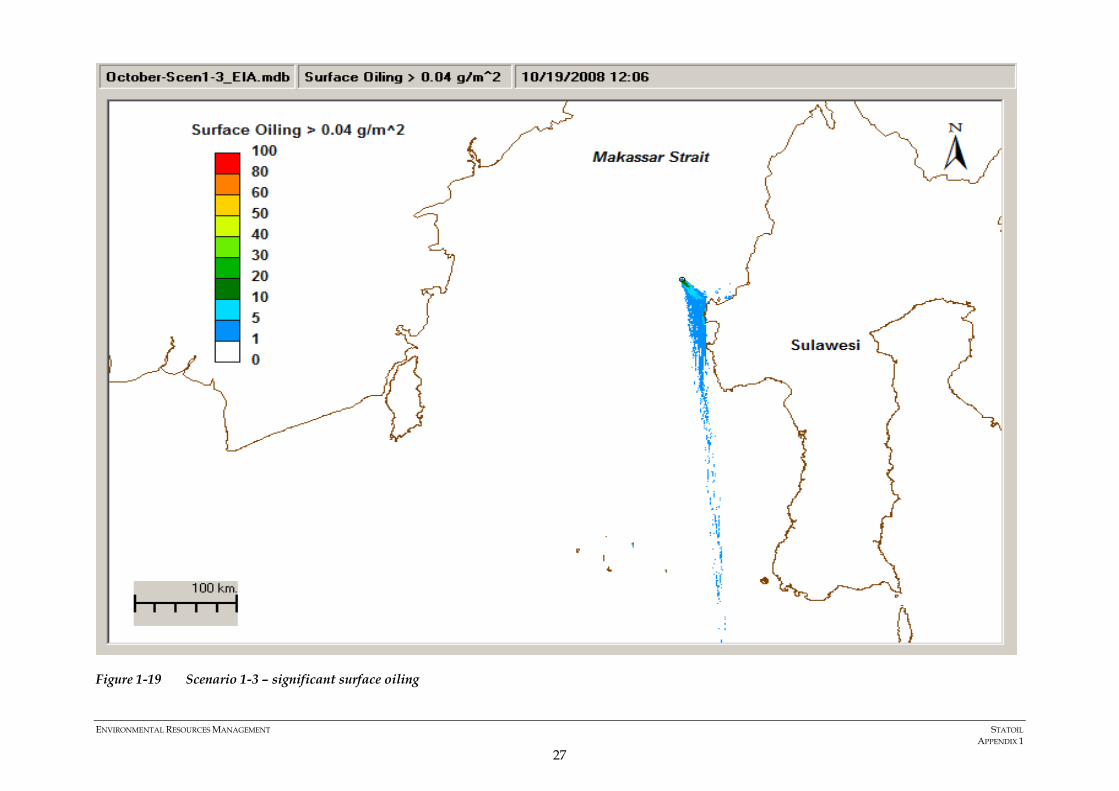
ENVIRONMENTAL RESOURCES MANAGEMENT STATOIL APPENDIX 1
27
Figure 1-19 Scenario 1-3 – significant surface oiling

ENVIRONMENTAL RESOURCES MANAGEMENT STATOIL APPENDIX 1
28
Figure 1-20 Scenario 1-3 – travel time (for significant oiling)

ENVIRONMENTAL RESOURCES MANAGEMENT STATOIL APPENDIX 1
29
Figure 1-21 Scenario 1-3 – maximum dissolved aromatic concentrations

ENVIRONMENTAL RESOURCES MANAGEMENT STATOIL APPENDIX 1
30
Scenario 1-3 Mass Balance
-20
0
20
40
60
80
100
0 24 48 72 96 120 144 168 192 216 240 264 288 312 336 360 384 408 432 456
Hours from Release
% o
f Tot
al M
ass
SurfaceAtmosphereDissolvedShorelineEntrained
Figure 1-22 Scenario 1-3 – mass balance
1.4.4 Scenario 1-4 – October (Maximum Winds), 5 day release, 8000 m³/d
Scenario 1-4 was identical to Scenario 1-3 except the winds were held constant at 11.2 m/s, blowing towards the east, at the maximum easterly wind speed measured in October over all the 11 years of meteorological data (1999 through 2009). Though the currents dominated the overall direction of the spill, the wind directed the surface oil towards the southeast, first contacting shoreline 55 km away after 1 day (Figure 1-23). The oil remained at a significant thickness throughout the time on the surface (Figure 1-24), covering an area of 1447 km². The oil continued to contact some shorelines in South Sulawesi and West Sulawesi, but mostly heading south away from Sulawesi’s coast (Figure 1-25), leaving a total of 84km of shoreline oiled. Though having several near-misses, Karampuang Island was not oiled. However, under slightly different circumstances, oil could have contacted the island. Maximum dissolved concentrations mostly ranged between 1 ppb and 1000 ppb (Figure 1-26). Over the entire duration of the model simulation, and through all depths, 53 km² of surface area exceeded the threshold at some point in time.
The mass balance analysis (Figure 1-27) showed that after five days, the amount of oil on the water surface peaks at 44% and decreased to 20% remaining on the surface heading south past Sulawesi. At the end of the model simulation, 8% of the total oil mass was stranded on the shoreline. The remaining mass adsorbs to suspended solids and sinks to the sediments.

ENVIRONMENTAL RESOURCES MANAGEMENT STATOIL APPENDIX 1
31
Figure 1-23 Scenario 1-4 – trajectory and shoreline oiling

ENVIRONMENTAL RESOURCES MANAGEMENT STATOIL APPENDIX 1
32
Figure 1-24 Scenario 1-4 – significant surface oiling (for significant oiling)

ENVIRONMENTAL RESOURCES MANAGEMENT STATOIL APPENDIX 1
33
Figure 1-25 Scenario 1-4 – travel time

ENVIRONMENTAL RESOURCES MANAGEMENT STATOIL APPENDIX 1
34
Figure 1-26 Scenario 1-4 – maximum dissolved aromatic concentrations

ENVIRONMENTAL RESOURCES MANAGEMENT STATOIL APPENDIX 1
35
Scenario 1-4 Mass Balance
0
10
20
30
40
50
60
70
80
90
100
0 24 48 72 96 120 144 168 192 216 240 264 288 312 336 360 384 408 432 456
Hours from Release
% o
f Tot
al M
ass
SurfaceAtmosphereDissolvedShorelineEntrained
Figure 1-27 Scenario 1-4 – mass balance
1.4.5 Scenario 2-1 – March (Typical Winds), 112 day release, 3000 m³/d
Scenario 2-1 was similar to Scenario 1-1 except it extended the release from 5 days to 112 days, with a rate of release decreased from 8000 m³/d to 3000 m³/d. Oil contacted 504 km of shoreline by the end of the model run (Figure 1-28) including Karampuang Island. The total area of water surface oiled with a significant thickness was 1944 km² (Figure 1-29). The oil first contacted shore directly east of the release within 51 hours and continued oiling shorelines there and to the south (Figure 1-30). The highest concentrations of dissolved aromatics surrounded the shores of West Sulawesi, typically ranging between 1 and 1000 ppb (Figure 1-31). Over the entire duration of the model simulation, and through all depths, 20 km² of surface area exceeded the threshold at some point in time. The mass balance analysis (Figure 1-32) showed that after the four month model simulation, 21% of the oil mass was stranded on the shoreline, 40% was in the atmosphere, 27% had dissolved, and 11% remained on the water surface without contacting shoreline.

ENVIRONMENTAL RESOURCES MANAGEMENT STATOIL APPENDIX 1
36
Figure 1-28 Scenario 2-1 – trajectory and shoreline oiling

ENVIRONMENTAL RESOURCES MANAGEMENT STATOIL APPENDIX 1
37
Figure 1-29 Scenario 2-1 – significant surface oiling (for significant oiling)

ENVIRONMENTAL RESOURCES MANAGEMENT STATOIL APPENDIX 1
38
Figure 1-30 Scenario 2-1 – travel time
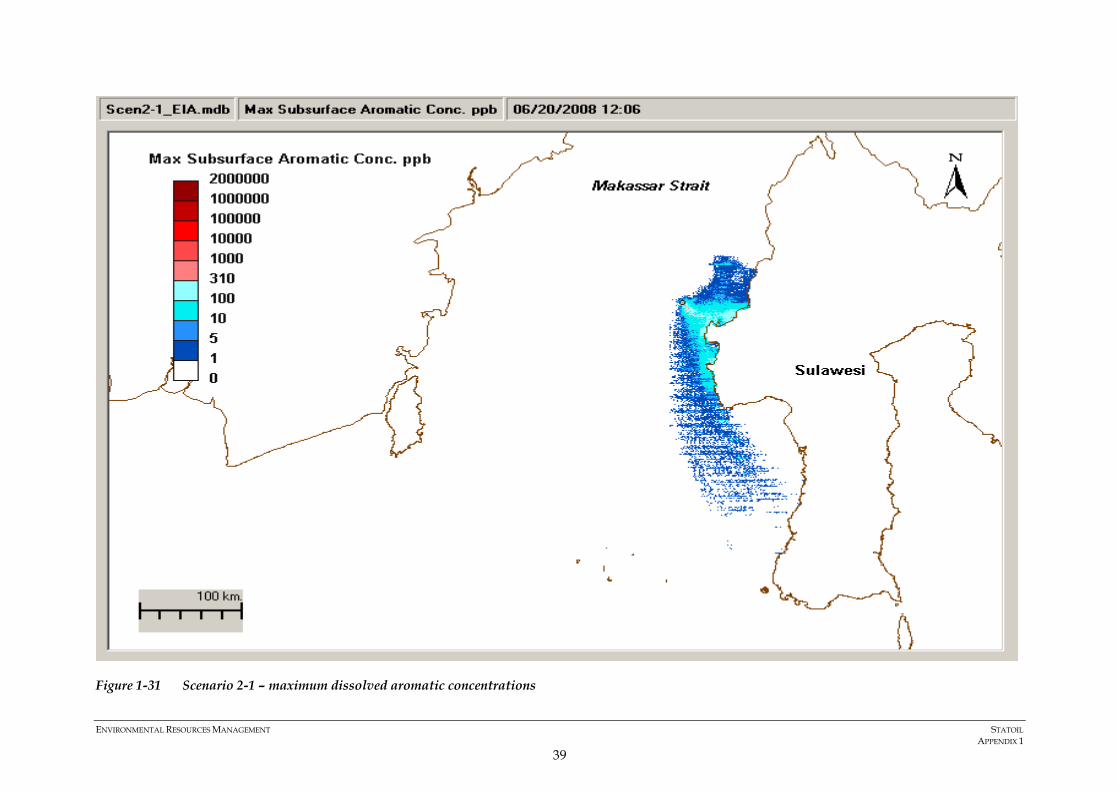
ENVIRONMENTAL RESOURCES MANAGEMENT STATOIL APPENDIX 1
39
Figure 1-31 Scenario 2-1 – maximum dissolved aromatic concentrations

ENVIRONMENTAL RESOURCES MANAGEMENT STATOIL APPENDIX 1
40
Scenario 2-1 Mass Balance
0
10
20
30
40
50
60
70
80
90
100
0 500 1000 1500 2000 2500 3000
Hours from Release
% o
f Tot
al M
ass
SurfaceAtmosphereDissolvedShorelineEntrained
Figure 1-32 Scenario 2-1 – mass balance
1.4.6 Scenario 2-2 – March (Maximum Winds), 112 day release, 3000 m³/d
Scenario 2-2 was similar to Scenario 2-1 except it applied maximum winds calculated from historical values for each month in the simulation period (March through June). These values were 8.2 m/s (March), 9.4 m/s (April), 8.8 m/s (May), and 9.2 m/s (June). Ultimately, oil contacted 289 km of shoreline after the 112-day release (Figure 1-33). The total area of water surface oiled with a significant thickness was 1301 km² (Figure 1-34), including Karampuang Island. The oil mostly contacted shore directly east of the release, first making contact within 34 hours, but also and to the south after 19 days (Figure 1-35). The highest concentrations of dissolved aromatics surrounded the shores of West Sulawesi, typically ranging between 1 and 1000 ppb (Figure 1-36). Over the entire duration of the model simulation, and through all depths, 85 km² of surface area exceeded the threshold at some point in time.
The mass balance analysis (Figure 1-37) showed that after the four month release, 25% of the oil mass was stranded on the shoreline once the remaining mass on the water surface was stranded on shore. The 43% of the mass was ultimately evaporated, and 31% was dissolved.

ENVIRONMENTAL RESOURCES MANAGEMENT STATOIL APPENDIX 1
41
Figure 1-33 Scenario 2-2 – trajectory and shoreline oiling
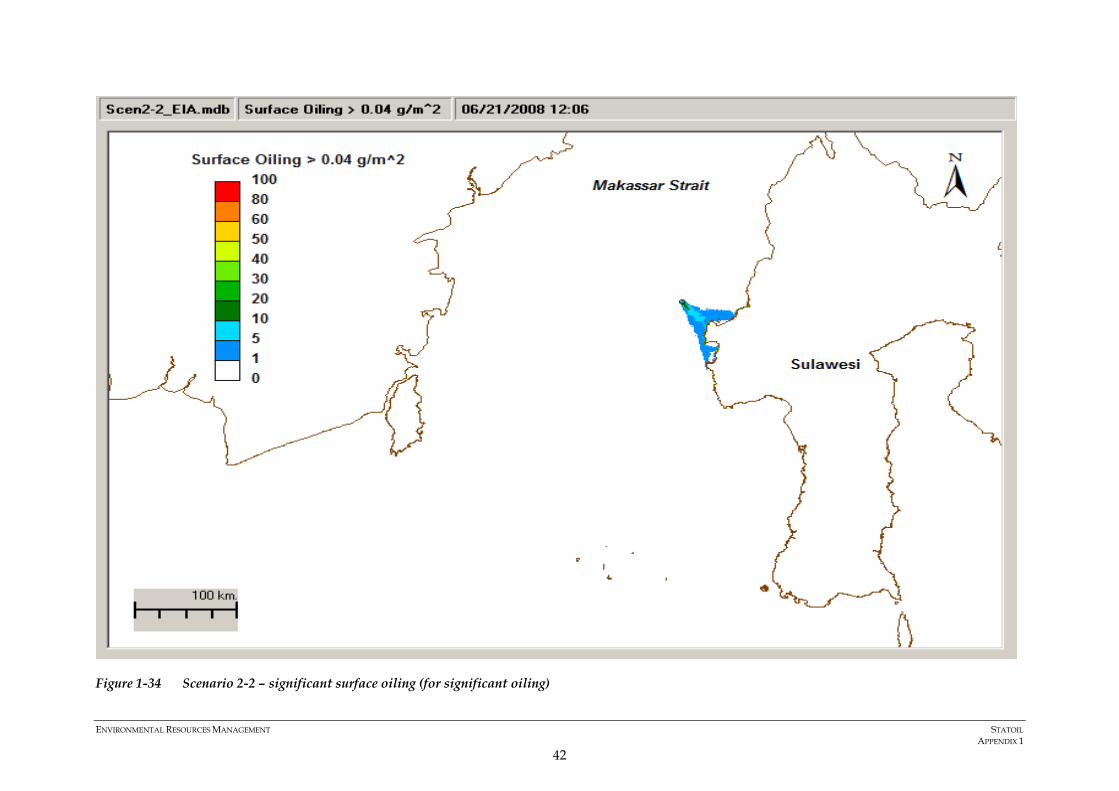
ENVIRONMENTAL RESOURCES MANAGEMENT STATOIL APPENDIX 1
42
Figure 1-34 Scenario 2-2 – significant surface oiling (for significant oiling)

ENVIRONMENTAL RESOURCES MANAGEMENT STATOIL APPENDIX 1
43
Figure 1-35 Scenario 2-2 – travel time

ENVIRONMENTAL RESOURCES MANAGEMENT STATOIL APPENDIX 1
44
Figure 1-36 Scenario 2-2 – maximum dissolved aromatic concentrations

ENVIRONMENTAL RESOURCES MANAGEMENT STATOIL APPENDIX 1
45
Scenario 2-2 Mass Balance
0
10
20
30
40
50
60
70
80
90
100
0 500 1000 1500 2000 2500 3000
Hours from Release
% o
f Tot
al M
ass
SurfaceAtmosphereDissolvedShorelineEntrained
Figure 1-37 Scenario 2-2 – mass balance
1.4.7 Scenario 2-3 – October (Typical Winds), 112 day release, 3000 m³/d
In Scenario 2-3 the surface oil first contacted the shorelines within 113 hours after the initial release and ultimately contacted 277 km of shoreline including Karampuang Island (Figure 1-38). A significantly thick oil layer covered 1270 km² of water surface through the 4-month release (Figure 1-39). The oil traveled south but avoided the South Sulawesi shorelines until 25 days after the release (Figure 1-40). Dissolved concentrations typically ranged from 1 to 1000 ppb with the greatest intensity between the Anoman Well and the West Sulawesi coast (Figure 1-41). Over the entire duration of the model simulation, and through all depths, 75 km² of surface area exceeded the threshold at some point in time. The mass balance analysis (Figure 1-42) showed that ultimately after the 4-month simulation, 11% of the mass hit the shoreline, while 16% on the surface continued to float south past Sulawesi. At that time, 31% of the mass is dissolved and 41% evaporates into the atmosphere.

ENVIRONMENTAL RESOURCES MANAGEMENT STATOIL APPENDIX 1
46
Figure 1-38 Scenario 2-3 – trajectory and shoreline oiling

ENVIRONMENTAL RESOURCES MANAGEMENT STATOIL APPENDIX 1
47
Figure 1-39 Scenario 2-3 – significant surface oiling (for significant oiling)

ENVIRONMENTAL RESOURCES MANAGEMENT STATOIL APPENDIX 1
48
Figure 1-40 Scenario 2-3 – travel time

ENVIRONMENTAL RESOURCES MANAGEMENT STATOIL APPENDIX 1
49
Figure 1-41 Scenario 2-3 – maximum dissolved aromatic concentrations

ENVIRONMENTAL RESOURCES MANAGEMENT STATOIL APPENDIX 1
50
Scenario 2-3 Mass Balance
0
10
20
30
40
50
60
70
80
90
100
0 500 1000 1500 2000 2500 3000
Hours from Release
% o
f Tot
al M
ass
SurfaceAtmosphereDissolvedShorelineEntrained
Figure 1-42 Scenario 2-3 – mass balance
1.4.8 Scenario 2-4 – October (Maximum Winds), 112 day release, 3000 m³/d
Scenario 2-4 was similar to Scenario 2-3 except it applied maximum winds calculated from historical values for each month in the simulation period (October through January). These values were 11.2 m/s (October), 7.6 m/s (November), 11.2 m/s (December), and 9.2 m/s (January). Oil contacted 299 km of shoreline by the end of the model run (Figure 1-43). The total area of water surface oiled with a significant thickness was 1157 km² (Figure 1-44), including Karampuang Island. The oil first contacted shore directly east of the release within 44 hours, and oiled shoreline to the south after 4 days (Figure 1-45). The highest concentrations of dissolved aromatics surrounded the shores of West Sulawesi, typically ranging between 1 and 1000 ppb (Figure 1-46). Over the entire duration of the model simulation, and through all depths, 99 km² of surface area exceeded the threshold at some point in time.
The mass balance analysis (Figure 1-47) showed that after the four month release, 13% of the oil mass was stranded on the shoreline while 16% on the surface continued to float south past Sulawesi. At the end of the simulation, 39% of the mass evaporated, and 31% was dissolved.

ENVIRONMENTAL RESOURCES MANAGEMENT STATOIL APPENDIX 1
51
Figure 1-43 Scenario 2-4 – trajectory and shoreline oiling

ENVIRONMENTAL RESOURCES MANAGEMENT STATOIL APPENDIX 1
52
Figure 1-44 Scenario 2-4 – significant surface oiling (for significant oiling)

ENVIRONMENTAL RESOURCES MANAGEMENT STATOIL APPENDIX 1
53
Figure 1-45 Scenario 2-4 – travel time

ENVIRONMENTAL RESOURCES MANAGEMENT STATOIL APPENDIX 1
54
Figure 1-46 Scenario 2-4 – maximum dissolved aromatic concentrations

ENVIRONMENTAL RESOURCES MANAGEMENT STATOIL APPENDIX 1
55
Scenario 2-4 Mass Balance
0
10
20
30
40
50
60
70
80
90
100
0 500 1000 1500 2000 2500 3000
Hours from Release
% o
f Tot
al M
ass
SurfaceAtmosphereDissolvedShorelineEntrained
Figure 1-47 Scenario 2-4 – mass balance
1.4.9 Scenario 3-1 – March (Typical Winds), 112 day release, 10800 m³/d
Scenario 3-1 was identical to Scenario 2-1 except the release rate was increased from 3000 m³/d to 10800 m³/d. The oil traveled in a similar manner except oil covered more shoreline and more surface area on the water surface. In this scenario, oil ultimately contacted 592 km of shoreline (Figure 1-48). A significantly thick oil slick on the water surface covered 1943 km² throughout the 112 day release (Figure 1-49). The oil first contacted shore within 51 hours and continued oiling the western coastal shorelines from north to south (Figure 1-50). Maximum dissolved aromatic concentrations typically ranged between 1 ppb to 1000 ppb, with a few small areas reaching over 10,000 ppb (Figure 1-51). Over the entire duration of the model simulation, and through all depths, 1,022 km² of surface area exceeded the threshold at some point in time. The mass balance analysis (Figure 1-52) showed that after the 112-days of continuous release, shoreline oiling decreased from a maximum nearly 16% of the mass down to 5% by the end, mostly due to evaporative losses. Oil transferred to the atmosphere steadily increased, and accounted for 52% of the mass after 120 days. The remainder of the mass was either dissolved (28%) or remained on the surface travelling south of Sulawesi (13%).

ENVIRONMENTAL RESOURCES MANAGEMENT STATOIL APPENDIX 1
56
Figure 1-48 Scenario 3-1 – trajectory and shoreline oiling
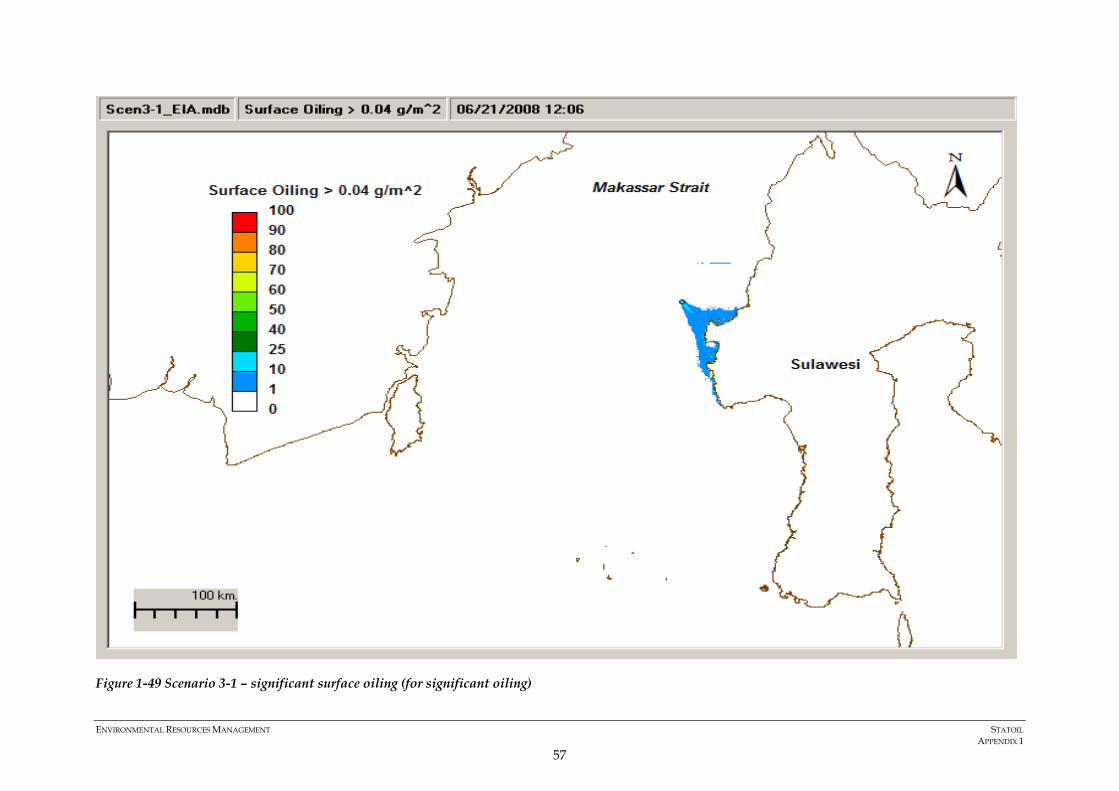
ENVIRONMENTAL RESOURCES MANAGEMENT STATOIL APPENDIX 1
57
Figure 1-49 Scenario 3-1 – significant surface oiling (for significant oiling)

ENVIRONMENTAL RESOURCES MANAGEMENT STATOIL APPENDIX 1
58
Figure 1-50 Scenario 3-1 – travel time

ENVIRONMENTAL RESOURCES MANAGEMENT STATOIL APPENDIX 1
59
Figure 1-51 Scenario 3-1 – maximum dissolved aromatic concentrations
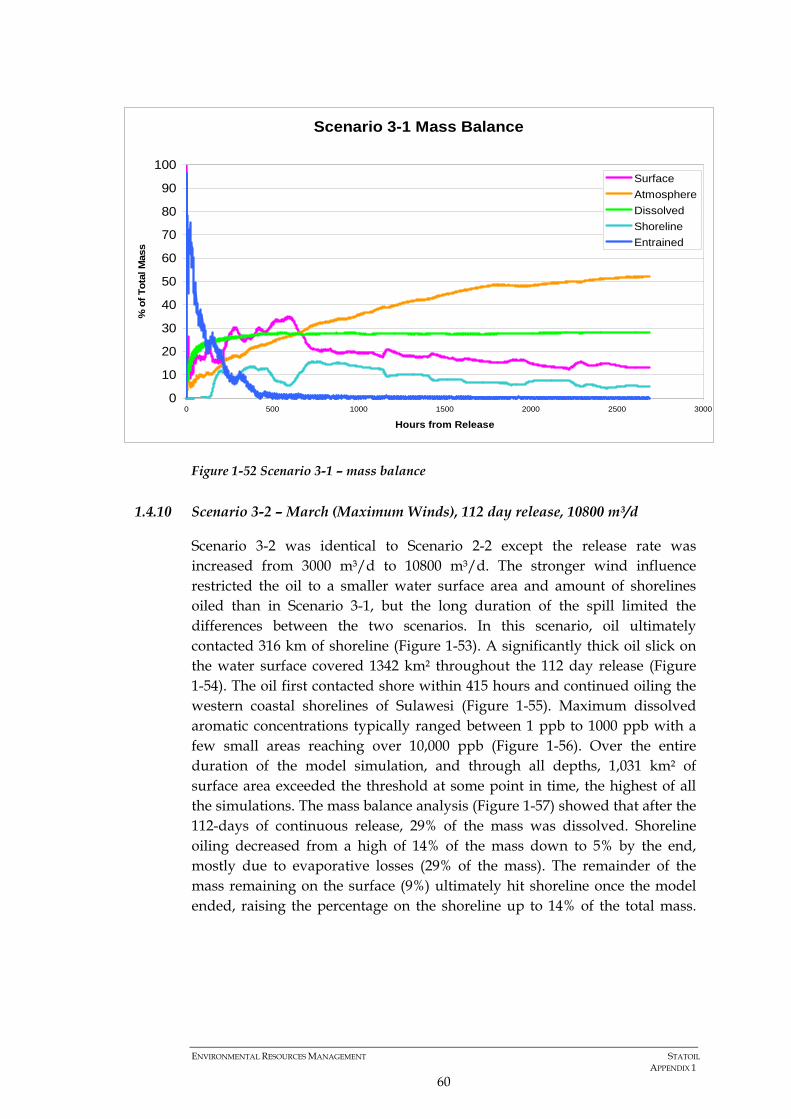
ENVIRONMENTAL RESOURCES MANAGEMENT STATOIL APPENDIX 1
60
Scenario 3-1 Mass Balance
0
10
20
30
40
50
60
70
80
90
100
0 500 1000 1500 2000 2500 3000
Hours from Release
% o
f Tot
al M
ass
SurfaceAtmosphereDissolvedShorelineEntrained
Figure 1-52 Scenario 3-1 – mass balance
1.4.10 Scenario 3-2 – March (Maximum Winds), 112 day release, 10800 m³/d
Scenario 3-2 was identical to Scenario 2-2 except the release rate was increased from 3000 m³/d to 10800 m³/d. The stronger wind influence restricted the oil to a smaller water surface area and amount of shorelines oiled than in Scenario 3-1, but the long duration of the spill limited the differences between the two scenarios. In this scenario, oil ultimately contacted 316 km of shoreline (Figure 1-53). A significantly thick oil slick on the water surface covered 1342 km² throughout the 112 day release (Figure 1-54). The oil first contacted shore within 415 hours and continued oiling the western coastal shorelines of Sulawesi (Figure 1-55). Maximum dissolved aromatic concentrations typically ranged between 1 ppb to 1000 ppb with a few small areas reaching over 10,000 ppb (Figure 1-56). Over the entire duration of the model simulation, and through all depths, 1,031 km² of surface area exceeded the threshold at some point in time, the highest of all the simulations. The mass balance analysis (Figure 1-57) showed that after the 112-days of continuous release, 29% of the mass was dissolved. Shoreline oiling decreased from a high of 14% of the mass down to 5% by the end, mostly due to evaporative losses (29% of the mass). The remainder of the mass remaining on the surface (9%) ultimately hit shoreline once the model ended, raising the percentage on the shoreline up to 14% of the total mass.

ENVIRONMENTAL RESOURCES MANAGEMENT STATOIL APPENDIX 1
61
Figure 1-53 Scenario 3-2 – trajectory and shoreline oiling

ENVIRONMENTAL RESOURCES MANAGEMENT STATOIL APPENDIX 1
62
Figure 1-54 Scenario 3-2 – significant surface oiling (for significant oiling)

ENVIRONMENTAL RESOURCES MANAGEMENT STATOIL APPENDIX 1
63
Figure 1-55 Scenario 3-2 – travel time

ENVIRONMENTAL RESOURCES MANAGEMENT STATOIL APPENDIX 1
64
Figure 1-56 Scenario 3-2 – maximum dissolved aromatic concentrations

ENVIRONMENTAL RESOURCES MANAGEMENT STATOIL APPENDIX 1
65
Scenario 3-2 Mass Balance
0
10
20
30
40
50
60
70
80
90
100
0 500 1000 1500 2000 2500 3000
Hours from Release
% o
f Tot
al M
ass
SurfaceAtmosphereDissolvedShorelineEntrained
Figure 1-57 Scenario 3-2 – mass balance
1.4.11 Scenario 3-3 – October (Typical Winds), 112 day release, 10800 m³/d
Scenario 3-3 was identical to Scenario 2-3 except the release rate was increased from 3000 m³/d to 10800 m³/d. The oil traveled in a similar manner to Scenario 2-3, covering 9 km more shoreline (286 km in total) with more oil mass and 110 km² more surface area on the water surface (1380 km² in total) (Figure 1-58 and Figure 1-59). The oil first contacted shore within 108 hours and continued oiling the western coastal shorelines from north to south (Figure 1-60). Maximum dissolved aromatic concentrations typically ranged between 1 ppb to 1000 ppb, with a few small areas reaching over 10,000 ppb (Figure 1-61). Over the entire duration of the model simulation, and through all depths, 622 km² of surface area exceeded the threshold at some point in time. The mass balance analysis (Figure 1-62) showed that after the 112-days of continuous release, shoreline oiling decreased from a maximum nearly 7% of the total mass down to 3% by the end of the release, mostly due to evaporative losses and oil on the surface floating south past Sulawesi. Oil transferred to the atmosphere steadily increased, and accounted for 43% of the mass after 120 days. The remainder of the mass was either dissolved (31%) or remained on the surface (22%).

ENVIRONMENTAL RESOURCES MANAGEMENT STATOIL APPENDIX 1
66
Figure 1-58 Scenario 3-3 – trajectory and shoreline oiling

ENVIRONMENTAL RESOURCES MANAGEMENT STATOIL APPENDIX 1
67
Figure 1-59 Scenario 3-3 – significant surface oiling (for significant oiling)

ENVIRONMENTAL RESOURCES MANAGEMENT STATOIL APPENDIX 1
68
Figure 1-60 Scenario 3-3 – travel time

ENVIRONMENTAL RESOURCES MANAGEMENT STATOIL APPENDIX 1
69
Figure 1-61 Scenario 3-3 – maximum dissolved aromatic concentrations

ENVIRONMENTAL RESOURCES MANAGEMENT STATOIL APPENDIX 1
70
Scenario 3-3 Mass Balance
0
10
20
30
40
50
60
70
80
90
100
0 500 1000 1500 2000 2500 3000
Hours from Release
% o
f Tot
al M
ass
SurfaceAtmosphereDissolvedShorelineEntrained
Figure 1-62 Scenario 3-3 – mass balance
1.4.12 Scenario 3-4 – October (Maximum Winds), 112 day release, 10800 m³/d
Scenario 3-4 was identical to Scenario 3-3 except the winds were held constant at historic monthly maximum values as described in Section 1.4.8. The oil traveled in a similar manner to Scenario 2-3, but was driven further onto the land covering 73 km more shoreline (359 km in total) and 136 km² less surface area on the water surface (1244 km² in total) (Figure 1-63 and Figure 1-64). The oil first contacted shore within 54 hours and continued oiling the western coastal shorelines from north to south (Figure 1-65). Maximum dissolved aromatic concentrations typically ranged between 1 ppb to 1000 ppb, with a few small areas reaching over 10,000 ppb (Figure 1-66). Over the entire duration of the model simulation, and through all depths, 636 km² of surface area exceeded the threshold at some point in time. The mass balance analysis (Figure 1-67) showed that after the 112-days of continuous release, shoreline oiling decreased from a maximum over 15% of the total mass down to 5% by the end of the release, mostly due to evaporative losses and oil on the surface floating south past Sulawesi. Oil transferred to the atmosphere steadily increased, and accounted for 45% of the mass after 120 days. The remainder of the mass was either dissolved (32%) or remained on the surface (17%).

ENVIRONMENTAL RESOURCES MANAGEMENT STATOIL APPENDIX 1
71
Figure 1-63 Scenario 3-4 – trajectory and shoreline oiling

ENVIRONMENTAL RESOURCES MANAGEMENT STATOIL APPENDIX 1
72
Figure 1-64 Scenario 3-4 – significant surface oiling (for significant oiling)

ENVIRONMENTAL RESOURCES MANAGEMENT STATOIL APPENDIX 1
73
Figure 1-65 Scenario 3-4 – travel time

ENVIRONMENTAL RESOURCES MANAGEMENT STATOIL APPENDIX 1
74
Figure 1-66 Scenario 3-4 – maximum dissolved aromatic concentrations
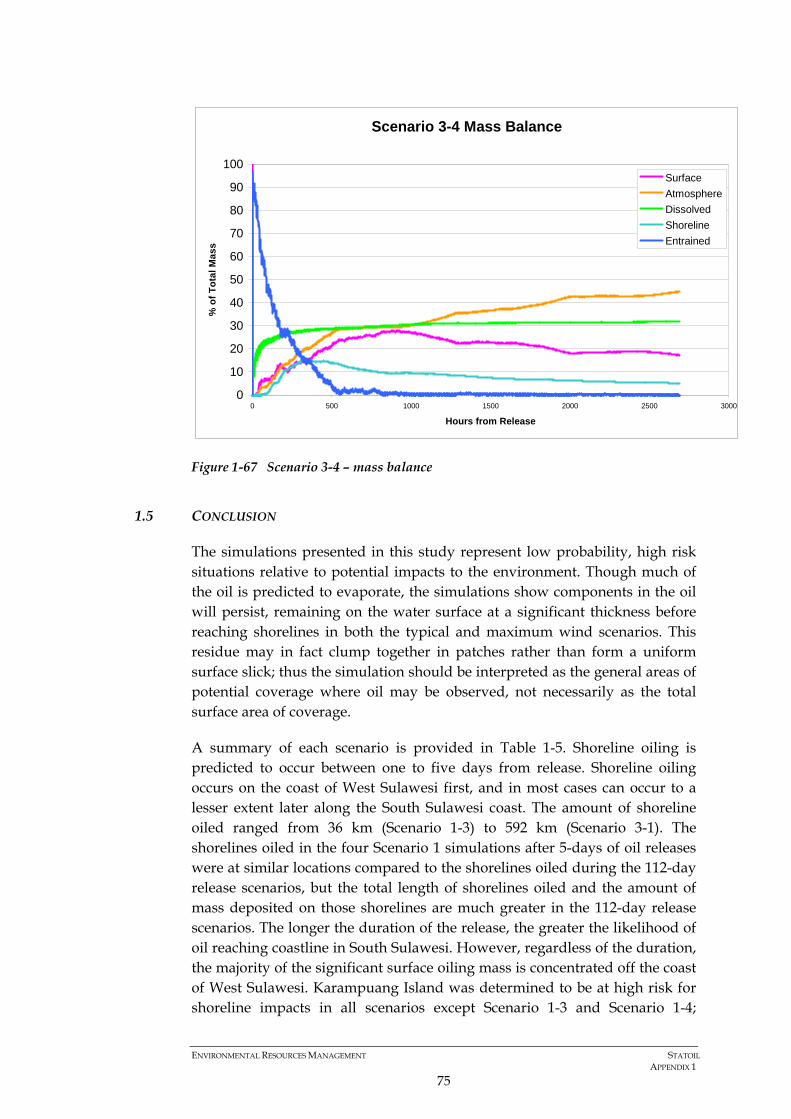
ENVIRONMENTAL RESOURCES MANAGEMENT STATOIL APPENDIX 1
75
Scenario 3-4 Mass Balance
0
10
20
30
40
50
60
70
80
90
100
0 500 1000 1500 2000 2500 3000
Hours from Release
% o
f Tot
al M
ass
SurfaceAtmosphereDissolvedShorelineEntrained
Figure 1-67 Scenario 3-4 – mass balance
1.5 CONCLUSION
The simulations presented in this study represent low probability, high risk situations relative to potential impacts to the environment. Though much of the oil is predicted to evaporate, the simulations show components in the oil will persist, remaining on the water surface at a significant thickness before reaching shorelines in both the typical and maximum wind scenarios. This residue may in fact clump together in patches rather than form a uniform surface slick; thus the simulation should be interpreted as the general areas of potential coverage where oil may be observed, not necessarily as the total surface area of coverage.
A summary of each scenario is provided in Table 1-5. Shoreline oiling is predicted to occur between one to five days from release. Shoreline oiling occurs on the coast of West Sulawesi first, and in most cases can occur to a lesser extent later along the South Sulawesi coast. The amount of shoreline oiled ranged from 36 km (Scenario 1-3) to 592 km (Scenario 3-1). The shorelines oiled in the four Scenario 1 simulations after 5-days of oil releases were at similar locations compared to the shorelines oiled during the 112-day release scenarios, but the total length of shorelines oiled and the amount of mass deposited on those shorelines are much greater in the 112-day release scenarios. The longer the duration of the release, the greater the likelihood of oil reaching coastline in South Sulawesi. However, regardless of the duration, the majority of the significant surface oiling mass is concentrated off the coast of West Sulawesi. Karampuang Island was determined to be at high risk for shoreline impacts in all scenarios except Scenario 1-3 and Scenario 1-4;

ENVIRONMENTAL RESOURCES MANAGEMENT STATOIL APPENDIX 1
76
however, even in these two near-miss cases, the island could have been hit under slightly different conditions.
The differences between the typical and the maximum wind scenarios are evident in the location of shoreline contact, amount of oil on the surface, and the time to reach the shoreline. Under constant maximum westerly wind conditions, the time for oiled shorelines was reduced, most especially in March (taking 26 hours, the shortest time to contact shoreline, in Scenario 1-3). The longest time to contract shoreline occurred in October under typical wind conditions (113 hours in Scenario 2-3). The amount of oil on the water surface is generally reduced in the maximum wind scenarios due to westerly wind forcing the oil onto shorelines. For example, the smallest amount of surface oiling, 1,013 km², occurred in Scenario 1-2 compared to 1,702 km² oiled under typical winds in Scenario 1-1. The greatest amount of surface oiling occurred in Scenario 3-1 (1,944 km²).
Table 1-5 Summary of model results
Scenario Release Month Winds Oiled Shore (km)
Time to Contact
Shore (hrs)
Surface Area Oiled (km²)
1-1 8000 m³/d 5 days
March Typical 171 41 1703
1-2 8000 m³/d 5 days
March Maximum 93 33 1013
1-3 8000 m³/d 5 days
October Typical 36 78 1958
1-4 8000 m³/d 5 days
October Maximum 84 26 1447
2-1 3000 m³/d 112 days
March Typical 504 51 1478
2-2 3000 m³/d 112 days
March Maximum 289 34 1301
2-3 3000 m³/d 112 days
October Typical 277 113 1270
2-4 3000 m³/d 112 days
October Maximum 299 44 1157
3-1 10800 m³/d 112 days
March Typical 592 51 1944
3-2 10800 m³/d 112 days
March Maximum 316 108 1342
3-3 10800 m³/d 112 days
October Typical 286 106 1380
3-4 10800 m³/d 112 days
October Maximum 359 54 1244

ENVIRONMENTAL RESOURCES MANAGEMENT STATOIL APPENDIX 1
77
Table 1-6 Summary of dissolved aromatics compared to the toxic threshold
Scenario Maximum Area with Dissolved Aromatics Above Threshold (km²)
1-1 161
1-2 120
1-3 46
1-4 53
2-1 20
2-2 85
2-3 75
2-4 99
3-1 1022
3-2 1031
3-3 622
3-4 636
Dissolved concentrations of hydrocarbons, in particular the soluble aromatics, are the components of oil typically of concern to the aquatic biota in the water column during oil spills. A toxic threshold for aromatics was calculated to be 310 ppb, derived from 96-hour LC50 values. In all scenarios, the maximum water column aromatic concentrations at times exceeded this threshold, indicating a risk of water column injury to aquatic biota. However, this risk is mitigated by the ability of fish to avoid the toxic plume at the water surface where the concentrations are most likely to be highest. As a result, though pelagic species are at risk, benthic organisms are unlikely to be impacted by dissolved aromatics released by such spills. Variations of the amount of water, in terms of the maximum surface area of water which exceeded the aromatic toxic threshold at any time and depth during the model simulation, are summarized in Table 1-6. The scenarios with the largest release rate in March (Scenario 3-1 and Scenario 3-2) produced the largest dissolved aromatic concentrations. The smallest of the maximum concentrations areas (20 km²) was calculated in Scenario 2-1. By comparison, in Scenario 2-2, the area was slightly higher indicating the maximum winds caused greater spreading of the most concentrated subsurface plume.
Environmental impacts due to a spill are primarily a concern to biota making contact with the surface oiling and to wildlife contacting oil on an impacted shoreline. An accidental release of oil is a much higher risk to birds and wildlife contacting the surface oil than to fish and other organisms in the water column. Vapors released during a spill may pose a human health risk to workers in the vicinity of the well.
Impacts from oil released from an annulus blowout pose a medium to high risk of impacts to organisms which contact the surface oil, depending on the quantity released and time before any potential response efforts can contain the release. Spills of this nature pose a low risk of acute toxic effects to the aquatic biota. Several shorelines are at risk within the first few days after a release.

ENVIRONMENTAL RESOURCES MANAGEMENT STATOIL APPENDIX 1
78
2 DRILL CUTTING MODELING
2.1 SIMULATION DESIGN
Modeling was performed to assess potential environmental impacts due to the release of drilling mud and drill cuttings during the planned operations. The objectives of the drill cuttings modeling study were to determine whether the disposal of the drill cuttings at the Anoman Well location will result in unacceptable adverse impacts to any sensitive ecosystems. It should be noted that this study has been limited to the examination of potential sedimentation and total suspended sediment loads on coral habitats. It does not consider impacts of drilling waste discharges on benthic and pelagic ecosystems, such as smothering, toxicity (e.g. associated with the type of drilling fluid used) or bioaccumulation of contaminants within the marine food chain. No specific locations of coral habitats have been identified for this analysis.
The potential dispersion and deposition of released drill cuttings and adhered muds has been quantified using hydrodynamic computer modeling techniques. Modeling allows the prediction and description of the water level, current velocity and direction in offshore Sulawesi waters, specifically around the Anoman Well using the same hydrodynamic techniques and same model grid employed in the oil spill modeling. Released material will pass vertically through the water column, since cuttings and adhered muds are denser than the receiving water; cuttings / mud plume dispersion is fundamentally a 3-D phenomenon.
Two scenarios were evaluated: March and October. Unlike with oil spill modeling, the extreme wind scenarios were not run since wind velocity has exponentially diminishing influence on current velocity with depth. Therefore, when running the model for the deep waters around the Anoman Well, maximum wind scenarios would produce negligible differences compared to the typical wind scenarios.
Discharge information was provided by StatOil. Both water based muds (WBM) and synthetic based muds (SBM) are planned to be used by StatOil. WBM used to drill sections prior to installing the riser will be released to the seabed together with the cuttings and associated pumped seawater. All SBM will be reused and stored at the Petrosea base when not in use. The cuttings drilled from all sections with SBM will be dried in a separate cuttings dryer system, crushed, and discharged to sea via the splash zone level in the moon pool (i.e., sea surface) on the drill ship.
Estimated properties of the mud discharged are provided in Table 2-1. The WBM is associated with the top hole drilling when cuttings are released to the sea floor. Since the model terminates when all particles reach the sea floor, simulating top hole drilling would cause the model to immediately end upon

ENVIRONMENTAL RESOURCES MANAGEMENT STATOIL APPENDIX 1
79
running, and was therefore not included in the simulations. Cuttings are estimated to dump at a rate of 480 m³ cuttings per well or 860 MT/well with an estimated average density of 1.8 kg/L. The higher rate, 860 MT/well was conservatively assumed for the modeling. Modeling was performed for the first two sections of SBM drilling (20” open hole diameter for 10 days and 17.5” open hole diameter for 11 days) since subsequent sections released less SBM; thus, the model was run assuming the first 21 days would present the worst case of the entire period of drilling. Mud density varied with drilling section. The average density (1.275 kg/L) of the two sections was assumed.
Table 2-1 Estimated mud discharge characteristics
36 24 20 17.5 13.25 12.25 8.5 6 Plug & Abandon Open Hole Diameter
(in) Water base
mud Synthetic base mud
Mud Usage/Discharge
(m³) 328 3502 213 303 230 161 88 55 0
Mud Usage/Discharge
(bbl) 3950 1761 20264 1340 1906 1447 1013 553 346
Table 2-2 Estimated mud density and release rate
Section 3 20.0” diameter
Section 4 17.5” diameter
Total days 10 21 Days per section 10 11
Fluid type SBM SBM Mud density (kg/L) 1.25 1.3
Mud usage/discharge (m³) 213 303 Mud usage/discharge (L) 213000 303000 Mud mass discharged (kg) 266250 393900 Mud mass discharged (MT) 266.25 393.9
Mud mass discharge rate (MT/hr) 1.109 0.782
In the absence of site specific measured values, the particle size distribution of the SBM and cuttings were assumed, based on previous drill cutting studies. SBM particle sizes were assumed to be 40% 0 - 1500 µm, 40% 1500 - 2500 µm, and 20% 2500 - 5000 µm. These ranges were described as discrete Table 0-3. Drill cuttings’ sizes were assumed to be in the range between 200 µm and 8000 µm. From distribution patterns seen in previous studies, the majority of the particles sizes (80%) were assumed to be at the average value (4100 µm), while the maximum and minimum values of the range were assumed to be each 10% of the particles (Table 2-4).
Table 2-3 Assumed SBM particle
Diameter (µm) % of cuttings 200 10% 4100 80% 8000 10%

ENVIRONMENTAL RESOURCES MANAGEMENT STATOIL APPENDIX 1
80
Table 2-4 Assumed drill cuttings particle sizes.
Diameter (µm) % of SBM 750 20% 1500 20% 2000 20% 2500 20% 3750 10% 5000 10%
2.2 MODEL SELECTION
The simulation model used for this analysis is GEMSS®, coupled with the Generalized Integrated Fate & Transport (GIFT) module which incorporates the GEMSS® Sediment Transport Model (STM). For this application, the GIFT model was used to compute the mass of sediment released for various particle sizes and densities. The GIFT model, through a Lagrangian framework, calculates the movement of particles representing the released mass using the measured currents spread across each grid cell in the model domain. The discharged drill cuttings and muds are modeled to predict the total suspended solids in the water column and the net deposition. Deposition and total suspended solids (TSS) estimates are thus designed to be additions to ambient conditions.
2.3 ASSESSMENT CRITERIA
The potential for drill cuttings and adhered muds to impact coral colonies has been assessed through a comparison with two criteria: sediment deposition rate and concentrations of total suspended solids (TSS) above ambient. Acceptable levels of each of these criteria have been based on international literature and previously applied standards.
Hard or hermatypic corals are dependent upon symbiotic photosynthesizing zooxanthellae for their survival and are, therefore, highly sensitive to increases in suspended sediment and the corresponding reduction in light penetration. Elevated levels of suspended sediments can also clog the corals respiratory and feeding apparatus. In addition to impacts of suspended solids in water, corals are susceptible to increased rates of deposition.
Species sensitivities to sedimentation are determined largely by the particle trapping properties of the colony and ability of individual polyps to reject settled materials. Horizontal plate-like colonies and massive growth forms present large stable surfaces for the interception and retention of settling solids. Conversely, vertical plates and upright branching forms are less likely to retain sediments. Tall polyps and convex colonies are also less susceptible to sediment accumulation than other growth forms. It is also acknowledged
ENVIRONMENTAL RESOURCES MANAGEMENT STATOIL APPENDIX 1
81
that sensitivities to sediment loads can also vary markedly between species within the same genus (Hawker and Connell, 1992).
The work of Pastorok and Bilyard (Pastorok and Bilyard, 1985) has been regarded as the primary source for quantifying the effects of sedimentation on corals, examining open water reefal environments where natural levels of sedimentation are very low. Pastorok and Bilyard have suggested the following criteria:
• 1 - 10 mg cm-2 day-1 - slight to moderate impacts
• 10 - 50 mg cm-2 day-1 - moderate to severe
• 50 mg cm-2 day-1 - severe to catastrophic
As corals can tolerate temporary changes in their local environment, it has been assumed to take the moderate tolerance threshold of 10 mg cm-2 day-1 has been assumed for the purposes of this assessment.
Information on hard coral tolerances to TSS indicates that a 20% reduction in annual growth rate corresponds to a 30% increase in average long-term background TSS levels (Hawker and Connell, 1992). Background levels vary from region to region and are site specific. It is known from research on the Great Barrier Reef that corals can be prone to episodes of sedimentation from a variety of sources, such as terrestrial run-off (Mapstone, et al., 1989). These sediments are often re-suspended during and following wind and wave action, resulting in low light levels due to turbidity. As such, elevations in TSS levels above 50 mg/L have been considered as having the potential to affect the physiology of corals. However, in Indonesia, in accordance with MoE Regulation No 51 Year 2004 concerning sea water standard, the threshold limits for TSS are as follows:
• Coral reef : 20 mg/L with tolerable change <10%
• Sea grass: 20 mg/L
• Mangrove: 80 mg/L
Based on the above, the following set of Coral Tolerance Threshold Criteria has been taken for the current assessment:
• Criterion 1 - The maximum allowable sedimentation rate of sediment on coral colonies should be no greater than 10 mg cm-2 day-1; and;
• Criterion 2 - The maximum allowable increase in total suspended solids at the bed layer of the water column in areas supporting coral colonies should be no greater than 20 mg/L above ambient.

ENVIRONMENTAL RESOURCES MANAGEMENT STATOIL APPENDIX 1
82
2.4 RESULTS
The results of the modeling are illustrated in the following sections for each scenario as contour plots. The plots presented indicate the location of the drill cuttings release point, taken as the drill centre. The results have been presented for comparison against the two criteria: net sedimentation rate measured in mg cm-2 day-1 and TSS measured in mg/L. For each scenario, the model output has been generated for the maximum TSS increase above ambient solids concentrations.
2.4.1 Scenario 1 – March currents and winds
For the first criterion in Scenario 1, drill cuttings in March yielded very small sedimentation rates, orders of magnitudes below ranges of concern for impacts associated with smothering from excessive sediment loads. The highest rate calculated was 0.0097 mg cm-2 day-1. Figure 2-1 shows the sedimentation rate for March after 12 days of accumulation when all particles have settled; the net sedimentation rate would begin to decrease after that time. The second criterion, TSS concentrations (Figure 2-2) briefly exceeded 20 mg/L, but only near the surface. TSS concentrations added to the bottom layers never exceeded 1 ppb. Since the TSS criterion applied to solids contacting coral, which would not be the case at the surface layers, the criterion was not violated. Therefore, cuttings and muds pose low risk for impacts due to sedimentation rate and TSS concentration.
2.4.2 Scenario 2 – October currents and winds
Like Scenario 1, Scenario 2 yielded low sedimentation rates (reaching a maximum of 0.011 mg cm² day-1), orders of magnitude below values of concern (Figure 2-3), satisfying the first criterion. For the second criterion, TSS concentrations also resembled March values, with the maximum concentration (66 mg/L) above the 20 mg/L criteria but at the surface above the Anoman well, away from contact with coral. At the bottom model layers, TSS concentrations did not exceed 1 mg/L. The mud and drill cuttings therefore pose low risk for environmental impacts.
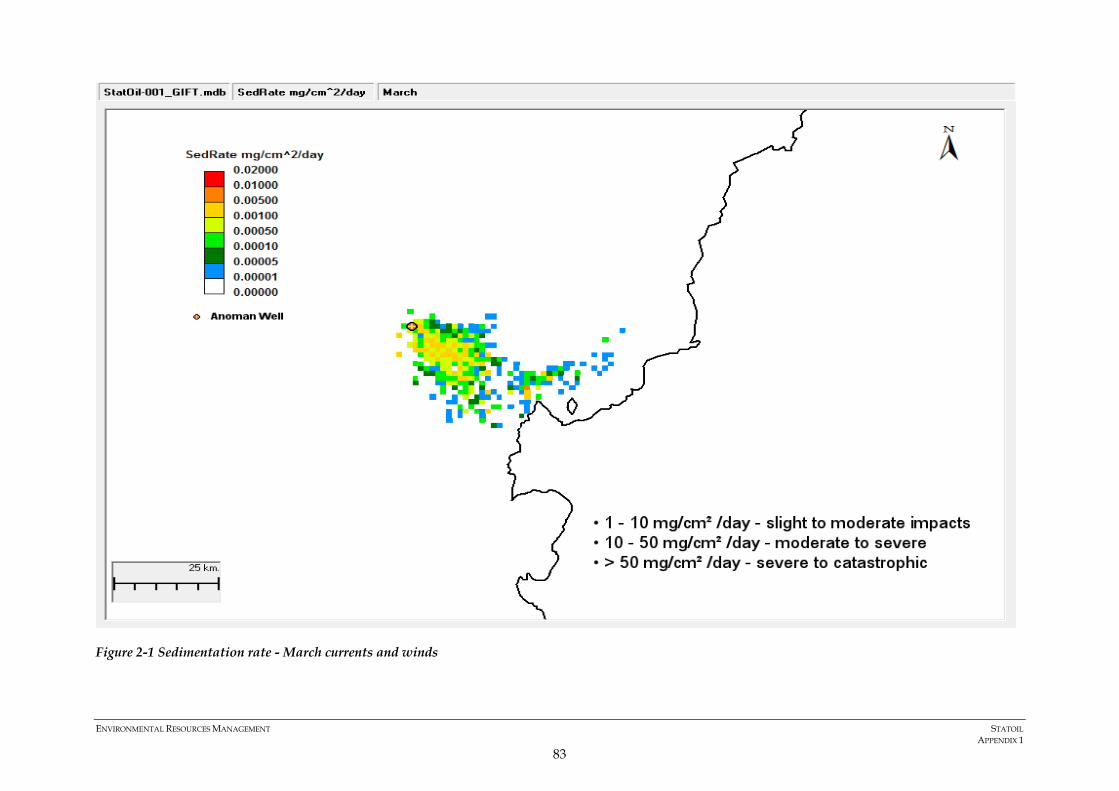
ENVIRONMENTAL RESOURCES MANAGEMENT STATOIL APPENDIX 1
83
Figure 2-1 Sedimentation rate - March currents and winds

ENVIRONMENTAL RESOURCES MANAGEMENT STATOIL APPENDIX 1
84
Figure 2-2 Highest TSS concentrations added to background – March currents and winds
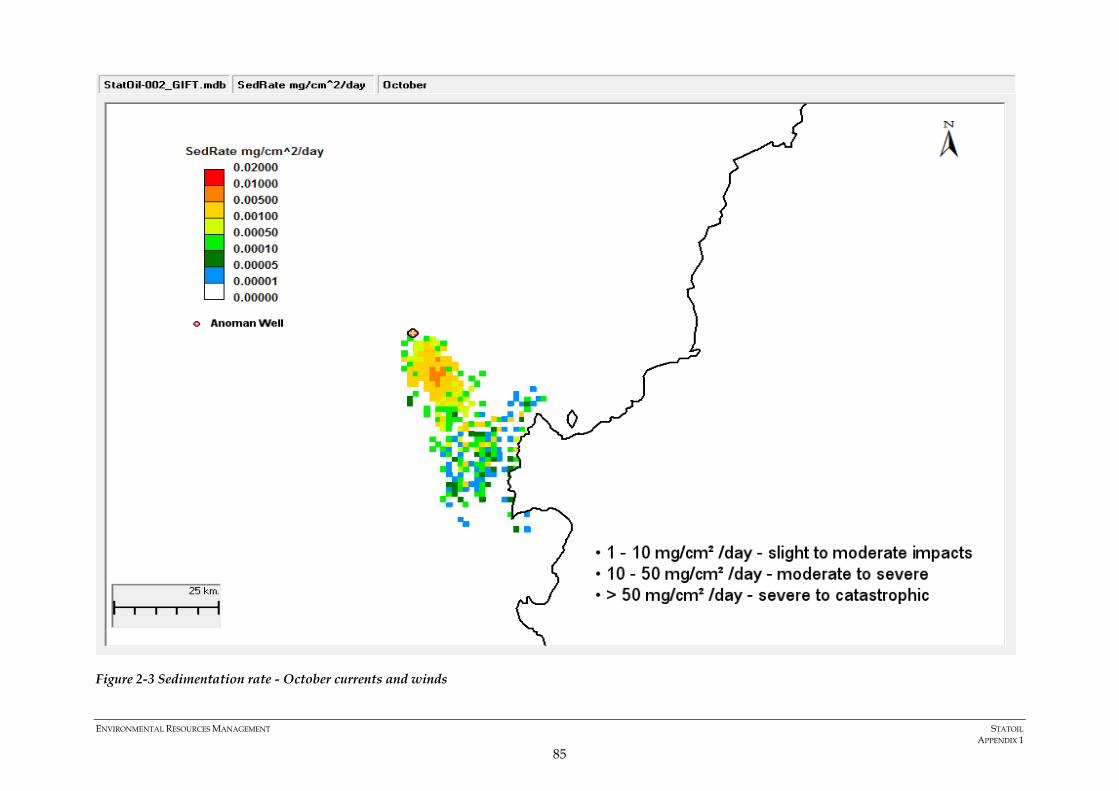
ENVIRONMENTAL RESOURCES MANAGEMENT STATOIL APPENDIX 1
85
Figure 2-3 Sedimentation rate - October currents and winds

ENVIRONMENTAL RESOURCES MANAGEMENT STATOIL APPENDIX 1
86
Figure 2-4 Highest TSS concentrations added to background – October currents and winds

ENVIRONMENTAL RESOURCES MANAGEMENT STATOIL APPENDIX 1
A1-87
2.5 CONCLUSIONS
Results from the drill cutting and mud modeling were compared against two criteria: sediment deposition rate and TSS concentration.
The drill cuttings and adhered muds would spread from the drill centre travelling 30 km to 40 km before reaching the sea floor. Note that a low but reasonable dispersion coefficient was assumed such that the sedimentation rate and suspended solids concentrations are considered realistic estimates.
Drilling waste disposal would result in compliance with the coral tolerance threshold criterion of 10 mg cm-2 day-1. Sedimentation rates were estimated to be orders of magnitude below the criterion and protective of sensitive coral receptors.
The only TSS concentrations which exceed the 20 mg/L threshold criterion occurred at the surface layers. Concentrations of TSS added to the bottom layers from discharge of drill cuttings were all less than 1 mg/L. As such, TSS concentrations were predicted to comply with the threshold criterion at all coral sensitive areas in all scenarios.
Uncertainties in the mud and drill cutting particle size distributions and densities are unlikely to affect the conclusions of this modeling study considering the conservative estimates used; particle sizes are likely to be in fact smaller than the assumed diameters, and thus have a higher distribution pattern with less potential impact.
Overall, the modelling indicates that no impact on corals should occur at any coral sensitive receptors that might exist in the area based upon the predicted absence of exceedances of the two criteria.

ENVIRONMENTAL RESOURCES MANAGEMENT STATOIL APPENDIX 1
A1-88
3 REFERENCES
ANZECC & ARMCANZ. 2000. Australian and New Zealand guidelines for fresh and marine water quality. October 2000. National Water Quality Management Strategy Paper No. 4, Australian and New Zealand Environment and Conservation Council & Agriculture and Resource Management Council of Australia and New Zealand, Canberra, Australia.
French, D., H. Schuttenberg, and T. Isaji. 1999. “Probabilities of oil exceeding thresholds of concern: examples from an evaluation for Florida Power and Light.” In Proceedings of the 22nd Arctic and Marine Oil Spill Program (AMOP) Technical Seminar, June 1999, Environment Canada, pp. 243-270.
French, D.P. 2000. Estimation of Oil Toxicity Using an Additive Toxicity Model. In Proceedings, 23rd Arctic and Marine Oil Spill Program (AMOP) Technical Seminar, June 14-16, 2000, Vancouver, Canada, Emergencies Science Division, Environment Canada, Ottowa, ON, Canada.
Hawker DW & Connell DW. 1992. Standards and Criteria for Pollution Control in Coral Reef Areas. Chapter 7 of Pollution in Tropical Aquatic Systems. Connell DW & Hawler DW ed. CRC Press.
Kolluru, V.S., M. L. Spaulding and E. Anderson. 1994. A Three Dimensional Subsurface Oil Dispersion Model using a Particle Based Approach. In Proceedings of the 17th Arctic and Marine Oil Spill Program (AMOP) Technical Seminar, Vancouver, British Columbia, Canada. pp. 867 - 894.
Koops, W. 1985. "The Oil Spill Slide Rule to Predict the Fate of an Oil Spill." in: Proceedings of the 1985 International Oil Spill Conference (Prevention, Behavior, Control, Cleanup), February 25-28, 1985, Los Angeles, CA. Washington, DC: American Petroleum Institute, Publication 4385.647.
Mapstone BD, Choat JH, Cumming RL and Oxley WG. 1989. The fringing reefs of magnetic island: benthic biota and sedimentation - a baseline study. A report to the Great Barrier Reef Marine Park Authority
Nilsen, H., G. H.G. Johnsen, T. Nordtug, Ø. Johansen. 2006. “Threshold values and exposure to risk functions for oil components in the water column to be used for risk assessment of acute discharges (EIF Acute).” Statoil and SINTEF report, C. FOU.DE.B02, 2006-06-15.
NOAA. 1996. “Aerial Observations of Oil at Sea”. HAZMAT Report 96-7

ENVIRONMENTAL RESOURCES MANAGEMENT STATOIL APPENDIX 1
A1-89
NOAA. 2009. GEODAS Grid Translator – Design-a-Grid. NOAA Satellite and Information Service. National Geophysical Data Center (NGDC). Accessed October 26, 2009.
URL: http://www.ngdc.noaa.gov/mgg/gdas/gd_designagrid.html?dbase=grdet1
Pastorok R.A. and Bilyard G.R. 1985. Effects of sewage pollution on coral-reef communities. Marine Ecology Progress Series 21: 175-189.

APPENDIX 2
ANALYTICAL RESULT OF SEAWATER QUALITY
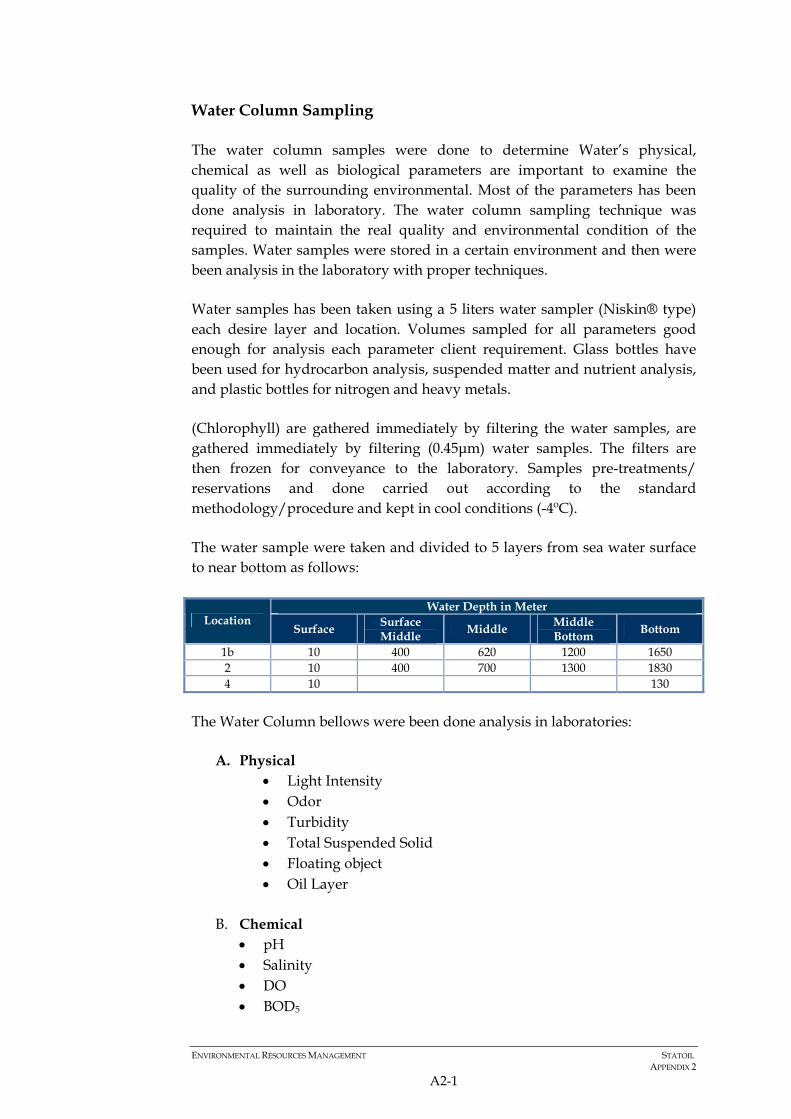
ENVIRONMENTAL RESOURCES MANAGEMENT STATOIL APPENDIX 2
A2-1
Water Column Sampling
The water column samples were done to determine Water’s physical, chemical as well as biological parameters are important to examine the quality of the surrounding environmental. Most of the parameters has been done analysis in laboratory. The water column sampling technique was required to maintain the real quality and environmental condition of the samples. Water samples were stored in a certain environment and then were been analysis in the laboratory with proper techniques.
Water samples has been taken using a 5 liters water sampler (Niskin® type) each desire layer and location. Volumes sampled for all parameters good enough for analysis each parameter client requirement. Glass bottles have been used for hydrocarbon analysis, suspended matter and nutrient analysis, and plastic bottles for nitrogen and heavy metals.
(Chlorophyll) are gathered immediately by filtering the water samples, are gathered immediately by filtering (0.45μm) water samples. The filters are then frozen for conveyance to the laboratory. Samples pre-treatments/ reservations and done carried out according to the standard methodology/procedure and kept in cool conditions (-4ºC).
The water sample were taken and divided to 5 layers from sea water surface to near bottom as follows:
Water Depth in Meter Location
Surface Surface Middle Middle Middle
Bottom Bottom
1b 10 400 620 1200 1650 2 10 400 700 1300 1830 4 10 130
The Water Column bellows were been done analysis in laboratories:
A. Physical • Light Intensity • Odor • Turbidity • Total Suspended Solid • Floating object • Oil Layer
B. Chemical • pH • Salinity • DO • BOD5

ENVIRONMENTAL RESOURCES MANAGEMENT STATOIL APPENDIX 2
A2-2
• Total Ammonia (NH3-N) • Phosphate (PO4-P) • Nitrate (NO3-N) • Cyanide (CN) • Sulfide (H2S) • PAH (Polycylic Aromatic Hydrocarbon) • Total Phenol • PCB • PCB Total • Biphenyl Surfactant • Oil and Grease • Pesticide • TBT
C. Heavy metal :
• Mercury (Hg) • Chromium hexavalent (Cr(VI)) • Arsenic (As) • Cadmium (Cd) • Copper (Cu) • Lead (Pb) • Zinc (Zn) • Nickel (Ni) • Barium (Ba) • Selenium (Se)
D. Biology : • Coliform • Pathogen • Plankton (Chlorophyll a)
E. Radioactivity:
• 226Ra, 228Ra, 210Pb
F. Additional Parameter • CO2 • Total organic carbon (TOC) • Total Hydro carbon (THC) • Silicate • C:N:P ratio • Heavy Metal : Al, Fe,V

ENVIRONMENTAL RESOURCES MANAGEMENT STATOIL APPENDIX 2
A2-3
G. List of PAH16 • Acenaphthene • Acenaphthylene • Anthracene • Benzo (a) anthracene • Benzo (a) pyrene • Benzo (b) fluoranthene • Benzo (ghi) perylene • Benzo (k) fluoranthene • Chrysene • Dibenzo (a, h) anthracene
• Fluoranthene • Fluorene • Indeno (1,2,3-cd) pyrene • Naphthalene • Phenanthrene • Pyrene
Method of analysis for the Examination of Water and Wastewater (SMEWW), International Standard (ISO) or Indonesian National Standard (SNI) has been used as standard on the laboratory analysis for the water quality parameters.
Table below shows the methods were used for the determination of each parameter.
No Analyzed Parameter Analysis Method 1 Turbidity SMEWW-2130-B 2 Total Suspended Solid SMEWW 2540-D 3 pH SMEWW-4500-H+-B 4 Salinity SMEWW 2520 5 Temperature SMEWW-2550 6 Conductivity SMEWW-2510 7 Dissolved Oxygen (DO) SMEWW 4500-O-G 8 Ammonia (NH3-N) SMEWW-4500-NH3-F 9 Ortho Phosphate (PO4) SMEWW 4500-P-D 10 Nitrate (NO3-N) SNI 06-2480 1991 11 Cyanide (CN) SMEWW 4500-CN C 12 Sulphide (H2S) SMEWW 4500-S2 H 13 Polycyclic Aromatic Hydrocarbon (PAH) ISO28540 14 Total Phenol SNI 06-2469-1991 15 PCB SNI 06-2508-1991 16 PCB Total SNI 06-2508-1991 17 Pesticide SNI 06-2508-1991 18 Mercury (Hg) SMEWW 3500-Hg 19 Hexavalent Chromium (Cr(VI)) SMEWW 3500 Cr D 20 Arsenic (As) SMEWW 3500B-As 21 Cadmium (Cd) SMEWW 3500-Cd 22 Cooper (Cu) SMEWW 3500-Cu 23 Lead (Pb) SMEWW 3500-Pb 24 Zinc (Zn) SMEWW-3500-Zn 25 Total Coliform Bacteria / 100 ml sample SMEWW 9216 26 CO2 SMEWW-4500-CO2 27 Aluminium (Al) SMEWW 3500-Al 28 Iron (Fe) SMEWW-3500-Fe-B
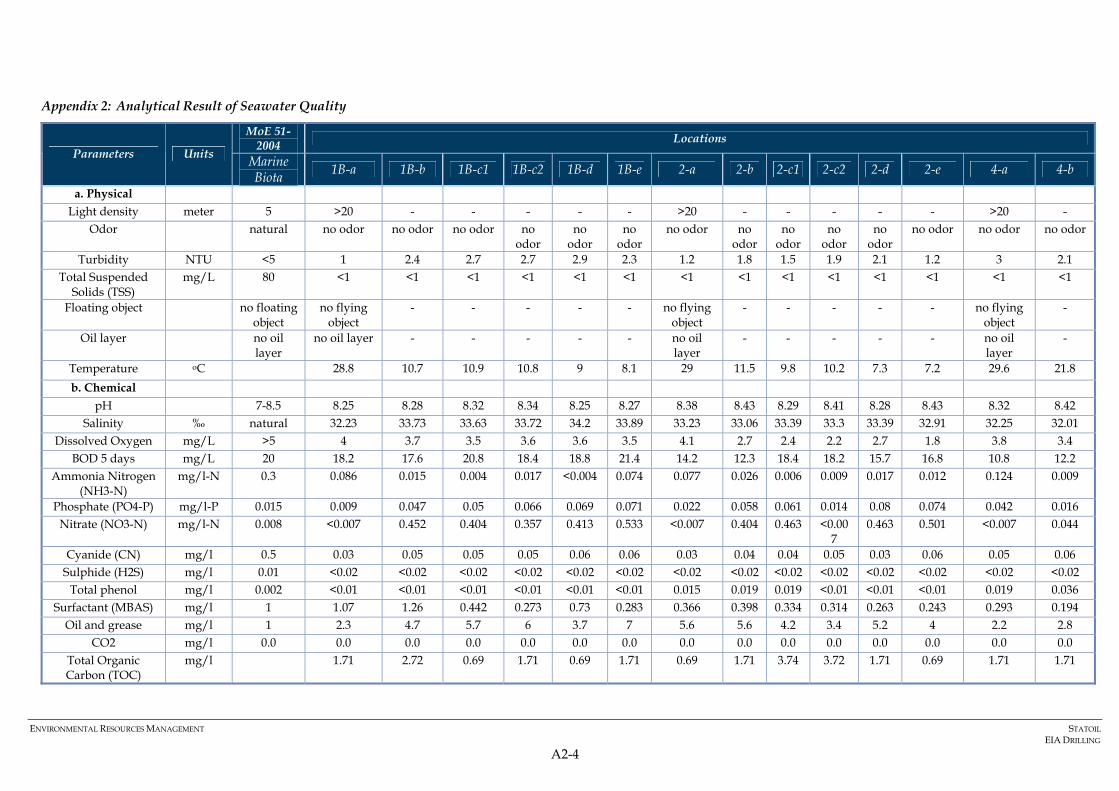
ENVIRONMENTAL RESOURCES MANAGEMENT STATOIL EIA DRILLING
A2-4
Appendix 2: Analytical Result of Seawater Quality
MoE 51-2004 Locations
Parameters Units Marine Biota 1B-a 1B-b 1B-c1 1B-c2 1B-d 1B-e 2-a 2-b 2-c1 2-c2 2-d 2-e 4-a 4-b
a. Physical Light density meter 5 >20 - - - - - >20 - - - - - >20 -
Odor natural no odor no odor no odor no odor
no odor
no odor
no odor no odor
no odor
no odor
no odor
no odor no odor no odor
Turbidity NTU <5 1 2.4 2.7 2.7 2.9 2.3 1.2 1.8 1.5 1.9 2.1 1.2 3 2.1 Total Suspended
Solids (TSS) mg/L 80 <1 <1 <1 <1 <1 <1 <1 <1 <1 <1 <1 <1 <1 <1
Floating object no floating object
no flying object
- - - - - no flying object
- - - - - no flying object
-
Oil layer no oil layer
no oil layer - - - - - no oil layer
- - - - - no oil layer
-
Temperature oC 28.8 10.7 10.9 10.8 9 8.1 29 11.5 9.8 10.2 7.3 7.2 29.6 21.8 b. Chemical
pH 7-8.5 8.25 8.28 8.32 8.34 8.25 8.27 8.38 8.43 8.29 8.41 8.28 8.43 8.32 8.42 Salinity ‰ natural 32.23 33.73 33.63 33.72 34.2 33.89 33.23 33.06 33.39 33.3 33.39 32.91 32.25 32.01
Dissolved Oxygen mg/L >5 4 3.7 3.5 3.6 3.6 3.5 4.1 2.7 2.4 2.2 2.7 1.8 3.8 3.4 BOD 5 days mg/L 20 18.2 17.6 20.8 18.4 18.8 21.4 14.2 12.3 18.4 18.2 15.7 16.8 10.8 12.2
Ammonia Nitrogen (NH3-N)
mg/l-N 0.3 0.086 0.015 0.004 0.017 <0.004 0.074 0.077 0.026 0.006 0.009 0.017 0.012 0.124 0.009
Phosphate (PO4-P) mg/l-P 0.015 0.009 0.047 0.05 0.066 0.069 0.071 0.022 0.058 0.061 0.014 0.08 0.074 0.042 0.016 Nitrate (NO3-N) mg/l-N 0.008 <0.007 0.452 0.404 0.357 0.413 0.533 <0.007 0.404 0.463 <0.00
7 0.463 0.501 <0.007 0.044
Cyanide (CN) mg/l 0.5 0.03 0.05 0.05 0.05 0.06 0.06 0.03 0.04 0.04 0.05 0.03 0.06 0.05 0.06 Sulphide (H2S) mg/l 0.01 <0.02 <0.02 <0.02 <0.02 <0.02 <0.02 <0.02 <0.02 <0.02 <0.02 <0.02 <0.02 <0.02 <0.02
Total phenol mg/l 0.002 <0.01 <0.01 <0.01 <0.01 <0.01 <0.01 0.015 0.019 0.019 <0.01 <0.01 <0.01 0.019 0.036 Surfactant (MBAS) mg/l 1 1.07 1.26 0.442 0.273 0.73 0.283 0.366 0.398 0.334 0.314 0.263 0.243 0.293 0.194
Oil and grease mg/l 1 2.3 4.7 5.7 6 3.7 7 5.6 5.6 4.2 3.4 5.2 4 2.2 2.8 CO2 mg/l 0.0 0.0 0.0 0.0 0.0 0.0 0.0 0.0 0.0 0.0 0.0 0.0 0.0 0.0 0.0
Total Organic Carbon (TOC)
mg/l 1.71 2.72 0.69 1.71 0.69 1.71 0.69 1.71 3.74 3.72 1.71 0.69 1.71 1.71

ENVIRONMENTAL RESOURCES MANAGEMENT STATOIL EIA DRILLING
A2-5
MoE 51-2004 Locations
Parameters Units Marine Biota 1B-a 1B-b 1B-c1 1B-c2 1B-d 1B-e 2-a 2-b 2-c1 2-c2 2-d 2-e 4-a 4-b
Total hydrocarbon mg/l 1.7 3 1 2.7 3 2.7 2.4 1.8 0.4 1 2.8 0.6 1.8 2.4 Silicate mg/l <0.08 1.25 2.71 4.06 4.65 5.14 <0.08 1.97 2.82 4.65 5.9 6.55 0.278 0.278
C:N:P ratio <0.001 0.048 0.0003 0.0007 0.0001 0.00004
0.00006 <0.001
0.0005
0.0001 0.0023
0.00001 0.0003 0.0014
Iron (Fe) mg/l 0.035 0.015 0.015 0.035 0.01 0.078 0.035 0.078 <0.01 0.046 0.015 <0.01 <0.01 <0.01 PAH mg/l ND ND ND ND ND ND ND ND ND ND ND ND ND ND PCB mg/l 0.003 ND ND ND ND ND ND ND ND ND ND ND ND ND ND TBT mg/l 0.01 ND ND ND ND ND ND ND ND ND ND ND ND ND ND
Organochlorin pesticide
ppb 0.01 0 0 0 0 1.101 (*)
0 0 0 0 0 0 0 0 0
Carbamates pesticide
0 0 0 0 0 0 0 0 0 0 0 0 0 0
Organophospates pesticide
0 0 0 0 0 0 0 0 0 0 0 0 0 0
c. Heavy metals Mercury (Hg) �g/l 1 1.18 0.027 <0.06 <0.06 0.046 0.09 <0.06 <0.06 0.09 0.18 <0.06 0.27 <0.06 0.18
Chromium hexavalent (Cr VI)
mg/l 0.005 0.01 0.023 0.018 0.02 0.015 0.009 0.013 0.028 0.008 0.009 0.13 0.007 0.035 0.018
Arsenic (As) mg/l 0.012 0.009 0.009 0.008 0.008 0.009 0.009 0.008 0.007 0.007 0.008 0.007 0.01 0.008 0.012 Cadmium (Cd) mg/l 0.001 0.0002 <0.0001 <0.0001 <0.00
01 <0.0001 <0.00
01 <0.0001 <0.00
01 <0.00
01 <0.00
01 <0.00
01 <0.0001 0.0002 <0.0001
Copper (Cu) mg/l 0.008 0.069 0.067 0.072 0.072 0.07 0.066 0.072 0.069 0.074 0.071 0.079 0.071 0.078 0.074 Lead (Pb) mg/l 0.008 0.208 0.205 0.233 0.194 0.24 0.225 0.293 0.272 0.28 0.288 0.283 0.229 0.3 0.263 Zinc (Zn) mg/l 0.05 0.069 0.061 0.075 0.073 0.068 0.065 0.069 0.073 0.064 0.076 0.062 0.072 0.078 0.068
Nickel (Ni) mg/l 0.05 0.355 0.35 0.376 0.0369 0.352 0.37 0.359 0.328 0.378 0.324 0.291 0.306 0.262 0.222 Barium (Ba) mg/l 0.104 0.111 0.092 0.016 0.017 0.013 0.012 0.015 0.009 0.012 0.012 0.008 0.007 0.007
Selenium (Se) mg/l 0.015 0.01 0.01 0.016 0.017 0.013 0.012 0.015 0.009 0.012 0.012 0.008 0.007 0.007 Aluminium (Al) mg/l 0.305 0.504 0.455 0.537 0.769 0.469 0.557 0.567 0.472 0.316 0.386 0.25 0.273 0.572 Vanadium (V) mg/l 0.021 0.026 0.022 0.024 0.029 0.024 0.023 0.024 0.023 0.024 0.022 0.02 0.024 0.02
d. Radioactivity 4,000 226 Ra mBq/l 1.2 ± 0.8 1.1 ± 0.7 3.2 ± 1.7 2.0 ±
1.2 3.5 ± 1.2
3.9 ± 1.4

ENVIRONMENTAL RESOURCES MANAGEMENT STATOIL EIA DRILLING
A2-6
MoE 51-2004 Locations
Parameters Units Marine Biota 1B-a 1B-b 1B-c1 1B-c2 1B-d 1B-e 2-a 2-b 2-c1 2-c2 2-d 2-e 4-a 4-b
228 Ra mBq/l 0.1 ± 0.1 0.1 ± 0.1 2.3 ± 1.2 0.8 ± 0.4
1.9 ± 0.7
3.0 ± 1.1
210 Pb mBq/l 3,800 ± 9,400
1,000 ± 5,700
3,900 ± 5,900
200 ± 300
< 200 ± 200
200 ± 200
e. Biology Total Coliform colony/1
00ml 1000 0 0 93 240 0 23 4 93 4 23 43 75 3 0
Faecal Coliform colony/100ml
0 0 0 0 0 0 0 0 9 0 4 0 0 0 0
Chlorophyll-a mg/l 1.415 1.191 1.53 2.081 1.209 1.153 1.521 1.209 0.991 0.85 0.722 1.038 0.653 0.213 Chlorophyll-b mg/l 1.49 1.864 1.781 2.076 1.632 1.603 1.908 1.527 1.239 1.115 0.9 1.426 1.021 0.458 Chlorophyll-c mg/l 2.469 2.114 2.466 4.094 2.058 1.55 2.419 1.959 1.612 1.449 1.202 1.655 1.299 0.496
Total Chlorophyll mg/l no bloom 5.374 5.168 5.777 8.251 4.9 4.306 5.849 4.704 3.842 3.415 2.824 4.119 2.974 1.167 Phytoplankton and
Zooplankton
Individual total number
ind/l 19,594 8,250 1,031 0 0 0 19,301 5,344 0 0 0 4,688 15,375 8,250
Shannon-Wiener Diversity Index
2.43 1.66 1.07 0 0 0 2.48 1.31 0 0 0 1.35 2.331 1.67
Evenness Index 0.92 0.93 0.97 0.89 0.94 0.97 0.9 0.93 Dominance Index 0.08 0.07 0.03 0.11 0.06 0.03 0.1 0.07
MoE 51-2004: Minister of Environment Decree No. 51 of 2004 concerning Sea Water Quality, Appendix III-Marine Biota
ND:Not detected
APPENDIX 3
ANALYTICAL RESULT OF SEABED SEDIMENT QUALITY
ENVIRONMENTAL RESOURCES MANAGEMENT STATOIL APPENDIX 3
A3-1
Sediment Samples
Sediment samples were conducted to provide an amount of sediment t for physical – chemical analyses. The rested samples have been processed for benthos analyses. Some samples have been processed onboard for visual analysis and some samples returned to shore for further analysis. Some portions of the sediment analysis placed in a fridge to avoid any contamination and good condition. The samples pre-treatments carried out to the usually approved methodology (rules of the art) and kept in cool conditions (-4ºC).
A. Gravity Core
Gravity Core samples has been taken in desire position used 400 kg weight of core head with 4 meter barrel length PVC and head catcher were used to collect samples for further analysis of geochemical and geotechnical Sample were landed on deck and the plastic liner extruded from the core barrel. The liner cut with a hacksaw into 50 cm sections working downward from the seabed and sealed by plastic caps secured by insulating or duct tape. To avoid any dispute for numbering and sequence of core barrel, marked Top and bottom of barrel after completion of taking sample. The samples will be returned to shore in this state without any analytical work being undertaken
B. Grab Sampling
Grab samples were provided an amount of sediment to be taken for physical – chemical analyses and the rest of the sample separated for benthos analyses. The core box with dimension 40 cm x 40 cm equal with 0.16 m2 was used to collect the sample at proposed location. The amount of sample collected to ensure enough for geochemical and geotechnical analysis. Visual analysis were been taken onboard and some rest data collected and stored sealed container for benthos plankton analysis.
Listed below were analysis has been done in Laboratory:
a. Physico-chemical characteristics. Parameters measured are:
• Grain size distribution • Total Organic Carbon (TOC) • Nutrient (Ammonium, Nitrate, Phosphate) • C:N:P Ratio • O2 • Sulfides

ENVIRONMENTAL RESOURCES MANAGEMENT STATOIL APPENDIX 3
A3-2
• Total Hydrocarbons (THC) • Poly Aromatic Hydrocarbons (PAH)
B. Heavy metals : Al, Fe, Ba, Pb, Cr, Cu, Zn, Ni, Cd, Hg,V, As, Cobalt
(Co),Magnese (Mn), Mercury (Hg), Selanium (Se), Silver (Ag)
C. Radioactivity : included at minimum 226Ra,228Ra,210Pb D. Biology characteristics:
• Name and Number of species (flora/fauna) • Number (abundance) of individual per species • Biomass per species • Distribution • The indexes to be calculated are: Shannon diversity index,
dominance index, evenness index
American Public Health Association American Water Works Association (APHA AWWA) and American Public Health Association (APHA) Standard Methods will be used as standard on the laboratory analysis to analyze the biology sediment.

ENVIRONMENTAL RESOURCES MANAGEMENT STATOIL APPENDIX 3
A3-3
Appendix 3: Analytical Result of Seabed Sediment
Location Point OSPAR Parameters Units
1 B 2 4 BC EAC
Lower Limit
EAC Upper Limit
a. Physico-Chemical Characteristics Total Organic Carbon
% 36.5 27.76 27.45
Ammonium mg/kg 11.88 14.46 16.43 Nitrate mg/kg <0.01 72.26 <0.01 Phosphate mg/kg 3,738.26 3,087.41 2,902.83 C:N:P ratio 97.9 286.39 191.62 Oxidation Potential Redox (ORP)
mv 97 68 115
Sulphide mg/kg ND ND ND Total hydrocarbon
mg/kg 279.74 259.9 239.94
PAH mg/kg ND ND ND Aluminium (Al)
mg/kg 20,900 44,700 31,200
Iron (Fe) Mg/kg 2,400 3,800 1,800 Barium (Ba) mg/kg 128.7 113.3 91.76 Lead (Pb) mg/kg 19.64 26.86 23.12 25 5 50 Chromium (Cr)
mg/kg 17.83 23.45 19.54 60 5 50
Copper (Cu) mg/kg 33.99 35.45 28.94 20 5 50 Zinc (Zn) mg/kg 75.24 62.49 66.17 90 10 100 Nickel (Ni) mg/kg 44.38 48.05 46.94 30 5 50 Cadmium (Cd)
mg/kg 0.176 0.237 0.206 0.2 0.1 1
Mercury (Hg)
mg/kg 0.54 0.38 0.3 0.05 0.05 0.05
Vanadium (V)
mg/kg 67.65 87.71 79.4
Arsenic (As) mg/kg 2.31 9.5 7.06 15 1 10 Cobalt (Co) mg/kg 19.63 24.67 22.41 Manganese (Mn)
mg/kg 180 220 900
Selenium (Se)
mg/kg 18.7 24.3 20.8
Silver (Ag) mg/kg 8.39 8.87 6.58 b. Radioactivity 226 Ra mBq/kg 1,150±760 1,220±89 1,090±76 228 Ra mBq/kg 657±64 890±120 1,180±120 210 Pb mBq/kg <50,500±42,000 <70,000±7,2100 <28,500±33,345

ENVIRONMENTAL RESOURCES MANAGEMENT STATOIL APPENDIX 3
A3-4
c. Biology Benthos Individual Total Number
Ind/m2 30,698 0 2,674
1.15 0 1.06
Shannon diversity index
Low - Low Evenness Index
0.59 - 0.66
Dominance Index
0.41 - 0.34
Note:
ND: Not Detected Intermediate Shannon index = 1.65±0.57

ENVIRONMENTAL RESOURCES MANAGEMENT STATOIL APPENDIX 3
A3-5
APPENDIX 4
STAKEHOLDER ENGAGEMENT MEETING REPORT

Delivering sustainable solutions in a more competitive world
Public Socialization Report
Oil and Gas Exploration Activity Plan in Karama Block, Makassar Strait
December 2009
Proponent:
Statoil Indonesia Karama AS

ENVIRONMENTAL RESOURCES MANAGEMENT STATOIL APPENDIX 4
i
TABLE OF CONTENTS
TABLE OF CONTENTS ..........................................................................................I
1 INTRODUCTION......................................................................................... 1 1.1 BACKGROUND .................................................................................................. 1 1.2 PURPOSE AND OBJECTIVE ................................................................................ 1
2 IMPLEMENTATION OF PUBLIC SOCIALIZATION .......................... 3 2.1 DATE ................................................................................................................. 3 2.2 PLACE................................................................................................................ 3 2.3 PARTICIPANTS .................................................................................................. 3
3 OUTCOME FROM THE PUBLIC SOCIALIZATION ........................... 4
4 CONCLUSION .............................................................................................. 5 3.1 QUESTION ....................................................................................................... 13

ENVIRONMENTAL RESOURCES MANAGEMENT STATOIL APPENDIX 4
1
1 INTRODUCTION
1.1 BACKGROUND
Statoil Indonesia Karama AS (Statoil) plans to conduct exploration drilling activities in Karama Block, Makassar Straits in Mamuju Regency West Sulawesi Province in 2011.
In 2006 Statoil has signed an MOU with Pertamina and in 2007 Statoil and Pertamina secured a Production Sharing Contractor (PSC) for the Karama Block.
In order to support the implementation of oil and gas exploration activities in the Karama Block, Statoil conducted public socializing as part of the internal Environmental Impact Assessment Study. Public socialization activities were implemented as one of the efforts in disseminating information about the plan of oil and gas exploration drilling activities which will take place in the area.
Statoil conducted the public socialization in coordination with BP Migas Kalsul representative office and West Sulawesi Province Energy and Mineral Office. The public socialization also attended by the stakeholders
Until now, Statoil has conducted several studies which are part of internal requirement, namely:
• Stakeholder mapping
• EMPs of 3D siesmic survey
• Study area and national regional profiles
• Baseline study of water quality, sediment and aquatic biota
• Oil spill modelling
• Drilling cuttings distribution modelling
1.2 PURPOSE AND OBJECTIVE
In general, the purpose and objective of public socialization is to inform the plan of oil and gas exploration activity and an explaination of the potential environmental impact of the activity in Karama Block.
In particular, the public socialization is intended:
1) To gather suggestions, opinions, and responses concerning the oil and gas exploration activity

ENVIRONMENTAL RESOURCES MANAGEMENT STATOIL APPENDIX 4
2
2) To protect public interest sorounding the activity area from potential impact that may arise from the project.
3) To establish an atmosphere of equal partnerhip bertween the parties interest in oil and gas exploration activity in Karama Block.
4) To respect the right of all parties to obtain information relating to oil and gas exploration activities in the Karama Block.

ENVIRONMENTAL RESOURCES MANAGEMENT STATOIL APPENDIX 3
3
2 IMPLEMENTATION OF PUBLIC SOCIALIZATION
2.1 DATE
The public socialization held on December 3, 2009 at the auditorium of Hotel Anugrah, Mamuju, West Sulawesi.
2.2 PLACE
Public consultation is conducted in Mamuju which is the nearest city to the project area. Mamuju was choosed because it is the capital city of West Sulawesi Province and relatively accessible for the entire stakeholders.
2.3 PARTICIPANTS
The participants were members of Coordinator/Facilitator/Mediator of Implementation of Oil and Gas Exploration/Exploitation of West Sulawesi Province which consist of representative from related institution in West Sulawesi Province. The public socialization also attended by media and NGOs.
Details list of participants and documentation of the public socialization event are presented in Appendix 1 and Appendix 3.

ENVIRONMENTAL RESOURCES MANAGEMENT STATOIL APPENDIX 3
4
3 OUTCOME FROM THE PUBLIC SOCIALIZATION
The public socialization is divided into three sessions, namely:
• Session I-Opening
o Greetings and project activity overview from Statoil presented by Neisharsa Triaswari.
o Message from Governor of West Sulawesi Province delivered by Secretary of West Sulawesi Province and officialy open the public socialization event.
• Session II-Presentation
o Project exposure of oil and gas activity presented by Ananda Idris (Statoil Government and Public Affair Manager)
o Environmental Impact Assessment overview by Yahya Husin (ERM Indonesia), Team leader of EIA document preparation)
• Session III-Discussion
o Question and Answer Session between the proponent and the participants is guided by Andi Yasin Head of Energy and Mineral Office, West Sulawesi province , as moderator.
During the public socialization discussion session, the participants were actively involved in providing critical inputs associated with the plan of oil and gas exploration drilling in the area. The summary are as follows, while transcript of the discussion session is presented in Appendix 2.
• Employement for local people at Statoil activities.
• Compansation for the rumpons owner located in the drilling site.
• Changes in water quality caused by drilling cuttings and drilling mud during drilling operation.
• Disruption to fishing activity.
• Operasion base which is planned to be located in Balikpapan instead of in Mamuju.
• More comprehensive socialization activities that involve communities in the vicinity of the project location.

ENVIRONMENTAL RESOURCES MANAGEMENT STATOIL APPENDIX 3
5
4 CONCLUSION
Based on the results of the public socialization, and by looking at the issues that arise, there are some key issues concerning oil and gas exploration activity in Karama Block in Makassar Strait Mamajuju Regency West Sulawesi Province that can be summarized as follows:
1) Water quality aspect related to drilling cutting and drilling mud management.
2) Social and Economics aspect releted to job opportunity for local people, community development program and compensation to rumpon owner and fishing group affected by the activity.

APPENDICES

Appendix 1 List of participants


APPENDIX 2 MINUTES OF PUBLIC SOCIALIZATION
Minutes of Public Socialization Plan for Oil and Gas Exploration Activities in the Karama Block
Makassar Strait Mamuju Regency West Sulawesi Province
Mamuju, December 3, 2009
OPENING
A. Statoil Activity Report by Niesharsa Triaswari
B. Message from the Vice Governor of West Sulawesi Province, represented by Secretary of West Sulawesi Province as well as officially open the public socialization.
C. Prayer by Ikhwan Yaman
PRESENTATION
A. Moderator : Drs. Andi Muh. Yasin, MSi (West Sulawesi Province-Energy and Mineral Dept.)
Details of activiries: exploration, operations, seismic survey and drilling.
Legislative context of oil and gas industries.
Exposure
a. Ananda Idris-Goverment & Public Affairs Manager Statoil Indonesia
Overview of oil and gas industries.
Statoil company profile introduction Statoil is leading company in deep sea oil and gas exploration and operation.
Statoil has conducted seismic survey in Karama Block to gather information on oil and gas reserve of the area.
Development and Operation strategy of a production unit will refer to the result of seismic survey and exploration drilling.
b. Yahya Husin (PT. ERM Indonesia)
Explaination on environmental impact assessment study:
– Statoil has conducted several studies in order to get information and environmental baseline of the Karama Block in Mamuju, such as stakeholder mapping, seismic survey and social study.
– Based on the studies, there are some sensitive areas, among them is mangrove ecosystem along the Mamuju shoreline.
– In addition to sensitive areas, informations gathered from the studies are usefull in determine the potential impact from drilling activity.
Q-A SESSION I
Question
1. HEAD OF MAMUJU REGENCY ENVIRONMENTAL OFFICE - MULYADI
• The seismic survey was conducted using microphone on the sea surface, is there any other technology so that it will not interupted the existed rumpon in the area.
• Operational Base is expected to be in Mamuju, West Sulawesi, instead of in Balikpapan, so that it will help to increase the local economy of Mamuju.
• Drilling activity can cause an environmental problem, for example in Sidoardjo and Timor Sea, what is the base on impact criteria determination so that drilling activity only requires UKL-UPL.
2. APPMI (ASSOCIATION OF COMMUNITY EMPOWERMENT)-IKHWAN BUSTAM
• Regarding the community empowerment program, will it be involving government or the culutral communities.
• Area that will be impacted by the drilling activity.
• Disposal procedures of drilling cuttings and safety of the operation.
• How long is the interval between exploration and production process.
3. REPRESENTATIVE OF FISHERMEN GROUP
• Clarification concerning compensation to fishermen, since previously compensation was only given to rumpon owner.
4. WEST SULAWESI PROVINCE ENVIRONMENTAL OFFICE
• Public socialization is expected to be conducted near the project location.

• Government supervision will refer to the approved document.
5. GERAK LAPAR NGO
• What is the sharing system between government and the company.
• Job opportunity is expected to give priority to local worker.
• EIA document preparation process.
• Compensation to rumpon owner did not consider losses to the communities, for example disturbance to shipping line.
RESPONSE
1. STATOIL- ANANDA IDRIS
• Sharing system between the government and the companies that appear in the presentation graph is not done in nominal terms, but takes the form of conversion to the barrels of oil production beyond the current oil price.
• Time period of exploration to production can not be determined directly prior to the drilling process because there are several steps that need to be done to determine the amount of oil reserves and economics feasibility, including drilling to determine the presence or absence of oil and gas reserves. If the result is positive, the drilling of appraisal well is conducted to determine the amount of oil and gas reserves, based on that, the economics feasibility studies is then carry out.
• Development of production unit will be based on economics feasibility studies result and also political judgment.
• Seismic survey using microphone is conducted based on sound reflection principle. Survey is conducted on sea surface based on water characteristics as good sound conductor. If it is conducted below the surface, the sound reflection will not maximum and the result will not be accurate.
• Sharing contract with the government refers to Oil and Gas Law in 2002 with the open possibility of such operation. Fundamental change is the clause in the Domestic Market Obligation which required operators to market some products to meet domestic needs.
• The availability of employment is related to the result of economic and social feasibility study, this will be answered after a known number of existing oil and gas reserves at the site could be exploited.
• Indemnity compensation has been set trough West Sulawesi Governor Regulation. The company will follow the regulation.

Addition comment from the Head of Maritime and Fisheries Office that the compensation issue of seismic activity has been completed and no problem occurred during the implementation.
2. ERM- BAPAK YAHYA HUSIN
• Explanation on determination of significant impact criterion and studies that have been conducted.
• In conducting an activity, there are studies that require approval and studies that not require approval from the related institution. Statoil as a company that will have an activity in Mamuju area has conducted baseline studies that not require approval from any institution. As for study that requires approval, it will be conducted base on the guideline stipulated in government regulations, for oil and gas operation, the approval will be issued from Central Government level.
• Minister of Environment Decree No. 11 year 2006 stated which activity requires an AMDAL or UKL-UPL. As mention in the Decree, Exploration drilling only requires UKL-UPL. Based on several studies that have been conducted by Directorate General of Oil and Gas to drilling activity in Indonesia, it is concluded that drilling activity did not generate significant impact therefore the activity only require UKL-UPL.
• Stakeholders consist of all stratums from central and provincial government to community level. Stakeholder mapping has been conducted by Statoil.
• Secure area of drilling point can be ascertained from modeling result that are being made and will be incorporated into the UKL-UPL document.
• The procedure for drilling cuttings and drilling mud will be carried out according to the regulated procedures. This includes circulating drill cuttings and mud after the test set by Minister of Energy and Mineral Decree No. 45 year 2006 concerning Management of drilling mud, drilling mud and cuttings waste for oil and gas drilling activity.
• Safe distance of fishing vessel to drilling ship will be socialized and notified during the drill ship operation.

5 Q-A SESSION II
3.1 A. QUESTION
1. HEAD OF WEST SULAWESI PROVINCE MARINE AND FISHERIES OFFICE-HARUNA HAMAL
• Potential problem that will physicaly occured during the drilling activity is noise (in term of frequency) and drilling cutting disposal.
• There are concenrs from the community that everytime an exploration activity happened in the area, the fish is disappeared. If any scientific study that can be assured that sound frequency will not affect the fishing activity.
• In early 2009, in Majene occured black oil that caused itching to the community. The oil point of source is not known. Is there any method to determine the origin of the oil, in order to determine who is responsible.
2. HEAD OF WEST SULAWESI PROVINCE TRANSPORTATION OFFICE
• Information regarding shipping line and infrastructure facility available in West Sulawesi Province, such as port and airport that is sufficient to cattered base operation requirement in West Sulawesi, instead of in Balikpapan.
• Drilling point shoul be informed to related institution for mapping purposes.
5.1 B. RESPONSE
1. ERM-YAHYA HUSIN
• Drilling cuttings and their distribution will be studied trough modeling; the modeling result later on will be incorporated into UKL-UPL.
• Regarding noise and its effect on fisheries, there area scientific studies which stated that species sensitive to sound frequency are marine mammals such as dolphins, whales and turtles.
• Helicopter will only be operated in daytime and assumed will not give any disturbance. Drill ship operation will only generate noise in the surface; therefore will not affect the fishing activity in Mamuju area. Noise impact assessment will only be carried out on human.
• The oil that occurred in Majene can not be appointed directly because although there are regulation existed to prevent such problem but the implementation of supervision in the field can not be done effectively.
Since no oil and gas exploration have been conducted in Majene (West Sulawesi) area, the oil is most likely come from ballast water discharge of ships crossing Makasar Straits.
• Drilling coordinate will be written in UKL-UPL document.
6 CLOSING
CLOSING SPEECH DELIVERED BY HARUNA HAMAL (HEAD OF WEST SULAWESI PROVINCE MARINE AND FISHERIES OFFICE)
• There are many advantages of this meeting, lesson learns and suggestions that will become part of enrichment for the future improvement both for West Sulawesi government in particular and Indonesia Government in general related to exploration and exploitation in oil and gas.
• We thank Statoil and all participants who have contribute to this event.
APPENDIX 3 PRESENTATION MATERIAL PRESENTED IN PUBLIC SOCIALIZATION
Sosialisasi Rencana KegiatanEksplorasi Migas di Blok Karama, Selat Makasar
Mamuju, 03 Desember 2009

APPENDIX 4 PHOTOS

APPENDIX 5
MASTER IMPACT TABLE

Scoping Impact Significance Residual Impact Significance
Activity/Aspect Potential Impact Magnitude of Impact
Value/sensitivity of resources/
receptor Significance
Mitigation Magnitude of
Impact
Value/sensitivity of resources/
receptor Significance
Planned Activities
Air emissions from vessels/ equipment involved in the movement of the drill ship to the project site; power generation on the drill ship, supply vessels, and helicopter transfers.
Reduction of air quality from emissions (e.g. CO2, CO, NOX, SO2, particulates/ smoke) and unburned hydrocarbons in the exhaust emissions.
Low Medium Minor • Optimising operations of the engines to optimize fuel combustion and thus emissions;
• Ensuring the use of low sulphur fuel;
• Ensuring the use of Marine Gas Oil as fuel rather than Heavy Fuel Oil to reduced emissions; and
• Ensuring the provision of a fuel overflow tank system.
Low Medium ALARP
Marine impacts: Largely behavioural impacts (disruption to movements, localised avoidance) to marine life, particularly marine mammals and sea turtles, as well as fish species by altering the natural underwater noise environment.
Medium High Moderate-Major
• Use of marine mammal observer (MMO) to observe the presence of marine mammals and turtles within close proximity of the drilling vessel prior to starting;
• Record sightings of marine mammal and turtles, details of any problems encountered, details of watches made for marine mammals/ turtles and the drilling activity during watches;
• Use of low noise thrusters and exhaust silencers;
• Use of low noise equipment; and • Optimised exploration activities.
Low High Moderate Noise generation during the exploration drilling program from propellers and thrusters of the drill ship and support vessels, drilling activities and helicopter transfers.
Nearshore impacts: Disturbance to local communities in the area
Low Low Not significant
No further mitigation needed. - - -

Scoping Impact Significance Residual Impact Significance
Activity/Aspect Potential Impact Magnitude of Impact
Value/sensitivity of resources/
receptor Significance
Mitigation Magnitude of
Impact
Value/sensitivity of resources/
receptor Significance
of Balikpapan from noise generated by helicopter transfers.
Wastes generation during drilling and support activities and handling, storage, disposal of non-hazardous and hazardous wastes.
Potential for the following in the event of inappropriate waste management: • Toxic effects or
physical damage to marine organisms;
• Water pollution/ fouling/ contamination of the sea/ shoreline or onshore environment (onshore storage, transport and disposal activities);
• Risks of fire and explosion; and
• Risks to human health.
Medium Low Minor Waste Management System (vessel’s Pollution Control and Waste Management Procedure), detailing: • Waste minimisation at source; • Waste segregation by type; • Transport of wastes in suitable
containers to avoid leaks, wind blown release of waste materials;
• Completion of transportation consignment notes to document the transfer of materials from offshore to onshore;
• Recycling of waste where possible; and
• Compliance with MARPOL Annex V requirements (including the prohibition of disposal of garbage into the sea) on the drilling vessel, support and supply vessels.
Low Low Not significant
Well drilling and discharge of drilling wastes and excess cement, wastewater, ballast water and rainwater runoff.
Contamination of the marine environment (reduction of water quality, increased suspended solids, and seabed blanketing from settling of drill cuttings) leading to toxic effects/ smothering of marine
Low Medium Minor • Careful monitoring of activities to ensure conducted in a controlled manner to reduce disturbance to seabed; and
• Conducting a comprehensive baseline of the area to determine the likely species present and their sensitivity prior to
Low Low Not significant
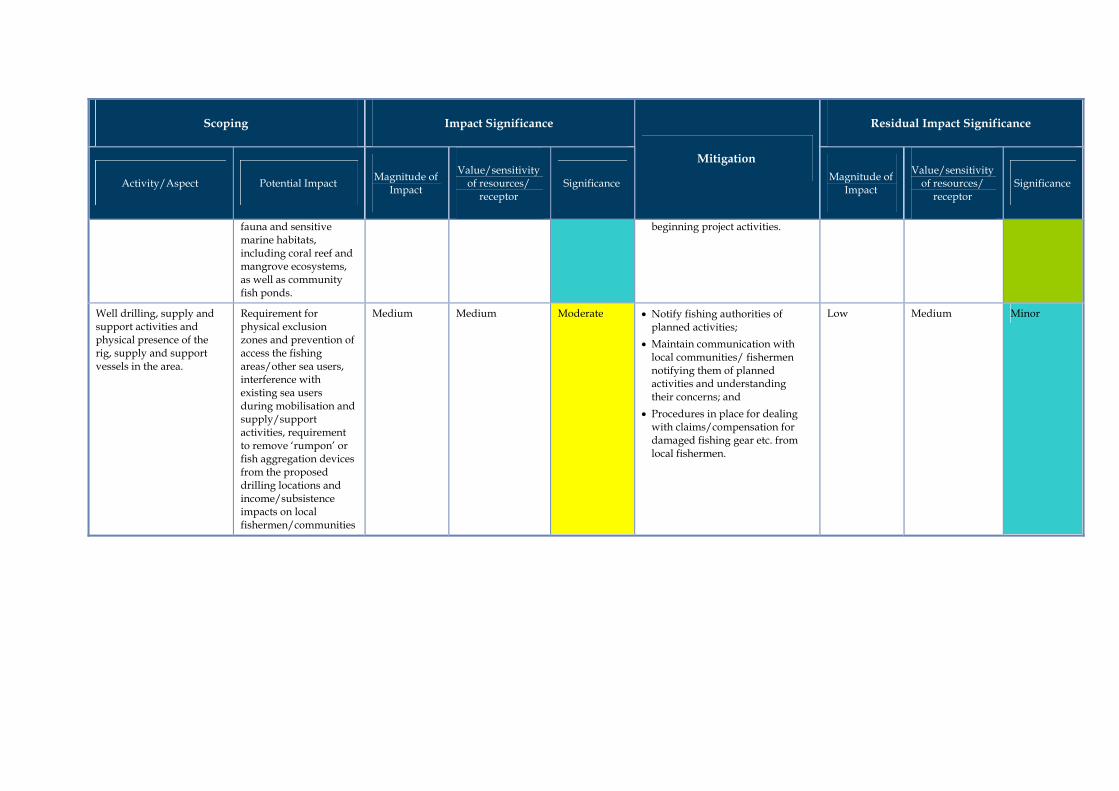
Scoping Impact Significance Residual Impact Significance
Activity/Aspect Potential Impact Magnitude of Impact
Value/sensitivity of resources/
receptor Significance
Mitigation Magnitude of
Impact
Value/sensitivity of resources/
receptor Significance
fauna and sensitive marine habitats, including coral reef and mangrove ecosystems, as well as community fish ponds.
beginning project activities.
Well drilling, supply and support activities and physical presence of the rig, supply and support vessels in the area.
Requirement for physical exclusion zones and prevention of access the fishing areas/other sea users, interference with existing sea users during mobilisation and supply/support activities, requirement to remove ‘rumpon’ or fish aggregation devices from the proposed drilling locations and income/subsistence impacts on local fishermen/communities
Medium Medium Moderate • Notify fishing authorities of planned activities;
• Maintain communication with local communities/ fishermen notifying them of planned activities and understanding their concerns; and
• Procedures in place for dealing with claims/compensation for damaged fishing gear etc. from local fishermen.
Low Medium Minor
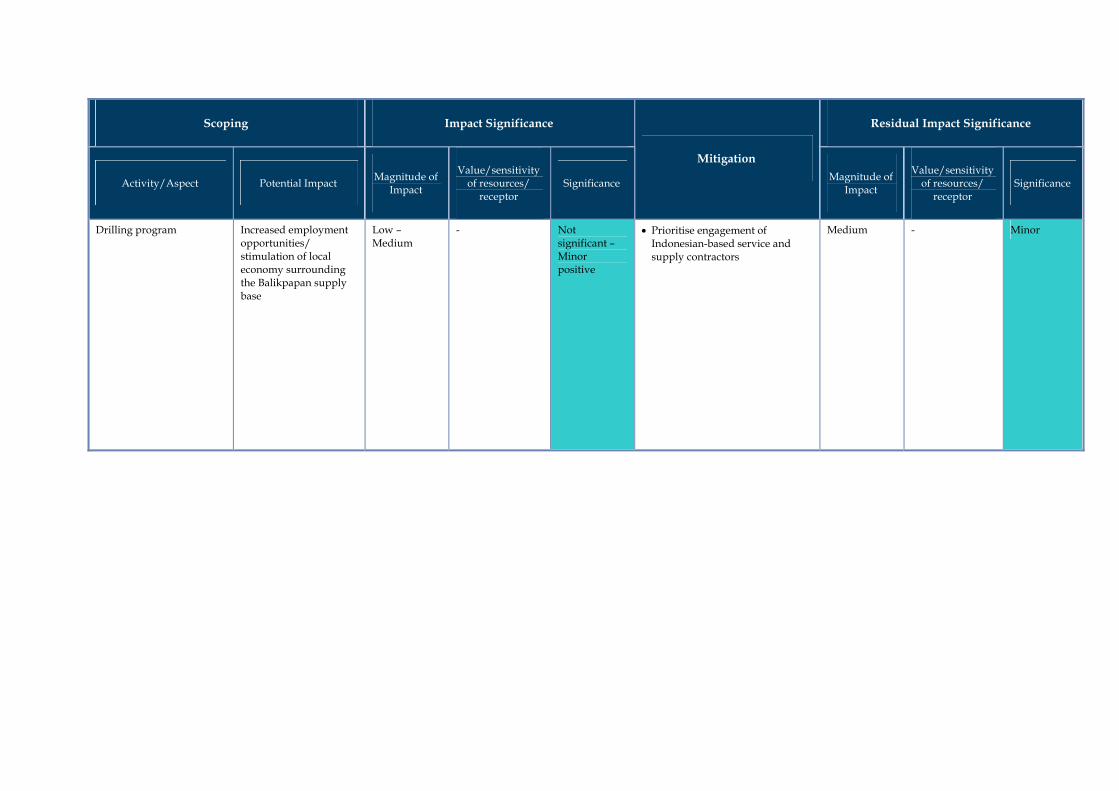
Scoping Impact Significance Residual Impact Significance
Activity/Aspect Potential Impact Magnitude of Impact
Value/sensitivity of resources/
receptor Significance
Mitigation Magnitude of
Impact
Value/sensitivity of resources/
receptor Significance
Drilling program Increased employment opportunities/ stimulation of local economy surrounding the Balikpapan supply base
Low – Medium
- Not significant – Minor positive
• Prioritise engagement of Indonesian-based service and supply contractors
Medium - Minor

Scoping Impact Significance Residual Impact Significance
Activity/Aspect Potential Impact Magnitude of Impact
Value/sensitivity of resources/
receptor Significance
Mitigation Magnitude of
Impact
Value/sensitivity of resources/
receptor Significance
Unplanned events
Well blow out and uncontrolled release of hydrocarbons; and Vessel collision, loss of vessel inventory
Large oil spill leading to multiple impacts: • Contamination of the
marine environment; • Toxic effects on
marine fauna; • Contamination of
coastline and oil fouling;
• Toxic effects on coastal flora/fauna;
• Impacts on fisheries, including sea fisheries and coastal mariculture;
• Disruption to transportation and shipping;
• Livelihood impacts on dependent /affected communities;
• Risks of fire and explosion; and
• Risks to human health.
High High Major • Development of an Oil Spill Contingency Plan that identifies responsibilities of relevant personnel, defines spill response actions (eg. for Tier 1, Tier 2 and Tier 3), describes actions to be taken in the event of a spill, communication procedures, reporting procedures, etc, including ensuring that spill response mechanisms are in place and located in a logistically suitable location (ie. locally based) that enables quick response time;
• Provision, implementation and training of all staff on an Emergency Prevention and Response Plans, including emergency training exercises;
• Ensuring a model can be run live in case of a spill;
• Ensure of notices to other mariners of activities in the area; and
• Presence of support vessels to warn other vessels in the area.
Medium Medium Moderate

APPENDIX 6
DRILLING CHEMICAL CHARACTERISTICS

Appendix 6 Environmental Characteristics of Drilling Fluids
Constituent (Trade Name) Compound Function Appearance * Spill Behaviour * Ecological Info *
Bio-accumulation
Potential * Degradability * HQ or OCNS
Group ** OCNS
Product Warnings **
Water Based Muds
BARAZAN D Xanthum gum Viscosifer White to yellow powder Soluble in water No data provided No data provided
No data provided E -
Barite Barite Additive Pink to tan grey solid Insoluble in water No data provided No data provided
No data provided E -
Bentonite Bentonite Weight additive Solid Insoluble in water No data provided No data provided
No data provided E -
Calcium Chloride (brine) Calcium chloride Soluble weighting/ bridging agent, osmotic control, stabilizer, accelerator, source of calcium
White solid Soluble in water No data provided No data provided
Does not decompose
E -
Caustic Soda Sodium hydroxide pH controller White solid pellets Insoluble in water Concentration greater than 10 ppm or pH greater than 10.5 may be toxic to fish and other organisms
Does not bioaccumulate
Does not biodegrade
E -
Gum Xanthan Gum Xanthan Stabiliser/ emulsifying agent Cream to tan coloured powder
Mixes with water Prevent spillage from entering water courses
No data provided
No data provided E -
PAC-LE Cellulose derivative Fluid loss additive White to off-white powder Forms a gel in water No data provided Not determined Readily biodegradable
- -
Soda Ash Sodium carbonate pH controller White powder Partially soluble in water
Prevent spillage from entering water courses
No data provided
No data provided E -
Sodium Bicarbonate Sodium bicarbonate pH controller White solid Soluble in water No date provided Not determined Slowly biodegradable
E -
Synthetic Based Muds
Calcium Carbonate, fine Calcium carbonate, crystalline silica quarts
Additive Light tan solid Soluble in water No data provided No data provided
No data provided E -
Calcium Chloride (powder)
Calcium chloride Soluble weighting/ bridging agent, osmotic control, stabilizer, accelerator, source of calcium
White solid Soluble in water No data provided No data provided
No data provided E -
EDC 95/11 Benzene Base oil Colourless liquid Insoluble in water LC 50, 96 Hrs, Fish mg/l: >100 This product must be essentially harmless for aquatic and land-based life and would be intrinsically biodegradable. Avoid water and soil pollution
No data provided
76% in 28 days Biodegradable in seawater
- -
EZ MUL NT Hydrotreated light distillate, ethylene glycol monobutyl Ether, diethylene glycol monobutyl ether
Emulsifier/ wetting agent Dark amber liquid Insoluble in water EC50: 1701 mg/l (Corophium volutator), Prevent from entering waterways
No data provided
No data provided D -
Lime hydrated Calcium hydroxide Alkalinity agent White solid Insoluble in water. Sinks in water.
TLM96: 100-500 ppm (Oncorhynchus mykiss)
No data provided
No data provided E -
LIQUITONE Latex HTHP filtration agent Milky white liquid Disperses in water Prevent from entering waterways No data provided
No data provided Gold -
RHEMOD L Fatty acids, propriety components
Rheology/ suspension Dark liquid Insoluble in water Prevent from entering waterways No data provided
No data provided - -

Constituent (Trade Name) Compound Function Appearance * Spill Behaviour * Ecological Info *
Bio-accumulation
Potential * Degradability * HQ or OCNS
Group ** OCNS
Product Warnings **
Contingency Chemicals
Calcium carbonate Calcium carbonate, crystalline silica quarts
Additive Light tan solid Soluble in water No data provided No data provided
No data provided E -
Aldacide G Glutaraldehyde Biocide Transparent liquid Soluble in water Prevent from entering waterways. May be highly toxic to aquatic life.
No data provided
Readily biodegradable
Silver, C -
Graphite Fine No data provided No data provided No data provided No data provided No data provided No data provided
No data provided - -
Graphite Medium No data provided No data provided No data provided No data provided No data provided No data provided
No data provided - -
Kwil-Seal Blend of vegetable and polymer fibres
Additive Blend of various coloured particles
Insoluble in water Not toxic to aquatic organisms No data provided
No data provided - -
Barofibre F/MC Natural Plant Fiber Additive Red brown powder Insoluble in water No data provided No data provided
Biodegradable E -
Nut Plug F/M/C Coconut shell Fluid loss reducer Brown, granular Insoluble in water No data provided No data provided
No data provided - -
Super Sweep Viscosifer Silver -
BARAKLEAN 2-Ethyl hexanol Corrosion inhibitor Light straw liquid Emulsifies Prevent from entering waterways. EC50: > 1890 mg/l (Corophium volutator)
No data provided
Slowly biodegradable
Gold, D Substitution warning
GELTONE II Modified bentonite Viscosifier Tan powder Insoluble in water TLM96: 36.75-696.3 mg/l (Cyprinus carpio)
No data provided
No data provided - -
COLDTROL Alcohol adducts Surfactant Colourless liquid Soluble in water Prevent from entering waterways. TLM96: 1-10 mg/l (Golden orfe)
No data provided
Readily biodegradable
- -
DRILL TREAT Lipid Oil-wetting Agent Amber liquid Disperses in water No data provided No data provided
Biodegradable - -
TEG No data provided No data provided No data provided No data provided No data provided No data provided
No data provided E -
N-SQUEEZE Blend of natural fibres Loss Circulation Material Light brown solid Forms a gel No data provided No data provided
Readily biodegradable
- -
N-PLEX Sodium hydroxide, sodium borate
Loss Circulation Material Clear colourless liquid Soluble in water Prevent from entering waterways No data provided
No data provided - -
Cement
Liquid Acelelator D077 Calcium chloride Acelelator Clear – yellow-brown liquid
Soluble in water Low toxicity to fish No data provided
No data provided E -
Antifoam Agent D 47
Polypropylene glycol Antifoam Clear liquid Soluble in water No data provided No data provided
Not biodegradable E -
Liquid Antisetlling D162
Hydrotreated light Petroleum distillates
Antsettling Off-white liquid Disperses in water LC50(10d) = 290 mg/kg (Corophium volutator); EC50(72h) = >1000 mg/l (Skeletonema costatum); LC50(48h) = 6.7 mg/l (Acartia Tonsa) May be highly toxic to some aquatic organisms
No data provided
No data provided B- D -
Barite D 31 Barium sulphate Barite White powder Low solubility in water No data provided No data provided
No data provided E -

Constituent (Trade Name) Compound Function Appearance * Spill Behaviour * Ecological Info *
Bio-accumulation
Potential * Degradability * HQ or OCNS
Group ** OCNS
Product Warnings **
SALBOND II Additive D 80A
Aromatic polymer derivative
Dispersant Dark brown liquid Soluble in water Do not allow material to contaminate ground water system.
Not likely to bioaccumulate
Not readily biodegradable
- -
Low temperature Liquid Dispersant D 145A
Amine polymer derivative
Dispersant Clear to hazy yellow liquid
Soluble in water Prevent further leakage or spillage. Keep out of waterways.
log Pow = < -5 17 % in 28 days C -
Low temperature Dispersant D 185
Aliphatic acid copolymer Dispersant Colourless liquid Soluble in water Fish toxicity: 96h LC50= >500 mg/l (Scophthalamus maximus juvenile)
Does not bioaccumulate
Not readily biodegradable
Gold Substitution warning
Low temperature Extender D 154
Non-crystalline silica Extander Grey-white powder Insoluble in water This product has no known eco-toxicological effects
No data provided
No data provided PLONOR -
Silicate Additive D 75 Silicic acid, sodium salt Extander Colourless liquid Soluble in water None required No data provided
No data provided PLONOR, E -
Litefil D 124 Extender Aluminum silicate Extander Tan-grey powder Insoluble in water None required No data provided
No data provided PLONOR -
Uniflac L D 168 Aliphatic amide polymer Fluid Loss Control Clear/ colourless – yellow liquid
Soluble in water Prevent further leakage or spillage 72h EC50= 45 mg/l (Skeletonema costatum)
Does not bioaccumulate
Partially biodegradable
Gold, E -
Fluid Control Additive D193
Organic polymer, Hexahydro-1,3,5-tris(2- hydroxyethyl)-sym-triazine
Fluid Loss Control, gas Control Colourless liquid Soluble in water Prevent further leakage or spillage; 80% (28 days) 72h EC50= 3 - 300 mg/l (Skeletonema costatum)
Low bioaccumulation
Biodegradable Gold -
Cement Class G D 907 Portland cement Cement Grey powder Misicible in water No data provided No data provided
No data provided E -
Gas Block LT D500 Organic polymer, Amine polymer, Hexahydro-1,3,5-tris(2- hydroxyethyl)-sym-triazine
Gas Block Green liquid Soluble in water Does not bioaccumulate
Biodegradable C, Gold Substitution warning
Low temperature Cement Set Enhancer D 186
Inorganic nitrogen compound, Aliphatic alcohol, 2,2'-methyliminodiethanol, Inorganic bromine compound
Low temperature Cement Enhancer
Light green liquid Soluble in water No data provided Does not bioaccumulate
No data provided Some components listed as PLONOR
-
Micro Cement D169 Portland cement Microfine Cement Grey powder Misicible in water No data provided No data provided
No data provided E -
Liquid retarder D81 Calcium lignosulfonate Retarder Dark brown liquid Soluble in water No data provided No data provided
Not readily biodegradable
PLONOR, E -
Uniset-LT D177 Phosphoric acid, Pentasodium EDTMP
Retarder Light green liquid Soluble in water 72h EC50=9 mg/l (Skeletonema costatum)
Does not bioaccumulate
Not biodegradable - -
Sulfactant F057 SALT OF SULFONATED AROMATIC ACID, ALIPHATIC ALCOHOL GLYCOL ETHER, SALT OF AROMATIC ACID
Sulfactant Yellow liquid Soluble in water Harmful to aquatic organisms No data provided
Partially biodegradable.
- -
Spacer B250 Bentonite, Glucoside polymer
Vicosifier Off-white solid Partially soluble No data provided Not likely to bioaccumulate
Readily biodegradable
PLONOR -
Notes: “NA“ means information not available “HQ” means Hazard Quotient under OSPARs Offshore Chemical Notification System (OCNS). Gold = lowest ecological hazard; while purple = highest. (See below for description) “OCNS Group” reflects an alternate hazard assessment system adopted under OCNS; with A being the greatest potential environmental hazard and E being the least. Products that only contain substances termed PLONORs (Pose Little or No Risk)

Constituent (Trade Name) Compound Function Appearance * Spill Behaviour * Ecological Info *
Bio-accumulation
Potential * Degradability * HQ or OCNS
Group ** OCNS
Product Warnings **
are given the OCNS E grouping. (See below for description) “Product Warnings”: are defined under the OCNS and indicate a product containing any percentage of hazardous chemicals listed in OSPARCOM’s Annex A. Zn = Zinc, Cr = Chromium
Sources:
* Individual Material Safety Data Sheets for each product
** CEFAS, BERR, Staatstoezicht op de Mijnen, 2002; Offshore Chemical Notification Scheme List of Notified and Ranked Products.

Explanation of OCNS Categories and Risk Assessment
Under OSPARs Offshore Chemical Notification System (OCNS), chemicals used in the offshore oil and gas industry are assessed in terms of their ecological hazard. Two approaches are used depending on the use of the chemical; either a Hazard Quotient (HQ) is given; expressed as a Colour Band; or an OCNS Group, expressed as a letter from A to E.
OCNS Hazard Quotient (HQ)
The HQ is the ratio between the Predicted Effect Concentration and the No Effect Concentration (PEC:NEC) and is expressed as a colour banding. Data used to define the Effects include toxicity, biodegradation and bioaccumulation. The HQ colour codes are interpreted as follows:
The OCNS HQ and colour bands
Minimum HQ value Maximum HQ value Colour banding
>0 <1 Gold
≥1 <30 Silver
≥30 <100 White
≥100 <300 Blue
≥300 <1000 Orange
≥1000
Purple
Lowest Hazard
Highest Hazard
OCNS Group
Some products are categorized into an OCNS Group of A-E instead (ie. inorganic substances, hydraulic fluids or chemicals used only in pipelines), with A being the greatest potential environmental hazard and E being the least (see below table). Factors considered in defining the environmental risk are also toxicity, biodegradation and bioaccumulation. Letter groups are provided as follows:

The OCNS letter grouping
Initial OCNS grouping
Result for aquatic toxicity (mg/l)
Result for sediment toxicity (mg/l)
Hazard Risk
A <1 <10 Highest B >1 - 10 >10 - 100 C >10 - 100 >100 - 1,000 D >100 - 1,000 >1,000 - 10,000 E >1,000 >10,000 Lowest
Products that only contain substances termed PLONORs (Pose Little or No Risk) are given the OCNS E grouping.
This information is derived from : http://www.cefas.co.uk/offshore-chemical-notification-scheme-(ocns)/hazard-assessment.aspx. Further information on the OCNS Classification System and Hazard Assessment methods is available at this website.