covid-19 and foreign firms’ activities in new hampshire
TRANSCRIPT

NEW HAMPSHIRE GLOBALIZATION REPORT 2020Covid-19 and Foreign Firms’ Activities in New Hampshire: Resilience And Regionalization
Dr. Roxana Wright ’01MBAProfessor of Management, Plymouth State University
Dr. Chen WuAssociate Professor of Economics, Plymouth State University

Plymouth State UniversityJanuary 2021

Page 1 of 24
EXECUTIVE SUMMARY
• Global and U.S. Foreign Direct Investment (FDI) inflows have been in decline since 2015, and expected to drop further in 2020.
• U.S. remained the world’s largest recipient of FDI flows in 2019. FDI from Canada decreased as compared to 2018, while FDI from the European Union, the United Kingdom, the Asia Pacific and China increased.
• The merchandise trade deficit of New Hampshire declined in 2019, near its lowest value in the past five years. New Hampshire maintained stable and strong trade relationships with its major partners in 2019.
• The U.S. trade dropped in the first half of 2020, but bounced up starting the third quarter due to the world-wide efforts to reopen economies and resume economic activities.
• After a sharp contraction in the second quarter of 2020, the Granite State’s economy grew in the third quarter by a pace that was ranked Number 8th among all states. The New Hampshire imports of goods was shifted to a much lower level in the second quarter and then started recovering. New Hampshire exporters showed stable performance and resilience during the pandemic.
• The implementation of the Foreign Investment Risk Review Modernization Act of 2018 by the Committee on Foreign Investment in the U.S. imposed mandatory filing and rigorous review for FDI in certain critical technologies, critical infrastructure, and the personal data of U.S. nationals.
• Foreign-owned businesses in New Hampshire demonstrate resilience to globalization risks in 2019. NH foreign firms’ expenditures in mergers and acquisitions, new establishments, and business expansions increased from 2016 to 2019.
• Despite the lower than normal levels of business activity during the 2020 COVID-19 pandemic, foreign firms engaged in a number of noteworthy projects and strategic activities with a significant meaning for the Granite State.
o Interactions between foreign and local firms not only strengthened the market position of the foreign companies but also gave domestic companies access to international markets.
o In acquisition cases, the purchase added to the company’s market segments, products and capabilities.
o Foreign firms’ actions to strengthen the supply chain were accompanied by clear goals of improving networking and pulling more or specific product types through the chain.
• The 2020 business activity involving foreign firms in NH was generated mostly by actions targeting U.S. expansion and increasing market presence. International reach of companies also generated activities in our state. New Hampshire’s geographical location creates a passageway to lucrative markets on the East Coast.

Page 2 of 24
• New Hampshire is positioned to offer closeness to U.S. markets and proximity or a corridor for
gaining proximity to a more localized supply chain network. Given the border proximity and the presence of foreign companies in key sectors, including manufacturing and high-tech, NH should benefit from regionalization, as more companies are aiming to increase the resilience of their supply chains and limit the high cost of disruptions.
• As more companies are building more redundancy into supplier networks, the time may be ideal for promoting our state to foreign businesses looking to regionalize their supply chains.

Page 3 of 24
PART 1. GLOBALIZATION RISKS AND NEW HAMSPHIRE
Questioning globalization
The 2020 “great lockdown” related to the COVID-19 pandemic has presented organizations and policy-makers with an unprecedented challenge. According to analystsi, the policy response to the health crisis has been “remarkable in its suddenness, magnitude and synchronicity across countries”. Governments have taken steps to cope with the economic challenges resulting from the containment policies by adopting a mix of fiscal, monetary and financial policies, some guided by protectionism and accompanied by partial or complete border closures. Current business literatureii asserts that businesses have been left scrambling trying to respond to the new policy reality. Studies cited by this literature noted the ways in which firms are presently reorganizing their global value chains by bringing production closer to distribution, diversifying their supplier base or adopting new technology. All of these issues remain at the forefront of the news and analysis. The COVID-19 pandemic has raised new questions about globalization and business resilience, with implications on policy and business decisions at global, national and state levels. The present report presents new assertions on globalization and opinions on how the new business realities impact foreign companies’ activities in New Hampshire.
1.1 The COVID-19 pandemic made globalization risks more obvious
Recent opinions on the impact of COVID-19 on globalizationiii argue that the pandemic revealed the social, political and economic risks of high specialization and markets’ inter-connectedness. In 2008-2009, globalization has been seen as fuel for the financial crisis. Globalized systems in 2020 represent a vehicle for the transmission of health risks. Analysts continue to recognize globalization as an avenue for development and progress, and the efficiencies of a networked world economy. Conversely, events in the past decade and a half, culminating with the current pandemic, point out to globalization’s facets of economic value displacement, increasing inequality, and unwanted immigration, and as a vehicle for spreading disease. Scholars and the mediaiv have remarked that the drive for efficiency has led to a concentration of production, knowledge and innovation in limited geographic areas. The same focus on efficiency resulted in more complex global supply chains. As countries went into lockdown due to the pandemic, production was disrupted, national borders were closed and supply shortages disrupted supply chains. The COVID-19 pandemic uncovered the risks of complex networks of global supply chains and reemphasized the importance of places, more so than flows of international trade and direct investments.
1.2 Globalization risks in the U.S. and New Hampshire in 2019
The year of 2019 witnessed rising risks in the globalization process. On one hand, the number of trade disputes between the U.S. and its major trading partners was soaring. According to a CRS report, as of December 2020 the U.S. has been involved either as a complainant or a respondent in a total of 280 trade disputes addressed through the WTO.v In 2019 alone, 54 developments in which the U.S. was a party were entered into the WTO dispute settlement system.vi The U.S. also initiated or responded in 14 cases of trade disputes in 2019 with its NAFTA partners and six of these cases remain active as of December 2020.vii As a consequence of the tension with trading partners, the U.S. merchandise exports to the world and imports from the world dropped for the first time since 2016 by 1.2 percent and 1.6 percent compared to 2018, respectively.viii
On the other hand, the global-wide movements of financial resources across the borders, as measured by the Foreign Direct Investment (FDI) inflows, continued to decline since 2015. The global FDI flows totaled $1.39 trillion in 2019, marking a one percent decrease from $1.41 trillion in 2018 and the

Page 4 of 24
fourth consecutive annual decline. Albeit the country-by-country variations, the general trend of FDI growth remained sluggish. This is mainly because the FDI flows to developed economies as a group decreased by 6 percent to a record low level of $643 billion, and such flows to developing countries did not grow in 2019. Moreover, both the announced greenfield projects and the cross-border Mergers and Acquisitions (M&As) projects, an indicator of future FDI trends, dropped by 22 percent and 40 percent from the previous year, respectively.ix
U.S.: decreased overall inflows but international ties still strong
Although the U.S. remained world’s largest recipient of FDI flows in 2019, its FDI inflows dropped by 2.9 percent from its 2018 value to $246.2 billion in 2019, leading the runner-up China by $105 billion. As shown in Figure 1, this is the fourth consecutive annual decline. Figure 2 illustrates the top sources of FDI flows into the U.S. in 2019. Two thirds of the inflows came from five markets, namely Germany (17%), Japan (16%), Canada (15%), United Kingdom (9%) and Bermuda (9%). Figure 3 compares the U.S. FDI inflows from the selected markets between 2018 and 2019. While the FDI flows from Canada declined, such investment from the European Union, the United Kingdom, and the Asia Pacific (Australia, Japan, etc.) significantly increased. It is interesting to note that, albeit the rising tension in the U.S.-China relationship around the investigations and disputes focusing on China’s multinational companies including ZTE and Huawei, the FDI flows from China into the U.S. grew by 168 percent. Manufacturing continued to receive the largest share of 36% of the FDI flows into the U.S., followed by wholesale trade (13%) and finance and insurance (10%), as shown in Figure 4.
Figure 1.
Data source: UNCTADstat.
471,792
277,258 253,561 246,215
2016 2017 2018 2019
FDI Inflows to the U.S.(USD at current prices in millions)

Page 5 of 24
Figure 2.
Data source: SelectUSA, Sources of FDI into the United States. Figure 3.
Data source: U.S. Bureau of Economic Analysis.
010,00020,00030,00040,00050,00060,00070,00080,00090,000
100,000110,000
EuropeanUnion
Canada Japan UnitedKingdom
Australia China
U.S. FDI Inflows from Selected Markets, 2018-2019 (millions of USD)
2018 2019
17%
16%
15%
9%
9%
7%
5%
5%
3%
2% 12%
Top Markets of FDI Flows into the U.S. in 2019
Germany Japan CanadaUK Bermuda AustraliaNetherlands Switzerland FranceUK Islands, Caribbean other

Page 6 of 24
Figure 4.
Data source: U.S. Bureau of Economic Analysis.
Not only had less foreign capital flown into the U.S. in 2019, the expenditures by the country’s foreign-owned businesses in activities of Merger & Acquisition (M&A), new establishment, and business expansions also went down by 37.7 percent from the 2018 value ($312.5 billion) to $194.7 billion. Figure 5 below illustrates that M&A of existing businesses remained its dominance by capturing 98 percent of the total expenditures of foreign-owned businesses, and among all Greenfield expenditures the amount to establish a new U.S. business was higher than that of expanding an existing foreign-owned U.S. business. This structure has been observed for the recent previous years. It’s worth noting that Greenfield expenditures are considered “new blood” to an economy and represent potential for growth in investment. For the U.S., most of the “new blood” was infused into the chemical manufacturing ($0.6 billion) and utilities ($0.5 billion) by FDI inflows from Japan ($1.1 billion) and Canada ($1.0 billion).x
0%
10%
20%
30%
40%
50%
60%
70%
80%
90%
100%
U.S. FDI Inflows by Major Industries in 2019
Depository Institutions
Wholesale Trade
Information
Real estate and rental andleasing
Professional, scientific, andtechnical services
Finance (except depositoryinstitutions) and insurance
Wholesale Trade
Other Industries
Total Manufacturing

Page 7 of 24
Figure 5.
Data source: U.S. Bureau of Economic Analysis.
New Hampshire: stable trade relationships and resilience of foreign-owned businesses In 2019, the state of New Hampshire exported 9.8 percent more merchandise goods compared to
2018 and reached $5.8 billion, highlighting the fourth consecutive annual growth. The state’s merchandise imports went down from its 2018 value by 15.7 percent to $10.5 billion. As shown in Figure 6, the merchandise trade deficit of New Hampshire declined to $4.7 billion in 2019, near its lowest value in 2016 ($4.5 billion) in the past five years. Figure 6.
Data source: Foreign Trade Division, U.S. Census Bureau.
97.9%
1.3%
0.8%
2.1%
Expenditures of Foreign-Owned Businesses in the U.S. 2019, by Type of Activities
M&A Establishment Expansion
$4,001,321,678 $4,143,394,613$5,147,759,964 $5,306,112,102 $5,828,604,755
$9,313,837,505$8,608,175,085
$11,349,717,595$12,489,255,667
$10,522,741,787
2015 2016 2017 2018 2019
New Hampshire Merchandise Goods Exports and Imports, 2015-2019
Exports Imports

Page 8 of 24
Figure 7 and Figure 8 illustrate the top trading partners of New Hampshire in exports and imports, respectively. In 2019, six markets (led by Germany, followed by Canada, Ireland, Mexico, and East Asia) each captured more than 5 percent of the state’s merchandise exports and in total they captured nearly 60 percent. The state imported over two thirds of its merchandise goods from six markets located in the North America, East Asia and Europe. It’s worth noting that New Hampshire maintained stable and strong trade relationships with its major partners: the Top 10 markets (from) to which New Hampshire (imported) exported merchandise remained stable from 2018 to 2019, except that the United Arab Emirates replaced Hong Kong who fell to the Number 12 of the state’s exports markets in 2019. Figure 7.
Data source: Foreign Trade Division, U.S. Census Bureau. Figure 8.
Data source: Foreign Trade Division, U.S. Census Bureau.
Germany17%
Canada15%
Ireland8%
Mexico7%Japan
6%
China5%
Netherlands4%
France3%
United Arab Emirates
3%
United Kingdom3%
Other29%
TO P M A R K E T S TO W H I C H N E W H A M P S H I R E E X P O R T M E R C H A N D I S E I N 2 0 1 9
Canada35%
China9%
Japan8%
Poland7%
Germany7%Mexico
3%
Israel3%
Viet Nam3%
United Kingdom3%
Italy2%
Other20%
TO P M A R K E T S F R O M W H I C H N E W H A M P S H I R E I M P O R T M E R C H A N D I S E I N 2 0 1 9

Page 9 of 24
Figure 9 and Figure 10 below rank the top 10 industries for New Hampshire’s merchandise exports
and imports by their share of the state total value, respectively. As both figures reveal, the state’s primary export industries and import industries stayed the same from 2018 to 2019. In 2018 the largest share (26 percent) of New Hampshire’s exports was in Computer and Electronic Products, followed by Transportation Equipment (19 percent). However, in 2019 these two industries switched places. The same pattern of change occurred in the state’s merchandise imports: in 2019 Transportation Equipment and Petroleum & Coal Products each captured 24 percent of the state total imports and thus ranked #1 with a tie, while the latter was almost double of the former (37 percent versus 20 percent) in 2018. Figure 9.
Data source: Office of Trade and Economic Analysis (OTEA), Industry and Analysis, International Trade Administration, U.S. Department of Commerce.
19
26
15
105 6
3 2 2 1
2623
1411
6 5 3 2 2 1
336--TRANSPO
RTATION
EQ
UIPM
ENT
334--COM
PUTER AN
D ELECTRO
NIC PRO
DUCTS
333--MACHIN
ERY; EXCEPT ELECTRICAL
325--CHEMICALS
335--ELECTRICAL EQ
UIPM
ENT; APPLIAN
CES &
COM
PON
ENTS
332--FABRICATED METAL
PRODU
CTS; NESO
I
339--MISCELLAN
EOU
S M
ANU
FACTURED
COM
MO
DITIES
326--PLASTICS & RU
BBER PRO
DUCTS
910--WASTE AN
D SCRAP
323--PRINTED M
ATTER AND
RELATED PRODU
CTS; NESO
I
2018-2019 Top 10 NAICS 3-Digit Industries of New Hampshire Merchandise Exports
(share of state total in percentage)
2018 2019

Page 10 of 24
Figure 10.
Data source: Office of Trade and Economic Analysis (OTEA), Industry and Analysis, International Trade Administration, U.S. Department of Commerce.
Different from the national situation of declined activities in 2019, the foreign-owned businesses in New Hampshire demonstrated resilience that favors the state’s globalization process. As shown in Table 1 below, their expenditures in activities of M&A, new establishment, and business expansions increased from $111 million in 2017 to $123 million in 2019. The investment activities by foreign-owned businesses created 1,000 jobs for New Hampshire in 2016 and since then the job creation number went down until 2019 when near 500 jobs were created by the FDI activities. Same with the national trend, M&A expenditures owned an absolute dominance over the Greenfield investment in the activities by foreign-owned businesses in the Granite State. Table 1. Expenditures by New Hampshire Foreign-Owned Businesses by Type of Activity, 2014-2019 (million USD)
YEAR EXPENDITURES M&A NEW ESTABLISHMENT EXPANSION 2019 123 (D) (*) (D) 2018 >2 (D) (*) 2 2017 111 111 (*) 0 2016 196 196 0 0 2015 (D) (D) 0 0 2014 (D) (D) 0 (D)
Notes: Data are from U.S. Bureau of Economic Analysis. (*) A nonzero value that rounds to zero. (D) Suppressed to avoid disclosure of data on individual companies.
20
37
8 84 4 3 2 1 2
24 24
9 85 5 3 3 3 2
336--TRANSPO
RTATION
EQ
UIPM
ENT
324--PETROLEU
M &
COAL
PRODU
CTS
333--MACHIN
ERY; EXCEPT ELECTRICAL
334--COM
PUTER AN
D ELECTRO
NIC PRO
DUCTS
339--MISCELLAN
EOU
S M
ANU
FACTURED
COM
MO
DITIES
316--LEATHER & ALLIED
PRODU
CTS
326--PLASTICS & RU
BBER PRO
DUCTS
332--FABRICATED METAL
PRODU
CTS; NESO
I
315--APPAREL M
ANU
FACTURIN
G
PRODU
CTS
335--ELECTRICAL EQ
UIPM
ENT; APPLIAN
CES &
COM
PON
ENTS
2018-2019 Top 10 NAICS 3-Digit Industries of New Hampshire Merchandise Imports
(share of state total in percentage)
2018 2019

Page 11 of 24
Table 2. Employment of Foreign-Owned Businesses Acquired, Established, and Expanded in New Hampshire, 2014-2019 (1,000 employees)
YEAR EMPLOYMENT M&A NEW ESTABLISHMENT EXPANSION 2019 A A 0.0 0.0 2018 0.1 0.1 (*) 0.0 2017 0.4 0.3 (*) 0.0 2016 1.0 1.0 0.0 0.0 2015 0.1 0.1 0.0 0.0 2014 0.9 0.8 0.0 0.1
Notes: Data are from U.S. Bureau of Economic Analysis. (*) Fewer than 50 employees. (A) 1-499 employees.
1.3 Escalation of globalization risks in the U.S. and New Hampshire before and during the COVID-19 pandemic
After entering the year of 2020, the shock from the COVID-19 pandemic to the global economy further escalated risks in the globalization process. COVID-19 first emerged in China in the late January, which contracted the world’s second largest economy’s GDP by 6.8 percent in the first quarter in comparison to the same time last year.xi The epicenter then shifted to the Europe and finally to the U.S. since the late March until today. The U.S. real GDP dropped by 5 percent in the first quarter and then suffered a cliff-like drop of 31.4 percent in the second quarter of 2020.xii A closer scrutiny of the components of the U.S. real GDP is presented in Figure 11 below. It reveals that in the first half of year 2020 the household consumption expenditures slowed down by the same pace with GDP, but the private domestic investment, which has been fluctuating across both the good and bad years, declined faster than GDP and dived to -46.6 percent in Q2. Behind the numbers of GDP decline was the fact that as responses to the spread of COVID-19, governments issued “stay at home” orders and distributed pandemic assistance payments to households and businesses, and businesses and schools switched to “work from home” or canceled operations. Consumers therefore canceled, restricted, or redirected their spending.xiii
In the third quarter of 2020, the U.S. real GDP increased by 33.4 percent, reflecting the nationwide efforts to reopen businesses and resume activities that were postponed or restricted due to COVID-19. The major contributing components for the growth of real GDP were personal consumer spending and private business investment spending, which went up by 41 percent and 86.3 percent, respectively. The leading industries that contributed to the third-quarter real GDP growth (ranked by the descending order) were: health care and social assistance; durable goods manufacturing; accommodation and food services; retail trade; and wholesale trade.xiv

Page 12 of 24
Figure 11.
Data source: U.S. Bureau of Economic Analysis.
Not only did the COVID-19 pandemic restrict America’s consumption spending on the domestic goods and services, it also significantly hampered both the demand and the transportation of goods and services across the borders. As illustrated in Figure 12 below, the U.S. total exports (imports) of goods and services dropped by 9.5 (15) percent in the first quarter as the travel bans started to kick off between the U.S., China and Europe, and then sharply fell by 64.4 (54.1) percent when the cross-border transportations of passengers and goods almost froze in the second quarter of 2020. In the third quarter, the U.S. remained the epicenter of the COVID-19 pandemic but many of its trade partners in Asia and Europe started to observe decreasing COVID cases and thus eased their restrictions on business activities. As these economies started to recover, their demand for American goods and services began to rise. Therefore, the U.S. exports of goods increased by 104.3 percent and service exports almost stopped the declining trend (-0.5 percent). Meanwhile, the U.S. imports of goods and services boosted by 110.2 percent and 24.9 percent, respectively, reflecting the increasing demand of both U.S. businesses for imported resources and parts, and U.S. households for imported goods, as the country continued to reopen its economy.xv
-50-40-30-20-10
0102030405060708090
2019Q1
2019Q2
2019Q3
2019Q4
2020Q1
2020Q2
2020Q3
Percentage Change in the U.S. Quarterly Real GDP 2019 Q1 - 2020 Q3
Real GDP
Personal consumption
Gross private domesticinvestment
Government consumptionand investment

Page 13 of 24
Figure 12.
Data source: U.S. Bureau of Economic Analysis.
The growth of the New Hampshire economy has been sluggish since the second quarter of 2019 and its real GDP growth remained around zero throughout 2019. As shown in Figure 13, the state’s economy responded to the COVID-19 pandemic by a 2.2 percent contraction in the first quarter and then a sharp contraction of 36.9 percent in the second quarter of 2020. This was due to the stay at home order that took effect on March 27 and expired on June 15. Since then, the Granite State joined other states to reopen its businesses and resume its economic activities. Its economy grew by 40.9 percent in the third quarter, a pace that was ranked Number 8th among all states. A scrutiny of industries that contributed to the third-quarter New Hampshire real GDP growth is illustrated in Figure 14. The state followed the national trend in terms of the leading five industries, but differed from the rank of the top three industries. New Hampshire’s leading five industries were (ranked by the descending order): accommodation and food services; health care and social assistance; durable goods manufacturing; retail trade; and wholesale trade.
-70-60-50-40-30-20-10
0102030405060708090
100
2019 Q1
2019 Q2
2019 Q3
2019 Q4
2020 Q1
2020 Q2
2020 Q3
Percentage Change in the U.S. Exports and Imports 2019 Q1 -2020 Q3
Exports Imports

Page 14 of 24
Figure 13.
Data source: U.S. Bureau of Economic Analysis Figure 14.
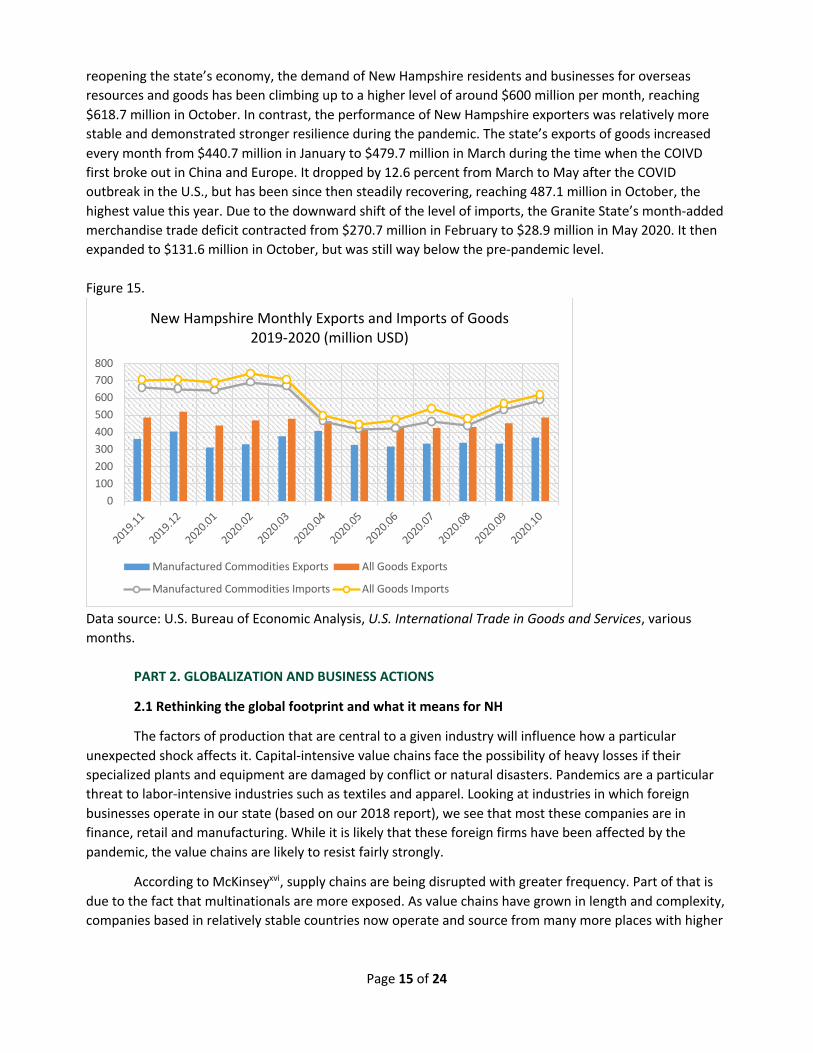
The New Hampshire imports of goods followed the declining path of the state’s real GDP: as shown in Figure 15, the downward trend of imports started in February 2020 and the sharpest drop occurred in April immediately after the issuance of the stay at home order as a response to the COVID-19 outbreak. This seems to have triggered a downward shift of the state’s imports of goods from around $700 million per month between November 2019 and March 2020, to around $500 million per month since April 2020 and throughout the summer. Starting in the third quarter, especially since August, within the context of
0.9 1.6 -1.58.2
-2.8 0.3 -0.5 -2.2
-36.9
40.9
-50-40-30-20-10
01020304050
2018:Q1-:Q
2
2018:Q2-:Q
3
2018:Q3-:Q
4
2018:Q4-2019:Q
1
2019:Q1-Q
2
2019:Q2-Q
3
2019:Q3-Q
4
2019:Q4-2020:Q
1
2020:Q1-Q
2
2020: Q2-Q
3
New Hampshire Real GDP Quarterly Percentage Change, 2018-2020
7.45
1.751.871.921.992.393.61
6.31
6.40
7.15
Contributions to Percent Change in New Hampshire Real GDP in Third Quarter of 2020, by Industry
Other
Administrative and
support and waste
managem
ent and rem
ediation services
Government and
government
enterprises
Professional, scientific, and technical services
Finance and insurance
Wholesale trade
Retail trade
Durable goods m
anufacturing
Health care and social assistance
Accomodation and
food services
Page 15 of 24
reopening the state’s economy, the demand of New Hampshire residents and businesses for overseas resources and goods has been climbing up to a higher level of around $600 million per month, reaching $618.7 million in October. In contrast, the performance of New Hampshire exporters was relatively more stable and demonstrated stronger resilience during the pandemic. The state’s exports of goods increased every month from $440.7 million in January to $479.7 million in March during the time when the COIVD first broke out in China and Europe. It dropped by 12.6 percent from March to May after the COVID outbreak in the U.S., but has been since then steadily recovering, reaching 487.1 million in October, the highest value this year. Due to the downward shift of the level of imports, the Granite State’s month-added merchandise trade deficit contracted from $270.7 million in February to $28.9 million in May 2020. It then expanded to $131.6 million in October, but was still way below the pre-pandemic level. Figure 15.
Data source: U.S. Bureau of Economic Analysis, U.S. International Trade in Goods and Services, various months.
PART 2. GLOBALIZATION AND BUSINESS ACTIONS
2.1 Rethinking the global footprint and what it means for NH
The factors of production that are central to a given industry will influence how a particular unexpected shock affects it. Capital-intensive value chains face the possibility of heavy losses if their specialized plants and equipment are damaged by conflict or natural disasters. Pandemics are a particular threat to labor-intensive industries such as textiles and apparel. Looking at industries in which foreign businesses operate in our state (based on our 2018 report), we see that most these companies are in finance, retail and manufacturing. While it is likely that these foreign firms have been affected by the pandemic, the value chains are likely to resist fairly strongly.
According to McKinseyxvi, supply chains are being disrupted with greater frequency. Part of that is due to the fact that multinationals are more exposed. As value chains have grown in length and complexity, companies based in relatively stable countries now operate and source from many more places with higher
0100200300400500600700800
2019.11
2019.12
2020.01
2020.02
2020.03
2020.04
2020.05
2020.06
2020.07
2020.08
2020.09
2020.10
New Hampshire Monthly Exports and Imports of Goods 2019-2020 (million USD)
Manufactured Commodities Exports All Goods Exports
Manufactured Commodities Imports All Goods Imports

Page 16 of 24
risk profiles. The previous era of globalization created intricately interconnected supply chains, data flows, financial flows, people flows, and idea flows—all of which offer more “surface area” for risk to penetrate.
Our 2018 report showed that the majority (31%) of foreign manufacturers of durable goods are making computer and electronic products. The McKinsey investigation finds that this industry relies on global innovations. But other industries where NH foreign manufacturers are significantly represented (such as fabricated metal products, 9% of foreign manufacturers) are relying on regional processing. For non-durable goods, NH foreign manufacturers are represented more extensively in chemicals (around 50%), an industry with declining global innovation reliance, and also in food and beverage (27%), an industry with expanding but still predominantly regional supply chains. These data may indicate that supply chains that NH foreign firms are part of are more resilient to disruption.
Also reported in the same McKinsey study, in a 2019 survey of global executives, almost 16% percent recognized transportation as a top cause of supply chain disruptions. The regionalization of trade and supply chains may mitigate transportation and logistics vulnerabilities. This study also shows that the trade occurring in the same region has been on an increase since 2012, with intraregional representing more than half of trade in Asia and Europe. Regional trade typically happens in automotive, chemicals, and food and beverage. Some electronics sector firms have regional supply chains. New Hampshire is uniquely positioned for trade and supply chain networks with Canada, and a key location for regionalization of such networks.
An EY articlexvii noted, based on a survey, that 45% of executives are currently re-evaluating supply chains. The article concluded that the next year will be marked by “changes to the supply chain, industry consolidation and a smaller manufacturing footprint.” Even before the pandemic, only 13% of globally traded goods are exported from low-wage to high-wage countries, as referenced by McKinsey. This suggests that companies are no longer seeking low cost locations for their operations. Factors such as access to skilled workforce, access and proximity to markets, the overall business environment and being part of the supplier ecosystem outweigh the labor and other low cost considerations. The flow of data plays an important role in this development. Given the border proximity and the presence of foreign companies in key sectors, including manufacturing and high-tech, New Hampshire should benefit from regionalization, as more companies are aiming to increase the resilience of their supply chains and limit the high cost of disruptions.
2.2 New realities of resilience in supply chains
In a recent reportxviii, a McKinsey Global Institute examination concludes that companies operating and integrating in cross-border supply chains do not have to sacrifice efficiency and have options for strengthening value chain and supply chain resilience. Policymakers and company executives will have to act on becoming more agile and innovative to create and take advantage of options to limit disruption.
The COVID-19 pandemic had led to the idea that companies could shift to more domestic or geographically-close production and sourcing. The McKinsey report estimates that “production of some 16 to 26 percent of global trade, worth $2.9 trillion to $4.6 trillion, could move across borders in the medium term” as a “combination of reverting to domestic production, nearshoring, and shifting to different offshore locations.” Moving the physical footprint of supply chains is one of the options for building resilience. COVID-19 seems to be the latest impetus for the regionalization of trade and production networks and the focus on proximity to consumers. The same report identifies other ways in which companies can build resilience, such as: improving transparency, building more redundancy into supplier networks, and increasing safety stocks of inventory.

Page 17 of 24
Decisionmakers in New Hampshire can contribute to the creation of resilient supply chains. The proximity to Canada means that our state is positioned to offer not only closeness to U.S. markets for Canadian companies, but also a corridor for gaining proximity to a more localized supply chain network. As shown in our first globalization report, foreign manufacturing and wholesale businesses hold a significant proportion in the overall foreign business activity (over 30% in 2018). Strong international business presence in electronics and machinery could be used to promote New Hampshire to potential supply chain partners in these industries. The growing and innovative life sciences sector presents good prospects for attracting new international business. The IT sector development could also benefit from inflow and outflow of foreign direct investment. As indicated in a different section of this report, a few projects this year illustrate expansion efforts in these sectors despite the pandemic.
New Hampshire decision- and policymakers could prioritize the seamless flow of data as another way to increase the resilience of supply chains for companies doing business in the state or with local or foreign firms. The strength of the higher education state system could be a vehicle for developing models for transparency, analytics and digital platforms. Strong wired and wireless capabilities in the entire state geography could be a determining factor for promoting resilience.
As more companies are building more redundancy into supplier networks, the time may be ideal for promoting our state to foreign businesses looking to regionalize their supply chains in proximity to the U.S. markets. As the McKinsey report mentioned above concludes: “The ability to reroute components and flex production dynamically across sites can keep production going in the wake of a shock.” New Hampshire’s geographical location creates a passageway to lucrative markets on the East Coast. Added benefits and opportunities to both investing firms and the state could be reducing carbon intensity, raising environmental and labor standards, and expanding opportunities for women- and minority-owned businesses.
PART 3. FOREIGN FIRMS’ ACTIVITIES IN NEW HAMPSHIRE DURING THE COVID-19 PANDEMIC
Despite the lower than normal levels of business activity during the pandemic, foreign firms engaged in a number of noteworthy projects and activities with a significant meaning for our state. We reviewed business activity involving foreign businesses in New Hampshire from the start of the pandemic (mid-March, 2020) to the end of the year 2020. Most activities were in electronics, information technology and financial services. Some activities also took place in the energy and life sciences sectors. The tables below show a few defining features of these initiatives.
Table 3. Key foreign business activity during the COVID pandemic � 25 Notable investment and expansion projects or activities were initiated by or involved
foreign firms � 5 Acquisitions involved foreign and NH-based companies � 7 Production or service expansion investments or new contracts � 10 Distribution agreements or actions connected foreign and NH-based companies � 3 New Product launch and supply chain action
Table 4. By the numbers: scale and impact of foreign firms’ activities
� More than 1/2 of the expansion agreements are multiyear arrangements � Each acquisition is valued at more than $100 million � At least 25% of agreements are specifically related to supply chain management

Page 18 of 24
Motives for investment
The motivations behind New Hampshire business activities involving foreign firms during the pandemic appeared to have been the same as in other times. While the pandemic has hindered and at some point, even stopped business operations in the state, strategic initiatives continued to be in play. The rationales listed below show a variety of purpose and large scale, multiple year commitments:
• Foreign companies’ access to the local market and market reach in the region appeared to have been a determinant motivation for five of the activities. In four of the instances, agreements with foreign companies allowed New Hampshire companies to expand their distribution outside the state or the U.S. Interactions between foreign and local firms not only strengthened the market position of the foreign companies but also gave domestic companies access to international markets. In all cases, the new initiatives this year offer entrance into significant markets in terms of scale and direct applicability of the companies’ competencies.
• In all acquisition cases, the purchase added to the company’s market segments, new products and capabilities. In most cases, foreign NH and non-NH companies acquired U.S. companies. In two of the instances, the purchase was a direct acquisition of a local company by a foreign company looking to operate in our state.
• The majority of expansion and other activities added to the initiating company’s portfolio of products and innovations. In some cases, the initiatives complemented existing product lines and opened more possibilities for commercialization of innovations.
• Actions determined to strengthen the supply chain were accompanied by clear goals of improving networking and pulling more or specific product types through the chain.
• All initiatives involving investments would be defined as strategic- e.g., long term actions to establish operations in New Hampshire; U.S. firm acquiring foreign assets in order to gain considerably more market power in the U.S. market; foreign company operating in NH acquiring companies for specific strategic purposes.
• About one-third of the business actions in our state are direct outcomes of foreign business strategies to access or expand reach into the U.S., initiated or accompanied by contracts or investments in other states.
Key direct investor during the pandemic
BAE Systems distinguished itself as a key foreign direct investor during the pandemic. This company received a number of production and funding contracts, continued to work closer with its suppliers, and engaged in acquisitions. The activities involved U.S. or NH entities. New projects and expansion actions are significant financially and expand over a number of years in the future. This company also continues to be awarded contracts from the government. This year’s activities appear to show products integration and innovation.
Origins of activities and projects
The origins of companies engaged in activities with local firms are diverse, despite the pandemic conditions and the relatively reduced intensity of business activity. Countries we identified previously as sources of direct investment inflows (Canada, UK, European countries) are represented in the synthesis shown below.

Page 19 of 24
Table 5. Partnerships, acquisitions and contracts involving NH and foreign businesses
Companies from the following countries initiated activities that involved NH firms:
NH companies initiated activities that involved foreign firms from the following countries:
� Canada: 4 � Denmark: 1 � France: 1 � Germany: 1 � Russia: 1 � South Korea: 1 � Sweden: 2 � UK: 8
� Ireland: 1 � Israel: 1 � Nigeria: 1 � Switzerland: 1
New investments versus existing investments
As detailed in the table below, foreign firms’ activities were new contracts, projects and investments, projects and investments with existing partners or use/expansion of current facilities. The activities counted are not mutually exclusive. Each instance represents an activity in which a foreign company was engaged during the pandemic, either on its own or in partnership with another company (NH, US or non-US based). One instance may represent more than one classification in the new or existing category.
Table 6. New versus existing investments of foreign firms in NH or with NH businesses
New Existing
� New investments or contracts for expansion of distribution in NH or access to NH and markets in the Northeast: 8
� New investments or contracts for NH firms’ expansion of distribution internationally: 6
� New acquisitions: 5
� Existing capacity use or expansion: 7
� Strengthening of existing business partnership: 1
� New contracts with existing partners: 4
Foreign direct investments and activities with NH ties: national versus regional versus state versus international
The business activity involving foreign firms in NH was generated mostly by actions targeting U.S. expansion or increase in market presence. International reach of companies also generated activities in our state. To a lesser extent, activity involving foreign firms in NH was part of local or regional business moves.
Table 7. The scope of FDI and FDI or supply chain related activities affecting NH
� Investments and activities focused on the state of NH: 3 � Investments and activities for the New England region or the East Coast: 5 � Investments and activities at U.S. national scale: 8 � Investments and activities aimed at international (outside US) expansion: 9

Page 20 of 24
PART 4. REGULATION AND GOVERNMENT ACTIONS THAT IMPACT FDI AND FOREIGN BUSINESS ACTIVITIES
4.1 Federal policy and FDI regulations
Our report could not be complete without a brief note on recent developments in federal policy and expanded regulations applied to foreign direct investment. Recent regulations address scrutiny of projects that give foreign companies from certain countries control over domestic businesses in some sectors. We provide a brief comparative overview below, with the goal of informing readers and business and development professionals on these specific actions and their importance for recruiting foreign direct investors and expanding FDI.
Since its inception in 1975, the Committee on Foreign Investment in the U.S. (CFIUS), chaired by the Secretary of the Treasury, has been authorized to review foreign investment transactions that pose a threat to national security. Although the concept of national security has been shifting in a dynamic global economy, fillings for CFIUS reviews were voluntary and the review process was typically not triggered unless an M&A led to foreign "control" of a U.S. business. However, a tendency toward tightened regulations on FDI emerged since 2017 within the context of the increasing geopolitical and technological ambitions of Chinese investments behind which the state-owned firms are suspiciously playing active roles. This gave birth to the Foreign Investment Risk Review Modernization Act of 2018 (FIRRMA), which was signed by President Trump into law on August 13, 2018. The CFIUS regulations implementing FIRRMA took effect on February 13, 2020.
Table 8 below compares the conditions in CFIUS regulations before and after the implementation of FIRRMA. The differences introduced by FIRRMA significantly expanded the jurisdiction of CFIUS and made the FDI application, screening and supervision more restrictive than the past decades. CFIUS applies to FDI from certain countries including China. As a consequence, the investment recruiting efforts both at the federal level by SelectUSA and at the local level by states’ international commerce officials would need to be cautious about FDI project proposals aiming to control (or even non-control) a U.S. business in the fields of critical technology, infrastructure and data (TID) that were initiated from the non-excepted foreign states and investors. The processing timeline and costs are also extended.
Table 8. Comparison of CFIUS regulations before and after FIRRMA.xix
Items Before FIRRMA After FIRRMA Conditions to Trigger CFUIS Reviews
Result in foreign "control" of a U.S. business (“controlling” FDI) and pose a threat to U.S. national security.
“Non-controlling” FDI in U.S. businesses involved in certain critical technologies, critical infrastructure, or the personal data of U.S. nationals (referred to as TID businesses).
Real Estate Transactions Not covered Covered if: (i) located within or functioning as part of a "covered port" (either airport or maritime port), (ii) located within close proximity of military installations and other government facilities, etc.
Page 21 of 24
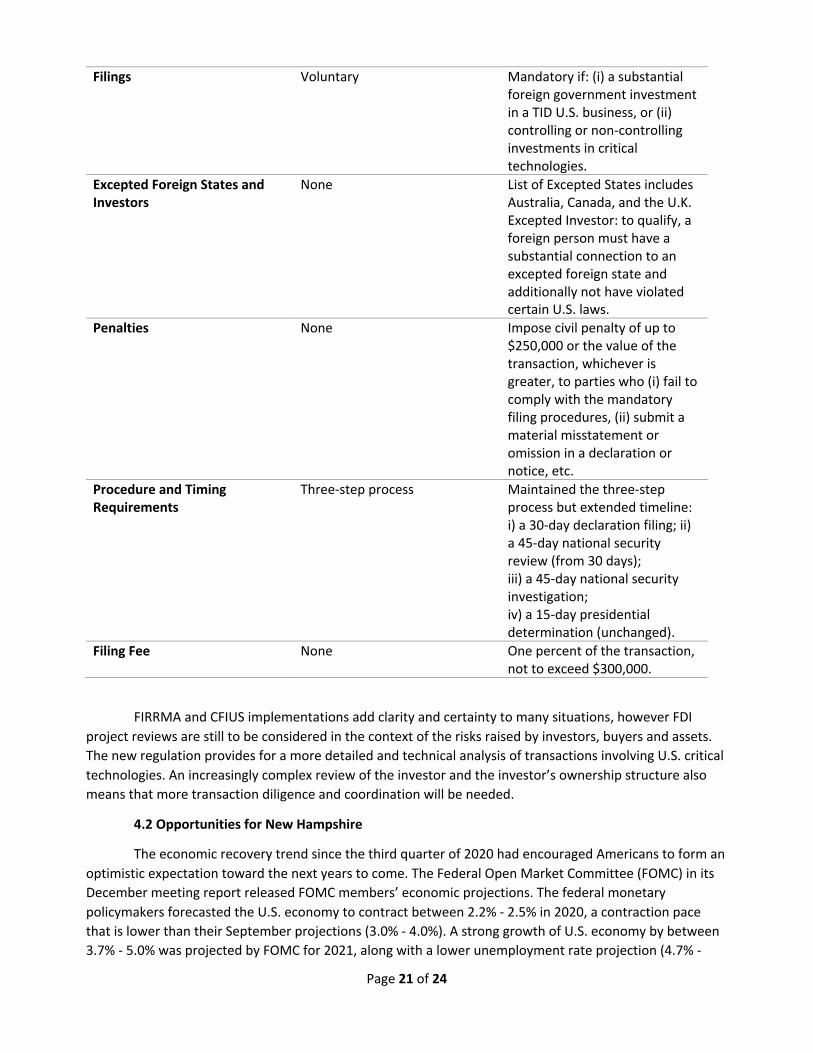
Filings Voluntary Mandatory if: (i) a substantial foreign government investment in a TID U.S. business, or (ii) controlling or non-controlling investments in critical technologies.
Excepted Foreign States and Investors
None List of Excepted States includes Australia, Canada, and the U.K. Excepted Investor: to qualify, a foreign person must have a substantial connection to an excepted foreign state and additionally not have violated certain U.S. laws.
Penalties None Impose civil penalty of up to $250,000 or the value of the transaction, whichever is greater, to parties who (i) fail to comply with the mandatory filing procedures, (ii) submit a material misstatement or omission in a declaration or notice, etc.
Procedure and Timing Requirements
Three-step process Maintained the three-step process but extended timeline: i) a 30-day declaration filing; ii) a 45-day national security review (from 30 days); iii) a 45-day national security investigation; iv) a 15-day presidential determination (unchanged).
Filing Fee None One percent of the transaction, not to exceed $300,000.
FIRRMA and CFIUS implementations add clarity and certainty to many situations, however FDI project reviews are still to be considered in the context of the risks raised by investors, buyers and assets. The new regulation provides for a more detailed and technical analysis of transactions involving U.S. critical technologies. An increasingly complex review of the investor and the investor’s ownership structure also means that more transaction diligence and coordination will be needed.
4.2 Opportunities for New Hampshire
The economic recovery trend since the third quarter of 2020 had encouraged Americans to form an optimistic expectation toward the next years to come. The Federal Open Market Committee (FOMC) in its December meeting report released FOMC members’ economic projections. The federal monetary policymakers forecasted the U.S. economy to contract between 2.2% - 2.5% in 2020, a contraction pace that is lower than their September projections (3.0% - 4.0%). A strong growth of U.S. economy by between 3.7% - 5.0% was projected by FOMC for 2021, along with a lower unemployment rate projection (4.7% -

Page 22 of 24
5.4%) and a moderate inflation rate projection (1.6% - 1.9%). All indicators pointed to a thriving macroeconomic environment for businesses in the U.S.xx
A recent articlexxi bets on a resetting of business-government relations, with higher expectations of integration between the public and the private arenas, if locations are to solve problems and take advantage of opportunities. Both sides will have to work on changing operations in order to adapt and gain resilience. Our state is likely to benefit from such a collaboration, with priorities on streamlining supply chains, increasing agility, reducing operational risk and boosting market access. In 2019, New Hampshire ranked second in the “Best States” rankingxxii, with very high scores for safety, opportunity and education. These aspects give our state an edge for supporting resilient business development and for attracting foreign direct investment that reinforces stability and sustainability. The timing may be opportune for our state’s leading professionals. Analystsxxiii note that, looking ahead, global and international businesses and professionals look to reshape their business portfolios, reflect on partnerships and plan to change how they do things.
As we show in our review of the most recent business thinking, several accounts note that, in order to build resilience in supply chains, in the near future multinational companies will aim to make them shorter, more domestic, and more diversified. Nevertheless, before approaching the redesign of global supply chains, executives and policymakers will need to identify the actual issues faced in each particular situation and the policies that can address them. New opinionsxxiv suggest that there is little support for the idea that reshoring improves the resilience of supply chains, noting that highly concentrated production leads to vulnerabilities, and supplier diversification redundancies in inventory and production capacity are costly. The authors of such opinions state that supply chain re-localization may not be the main approach to mitigate the post-COVID uncertainty. They give examples of multinational companies that have used their network to relocate production during the pandemic, thus taking advantage of operating in multiple markets. They also identify that new business models rely on agility and adaptation, and are based on dynamic capabilities. Rather than rethinking supply chains, decisionmakers would be better served to consider the kind of location advantages they need, domestically and overseas.
The ideas we reviewed in our report show a plurality of possibilities now that the vulnerabilities of international supply chains and globalization have been exposed by the pandemic. It is expected that not only foreign firms will be under pressure to resolve the issues revealed, but also governments.
While we believe that supply chains and market operations will have to be given significant consideration, we suggest that the generation of flexibility and agility as dynamic capabilities will be a priority for foreign firms in the near future. A platform for dialogue between foreign firms and public institutions could serve as a space where dynamic capabilities can be explored and developed. Such a platform could be a place for networking, communication and collaborations among foreign firms and local entities, encouraging firms to exchange ideas for resilience. Dialogue would allow firms and local governments to cooperate and be better prepared for risks. Support for networking can be found in business literature, with a current studyxxv identifying how subnational governments have been increasing their profile and level of cooperative activity. The authors of this study argue that firms and governments co-evolve and create the basis for sustainable economic growth. Multinational enterprises can be positioned as international knowledge integrators. Innovation and resilience in the future are likely to be the result of systematic knowledge-based interactions among the private and public sectors, combining local and international intelligence.
The way of the future is for foreign firms to embed in established local networks and to build new relationships and connections that did not exist previously. Foreign subsidiaries that are already local

Page 23 of 24
centers of excellence or knowledge can champion or share resilience and agility actions. This platform could also serve the role of disseminating know-how in more peripheral locations, outside areas where innovation, manufacturing and knowledge-intensive service activities are concentrated. The post-pandemic recovery and local economic development is tied to the development of new governance arrangements involving a broad coalition of local governments, foreign and domestic firms and other stakeholders, in a process of co-evolution and intentional progress.
ENDNOTES
i Assche and Lundan (2020), From the editor: COVID-19 and international business policy, in Journal of International Business Policy, Vol. 3, No. 3. https://doi.org/10.1057/s42214-020-00065-7 ii Assche and Lundan (2020), From the editor: COVID-19 and international business policy, in Journal of International Business Policy, Vol. 3, No. 3. https://doi.org/10.1057/s42214-020-00065-7 iii Kobrin (2020), How globalization became a thing that goes bump in the night, in Journal of International Business Policy, Vol. 3, No. 3. https://doi.org/10.1057/s42214-020-00060-y iv As described by Kobrin (2020), How globalization became a thing that goes bump in the night, in in Journal of International Business Policy, Vol. 3, No. 3. https://doi.org/10.1057/s42214-020-00060-y v Congressional Research Service, U.S. Trade Debates: Select Disputes and Actions, updated December 10, 2020. https://crsreports.congress.gov/product/pdf/IF/IF10958 vi The U.S. International Trade Commission, WTO dispute settlement cases to which the United States was a party, developments in 2019. https://www.usitc.gov/publications/332/appendixa.html vii The U.S. International Trade Commission, NAFTA Chapter 19 substantive challenges to original and five-year review determinations of USITC and USDOC, developments in 2019. https://www.usitc.gov/publications/332/appendixa.html viii The U.S. International Trade Commission, U.S. merchandise trade with the world, 2015-19. https://www.usitc.gov/publications/332/tradebalance.html ix United Nations Conference on Trade and Development, Global investment flows flat in 2019, moderate increase expected in 2020. https://unctad.org/en/pages/newsdetails.aspx?OriginalVersionID=2274 x U.S. Bureau of Economic Analysis, New Foreign Direct Investment in the United States, 2019. https://www.bea.gov/news/2020/new-foreign-direct-investment-united-states-2019 xi Source: National Data, National Bureau of Statistics of China. xii The quarterly percent changes are seasonally adjusted and displayed at annual rates throughout this study, unless otherwise specified. xiii U.S. Bureau of Economic Analysis, Gross Domestic Product (Third Estimate), Corporate Profits (Revised), and Gross Domestic Product by Industry, Second Quarter of 2020. https://www.bea.gov/sites/default/files/2020-09/tech2q20_3rd.pdf xiv U.S. Bureau of Economic Analysis, Gross Domestic Product (Third Estimate), Corporate Profits (Revised), and Gross Domestic Product by Industry, Third Quarter of 2020. https://www.bea.gov/news/2020/gross-domestic-product-third-estimate-corporate-profits-revised-and-gdp-industry-third xv U.S. Bureau of Economic Analysis, Gross Domestic Product (Third Estimate), Corporate Profits (Revised), and Gross Domestic Product by Industry, Third Quarter of 2020. https://www.bea.gov/news/2020/gross-domestic-product-third-estimate-corporate-profits-revised-and-gdp-industry-third xvi McKinsey Global Institute (2020), Risk, resilience, and rebalancing in global value chains, accessed at https://www.mckinsey.com/business-functions/operations/our-insights/risk-resilience-and-rebalancing-in-global-value-chains xvii Gale, D. (2020), Why resilience is the antidote to crisis for manufacturing executives, 2020 Advanced manufacturing M&A report, accessed at https://www.ey.com/en_us/ccb/advanced-manufacturing-mergers-acquisitions

Page 24 of 24
xviii McKinsey Global Institute (2020), Risk, resilience, and rebalancing in global value chains, accessed at https://www.mckinsey.com/business-functions/operations/our-insights/risk-resilience-and-rebalancing-in-global-value-chains xix Table was constructed by the authors based on information from Tzinova, A & Bisk, C. (2020, February 13). New CFIUS Regulations Finally Take Effect. https://www.hklaw.com/en/insights/publications/2020/02/new-cfius-regulations-finally-take-effect#:~:text=Regulations%20implementing%20the%20Foreign%20Investment,in%20the%20U.S.%20(CFIUS). xx U.S. Federal Open Market Committee, December 16, 2020: FOMC Projections materials, accessible version. https://www.federalreserve.gov/monetarypolicy/fomcprojtabl20201216.htm xxi Weidemeyer, F. (2020), COVID-19: Which critical choices should businesses make next?, accessed at https://www.ey.com/en_us/long-term-value/covid-19-critical-choices-businesses-should-make xxii U.S. News, Best States, accessed at https://www.usnews.com/news/best-states/new-hampshire xxiii McKinsey Global Institute (2020), The future of business: Reimagining 2020 and beyond, accessed at https://www.mckinsey.com/featured-insights/the-next-normal/business-in-2020-and-beyond xxiv In particular, Miroudot, S. (2020), Reshaping the policy debate on the implications of COVID-19 for global supply chains. Journal of International Business Policy, Vol. 3, No. 4. https://doi.org/10.1057/s42214-020-00074-6 xxv Lundan, S., Cantwell, J. (2020), The local co-evolution of firms and governments in the Information Age. Journal of International Business Studies, Vol. 51, No. 9. https://doi.org/10.1057/s41267-020-00373-3

plymouth.edu
Dr. Roxana Wright ’01MBAProfessor of Management, Plymouth State [email protected]
Dr. Chen WuAssociate Professor of Economics,
Plymouth State [email protected]
