cpi detailed report - fraser · u.s. department of labor alexis m. herman, secretary data for...
TRANSCRIPT
CPI Detailed Report
Digitized for FRASER http://fraser.stlouisfed.org/ Federal Reserve Bank of St. Louis
U.S. DEPARTMENT OF LABOR Alexis M. Herman, Secretary
Data for February 1999
BUREAU OF LABOR STATISTICS Katharine G. Abraham, Commissioner
The CPI Detailed Report (ISSN 0095-926X; USPS 485-030) is a monthly report on consumer price movements, including statistical tables and technical notes. The report covers two indexes— the Consumer Price Index for All Urban Consumers (CPI-U) and the Consumer Price Index for Wage Earners and Clerical Workers (CPI-W). The indexes reflect data for the U.S. city average and selected areas.
A subscription may be ordered for 1 or 2 years from: New Orders, Superintendent of Documents, P.O. Box 371954, Pittsburgh, PA 15250-7954 or by calling (202) 512-1800. Visa or MasterCard accepted. Fax (202) 512-2233. Subscription price per year: $27 domestic, $33.75 foreign. Single copy domestic, $12.00; foreign, $15.00. Prices are subject to change by the U.S. Government Printing Office.
Send correspondence on subscription m atters, including address changes and missing issues, to the Superintendent of Documents, U.S. Government Printing Office, Washington, DC 20402, or telephone (202) 512-1806. POSTMASTER: Send address changes to CPÌ Detailed Report, U.S. Government Printing Office, Washington, DC 20402.
For technical inform ation, call the CPI Information and Analysis Office at (202) 606-7000, or write to Consumer Price Indexes, 2 Massachusetts Avenue, NE, Room 3615, Washington, DC 20212-0001.
CPI MAILGRAM provides selected U.S. City Average data for CPI-U and CPI-W within 24 hours of release. Order from: National Technical Information Service, 5285 Port Royal Road, Springfield, VA 22161. Subscription rates: $145 in contiguous U.S. and Hawaii; $160 in Alaska and Canada.
Material in this publication is in the public domain and, with appropriate credit, may be reproduced without permission. This information is available to sensory impaired individuals upon request. Voice phone: (202) 606-STAT; Federal Relay Service: 1-800-877-8339. Data on the CPI can also be accessed at http://stats.bIs.gov/cpihome.htm through the CPI homepage. Periodicals postage paid at Washington, DC and at additional mailing offices.
April 1999
Digitized for FRASER http://fraser.stlouisfed.org/ Federal Reserve Bank of St. Louis
CPI Detailed Report Data for February 1999
Editors Todd Wilson Monica Gabor
Visual Information Specialist Cornita Alston
Contents page
Price movements, February 1999 .......................................................................... 1CPI-U 12-month changes........................................................................................ 3Consumer Price Index formula changed ............................................................. 4Scheduled updates for expenditure weights in the C P I.................................... 5Technical n o te ............................................................................................................ 114
Index tables CPI-U
Table Page
U.S. city averageExpenditure categories; commodity, service groups..................................... 1 7Seasonally adjusted expenditure categories;
commodity, service groups............................................................................. 2 9Detailed expenditure categories........................................................................ 3 11Seasonally adjusted detailed expenditure categories..................................... 4 18Special detailed categories................................................................................. 5 25Historical
All items, 1913-present...................................................................................... 24 73Commodity and service groups and detailed
expenditures, indexes..................................................................................... 25 75Commodity and service groups and detailed
expenditures, percent change from previous December........................ 26 82
Selected areasAll items indexes.................................................................................................. 10 43R egions.................................................................................................................... 11 44Population c lasses................................................................................................. 12 46Regions and population classes cross-classified............................................ 13 48Food at home expenditure categories............................................................... 14 52Areas priced monthly: percent changes over the m onth .............................. 15 53City indexes and percent changes..................................................................... 16 54
CPITable
6
78 9
27
28
29
17181920 21 22 23
Page
27
293137
89
91
97
5859 61 636768 69
Digitized for FRASER http://fraser.stlouisfed.org/ Federal Reserve Bank of St. Louis
Contents—ContinuedCPI-U
Table Page
Average price tables
U.S. city average Energy
Residential p ric e s ................................................................................................ ................. PI 103Residential unit and consumption ranges...................................................... ................. P2 104G aso lin e .................................................................................................................................. P3 105
Retail food............................................................................................................... ................. P4 106
Old series tables
U.S. city average, expenditure categories; commodity, service groupsusing a Laspeyres E stim ator............................................................................... 1 (LAS) 108
Selected areas, all items index using a Laspeyres Estim ator........................... 3(LAS) 112
Scheduled Release DatesConsumer Price Index data are scheduled for initial release on the following dates:
Index month Release date Index month Release date
March April 13 June July 15
April May 14 July August 17
May June 16 August September 15
CPI-W Table Page
2(LAS) 110 4(LAS) 113
Digitized for FRASER http://fraser.stlouisfed.org/ Federal Reserve Bank of St. Louis
Price Movements February 1999
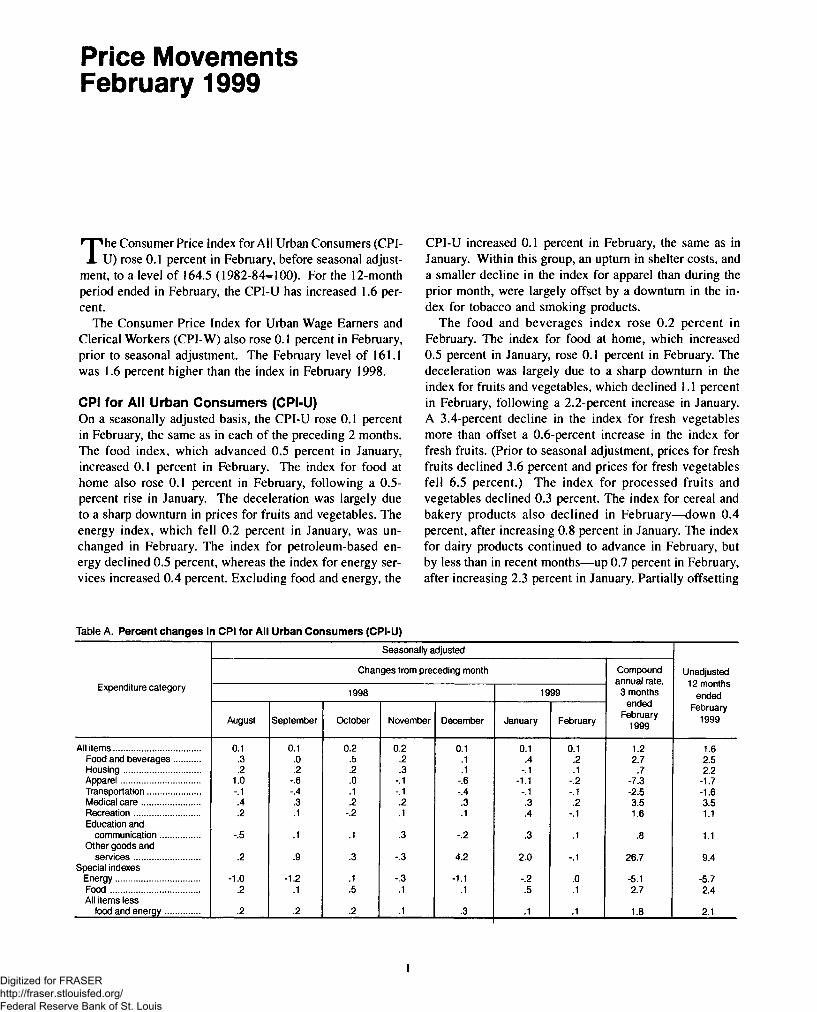
T he Consumer Price Index for All Urban Consumers (CPI- U) rose 0.1 percent in February, before seasonal adjust
ment, to a level of 164.5 (1982-84*100). For the 12-month period ended in February, the CPI-U has increased 1.6 percent.
The Consumer Price Index for Urban Wage Earners and Clerical Workers (CPI-W) also rose 0.1 percent in February, prior to seasonal adjustment. The February level of 161.1 was 1.6 percent higher than the index in February 1998.
CPI for All Urban Consumers (CPI-U)On a seasonally adjusted basis, the CPI-U rose 0.1 percent in February, the same as in each of the preceding 2 months. The food index, which advanced 0.5 percent in January, increased 0.1 percent in February. The index for food at home also rose 0.1 percent in February, following a 0.5- percent rise in January. The deceleration was largely due to a sharp downturn in prices for fruits and vegetables. The energy index, which fell 0.2 percent in January, was unchanged in February. The index for petroleum-based energy declined 0.5 percent, whereas the index for energy services increased 0.4 percent. Excluding food and energy, the
CPI-U increased 0.1 percent in February, the same as in January. Within this group, an upturn in shelter costs, and a smaller decline in the index for apparel than during the prior month, were largely offset by a downturn in the index for tobacco and smoking products.
The food and beverages index rose 0.2 percent in February. The index for food at home, which increased 0.5 percent in January, rose 0.1 percent in February. The deceleration was largely due to a sharp downturn in the index for fruits and vegetables, which declined 1.1 percent in February, following a 2.2-percent increase in January. A 3.4-percent decline in the index for fresh vegetables more than offset a 0.6-percent increase in the index for fresh fruits. (Prior to seasonal adjustment, prices for fresh fruits declined 3.6 percent and prices for fresh vegetables fell 6.5 percent.) The index for processed fruits and vegetables declined 0.3 percent. The index for cereal and bakery products also declined in February— down 0.4 percent, after increasing 0.8 percent in January. The index for dairy products continued to advance in February, but by less than in recent months— up 0.7 percent in February, after increasing 2.3 percent in January. Partially offsetting
Table A. Percent changes in CPI for All Urban Consumers (CPI-U)Seasonally adjusted
Expenditure category
Changes from preceding month Compound annual rate,
3 months ended
February 1999
Unadjusted 12 months
ended1998 1999
August September October November December January FebruaryFebruary
1999
All item s.................................... 0.1 0.1 0.2 0.2 0.1 0.1 0.1 1.2 1.6Food and beverages........... .3 .0 .5 .2 .1 .4 .2 2.7 2.5H ousing................................ .2 .2 .2 .3 .1 -.1 .1 .7 2.2Apparel................................. 1.0 -.6 .0 -.1 -.6 -1.1 -.2 -7.3 -1.7Transportation...................... -.1 -.4 .1 -.1 -.4 -.1 -.1 -2.5 -1.6Medical c a re ........................ .4 .3 .2 .2 .3 .3 .2 3.5 3.5Recreation........................... .2 .1 -.2 .1 .1 .4 -.1 1.6 1.1Education and
communication................ -.5 .1 .1 .3 -.2 .3 .1 .8 1.1Other goods and
serv ices........................... .2 .9 .3 -.3 4.2 2.0 -.1 26.7 9.4Special indexes
Energy................................... -1.0 -1.2 .1 -.3 -1.1 -.2 .0 -5.1 -5.7Food ..................................... .2 .1 .5 .1 .1 .5 .1 2.7 2.4All items less
food and energy.............. .2 .2 .2 .1 .3 .1 .1 1.8 2.1
1Digitized for FRASER http://fraser.stlouisfed.org/ Federal Reserve Bank of St. Louis
this deceleration was an upturn in the index for meats, poultry, fish, and eggs, which rose 0.9 percent in February, after registering a 0.8-percent drop in January. Prices for beef and veal; pork; and fish and seafood, each of which declined by at least 1.0 percent in January, increased 1.3, 1.4, and 1.3 percent, respectively, in February. Poultry prices declined for the fourth consecutive month, down 0.7 percent in February. Among the other major grocery store food groups, the indexes for nonalcoholic beverages and for other food at home rose 0.2 and 0.1 percent, respectively. The other two components of the food and beverage index— food away from home and alcoholic beverages— rose 0.2 and 0.4 percent, respectively
The housing component rose 0.1 percent in February. Shelter costs, which were unchanged in January, increased 0.2 percent in February. Within shelter, the indexes for rent and owners’ equivalent rent rose 0.2 and 0.3 percent, respectively, whereas the cost of lodging away from home declined 0.5 percent. (Prior to seasonal adjustment, the cost of lodging while away from home increased 3.2 percent.) The index for fuels and utilities rose 0.2 percent in February. The index for household fuels increased 0.3 percent, as increases in the indexes for electricity and natural gas more than offset a 1.4-percent decline in the index for fuel oil. The indexes for electricity and for natural gas increased 0.6 and 0.1 percent, respectively. The index for household fu rn ish ings and operations declined 0.2 percent in February, reflecting discounting on most home furnishings.
The transportation component declined for the fourth con secu tiv e m onth , down 0.1 p e rcen t in February . Declines in the prices for new and used vehicles and for gasoline were partially offset by an increase in airline fares. The index for new vehicles fell 0.3 percent, and the
index for used cars and trucks decreased 1.5 percent. The index for gasoline declined 0.5 percent in February. (Prior to seasonal adjustment, gasoline prices fell 1.7 percent; as of February, gasoline prices were 30.1 percent lower than their peak level in November 1990.) Public transportation costs increased 1.4 percent in February, reflecting a 2.4- percent rise in airline fares.
The index for apparel decreased 0.2 percent in February, following a 1.1-percent drop in January. (Before seasonal adjustment, apparel prices rose 1.4 percent, reflecting the introduction of high-priced spring summer wear.)
Medical care costs rose 0.2 percent in February to a level 3.5 percent above a year ago. The index for medical care commodities— prescription drugs, nonprescription drugs, and medical supplies— increased 0.2 percent. The index for medical care services rose 0.3 percent. Charges for professional services and hospital and related services increased 0.1 and 0.5 percent, respectively. (Prior to seasonal adjustment, the indexes for professional services and hospital services rose 0.4 and 0.6 percent, respectively.)
The index for recreation costs declined 0.1 percent in February, fo llow ing a 0 .4-percent rise in January. In February, the indexes for video and audio equipment, toys, and recreational reading materials each turned down, more than o ffse tt in g in c rea se s in the in d ex es fo r c lub memberships and admissions to movies, theaters, concerts, and sporting events.
The index for education and communication increased 0.1 percent in February. Educational costs, reflecting a 1.2- percent increase in the index for textbooks and supplies, rose 0.8 percent, whereas the index for communication decreased 0.4 percent. Within the latter group, decreases in the indexes for p ersona l co m p u ters and p e rip h era l equipment and for telephone services— down 2.8 and 0.3
Table B. Percent changes in CPI for Urban Wage Earners and Clerical Workers (CPI-W)
Seasonally adjusted
Expenditure categoryChanges from preceding month Compound
annual rate,Unadjusted 12 months
ended1998 1999 3 months ended
February 1999
August September October November December January FebruaryFebruary
1999
All ite m s ................................... 0.1 0.1 0.2 0.2 0.2 0.2 0 1.5 1.6Food and beverages.......... .2 .1 .4 .2 .1 .4 .1 2.5 2.4H ousing................................ .1 .2 .2 .3 .2 .0 .1 1.3 2.1Apparel................................. .8 -.3 .4 -.1 -.5 -1.1 -.4 -7.6 -1.5Transportation..................... -.2 -.4 .2 -.1 -.5 -.1 -.4 -3.9 -1.8Medical ca re ........................ .4 .3 .2 .2 .2 .3 .2 3.0 3.4Recreation........................... .1 .1 -.3 .1 .1 .4 -.2 1.2 .6Education and
com m unication............... -.5 .2 .1 .3 -.2 .3 .2 1.2 1.4Other goods and
se rv ices ........................... .2 1.3 .2 -.5 5.8 2.5 -.2 36.8 12.0Special indexes
Energy.................................. -1.3 -1.1 .2 -.4 -1.3 -.1 -.2 -6.3 -6.2F o od ..................................... .2 .1 .4 .2 .0 .5 .1 2.5 2.4All items less
food and en e rgy ............. .2 .2 .1 .2 .4 .1 .0 1.9 2.2
2Digitized for FRASER http://fraser.stlouisfed.org/ Federal Reserve Bank of St. Louis
percent, respectively— more than offset a 1.1-percent increase in the index for delivery services.
The index for other goods and services declined 0.1 percent in February, following a 2.0-percent increase in January. The index for tobacco and smoking products, which increased 6.6 percent in January, declined 1.4 percent in February. Despite this decline, cigarette prices have increased 35.4 percent in the 12-month period ended in February. Charges for personal financial services and for legal services rose 0.7 and 0.9 percent, respectively.
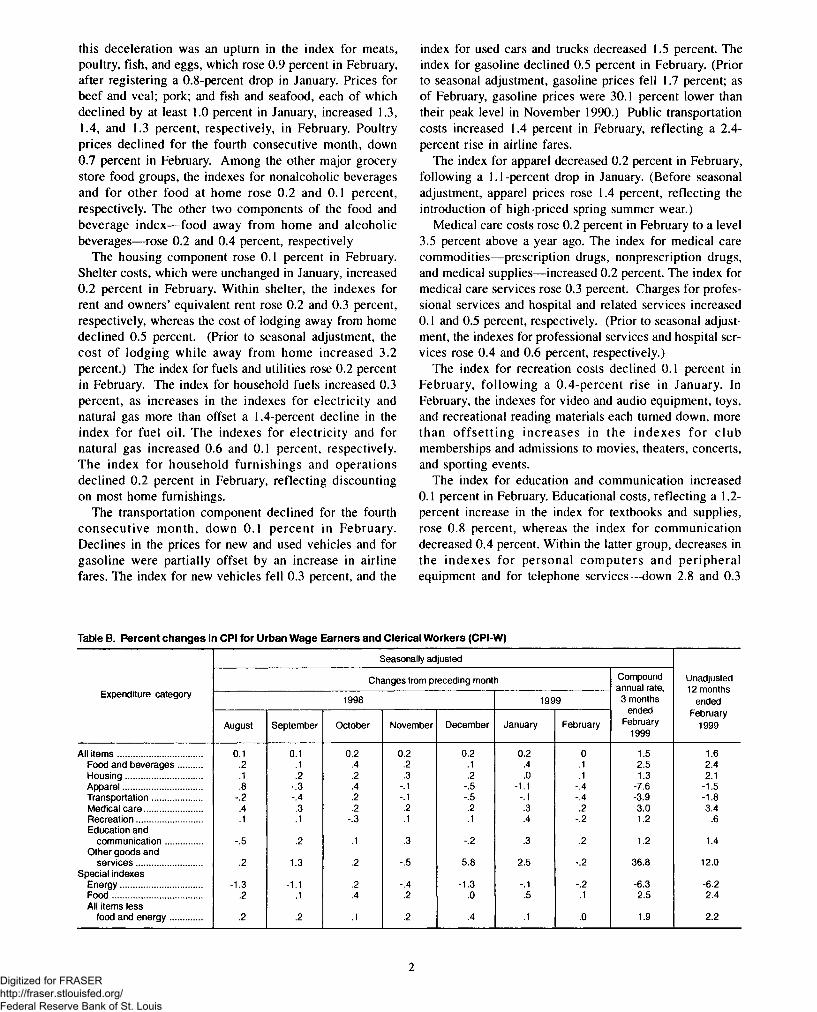
CPI for Urban Wage Earners and Clerical Workers (CPI-W)On a seasonally adjusted basis, the CPI for Urban Wage
Earners and Clerical Workers was unchanged in February.
CPI (Old Series)For the first 6 months of 1999, BLS will also publish Old Series CPI-U and Old Series CPI-W, based on the former method of calculating the elementary aggregates, that is, em ploying an arithm etic mean in all index categories. These old series data are contained in tables 1-4 (LAS). From January to February, the Old Series CPI-U and the Old Series CPI-W rose 0.2 and 0.1 percent, respectively. These series are not seasonally adjusted. (The unadjusted CPI-U and CPI-W, using the new method of calculating the elementary aggregates, each rose 0.1 percent in February.)
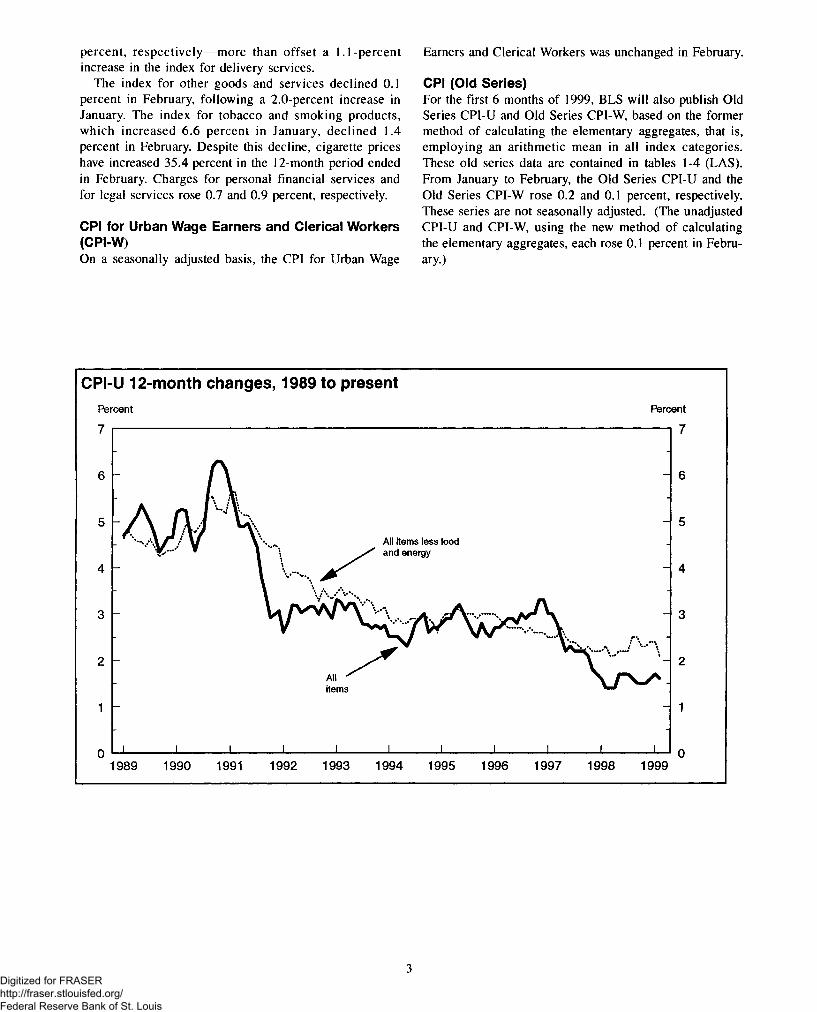
CPI-U 12-month changes, 1989 to presentPercent Percent
3Digitized for FRASER http://fraser.stlouisfed.org/ Federal Reserve Bank of St. Louis
Consumer Price Index Formula Changed
O n April 16, 1998, the Bureau of Labor Statistics announced its decision to use a new formula for calculat
ing the basic components of the Consumer Price Index for All Urban Consumers (CPI-U) and the Consumer Price Index for Urban Wage Earners and Clerical Workers (CPI-W). This change is effective with data for January 1999.
The new formula, the geometric mean estimator, will be used in index categories that comprise approximately 61 percent of total consumer spending represented by the CPI-U. The remaining index categories, which are shown in the table below, will continue to be calculated as they have been. Based upon BLS research, it is expected that planned use of the new formula will reduce the annual rate of increase in the CPI by approximately 0.2 percentage point per year.
The geometric mean estimator has been introduced in both the CPI-U and the CPI-W effective with data for January 1999, in accordance with the past practice of introducing methodological changes at the beginning of a calendar year. BLS will continue to publish “overlap” CPI-U and CPI-W series using the former calculation method for the first 6 m onths o f 1999. These indexes will not be published regularly for months subsequent to June 1999 but will be available upon request.
Additional information on this change was published in the April 1998 CPI Detailed Report and is available on the Internet (http://stats.bls.gov/cpihome.htm). This information also can be obtained by writing to the Bureau of Labor
Statistics, Division of Consumer Prices and Price Indexes, 2 Massachusetts Ave., NE., Room 3615, Washington, D.C. 20212 or by calling (202) 606-7000.
Components retaining the arithmetic mean (Laspeyres) formula:
Selected shelter services• Rent of primary residence• Owners’ equivalent rent of primary residence• Housing at school, excluding board
Selected utilities and government charges• Electricity• Utility natural gas service• Residential water and sewerage maintenance• State and local registration, license, and motor vehicle
property tax• Telephone services, local charges• Cable television
Selected medical care services• Physicians’ services• Dental services• Eyeglasses and eye care• Services by other medical professionals• Hospital services• Nursing homes and adult daycare
4Digitized for FRASER http://fraser.stlouisfed.org/ Federal Reserve Bank of St. Louis
Scheduled Updates for Expenditure Weights in the Consumer Price Index
T he Bureau of Labor Statistics (BLS) will be updating, to the 1999-2000 period, the consumption expenditure
weights in the Consumer Price Index for all Urban Consumers (CPI-U) and the CPI for Urban Wage Earners and Clerical Workers (CPI-W), effective with release of data for January 2002. These new weights will replace the 1993-95 weights that were first used in the index effective with January 1998 data. Additionally, BLS will update CPI expenditure weights at 2-year intervals after the 2002 updating. Thus, for example, CPI expenditure weights will be updated to the 2001-02 period, effective with release of CPI data for January 2004. Because of this change, expenditure weight data will be, on average, 2 years old when BLS introduces them into the CPI and 4 years old when BLS replaces them. By contrast, the1993-95 weights were, on average, 3lA years old in January 1998 and replaced weights that were about 15 years old.
Historically, the introduction of a comprehensive new set of expenditure weights attached to the categories of goods and services in the CPI “market basket” has taken place in the context of the periodic major revisions of the index. Such major revisions have taken place approximately once each decade— in 1940,1953,1964,1978, 1987 and, most recently, in 1998. BLS constructs the CPI-U and CPI-W expenditure weights, using household spending patterns during specified base periods, as reported in the Consumer Expenditure Survey (CEX). Effective with data for January 1998, BLS updated the C PI’s expenditure base period from 1982-84 to 1993-95.
In June 1997, in a paper prepared for the Chairman of the Joint Economic Committee, BLS said it was considering a more frequent schedule of updates to follow the planned January 1998 update. In an August 1997 response to a General Accounting Office report, BLS indicated that more frequent updates would be preferable, the future schedule was under review, and any decision would be based on a consideration of what frequency would yield the most accurate CPI and best support the many uses of the index. This review is now complete and is the basis for the policy announced above.
As BLS has stated previously, the cost-of-living index (COLI) provides the measurement objective for the CPI. The theory of the COLI, however, does not specify any particular expenditure base period as the appropriate one, nor does it specify the proper interval between updates of the base period expenditure patterns. Furthermore, BLS does not view
the choice of update frequency as a means of addressing the problem sometimes referred to as “upper-level substitution bias” in the CPI. It has sometimes been argued that using more timely, and more frequently updated, expenditure weights would lower the index’s rate of growth by reflecting consumer response to changes in the relative prices of CPI item categories. However, there is little evidence of any historical link between the CPI’s growth rate and the age of its underlying expenditure weights. BLS believes that consumer substitution in response to relative price change is best dealt with using a “superlative” cost-of-living index formula. As previously announced, a superlative CPI index will be published in 2002, as a complement to the CPI-U and CPI-W.
In the Bureau’s view, the goal in using current expenditure weights is to make the CPI reflect, as much as possible, the inflation recently experienced by consumers. More specifically, the use of current weights will help to ensure that the relative importance data of CPI item categories, such as food away from home, college tuition, and medical care services accurately reflects how consumers are allocating their spending. The CPI’s current item sample rotation procedures are similarly aimed at ensuring that individual items priced in the CPI are representative of current purchases within CPI item categories. BLS also has initiatives underway that, beginning in 1999, will expand the sample size of the CEX and that will enhance the computer systems used to introduce new expenditure weights into the CPI. Both initiatives have the purpose of reducing the average age of those weights.
Based on this overall objective of making the CPI representative of consumer experience, BLS has decided to update the index’s expenditure weights every 2 years, beginning with the release of data for January 2002. This schedule will allow for the use of the expanded CEX sample mentioned above, and the consequent implementation of a 2-year expenditure base period (1999-2000), rather than the 3-year base period used in the 1987 and 1998 revisions. In the planned updating schedule, the 2001-02 expenditure weights will replace the 1999-2000 expenditure weights, effective with the CPI for January 2004. As noted above, under the new updating schedule, CPI expenditure weights, both at the time of their introduction and at the time they are replaced, will be substantially closer to current expenditure patterns than under the schedule previously followed.
5Digitized for FRASER http://fraser.stlouisfed.org/ Federal Reserve Bank of St. Louis
As noted above, this decision is not in tended— or expected— to have a large, systematic effect on the C PI’s rate of change. Nevertheless, to examine the quantitative impact of moving to a 2-year update policy, BLS has analyzed historical CPI-U data to estimate what the growth in the index would have been, had the new policy taken effect after the 1987 major revision. Specifically, the simulated policy included the introduction of 1986-87 expenditure patterns in January 1989; the introduction of 1988-89 patterns in January1991, and similarly thereafter, through the introduction of1994-95 expenditure patterns in January 1997. The simulated increase from December 1988 through December 1997 under this policy was 31.9 percent, compared to 33.9 percent for the published CPI-U. On an average annual basis, the new policy would have lowered the measured rate of CPI-U growth by 0.17 percentage point. It is important to recognize, however, that this estimated historical effect may not be indicative of the future effect of the policy. Low growth associated with the simulated policy is explained entirely by the replacement of 1982-84 weights by 1986-87 weights in 1989. Subsequent biennial updates had virtually no net effect. A simulated policy of maintaining 1986-87 weights from 1989 forward yielded a total increase in the CPI-U between
December 1988 and December 1997 of 31.8 percent, 0.1 percentage point less than under the 2-year updating policy. It is likely that incorporating new weights more frequently in the future will have a small upward effect on the index in some years and a small downward effect in other years.
It should be emphasized that this policy does not mean that the full range of activities involved in a major CPI revision henceforth will occur every 2 years. In addition to updating expenditure weights, major revisions of the CPI have comprised updating the geographic (area) sample and sample of housing units, revising the item classification and publication structure, and introducing technological and methodological enhancements. (A description of the 1998 and earlier revisions can be found in the December 1996 issue of the Monthly Labor Review.) Not all these activities are feasible, or advisable, on a biennial basis. For example, fundamental reworkings of the index’s item classification and publication structures are both costly and potentially disruptive for users. In addition, as long as BLS continues to rely on decennial census data for selecting new CPI area and housing samples, it will be possible to update those samples only about once every 10 years.
6Digitized for FRASER http://fraser.stlouisfed.org/ Federal Reserve Bank of St. Louis
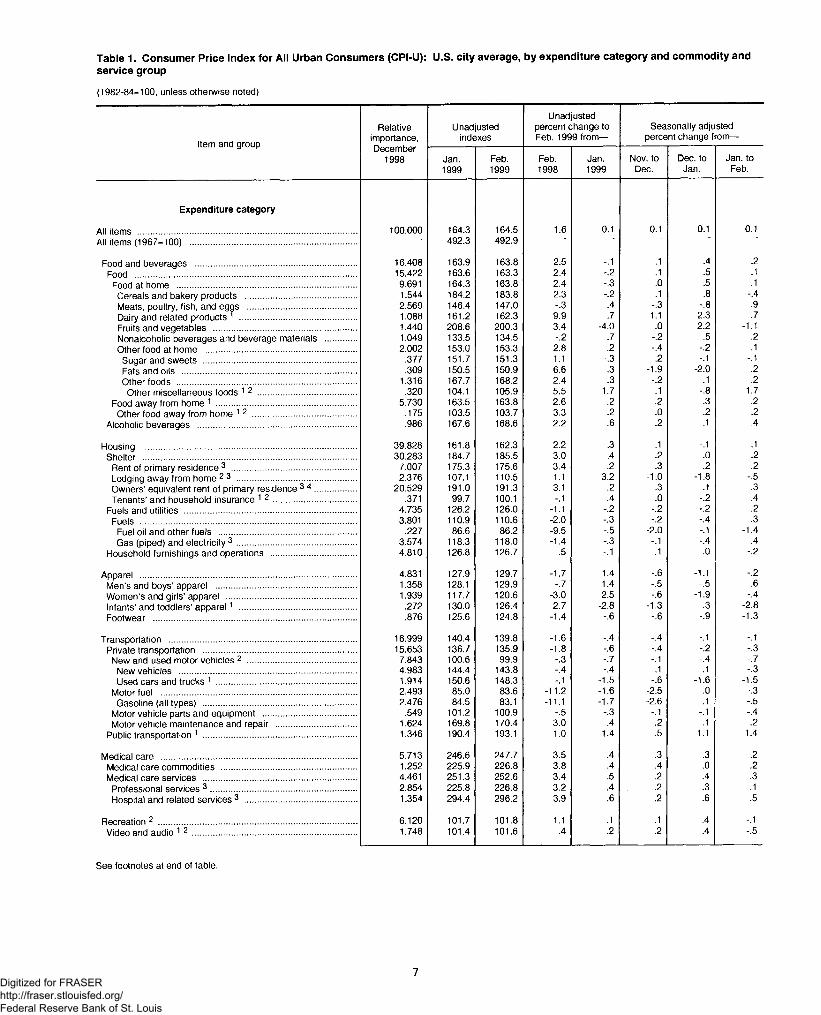
Table 1. Consumer Price Index for All Urban Consumers (CPI-U): U.S. city average, by expenditure category and commodity andservice group
(1982-84=100, unless otherwise noted)
Item and group
Relativeimportance,
Unadjustedindexes
Unadjusted percent change to Feb. 1999 from—
Seasonally adjusted percent change from—
December1998 Jan.
1999Feb.1999
Feb.1998
Jan.1999
Nov. to Dec.
Dec. to Jan.
Jan. to Feb.
Expenditure category
All items ................ .......................................................................... 100.000 164.3 164.5 1.6 0.1 0.1 0.1 0.1All items (1967-100) ..................................................................... ' 492.3 492.9
Food and beverages ................................................................... 16.408 163.9 163.8 2.5 -.1 .1 .4 .2Food ............................................................................................ 15.422 163.6 163.3 2.4 -.2 .1 .5 .1
Food at home ........................................................................... 9.691 164.3 163.8 2.4 -.3 .0 .5 .1Cereals and bakery products .............................................. 1.544 184.2 183.8 2.3 -.2 .1 .8 -.4Meats, poultry, fish, and eggs .............................................Dairy and related products ' .................................................
2.569 146.4 147.0 -.3 .4 -.3 -.8 .91.088 161.2 162.3 9.9 .7 1.1 2.3 .7
Fruits and vegetables ............................................................ 1.440 208.6 200.3 3.4 -4.0 .0 2.2 -1.1Nonalcoholic beverages and beverage materials ............. 1.049 133.5 134.5 -.2 .7 -.2 .5 .2Other food at home ............................................................... 2.002 153.0 153.3 2.8 .2 -.4 -.2 .1
Sugar and sweets ................................................................ .377 151.7 151.3 1.1 -.3 .2 -.1 -.1Fats and oils ......................................................................... .309 150.5 150.9 6.6 .3 -1.9 -2.0 .2Other foods ........................................................................... 1.316 167.7 168.2 2.4 .3 -.2 .1 .2
Other miscellaneous foods 1 2 ......................................... .320 104.1 105.9 5.5 1.7 .1 -.8 1.7Food away from home 1 .......................................................... 5.730 163.5 163.8 2.6 .2 .2 .3 .2
Other food away from home 1 2 ........................................... .175 103.5 103.7 3.3 .2 .0 .2 .2Alcoholic beverages .................................................................. .986 167.6 168.6 2.2 .6 .2 .1 .4
Housing ......................................................................................... 39.828 161.8 162.3 2.2 .3 .1 -.1 .1Shelter ......................................................................................... 30.283 184.7 185.5 3.0 .4 .2 .0 .2
Rent of primary residence 3 .................................................... 7.007 175.3 175.6 3.4 .2 .3 .2 .2Lodging away from home 2 3 ................................................... 2.376 107.1 110.5 1.1 3.2 -1.0 -1.8 -.5Owners’ equivalent rent of primary residence 3 4 ................. 20.529 191.0 191.3 3.1 .2 .3 .1 .3Tenants’ and household insurance 1 2 ................................... .371 99.7 100.1 -.1 .4 .0 -.2 .4
Fuels and utilities ........................................................................ 4.735 126.2 126.0 -1.1 -.2 -.2 -.2 .2Fuels .......................................................................................... 3.801 110.9 110.6 -2.0 -.3 -.2 -.4 .3
Fuel oil and other fuels ......................................................... .227 86.6 86.2 -9.5 -.5 -2.0 -.1 -1.4Gas (piped) and electricity 3 .................................................. 3.574 118.3 118.0 -1.4 -.3 -.1 -.4 .4
Household furnishings and operations .................................... 4.810 126.8 126.7 .5 -.1 .1 .0 -.2
Apparel .......................................................................................... 4.831 127.9 129.7 -1.7 1.4 -.6 -1.1 -.2Men’s and boys’ apparel .......................................................... 1.358 128.1 129.9 -.7 1.4 -.5 -.5 .6Women’s and girls’ apparel ...................................................... 1.939 117.7 120.6 -3.0 2.5 -.6 -1.9 -.4Infants’ and toddlers’ apparel1 ................................................. .272 130.0 126.4 2.7 -2.8 -1.3 .3 -2.8Footwear ..................................................................................... .876 125.6 124.8 -1.4 -.6 -.6 -.9 -1.3
Transportation .............................................................................. 16.999 140.4 139.8 -1.6 -.4 -.4 -.1 -.1Private transportation ................................................................ 15.653 136.7 135.9 -1.8 -.6 -.4 -.2 -.3
New and used motor vehicles 2 ............................................. 7.843 100.6 99.9 -.3 -.7 -.1 -.4 -.7New vehicles .......................................................................... 4.983 144.4 143.8 -.4 -.4 .1 .1 -.3Used cars and trucks 1 ........................................................... 1.914 150.6 148.3 -.1 -1.5 -.6 -1.6 -1.5
Motor fuel .................................................................................. 2.493 85.0 83.6 -11.2 -1.6 -2.5 .0 -.3Gasoline (all tvpes) ................................................................ 2.476 84.5 83.1 -11.1 -1.7 -2.6 .1 -.5
Motor vehicle parts and equipment ....................................... .549 101.2 100.9 -.5 -.3 -.1 -.1 -.4Motor vehicle maintenance and repair ................................. 1.624 169.8 170.4 3.0 .4 .2 .1 .2
Public transportation 1 ................................................................ 1.346 190.4 193.1 1.0 1.4 .5 1.1 1.4
Medical care .................................................................................. 5.713 246.6 247.7 3.5 .4 .3 .3 .2Medical care commodities ........................................................ 1.252 225.9 226.8 3.8 .4 .4 .0 .2Medical care services ................................................................ 4.461 251.3 252.6 3.4 .5 .2 .4 .3
Professional services 3 ............................................................. 2.854 225.8 226.8 3.2 .4 .2 .3 .1Hospital and related services 3 ............................................... 1.354 294.4 296.2 3.9 .6 .2 .6 .5
Recreation 2 ................................................................................... 6.120 101.7 101.8 1.1 .1 .1 .4 -.1Video and audio 1 2 .................................................................... 1.748 101.4 101.6 .4 .2 .2 .4 -.5
See footnotes at end of table.
7Digitized for FRASER http://fraser.stlouisfed.org/ Federal Reserve Bank of St. Louis
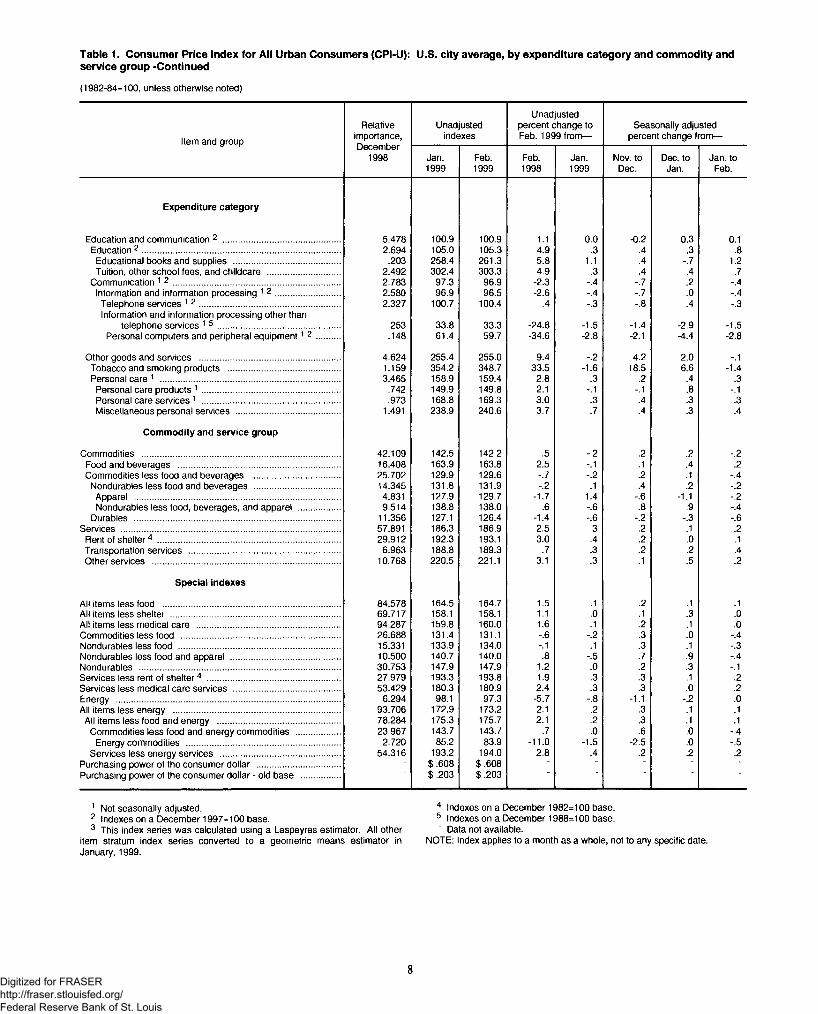
Table 1. Consumer Price Index for All Urban Consumers (CPI-U): U.S. city average, by expenditure category and commodity andservice group -Continued
(1982-84=100, unless otherwise noted)
Item and group
Relativeimportance,December
1998
Unadjustedindexes
Unadjusted percent change to Feb. 1999 from—
Seasonally adjusted percent change from—
Jan.1999
Feb.1999
Feb.1998
Jan.1999
Nov. to Dec.
Dec. to Jan.
Jan. to Feb.
Expenditure category
Education and communication 2 ................................................. 5.478 100.9 100.9 1.1 0.0 -0.2 0.3 0.1Education 2 ................................................................................... 2.694 105.0 105.3 4.9 .3 .4 .3 .8
Educational books and supplies ............................................ .203 258.4 261.3 5.8 1.1 .4 -.7 1.2Tuition, other school fees, and childcare .............................. 2.492 302.4 303.3 4.9 .3 .4 .4 .7
Communication 1 2 ...................................................................... 2.783 97.3 96.9 -2.3 -.4 -.7 .2 -.4Information and information processing 1 2 ........................... 2.580 96.9 96.5 -2.6 -.4 -.7 .0 -.4
Telephone services 1 2 ........................................................... 2.327 100.7 100.4 .4 -.3 -.8 .4 -.3Information and information processing other than
telephone services 1 5 ................................................... .253 33.8 33.3 -24.8 -1.5 -1.4 -2.9 -1.5Personal computers and peripheral equipment1 2 .......... .148 61.4 59.7 -34.6 -2.8 -2.1 -4.4 -2.8
Other goods and services ........................................................... 4.624 255.4 255.0 9.4 -.2 4.2 2.0 -.1Tobacco and smoking products ............................................... 1.159 354.2 348.7 33.5 -1.6 18.5 6.6 -1.4Personal care 1 ........................................................................... 3.465 158.9 159.4 2.8 .3 .2 .4 .3
Personal care products 1 .......................................................... .742 149.9 149.8 2.1 -.1 -.1 .8 -.1Personal care services 1 .......................................................... .973 168.8 169.3 3.0 .3 .4 .3 .3Miscellaneous personal services ........................................... 1.491 238.9 240.6 3.7 .7 .4 .3 .4
Commodity and service group
Commodities ................................................................................... 42.109 142.5 142.2 .5 -.2 .2 .2 -.2Food and beverages ................................................................... 16.408 163.9 163.8 2.5 -.1 .1 .4 .2Commodities less food and beverages ..................................... 25.702 129.9 129.6 -.7 -.2 .2 .1 -.4
Nondurables less food and beverages .................................... 14.345 131.8 131.9 -.2 .1 .4 .2 -.2Apparel ...................................................................................... 4.831 127.9 129.7 -1.7 1.4 -.6 -1.1 -.2Nondurables less food, beverages, and apparel ................. 9.514 138.8 138.0 .6 -.6 .8 .9 -.4
Durables ...................................................................................... 11.356 127.1 126.4 -1.4 -.6 -.2 -.3 -.6Services ........................................................................................... 57.891 186.3 186.9 2.5 .3 .2 .1 .2
Rent of shelter4 ............................................................................ 29.912 192.3 193.1 3.0 .4 .2 .0 .1Transportation services ............................................................... 6.963 188.8 189.3 .7 .3 .2 .2 .4Other services .............................................................................. 10.768 220.5 221.1 3.1 .3 .1 .5 .2
Special indexes
All items less food .......................................................................... 84.578 164.5 164.7 1.5 .1 .2 .1 .1All items less shelter ....................................................................... 69.717 158.1 158.1 1.1 .0 .1 .3 .0All items less medical care ............................................................ 94.287 159.8 160.0 1.6 .1 .2 .1 .0Commodities less food .................................................................. 26.688 131.4 131.1 -.6 -.2 .3 .0 -.4Nondurables less food ................................................................... 15.331 133.9 134.0 -.1 .1 .3 .1 -.3Nondurables less food and apparel .............................................. 10.500 140.7 140.0 .8 -.5 .7 .9 -.4Nondurables .................................................................................... 30.753 147.9 147.9 1.2 .0 .2 .3 -.1Services less rent of shelter4 ....................................................... 27.979 193.3 193.8 1.9 .3 .3 .1 .2Services less medical care services ............................................ 53.429 180.3 180.9 2.4 .3 .3 .0 .2Energy ............................................................................................. 6.294 98.1 97.3 -5.7 -.8 -1.1 -.2 .0All items less energy ...................................................................... 93.706 172.9 173.2 2.1 .2 .3 .1 .1
All items less food and energy ................................................... 78.284 175.3 175.7 2.1 .2 .3 .1 .1Commodities less food and energy commodities .................. 23.967 143.7 143.7 .7 .0 .6 .0 -.4
Energy commodities ................................................................ 2.720 85.2 83.9 -11.0 -1.5 -2.5 .0 -.5Services less energy services .................................................. 54.316 193.2 194.0 2.8 .4 .2 .2 .2
Purchasing power of the consumer dollar ................................... * $.608 $.608 ■ ■ ■ ■ ■Purchasing power of the consumer dollar - old base ................ $.203 $.203
1 Not seasonally adjusted.2 Indexes on a December 1997=100 base.3 This index series was calculated using a Laspeyres estimator. All other
item stratum index series converted to a geometric means estimator in January, 1999.
4 Indexes on a December 1982=100 base.5 Indexes on a December 1988=100 base.~ Data not available.
NOTE: Index applies to a month as a whole, not to any specific date.
8Digitized for FRASER http://fraser.stlouisfed.org/ Federal Reserve Bank of St. Louis
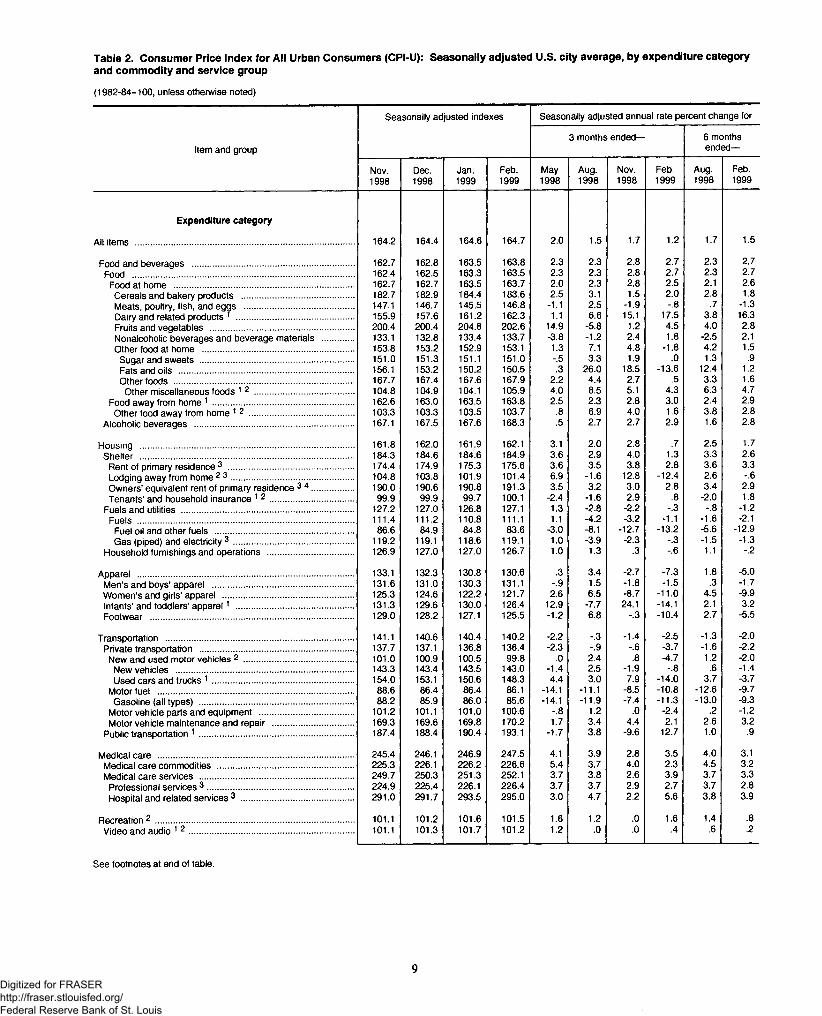
Table 2. Consumer Price Index for All Urban Consumers (CPI-U): Seasonally adjusted U.S. city average, by expenditure categoryand commodity and service group
(1982-84=100, unless otherwise noted)
Seasonally adjusted indexes Seasonally adjusted annual rate percent change for
Item and group3 months ended— 6 months
ended—
Nov.1998
Dec.1998
Jan.1999
Feb.1999
May1998
Aug.1998
Nov.1998
Feb.1999
Aug.1998
Feb.1999
Expenditure category
All items ........................................................................................... 164.2 164.4 164.6 164.7 2.0 1.5 1.7 1.2 1.7 1.5
Food and beverages .................................................................... 162.7 162.8 163.5 163.8 2.3 2.3 2.8 2.7 2.3 2.7Food ............................................................................................ 162.4 162.5 163.3 163.5 2.3 2.3 2.8 2.7 2.3 2.7
Food at home ........................................................................... 162.7 162.7 163.5 163.7 2.0 2.3 2.8 2.5 2.1 2.6Cereals and bakery products ............................................... 182.7 182.9 184.4 183.6 2.5 3.1 1.5 2.0 2.8 1.8Meats, poultry, fish, and eggs ..............................................Dairy and related products ' .................................................
147.1 146.7 145.5 146.8 -1.1 2.5 -1.9 -.8 .7 -1.3155.9 157.6 161.2 162.3 1.1 6.6 15.1 17.5 3.8 16.3
Fruits and vegetables ............................................................ 200.4 200.4 204.8 202.6 14.9 -5.8 1.2 4.5 4.0 2.8Nonalcoholic beverages and beverage materials ............. 133.1 132.8 133.4 133.7 -3.8 -1.2 2.4 1.8 -2.5 2.1Other food at home ............................................................... 153.8 153.2 152.9 153.1 1.3 7.1 4.8 -1.8 4.2 1.5
Sugar and sweets ................................................................ 151.0 151.3 151.1 151.0 -.5 3.3 1.9 .0 1.3 .9Fats and oils ......................................................................... 156.1 153.2 150.2 150.5 .3 26.0 18.5 -13.6 12.4 1.2Other foods ........................................................................... 167.7 167.4 167.6 167.9 2.2 4.4 2.7 .5 3.3 1.6
Other miscellaneous foods 1 2 ......................................... 104.8 104.9 104.1 105.9 4.0 8.5 5.1 4.3 6.3 4.7Food away from home 1 ........................................................... 162.6 163.0 163.5 163.8 2.5 2.3 2.8 3.0 2.4 2.9Other food away from home 1 2 ............................................ 103.3 103.3 103.5 103.7 .8 6.9 4.0 1.6 3.8 2.8
Alcoholic beverages .................................................................. 167.1 167.5 167.6 168.3 .5 2.7 2.7 2.9 1.6 2.8
Housing ......................................................................................... 161.8 162.0 161.9 162.1 3.1 2.0 2.8 .7 2.5 1.7Shelter ......................................................................................... 184.3 184.6 184.6 184.9 3.6 2.9 4.0 1.3 3.3 2.6
Rent of primary residence 3 .................................................... 174.4 174.9 175.3 175.6 3.6 3.5 3.8 2.8 3.6 3.3Lodging away from home 2 3 ................................................... 104.8 103.8 101.9 101.4 6.9 -1.6 12.8 -12.4 2.6 -.6Owners’ equivalent rent of primary residence 3 4 ................. 190.0 190.6 190.8 191.3 3.5 3.2 3.0 2.8 3.4 2.9Tenants’ and household insurance 1 2 ................................... 99.9 99.9 99.7 100.1 -2.4 -1.6 2.9 .8 -2.0 1.8
Fuels and utilities ........................................................................ 127.2 127.0 126.8 127.1 1.3 -2.8 -2.2 -.3 -.8 -1.2Fuels .......................................................................................... 111.4 111.2 110.8 111.1 1.1 -4.2 -3.2 -1.1 -1.6 -2.1
Fuel oil and other fuels .......................................................... 86.6 84.9 84.8 83.6 -3.0 -8.1 -12.7 -13.2 -5.6 -12.9Gas (piped) and electricity 3 .................................................. 119.2 119.1 118.6 119.1 1.0 -3.9 -2.3 -.3 -1.5 -1.3
Household furnishings and operations .................................... 126.9 127.0 127.0 126.7 1.0 1.3 .3 -.6 1.1 -.2
Apparel .......................................................................................... 133.1 132.3 130.8 130.6 .3 3.4 -2.7 -7.3 1.8 -5.0Men’s and boys’ apparel ........................................................... 131.6 131.0 130.3 131.1 -.9 1.5 -1.8 -1.5 .3 -1.7Women’s and girls’ apparel ...................................................... 125.3 124.6 122.2 121.7 2.6 6.5 -8.7 -11.0 4.5 -9.9Infants’ and toddlers’ apparel1 ................................................. 131.3 129.6 130.0 126.4 12.9 -7.7 24.1 -14.1 2.1 3.2Footwear ..................................................................................... 129.0 128.2 127.1 125.5 -1.2 6.8 -.3 -10.4 2.7 -5.5
Transportation .............................................................................. 141.1 140.6 140.4 140.2 -2.2 -.3 -1.4 -2.5 -1.3 -2.0Private transportation ................................................................ 137.7 137.1 136.8 136.4 -2.3 -.9 -.6 -3.7 -1.6 -2.2New and used motor vehicles 2 .............................................. 101.0 100.9 100.5 99.8 .0 2.4 .8 -4.7 1.2 -2.0
New vehicles .......................................................................... 143.3 143.4 143.5 143.0 -1.4 2.5 -1.9 -.8 .6 -1.4Used cars and trucks 1 ........................................................... 154.0 153.1 150.6 148.3 4.4 3.0 7.9 -14.0 3.7 -3.7
Motor fuel .................................................................................. 88.6 86.4 86.4 86.1 -14.1 -11.1 -8.5 -10.8 -12.6 -9.7Gasoline (all types) ................................................................ 88.2 85.9 86.0 85.6 -14.1 -11.9 -7.4 -11.3 -13.0 -9.3
Motor vehicle parts and equipment ....................................... 101.2 101.1 101.0 100.6 -.8 1.2 .0 -2.4 .2 -1.2Motor vehicle maintenance and repair .................................. 169.3 169.6 169.8 170.2 1.7 3.4 4.4 2.1 2.6 3.2
Public transportation 1 ................................................................ 187.4 188.4 190.4 193.1 -1.7 3.8 -9.6 12.7 1.0 .9
Medical care .................................................................................. 245.4 246.1 246.9 247.5 4.1 3.9 2.8 3.5 4.0 3.1Medical care commodities ......................................................... 225.3 226.1 226.2 226.6 5.4 3.7 4.0 2.3 4.5 3.2Medical care services ................................................................ 249.7 250.3 251.3 252.1 3.7 3.8 2.6 3.9 3.7 3.3
Professional services 3 ............................................................. 224.9 225.4 226.1 226.4 3.7 3.7 2.9 2.7 3.7 2.8Hospital and related sen/ices 3 ............................................... 291.0 291.7 293.5 295.0 3.0 4.7 2.2 5.6 3.8 3.9
Recreation2 ................................................................................... 101.1 101.2 101.6 101.5 1.6 1.2 .0 1.6 1.4 .8Video and audio 1 2 ..................................................................... 101.1 101.3 101.7 101.2 1.2 .0 .0 .4 .6 .2
See footnotes at end of table.
9Digitized for FRASER http://fraser.stlouisfed.org/ Federal Reserve Bank of St. Louis
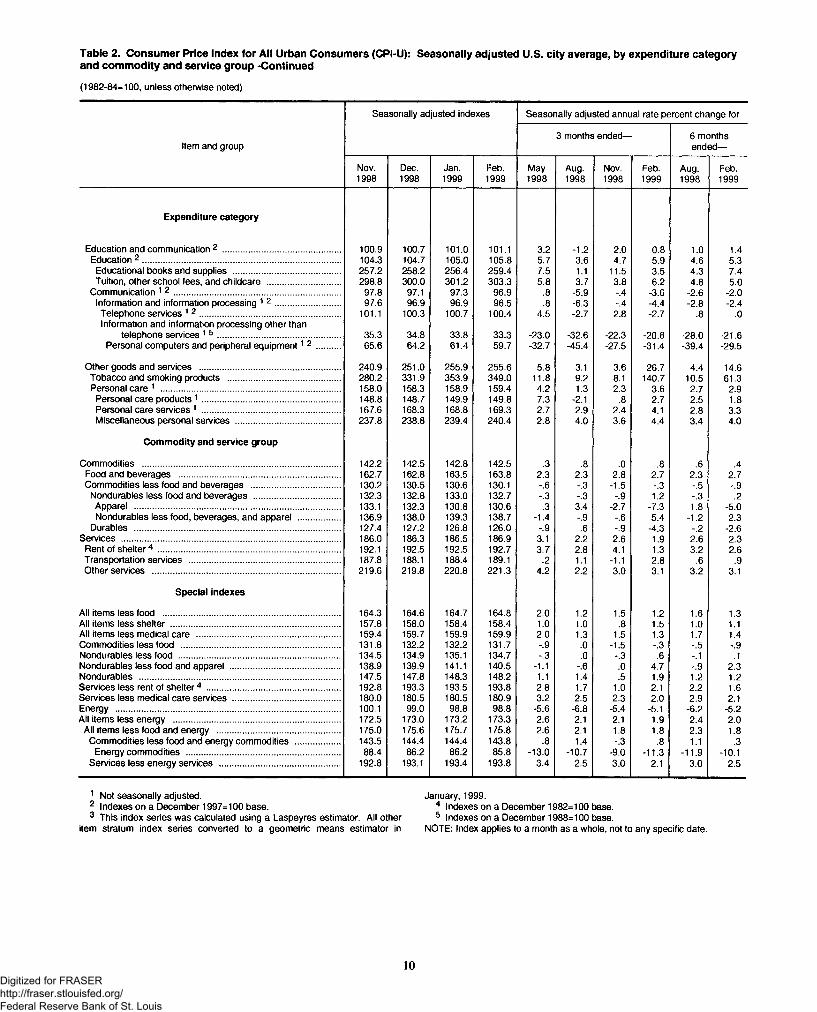
Table 2. Consumer Price Index for All Urban Consumers (CPI-U): Seasonally adjusted U.S. city average, by expenditure categoryand commodity and service group -Continued
(1982-84=100, unless otherwise noted)
Seasonally adjusted indexes Seasonally adjusted annual rate percent change for
Item and group3 months ended— 6 months
ended—
Nov.1998
Dec.1998
Jan.1999
Feb.1999
May1998
Aug.1998
Nov.1998
Feb.1999
Aug.1998
Feb.1999
Expenditure category
Education and communication 2 ................................................. 100.9 100.7 101.0 101.1 3.2 -1.2 2.0 0.8 1.0 1.4Education 2 ................................................................................... 104.3 104.7 105.0 105.8 5.7 3.6 4.7 5.9 4.6 5.3Educational books and supplies ............................................. 257.2 258.2 256.4 259.4 7.5 1.1 11.5 3.5 4.3 7.4Tuition, other school fees, and childcare ............................... 298.8 300.0 301.2 303.3 5.8 3.7 3.8 6.2 4.8 5.0
Communication 1 2 ..................................................................... 97.8 97.1 97.3 96.9 .8 -5.9 -.4 -3.6 -2.6 -2.0Information and information processing 1 2 ........................... 97.6 96.9 96.9 96.5 .8 -6.3 -.4 -4.4 -2.8 -2.4
Telephone services 1 2 ........................................................... 101.1 100.3 100.7 100.4 4.5 -2.7 2.8 -2.7 .8 .0Information and information processing other than
telephone services 1 5 ................................................... 35.3 34.8 33.8 33.3 -23.0 -32.6 -22.3 -20.8 -28.0 -21.6Personal computers and peripheral equipment1 2 .......... 65.6 64.2 61.4 59.7 -32.7 -45.4 -27.5 -31.4 -39.4 -29.5
Other goods and services ........................................................... 240.9 251.0 255.9 255.6 5.8 3.1 3.6 26.7 4.4 14.6Tobacco and smoking products ............................................... 280.2 331.9 353.9 349.0 11.8 9.2 8.1 140.7 10.5 61.3Personal care 1 ........................................................................... 158.0 158.3 158.9 159.4 4.2 1.3 2.3 3.6 2.7 2.9
Personal care products 1 .......................................................... 148.8 148.7 149.9 149.8 7.3 -2.1 .8 2.7 2.5 1.8Personal care services 1 .......................................................... 167.6 168.3 168.8 169.3 2.7 2.9 2.4 4.1 2.8 3.3Miscellaneous personal services ............................................ 237.8 238.8 239.4 240.4 2.8 4.0 3.6 4.4 3.4 4.0
Commodity and service group
Commodities ................................................................................... 142.2 142.5 142.8 142.5 .3 .8 .0 .8 .6 .4Food and beverages ................................................................... 162.7 162.8 163.5 163.8 2.3 2.3 2.8 2.7 2.3 2.7Commodities less food and beverages ..................................... 130.2 130.5 130.6 130.1 -.6 -.3 -1.5 -.3 -.5 -.9
Nondurables less food and beverages .................................... 132.3 132.8 133.0 132.7 -.3 -.3 -.9 1.2 -.3 .2Apparel ...................................................................................... 133.1 132.3 130.8 130.6 .3 3.4 -2.7 -7.3 1.8 -5.0Nondurables less food, beverages, and apparel .................. 136.9 138.0 139.3 138.7 -1.4 -.9 -.6 5.4 -1.2 2.3
Durables ...................................................................................... 127.4 127.2 126.8 126.0 -.9 .6 -.9 -4.3 -.2 -2.6Services ........................................................................................... 186.0 186.3 186.5 186.9 3.1 2.2 2.6 1.9 2.6 2.3
Rent of shelter4 ............................................................................ 192.1 192.5 192.5 192.7 3.7 2.8 4.1 1.3 3.2 2.6Transportation services ............................................................... 187.8 188.1 188.4 189.1 .2 1.1 -1.1 2.8 .6 .9Other services .............................................................................. 219.6 219.8 220.8 221.3 4.2 2.2 3.0 3.1 3.2 3.1
Special indexes
All items less food .......................................................................... 164.3 164.6 164.7 164.8 2.0 1.2 1.5 1.2 1.6 1.3All items less shelter ....................................................................... 157.8 158.0 158.4 158.4 1.0 1.0 .8 1.5 1.0 1.1All items less medical care ............................................................ 159.4 159.7 159.9 159.9 2.0 1.3 1.5 1.3 1.7 1.4Commodities less food .................................................................. 131.8 132.2 132.2 131.7 -.9 .0 -1.5 -.3 -.5 -.9Nondurables less food ................................................................... 134.5 134.9 135.1 134.7 -.3 .0 -.3 .6 -.1 .1Nondurables less food and apparel .............................................. 138.9 139.9 141.1 140.5 -1.1 -.6 .0 4.7 -.9 2.3Nondurables .................................................................................... 147.5 147.8 148.3 148.2 1.1 1.4 .5 1.9 1.2 1.2Services less rent of shelter4 ........................................................ 192.8 193.3 193.5 193.8 2.8 1.7 1.0 2.1 2.2 1.6Services less medical care services ............................................. 180.0 180.5 180.5 180.9 3.2 2.5 2.3 2.0 2.9 2.1Energy .............................................................................................. 100.1 99.0 98.8 98.8 -5.6 -6.8 -5.4 -5.1 -6.2 -5.2All items less energy ..................................................................... 172.5 173.0 173.2 173.3 2.6 2.1 2.1 1.9 2.4 2.0
All items less food and energy ................................................... 175.0 175.6 175.7 175.8 2.6 2.1 1.8 1.8 2.3 1.8Commodities less food and energy commodities ................... 143.5 144.4 144.4 143.8 .8 1.4 -.3 .8 1.1 .3
Energy commodities ................................................................ 88.4 86.2 86.2 85.8 -13.0 -10.7 -9.0 -11.3 -11.9 -10.1Services less energy services .................................................. 192.8 193.1 193.4 193.8 3.4 2.5 3.0 2.1 3.0 2.5
1 Not seasonally adjusted. January, 1999.2 Indexes on a December 1997=100 base. 4 Indexes on a December 1982=100 base.3 This index series was calculated using a Laspeyres estimator. All other 5 Indexes on a December 1988=100 base.
item stratum index series converted to a geometric means estimator in NOTE: Index applies to a month as a whole, not to any specific date.
10Digitized for FRASER http://fraser.stlouisfed.org/ Federal Reserve Bank of St. Louis
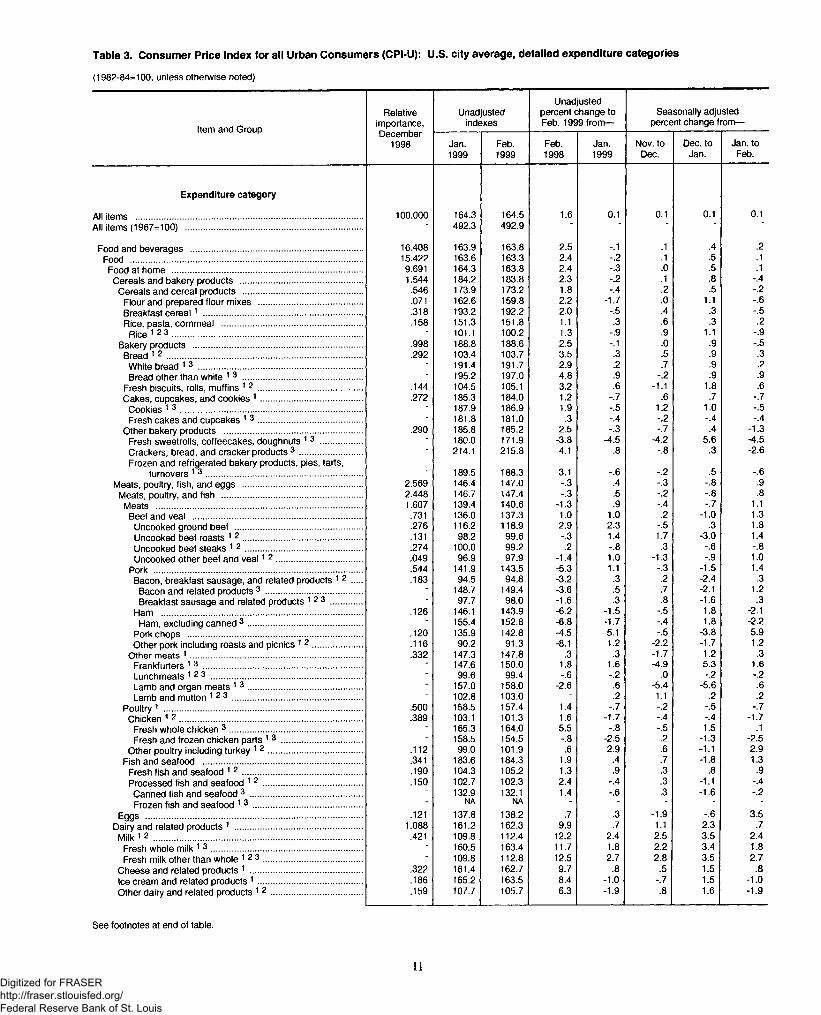
Table 3. Consumer Price Index for all Urban Consumers (CPI-U): U.S. city average, detailed expenditure categories
(1982-84=100, unless otherwise noted)
Item and Group
Relativeimportance,
Unadjustedindexes
Unadjusted percent change to Feb. 1999 from—
Seasonally adjusted percent change from—
December1998 Jan.
1999Feb.1999
Feb.1998
Jan.1999
Nov. to Dec.
Dec. to Jan.
Jan. to Feb.
Expenditure category
All items ........................................................................................... 100.000 164.3 164.5 1.6 0.1 0.1 0.1 0.1All items (1967-100) .......................................................................... 492.3 492.9 - - - - -
Food and beverages ........................................................................ 16.408 163.9 163.8 2.5 -.1 .1 .4 .2Food .............................................................................. 15.422 163.6 163.3 2.4 -.2 .1 .5 .1Food at home ............................................................................... 9.691 164.3 163.8 2.4 -.3 .0 .5 .1
Cereals and bakery products ................................................... 1.544 184.2 183.8 2.3 -.2 .1 .8 -.4Cereals and cereal products .................................................. .546 173.9 173.2 1.8 -.4 .2 .5 -.2
Flour and prepared flour mixes ........................................... .071 162.6 159.8 2.2 -1.7 .0 1.1 -.6Breakfast cereal ̂ .................................................................. .318 193.2 192.2 2.0 -.5 .4 .3 -.5Rice pasta cornmeal ........................................................... .158 151.3 151.8 1.1 .3 .6 .3 .2
Rice 12 3 ............................................................................... 101.1 100.2 1.3 -.9 .9 1.1 -.9Bakery products ....................................................................... .998 188.8 188.6 2.5 -.1 .0 .9 -.5
Bread * 2 ................................................................................. .292 103.4 103.7 3.5 .3 .5 .9 .3White bread ̂ 3 ................................................................... - 191.4 191.7 2.9 .2 .7 .9 .2Bread other than white 1 3 .................................................. - 195.2 197.0 4.8 .9 -.2 .9 .9
Fresh biscuits rolls muffins * 2 ........................................... .144 104.5 105.1 3.2 .6 -1.1 1.8 .6Cakes cupcakes and cookies ^ .......................................... .272 185.3 184.0 1.2 -.7 .6 .7 -.7
Cookies ̂ 3 ............................................................................ 187.9 186.9 1.9 -.5 1.2 1.0 -.5Fresh cakes and cupcakes ̂ 3 ........................................... - 181.8 181.0 .3 -.4 -.2 -.4 -.4
Other bakery products .......................................................... .290 185.8 185.2 2.5 -.3 -.7 .4 -1.3Fresh sweetrolls coffeecakes, doughnuts 1 3 ................. 180.0 171.9 -3.8 -4.5 -4.2 5.6 -4.5Crackers bread and cracker products 3 .......................... - 214.1 215.8 4.1 .8 -.8 .3 -2.6Frozen and refrigerated bakery products, pies, tarts,
turnovers 1 3 ................................................................._ 189.5 188.3 3.1 -.6 -.2 .5 -.6
Meats, poultry fish, and eggs .................................................. 2.569 146.4 147.0 -.3 .4 -.3 -.8 .9Meats poultry and fish ........................................................... 2.448 146.7 147.4 -.3 .5 -.2 -.8 .8
Meats ..................................................................................... 1.607 139.4 140.6 -1.3 .9 -.4 -.7 1.1Beef and veal ....................................................................... .731 136.0 137.3 1.0 1.0 .2 -1.0 1.3
Uncooked ground beef ..................................................... .276 116.2 118.9 2.9 2.3 -.5 .3 1.8Uncooked beef roasts ̂ 2 .................................................. .131 98.2 99.6 -.3 1.4 1.7 -3.0 1.4Uncooked beef steaks ̂ 2 ................................................. .274 100.0 99.2 .2 -.8 .3 -.6 -.8Uncooked other beef and veal ̂ 2 .................................... .049 96.9 97.9 -1.4 1.0 -1.3 -.9 1.0
Pork ..................................................................................... .544 141.9 143.5 -5.3 1.1 -.3 -1.5 1.4Bacon, breakfast sausage, and related products 1 2 ....
Bacon and related products 3 .........................................183 94.5
148.794.8
149.4-3.2-3.6
.3
.5.2.7
-2.4-2.1
.31.2
Breakfast sausage and related products 12 3 ............. - 97.7 98.0 -1.6 .3 .8 -1.6 .3Ham .................................................................................. .126 146.1 143.9 -6.2 -1.5 -.5 1.8 -2.1
Ham excluding canned 3 ................................................ 155.4 152.8 -6.8 -1.7 -.4 1.8 -2.2Pork chops ......................................................................... .120 135.9 142.8 -4.5 5.1 -.5 -3.8 5.9Other pork including roasts and picnics * 2 ..................... .116 90.2 91.3 -8.1 1.2 -2.2 -1.7 1.2
Other meats ^ ........................................................................ .332 147.3 147.8 .3 .3 -1.7 1.2 .3Frankfurters 1 3 .................................................................. 147.6 150.0 1.8 1.6 -4.9 5.3 1.6Lunchmeats 12 3 ............................................................... - 99.6 99.4 -.6 -.2 .0 -.2 -.2Lamb and organ meats ̂ 3 ................................................ - 157.0 158.0 -2.6 .6 -5.4 -5.6 .6Lamb and mutton 1 2 3 ...................................................... - 102.8 103.0 .2 1.1 .2 .2
Poultry i ................................................................................... .500 158.5 157.4 1.4 -.7 -.2 -.5 -.7Chicken ̂ 2 ............................................................................ .389 103.1 101.3 1.6 -1.7 -.4 -.4 -1.7
Fresh whole chicken 3 ....................................................... 165.3 164.0 5.5 -.8 -.5 1.5 .1Fresh and frozen chicken parts ̂ 3 .................................. - 158.5 154.5 -.8 -2.5 .2 -1.3 -2.5
Other poultry including turkey ̂ 2 ....................................... .112 99.0 101.9 .6 2.9 .6 -1.1 2.9Fish and seafood .................................................................. .341 183.6 184.3 1.9 .4 .7 -1.8 1.3
Fresh fish and seafood 2 ............... ................................. .190 104.3 105.2 1.3 .9 .3 .8 .9Processed fish and seafood ̂ 2 ......................................... .150 102.7 102.3 2.4 -.4 .3 -1.1 -.4Canned fish and seafood 3 ............................................... 132.9 132.1 1.4 -.6 .3 -1.6 -.2Frozen fish and seafood 3 .............................................. - NA NA - - - - -
Eaas ................................................................................................................................ .121 137.8 138.2 .7 .3 -1.9 -.6 3.5Dairy and related products * ...................................................................................... 1.088 161.2 162.3 9.9 .7 1.1 2.3 .7
Milk 1 2 ............................................................................................................................................... .421 109.8 112.4 12.2 2.4 2.5 3.5 2.4Fresh whole milk ̂ 3 .......................................................................................................
- 160.5 163.4 11.7 1.8 2.2 3.4 1.8Fresh milk other than whole ̂ 2 3 ....................................................................
- 109.8 112.8 12.5 2.7 2.8 3.5 2.7Cheese and related products ̂ ............................................................................. .322 161.4 162.7 9.7 .8 .5 1.5 .8Ice cream and related products ^ ........................................... .186 165.2 163.5 8.4 -1.0 -.7 1.5 -1.0Other dairy and related products ̂ 2 ............................................................... .159 107.7 105.7 6.3 -1.9 .8 1.6 -1.9
See footnotes at end of table.
11Digitized for FRASER http://fraser.stlouisfed.org/ Federal Reserve Bank of St. Louis
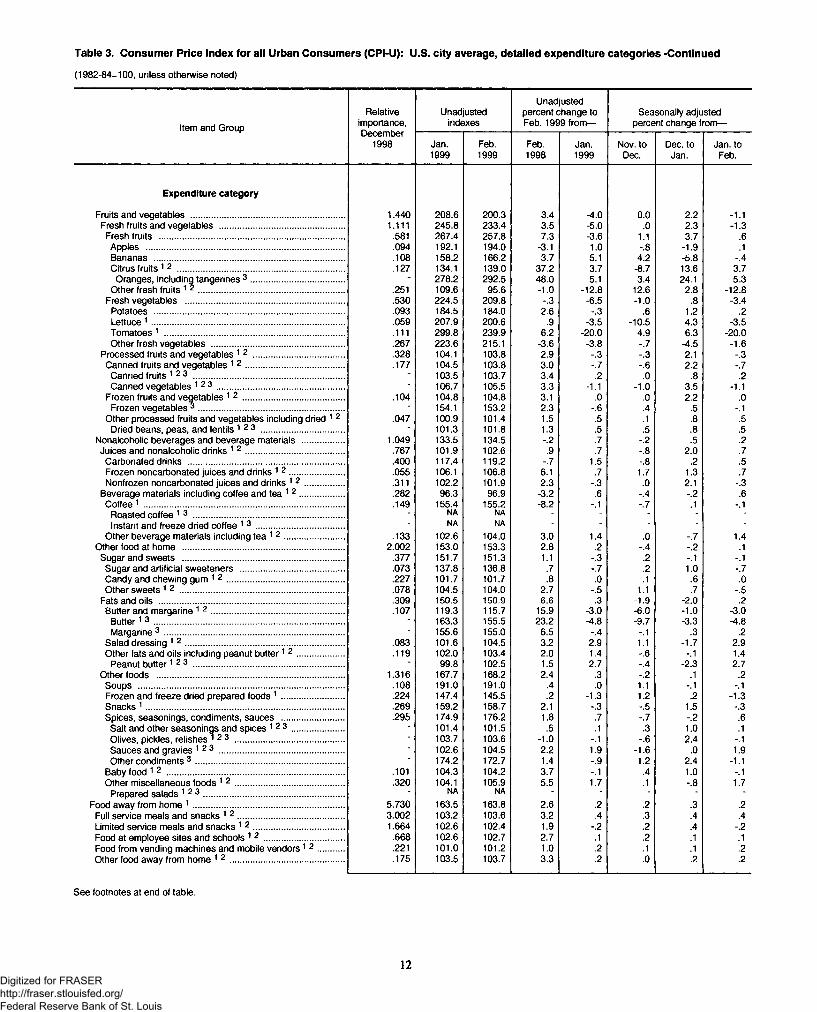
Table 3. Consumer Price Index for all Urban Consumers (CPI-U): U.S. city average, detailed expenditure categories -Continued
(1982-84=100, unless otherwise noted)
Item and Group
Relativeimportance,December
1998
Unadjustedindexes
Unadjusted percent change to Feb. 1999 from—
Seasonally adjusted percent change from—
Jan.1999
Feb.1999
Feb.1998
Jan.1999
Nov. to Dec.
Dec. to Jan.
Jan. to Feb.
Expenditure category
Fruits and vegetables ................................................................ 1.440 208.6 200.3 3.4 -4.0 0.0 2.2 -1.1Fresh fruits and vegetables .................................................... 1.111 245.8 233.4 3.5 -5.0 .0 2.3 -1.3
Fresh fruits ............................................................................. .581 267.4 257.8 7.3 -3.6 1.1 3.7 .6Apples ................................................................................... .094 192.1 194.0 -3.1 1.0 -.8 -1.9 .1Bananas ............................................................................... .108 158.2 166.2 3.7 5.1 4.2 -5.8 -.4Citrus fruits 1 2 ...................................................................... .127 134.1 139.0 37.2 3.7 -8.7 13.6 3.7
Oranges, including tangerines 3 ....................................... - 278.2 292.5 48.0 5.1 3.4 24.1 5.3Other fresh fruits 1 2 ............................................................. .251 109.6 95.6 -1.0 -12.8 12.6 2.8 -12.8
Fresh vegetables .................................................................. .530 224.5 209.8 -.3 -6.5 -1.0 .8 -3.4Potatoes ............................................................................... .093 184.5 184.0 2.6 -.3 .6 1.2 .2Lettuce 1 ................................................................................ .059 207.9 200.6 .9 -3.5 -10.5 4.3 -3.5Tomatoes 1 ........................................................................... .111 299.8 239.9 6.2 -20.0 4.9 6.3 -20.0Other fresh vegetables ....................................................... .267 223.6 215.1 -3.6 -3.8 -.7 -4.5 -1.6
Processed fruits and vegetables 1 2 ...................................... .328 104.1 103.8 2.9 -.3 -.3 2.1 -.3Canned fruits and vegetables 1 2 ......................................... .177 104.5 103.8 3.0 -.7 -.6 2.2 -.7
Canned fruits 1 2 3 ............................................................... - 103.5 103.7 3.4 .2 .0 .8 .2Canned vegetables 1 2 3 ..................................................... - 106.7 105.5 3.3 -1.1 -1.0 3.5 -1.1
Frozen fruits and vegetables 1 2 ..........................................Frozen vegetab les*.............................................................
.104 104.8 104.8 3.1 .0 .0 2.2 .0- 154.1 153.2 2.3 -.6 .4 .5 -.1
Other processed fruits and vegetables including dried 1 2 .047 100.9 101.4 1.5 .5 .1 .8 .5Dried beans, peas, and lentils 1 2 3 ................................... • 101.3 101.8 1.3 .5 .5 .8 .5
Nonalcoholic beverages and beverage materials ................. 1.049 133.5 134.5 -.2 .7 -.2 .5 .2Juices and nonalcoholic drinks 1 2 ......................................... .767 101.9 102.6 .9 .7 -.8 2.0 .7
Carbonated drinks ................................................................. .400 117.4 119.2 -.7 1.5 -.8 .2 .5Frozen noncarbonated juices and drinks 1 2 ....................... .055 106.1 106.8 6.1 .7 1.7 1.3 .7Nonfrozen noncarbonated juices and drinks 1 2 ................ .311 102.2 101.9 2.3 -.3 .0 2.1 -.3
Beverage materials including coffee and tea 1 2 ................... .282 96.3 96.9 -3.2 .6 -.4 -.2 .6Coffee 1 .................................................................................... .149 155.4 155.2 -8.2 -.1 -.7 .1 -.1
Roasted coffee 1 3 ............................................................... - NA NA - - - - -Instant and freeze dried coffee 1 3 ..................................... - NA NA - - - - -
Other beverage materials including tea 1 2 ......................... .133 102.6 104.0 3.0 1.4 .0 -.7 1.4Other food at home ................................................................... 2.002 153.0 153.3 2.8 .2 -.4 -.2 .1
Sugar and sweets ................................................................... .377 151.7 151.3 1.1 -.3 .2 -.1 -.1Sugar and artificial sweeteners ........................................... .073 137.8 136.8 .7 -.7 .2 1.0 -.7Candy and chewing gum 1 2 ................................................. .227 101.7 101.7 .8 .0 .1 .6 .0Other sweets 1 2 ..................................................................... .078 104.5 104.0 2.7 -.5 1.1 .7 -.5
Fats and oils ............................................................................. .309 150.5 150.9 6.6 .3 -1.9 -2.0 .2Butter and margarine 1 2 ....................................................... .107 119.3 115.7 15.9 -3.0 -6.0 -1.0 -3.0
B utte r1 3 ............................................................................... - 163.3 155.5 23.2 -4.8 -9.7 -3.3 -4.8Margarine 3 ........................................................................... - 155.6 155.0 6.5 -.4 -.1 .3 .2
Salad dressing 1 2 .................................................................. .083 101.6 104.5 3.2 2.9 1.1 -1.7 2.9Other fats and oils including peanut bu tter1 2 .................... .119 102.0 103.4 2.0 1.4 -.6 -.1 1.4
Peanut bu tter1 2 3 ............................................................... - 99.8 102.5 1.5 2.7 -.4 -2.3 2.7Other foods .............................................................................. 1.316 167.7 168.2 2.4 .3 -.2 .1 .2
Soups ...................................................................................... .108 191.0 191.0 .4 .0 1.1 -.1 -.1Frozen and freeze dried prepared foods 1 .......................... .224 147.4 145.5 .2 -1.3 1.2 .2 -1.3Snacks 1 ................................................................................... .269 159.2 158.7 2.1 -.3 -.5 1.5 -.3Spices, seasonings, condiments, sauces .......................... .295 174.9 176.2 1.8 .7 -.7 -.2 .6
Salt and other seasonings and spices 1 2 3 ...................... ■ 101.4 101.5 .5 .1 .3 1.0 .1Olives, pickles, relishes 1 2 3 ............................................. - 103.7 103.6 -1.0 -.1 -.6 2.4 -.1Sauces and gravies 1 2 3 .................................................... ■ 102.6 104.5 2.2 1.9 -1.6 .0 1.9Other condiments 3 .............................................................. - 174.2 172.7 1.4 -.9 1.2 2.4 -1.1
Baby food 12 .......................................................................... .101 104.3 104.2 3.7 -.1 .4 1.0 -.1Other miscellaneous foods 1 2 ............................................. .320 104.1 105.9 5.5 1.7 .1 -.8 1.7
Prepared salads 1 2 3 ........................................................... - NA NA - - - - -Food away from home 1 ............................................................... 5.730 163.5 163.8 2.6 .2 .2 .3 .2
Full service meals and snacks 1 2 ............................................ 3.002 103.2 103.6 3.2 .4 .3 .4 .4Limited service meals and snacks 1 2 ...................................... 1.664 102.6 102.4 1.9 -.2 .2 .4 -.2Food at employee sites and schools 1 2 ................................. .668 102.6 102.7 2.7 .1 .2 .1 .1Food from vending machines and mobile vendors1 2 ........... .221 101.0 101.2 1.0 .2 .1 .1 .2Other food away from home 1 2 ................................................ .175 103.5 103.7 3.3 .2 .0 .2 .2
See footnotes at end of table.
12Digitized for FRASER http://fraser.stlouisfed.org/ Federal Reserve Bank of St. Louis
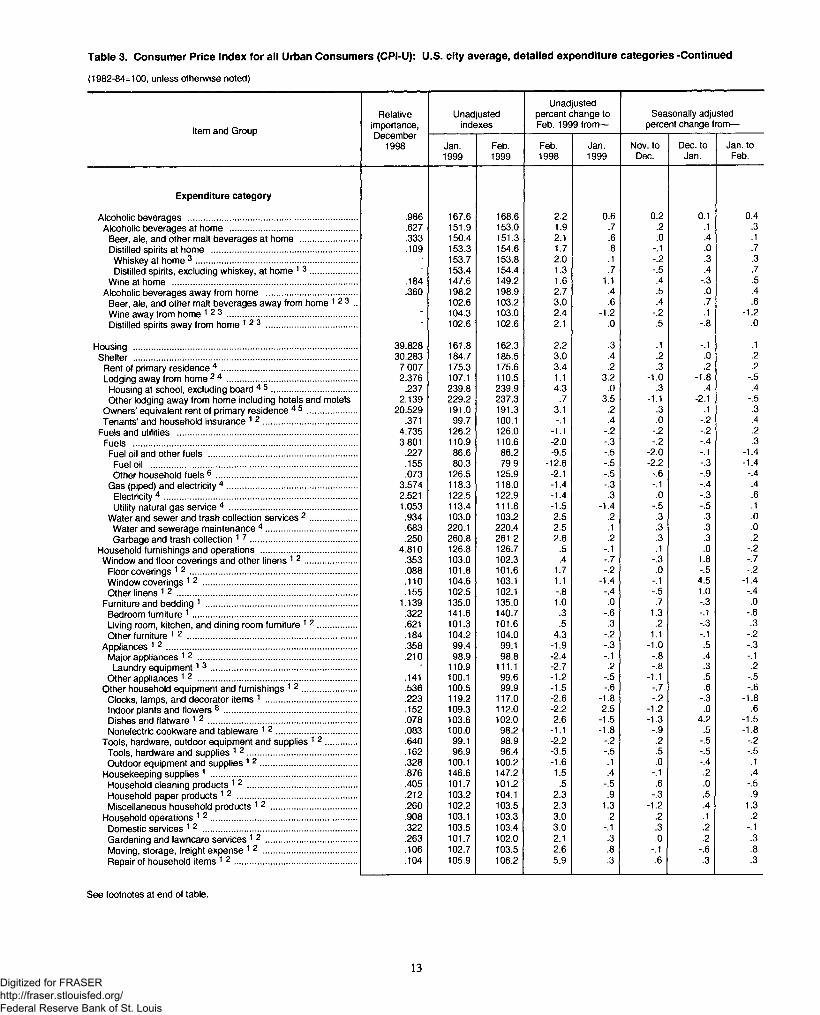
Table 3. Consumer Price Index for all Urban Consumers (CPI-U): U.S. city average, detailed expenditure categories -Continued
(1982-84=100, unless otherwise noted)
Item and Group
Relativeimportance,
Unadjustedindexes
Unadjusted percent change to Feb. 1999 from—
Seasonally adjusted percent change from—
December1998 Jan.
1999Feb.1999
Feb.1998
Jan.1999
Nov. to Dec.
Dec. to Jan.
Jan. to Feb.
Expenditure category
Alcoholic beverages ....................................................................... .986 167.6 168.6 2.2 0.6 0.2 0.1 0.4Alcoholic beverages at home ..................................................... .627 151.9 153.0 1.9 .7 .2 .1 .3
Beer, ale, and other malt beverages at home ........................ .333 150.4 151.3 2.1 .6 .0 .4 .1Distilled spirits at home ............................................................. .109 153.3 154.6 1.7 .8 -.1 .0 .7Whiskey at home 3 ................................................................... - 153.7 153.8 2.0 .1 -.2 .3 .3Distilled spirits, excluding whiskey, at home 1 3 ................... - 153.4 154.4 1.3 .7 -.5 .4 .7
Wine at home ............................................................................. .184 147.6 149.2 1.6 1.1 .4 -.3 .5Alcoholic beverages away from home ...................................... .360 198.2 198.9 2.7 .4 .5 .0 .4
Beer, ale, and other malt beverages away from home 1 2 3 .. - 102.6 103.2 3.0 .6 .4 .7 .6Wine away from home 1 2 3 ...................................................... - 104.3 103.0 2.4 -1.2 -.2 .1 -1.2Distilled spirits away from home 1 2 3 ...................................... 102.6 102.6 2.1 .0 .5 -.8 .0
Housing ............................................................................................. 39.828 161.8 162.3 2.2 .3 .1 -.1 .1Shelter ............................................................................................. 30.283 184.7 185.5 3.0 .4 .2 .0 .2
Rent of primary residence 4 ........................................................ 7.007 175.3 175.6 3.4 .2 .3 .2 .2Lodging away from home 2 4 ...................................................... 2.376 107.1 110.5 1.1 3.2 -1.0 -1.8 -.5
Housing at school, excluding board 4 5 .................................... .237 239.8 239.9 4.3 .0 .3 .4 .4Other lodging away from home including hotels and motels 2.139 229.2 237.3 .7 3.5 -1.1 -2.1 -.5
Owners’ equivalent rent of primary residence 4 5 .................... 20.529 191.0 191.3 3.1 .2 .3 .1 .3Tenants’ and household insurance 1 2 ....................................... .371 99.7 100.1 -.1 .4 .0 -.2 .4
Fuels and utilities ........................................................................... 4.735 126.2 126.0 -1.1 -.2 -.2 -.2 .2Fuels ............................................................................................. 3.801 110.9 110.6 -2.0 -.3 -.2 -.4 .3
Fuel oil and other fuels .............................................................. .227 86.6 86.2 -9.5 -.5 -2.0 -.1 -1.4Fuel oil ...................................................................................... .155 80.3 79.9 -12.6 -.5 -2.2 -.3 -1.4Other household fuels 6 ........................................................... .073 126.5 125.9 -2.1 -.5 -.6 -.9 -.4
Gas (piped) and electricity 4 ...................................................... 3.574 118.3 118.0 -1.4 -.3 -.1 -.4 .4Electricity 4 ................................................................................ 2.521 122.5 122.9 -1.4 .3 .0 -.3 .6Utility natural gas service 4 ..................................................... 1.053 113.4 111.8 -1.5 -1.4 -.5 -.5 .1
Water and sewer and trash collection services 2 ................... .934 103.0 103.2 2.5 .2 .3 .3 .0Water and sewerage maintenance 4 ...................................... .683 220.1 220.4 2.5 .1 .3 .3 .0Garbage and trash collection 1 7 ............................................ .250 260.8 261.2 2.6 .2 .3 .3 .2
Household furnishings and operations ........................................ 4.810 126.8 126.7 .5 -.1 .1 .0 -.2Window and floor coverings and other linens 1 2 ...................... .353 103.0 102.3 .4 -.7 -.3 1.8 -.7
Floor coverings 1 2 ...................................................................... .088 101.8 101.6 1.7 -.2 .0 -.5 -.2Window coverings 1 2 ................................................................ .110 104.6 103.1 1.1 -1.4 -.1 4.5 -1.4Other linens 1 2 ........................................................................... .155 102.5 102.1 -.8 -.4 -.5 1.0 -.4
Furniture and bedding 1 ............................................................... 1.139 135.0 135.0 1.0 .0 .7 -.3 .0Bedroom furniture 1 .................................................................... .322 141.6 140.7 .3 -.6 1.3 -.1 -.6Living room, kitchen, and dining room furniture 1 2 ................ .621 101.3 101.6 .5 .3 .2 -.3 .3Other furniture 1 2 ....................................................................... .184 104.2 104.0 4.3 -.2 1.1 -.1 -.2
Appliances 1 2 ............................................................................... .358 99.4 99.1 -1.9 -.3 -1.0 .5 -.3Major appliances 1 2 .................................................................. .210 98.9 98.8 -2.4 -.1 -.8 .4 -.1
Laundry equipment1 3 ............................................................. ■ 110.9 111.1 -2.7 .2 -.8 .3 .2Other appliances 1 2 .................................................................. .141 100.1 99.6 -1.2 -.5 -1.1 .5 -.5
Other household equipment and furnishings 1 2 ....................... .536 100.5 99.9 -1.5 -.6 -.7 .6 -.6Clocks, lamps, and decorator items 1 ...................................... .223 119.2 117.0 -2.6 -1.8 -.2 -.3 -1.8Indoor plants and flowers 8 ....................................................... .152 109.3 112.0 -2.2 2.5 -1.2 .0 .6Dishes and flatware 1 2 .............................................................. .078 103.6 102.0 2.6 -1.5 -1.3 4.2 -1.5Nonelectric cookware and tableware 1 2 ................................. .083 100.0 98.2 -1.1 -1.8 -.9 .5 -1.8
Tools, hardware, outdoor equipment and supplies 1 2 ............. .640 99.1 98.9 -2.2 -.2 .2 -.5 -.2Tools, hardware and supplies 1 2 .............................................. .162 96.9 96.4 -3.5 -.5 .5 -.5 -.5Outdoor equipment and supplies 1 2 ........................................ .328 100.1 100.2 -1.6 .1 .0 -.4 .1
Housekeeping supplies 1 ............................................................. .876 146.6 147.2 1.5 .4 -.1 .2 .4Household cleaning products 1 2 .............................................. .405 101.7 101.2 .5 -.5 .6 .0 -.5Household paper products 1 2 .................................................. .212 103.2 104.1 2.3 .9 -.3 .5 .9Miscellaneous household products 1 2 .................................... .260 102.2 103.5 2.3 1.3 -1.2 .4 1.3
Household operations 1 2 ............................................................. .908 103.1 103.3 3.0 .2 .2 .1 .2Domestic services 1 2 ................................................................ .322 103.5 103.4 3.0 -.1 .3 .2 -.1Gardening and lawncare services 1 2 ...................................... .263 101.7 102.0 2.1 .3 .0 .2 .3Moving, storage, freight expense 1 2 ....................................... .106 102.7 103.5 2.6 .8 -.1 -.6 .8Repair of household items 1 2 ................................................... .104 105.9 106.2 5.9 .3 .6 .3 .3
See footnotes at end of table.
13Digitized for FRASER http://fraser.stlouisfed.org/ Federal Reserve Bank of St. Louis
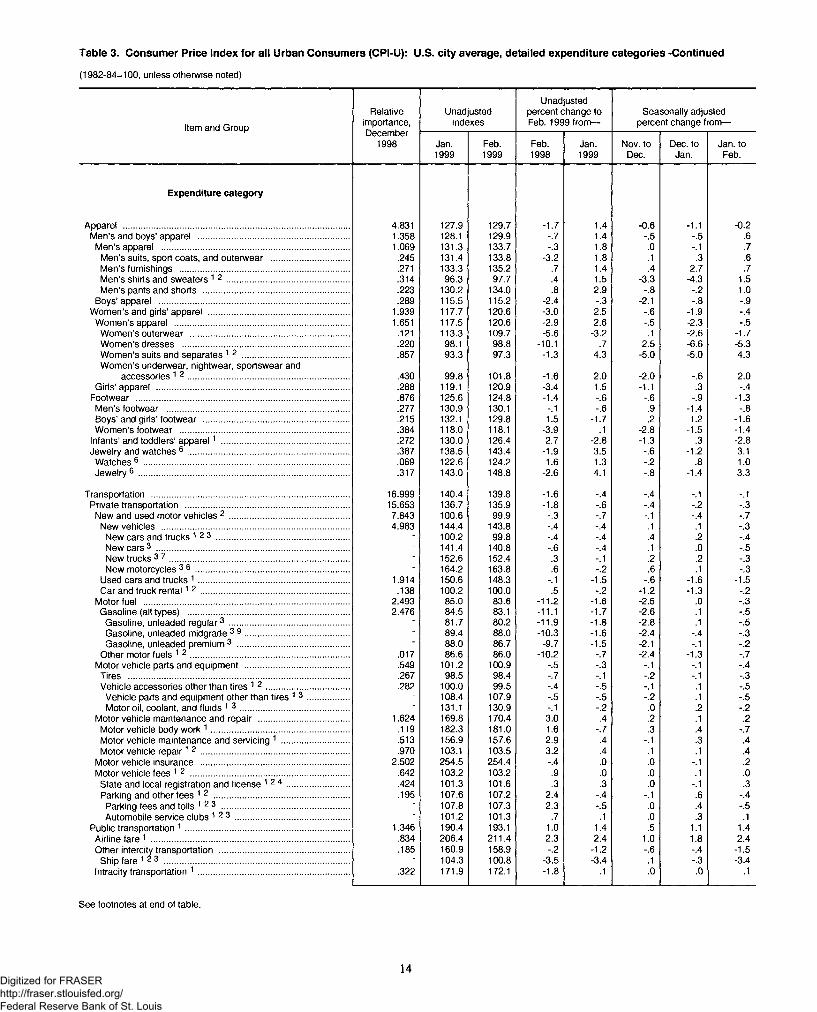
Table 3. Consumer Price Index for all Urban Consumers (CPI-U): U.S. city average, detailed expenditure categories -Continued
(1982-84=100, unless otherwise noted)
Item and Group
Relativeimportance,December
1998
Unadjustedindexes
Unadjusted percent change to Feb. 1999 from—
Seasonally adjusted percent change from—
Jan.1999
Feb.1999
Feb.1998
Jan.1999
Nov. to Dec.
Dec. to Jan.
Jan. to Feb.
Expenditure category
Apparel .............................................................................................. 4.831 127.9 129.7 -1.7 1.4 -0.6 -1.1 -0.2Men’s and boys’ apparel ............................................................... 1.358 128.1 129.9 -.7 1.4 -.5 -.5 .6
Men’s apparel .............................................................................. 1.069 131.3 133.7 -.3 1.8 .0 -.1 .7Men’s suits, sport coats, and outerwear ................................ .245 131.4 133.8 -3.2 1.8 .1 .3 .6Men’s furnishings ....................................................................... .271 133.3 135.2 .7 1.4 .4 2.7 .7Men’s shirts and sweaters 1 2 ................................................... .314 96.3 97.7 .4 1.5 -3.3 -4.3 1.5Men’s pants and shorts ............................................................. .223 130.2 134.0 .8 2.9 -.8 -.2 1.0
Boys’ apparel ............................................................................... .289 115.5 115.2 -2.4 -.3 -2.1 -.8 -.9Women’s and girls’ apparel ........................................................... 1.939 117.7 120.6 -3.0 2.5 -.6 -1.9 -.4
Women’s apparel ......................................................................... 1.651 117.5 120.6 -2.9 2.6 -.5 -2.3 -.5Women’s outerwear .................................................................. .121 113.3 109.7 -5.6 -3.2 .1 -2.6 -1.7Women’s dresses ..................................................................... .220 98.1 98.8 -10.1 .7 2.5 -6.6 -5.3Women’s suits and separates 1 2 ............................................ .857 93.3 97.3 -1.3 4.3 -5.0 -5.0 4.3Women’s underwear, nightwear, sportswear and
accessories 1 2 ................................................................... .430 99.8 101.8 -1.6 2.0 -2.0 -.6 2.0Girls’ apparel ................................................................................ .288 119.1 120.9 -3.4 1.5 -1.1 .3 -.4
Footwear ......................................................................................... .876 125.6 124.8 -1.4 -.6 -.6 -.9 -1.3Men’s footwear ............................................................................. .277 130.9 130.1 -.1 -.6 .9 -1.4 -.8Boys’ and girls’ footwear ............................................................. .215 132.1 129.8 1.5 -1.7 .2 1.2 -1.6Women’s footwear ...................................................................... .384 118.0 118.1 -3.9 .1 -2.8 -1.5 -1.4
Infants’ and toddlers’ apparel1 ..................................................... .272 130.0 126.4 2.7 -2.8 -1.3 .3 -2.8Jewelry and watches 6 ................................................................... .387 138.5 143.4 -1.9 3.5 -.6 -1.2 3.1
Watches6 ...................................................................................... .069 122.6 124.2 1.6 1.3 -.2 .8 1.0Jewelry 6 ........................................................................................ .317 143.0 148.8 -2.6 4.1 -.8 -1.4 3.3
Transportation .................................................................................. 16.999 140.4 139.8 -1.6 -.4 -.4 -.1 -.1Private transportation .................................................................... 15.653 136.7 135.9 -1.8 -.6 -.4 -.2 -.3
New and used motor vehicles 2 .................................................. 7.843 100.6 99.9 -.3 -.7 -.1 -.4 -.7New vehicles .............................................................................. 4.983 144.4 143.8 -.4 -.4 .1 .1 -.3New cars and trucks 1 2 3 ....................................................... - 100.2 99.8 -.4 -.4 .4 .2 -.4New cars 3 ................................................................................ - 141.4 140.8 -.6 -.4 .1 .0 -.5New trucks 3 7 ........................................................................... - 152.6 152.4 .3 -.1 .2 .2 -.3New motorcycles 3 6 ................................................................ - 164.2 163.8 .6 -.2 .6 .1 -.3
Used cars and trucks 1 ............................................................... 1.914 150.6 148.3 -.1 -1.5 -.6 -1.6 -1.5Car and truck renta l1 2 .............................................................. .138 100.2 100.0 .5 -.2 -1.2 -1.3 -.2
Motor fuel ...................................................................................... 2.493 85.0 83.6 -11.2 -1.6 -2.5 .0 -.3Gasoline (all types) ................................................................... 2.476 84.5 83.1 -11.1 -1.7 -2.6 .1 -.5
Gasoline, unleaded regular3 .................................................. - 81.7 80.2 -11.9 -1.8 -2.8 .1 -.5Gasoline, unleaded midgrade 3 9 ........................................... - 89.4 88.0 -10.3 -1.6 -2.4 -.4 -.3Gasoline, unleaded premium 3 ............................................... - 88.0 86.7 -9.7 -1.5 -2.1 -.1 -.2
Other motor fuels 1 2 .................................................................. .017 86.6 86.0 -10.2 -.7 -2.4 -1.3 -.7Motor vehicle parts and equipment ........................................... .549 101.2 100.9 -.5 -.3 -.1 -.1 -.4Tires ............................................................................................ .267 98.5 98.4 -.7 -.1 -.2 -.1 -.3Vehicle accessories other than tires 1 2 ................................... .282 100.0 99.5 -.4 -.5 -.1 .1 -.5
Vehicle parts and equipment other than tires 1 3 ................. - 108.4 107.9 -.5 -.5 -.2 .1 -.5Motor oil, coolant, and fluids 1 3 ............................................. • 131.1 130.9 -.1 -.2 .0 .2 -.2
Motor vehicle maintenance and repair ...................................... 1.624 169.8 170.4 3.0 .4 .2 .1 .2Motor vehicle body work 1 ......................................................... .119 182.3 181.0 1.6 -.7 .3 .4 -.7Motor vehicle maintenance and servicing 1 ............................ .513 156.9 157.6 2.9 .4 -.1 .3 .4Motor vehicle repa ir1 2 .............................................................. .970 103.1 103.5 3.2 .4 .1 .1 .4
Motor vehicle insurance .............................................................. 2.502 254.5 254.4 -.4 .0 .0 -.1 .2Motor vehicle fees 1 2 .................................................................. .642 103.2 103.2 .9 .0 .0 .1 .0
State and local registration and license 1 2 4 .......................... .424 101.3 101.6 .3 .3 .0 -.1 .3Parking and other fees 1 2 ........................................................ .195 107.6 107.2 2.4 -.4 -.1 .6 -.4
Parking fees and tolls 1 2 3 ..................................................... - 107.8 107.3 2.3 -.5 .0 .4 -.5Automobile service clubs 1 2 3 ................................................ - 101.2 101.3 .7 .1 .0 .3 .1
Public transportation 1 .................................................................... 1.346 190.4 193.1 1.0 1.4 .5 1.1 1.4Airline fare 1 .................................................................................. .834 206.4 211.4 2.3 2.4 1.0 1.8 2.4Other intercity transportation ...................................................... .185 160.9 158.9 -.2 -1.2 -.6 -.4 -1.5
Ship fare 1 2 3 ............................................................................. - 104.3 100.8 -3.5 -3.4 .1 -.3 -3.4Intracity transportation 1 ............................................................... .322 171.9 172.1 -1.8 .1 .0 .0 .1
See footnotes at end of table.
14Digitized for FRASER http://fraser.stlouisfed.org/ Federal Reserve Bank of St. Louis
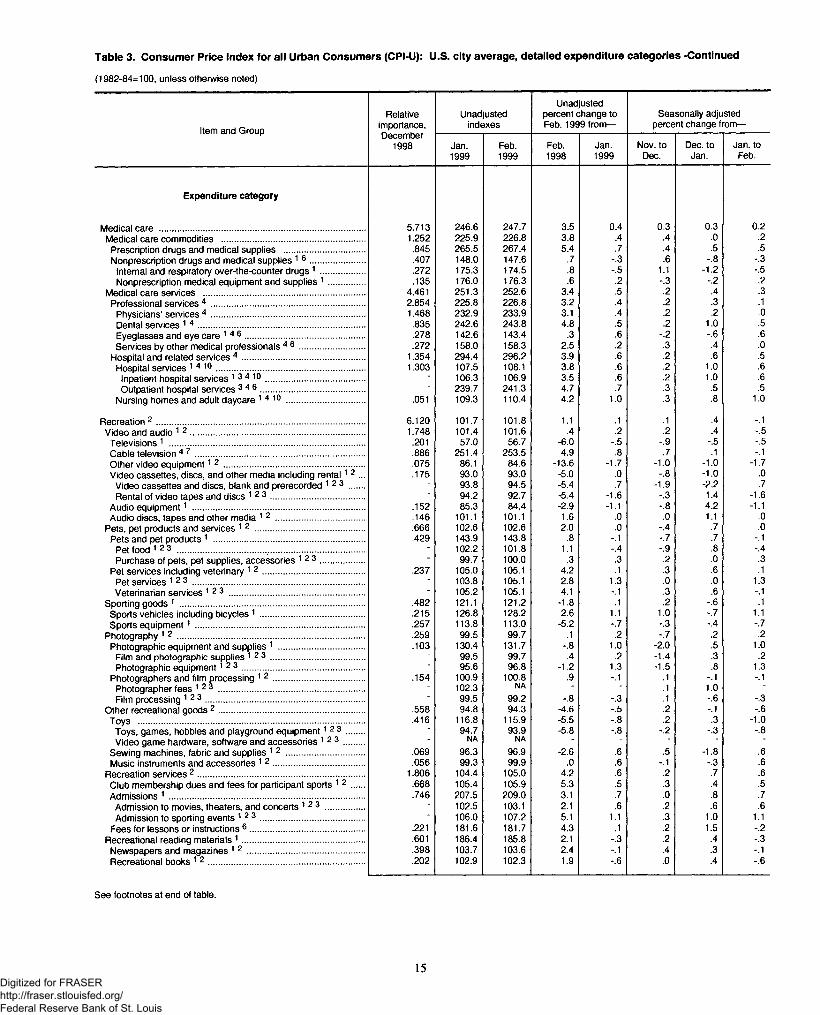
Table 3. Consumer Price Index for all Urban Consumers (CPI-U): U.S. city average, detailed expenditure categories -Continued
(1982-84=100, unless otherwise noted)
Item and Group
Relativeimportance,
Unadjustedindexes
Unadjusted percent change to Feb. 1999 from—
Seasonally adjusted percent change from—
December1998 Jan.
1999Feb.1999
Feb.1998
Jan.1999
Nov. to Dec.
Dec. to Jan.
Jan. to Feb.
Expenditure category
Medical care ...................................................................................... 5.713 246.6 247.7 3.5 0.4 0.3 0.3 0.2Medical care commodities ............................................................ 1.252 225.9 226.8 3.8 .4 .4 .0 .2
Prescription drugs and medical supplies .................................. .845 265.5 267.4 5.4 .7 .4 .5 .5Nonprescription drugs and medical supplies ̂ ® ....................... .407 148.0 147.6 .7 -.3 .6 -.8 -.3
Internal and respiratory over-the-counter drugs ................... .272 175.3 174.5 .8 -.5 1.1 -1.2 -.5Nonprescription medical equipment and supplies ^ ............... .135 176.0 176.3 .6 .2 -.3 -.2 .2
Medical care services ................................................................... 4.461 251.3 252.6 3.4 .5 .2 .4 .3Professional services 4 ................................................................ 2.854 225.8 226.8 3.2 .4 .2 .3 .1
Physicians’ services 4 ................................................................ 1.468 232.9 233.9 3.1 .4 .2 .2 .0Dental services 1 4 ...................................................................... .835 242.6 243.8 4.8 .5 .2 1.0 .5Eyeglasses and eye care 14 6 .................................................. .278 142.6 143.4 .3 .6 -.2 -.6 .6Services by other medical professionals 4 ® ........................... .272 158.0 158.3 2.5 .2 .3 .4 .0
Hospital and related services 4 ................................................... 1.354 294.4 296.2 3.9 .6 .2 .6 .5Hospital services i 4 1 0 .............................................................. 1.303 107.5 108.1 3.8 .6 .2 1.0 .6
Inpatient hospital services 1 3 4 1 0 .................................................. 106.3 106.9 3.5 .6 .2 1.0 .6Outpatient hospital services 3 4 6 ............................................ - 239.7 241.3 4.7 .7 .3 .5 .5
Nursing homes and adult daycare 1 4 10 ................................. .051 109.3 110.4 4.2 1.0 .3 .8 1.0
Recreation 2 ....................................................................................... 6.120 101.7 101.8 1.1 .1 .1 .4 -.1Video and audio ̂ 2 ......................................................................... 1.748 101.4 101.6 .4 .2 .2 .4 -.5
Televisions ̂ ........................................................................... .201 57.0 56.7 -6.0 -.5 -.9 -.5 -.5Cable television 4 7 ....................................................................... .886 251.4 253.5 4.9 .8 .7 .1 -.1Other video equipment ̂ 2 ........................................................... .075 86.1 84.6 -13.6 -1.7 -1.0 -1.0 -1.7Video cassettes, discs, and other media including ren ta l1 2 ...
Video cassettes and discs, blank and prerecorded 1 2 3 ......Rental of video tapes and discs 1 2 3 .......................................
.175 93.093.894.2
93.094.592.7
-5.0-5.4-5.4
.0
.7-1.6
-.8-1.9
-.3
-1.0-2.21.4
.0
.7-1.6
Audio equipment1 ........................................................................ .152 85.3 84.4 -2.9 -1.1 -.8 4.2 -1.1Audio discs tapes and other media ̂ 2 ..................................... .146 101.1 101.1 1.6 .0 .0 1.1 .0
Pets pet products and services ̂ 2 .............................................. .666 102.6 102.6 2.0 .0 -.4 .7 .0Pets and pet products 1 ............................................................... .429 143.9 143.8 .8 -.1 -.7 .7 -.1
Pet food 123 .............................................................................. 102.2 101.8 1.1 -.4 -.9 .8 -.4Purchase of pets pet supplies, accessories 1 2 3 ................... - 99.7 100.0 .3 .3 .2 .0 .3
Pet services including veterinary ̂ 2 .......................................... .237 105.0 105.1 4.2 .1 .3 .6 .1Pet services 1 2 3 ........................................................................ 103.8 105.1 2.8 1.3 .0 .0 1.3Veterinarian services 1 2 3 ......................................................... - 105.2 105.1 4.1 -.1 .3 .6 -.1
Sporting goods ̂ ........................................................................... .482 121.1 121.2 -1.8 .1 .2 -.6 .1Sports vehicles including bicycles 1 ............................................ .215 126.8 128.2 2.6 1.1 1.0 -.7 1.1Sports equipm ent1 ....................................................................... .257 113.8 113.0 -5.2 -.7 -.3 -.4 -.7
Photography 1 2 ................... .......................................................... .259 99.5 99.7 .1 .2 -.7 .2 .2Photographic equipment and supplies ̂ .................................... .103 130.4 131.7 -.8 1.0 -2.0 .5 1.0
Film and photographic supplies 12 3 ....................................... 99.5 99.7 .4 .2 -1.4 .3 .2Photographic equipment ' 2 3 ................................................... - 95.6 96.8 -1.2 1.3 -1.5 .8 1.3
Photographers and film processing 2 ...................................... .154 100.9 100.8 .9 -.1 .1 -.1 -.1Photographer fees 1 2 3 ............................................................. 102.3 NA .1 1.0 -Film processing 1 2 3 .................................................................. - 99.5 99.2 -.8 -.3 .1 -.6 -.3
Other recreational goods 2 ............................................................. .558 94.8 94.3 -4.6 -.5 .2 -.1 -.6Tovs ..............................................................................................1 ............................................................................ " ' .416 116.8 115.9 -5.5 -.8 .2 .3 -1.0
Toys, games, hobbies and playground equipment1 2 3 .......Video game hardware, software and accessories 1 2 3 .........
Sewing machines fabric and supplies ̂ 2 ................................. .069
94.7NA
96.3
93.9 NA
96.9
-5.8
-2.6
-.8
.6
-.2
.5
-.3
-1.8
-.8
.6Music instruments and accessories 2 ...................................... .056 99.3 99.9 .0 .6 -.1 -.3 .6
Recreation services 2 ...................................................................... 1.806 104.4 105.0 4.2 .6 .2 .7 .6Club membership dues and fees for participant sports 1 2 .....Admissions 1 .................................................................................
.668
.746105.4207.5
105.9209.0
5.33.1
.5
.7.3.0
.4
.8.5.7
Admission to movies theaters and concerts 1 2 3 ................ 102.5 103.1 2.1 .6 .2 .6 .6Admission to sporting events 1 2 3 ............................................ - 106.0 107.2 5.1 1.1 .3 1.0 1.1
Fees for lessons or instructions ®................................................ .221 181.6 181.7 4.3 .1 .2 1.5 -.2Recreational reading materials ^ ................................................... .601 186.4 185.8 2.1 -.3 .2 .4 -.3
Newspapers and magazines1 2 ................................................. .398 103.7 103.6 2.4 -.1 .4 .3 -.1Recreational books ̂ 2 ................................................................. .202 102.9 102.3 1.9 -.6 .0 .4 -.6
See footnotes at end of table.
15Digitized for FRASER http://fraser.stlouisfed.org/ Federal Reserve Bank of St. Louis
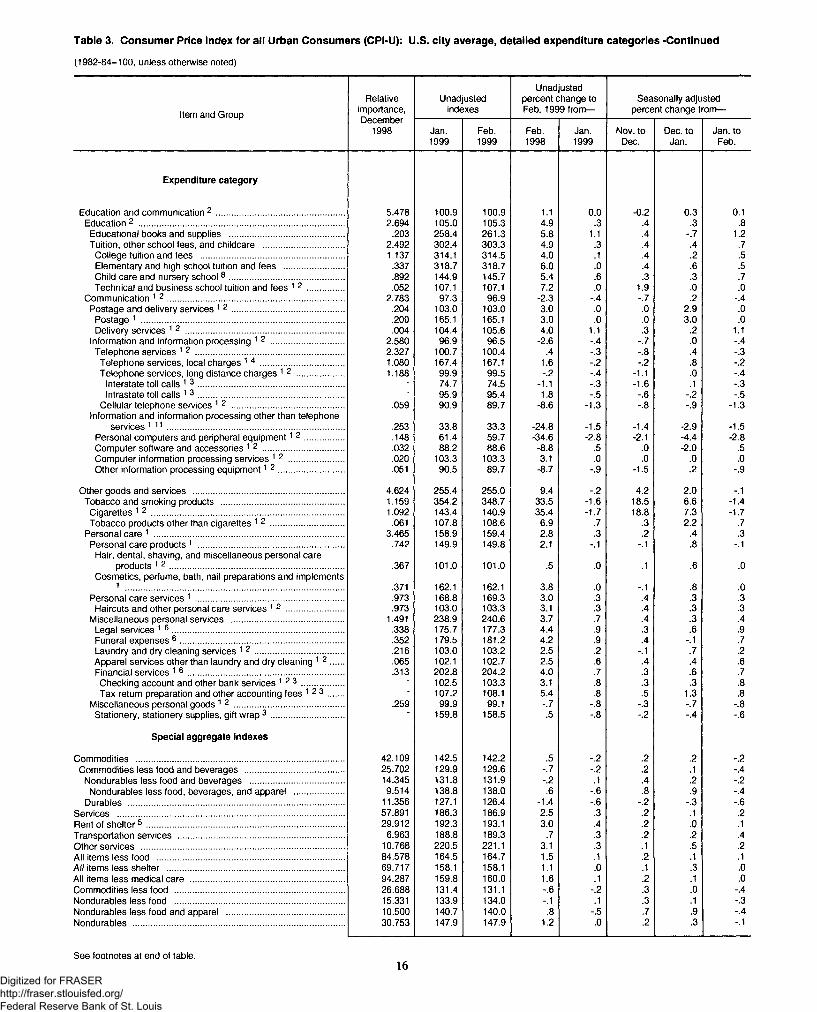
Table 3. Consumer Price Index for all Urban Consumers (CPI-U): U.S. city average, detailed expenditure categories -Continued
(1982-84=100, unless otherwise noted)
Item and Group
Relativeimportance,December
1998
Unadjustedindexes
Unadjusted percent change to Feb. 1999 from—
Seasonally adjusted percent change from—
Jan.1999
Feb.1999
Feb.1998
Jan.1999
Nov. to Dec.
Dec. to Jan.
Jan. to Feb.
Expenditure category
Education and communication 2 ..................................................... 5.478 100.9 100.9 1.1 0.0 -0.2 0.3 0.1Education 2 ...................................................................................... 2.694 105.0 105.3 4.9 .3 .4 .3 .8
Educational books and supplies ................................................ .203 258.4 261.3 5.8 1.1 .4 -.7 1.2Tuition, other school fees, and childcare .................................. 2.492 302.4 303.3 4.9 .3 .4 .4 .7
College tuition and fees ............................................................ 1.137 314.1 314.5 4.0 .1 .4 .2 .5Elementary and high school tuition and fees ......................... .337 318.7 318.7 6.0 .0 .4 .6 .5Child care and nursery school 8 ................................................ .892 144.9 145.7 5.4 .6 .3 .3 .7Technical and business school tuition and fees 1 2 ............... .052 107.1 107.1 7.2 .0 1.9 .0 .0
Communication 1 2 .......................................................................... 2.783 97.3 96.9 -2.3 -.4 -.7 .2 -.4Postage and delivery services 1 2 ............................................... .204 103.0 103.0 3.0 .0 .0 2.9 .0
Postage 1 .................................................................................... .200 165.1 165.1 3.0 .0 .0 3.0 .0Delivery services 1 2 .................................................................. .004 104.4 105.6 4.0 1.1 .3 .2 1.1
Information and information processing 1 2 .............................. 2.580 96.9 96.5 -2.6 -.4 -.7 .0 -.4Telephone services 12 .............................................................. 2.327 100.7 100.4 .4 -.3 -.8 .4 -.3
Telephone services, local charges 1 4 ................................... 1.080 167.4 167.1 1.6 -.2 -.2 .8 -.2Telephone services, long distance charges 12 .................... 1.188 99.9 99.5 -.2 -.4 -1.1 .0 -.4
Interstate toll calls 1 3 ............................................................. - 74.7 74.5 -1.1 -.3 -1.6 .1 -.3Intrastate toll calls 1 3 ............................................................. - 95.9 95.4 1.8 -.5 -.6 -.2 -.5
Cellular telephone services 1 2 ............................................... .059 90.9 89.7 -8.6 -1.3 -.8 -.9 -1.3Information and information processing other than telephone
services 111 .......................................................................... .253 33.8 33.3 -24.8 -1.5 -1.4 -2.9 -1.5Personal computers and peripheral equipment1 2 ................ .148 61.4 59.7 -34.6 -2.8 -2.1 -4.4 -2.8Computer software and accessories 12 .................................. .032 88.2 88.6 -8.8 .5 .0 -2.0 .5Computer information processing services 12 ....................... .020 103.3 103.3 3.1 .0 .0 .0 .0Other information processing equipment1 2 ........................... .051 90.5 89.7 -8.7 -.9 -1.5 .2 -.9
Other goods and services ............................................................... 4.624 255.4 255.0 9.4 -.2 4.2 2.0 -.1Tobacco and smoking products ................................................... 1.159 354.2 348.7 33.5 -1.6 18.5 6.6 -1.4
Cigarettes 1 2 ................................................................................ 1.092 143.4 140.9 35.4 -1.7 18.8 7.3 -1.7Tobacco products other than cigarettes 1 2 ............................... .061 107.8 108.6 6.9 .7 .3 2.2 .7
Personal care 1 ............................................................................... 3.465 158.9 159.4 2.8 .3 .2 .4 .3Personal care products 1 ............................................................. .742 149.9 149.8 2.1 -.1 -.1 .8 -.1
Hair, dental, shaving, and miscellaneous personal careproducts 1 2 ......................................................................... .367 101.0 101.0 .5 .0 .1 .6 .0
Cosmetics, perfume, bath, nail preparations and implements1 .371 162.1 162.1 3.8 .0 -.1 .8 .0
Personal care services 1 .............................................................. .973 168.8 169.3 3.0 .3 .4 .3 .3Haircuts and other personal care services 1 2 ........................ .973 103.0 103.3 3.1 .3 .4 .3 .3
Miscellaneous personal services ............................................... 1.491 238.9 240.6 3.7 .7 .4 .3 .4Legal services 1 6 ........................................................................ .338 175.7 177.3 4.4 .9 .3 .6 .9Funeral expenses 6 .................................................................... .352 179.5 181.2 4.2 .9 .4 -.1 .7Laundry and dry cleaning services 1 2 ..................................... .216 103.0 103.2 2.5 .2 -.1 .7 .2Apparel services other than laundry and dry cleaning 1 2 ..... .065 102.1 102.7 2.5 .6 .4 .4 .6Financial services 1 6 ................................................................. .313 202.8 204.2 4.0 .7 .3 .6 .7Checking account and other bank sen/ices 1 2 3 .................. - 102.5 103.3 3.1 .8 .3 .3 .8Tax return preparation and other accounting fees 1 2 3 ....... ■ 107.2 108.1 5.4 .8 .5 1.3 .8
Miscellaneous personal goods 1 2 .............................................. .259 99.9 99.1 -.7 -.8 -.3 -.7 -.8Stationery, stationery supplies, gift wrap 3 .............................. 159.8 158.5 .5 -.8 -.2 -.4 -.6
Special aggregate indexes
Commodities ....................................................................................... 42.109 142.5 142.2 .5 -.2 .2 .2 -.2Commodities less food and beverages ......................................... 25.702 129.9 129.6 -.7 -.2 .2 .1 -.4
Nondurables less food and beverages ....................................... 14.345 131.8 131.9 -.2 .1 .4 .2 -.2Nondurables less food, beverages, and apparel ..................... 9.514 138.8 138.0 .6 -.6 .8 .9 -.4
Durables .......................................................................................... 11.356 127.1 126.4 -1.4 -.6 -.2 -.3 -.6Services .............................................................................................. 57.891 186.3 186.9 2.5 .3 .2 .1 .2Rent of she lter5 .................................................................................. 29.912 192.3 193.1 3.0 .4 .2 .0 .1Transportation services ..................................................................... 6.963 188.8 189.3 .7 .3 .2 .2 .4Other services ..................................................................................... 10.768 220.5 221.1 3.1 .3 .1 .5 .2All items less food .............................................................................. 84.578 164.5 164.7 1.5 .1 .2 .1 .1All items less shelter .......................................................................... 69.717 158.1 158.1 1.1 .0 .1 .3 .0All items less medical care ................................................................ 94.287 159.8 160.0 1.6 .1 .2 .1 .0Commodities less food ....................................................................... 26.688 131.4 131.1 -.6 -.2 .3 .0 -.4Nondurables less food ....................................................................... 15.331 133.9 134.0 -.1 .1 .3 .1 -.3Nondurables less food and apparel ................................................. 10.500 140.7 140.0 .8 -.5 .7 .9 -.4Nondurables ........................................................................................ 30.753 147.9 147.9 1.2 .0 .2 .3 -.1
See footnotes at end of table.16
Digitized for FRASER http://fraser.stlouisfed.org/ Federal Reserve Bank of St. Louis
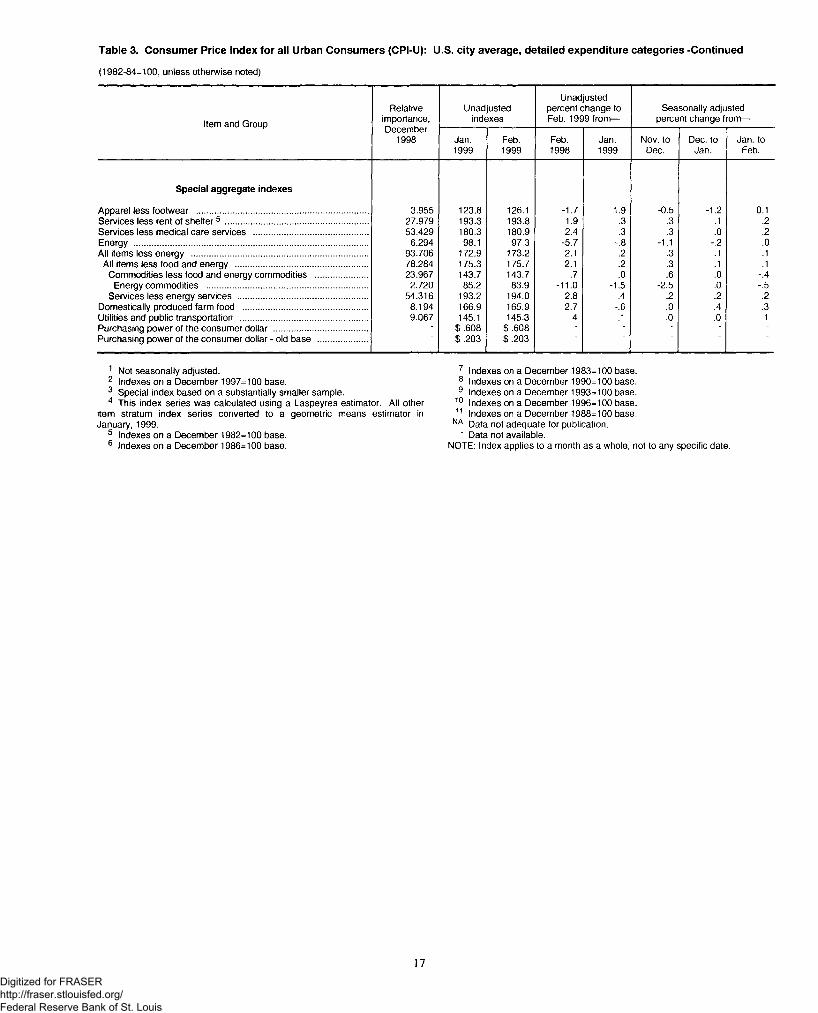
Table 3. Consumer Price Index for all Urban Consumers (CPI-U): U.S. city average, detailed expenditure categories -Continued
(1982-84=100, unless otherwise noted)
Item and Group
Relativeimportance,December
1998
Unadjustedindexes
Unadjusted percent change to Feb. 1999 from—
Seasonally adjusted percent change from—
Jan.1999
Feb.1999
Feb.1998
Jan.1999
Nov. to Dec.
Dec. to Jan.
Jan. to Feb.
Special aggregate indexes
Apparel less footwear ....................................................................... 3.955 123.8 126.1 -1.7 1.9 -0.5 -1.2 0.1Services less rent of shelter5 ........................................................... 27.979 193.3 193.8 1.9 .3 .3 .1 .2Services less medical care services ................................................ 53.429 180.3 180.9 2.4 .3 .3 .0 .2Energy .................................................................................................. 6.294 98.1 97.3 -5.7 -.8 -1.1 -.2 .0All items less energy .......................................................................... 93.706 172.9 173.2 2.1 .2 .3 .1 .1
All items less food and energy ....................................................... 78.284 175.3 175.7 2.1 .2 .3 .1 .1Commodities less food and energy commodities ...................... 23.967 143.7 143.7 .7 .0 .6 .0 -.4
Energy commodities ................................................................... 2.720 85.2 83.9 -11.0 -1.5 -2.5 .0 -.5Services less energy services ...................................................... 54.316 193.2 194.0 2.8 .4 .2 .2 .2
Domestically produced farm food .................................................... 8.194 166.9 165.9 2.7 -.6 .0 .4 .3Utilities and public transportation ..................................................... 9.067 145.1 145.3 .4 .1 .0 .0 .1Purchasing power of the consumer dollar ....................................... ■ $ .608 $.608 ~ • • • ■Purchasing power of the consumer dollar - old base ..................... $.203 $.203
1 Not seasonally adjusted.2 Indexes on a December 1997=100 base.3 Special index based on a substantially smaller sample.4 This index series was calculated using a Laspeyres estimator. All other
item stratum index series converted to a geometric means estimator in January, 1999.
5 Indexes on a December 1982=100 base.6 Indexes on a December 1986=100 base.
7 Indexes on a December 1983=100 base.8 Indexes on a December 1990=100 base.9 Indexes on a December 1993=100 base.
10 Indexes on a December 1996=100 base.11 Indexes on a December 1988= 100 base.
NA Data not adequate for publication.' Data not available.
NOTE: Index applies to a month as a whole, not to any specific date.
17Digitized for FRASER http://fraser.stlouisfed.org/ Federal Reserve Bank of St. Louis
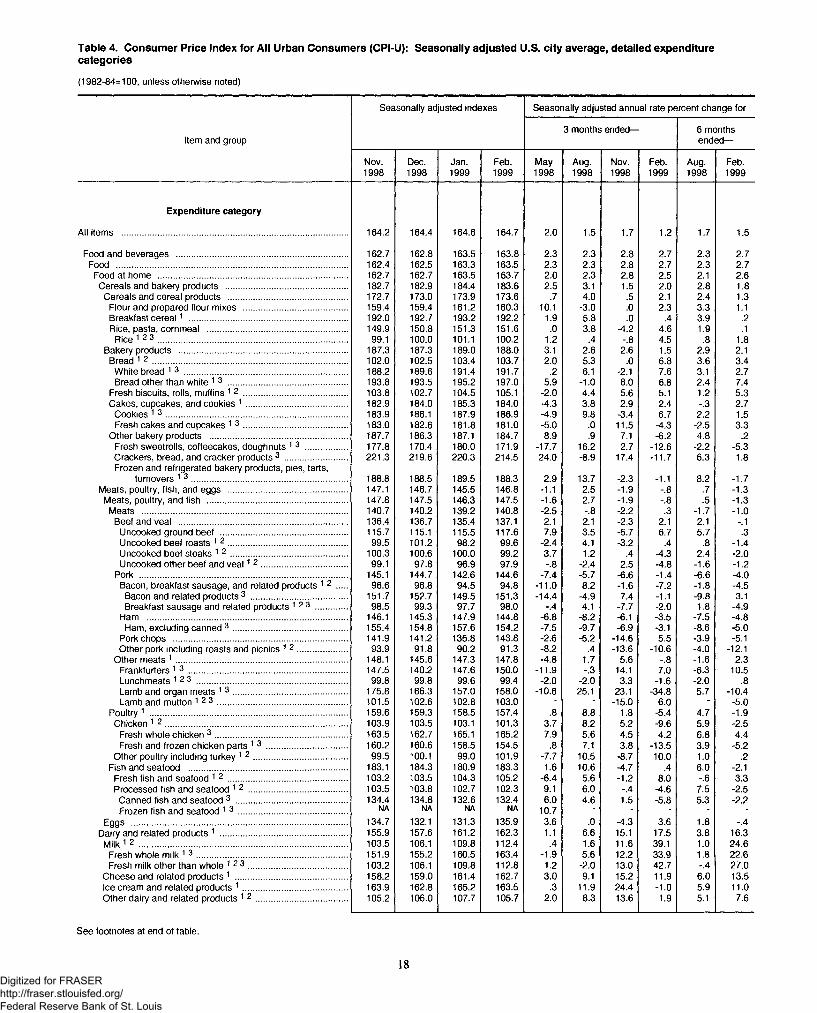
Table 4. Consumer Price Index for All Urban Consumers (CPI-U): Seasonally adjusted U.S. city average, detailed expenditurecategories
(1982-84=100, unless otherwise noted)
Item and group
Seasonally adjusted indexes Seasonally adjusted annual rate percent change for
3 months ended— 6 months ended—
Nov.1998
Dec.1998
Jan.1999
Feb.1999
May1998
Aug.1998
Nov.1998
Feb.1999
Aug.1998
Feb.1999
Expenditure category
All items .............................................................................................. 164.2 164.4 164.6 164.7 2.0 1.5 1.7 1.2 1.7 1.5
Food and beverages ....................................................................... 162.7 162.8 163.5 163.8 2.3 2.3 2.8 2.7 2.3 2.7Food ................................................................................................ 162.4 162.5 163.3 163.5 2.3 2.3 2.8 2.7 2.3 2.7
Food at home ............................................................................... 162.7 162.7 163.5 163.7 2.0 2.3 2.8 2.5 2.1 2.6Cereals and bakery products ................................................... 182.7 182.9 184.4 183.6 2.5 3.1 1.5 2.0 2.8 1.8
Cereals and cereal products .................................................. 172.7 173.0 173.9 173.6 .7 4.0 .5 2.1 2.4 1.3Flour and prepared flour mixes ........................................... 159.4 159.4 161.2 160.3 10.1 -3.0 .0 2.3 3.3 1.1Breakfast cerea l1 .................................................................. 192.0 192.7 193.2 192.2 1.9 5.8 .0 .4 3.9 .2Rice, pasta, cornmeal ........................................................... 149.9 150.8 151.3 151.6 .0 3.8 -4.2 4.6 1.9 .1
Rice 1 2 3 ............................................................................... 99.1 100.0 101.1 100.2 1.2 .4 -.8 4.5 .8 1.8Bakery products ...................................................................... 187.3 187.3 189.0 188.0 3.1 2.6 2.6 1.5 2.9 2.1
Bread 1 2 ................................................................................. 102.0 102.5 103.4 103.7 2.0 5.3 .0 6.8 3.6 3.4White bread 13 .................................................................... 188.2 189.6 191.4 191.7 .2 6.1 -2.1 7.6 3.1 2.7Bread other than white 1 3 .................................................. 193.8 193.5 195.2 197.0 5.9 -1.0 8.0 6.8 2.4 7.4
Fresh biscuits, rolls, muffins 1 2 ........................................... 103.8 102.7 104.5 105.1 -2.0 4.4 5.6 5.1 1.2 5.3Cakes, cupcakes, and cookies 1 .......................................... 182.9 184.0 185.3 184.0 -4.3 3.8 2.9 2.4 -.3 2.7
Cookies 1 3 ............................................................................ 183.9 186.1 187.9 186.9 -4.9 9.8 -3.4 6.7 2.2 1.5Fresh cakes and cupcakes 1 3 ........................................... 183.0 182.6 181.8 181.0 -5.0 .0 11.5 -4.3 -2.5 3.3
Other bakery products ......................................................... 187.7 186.3 187.1 184.7 8.9 .9 7.1 -6.2 4.8 .2Fresh sweetrolls, coffeecakes, doughnuts 1 3 ................. 177.8 170.4 180.0 171.9 -17.7 16.2 2.7 -12.6 -2.2 -5.3Crackers, bread, and cracker products 3 .......................... 221.3 219.6 220.3 214.5 24.0 -8.9 17.4 -11.7 6.3 1.8Frozen and refrigerated bakery products, pies, tarts,
turnovers 1 3 ................................................................. 188.8 188.5 189.5 188.3 2.9 13.7 -2.3 -1.1 8.2 -1.7Meats, poultry, fish, and eggs .................................................. 147.1 146.7 145.5 146.8 -1.1 2.5 -1.9 -.8 .7 -1.3
Meats, poultry, and fish ........................................................... 147.8 147.5 146.3 147.5 -1.6 2.7 -1.9 -.8 .5 -1.3Meats ...................................................................................... 140.7 140.2 139.2 140.8 -2.5 -.8 -2.2 .3 -1.7 -1.0
Beef and veal ...................................................................... 136.4 136.7 135.4 137.1 2.1 2.1 -2.3 2.1 2.1 -.1Uncooked ground beef ..................................................... 115.7 115.1 115.5 117.6 7.9 3.5 -5.7 6.7 5.7 .3Uncooked beef roasts 1 2 .................................................. 99.5 101.2 98.2 99.6 -2.4 4.1 -3.2 .4 .8 -1.4Uncooked beef steaks 1 2 ................................................. 100.3 100.6 100.0 99.2 3.7 1.2 .4 -4.3 2.4 -2.0Uncooked other beef and v e a l1 2 .................................... 99.1 97.8 96.9 97.9 -.8 -2.4 2.5 -4.8 -1.6 -1.2
Pork ....................................................................................... 145.1 144.7 142.6 144.6 -7.4 -5.7 -6.6 -1.4 -6.6 -4.0Bacon, breakfast sausage, and related products 1 2 .... 96.6 96.8 94.5 94.8 -11.0 8.2 -1.6 -7.2 -1.8 -4.5
Bacon and related products 3 ........................................ 151.7 152.7 149.5 151.3 -14.4 -4.9 7.4 -1.1 -9.8 3.1Breakfast sausage and related products 1 2 3 ............. 98.5 99.3 97.7 98.0 -.4 4.1 -7.7 -2.0 1.8 -4.9
Ham ................................................................................... 146.1 145.3 147.9 144.8 -6.8 -8.2 -6.1 -3.5 -7.5 -4.8Ham, excluding canned 3 ................................................ 155.4 154.8 157.6 154.2 -7.5 -9.7 -6.9 -3.1 -8.6 -5.0
Pork chops ......................................................................... 141.9 141.2 135.8 143.8 -2.6 -5.2 -14.6 5.5 -3.9 -5.1Other pork including roasts and picnics 1 2 ..................... 93.9 91.8 90.2 91.3 -8.2 .4 -13.6 -10.6 -4.0 -12.1
Other meats 1 ....................................................................... 148.1 145.6 147.3 147.8 -4.8 1.7 5.6 -.8 -1.6 2.3Frankfurters 1 3 .................................................................. 147.5 140.2 147.6 150.0 -11.9 -.3 14.1 7.0 -6.3 10.5Lunchmeats 1 2 3 ............................................................... 99.8 99.8 99.6 99.4 -2.0 -2.0 3.3 -1.6 -2.0 .8Lamb and organ meats 1 3 ................................................ 175.8 166.3 157.0 158.0 -10.6 25.1 23.1 -34.8 5.7 -10.4Lamb and mutton 1 2 3 ...................................................... 101.5 102.6 102.8 103.0 - - -15.0 6.0 - -5.0
Poultry 1 .................................................................................. 159.6 159.3 158.5 157.4 .8 8.8 1.8 -5.4 4.7 -1.9Chicken 1 2 ............................................................................ 103.9 103.5 103.1 101.3 3.7 8.2 5.2 -9.6 5.9 -2.5
Fresh whole chicken 3 ....................................................... 163.5 162.7 165.1 165.2 7.9 5.6 4.5 4.2 6.8 4.4Fresh and frozen chicken parts 1 3 .................................. 160.2 160.6 158.5 154.5 .8 7.1 3.8 -13.5 3.9 -5.2
Other poultry including turkey 1 2 ....................................... 99.5 100.1 99.0 101.9 -7.7 10.5 -8.7 10.0 1.0 .2Fish and seafood .................................................................. 183.1 184.3 180.9 183.3 1.6 10.6 -4.7 .4 6.0 -2.1
Fresh fish and seafood 1 2 .................................................. 103.2 103.5 104.3 105.2 -6.4 5.6 -1.2 8.0 -.6 3.3Processed fish and seafood 1 2 ......................................... 103.5 103.8 102.7 102.3 9.1 6.0 -.4 -4.6 7.5 -2.5Canned fish and seafood 3 .............................................. 134.4 134.8 132.6 132.4 6.0 4.6 1.5 -5.8 5.3 -2.2Frozen fish and seafood 1 3 ............................................. NA NA NA NA 10.7 - - - - -
Eggs .......................................................................................... 134.7 132.1 131.3 135.9 3.6 .0 -4.3 3.6 1.8 -.4Dairy and related products 1 ..................................................... 155.9 157.6 161.2 162.3 1.1 6.6 15.1 17.5 3.8 16.3
Milk 1 2 ....................................................................................... 103.5 106.1 109.8 112.4 .4 1.6 11.6 39.1 1.0 24.6Fresh whole milk 1 3 ............................................................... 151.9 155.2 160.5 163.4 -1.9 5.6 12.2 33.9 1.8 22.6Fresh milk other than whole 1 2 3 ......................................... 103.2 106.1 109.8 112.8 1.2 -2.0 13.0 42.7 -.4 27.0
Cheese and related products 1 ............................................... 158.2 159.0 161.4 162.7 3.0 9.1 15.2 11.9 6.0 13.5Ice cream and related products 1 ............................................ 163.9 162.8 165.2 163.5 .3 11.9 24.4 -1.0 5.9 11.0Other dairy and related products 1 2 ...................................... 105.2 106.0 107.7 105.7 2.0 8.3 13.6 1.9 5.1 7.6
See footnotes at end of table.
18Digitized for FRASER http://fraser.stlouisfed.org/ Federal Reserve Bank of St. Louis
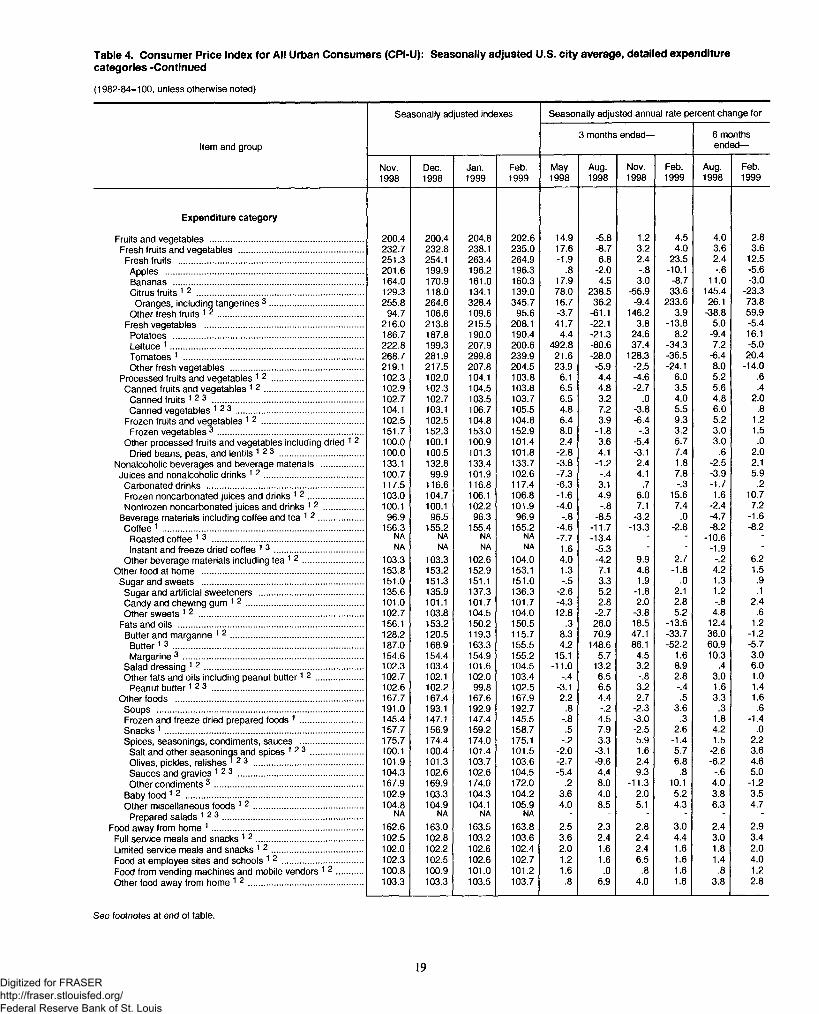
Table 4. Consumer Price Index for All Urban Consumers (CPI-U): Seasonally adjusted U.S. city average, detailed expenditurecategories -Continued
(1982-84=100, unless otherwise noted)
Seasonally adjusted indexes Seasonally adjusted annual rate percent change for
Item and group3 months ended— 6 months
ended—
Nov.1998
Dec.1998
Jan.1999
Feb.1999
May1998
Aug.1998
Nov.1998
Feb.1999
Aug.1998
Feb.1999
Expenditure category
Fruits and vegetables ................................................................ 200.4 200.4 204.8 202.6 14.9 -5.8 1.2 4.5 4.0 2.8Fresh fruits and vegetables .................................................... 232.7 232.8 238.1 235.0 17.6 -8.7 3.2 4.0 3.6 3.6
Fresh fruits ............................................................................. 251.3 254.1 263.4 264.9 -1.9 6.8 2.4 23.5 2.4 12.5Apples .................................................................................. 201.6 199.9 196.2 196.3 .8 -2.0 -.8 -10.1 -.6 -5.6Bananas ............................................................................... 164.0 170.9 161.0 160.3 17.9 4.5 3.0 -8.7 11.0 -3.0Citrus fruits 1 2 ..................................................................... 129.3 118.0 134.1 139.0 78.0 238.5 -55.9 33.6 145.4 -23.3
Oranges, including tangerines 3 ....................................... 255.8 264.6 328.4 345.7 16.7 36.2 -9.4 233.6 26.1 73.8Other fresh fruits 1 2 ............................................................. 94.7 106.6 109.6 95.6 -3.7 -61.1 146.2 3.9 -38.8 59.9
Fresh vegetables .................................................................. 216.0 213.8 215.5 208.1 41.7 -22.1 3.8 -13.8 5.0 -5.4Potatoes ............................................................................... 186.7 187.8 190.0 190.4 4.4 -21.3 24.6 8.2 -9.4 16.1Lettuce 1 ................................................................................ 222.8 199.3 207.9 200.6 492.8 -80.6 37.4 -34.3 7.2 -5.0Tomatoes 1 ........................................................................... 268.7 281.9 299.8 239.9 21.6 -28.0 128.3 -36.5 -6.4 20.4Other fresh vegetables ....................................................... 219.1 217.5 207.8 204.5 23.9 -5.9 -2.5 -24.1 8.0 -14.0
Processed fruits and vegetables 1 2 ...................................... 102.3 102.0 104.1 103.8 6.1 4.4 -4.6 6.0 5.2 .6Canned fruits and vegetables 1 2 ......................................... 102.9 102.3 104.5 103.8 6.5 4.8 -2.7 3.5 5.6 .4
Canned fruits 1 2 3 ............................................................... 102.7 102.7 103.5 103.7 6.5 3.2 .0 4.0 4.8 2.0Canned vegetables 1 2 3 ..................................................... 104.1 103.1 106.7 105.5 4.8 7.2 -3.8 5.5 6.0 .8
Frozen fruits and vegetables 1 2 .......................................... 102.5 102.5 104.8 104.8 6.4 3.9 -6.4 9.3 5.2 1.2Frozen vegetables 3 ............................................................. 151.7 152.3 153.0 152.9 8.0 -1.8 -.3 3.2 3.0 1.5
Other processed fruits and vegetables including dried 1 2 100.0 100.1 100.9 101.4 2.4 3.6 -5.4 5.7 3.0 .0Dried beans, peas, and lentils 1 2 3 ................................... 100.0 100.5 101.3 101.8 -2.8 4.1 -3.1 7.4 .6 2.0
Nonalcoholic beverages and beverage materials ................. 133.1 132.8 133.4 133.7 -3.8 -1.2 2.4 1.8 -2.5 2.1Juices and nonalcoholic drinks 1 2 ......................................... 100.7 99.9 101.9 102.6 -7.3 -.4 4.1 7.8 -3.9 5.9
Carbonated drinks ................................................................. 117.5 116.6 116.8 117.4 -6.3 3.1 .7 -.3 -1.7 .2Frozen noncarbonated juices and drinks 1 2 ....................... 103.0 104.7 106.1 106.8 -1.6 4.9 6.0 15.6 1.6 10.7Nonfrozen noncarbonated juices and drinks 1 2 ................ 100.1 100.1 102.2 101.9 -4.0 -.8 7.1 7.4 -2.4 7.2
Beverage materials including coffee and tea 1 2 .................. 96.9 96.5 96.3 96.9 -.8 -8.5 -3.2 .0 -4.7 -1.6Coffee 1 .................................................................................... 156.3 155.2 155.4 155.2 -4.6 -11.7 -13.3 -2.8 -8.2 -8.2
Roasted coffee 1 3 ............................................................... NA NA NA NA -7.7 -13.4 - - -10.6 -Instant and freeze dried coffee 1 3 ..................................... NA NA NA NA 1.6 -5.3 - - -1.9 ■
Other beverage materials including tea 1 2 ......................... 103.3 103.3 102.6 104.0 4.0 -4.2 9.9 2.7 -.2 6.2Other food at home ................................................................... 153.8 153.2 152.9 153.1 1.3 7.1 4.8 -1.8 4.2 1.5
Sugar and sweets ................................................................... 151.0 151.3 151.1 151.0 -.5 3.3 1.9 .0 1.3 .9Sugar and artificial sweeteners ........................................... 135.6 135.9 137.3 136.3 -2.6 5.2 -1.8 2.1 1.2 .1Candy and chewing gum 1 2 ................................................. 101.0 101.1 101.7 101.7 -4.3 2.8 2.0 2.8 -.8 2.4Other sweets 1 2 .................................................................... 102.7 103.8 104.5 104.0 12.8 -2.7 -3.8 5.2 4.8 .6
Fats and oils ............................................................................. 156.1 153.2 150.2 150.5 .3 26.0 18.5 -13.6 12.4 1.2Butter and margarine 1 2 ....................................................... 128.2 120.5 119.3 115.7 8.3 70.9 47.1 -33.7 36.0 -1.2
Butter1 3 ............................................................................... 187.0 168.9 163.3 155.5 4.2 148.6 86.1 -52.2 60.9 -5.7Margarine 3 ........................................................................... 154.6 154.4 154.9 155.2 15.1 5.7 4.5 1.6 10.3 3.0
Salad dressing 1 2 .................................................................. 102.3 103.4 101.6 104.5 -11.0 13.2 3.2 8.9 .4 6.0Other fats and oils including peanut butter1 2 .................... 102.7 102.1 102.0 103.4 -.4 6.5 -.8 2.8 3.0 1.0
Peanut bu tter1 2 3 ............................................................... 102.6 102.2 99.8 102.5 -3.1 6.5 3.2 -.4 1.6 1.4Other foods .............................................................................. 167.7 167.4 167.6 167.9 2.2 4.4 2.7 .5 3.3 1.6
Soups ...................................................................................... 191.0 193.1 192.9 192.7 .8 -.2 -2.3 3.6 .3 .6Frozen and freeze dried prepared foods 1 .......................... 145.4 147.1 147.4 145.5 -.8 4.5 -3.0 .3 1.8 -1.4Snacks 1 ................................................................................... 157.7 156.9 159.2 158.7 .5 7.9 -2.5 2.6 4.2 .0Spices, seasonings, condiments, sauces .......................... 175.7 174.4 174.0 175.1 -.2 3.3 5.9 -1.4 1.5 2.2
Salt and other seasonings and spices 1 2 3 ...................... 100.1 100.4 101.4 101.5 -2.0 -3.1 1.6 5.7 -2.6 3.6Olives, pickles, relishes 1 2 3 .............................................. 101.9 101.3 103.7 103.6 -2.7 -9.6 2.4 6.8 -6.2 4.6Sauces and gravies 1 2 3 .................................................... 104.3 102.6 102.6 104.5 -5.4 4.4 9.3 .8 -.6 5.0Other condiments 3 .............................................................. 167.9 169.9 174.0 172.0 .2 8.0 -11.3 10.1 4.0 -1.2
Baby food 1 2 .......................................................................... 102.9 103.3 104.3 104.2 3.6 4.0 2.0 5.2 3.8 3.5Other miscellaneous foods 1 2 .............................................. 104.8 104.9 104.1 105.9 4.0 8.5 5.1 4.3 6.3 4.7
Prepared salads 1 2 3 .......................................................... NA NA NA NA - - - • - -Food away from home 1 ............................................................... 162.6 163.0 163.5 163.8 2.5 2.3 2.8 3.0 2.4 2.9
Full service meals and snacks 1 2 ............................................ 102.5 102.8 103.2 103.6 3.6 2.4 2.4 4.4 3.0 3.4Limited service meals and snacks 1 2 ...................................... 102.0 102.2 102.6 102.4 2.0 1.6 2.4 1.6 1.8 2.0Food at employee sites and schools 1 2 .................................. 102.3 102.5 102.6 102.7 1.2 1.6 6.5 1.6 1.4 4.0Food from vending machines and mobile vendors 1 2 ........... 100.8 100.9 101.0 101.2 1.6 .0 .8 1.6 .8 1.2Other food away from home 1 2 ................................................ 103.3 103.3 103.5 103.7 .8 6.9 4.0 1.6 3.8 2.8
See footnotes at end of table.
19Digitized for FRASER http://fraser.stlouisfed.org/ Federal Reserve Bank of St. Louis
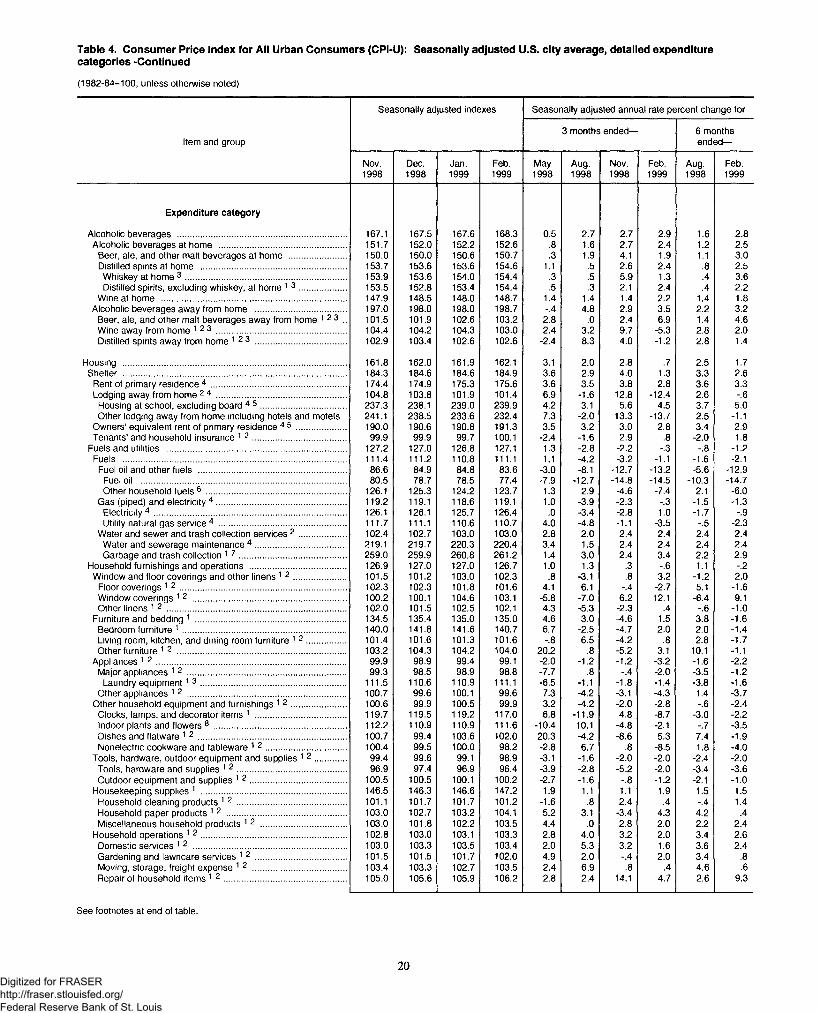
Table 4. Consumer Price Index for All Urban Consumers (CPI-U): Seasonally adjusted U.S. city average, detailed expenditurecategories -Continued
(1982-84=100, unless otherwise noted)
Seasonally adjusted indexes Seasonally adjusted annual rate percent change for
Item and group3 months ended— 6 months
ended—
Nov.1998
Dec.1998
Jan.1999
Feb.1999
May1998
Aug.1998
Nov.1998
Feb.1999
Aug.1998
Feb.1999
Expenditure category
Alcoholic beverages ...................................................................... 167.1 167.5 167.6 168.3 0.5 2.7 2.7 2.9 1.6 2.8Alcoholic beverages at home ..................................................... 151.7 152.0 152.2 152.6 .8 1.6 2.7 2.4 1.2 2.5
Beer, ale, and other malt beverages at home ........................ 150.0 150.0 150.6 150.7 .3 1.9 4.1 1.9 1.1 3.0Distilled spirits at home ............................................................. 153.7 153.6 153.6 154.6 1.1 .5 2.6 2.4 .8 2.5Whiskey at home 3 ................................................................... 153.9 153.6 154.0 154.4 .3 .5 5.9 1.3 .4 3.6Distilled spirits, excluding whiskey, at home 1 3 .................... 153.5 152.8 153.4 154.4 .5 .3 2.1 2.4 .4 2.2
Wine at home ............................................................................. 147.9 148.5 148.0 148.7 1.4 1.4 1.4 2.2 1.4 1.8Alcoholic beverages away from home ...................................... 197.0 198.0 198.0 198.7 -.4 4.8 2.9 3.5 2.2 3.2
Beer, ale, and other malt beverages away from home 1 2 3 .. 101.5 101.9 102.6 103.2 2.8 .0 2.4 6.9 1.4 4.6Wine away from home 1 2 3 ...................................................... 104.4 104.2 104.3 103.0 2.4 3.2 9.7 -5.3 2.8 2.0Distilled spirits away from home 1 2 3 ...................................... 102.9 103.4 102.6 102.6 -2.4 8.3 4.0 -1.2 2.8 1.4
Housing ............................................................................................. 161.8 162.0 161.9 162.1 3.1 2.0 2.8 .7 2.5 1.7Shelter ............................................................................................. 184.3 184.6 184.6 184.9 3.6 2.9 4.0 1.3 3.3 2.6
Rent of primary residence 4 ........................................................ 174.4 174.9 175.3 175.6 3.6 3.5 3.8 2.8 3.6 3.3Lodging away from home 2 4 ...................................................... 104.8 103.8 101.9 101.4 6.9 -1.6 12.8 -12.4 2.6 -.6
Housing at school, excluding board 4 5 .................................... 237.3 238.1 239.0 239.9 4.2 3.1 5.6 4.5 3.7 5.0Other lodging away from home including hotels and motels 241.1 238.5 233.6 232.4 7.3 -2.0 13.3 -13.7 2.5 -1.1
Owners’ equivalent rent of primary residence 4 5 ..................... 190.0 190.6 190.8 191.3 3.5 3.2 3.0 2.8 3.4 2.9Tenants’ and household insurance 1 2 ....................................... 99.9 99.9 99.7 100.1 -2.4 -1.6 2.9 .8 -2.0 1.8
Fuels and utilities ........................................................................... 127.2 127.0 126.8 127.1 1.3 -2.8 -2.2 -.3 -.8 -1.2Fuels ............................................................................................. 111.4 111.2 110.8 111.1 1.1 -4.2 -3.2 -1.1 -1.6 -2.1
Fuel oil and other fuels .............................................................. 86.6 84.9 84.8 83.6 -3.0 -8.1 -12.7 -13.2 -5.6 -12.9Fuel oil ...................................................................................... 80.5 78.7 78.5 77.4 -7.9 -12.7 -14.8 -14.5 -10.3 -14.7Other household fuels 6 .......................................................... 126.1 125.3 124.2 123.7 1.3 2.9 -4.6 -7.4 2.1 -6.0
Gas (piped) and electricity 4 ...................................................... 119.2 119.1 118.6 119.1 1.0 -3.9 -2.3 -.3 -1.5 -1.3Electricity 4 ................................................................................ 126.1 126.1 125.7 126.4 .0 -3.4 -2.8 1.0 -1.7 -.9Utility natural gas service 4 ..................................................... 111.7 111.1 110.6 110.7 4.0 -4.8 -1.1 -3.5 -.5 -2.3
Water and sewer and trash collection services 2 .................... 102.4 102.7 103.0 103.0 2.8 2.0 2.4 2.4 2.4 2.4Water and sewerage maintenance 4 ...................................... 219.1 219.7 220.3 220.4 3.4 1.5 2.4 2.4 2.4 2.4Garbage and trash collection 1 7 ............................................ 259.0 259.9 260.8 261.2 1.4 3.0 2.4 3.4 2.2 2.9
Household furnishings and operations ........................................ 126.9 127.0 127.0 126.7 1.0 1.3 .3 -.6 1.1 -.2Window and floor coverings and other linens 1 2 ...................... 101.5 101.2 103.0 102.3 .8 -3.1 .8 3.2 -1.2 2.0
Floor coverings 1 2 ..................................................................... 102.3 102.3 101.8 101.6 4.1 6.1 -.4 -2.7 5.1 -1.6Window coverings 1 2 ................................................................ 100.2 100.1 104.6 103.1 -5.8 -7.0 6.2 12.1 -6.4 9.1Other linens 1 2 ........................................................................... 102.0 101.5 102.5 102.1 4.3 -5.3 -2.3 .4 -.6 -1.0
Furniture and bedding 1 ............................................................... 134.5 135.4 135.0 135.0 4.6 3.0 -4.6 1.5 3.8 -1.6Bedroom furniture 1 .................................................................... 140.0 141.8 141.6 140.7 6.7 -2.5 -4.7 2.0 2.0 -1.4Living room, kitchen, and dining room furniture 1 2 ................ 101.4 101.6 101.3 101.6 -.8 6.5 -4.2 .8 2.8 -1.7Other furniture 1 2 ...................................................................... 103.2 104.3 104.2 104.0 20.2 .8 -5.2 3.1 10.1 -1.1
Appliances 1 2 ............................................................................... 99.9 98.9 99.4 99.1 -2.0 -1.2 -1.2 -3.2 -1.6 -2.2Major appliances 1 2 .................................................................. 99.3 98.5 98.9 98.8 -7.7 .8 -.4 -2.0 -3.5 -1.2
Laundry equipment1 3 ............................................................. 111.5 110.6 110.9 111.1 -6.5 -1.1 -1.8 -1.4 -3.8 -1.6Other appliances 1 2 .................................................................. 100.7 99.6 100.1 99.6 7.3 -4.2 -3.1 -4.3 1.4 -3.7
Other household equipment and furnishings 1 2 ....................... 100.6 99.9 100.5 99.9 3.2 -4.2 -2.0 -2.8 -.6 -2.4Clocks, lamps, and decorator items 1 ...................................... 119.7 119.5 119.2 117.0 6.8 -11.9 4.8 -8.7 -3.0 -2.2Indoor plants and flowers 8 ....................................................... 112.2 110.9 110.9 111.6 -10.4 10.1 -4.8 -2.1 -.7 -3.5Dishes and flatware 1 2 .............................................................. 100.7 99.4 103.6 102.0 20.3 -4.2 -8.6 5.3 7.4 -1.9Nonelectric cookware and tableware 1 2 .................................. 100.4 99.5 100.0 98.2 -2.8 6.7 .8 -8.5 1.8 -4.0
Tools, hardware, outdoor equipment and supplies 1 2 ............. 99.4 99.6 99.1 98.9 -3.1 -1.6 -2.0 -2.0 -2.4 -2.0Tools, hardware and supplies 1 2 ............................................. 96.9 97.4 96.9 96.4 -3.9 -2.8 -5.2 -2.0 -3.4 -3.6Outdoor equipment and supplies 1 2 ........................................ 100.5 100.5 100.1 100.2 -2.7 -1.6 -.8 -1.2 -2.1 -1.0
Housekeeping supplies 1 ............................................................. 146.5 146.3 146.6 147.2 1.9 1.1 1.1 1.9 1.5 1.5Household cleaning products 1 2 ............................................. 101.1 101.7 101.7 101.2 -1.6 .8 2.4 .4 -.4 1.4Household paper products 1 2 .................................................. 103.0 102.7 103.2 104.1 5.2 3.1 -3.4 4.3 4.2 .4Miscellaneous household products 1 2 .................................... 103.0 101.8 102.2 103.5 4.4 .0 2.8 2.0 2.2 2.4
Household operations 1 2 ............................................................. 102.8 103.0 103.1 103.3 2.8 4.0 3.2 2.0 3.4 2.6Domestic services 1 2 ................................................................ 103.0 103.3 103.5 103.4 2.0 5.3 3.2 1.6 3.6 2.4Gardening and lawncare services 1 2 ...................................... 101.5 101.5 101.7 102.0 4.9 2.0 -.4 2.0 3.4 .8Moving, storage, freight expense 1 2 ....................................... 103.4 103.3 102.7 103.5 2.4 6.9 .8 .4 4.6 .6Repair of household items 1 2 ................................................... 105.0 105.6 105.9 106.2 2.8 2.4 14.1 4.7 2.6 9.3
See footnotes at end of table.
20Digitized for FRASER http://fraser.stlouisfed.org/ Federal Reserve Bank of St. Louis
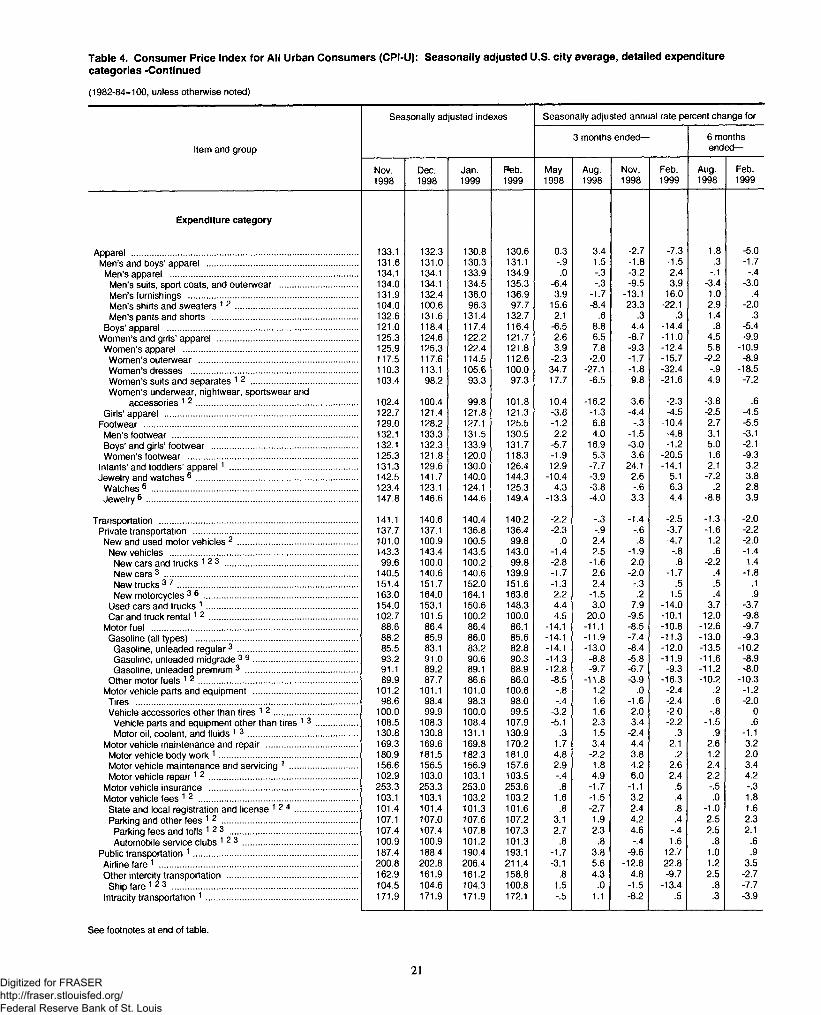
Table 4. Consumer Price Index for All Urban Consumers (CPI-U): Seasonally adjusted U.S. city average, detailed expenditurecategories -Continued
(1982-84=100, unless otherwise noted)
Item and group
Seasonally adjusted indexes Seasonally adjusted annual rate percent change for
3 months ended— 6 months ended—
Nov.1998
Dec.1998
Jan.1999
Feb.1999
May1998
Aug.1998
Nov.1998
Feb.1999
Aug.1998
Feb.1999
Expenditure category
Apparel .............................................................................................. 133.1 132.3 130.8 130.6 0.3 3.4 -2.7 -7.3 1.8 -5.0Men’s and boys’ apparel ............................................................... 131.6 131.0 130.3 131.1 -.9 1.5 -1.8 -1.5 .3 -1.7
Men’s apparel .............................................................................. 134.1 134.1 133.9 134.9 .0 -.3 -3.2 2.4 -.1 -.4Men’s suits, sport coats, and outerwear ................................ 134.0 134.1 134.5 135.3 -6.4 -.3 -9.5 3.9 -3.4 -3.0Men’s furnishings ....................................................................... 131.9 132.4 136.0 136.9 3.9 -1.7 -13.1 16.0 1.0 .4Men’s shirts and sweaters 1 2 ................................................... 104.0 100.6 96.3 97.7 15.6 -8.4 23.3 -22.1 2.9 -2.0Men’s pants and shorts ............................................................. 132.6 131.6 131.4 132.7 2.1 .6 .3 .3 1.4 .3
Boys’ apparel ............................................................................... 121.0 118.4 117.4 116.4 -6.5 8.8 4.4 -14.4 .8 -5.4Women’s and girls’ apparel ........................................................... 125.3 124.6 122.2 121.7 2.6 6.5 -8.7 -11.0 4.5 -9.9Women’s apparel ......................................................................... 125.9 125.3 122.4 121.8 3.9 7.8 -9.3 -12.4 5.8 -10.9
Women’s outerwear .................................................................. 117.5 117.6 114.5 112.6 -2.3 -2.0 -1.7 -15.7 -2.2 -8.9Women’s dresses ..................................................................... 110.3 113.1 105.6 100.0 34.7 -27.1 -1.8 -32.4 -.9 -18.5Women’s suits and separates 1 2 ............................................ 103.4 98.2 93.3 97.3 17.7 -6.5 9.8 -21.6 4.9 -7.2Women’s underwear, nightwear, sportswear and
accessories 1 2 ................................................................... 102.4 100.4 99.8 101.8 10.4 -16.2 3.6 -2.3 -3.8 .6Girls’ apparel ................................................................................ 122.7 121.4 121.8 121.3 -3.8 -1.3 -4.4 -4.5 -2.5 -4.5
Footwear ......................................................................................... 129.0 128.2 127.1 125.5 -1.2 6.8 -.3 -10.4 2.7 -5.5Men’s footwear ............................................................................. 132.1 133.3 131.5 130.5 2.2 4.0 -1.5 -4.8 3.1 -3.1Boys’ and girls’ footwear ............................................................. 132.1 132.3 133.9 131.7 -5.7 16.9 -3.0 -1.2 5.0 -2.1Women’s footwear ....................................................................... 125.3 121.8 120.0 118.3 -1.9 5.3 3.6 -20.5 1.6 -9.3
Infants’ and toddlers’ apparel1 ..................................................... 131.3 129.6 130.0 126.4 12.9 -7.7 24.1 -14.1 2.1 3.2Jewelry and watches 6 ................................................................... 142.5 141.7 140.0 144.3 -10.4 -3.9 2.6 5.1 -7.2 3.8
Watches6 ...................................................................................... 123.4 123.1 124.1 125.3 4.3 -3.8 -.6 6.3 .2 2.8Jewelry 6 ........................................................................................ 147.8 146.6 144.6 149.4 -13.3 -4.0 3.3 4.4 -8.8 3.9
Transportation ................................................................................... 141.1 140.6 140.4 140.2 -2.2 -.3 -1.4 -2.5 -1.3 -2.0Private transportation .................................................................... 137.7 137.1 136.8 136.4 -2.3 -.9 -.6 -3.7 -1.6 -2.2New and used motor vehicles 2 .................................................. 101.0 100.9 100.5 99.8 .0 2.4 .8 -4.7 1.2 -2.0
New vehicles .............................................................................. 143.3 143.4 143.5 143.0 -1.4 2.5 -1.9 -.8 .6 -1.4New cars and trucks 123 ....................................................... 99.6 100.0 100.2 99.8 -2.8 -1.6 2.0 .8 -2.2 1.4New cars 3 ................................................................................ 140.5 140.6 140.6 139.9 -1.7 2.6 -2.0 -1.7 .4 -1.8New trucks 3 7 ........................................................................... 151.4 151.7 152.0 151.6 -1.3 2.4 -.3 .5 .5 .1New motorcycles 3 6 ................................................................ 163.0 164.0 164.1 163.6 2.2 -1.5 .2 1.5 .4 .9
Used cars and trucks 1 ............................................................... 154.0 153.1 150.6 148.3 4.4 3.0 7.9 -14.0 3.7 -3.7Car and truck ren ta l1 2 .............................................................. 102.7 101.5 100.2 100.0 4.5 20.0 -9.5 -10.1 12.0 -9.8
Motor fuel ...................................................................................... 88.6 86.4 86.4 86.1 -14.1 -11.1 -8.5 -10.8 -12.6 -9.7Gasoline (all types) ................................................................... 88.2 85.9 86.0 85.6 -14.1 -11.9 -7.4 -11.3 -13.0 -9.3
Gasoline, unleaded regular3 .................................................. 85.5 83.1 83.2 82.8 -14.1 -13.0 -8.4 -12.0 -13.5 -10.2Gasoline, unleaded midgrade 3 9 ........................................... 93.2 91.0 90.6 90.3 -14.3 -8.8 -5.8 -11.9 -11.6 -8.9Gasoline, unleaded premium 3 ............................................... 91.1 89.2 89.1 88.9 -12.8 -9.7 -6.7 -9.3 -11.2 -8.0
Other motor fuels 1 2 .................................................................. 89.9 87.7 86.6 86.0 -8.5 -11.8 -3.9 -16.3 -10.2 -10.3Motor vehicle parts and equipment ........................................... 101.2 101.1 101.0 100.6 -.8 1.2 .0 -2.4 .2 -1.2Tires ............................................................................................ 98.6 98.4 98.3 98.0 -.4 1.6 -1.6 -2.4 .6 -2.0Vehicle accessories other than tires 1 2 ................................... 100.0 99.9 100.0 99.5 -3.2 1.6 2.0 -2.0 -.8 .0Vehicle parts and equipment other than tires 1 3 ................. 108.5 108.3 108.4 107.9 -5.1 2.3 3.4 -2.2 -1.5 .6Motor oil, coolant, and fluids 1 3 .............................................. 130.8 130.8 131.1 130.9 .3 1.5 -2.4 .3 .9 -1.1
Motor vehicle maintenance and repair ...................................... 169.3 169.6 169.8 170.2 1.7 3.4 4.4 2.1 2.6 3.2Motor vehicle body work 1 ......................................................... 180.9 181.5 182.3 181.0 4.8 -2.2 3.8 .2 1.2 2.0Motor vehicle maintenance and servicing 1 ............................ 156.6 156.5 156.9 157.6 2.9 1.8 4.2 2.6 2.4 3.4Motor vehicle repa ir1 2 .............................................................. 102.9 103.0 103.1 103.5 -.4 4.9 6.0 2.4 2.2 4.2
Motor vehicle insurance .............................................................. 253.3 253.3 253.0 253.6 .8 -1.7 -1.1 .5 -.5 -.3Motor vehicle fees 1 2 .................................................................. 103.1 103.1 103.2 103.2 1.6 -1.5 3.2 .4 .0 1.8
State and local registration and license 1 2 4 .......................... 101.4 101.4 101.3 101.6 .8 -2.7 2.4 .8 -1.0 1.6Parking and other fees 1 2 ........................................................ 107.1 107.0 107.6 107.2 3.1 1.9 4.2 .4 2.5 2.3
Parking fees and tolls 1 2 3 ..................................................... 107.4 107.4 107.8 107.3 2.7 2.3 4.6 -.4 2.5 2.1Automobile service clubs 1 2 3 ................................................ 100.9 100.9 101.2 101.3 .8 .8 -.4 1.6 .8 .6
Public transportation 1 .................................................................... 187.4 188.4 190.4 193.1 -1.7 3.8 -9.6 12.7 1.0 .9Airline fare 1 ................................................................................... 200.8 202.8 206.4 211.4 -3.1 5.6 -12.8 22.8 1.2 3.5Other intercity transportation ...................................................... 162.9 161.9 161.2 158.8 .8 4.3 4.8 -9.7 2.5 -2.7
Ship fare 1 * 3 ............................................................................. 104.5 104.6 104.3 100.8 1.5 .0 -1.5 -13.4 .8 -7.7Intracity transportation 1 ............................................................... 171.9 171.9 171.9 172.1 -.5 1.1 -8.2 .5 .3 -3.9
See footnotes at end of table.
21Digitized for FRASER http://fraser.stlouisfed.org/ Federal Reserve Bank of St. Louis
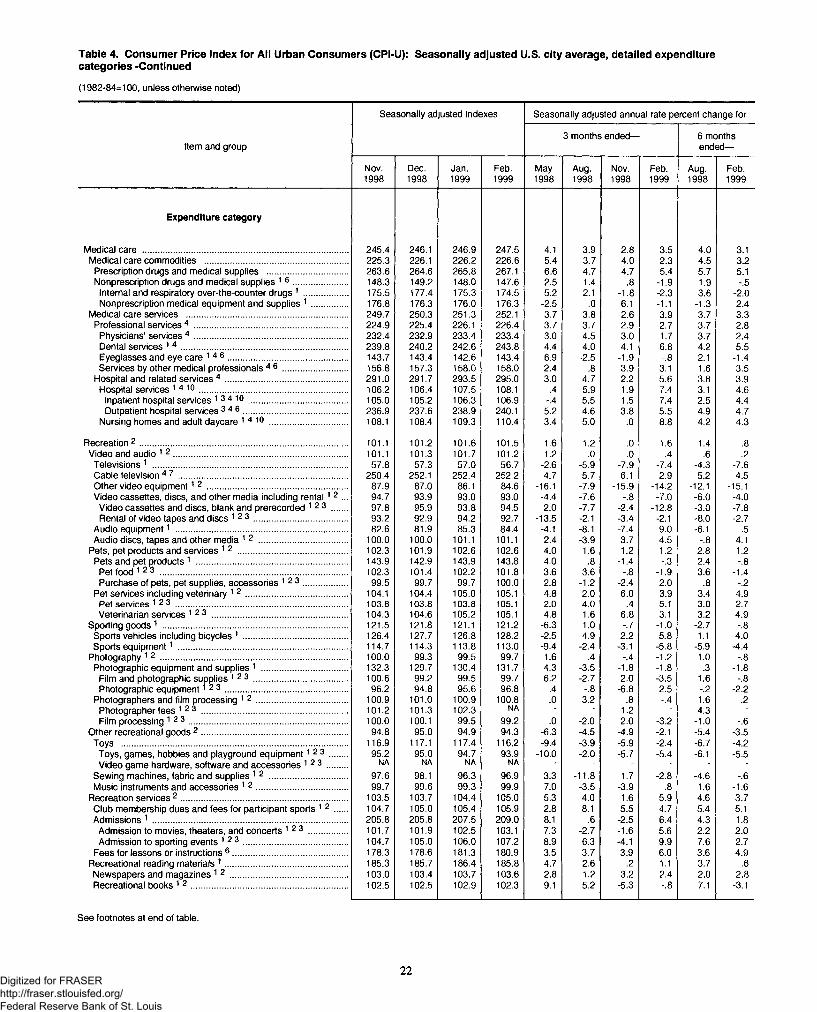
Table 4. Consumer Price Index for All Urban Consumers (CPI-U): Seasonally adjusted U.S. city average, detailed expenditurecategories -Continued
(1982-84=100, unless otherwise noted)
Seasonally adjusted indexes Seasonally adjusted annual rate percent change for
Item and group3 months ended— 6 months
ended—
Nov.1998
Dec.1998
Jan.1999
Feb.1999
May1998
Aug.1998
Nov.1998
Feb.1999
Aug.1998
Feb.1999
Expenditure category
Medical care ...................................................................................... 245.4 246.1 246.9 247.5 4.1 3.9 2.8 3.5 4.0 3.1Medical care commodities ............................................................ 225.3 226.1 226.2 226.6 5.4 3.7 4.0 2.3 4.5 3.2
Prescription drugs and medical supplies .................................. 263.6 264.6 265.8 267.1 6.6 4.7 4.7 5.4 5.7 5.1Nonprescription drugs and medical supplies 1 6 ....................... 148.3 149.2 148.0 147.6 2.5 1.4 .8 -1.9 1.9 -.5
Internal and respiratory over-the-counter drugs 1 .................. 175.5 177.4 175.3 174.5 5.2 2.1 -1.8 -2.3 3.6 -2.0Nonprescription medical equipment and supplies 1 ............... 176.8 176.3 176.0 176.3 -2.5 .0 6.1 -1.1 -1.3 2.4
Medical care services ................................................................... 249.7 250.3 251.3 252.1 3.7 3.8 2.6 3.9 3.7 3.3Professional services 4 ................................................................ 224.9 225.4 226.1 226.4 3.7 3.7 2.9 2.7 3.7 2.8
Physicians’ services 4 ................................................................ 232.4 232.9 233.4 233.4 3.0 4.5 3.0 1.7 3.7 2.4Dental services 1 4 ..................................................................... 239.8 240.2 242.6 243.8 4.4 4.0 4.1 6.8 4.2 5.5Eyeglasses and eye care 1 4 6 .................................................. 143.7 143.4 142.6 143.4 6.9 -2.5 -1.9 -.8 2.1 -1.4Services by other medical professionals 4 6 ........................... 156.8 157.3 158.0 158.0 2.4 .8 3.9 3.1 1.6 3.5
Hospital and related sen/ices 4 ................................................... 291.0 291.7 293.5 295.0 3.0 4.7 2.2 5.6 3.8 3.9Hospital services 1 4 1 0 .............................................................. 106.2 106.4 107.5 108.1 .4 5.9 1.9 7.4 3.1 4.6
Inpatient hospital services i 3 4 1 0 ......................................... 105.0 105.2 106.3 106.9 -.4 5.5 1.5 7.4 2.5 4.4Outpatient hospital services 34 6 ........................................... 236.9 237.6 238.9 240.1 5.2 4.6 3.8 5.5 4.9 4.7
Nursing homes and adult daycare 1410 ................................ 108.1 108.4 109.3 110.4 3.4 5.0 .0 8.8 4.2 4.3
Recreation 2 ....................................................................................... 101.1 101.2 101.6 101.5 1.6 1.2 .0 1.6 1.4 .8Video and audio 1 2 ......................................................................... 101.1 101.3 101.7 101.2 1.2 .0 .0 .4 .6 .2
Televisions 1 ................................................................................. 57.8 57.3 57.0 56.7 -2.6 -5.9 -7.9 -7.4 -4.3 -7.6Cable television 4 7 ...................................................................... 250.4 252.1 252.4 252.2 4.7 5.7 6.1 2.9 5.2 4.5Other video equipment1 2 ........................................................... 87.9 87.0 86.1 84.6 -16.1 -7.9 -15.9 -14.2 -12.1 -15.1Video cassettes, discs, and other media including renta l1 2 ... 94.7 93.9 93.0 93.0 -4.4 -7.6 -.8 -7.0 -6.0 -4.0
Video cassettes and discs, blank and prerecorded 123 97.8 95.9 93.8 94.5 2.0 -7.7 -2.4 -12.8 -3.0 -7.8Rental of video tapes and discs 1 2 3 ....................................... 93.2 92.9 94.2 92.7 -13.5 -2.1 -3.4 -2.1 -8.0 -2.7
Audio equipment1 ........................................................................ 82.6 81.9 85.3 84.4 -4.1 -8.1 -7.4 9.0 -6.1 .5Audio discs, tapes and other media 1 2 ..................................... 100.0 100.0 101.1 101.1 2.4 -3.9 3.7 4.5 -.8 4.1
Pets, pet products and services 1 2 .............................................. 102.3 101.9 102.6 102.6 4.0 1.6 1.2 1.2 2.8 1.2Pets and pet products 1 ............................................................... 143.9 142.9 143.9 143.8 4.0 .8 -1.4 -.3 2.4 -.8
Pet food 123 .............................................................................. 102.3 101.4 102.2 101.8 3.6 3.6 -.8 -1.9 3.6 -1.4Purchase of pets, pet supplies, accessories 1 2 3 .................. 99.5 99.7 99.7 100.0 2.8 -1.2 -2.4 2.0 .8 -.2
Pet services including veterinary 1 2 .......................................... 104.1 104.4 105.0 105.1 4.8 2.0 6.0 3.9 3.4 4.9Pet services 1 2 3 ........................................................................ 103.8 103.8 103.8 105.1 2.0 4.0 .4 5.1 3.0 2.7Veterinarian services 1 2 3 ........................................................ 104.3 104.6 105.2 105.1 4.8 1.6 6.8 3.1 3.2 4.9
Sporting goods 1 ............................................................................. 121.5 121.8 121.1 121.2 -6.3 1.0 -.7 -1.0 -2.7 -.8Sports vehicles including bicycles 1 ........................................... 126.4 127.7 126.8 128.2 -2.5 4.9 2.2 5.8 1.1 4.0Sports equipment1 ....................................................................... 114.7 114.3 113.8 113.0 -9.4 -2.4 -3.1 -5.8 -5.9 -4.4
Photography 1 2 .............................................................................. 100.0 99.3 99.5 99.7 1.6 .4 -.4 -1.2 1.0 -.8Photographic equipment and supplies 1 .................................... 132.3 129.7 130.4 131.7 4.3 -3.5 -1.8 -1.8 .3 -1.8
Film and photographic supplies 1 2 3 ....................................... 100.6 99.2 99.5 99.7 6.2 -2.7 2.0 -3.5 1.6 -.8Photographic equipment1 2 3 ................................................... 96.2 94.8 95.6 96.8 .4 -.8 -6.8 2.5 -.2 -2.2
Photographers and film processing 1 2 ......................................Photographer fees 123 .............................................................
100.9 101.0 100.9 100.8 .0 3.2 .8 -.4 1.6 .2101.2 101.3 102.3 NA ■ * 1.2 ■ 4.3 ■
Film processing 1 2 3 .................................................................. 100.0 100.1 99.5 99.2 .0 -2.0 2.0 -3.2 -1.0 -.6Other recreational goods 2 ............................................................. 94.8 95.0 94.9 94.3 -6.3 -4.5 -4.9 -2.1 -5.4 -3.5
Toys .............................................................................................. 116.9 117.1 117.4 116.2 -9.4 -3.9 -5.9 -2.4 -6.7 -4.2Toys, games, hobbies and playground equipment1 2 3 ....... 95.2 95.0 94.7 93.9 -10.0 -2.0 -5.7 -5.4 -6.1 -5.5Video game hardware, software and accessories 1 2 3 ........ NA NA NA NA ■ - - - - -
Sewing machines, fabric and supplies 1 2 ................................. 97.6 98.1 96.3 96.9 3.3 -11.8 1.7 -2.8 -4.6 -.6Music instruments and accessories 1 2 ...................................... 99.7 99.6 99.3 99.9 7.0 -3.5 -3.9 .8 1.6 -1.6
Recreation services 2 ..................................................................... 103.5 103.7 104.4 105.0 5.3 4.0 1.6 5.9 4.6 3.7Club membership dues and fees for participant sports 1 2 ..... 104.7 105.0 105.4 105.9 2.8 8.1 5.5 4.7 5.4 5.1Admissions 1 ................................................................................. 205.8 205.8 207.5 209.0 8.1 .6 -2.5 6.4 4.3 1.8
Admission to movies, theaters, and concerts 1 2 3 ................ 101.7 101.9 102.5 103.1 7.3 -2.7 -1.6 5.6 2.2 2.0Admission to sporting events 1 2 3 ............................................ 104.7 105.0 106.0 107.2 8.9 6.3 -4.1 9.9 7.6 2.7
Fees for lessons or instructions 6 ................................................ 178.3 178.6 181.3 180.9 3.5 3.7 3.9 6.0 3.6 4.9Recreational reading materials 1 ................................................... 185.3 185.7 186.4 185.8 4.7 2.6 .2 1.1 3.7 .6Newspapers and magazines 1 2 ................................................. 103.0 103.4 103.7 103.6 2.8 1.2 3.2 2.4 2.0 2.8Recreational books 1 2 ................................................................. 102.5 102.5 102.9 102.3 9.1 5.2 -5.3 -.8 7.1 -3.1
See footnotes at end of table.
22Digitized for FRASER http://fraser.stlouisfed.org/ Federal Reserve Bank of St. Louis
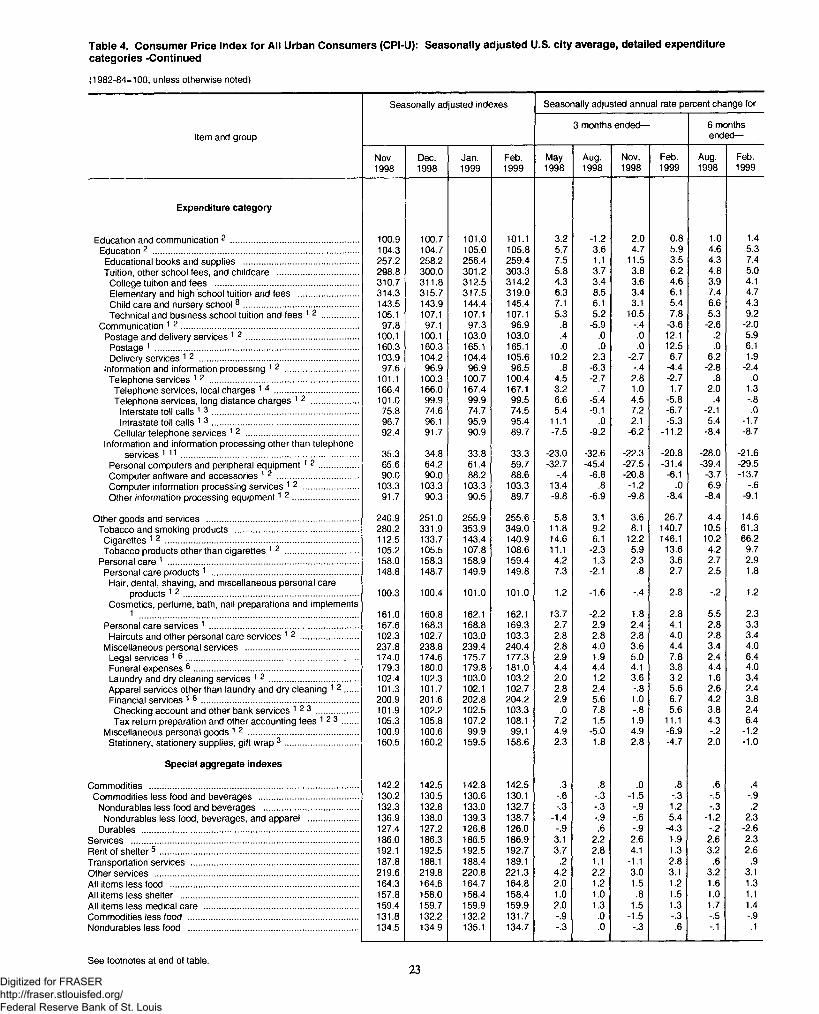
Table 4. Consumer Price Index for All Urban Consumers (CPI-U): Seasonally adjusted U.S. city average, detailed expenditurecategories -Continued
(1982-84=100, unless otherwise noted)
Seasonally adjusted indexes Seasonally adjusted annual rate percent change for
Item and group3 months ended— 6 months
ended—
Nov.1998
Dec.1998
Jan.1999
Feb.1999
May1998
Aug.1998
Nov.1998
Feb.1999
Aug.1998
Feb.1999
Expenditure category
Education and communication 2 ..................................................... 100.9 100.7 101.0 101.1 3.2 -1.2 2.0 0.8 1.0 1.4Education 2 ...................................................................................... 104.3 104.7 105.0 105.8 5.7 3.6 4.7 5.9 4.6 5.3
Educational books and supplies ................................................ 257.2 258.2 256.4 259.4 7.5 1.1 11.5 3.5 4.3 7.4Tuition, other school fees, and childcare .................................. 298.8 300.0 301.2 303.3 5.8 3.7 3.8 6.2 4.8 5.0
College tuition and fees ............................................................ 310.7 311.8 312.5 314.2 4.3 3.4 3.6 4.6 3.9 4.1Elementary and high school tuition and fees ......................... 314.3 315.7 317.5 319.0 6.3 8.5 3.4 6.1 7.4 4.7Child care and nursery school 8 ................................................ 143.5 143.9 144.4 145.4 7.1 6.1 3.1 5.4 6.6 4.3Technical and business school tuition and fees 1 2 ............... 105.1 107.1 107.1 107.1 5.3 5.2 10.5 7.8 5.3 9.2
Communication 1 2 .......................................................................... 97.8 97.1 97.3 96.9 .8 -5.9 -.4 -3.6 -2.6 -2.0Postage and delivery services 1 2 ............................................... 100.1 100.1 103.0 103.0 .4 .0 .0 12.1 .2 5.9
Postage 1 ..................................................................................... 160.3 160.3 165.1 165.1 .0 .0 .0 12.5 .0 6.1Delivery services 1 2 .................................................................. 103.9 104.2 104.4 105.6 10.2 2.3 -2.7 6.7 6.2 1.9
Information and information processing 1 2 .............................. 97.6 96.9 96.9 96.5 .8 -6.3 -.4 -4.4 -2.8 -2.4Telephone services 1 2 .............................................................. 101.1 100.3 100.7 100.4 4.5 -2.7 2.8 -2.7 .8 .0
Telephone services, local charges 1 4 ................................... 166.4 166.0 167.4 167.1 3.2 .7 1.0 1.7 2.0 1.3Telephone services, long distance charges 12 ................... 101.0 99.9 99.9 99.5 6.6 -5.4 4.5 -5.8 .4 -.8
Interstate toll calls 1 3 ............................................................. 75.8 74.6 74.7 74.5 5.4 -9.1 7.2 -6.7 -2.1 .0Intrastate toll calls 1 3 ............................................................. 96.7 96.1 95.9 95.4 11.1 .0 2.1 -5.3 5.4 -1.7
Cellular telephone services 1 2 ............................................... 92.4 91.7 90.9 89.7 -7.5 -9.2 -6.2 -11.2 -8.4 -8.7Information and information processing other than telephone
services 1 1 1 .......................................................................... 35.3 34.8 33.8 33.3 -23.0 -32.6 -22.3 -20.8 -28.0 -21.6Personal computers and peripheral equipm ent1 2 ................ 65.6 64.2 61.4 59.7 -32.7 -45.4 -27.5 -31.4 -39.4 -29.5Computer software and accessories 12 .................................. 90.0 90.0 88.2 88.6 -.4 -6.8 -20.8 -6.1 -3.7 -13.7Computer information processing services 1 2 ....................... 103.3 103.3 103.3 103.3 13.4 .8 -1.2 .0 6.9 -.6Other information processing equipment1 2 ........................... 91.7 90.3 90.5 89.7 -9.8 -6.9 -9.8 -8.4 -8.4 -9.1
Other goods and services ............................................................... 240.9 251.0 255.9 255.6 5.8 3.1 3.6 26.7 4.4 14.6Tobacco and smoking products ................................................... 280.2 331.9 353.9 349.0 11.8 9.2 8.1 140.7 10.5 61.3
Cigarettes 1 2 ................................................................................ 112.5 133.7 143.4 140.9 14.6 6.1 12.2 146.1 10.2 66.2Tobacco products other than cigarettes 12 ............................... 105.2 105.5 107.8 108.6 11.1 -2.3 5.9 13.6 4.2 9.7
Personal care 1 ............................................................................... 158.0 158.3 158.9 159.4 4.2 1.3 2.3 3.6 2.7 2.9Personal care products 1 ............................................................. 148.8 148.7 149.9 149.8 7.3 -2.1 .8 2.7 2.5 1.8
Hair, dental, shaving, and miscellaneous personal careproducts 1 2 ......................................................................... 100.3 100.4 101.0 101.0 1.2 -1.6 -.4 2.8 -.2 1.2
Cosmetics, perfume, bath, nail preparations and implements1 161.0 160.8 162.1 162.1 13.7 -2.2 1.8 2.8 5.5 2.3
Personal care services 1 .............................................................. 167.6 168.3 168.8 169.3 2.7 2.9 2.4 4.1 2.8 3.3Haircuts and other personal care services 1 2 ........................ 102.3 102.7 103.0 103.3 2.8 2.8 2.8 4.0 2.8 3.4
Miscellaneous personal services ............................................... 237.8 238.8 239.4 240.4 2.8 4.0 3.6 4.4 3.4 4.0Legal services 1 6 ........................................................................ 174.0 174.6 175.7 177.3 2.9 1.9 5.0 7.8 2.4 6.4Funeral expenses 6 .................................................................... 179.3 180.0 179.8 181.0 4.4 4.4 4.1 3.8 4.4 4.0Laundry and dry cleaning services 1 2 ..................................... 102.4 102.3 103.0 103.2 2.0 1.2 3.6 3.2 1.6 3.4Apparel services other than laundry and dry cleaning 1 2 ..... 101.3 101.7 102.1 102.7 2.8 2.4 -.8 5.6 2.6 2.4Financial services 1 6 ................................................................. 200.9 201.6 202.8 204.2 2.9 5.6 1.0 6.7 4.2 3.8Checking account and other bank services 1 2 3 ................. 101.9 102.2 102.5 103.3 .0 7.8 -.8 5.6 3.8 2.4Tax return preparation and other accounting fees 1 2 3 ...... 105.3 105.8 107.2 108.1 7.2 1.5 1.9 11.1 4.3 6.4
Miscellaneous personal goods 1 2 .............................................. 100.9 100.6 99.9 99.1 4.9 -5.0 4.9 -6.9 -.2 -1.2Stationery, stationery supplies, gift wrap 3 .............................. 160.5 160.2 159.5 158.6 2.3 1.8 2.8 -4.7 2.0 -1.0
Special aggregate indexes
Commodities ....................................................................................... 142.2 142.5 142.8 142.5 .3 .8 .0 .8 .6 .4Commodities less food and beverages ......................................... 130.2 130.5 130.6 130.1 -.6 -.3 -1.5 -.3 -.5 -.9
Nondurables less food and beverages ....................................... 132.3 132.8 133.0 132.7 -,3 -.3 -.9 1.2 -.3 .2Nondurables less food, beverages, and apparel ..................... 136.9 138.0 139.3 138.7 -1.4 -.9 -.6 5.4 -1.2 2.3
Durables .......................................................................................... 127.4 127.2 126.8 126.0 -.9 .6 -.9 -4.3 -.2 -2.6Services .............................................................................................. 186.0 186.3 186.5 186.9 3.1 2.2 2.6 1.9 2.6 2.3Rent of shelter5 ................................................................................... 192.1 192.5 192.5 192.7 3.7 2.8 4.1 1.3 3.2 2.6Transportation services ...................................................................... 187.8 188.1 188.4 189.1 .2 1.1 -1.1 2.8 .6 .9Other services ..................................................................................... 219.6 219.8 220.8 221.3 4.2 2.2 3.0 3.1 3.2 3.1All items less food .............................................................................. 164.3 164.6 164.7 164.8 2.0 1.2 1.5 1.2 1.6 1.3All items less shelter .......................................................................... 157.8 158.0 158.4 158.4 1.0 1.0 .8 1.5 1.0 1.1All items less medical care ................................................................ 159.4 159.7 159.9 159.9 2.0 1.3 1.5 1.3 1.7 1.4Commodities less food ....................................................................... 131.8 132.2 132.2 131.7 -.9 .0 -1.5 -.3 -.5 -.9Nondurables less food ....................................................................... 134.5 134.9 135.1 134.7 -.3 .0 -.3 .6 -.1 .1
See footnotes at end of table.23
Digitized for FRASER http://fraser.stlouisfed.org/ Federal Reserve Bank of St. Louis
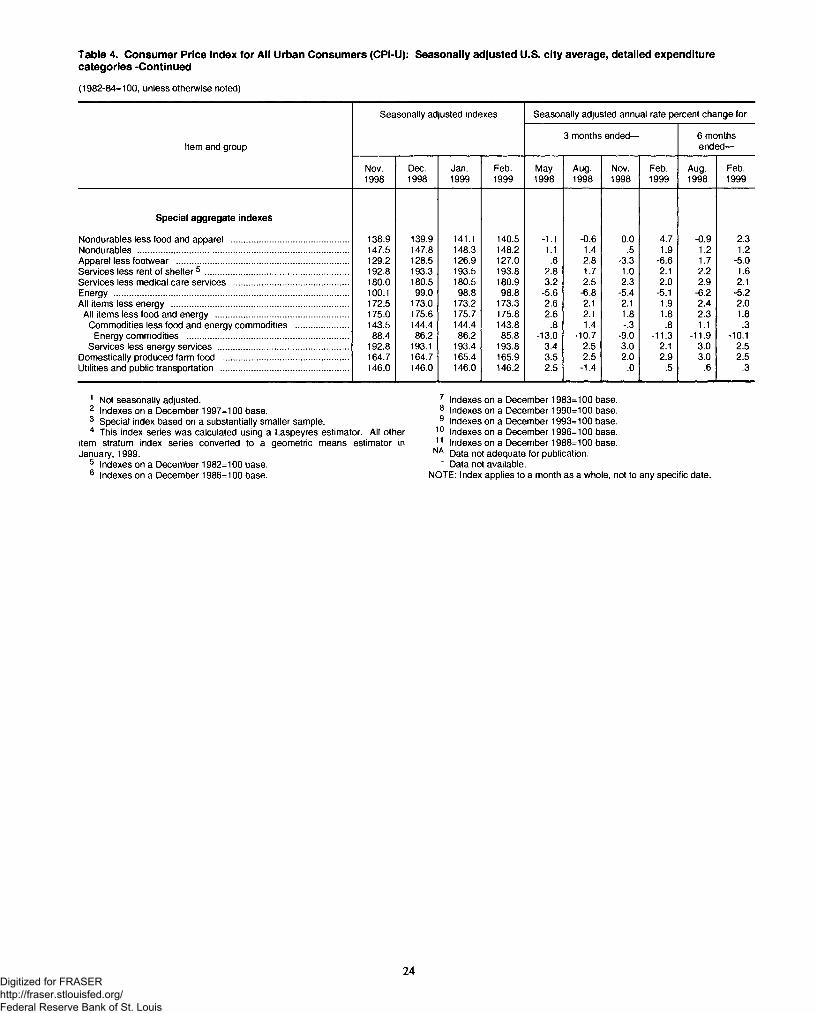
Table 4. Consumer Price Index for All Urban Consumers (CPI-U): Seasonally adjusted U.S. city average, detailed expenditurecategories -Continued
(1982-84=100, unless otherwise noted)
Seasonally adjusted indexes Seasonally adjusted annual rate percent change for
Item and group3 months ended— 6 months
ended—
Nov.1998
Dec.1998
Jan.1999
Feb.1999
May1998
Aug.1998
Nov.1998
Feb.1999
Aug.1998
Feb.1999
Special aggregate indexes
Nondurables less food and apparel ................................................. 138.9 139.9 141.1 140.5 -1.1 -0.6 0.0 4.7 -0.9 2.3Nondurables ........................................................................................ 147.5 147.8 148.3 148.2 1.1 1.4 .5 1.9 1.2 1.2Apparel less footwear ........................................................................ 129.2 128.5 126.9 127.0 .6 2.8 -3.3 -6.6 1.7 -5.0Services less rent of shelter5 ............................................................ 192.8 193.3 193.5 193.8 2.8 1.7 1.0 2.1 2.2 1.6Services less medical care services ................................................ 180.0 180.5 180.5 180.9 3.2 2.5 2.3 2.0 2.9 2.1Energy .................................................................................................. 100.1 99.0 98.8 98.8 -5.6 -6.8 -5.4 -5.1 -6.2 -5.2All items less energy .......................................................................... 172.5 173.0 173.2 173.3 2.6 2.1 2.1 1.9 2.4 2.0
All items less food and energy ....................................................... 175.0 175.6 175.7 175.8 2.6 2.1 1.8 1.8 2.3 1.8Commodities less food and energy commodities ...................... 143.5 144.4 144.4 143.8 .8 1.4 -.3 .8 1.1 .3
Energy commodities ................................................................... 88.4 86.2 86.2 85.8 -13.0 -10.7 -9.0 -11.3 -11.9 -10.1Services less energy services ...................................................... 192.8 193.1 193.4 193.8 3.4 2.5 3.0 2.1 3.0 2.5
Domestically produced farm food .................................................... 164.7 164.7 165.4 165.9 3.5 2.5 2.0 2.9 3.0 2.5Utilities and public transportation ..................................................... 146.0 146.0 146.0 146.2 2.5 -1.4 .0 .5 .6 .3
1 Not seasonally adjusted.2 Indexes on a December 1997=100 base.3 Special index based on a substantially smaller sample.4 This index series was calculated using a Laspeyres estimator. All other
item stratum index series converted to a geometric means estimator in January, 1999.
5 Indexes on a December 1982=100 base.6 Indexes on a December 1986=100 base.
1011
NA
7 Indexes on a December 1983=100 base.8 Indexes on a December 1990=100 base.9 Indexes on a December 1993=100 base.
Indexes on a December 1996=100 base. Indexes on a December 1988=100 base. Data not adequate for publication.Data not available.
NOTE: Index applies to a month as a whole, not to any specific date.
24Digitized for FRASER http://fraser.stlouisfed.org/ Federal Reserve Bank of St. Louis
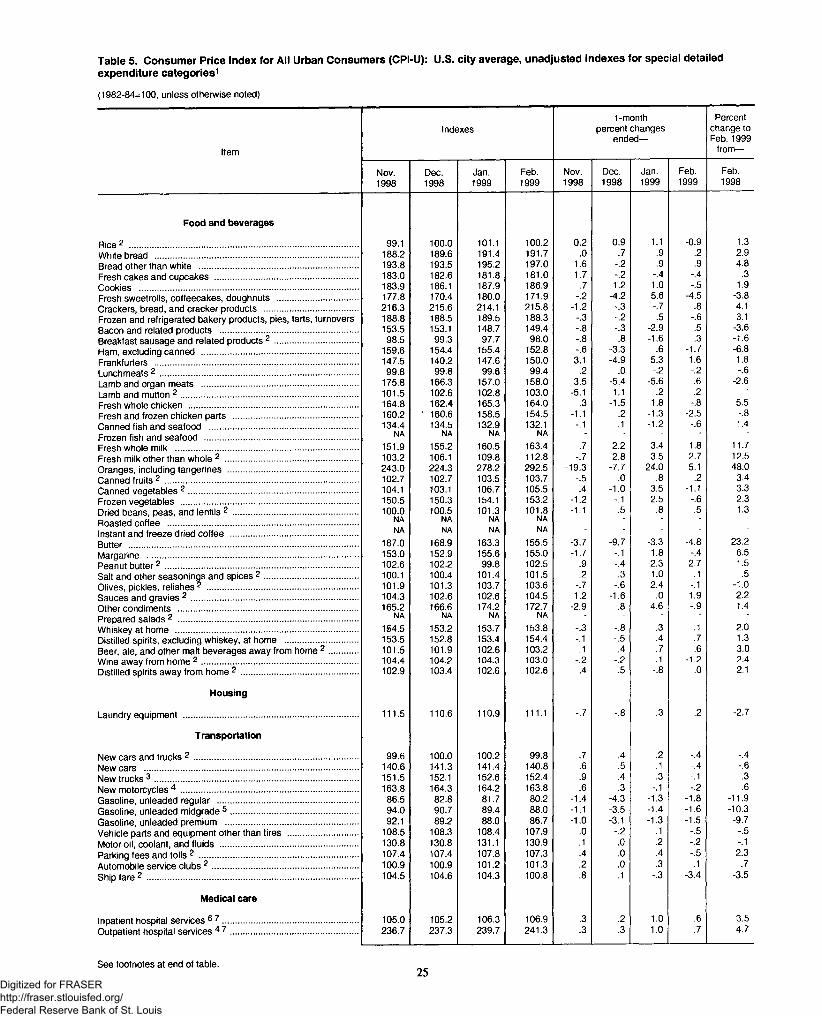
Table 5. Consumer Price Index for All Urban Consumers (CPI-U): U.S. city average, unadjusted indexes for special detailedexpenditure categories1
(1982-84=100, unless otherwise noted)
Item
Indexes1-month
percent changes ended—
Percent change to Feb. 1999
from—
Nov.1998
Dec.1998
Jan.1999
Feb.1999
Nov.1998
Dec.1998
Jan.1999
Feb.1999
Feb.1998
F o o d a n d b e v e ra g e s
99.1 100.0 101.1 100.2 0.2 0.9 1.1 -0.9 1.3White bread ..................................................................................... 188.2 189.6 191.4 191.7 .0 .7 .9 .2 2.9Bread other than white .................................................................. 193.8 193.5 195.2 197.0 1.6 -.2 .9 .9 4.8Fresh cakes and cupcakes ............................................................ 183.0 182.6 181.8 181.0 1.7 -.2 -.4 -.4 .3
183.9 186.1 187.9 186.9 .7 1.2 1.0 -.5 1.9Fresh sweetrolls, coffeecakes, doughnuts .................................. 177.8 170.4 180.0 171.9 -.2 -4.2 5.6 -4.5 -3.8Crackers, bread, and cracker products ....................................... 216.3 215.6 214.1 215.8 -1.2 -.3 -.7 .8 4.1Frozen and refrigerated bakery products, pies, tarts, turnovers 188.8 188.5 189.5 188.3 -.3 -.2 .5 -.6 3.1Bacon and related products ......................................................... 153.5 153.1 148.7 149.4 -.8 -.3 -2.9 .5 -3.6Breakfast sausage and related products 2 ................................... 98.5 99.3 97.7 98.0 -.8 .8 -1.6 .3 -1.6Ham, excluding canned ................................................................. 159.6 154.4 155.4 152.8 -.6 -3.3 .6 -1.7 -6.8Frankfurters ..................................................................................... 147.5 140.2 147.6 150.0 3.1 -4.9 5.3 1.6 1.8Lunchmeats2 ................................................................................... 99.8 99.8 99.6 99.4 .2 .0 -.2 -.2 -.6Lamb and organ meats ................................................................. 175.8 166.3 157.0 158.0 3.5 -5.4 -5.6 .6 -2.6Lamb and mutton 2 .......................................................................... 101.5 102.6 102.8 103.0 -5.1 1.1 .2 .2Fresh whole chicken ....................................................................... 164.8 162.4 165.3 164.0 .3 -1.5 1.8 -.8 5.5Fresh and frozen chicken parts .................................................... 160.2 ' 160.6 158.5 154.5 -1.1 .2 -1.3 -2.5 -.8Canned fish and seafood .............................................................. 134.4 134.5 132.9 132.1 -.1 .1 -1.2 -.6 1.4Frozen fish and seafood ................................................................ NA NA NA NA '
11.7Fresh whole milk ............................................................................ 151.9 155.2 160.5 163.4 .7 2.2 3.4 1.8Fresh milk other than whole 2 ....................................................... 103.2 106.1 109.8 112.8 -.7 2.8 3.5 2.7 12.5Oranges, including tangerines ...................................................... 243.0 224.3 278.2 292.5 -19.3 -7.7 24.0 5.1 48.0Canned fruits 2 ................................................................................ 102.7 102.7 103.5 103.7 -.5 .0 .8 .2 3.4Canned vegetables 2 ....................................................................... 104.1 103.1 106.7 105.5 .4 -1.0 3.5 -1.1 3.3Frozen vegetables .......................................................................... 150.5 150.3 154.1 153.2 -1.2 -.1 2.5 -.6 2.3Dried beans, peas, and lentils 2 .................................................... 100.0 100.5 101.3 101.8 -1.1 .5 .8 .5 1.3Roasted coffee ............................................................................... NA NA NA NA - ■ ~ ■ ■
Instant and freeze dried coffee ..................................................... NA NA NA NA ■ ■ * ‘23.2187.0 168.9 163.3 155.5 -3.7 -9.7 -3.3 -4.8
Margarine ........................................................................................ 153.0 152.9 155.6 155.0 -1.7 -.1 1.8 -.4 6.5Peanut butter2 ................................................................................. 102.6 102.2 99.8 102.5 .9 -.4 -2.3 2.7 1.5Salt and other seasoninas and spices 2 ....................................... 100.1 100.4 101.4 101.5 .2 .3 1.0 .1 .5Olives, pickles, relishes 2 ............................................................... 101.9 101.3 103.7 103.6 -.7 -.6 2.4 -.1 -1.0Sauces and gravies 2 ...................................................................... 104.3 102.6 102.6 104.5 1.2 -1.6 .0 1.9 2.2Other condiments ........................................................................... 165.2 166.6 174.2 172.7 -2.9 .8 4.6 -.9 1.4Prepared salads 2 ........................................................................... NA NA NA NA ■ ■ ■ ■ 'Whiskey at home ............................................................................ 154.5 153.2 153.7 153.8 -.3 -.8 .3 .1 2.0Distilled spirits, excluding whiskey, at home .............................. 153.5 152.8 153.4 154.4 -.1 -.5 .4 .7 1.3Beer, ale, and other malt beverages away from home 2 ............ 101.5 101.9 102.6 103.2 .1 .4 .7 .6 3.0Wine away from home 2 ................................................................. 104.4 104.2 104.3 103.0 -.2 -.2 .1 -1.2 2.4Distilled spirits away from home 2 ................................................. 102.9 103.4 102.6 102.6 .4 .5 -.8 .0 2.1
H o u s in g
Laundry equipment ......................................................................... 111.5 110.6 110.9 111.1 -.7 -.8 .3 .2 -2.7
T ra n s p o rta tio n
New cars and trucks 2 .................................................................... 99.6 100.0 100.2 99.8 .7 .4 .2 -.4 -.4New cars ......................................................................................... 140.6 141.3 141.4 140.8 .6 .5 .1 -.4 -.6New trucks 3 ..................................................................................... 151.5 152.1 152.6 152.4 .9 .4 .3 -.1 .3New motorcycles 4 .......................................................................... 163.8 164.3 164.2 163.8 .6 .3 -.1 -.2 .6Gasoline, unleaded regular ........................................................... 86.5 82.8 81.7 80.2 -1.4 -4.3 -1.3 -1.8 -11.9Gasoline, unleaded midgrade 5 ..................................................... 94.0 90.7 89.4 88.0 -1.1 -3.5 -1.4 -1.6 -10.3Gasoline, unleaded premium ....................................................... 92.1 89.2 88.0 86.7 -1.0 -3.1 -1.3 -1.5 -9.7Vehicle parts and equipment other than tires ............................. 108.5 108.3 108.4 107.9 .0 -.2 .1 -.5 -.5Motor oil, coolant, and fluids .......................................................... 130.8 130.8 131.1 130.9 .1 .0 .2 -.2 -.1Parking fees and tolls 2 .................................................................. 107.4 107.4 107.8 107.3 .4 .0 .4 -.5 2.3Automobile service clubs 2 ............................................................. 100.9 100.9 101.2 101.3 .2 .0 .3 .1 .7Ship fare 2 ........................................................................................ 104.5 104.6 104.3 100.8 .8 .1 -.3 -3.4 -3.5
M ed ica l care
Inpatient hospital services 6 7 ........................................................ 105.0 105.2 106.3 106.9 .3 .2 1.0 .6 3.5Outpatient hospital services 4 7 ..................................................... 236.7 237.3 239.7 241.3 .3 .3 1.0 .7 4.7
See footnotes at end of table.25
Digitized for FRASER http://fraser.stlouisfed.org/ Federal Reserve Bank of St. Louis
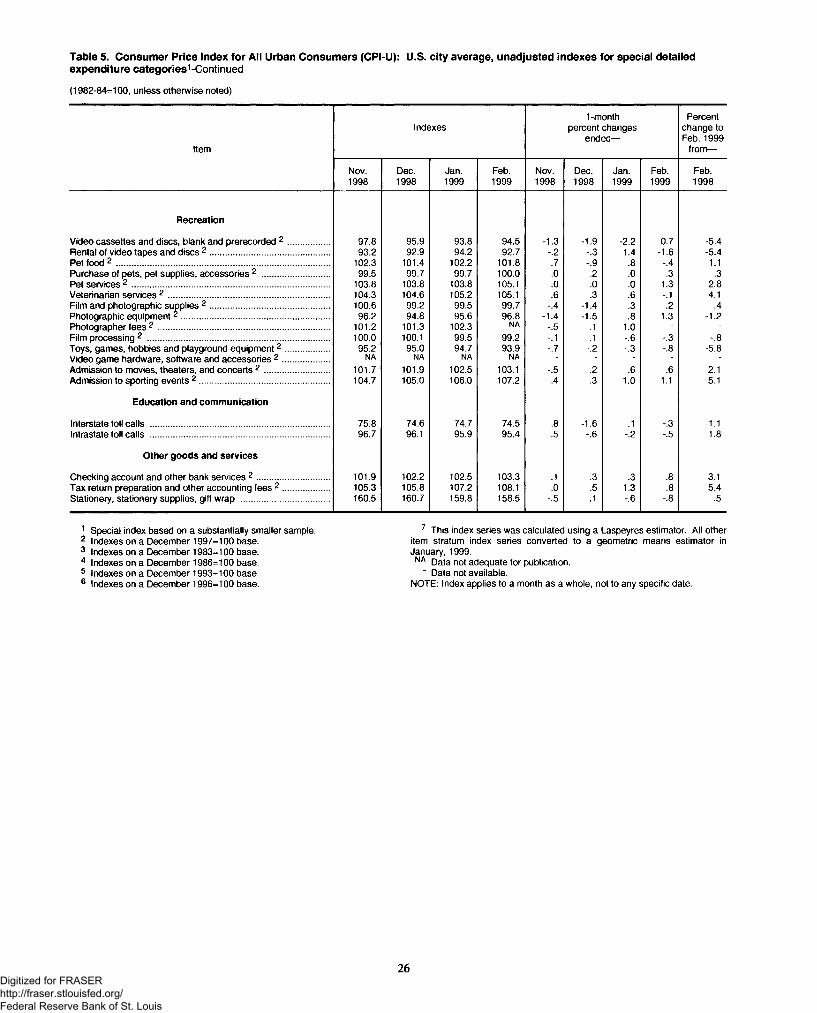
Table 5. Consumer Price Index for All Urban Consumers (CPI-U): U.S. city average, unadjusted indexes for special detailedexpenditure categories1-Continued
(1982-84=100, unless otherwise noted)
Item
Indexes1 -month
percent changes ended—
Percent change to Feb. 1999
from—
Nov.1998
Dec.1998
Jan.1999
Feb.1999
Nov.1998
Dec.1998
Jan.1999
Feb.1999
Feb.1998
Recreation
Video cassettes and discs, blank and prerecorded 2 ................. 97.8 95.9 93.8 94.5 -1.3 -1.9 -2.2 0.7 -5.4Rental of video tapes and discs 2 .................................................. 93.2 92.9 94.2 92.7 -.2 -.3 1.4 -1.6 -5.4Pet food 2 ......................................................................................... 102.3 101.4 102.2 101.8 .7 -.9 .8 -.4 1.1Purchase of pets, pet supplies, accessories 2 ............................ 99.5 99.7 99.7 100.0 .0 .2 .0 .3 .3Pet services 2 ................................................................................... 103.8 103.8 103.8 105.1 .0 .0 .0 1.3 2.8Veterinarian services 2 ................................................................... 104.3 104.6 105.2 105.1 .6 .3 .6 -.1 4.1Film and photographic supplies 2 ..................................................Photographic equipment * ..............................................................
100.6 99.2 99.5 99.7 -.4 -1.4 .3 .2 .496.2 94.8 95.6 96.8 -1.4 -1.5 .8 1.3 -1.2
Photographer fees 2 ....................................................................... 101.2 101.3 102.3 NA -.5 .1 1.0 - -Film processing 2 ............................................................................ 100.0 100.1 99.5 99.2 -.1 .1 -.6 -.3 -.8Toys, games, hobbies and playground equipment2 .................. 95.2 95.0 94.7 93.9 -.7 -.2 -.3 -.8 -5.8Video game hardware, software and accessories 2 .................... NA NA NA NA - - - - -Admission to movies, theaters, and concerts 2 ........................... 101.7 101.9 102.5 103.1 -.5 .2 .6 .6 2.1Admission to sporting events 2 ...................................................... 104.7 105.0 106.0 107.2 .4 .3 1.0 1.1 5.1
Education and communication
Interstate toll calls ........................................................................... 75.8 74.6 74.7 74.5 .8 -1.6 .1 -.3 -1.1Intrastate toll calls ........................................................................... 96.7 96.1 95.9 95.4 .5 -.6 -.2 -.5 1.8
Other goods and services
Checking account and other bank services 2 .............................. 101.9 102.2 102.5 103.3 .1 .3 .3 .8 3.1Tax return preparation and other accounting fees 2 ................... 105.3 105.8 107.2 108.1 .0 .5 1.3 .8 5.4Stationery, stationery supplies, gift wrap ..................................... 160.5 160.7 159.8 158.5 -.5 .1 -.6 -.8 .5
Special index based on a substantially smaller sample. Indexes on a December 1997=100 base.Indexes on a December 1983=100 base.Indexes on a December 1986=100 base.Indexes on a December 1993=100 base.Indexes on a December 1996=100 base.
7 This index series was calculated using a Laspeyres estimator. All other item stratum index series converted to a geometric means estimator in January, 1999.NA Data not adequate for publication.
" Data not available.NOTE: Index applies to a month as a whole, not to any specific date.
26Digitized for FRASER http://fraser.stlouisfed.org/ Federal Reserve Bank of St. Louis
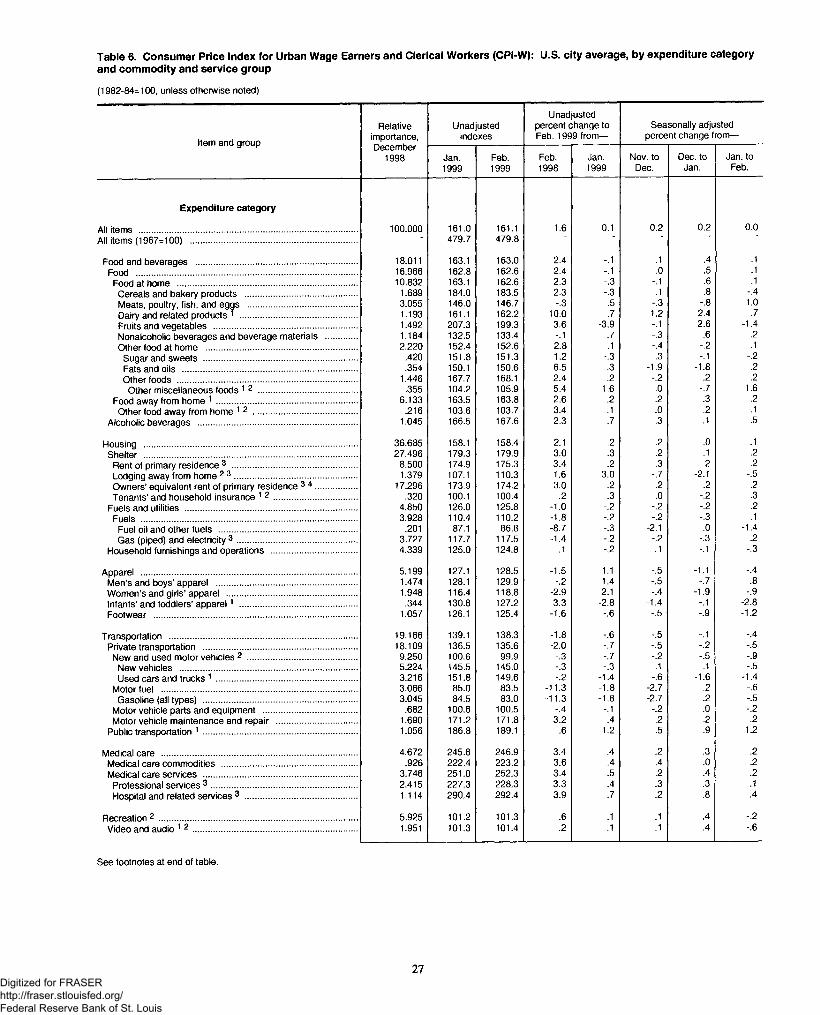
Table 6. Consumer Price Index for Urban Wage Earners and Clerical Workers (CPI-W): U.S. city average, by expenditure categoryand commodity and service group
(1982-84=100, unless otherwise noted)
Item and group
Relativeimportance,
Unadjustedindexes
Unadjusted percent change to Feb. 1999 from—
Seasonally adjusted percent change from—
December1998 Jan.
1999Feb.1999
Feb.1998
Jan.1999
Nov. to Dec.
Dec. to Jan.
Jan. to Feb.
Expenditure category
All items ........................................................................................... 100.000 161.0 161.1 1.6 0.1 0.2 0.2 0.0All items (1967-100) ..................................................................... 479.7 479.8
Food and beverages ................................................................... 18.011 163.1 163.0 2.4 -.1 .1 .4 .1Food ............................................................................................ 16.966 162.8 162.6 2.4 -.1 .0 .5 .1
Food at home ........................................................................... 10.832 163.1 162.6 2.3 -.3 -.1 .6 .1Cereals and bakery products ............................................... 1.689 184.0 183.5 2.3 -.3 .1 .8 -.4Meats, poultry, fish, and eggs ..............................................Dairy and related products 1 .................................................
3.055 146.0 146.7 -.3 .5 -.3 -.8 1.01.193 161.1 162.2 10.0 .7 1.2 2.4 .7
Fruits and vegetables ............................................................ 1.492 207.3 199.3 3.6 -3.9 -.1 2.6 -1.4Nonalcoholic beverages and beverage materials ............. 1.184 132.5 133.4 -.1 .7 -.3 .6 .2Other food at home ............................................................... 2.220 152.4 152.6 2.8 .1 -.4 -.2 .1
Sugar and sweets ................................................................ .420 151.8 151.3 1.2 -.3 .3 -.1 -.2Fats and oils ......................................................................... .354 150.1 150.6 6.5 .3 -1.9 -1.8 .2Other foods ........................................................................... 1.446 167.7 168.1 2.4 .2 -.2 .2 .2
Other miscellaneous foods 1 2 ......................................... .355 104.2 105.9 5.4 1.6 .0 -.7 1.6Food away from home 1 ........................................................... 6.133 163.5 163.8 2.6 .2 .2 .3 .2Other food away from home 1 2 ........................................... .216 103.6 103.7 3.4 .1 .0 .2 .1
Alcoholic beverages .................................................................. 1.045 166.5 167.6 2.3 .7 .3 .1 .5
Housing ......................................................................................... 36.685 158.1 158.4 2.1 .2 .2 .0 .1Shelter ......................................................................................... 27.496 179.3 179.9 3.0 .3 .2 .1 .2
Rent of primary residence 3 .................................................... 8.500 174.9 175.3 3.4 .2 .3 .2 .2Lodging away from home 2 3 ................................................... 1.379 107.1 110.3 1.6 3.0 -.7 -2.1 -.5Owners’ equivalent rent of primary residence 3 4 ................. 17.296 173.9 174.2 3.0 .2 .2 .2 .2Tenants’ and household insurance 1 2 ................................... .320 100.1 100.4 .2 .3 .0 -.2 .3
Fuels and utilities ........................................................................ 4.850 126.0 125.8 -1.0 -.2 -.2 -.2 .2Fuels .......................................................................................... 3.928 110.4 110.2 -1.8 -.2 -.2 -.3 .1
Fuel oil and other fuels .......................................................... .201 87.1 86.8 -8.7 -.3 -2.1 .0 -1.4Gas (piped) and electricity 3 .................................................. 3.727 117.7 117.5 -1.4 -.2 -.2 -.3 .2
Household furnishings and operations .................................... 4.339 125.0 124.8 .1 -.2 .1 -.1 -.3
Apparel .......................................................................................... 5.199 127.1 128.5 -1.5 1.1 -.5 -1.1 -.4Men’s and boys’ apparel ........................................................... 1.474 128.1 129.9 -.2 1.4 -.5 -.7 .8Women’s and girls’ apparel ...................................................... 1.948 116.4 118.8 -2.9 2.1 -.4 -1.9 -.9Infants’ and toddlers’ apparel1 ................................................. .344 130.8 127.2 3.3 -2.8 -1.4 -.1 -2.8Footwear ..................................................................................... 1.057 126.1 125.4 -1.6 -.6 -.5 -.9 -1.2
Transportation .............................................................................. 19.166 139.1 138.3 -1.8 -.6 -.5 -.1 -.4Private transportation ................................................................ 18.109 136.5 135.6 -2.0 -.7 -.5 -.2 -.5New and used motor vehicles 2 .............................................. 9.250 100.6 99.9 -.3 -.7 -.2 -.5 -.9
New vehicles .......................................................................... 5.224 145.5 145.0 -.3 -.3 .1 .1 -.5Used cars and trucks 1 ........................................................... 3.216 151.8 149.6 -.2 -1.4 -.6 -1.6 -1.4
Motor fuel .................................................................................. 3.066 85.0 83.5 -11.3 -1.8 -2.7 .2 -.6Gasoline (all types) ................................................................ 3.045 84.5 83.0 -11.3 -1.8 -2.7 .2 -.5
Motor vehicle parts and equipment ....................................... .682 100.6 100.5 -.4 -.1 -.2 .0 -.2Motor vehicle maintenance and repair .................................. 1.690 171.2 171.8 3.2 .4 .2 .2 .2
Public transportation 1 ................................................................ 1.056 186.8 189.1 .6 1.2 .5 .9 1.2
Medical care .................................................................................. 4.672 245.8 246.9 3.4 .4 .2 .3 .2Medical care commodities ......................................................... .926 222.4 223.2 3.6 .4 .4 .0 .2Medical care services ................................................................ 3.746 251.0 252.3 3.4 .5 .2 .4 .2
Professional services 3 ............................................................. 2.415 227.3 228.3 3.3 .4 .3 .3 .1Hospital and related services 3 ............................................... 1.114 290.4 292.4 3.9 .7 .2 .8 .4
Recreation 2 ................................................................................... 5.925 101.2 101.3 .6 .1 .1 .4 -.2Video and audio 1 2 .................................................................... 1.951 101.3 101.4 .2 .1 .1 .4 -.6
See footnotes at end of table.
27Digitized for FRASER http://fraser.stlouisfed.org/ Federal Reserve Bank of St. Louis
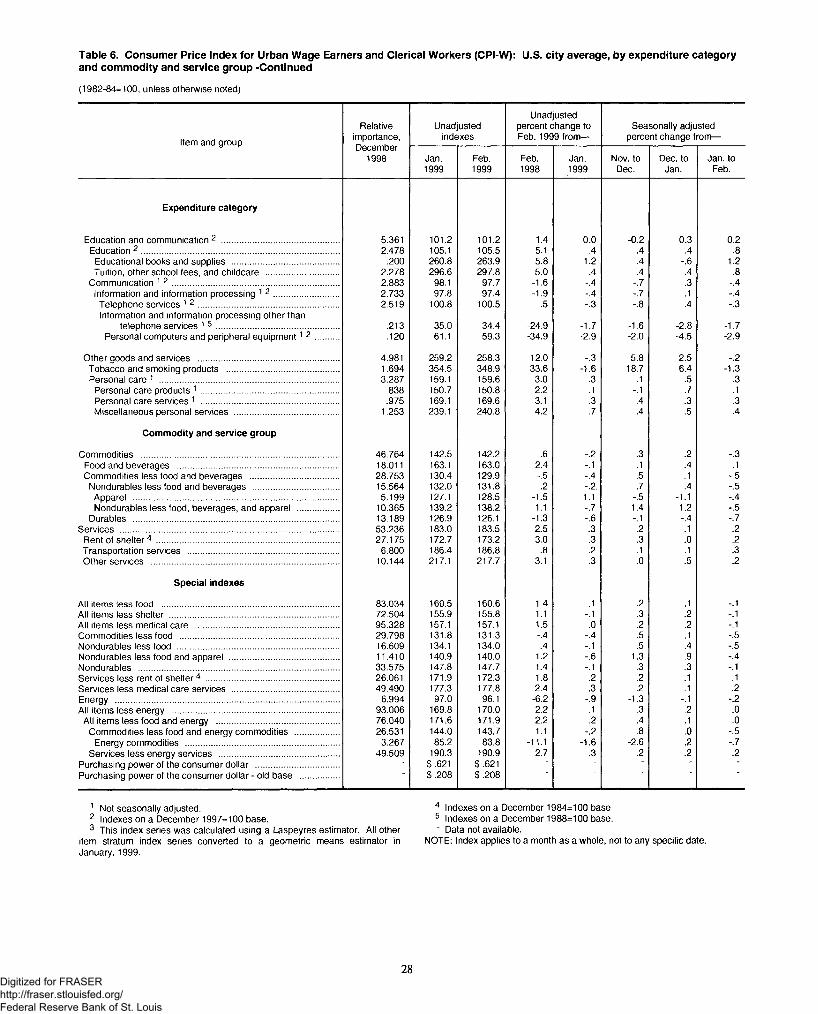
(1982-84=100, unless otherwise noted)
Table 6. Consumer Price Index for Urban Wage Earners and Clerical Workers (CPI-W): U.S. city average, by expenditure categoryand commodity and service group -Continued
Item and group
Relativeimportance,December
1998
Unadjustedindexes
Unadjusted percent change to Feb. 1999 from—
Seasonally adjusted percent change from—
Jan.1999
Feb.1999
Feb.1998
Jan.1999
Nov. to Dec.
Dec. to Jan.
Jan. to Feb.
Expenditure category
Education and communication 2 ................................................. 5.361 101.2 101.2 1.4 0.0 -0.2 0.3 0.2Education 2 .................................................................................. 2.478 105.1 105.5 5.1 .4 .4 .4 .8
Educational books and supplies ............................................. .200 260.8 263.9 5.8 1.2 .4 -.6 1.2Tuition, other school fees, and childcare .............................. 2.278 296.6 297.8 5.0 .4 .4 .4 .8
Communication 1 2 ..................................................................... 2.883 98.1 97.7 -1.6 -.4 -.7 .3 -.4Information and information processing 1 2 ........................... 2.733 97.8 97.4 -1.9 -.4 -.7 .1 -.4Telephone services 1 2 ........................................................... 2.519 100.8 100.5 .5 -.3 -.8 .4 -.3Information and information processing other than
telephone services 1 5 ................................................... .213 35.0 34.4 -24.9 -1.7 -1.6 -2.8 -1.7Personal computers and peripheral equipment1 2 .......... .120 61.1 59.3 -34.9 -2.9 -2.0 -4.5 -2.9
Other goods and services ........................................................... 4.981 259.2 258.3 12.0 -.3 5.8 2.5 -.2Tobacco and smoking products ............................................... 1.694 354.5 348.9 33.6 -1.6 18.7 6.4 -1.3Personal care 1 .......................................................................... 3.287 159.1 159.6 3.0 .3 .1 .5 .3
Personal care products 1 ......................................................... .838 150.7 150.8 2.2 .1 -.1 .7 .1Personal care sen/ices 1 ......................................................... .975 169.1 169.6 3.1 .3 .4 .3 .3Miscellaneous personal services ........................................... 1.253 239.1 240.8 4.2 .7 .4 .5 .4
Commodity and service group
Commodities .................................................................................. 46.764 142.5 142.2 .6 -.2 .3 .2 -.3Food and beverages ................................................................... 18.011 163.1 163.0 2.4 -.1 .1 .4 .1Commodities less food and beverages ..................................... 28.753 130.4 129.9 -.5 -.4 .5 .1 -.5
Nondurables less food and beverages .................................... 15.564 132.0 131.8 .2 -.2. .7 .4 -.5Apparel ...................................................................................... 5.199 127.1 128.5 -1.5 1.1 -.5 -1.1 -.4Nondurables less food, beverages, and apparel ................. 10.365 139.2 138.2 1.1 -.7 1.4 1.2 -.5
Durables ...................................................................................... 13.189 126.9 126.1 -1.3 -.6 -.1 -.4 -.7Services ........................................................................................... 53.236 183.0 183.5 2.5 .3 .2 .1 .2
Rent of shelter4 ............................................................................ 27.175 172.7 173.2 3.0 .3 .3 .0 .2Transportation services ............................................................... 6.800 186.4 186.8 .8 .2 .1 .1 .3Other services .............................................................................. 10.144 217.1 217.7 3.1 .3 .0 .5 .2
Special indexes
All items less food .......................................................................... 83.034 160.5 160.6 1.4 .1 .2 .1 -.1All items less shelter ....................................................................... 72.504 155.9 155.8 1.1 -.1 .3 .2 -.1All items less medical care ............................................................ 95.328 157.1 157.1 1.5 .0 .2 .2 -.1Commodities less food .................................................................. 29.798 131.8 131.3 -.4 -.4 .5 .1 -.5Nondurables less food ................................................................... 16.609 134.1 134.0 .4 -.1 .5 .4 -.5Nondurables less food and apparel .............................................. 11.410 140.9 140.0 1.2 -.6 1.3 .9 -.4Nondurables .................................................................................... 33.575 147.8 147.7 1.4 -.1 .3 .3 -.1Services less rent of shelter4 ....................................................... 26.061 171.9 172.3 1.8 .2 .2 .1 .1Services less medical care services ............................................. 49.490 177.3 177.8 2.4 .3 .2 .1 .2Energy ............................................................................................. 6.994 97.0 96.1 -6.2 -.9 -1.3 -.1 -.2All items less energy ..................................................................... 93.006 169.8 170.0 2.2 .1 .3 .2 .0
All items less food and energy ................................................... 76.040 171.6 171.9 2.2 .2 .4 .1 .0Commodities less food and energy commodities .................. 26.531 144.0 143.7 1.1 -.2 .8 .0 -.5
Energy commodities ................................................................ 3.267 85.2 83.8 -11.1 -1.6 -2.6 .2 -.7Services less energy services .................................................. 49.509 190.3 190.9 2.7 .3 .2 .2 .2
Purchasing power of the consumer dollar ................................... • $.621 $.621 ■ ■ ■ ~ ■Purchasing power of the consumer dollar - old base ................ $.208 $.208
1 Not seasonally adjusted.2 Indexes on a December 1997=100 base.3 This index series was calculated using a Laspeyres estimator. All other
item stratum index series converted to a geometric means estimator in January, 1999.
4 Indexes on a December 1984=100 base5 Indexes on a December 1988=100 base." Data not available.
NOTE: Index applies to a month as a whole, not to any specific date.
28Digitized for FRASER http://fraser.stlouisfed.org/ Federal Reserve Bank of St. Louis
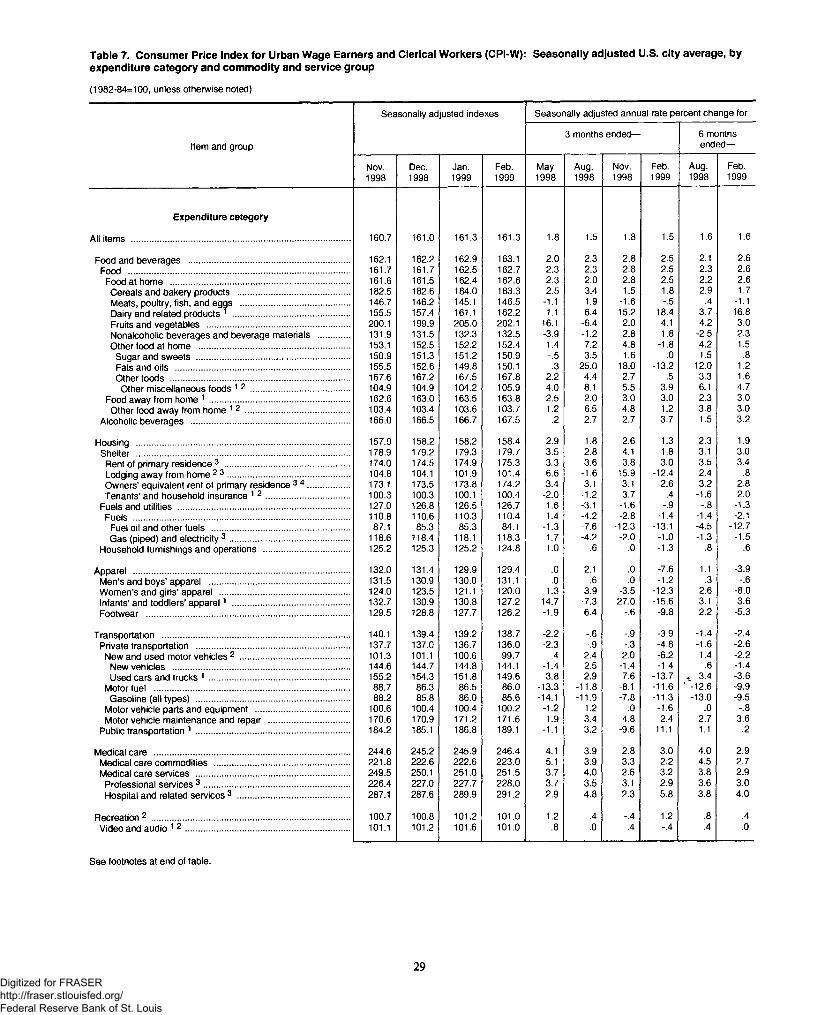
Table 7. Consumer Price Index for Urban Wage Earners and Clerical Workers (CPI-W): Seasonally adjusted U.S. city average, byexpenditure category and commodity and service group
(1982-84=100, unless otherwise noted)
Seasonally adjusted indexes Seasonally adjusted annual rate percent change for
Item and group3 months ended— 6 months
ended—
Nov.1998
Dec.1998
Jan.1999
Feb.1999
May1998
Aug.1998
Nov.1998
Feb.1999
Aug.1998
Feb.1999
Expenditure category
All items ........................................................................................... 160.7 161.0 161.3 161.3 1.8 1.5 1.8 1.5 1.6 1.6
Food and beverages ................................................................... 162.1 162.2 162.9 163.1 2.0 2.3 2.8 2.5 2.1 2.6Food ............................................................................................ 161.7 161.7 162.5 162.7 2.3 2.3 2.8 2.5 2.3 2.6
Food at home ........................................................................... 161.6 161.5 162.4 162.6 2.3 2.0 2.8 2.5 2.2 2.6Cereals and bakery products ............................................... 182.5 182.6 184.0 183.3 2.5 3.4 1.5 1.8 2.9 1.7Meats, poultry, fish, and eggs ..............................................Dairy and related products * .................................................
146.7 146.2 145.1 146.5 -1.1 1.9 -1.6 -.5 .4 -1.1155.5 157.4 161.1 162.2 1.1 6.4 15.2 18.4 3.7 16.8
Fruits and vegetables ............................................................ 200.1 199.9 205.0 202.1 16.1 -6.4 2.0 4.1 4.2 3.0Nonalcoholic beverages and beverage materials ............. 131.9 131.5 132.3 132.5 -3.9 -1.2 2.8 1.8 -2.5 2.3Other food at home ............................................................... 153.1 152.5 152.2 152.4 1.4 7.2 4.8 -1.8 4.2 1.5
Sugar and sweets ................................................................ 150.9 151.3 151.2 150.9 -.5 3.5 1.6 .0 1.5 .8Fats and oils ......................................................................... 155.5 152.6 149.8 150.1 .3 25.0 18.0 -13.2 12.0 1.2Other foods ........................................................................... 167.6 167.2 167.5 167.8 2.2 4.4 2.7 .5 3.3 1.6
Other miscellaneous foods 1 2 ......................................... 104.9 104.9 104.2 105.9 4.0 8.1 5.5 3.9 6.1 4.7Food away from home 1 .......................................................... 162.6 163.0 163.5 163.8 2.5 2.0 3.0 3.0 2.3 3.0Other food away from home 1 2 ........................................... 103.4 103.4 103.6 103.7 1.2 6.5 4.8 1.2 3.8 3.0
Alcoholic beverages .................................................................. 166.0 166.5 166.7 167.5 .2 2.7 2.7 3.7 1.5 3.2
Housing ......................................................................................... 157.9 158.2 158.2 158.4 2.9 1.8 2.6 1.3 2.3 1.9Shelter ......................................................................................... 178.9 179.2 179.3 179.7 3.5 2.8 4.1 1.8 3.1 3.0
Rent of primary residence 3 .................................................... 174.0 174.5 174.9 175.3 3.3 3.6 3.8 3.0 3.5 3.4Lodging away from home 2 3 ................................................... 104.8 104.1 101.9 101.4 6.6 -1.6 15.9 -12.4 2.4 .8Owners’ equivalent rent of primary residence 3 4 ................. 173.1 173.5 173.8 174.2 3.4 3.1 3.1 2.6 3.2 2.8Tenants’ and household insurance 1 2 ................................... 100.3 100.3 100.1 100.4 -2.0 -1.2 3.7 .4 -1.6 2.0
Fuels and utilities ........................................................................ 127.0 126.8 126.5 126.7 1.6 -3.1 -1.6 -.9 -.8 -1.3Fuels .......................................................................................... 110.8 110.6 110.3 110.4 1.4 -4.2 -2.8 -1.4 -1.4 -2.1
Fuel oil and other fuels ......................................................... 87.1 85.3 85.3 84.1 -1.3 -7.6 -12.3 -13.1 -4.5 -12.7Gas (piped) and electricity 3 .................................................. 118.6 118.4 118.1 118.3 1.7 -4.2 -2.0 -1.0 -1.3 -1.5
Household furnishings and operations .................................... 125.2 125.3 125.2 124.8 1.0 .6 .0 -1.3 .8 -.6
Apparel .......................................................................................... 132.0 131.4 129.9 129.4 .0 2.1 .0 -7.6 1.1 -3.9Men’s and boys’ apparel .......................................................... 131.5 130.9 130.0 131.1 .0 .6 .0 -1.2 .3 -.6Women’s and girls’ apparel ...................................................... 124.0 123.5 121.1 120.0 1.3 3.9 -3.5 -12.3 2.6 -8.0Infants’ and toddlers’ appare l1 ................................................. 132.7 130.9 130.8 127.2 14.7 -7.3 27.0 -15.6 3.1 3.6Footwear ..................................................................................... 129.5 128.8 127.7 126.2 -1.9 6.4 -.6 -9.8 2.2 -5.3
Transportation .............................................................................. 140.1 139.4 139.2 138.7 -2.2 -.6 -.9 -3.9 -1.4 -2.4Private transportation ................................................................ 137.7 137.0 136.7 136.0 -2.3 -.9 -.3 -4.8 -1.6 -2.6
New and used motor vehicles 2 .............................................. 101.3 101.1 100.6 99.7 .4 2.4 2.0 -6.2 1.4 -2.2New vehicles .......................................................................... 144.6 144.7 144.8 144.1 -1.4 2.5 -1.4 -1.4 .6 -1.4Used cars and trucks 1 ........................................................... 155.2 154.3 151.8 149.6 3.8 2.9 7.6 -13.7 « 3.4 -3.6
Motor fuel ................................................................................. 88.7 86.3 86.5 86.0 -13.3 -11.8 -8.1 -11.6 ! -12.6 -9.9Gasoline (all types) ................................................................ 88.2 85.8 86.0 85.6 -14.1 -11.9 -7.8 -11.3 -13.0 -9.5
Motor vehicle parts and equipment ....................................... 100.6 100.4 100.4 100.2 -1.2 1.2 .0 -1.6 .0 -.8Motor vehicle maintenance and repair .................................. 170.6 170.9 171.2 171.6 1.9 3.4 4.8 2.4 2.7 3.6
Public transportation 1 ................................................................ 184.2 185.1 186.8 189.1 -1.1 3.2 -9.6 11.1 1.1 .2
Medical care .................................................................................. 244.6 245.2 245.9 246.4 4.1 3.9 2.8 3.0 4.0 2.9Medical care commodities ........................................................ 221.8 222.6 222.6 223.0 5.1 3.9 3.3 2.2 4.5 2.7Medical care services ................................................................ 249.5 250.1 251.0 251.5 3.7 4.0 2.6 3.2 3.8 2.9
Professional services 3 ............................................................. 226.4 227.0 227.7 228.0 3.7 3.5 3.1 2.9 3.6 3.0Hospital and related services 3 ............................................... 287.1 287.6 289.9 291.2 2.9 4.8 2.3 5.8 3.8 4.0
Recreation 2 ................................................................................... 100.7 100.8 101.2 101.0 1.2 .4 -.4 1.2 .8 .4Video and audio 1 2 .................................................................... 101.1 101.2 101.6 101.0 .8 .0 .4 -.4 .4 .0
See footnotes at end of table.
29Digitized for FRASER http://fraser.stlouisfed.org/ Federal Reserve Bank of St. Louis
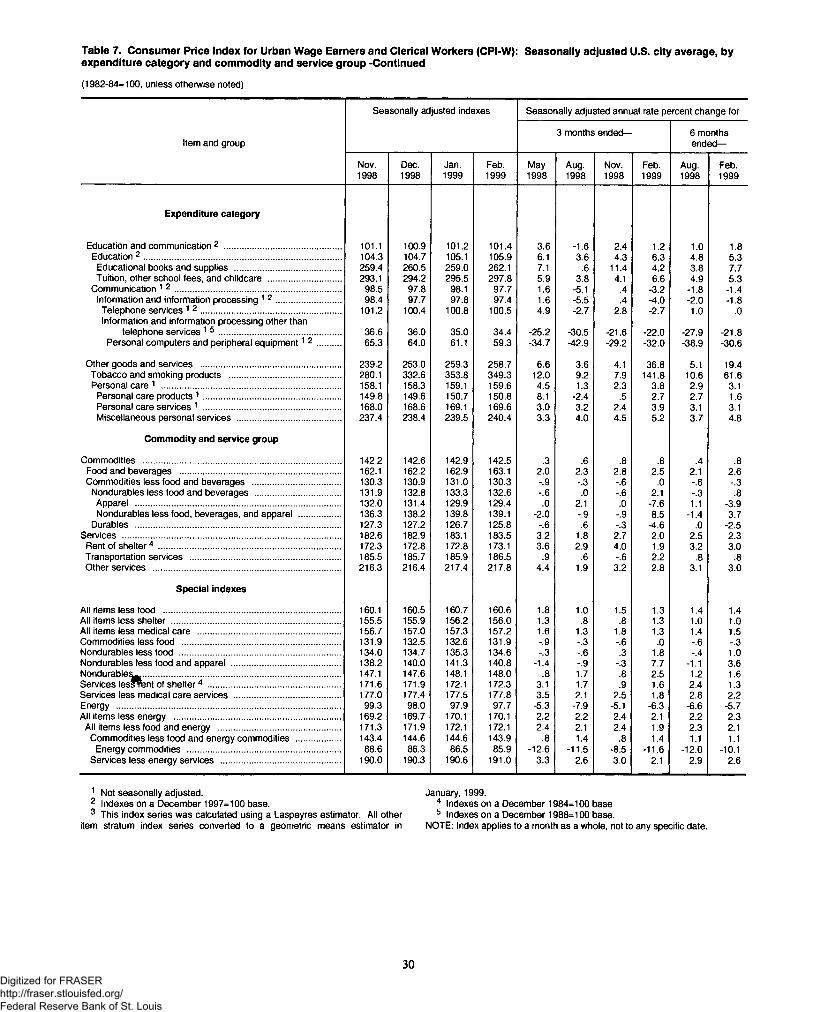
Table 7. Consumer Price Index for Urban Wage Earners and Clerical Workers (CPI-W): Seasonally adjusted U.S. city average, byexpenditure category and commodity and service group -Continued
(1982-84=100, unless otherwise noted)
Seasonally adjusted indexes Seasonally adjusted annual rate percent change for
Item and group3 months ended— 6 months
ended—
Nov.1998
Dec.1998
Jan.1999
Feb.1999
May1998
Aug.1998
Nov.1998
Feb.1999
Aug.1998
Feb.1999
Expenditure category
Education and communication 2 ................................................. 101.1 100.9 101.2 101.4 3.6 -1.6 2.4 1.2 1.0 1.8Education 2 .................................................................................. 104.3 104.7 105.1 105.9 6.1 3.6 4.3 6.3 4.8 5.3
Educational books and supplies ............................................ 259.4 260.5 259.0 262.1 7.1 .6 11.4 4.2 3.8 7.7Tuition, other school fees, and childcare .............................. 293.1 294.2 295.5 297.8 5.9 3.8 4.1 6.6 4.9 5.3
Communication 1 2 ..................................................................... 98.5 97.8 98.1 97.7 1.6 -5.1 .4 -3.2 -1.8 -1.4Information and information processing 1 2 ........................... 98.4 97.7 97.8 97.4 1.6 -5.5 .4 -4.0 -2.0 -1.8Telephone services 1 2 .......................................................... 101.2 100.4 100.8 100.5 4.9 -2.7 2.8 -2.7 1.0 .0Information and information processing other than
telephone services 1 5 ................................................... 36.6 36.0 35.0 34.4 -25.2 -30.5 -21.6 -22.0 -27.9 -21.8Personal computers and peripheral equipment1 2 .......... 65.3 64.0 61.1 59.3 -34.7 -42.9 -29.2 -32.0 -38.9 -30.6
Other goods and services .......................................................... 239.2 253.0 259.3 258.7 6.6 3.6 4.1 36.8 5.1 19.4Tobacco and smoking products .............................................. 280.1 332.6 353.8 349.3 12.0 9.2 7.9 141.8 10.6 61.6Personal care 1 ........................................................................... 158.1 158.3 159.1 159.6 4.5 1.3 2.3 3.8 2.9 3.1
Personal care products 1 ......................................................... 149.8 149.6 150.7 150.8 8.1 -2.4 .5 2.7 2.7 1.6Personal care services 1 ......................................................... 168.0 168.6 169.1 169.6 3.0 3.2 2.4 3.9 3.1 3.1Miscellaneous personal services ........................................... 237.4 238.4 239.5 240.4 3.3 4.0 4.5 5.2 3.7 4.8
Commodity and service group
Commodities .................................................................................. 142.2 142.6 142.9 142.5 .3 .6 .8 .8 .4 .8Food and beverages ................................................................... 162.1 162.2 162.9 163.1 2.0 2.3 2.8 2.5 2.1 2.6Commodities less food and beverages ..................................... 130.3 130.9 131.0 130.3 -.9 -.3 -.6 .0 -.6 -.3
Nondurables less food and beverages .................................... 131.9 132.8 133.3 132.6 -.6 .0 -.6 2.1 -.3 .8Apparel ...................................................................................... 132.0 131.4 129.9 129.4 .0 2.1 .0 -7.6 1.1 -3.9Nondurables less food, beverages, and apparel ................. 136.3 138.2 139.8 139.1 -2.0 -.9 -.9 8.5 -1.4 3.7
Durables ...................................................................................... 127.3 127.2 126.7 125.8 -.6 .6 -.3 -4.6 .0 -2.5Services ........................................................................................... 182.6 182.9 183.1 183.5 3.2 1.8 2.7 2.0 2.5 2.3
Rent of shelter4 ............................................................................ 172.3 172.8 172.8 173.1 3.6 2.9 4.0 1.9 3.2 3.0Transportation services ............................................................... 185.5 185.7 185.9 186.5 .9 .6 -.6 2.2 .8 .8Other services .............................................................................. 216.3 216.4 217.4 217.8 4.4 1.9 3.2 2.8 3.1 3.0
Special indexes
All items less food .......................................................................... 160.1 160.5 160.7 160.6 1.8 1.0 1.5 1.3 1.4 1.4All items less shelter ....................................................................... 155.5 155.9 156.2 156.0 1.3 .8 .8 1.3 1.0 1.0All items less medical care ............................................................ 156.7 157.0 157.3 157.2 1.6 1.3 1.8 1.3 1.4 1.5Commodities less food .................................................................. 131.9 132.5 132.6 131.9 -.9 -.3 -.6 .0 -.6 -.3Nondurables less food ................................................................... 134.0 134.7 135.3 134.6 -.3 -.6 .3 1.8 -.4 1.0Nondurables less food and apparel ............................................. 138.2 140.0 141.3 140.8 -1.4 -.9 -.3 7.7 -1.1 3.6N ondurab le^...................................................................................Services lessront of shelter4 .......................................................
147.1 147.6 148.1 148.0 .8 1.7 .8 2.5 1.2 1.6171.6 171.9 172.1 172.3 3.1 1.7 .9 1.6 2.4 1.3
Services less medical care services ............................................ 177.0 177.4 177.5 177.8 3.5 2.1 2.5 1.8 2.8 2.2Energy ............................................................................................. 99.3 98.0 97.9 97.7 -5.3 -7.9 -5.1 -6.3 -6.6 -5.7All items less energy ..................................................................... 169.2 169.7 170.1 170.1 2.2 2.2 2.4 2.1 2.2 2.3
All items less food and energy ................................................... 171.3 171.9 172.1 172.1 2.4 2.1 2.4 1.9 2.3 2.1Commodities less food and energy commodities .................. 143.4 144.6 144.6 143.9 .8 1.4 .8 1.4 1.1 1.1
Energy commodities ................................................................ 88.6 86.3 86.5 85.9 -12.6 -11.5 -8.5 -11.6 -12.0 -10.1Services less energy services .................................................. 190.0 190.3 190.6 191.0 3.3 2.6 3.0 2.1 2.9 2.6
1 Not seasonally adjusted. January, 1999.2 Indexes on a December 1997=100 base. 4 Indexes on a December 1984=100 base3 This index series was calculated using a Laspeyres estimator. All other 5 Indexes on a December 1988=100 base.
item stratum index series converted to a geometric means estimator in NOTE: Index applies to a month as a whole, not to any specific date.
30Digitized for FRASER http://fraser.stlouisfed.org/ Federal Reserve Bank of St. Louis
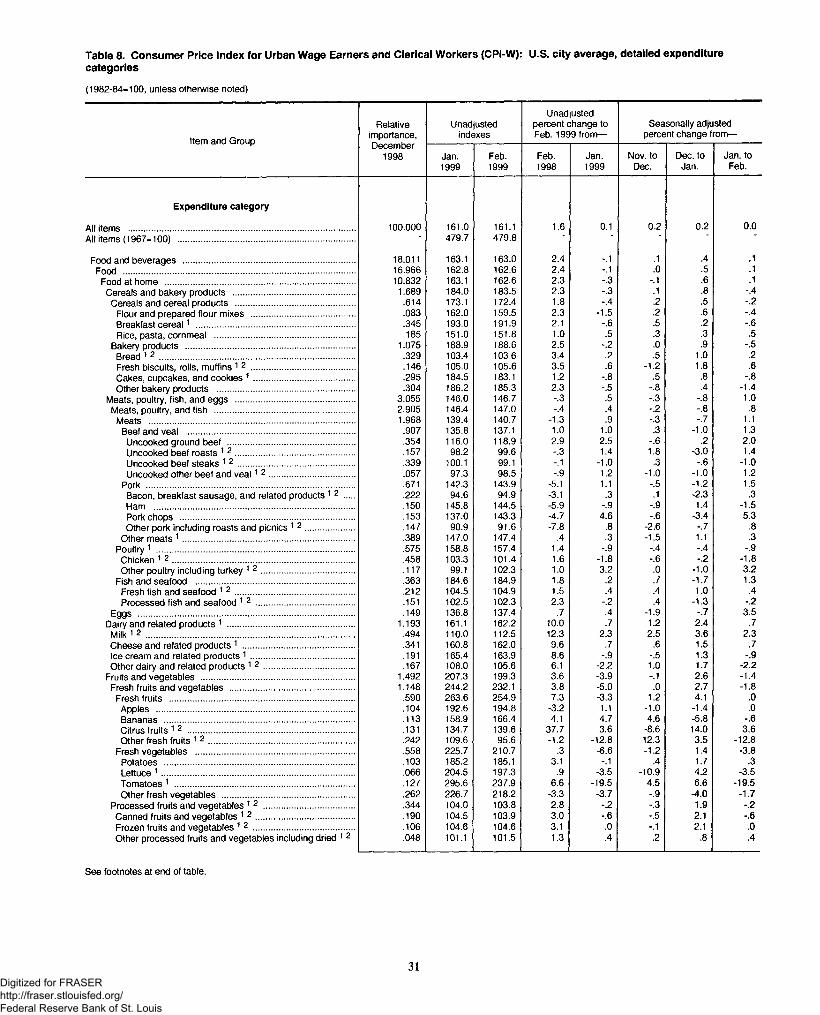
Table 8. Consumer Price Index for Urban Wage Earners and Clerical Workers (CPI-W): U.S. city average, detailed expenditurecategories
(1982-84=100, unless otherwise noted)
Item and Group
Relativeimportance,
Unadjustedindexes
Unadjusted percent change to Feb. 1999 from—
Seasonally adjusted percent change from—
December1998 Jan.
1999Feb.1999
Feb.1998
Jan.1999
Nov. to Dec.
Dec. to Jan.
Jan. to Feb.
Expenditure category
All items .............................................................................................. 100.000 161.0 161.1 1.6 0.1 0.2 0.2 0.0All items (1967-100) .......................................................................... " 479.7 479.8
Food and beverages ........................................................................ 18.011 163.1 163.0 2.4 -.1 .1 .4 .1Food ................................................................................................. 16.966 162.8 162.6 2.4 -.1 .0 .5 .1
Food at home ............................................................................... 10.832 163.1 162.6 2.3 -.3 -.1 .6 .1Cereals and bakery products ................................................... 1.689 184.0 183.5 2.3 -.3 .1 .8 -.4Cereals and cereal products .................................................. .614 173.1 172.4 1.8 -.4 .2 .5 -.2
Flour and prepared flour mixes ........................................... .083 162.0 159.5 2.3 -1.5 .2 .6 -.4Breakfast cerea l1 .................................................................. .345 193.0 191.9 2.1 -.6 .5 .2 -.6Rice, pasta, cornmeal ........................................................... .185 151.0 151.8 1.0 .5 .3 .3 .5
Bakery products ....................................................................... 1.075 188.9 188.6 2.5 -.2 .0 .9 -.5Bread 1 2 ................................................................................. .329 103.4 103.6 3.4 .2 .5 1.0 .2Fresh biscuits, rolls, muffins 1 2 ........................................... .146 105.0 105.6 3.5 .6 -1.2 1.8 .6Cakes, cupcakes, and cookies 1 .......................................... .295 184.5 183.1 1.2 -.8 .5 .8 -.8Other bakery products ......................................................... .304 186.2 185.3 2.3 -.5 -.8 .4 -1.4
Meats, poultry, fish, and eggs .................................................. 3.055 146.0 146.7 -.3 .5 -.3 -.8 1.0Meats, poultry, and fish .......................................................... 2.905 146.4 147.0 -.4 .4 -.2 -.8 .8
Meats ...................................................................................... 1.968 139.4 140.7 -1.3 .9 -.3 -.7 1.1Beef and veal ....................................................................... .907 135.8 137.1 1.0 1.0 .3 -1.0 1.3
Uncooked ground beef ..................................................... .354 116.0 118.9 2.9 2.5 -.6 .2 2.0Uncooked beef roasts 1 2 .................................................. .157 98.2 99.6 -.3 1.4 1.8 -3.0 1.4Uncooked beef steaks 1 2 ................................................. .339 100.1 99.1 -.1 -1.0 .3 -.6 -1.0Uncooked other beef and v e a l1 2 .................................... .057 97.3 98.5 -.9 1.2 -1.0 -1.0 1.2
Pork ....................................................................................... .671 142.3 143.9 -5.1 1.1 -.5 -1.2 1.5Bacon, breakfast sausage, and related products 1 2 .... .222 94.6 94.9 -3.1 .3 .1 -2.3 .3Ham .................................................................................... .150 145.8 144.5 -5.9 -.9 -9 1.4 -1.5Pork chops ......................................................................... .153 137.0 143.3 -4.7 4.6 -.6 -3.4 5.3Other pork including roasts and picnics 1 2 ..................... .147 90.9 91.6 -7.8 .8 -2.6 -.7 .8
Other meats 1 ........................................................................ .389 147.0 147.4 .4 .3 -1.5 1.1 .3Poultry 1 ................................................................................... .575 158.8 157.4 1.4 -.9 -.4 -.4 -.9Chicken 1 2 ............................................................................ .458 103.3 101.4 1.6 -1.8 -.6 -.2 -1.8Other poultry including turkey 1 2 ....................................... .117 99.1 102.3 1.0 3.2 .0 -1.0 3.2
Fish and seafood .................................................................. .363 184.6 184.9 1.8 .2 .7 -1.7 1.3Fresh fish and seafood 1 2 .................................................. .212 104.5 104.9 1.5 .4 .4 1.0 .4Processed fish and seafood 1 2 ......................................... .151 102.5 102.3 2.3 -.2 .4 -1.3 -.2
E g g s .......................................................................................... .149 136.8 137.4 .7 .4 -1.9 -.7 3.5Dairy and related products 1 ..................................................... 1.193 161.1 162.2 10.0 .7 1.2 2.4 .7
Milk 1 2 ....................................................................................... .494 110.0 112.5 12.3 2.3 2.5 3.6 2.3Cheese and related products 1 ............................................... .341 160.8 162.0 9.6 .7 .6 1.5 .7Ice cream and related products 1 ........................................... .191 165.4 163.9 8.6 -.9 -.5 1.3 -.9Other dairy and related products 1 2 ...................................... .167 108.0 105.6 6.1 -2.2 1.0 1.7 -2.2
Fruits and vegetables ................................................................ 1.492 207.3 199.3 3.6 -3.9 -.1 2.6 -1.4Fresh fruits and vegetables .................................................... 1.148 244.2 232.1 3.8 -5.0 .0 2.7 -1.8
Fresh fruits ............................................................................. .590 263.6 254.9 7.3 -3.3 1.2 4.1 .0Apples ................................................................................... .104 192.6 194.8 -3.2 1.1 -1.0 -1.4 .0Bananas ............................................................................... .113 158.9 166.4 4.1 4.7 4.6 -5.8 -.6Citrus fruits 1 2 ...................................................................... .131 134.7 139.6 37.7 3.6 -8.6 14.0 3.6Other fresh fruits 1 2 ............................................................. .242 109.6 95.6 -1.2 -12.8 12.3 3.5 -12.8
Fresh vegetables .................................................................. .558 225.7 210.7 .3 -6.6 -1.2 1.4 -3.8Potatoes ............................................................................... .103 185.2 185.1 3.1 -.1 .4 1.7 .3Lettuce 1 ................................................................................ .066 204.5 197.3 .9 -3.5 -10.9 4.2 -3.5Tomatoes 1 ........................................................................... .127 295.6 237.9 6.6 -19.5 4.5 6.6 -19.5Other fresh vegetables ....................................................... .262 226.7 218.2 -3.3 -3.7 -.9 -4.0 -1.7
Processed fruits and vegetables 12 ...................................... .344 104.0 103.8 2.8 -.2 -.3 1.9 -.2Canned fruits and vegetables 1 2 ......................................... .190 104.5 103.9 3.0 -.6 -.5 2.1 -.6Frozen fruits and vegetables 1 2 .......................................... .106 104.6 104.6 3.1 .0 -.1 2.1 .0Other processed fruits and vegetables including dried 1 2 .048 101.1 101.5 1.3 .4 .2 .8 .4
See footnotes at end of table.
31Digitized for FRASER http://fraser.stlouisfed.org/ Federal Reserve Bank of St. Louis

Table 8. Consumer Price Index for Urban Wage Earners and Clerical Workers (CPI-W): U.S. city average, detailed expenditurecategories -Continued
(1982-84=100, unless otherwise noted)
Item and Group
Relativeimportance,December
1998
Unadjustedindexes
Unadjusted percent change to Feb. 1999 from—
Seasonally adjusted percent change from—
Jan.1999
Feb.1999
Feb.1998
Jan.1999
Nov. to Dec.
Dec. to Jan.
Jan. to Feb.
Expenditure category
Nonalcoholic beverages and beverage materials ................. 1.184 132.5 133.4 -0.1 0.7 -0.3 0.6 0.2Juices and nonalcoholic drinks 1 2 ......................................... .894 101.9 102.7 .9 .8 -.9 2.2 .8
Carbonated drinks ................................................................. .495 117.9 119.6 -.7 1.4 -.7 .3 .5Frozen noncarbonated juices and drinks 1 2 ....................... .054 105.8 106.5 5.8 .7 1.8 1.1 .7Nonfrozen noncarbonated juices and drinks 1 2 ................ .344 102.0 101.8 2.3 -.2 -.1 2.0 -.2
Beverage materials including coffee and tea 1 2 .................. .290 96.5 97.1 -3.0 .6 -.3 -.2 .6Coffee 1 .................................................................................... .148 154.4 154.4 -8.3 .0 -.6 .1 .0Other beverage materials including tea 1 2 ......................... .142 102.8 104.0 3.0 1.2 -.1 -.5 1.2
Other food at home ................................................................... 2.220 152.4 152.6 2.8 .1 -.4 -.2 .1Sugar and sweets ................................................................... .420 151.8 151.3 1.2 -.3 .3 -.1 -.2
Sugar and artificial sweeteners ........................................... .092 138.2 137.1 .6 -.8 .2 .9 -.7Candy and chewing gum 1 2 ................................................. .248 102.0 101.9 .9 -.1 .1 .7 -.1Other sweets 1 2 .................................................................... .080 104.5 104.0 2.8 -.5 1.0 .8 -.5
Fats and oils ............................................................................. .354 150.1 150.6 6.5 .3 -1.9 -1.8 .2Butter and margarine 1 2 ....................................................... .119 119.0 115.4 15.7 -3.0 -5.8 -1.0 -3.0Salad dressing 1 2 .................................................................. .092 101.9 104.8 3.3 2.8 1.0 -1.5 2.8Other fats and oils including peanut bu tter1 2 ................... .142 102.2 103.7 2.1 1.5 -.7 .0 1.5
Other foods .............................................................................. 1.446 167.7 168.1 2.4 .2 -.2 .2 .2Soups ...................................................................................... .107 191.5 191.7 .5 .1 1.1 -.1 -.2Frozen and freeze dried prepared foods 1 .......................... .251 146.7 144.6 .2 -1.4 1.1 .2 -1.4Snacks 1 ................................................................................... .298 158.6 158.0 1.8 -.4 -.6 1.6 -.4Spices, seasonings, condiments, sauces .......................... .309 175.0 176.4 1.8 .8 -.6 -.2 .6Baby food 12 .......................................................................... .125 104.0 104.1 3.7 .1 .3 1.0 .1Other miscellaneous foods 1 2 ............................................. .355 104.2 105.9 5.4 1.6 .0 -.7 1.6
Food away from home 1 ............................................................... 6.133 163.5 163.8 2.6 .2 .2 .3 .2Full service meals and snacks 1 2 ............................................ 3.199 103.1 103.5 3.0 .4 .2 .4 .4Limited service meals and snacks 1 2 ...................................... 1.772 102.5 102.4 1.9 -.1 .2 .3 -.1Food at employee sites and schools 1 2 .................................. .711 102.6 102.6 2.6 .0 .2 .1 .0Food from vending machines and mobile vendors 1 2 ........... .235 101.0 101.1 1.0 .1 .1 .2 .1Other food away from home 1 2 ........................... .................... .216 103.6 103.7 3.4 .1 .0 .2 .1
Alcoholic beverages ....................................................................... 1.045 166.5 167.6 2.3 .7 .3 .1 .5Alcoholic beverages at home ..................................................... .698 151.2 152.5 2.1 .9 .3 .1 .4
Beer, ale, and other malt beverages at home ........................ .479 150.3 151.5 2.4 .8 .2 .1 .4Distilled spirits at home ............................................................. .094 152.7 153.9 1.6 .8 .0 .2 .7Wine at home ............................................................................. .125 145.4 147.0 1.7 1.1 .5 -.3 .3
Alcoholic beverages away from home ...................................... .347 196.8 197.5 2.5 .4 .3 .2 .4
Housing ............................................................................................. 36.685 158.1 158.4 2.1 .2 .2 .0 .1Shelter ............................................................................................. 27.496 179.3 179.9 3.0 .3 .2 .1 .2
Rent of primary residence 3 ........................................................ 8.500 174.9 175.3 3.4 .2 .3 .2 .2Lodging away from home 2 3 ...................................................... 1.379 107.1 110.3 1.6 3.0 -.7 -2.1 -.5
Housing at school, excluding board 3 4 .................................... .141 241.9 242.1 4.6 .1 .4 .4 .2Other lodging away from home including hotels and motels 1.238 228.9 236.5 1.3 3.3 -.8 -2.4 -.6
Owners’ equivalent rent of primary residence 3 4 ..................... 17.296 173.9 174.2 3.0 .2 .2 .2 .2Tenants’ and household insurance 1 2 ....................................... .320 100.1 100.4 .2 .3 .0 -.2 .3
Fuels and utilities ........................................................................... 4.850 126.0 125.8 -1.0 -.2 -.2 -.2 .2Fuels ............................................................................................. 3.928 110.4 110.2 -1.8 -.2 -.2 -.3 .1
Fuel oil and other fuels .............................................................. .201 87.1 86.8 -8.7 -.3 -2.1 .0 -1.4Fuel oil ...................................................................................... .123 80.5 80.1 -12.6 -.5 -2.2 -.1 -1.5Other household fuels 5 ........................................................... .078 125.8 125.6 -2.0 -.2 -.7 -1.0 -.2
Gas (piped) and electricity 3 ...................................................... 3.727 117.7 117.5 -1.4 -.2 -.2 -.3 .2Electricity 3 ................................................................................ 2.672 122.0 122.4 -1.4 .3 .0 -.2 .6Utility natural gas service 3 ..................................................... 1.056 112.7 111.1 -1.5 -1.4 -.5 -.5 -.9
Water and sewer and trash collection services 2 ................... .922 103.1 103.2 2.5 .1 .3 .2 .1Water and sewerage maintenance 3 ...................................... .684 217.0 217.3 2.5 .1 .3 .2 .0Garbage and trash collection 1 6 ............................................ .238 261.0 261.4 2.6 .2 .3 .3 .2
Household furnishings and operations ........................................ 4.339 125.0 124.8 .1 -.2 .1 -.1 -.3Window and floor coverings and other linens 1 2 ...................... .315 102.3 101.8 .4 -.5 -.4 1.3 -.5
Floor coverings 1 2 ...................................................................... .075 101.8 101.9 2.0 .1 .0 -.7 .1Window coverings 1 2 ................................................................ .085 103.8 102.8 1.9 -1.0 -.4 3.6 -1.0Other linens 1 2 ........................................................................... .154 101.7 101.2 -1.3 -.5 -.5 1.0 -.5
Furniture and bedding 1 ............................................................... 1.166 131.9 131.7 .8 -.2 .7 -.3 -.2Bedroom furniture 1 .................................................................... .349 140.6 139.4 .2 -.9 1.4 -.4 -.9Living room, kitchen, and dining room furniture 1 2 ................ .614 101.0 101.1 .0 .1 .2 -.2 .1Other furniture 1 2 ....................................................................... .185 104.2 104.3 4.7 .1 1.0 -.3 .1
See footnotes at end of table.
32Digitized for FRASER http://fraser.stlouisfed.org/ Federal Reserve Bank of St. Louis
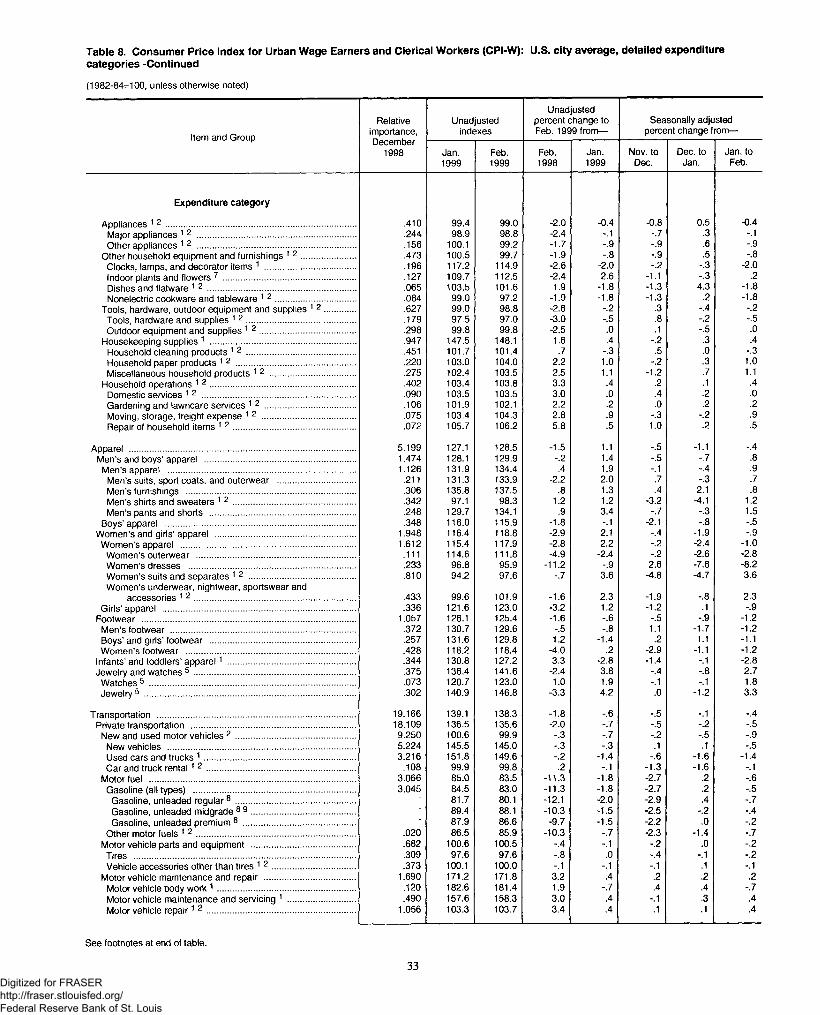
Table 8. Consumer Price Index for Urban Wage Earners and Clerical Workers (CPI-W): U.S. city average, detailed expenditurecategories -Continued
(1982-84=100, unless otherwise noted)
Item and Group
Relativeimportance,December
1998
Unadjustedindexes
Unadjusted percent change to Feb. 1999 from—
Seasonally adjusted percent change from—
Jan.1999
Feb.1999
Feb.1998
Jan.1999
Nov. to Dec.
Dec. to Jan.
Jan. to Feb.
Expenditure category
Appliances 1 2 ............................................................................... .410 99.4 99.0 -2.0 -0.4 -0.8 0.5 -0.4Major appliances 1 2 .................................................................. .244 98.9 98.8 -2.4 -.1 -.7 .3 -.1Other appliances 1 2 .................................................................. .156 100.1 99.2 -1.7 -.9 -.9 .6 -.9
Other household equipment and furnishings 1 2 ....................... .473 100.5 99.7 -1.9 -.8 -.9 .5 -.8Clocks, lamps, and decorator items 1 ...................................... .196 117.2 114.9 -2.6 -2.0 -.2 -.3 -2.0Indoor plants and flowers 7 ....................................................... .127 109.7 112.5 -2.4 2.6 -1.1 -.3 .2Dishes and flatware 1 2 .............................................................. .065 103.5 101.6 1.9 -1.8 -1.3 4.3 -1.8Nonelectric cookware and tableware 1 2 ................................. .084 99.0 97.2 -1.9 -1.8 -1.3 .2 -1.8
Tools, hardware, outdoor equipment and supplies 1 2 ............. .627 99.0 98.8 -2.6 -.2 .3 -.4 -.2Tools, hardware and supplies 1 2 ............................................. .179 97.5 97.0 -3.0 -.5 .8 -.2 -.5Outdoor equipment and supplies 1 2 ........................................ .298 99.8 99.8 -2.5 .0 .1 -.5 .0
Housekeeping supplies 1 ............................................................. .947 147.5 148.1 1.6 .4 -.2 .3 .4Household cleaning products 1 2 ............................................. .451 101.7 101.4 .7 -.3 .5 .0 -.3Household paper products 1 2 .................................................. .220 103.0 104.0 2.2 1.0 -.2 .3 1.0Miscellaneous household products 1 2 .................................... .275 102.4 103.5 2.5 1.1 -1.2 .7 1.1
Household operations 1 2 ............................................................. .402 103.4 103.8 3.3 .4 .2 .1 .4Domestic services 12 ................................................................ .090 103.5 103.5 3.0 .0 .4 .2 .0Gardening and lawncare services 1 2 ...................................... .106 101.9 102.1 2.2 .2 .0 .2 .2Moving, storage, freight expense 1 2 ....................................... .075 103.4 104.3 2.8 .9 -.3 -.2 .9Repair of household items 1 2 ................................................... .072 105.7 106.2 5.8 .5 1.0 .2 .5
Apparel .............................................................................................. 5.199 127.1 128.5 -1.5 1.1 -.5 -1.1 -.4Men’s and boys’ apparel ............................................................... 1.474 128.1 129.9 -.2 1.4 -.5 -.7 .8
Men’s apparel .............................................................................. 1.126 131.9 134.4 .4 1.9 -.1 -.4 .9Men’s suits, sport coats, and outerwear ................................ .211 131.3 133.9 -2.2 2.0 .7 -.3 .7Men’s furnishings ....................................................................... .306 135.8 137.5 .8 1.3 .4 2.1 .8Men’s shirts and sweaters 1 2 ................................................... .342 97.1 98.3 1.2 1.2 -3.2 -4.1 1.2Men’s pants and shorts ............................................................. .248 129.7 134.1 .9 3.4 -.7 -.3 1.5
Boys’ apparel ............................................................................... .348 116.0 115.9 -1.8 -.1 -2.1 -.8 -.5Women’s and girls’ apparel ........................................................... 1.948 116.4 118.8 -2.9 2.1 -.4 -1.9 -.9
Women’s apparel ......................................................................... 1.612 115.4 117.9 -2.8 2.2 -.2 -2.4 -1.0Women’s outerwear .................................................................. .111 114.6 111.8 -4.9 -2.4 -.2 -2.6 -2.8Women’s dresses ...................................................................... .233 96.8 95.9 -11.2 -.9 2.6 -7.6 -8.2Women’s suits and separates 1 2 ............................................ .810 94.2 97.6 -.7 3.6 -4.8 -4.7 3.6Women’s underwear, nightwear, sportswear and
accessories 1 2 ................................................................... .433 99.6 101.9 -1.6 2.3 -1.9 -.8 2.3Girls’ apparel ................................................................................ .336 121.6 123.0 -3.2 1.2 -1.2 .1 -.9
Footwear ......................................................................................... 1.057 126.1 125.4 -1.6 -.6 -.5 -.9 -1.2Men’s footwear ............................................................................. .372 130.7 129.6 -.5 -.8 1.1 -1.7 -1.2Boys’ and girls’ footwear ............................................................ .257 131.6 129.8 1.2 -1.4 .2 1.1 -1.1Women’s footwear ....................................................................... .428 118.2 118.4 -4.0 .2 -2.9 -1.1 -1.2
Infants’ and toddlers’ appare l1 ..................................................... .344 130.8 127.2 3.3 -2.8 -1.4 -.1 -2.8Jewelry and watches 5 ................................................................... .375 136.4 141.6 -2.4 3.8 -.4 -.8 2.7
Watches5 ...................................................................................... .073 120.7 123.0 1.0 1.9 -.1 -.1 1.8Jewelry5 ........................................................................................ .302 140.9 146.8 -3.3 4.2 .0 -1.2 3.3
Transportation .................................................................................. 19.166 139.1 138.3 -1.8 -.6 -.5 -.1 -.4Private transportation .................................................................... 18.109 136.5 135.6 -2.0 -.7 -.5 -.2 -.5
New and used motor vehicles 2 .................................................. 9.250 100.6 99.9 -.3 -.7 -.2 -.5 -.9New vehicles .............................................................................. 5.224 145.5 145.0 -.3 -.3 .1 .1 -.5Used cars and trucks 1 ............................................................... 3.216 151.8 149.6 -.2 -1.4 -.6 -1.6 -1.4Car and truck renta l1 2 .............................................................. .108 99.9 99.8 .2 -.1 -1.3 -1.6 -.1
Motor fuel ...................................................................................... 3.066 85.0 83.5 -11.3 -1.8 -2.7 .2 -.6Gasoline (all types) ................................................................... 3.045 84.5 83.0 -11.3 -1.8 -2.7 .2 -.5
Gasoline, unleaded regular8 .................................................. ■ 81.7 80.1 -12.1 -2.0 -2.9 .4 -.7Gasoline, unleaded midgrade 8 9 ........................................... ■ 89.4 88.1 -10.3 -1.5 -2.5 -.2 -.4Gasoline, unleaded premium 8 ............................................... ■ 87.9 86.6 -9.7 -1.5 -2.2 .0 -.2
Other motor fuels 1 2 .................................................................. .020 86.5 85.9 -10.3 -.7 -2.3 -1.4 -.7Motor vehicle parts and equipment ........................................... .682 100.6 100.5 -.4 -.1 -.2 .0 -.2
Tires ............................................................................................ .309 97.6 97.6 -.8 .0 -.4 -.1 -.2Vehicle accessories other than tires 1 2 ................................... .373 100.1 100.0 -.1 -.1 -.1 .1 -.1
Motor vehicle maintenance and repair ...................................... 1.690 171.2 171.8 3.2 .4 .2 .2 .2Motor vehicle body work 1 ......................................................... .120 182.6 181.4 1.9 -.7 .4 .4 -.7Motor vehicle maintenance and servicing 1 ............................ .490 157.6 158.3 3.0 .4 -.1 .3 .4Motor vehicle repa ir1 2 .............................................................. 1.056 103.3 103.7 3.4 .4 .1 .1 .4
See footnotes at end of table.
33Digitized for FRASER http://fraser.stlouisfed.org/ Federal Reserve Bank of St. Louis
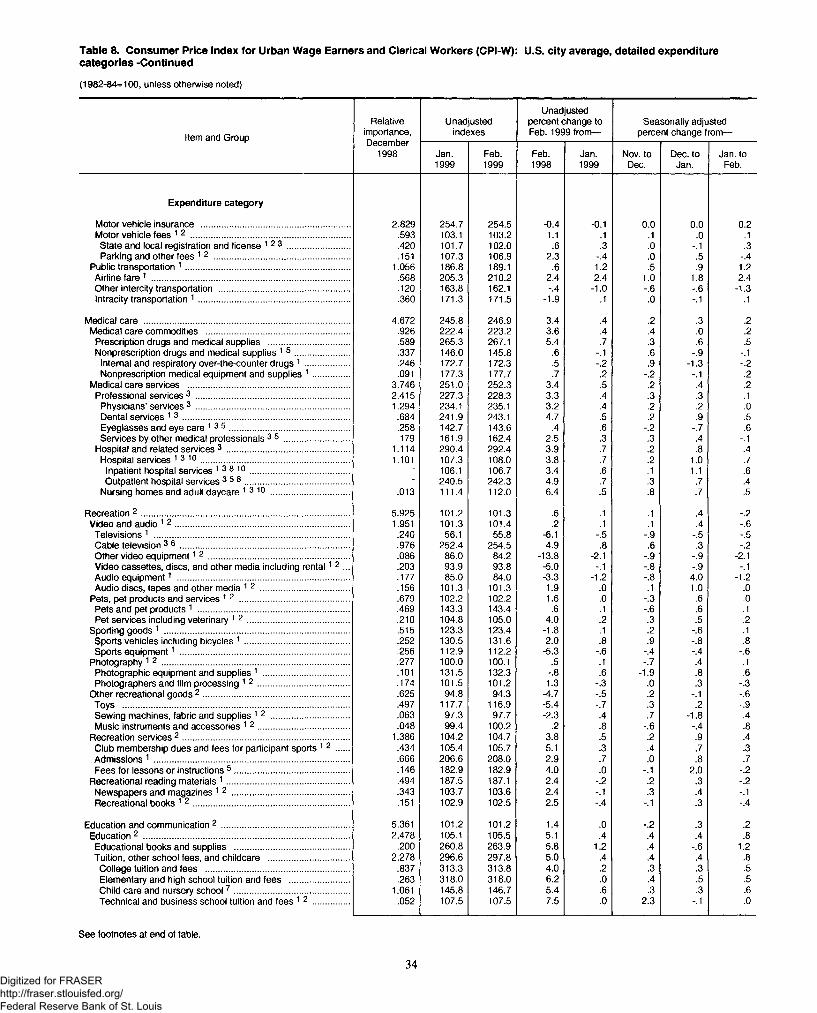
Table 8. Consumer Price Index for Urban Wage Earners and Clerical Workers (CPI-W): U.S. city average, detailed expenditurecategories -Continued
(1982-84=100, unless otherwise noted)
Item and Group
Relativeimportance,December
1998
Unadjustedindexes
Unadjusted percent change to Feb. 1999 from—
Seasonally adjusted percent change from—
Jan.1999
Feb.1999
Feb.1998
Jan.1999
Nov. to Dec.
Dec. to Jan.
Jan. to Feb.
Expenditure category
Motor vehicle insurance .............................................................. 2.829 254.7 254.5 -0.4 -0.1 0.0 0.0 0.2Motor vehicle fees 1 2 .................................................................. .593 103.1 103.2 1.1 .1 .1 .0 .1
State and local registration and license 1 2 3 .......................... .420 101.7 102.0 .6 .3 .0 -.1 .3Parking and other fees 12 ......................................................... .151 107.3 106.9 2.3 -.4 .0 .5 -.4
Public transportation 1 .................................................................... 1.056 186.8 189.1 .6 1.2 .5 .9 1.2Airline fare 1 ................................................................................... .568 205.3 210.2 2.4 2.4 1.0 1.8 2.4Other intercity transportation ...................................................... .120 163.8 162.1 -.4 -1.0 -.6 -.6 -1.3Intracity transportation 1 ............................................................... .360 171.3 171.5 -1.9 .1 .0 -.1 .1
Medical care ...................................................................................... 4.672 245.8 246.9 3.4 .4 .2 .3 .2Medical care commodities ............................................................ .926 222.4 223.2 3.6 .4 .4 .0 .2
Prescription drugs and medical supplies .................................. .589 265.3 267.1 5.4 .7 .3 .6 .5Nonprescription drugs and medical supplies 1 5 ....................... .337 146.0 145.8 .6 -.1 .6 -.9 -.1
Internal and respiratory over-the-counter drugs 1 .................. .246 172.7 172.3 .5 -.2 .9 -1.3 -.2Nonprescription medical equipment and supplies 1 ............... .091 177.3 177.7 .7 .2 -.2 -.1 .2
Medical care services ................................................................... 3.746 251.0 252.3 3.4 .5 .2 .4 .2Professional services 3 ................................................................ 2.415 227.3 228.3 3.3 .4 .3 .3 .1
Physicians’ services 3 ................................................................ 1.294 234.1 235.1 3.2 .4 .2 .2 .0Dental services 1 3 ..................................................................... .684 241.9 243.1 4.7 .5 .2 .9 .5Eyeglasses and eye care 1 3 5 .................................................. .258 142.7 143.6 .4 .6 -.2 -.7 .6Services by other medical professionals 3 5 ........................... .179 161.9 162.4 2.5 .3 .3 .4 -.1
Hospital and related services 3 ................................................... 1.114 290.4 292.4 3.9 .7 .2 .8 .4Hospital services 1 3 1 0 .............................................................. 1.101 107.3 108.0 3.8 .7 .2 1.0 .7
Inpatient hospital sen/ices 1 3 8 1 0 ......................................... - 106.1 106.7 3.4 .6 .1 1.1 .6Outpatient hospital services 3 5 8 ............................................ 240.5 242.3 4.9 .7 .3 .7 .4
Nursing homes and adult daycare 1 3 10 ................................. .013 111.4 112.0 6.4 .5 .8 .7 .5
Recreation 2 ....................................................................................... 5.925 101.2 101.3 .6 .1 .1 .4 -.2Video and audio 1 2 ......................................................................... 1.951 101.3 101.4 .2 .1 .1 .4 -.6
Televisions 1 ................................................................................. .240 56.1 55.8 -6.1 -.5 -.9 -.5 -.5Cable television 3 6 ...................................................................... .976 252.4 254.5 4.9 .8 .6 .3 -.2Other video equipment1 2 ........................................................... .086 86.0 84.2 -13.8 -2.1 -.9 -.9 -2.1Video cassettes, discs, and other media including renta l1 2 ... .203 93.9 93.8 -5.0 -.1 -.8 -.9 -.1Audio equipment1 ........................................................................ .177 85.0 84.0 -3.3 -1.2 -.8 4.0 -1.2Audio discs, tapes and other media 12 ..................................... .156 101.3 101.3 1.9 .0 .1 1.0 .0
Pets, pet products and services 1 2 .............................................. .679 102.2 102.2 1.6 .0 -.3 .6 .0Pets and pet products 1 ............................................................... .469 143.3 143.4 .6 .1 -.6 .6 .1Pet services including veterinary 1 2 .......................................... .210 104.8 105.0 4.0 .2 .3 .5 .2
Sporting goods 1 ............................................................................. .515 123.3 123.4 -1.8 .1 .2 -.6 .1Sports vehicles including bicycles 1 ........................................... .252 130.5 131.6 2.0 .8 .9 -.8 .8Sports equipment1 ....................................................................... .256 112.9 112.2 -5.3 -.6 -.4 -.4 -.6
Photography 1 2 .............................................................................. .277 100.0 100.1 .5 .1 -.7 .4 .1Photographic equipment and supplies 1 .................................... .101 131.5 132.3 -.8 .6 -1.9 .8 .6Photographers and film processing 1 2 ...................................... .174 101.5 101.2 1.3 -.3 .0 .3 -.3
Other recreational goods 2 ............................................................. .625 94.8 94.3 -4.7 -.5 .2 -.1 -.6Toys .............................................................................................. .497 117.7 116.9 -5.4 -.7 .3 .2 -.9Sewing machines, fabric and supplies 1 2 ................................. .063 97.3 97.7 -2.3 .4 .7 -1.8 .4Music instruments and accessories 1 2 ...................................... .048 99.4 100.2 .2 .8 -.6 -.4 .8
Recreation services 2 ..................................................................... 1.386 104.2 104.7 3.8 .5 .2 .9 .4Club membership dues and fees for participant sports 1 2 ..... .434 105.4 105.7 5.1 .3 .4 .7 .3Admissions 1 ................................................................................. .666 206.6 208.0 2.9 .7 .0 .8 .7Fees for lessons or instructions 5 ................................................ .146 182.9 182.9 4.0 .0 -.1 2.0 -.2
Recreational reading materials 1 ................................................... .494 187.5 187.1 2.4 -.2 .2 .3 -.2Newspapers and magazines 1 2 ................................................. .343 103.7 103.6 2.4 -.1 .3 .4 -.1Recreational books 1 2 ................................................................. .151 102.9 102.5 2.5 -.4 -.1 .3 -.4
Education and communication 2 ..................................................... 5.361 101.2 101.2 1.4 .0 -.2 .3 .2Education2 ...................................................................................... 2.478 105.1 105.5 5.1 .4 .4 .4 .8
Educational books and supplies ................................................ .200 260.8 263.9 5.8 1.2 .4 -.6 1.2Tuition, other school fees, and childcare .................................. 2.278 296.6 297.8 5.0 .4 .4 .4 .8
College tuition and fees ............................................................ .837 313.3 313.8 4.0 .2 .3 .3 .5Elementary and high school tuition and fees ......................... .263 318.0 318.0 6.2 .0 .4 .5 .5Child care and nursery school 7 ................................................ 1.061 145.8 146.7 5.4 .6 .3 .3 .6Technical and business school tuition and fees 1 2 ............... .052 107.5 107.5 7.5 .0 2.3 -.1 .0
See footnotes at end of table.
34Digitized for FRASER http://fraser.stlouisfed.org/ Federal Reserve Bank of St. Louis
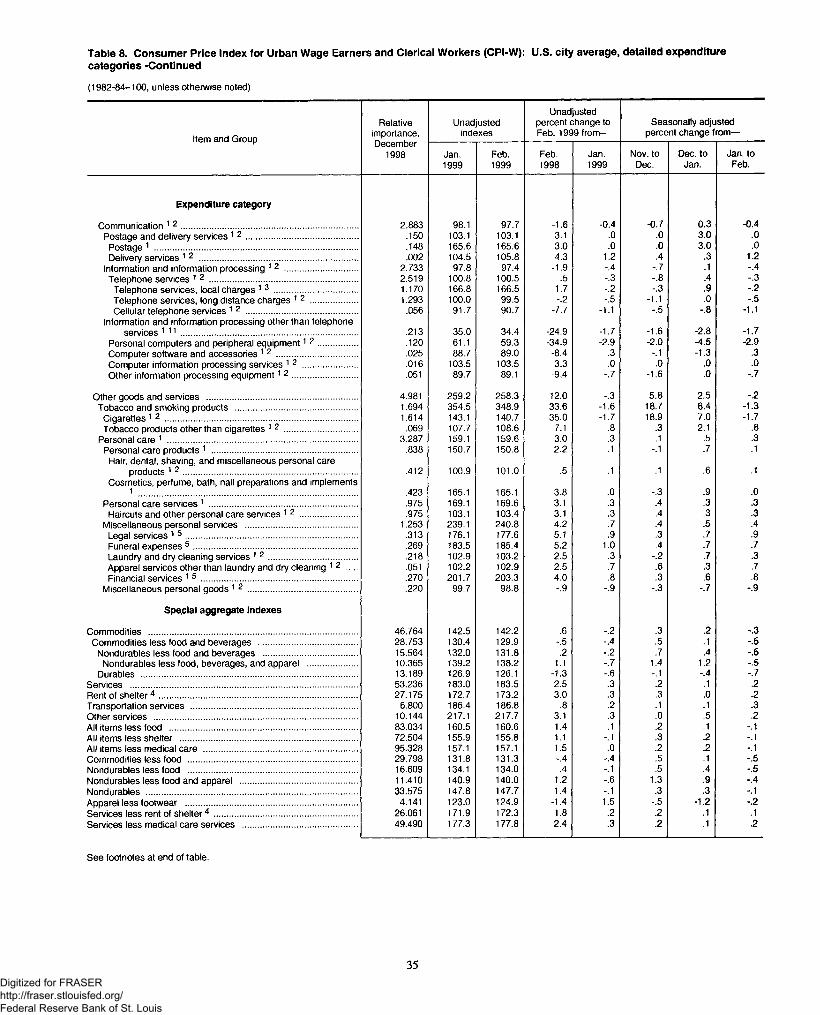
Table 8. Consumer Price Index for Urban Wage Earners and Clerical Workers (CPI-W): U.S. city average, detailed expenditurecategories -Continued
(1982-84=100, unless otherwise noted)
Item and Group
Relativeimportance,
Unadjustedindexes
Unadjusted percent change to Feb. 1999 from—
Seasonally adjusted percent change from—
December1998 Jan.
1999Feb.1999
Feb.1998
Jan.1999
Nov. to Dec.
Dec. to Jan.
Jan. to Feb.
Expenditure category
Communication 1 2 .......................................................................... 2.883 98.1 97.7 -1.6 -0.4 -0.7 0.3 -0.4Postage and delivery services 1 2 ............................................... .150 103.1 103.1 3.1 .0 .0 3.0 .0
Postage 1 ..................................................................................... .148 165.6 165.6 3.0 .0 .0 3.0 .0Delivery services 1 2 .................................................................. .002 104.5 105.8 4.3 1.2 .4 .3 1.2
Information and information processing 1 2 ............................... 2.733 97.8 97.4 -1.9 -.4 -.7 .1 -.4Telephone services 1 2 .............................................................. 2.519 100.8 100.5 .5 -.3 -.8 .4 -.3
Telephone services, local charges 1 3 ................................... 1.170 166.8 166.5 1.7 -.2 -.3 .9 -.2Telephone services long distance charges 12 .................... 1.293 100.0 99.5 -.2 -.5 -1.1 .0 -.5Cellular telephone services 1 2 ............................................... .056 91.7 90.7 -7.7 -1.1 -.5 -.8 -1.1
Information and information processing other than telephone services 1 11.......................................................................... .213 35.0 34.4 -24.9 -1.7 -1.6 -2.8 -1.7
Personal computers and peripheral equipment1 2 ................ .120 61.1 59.3 -34.9 -2.9 -2.0 -4.5 -2.9Computer software and accessories 1 2 .................................. .025 88.7 89.0 -8.4 .3 -.1 -1.3 .3Computer information processing services 1 2 ....................... .016 103.5 103.5 3.3 .0 .0 .0 .0Other information processing equipment1 2 ........................... .051 89.7 89.1 -9.4 -.7 -1.6 .0 -.7
Other goods and services ............................................................... 4.981 259.2 258.3 12.0 -.3 5.8 2.5 -.2Tobacco and smoking products ................................................... 1.694 354.5 348.9 33.6 -1.6 18.7 6.4 -1.3
Cigarettes 1 2 ................................................................................ 1.614 143.1 140.7 35.0 -1.7 18.9 7.0 -1.7Tobacco products other than cigarettes 1 2 ............................... .069 107.7 108.6 7.1 .8 .3 2.1 .8
Personal care 1 ............................................................................... 3.287 159.1 159.6 3.0 .3 .1 .5 .3Personal care products 1 ............................................................. .838 150.7 150.8 2.2 .1 -.1 .7 .1
Hair, dental, shaving, and miscellaneous personal careproducts 1 2 ......................................................................... .412 100.9 101.0 .5 .1 .1 .6 .1
Cosmetics, perfume, bath, nail preparations and implements.423 165.1 165.1 3.8 .0 -.3 .9 .0
Personal care services 1 .............................................................. .975 169.1 169.6 3.1 .3 .4 .3 .3Haircuts and other personal care services 1 2 ........................ .975 103.1 103.4 3.1 .3 .4 .3 .3
Miscellaneous personal services ............................................... 1.253 239.1 240.8 4.2 .7 .4 .5 .4Legal services 1 5 ........................................................................ .313 176.1 177.6 5.1 .9 .3 .7 .9Funeral expenses 5 .................................................................... .269 183.5 185.4 5.2 1.0 .4 .7 .7Laundry and dry cleaning services 1 2 ..................................... .218 102.9 103.2 2.5 .3 -.2 .7 .3Apparel services other than laundry and dry cleaning 1 2 .....Financial services 1 5 .................................................................
.051
.270102.2201.7
102.9203.3
2.54.0
.7
.8.6.3
.3
.6.7.8
Miscellaneous personal goods 1 2 .............................................. .220 99.7 98.8 -.9 -.9 -.3 -.7 -.9
Special aggregate indexes
Commodities ....................................................................................... 46.764 142.5 142.2 .6 -.2 .3 .2 -.3Commodities less food and beverages ......................................... 28.753 130.4 129.9 -.5 -.4 .5 .1 -.5
Nondurables less food and beverages ....................................... 15.564 132.0 131.8 .2 -.2 .7 .4 -.5Nondurables less food, beverages, and apparel ..................... 10.365 139.2 138.2 1.1 -.7 1.4 1.2 -.5
Durables .......................................................................................... 13.189 126.9 126.1 -1.3 -.6 -.1 -.4 -.7Services ............................................................................................... 53.236 183.0 183.5 2.5 .3 .2 .1 .2Rent of shelter4 ................................................................................... 27.175 172.7 173.2 3.0 .3 .3 .0 .2Transportation services ...................................................................... 6.800 186.4 186.8 .8 .2 .1 .1 .3Other services ..................................................................................... 10.144 217.1 217.7 3.1 .3 .0 .5 .2All items less food .............................................................................. 83.034 160.5 160.6 1.4 .1 .2 .1 -.1All items less shelter .......................................................................... 72.504 155.9 155.8 1.1 -.1 .3 .2 -.1All items less medical care ................................................................ 95.328 157.1 157.1 1.5 .0 .2 .2 -.1Commodities less food ....................................................................... 29.798 131.8 131.3 -.4 -.4 .5 .1 -.5Nondurables less food ....................................................................... 16.609 134.1 134.0 .4 -.1 .5 .4 -.5Nondurables less food and apparel ................................................. 11.410 140.9 140.0 1.2 -.6 1.3 .9 -.4Nondurables ........................................................................................ 33.575 147.8 147.7 1.4 -.1 .3 .3 -.1Apparel less footwear ........................................................................ 4.141 123.0 124.9 -1.4 1.5 -.5 -1.2 -.2Services less rent of she lter4 ............................................................ 26.061 171.9 172.3 1.8 .2 .2 .1 .1Services less medical care services ................................................ 49.490 177.3 177.8 2.4 .3 .2 .1 .2
See footnotes at end of table.
35Digitized for FRASER http://fraser.stlouisfed.org/ Federal Reserve Bank of St. Louis
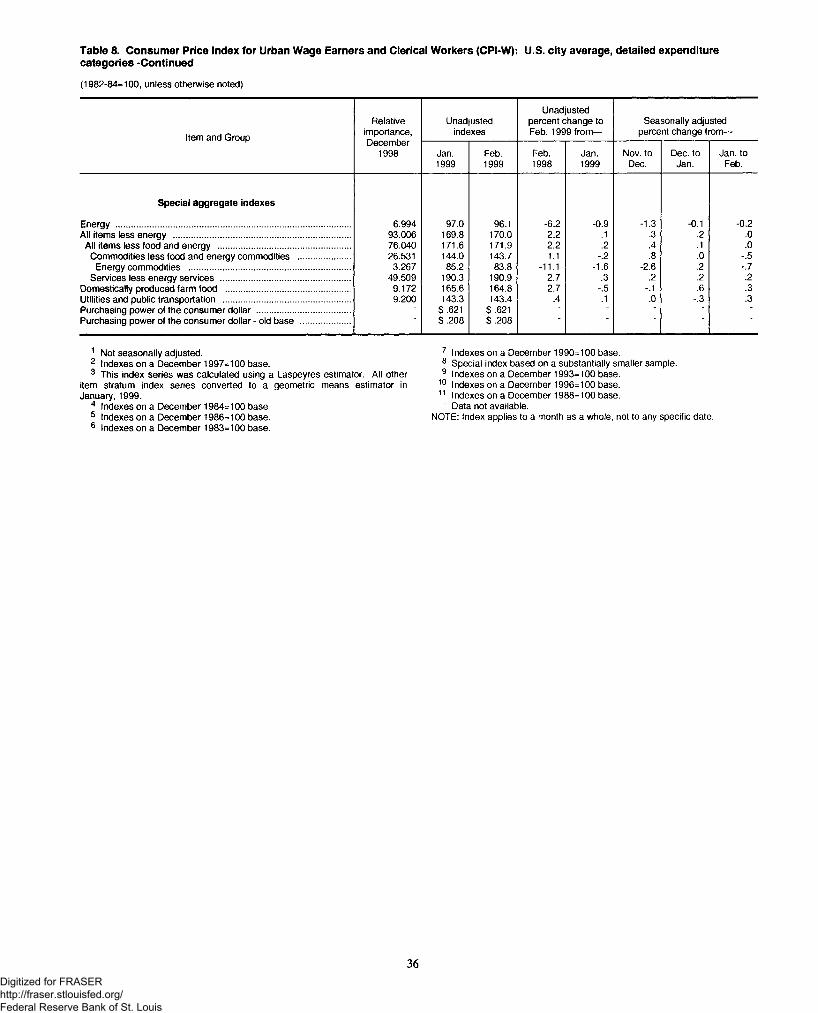
Table 8. Consumer Price Index for Urban Wage Earners and Clerical Workers (CPI-W): U.S. city average, detailed expenditurecategories -Continued
(1982-84=100, unless otherwise noted)
Item and Group
Relativeimportance,December
1998
Unadjustedindexes
Unadjusted percent change to Feb. 1999 from—
Seasonally adjusted percent change from—
Jan.1999
Feb.1999
Feb.1998
Jan.1999
Nov. to Dec.
Dec. to Jan.
Jan. to Feb.
Special aggregate indexes
Energy .................................................................................................. 6.994 97.0 96.1 -6.2 -0.9 -1.3 -0.1 -0.2All items less energy .......................................................................... 93.006 169.8 170.0 2.2 .1 .3 .2 .0
All items less food and energy ....................................................... 76.040 171.6 171.9 2.2 .2 .4 .1 .0Commodities less food and energy commodities ...................... 26.531 144.0 143.7 1.1 -.2 .8 .0 -.5
Energy commodities ................................................................... 3.267 85.2 83.8 -11.1 -1.6 -2.6 .2 -.7Services less energy services ...................................................... 49.509 190.3 190.9 2.7 .3 .2 .2 .2
Domestically produced farm food .................................................... 9.172 165.6 164.8 2.7 -.5 -.1 .6 .3Utilities and public transportation ..................................................... 9.200 143.3 143.4 .4 .1 .0 -.3 .3Purchasing power of the consumer dollar ....................................... ■ $.621 $.621 ■ ■ ■ ■ ■Purchasing power of the consumer dollar - old base ..................... $.208 $.208
1 Not seasonally adjusted.2 Indexes on a December 1997=100 base.3 This index series was calculated using a Laspeyres estimator. All other
item stratum index series converted to a geometric means estimator in January, 1999.
4 Indexes on a December 1984=100 base5 Indexes on a December 1986=100 base.6 Indexes on a December 1983=100 base.
7 Indexes on a December 1990=100 base.8 Special index based on a substantially smaller sample.9 Indexes on a December 1993=100 base.
10 Indexes on a December 1996=100 base.11 Indexes on a December 1988=100 base.
" Data not available.NOTE: Index applies to a month as a whole, not to any specific date.
36Digitized for FRASER http://fraser.stlouisfed.org/ Federal Reserve Bank of St. Louis
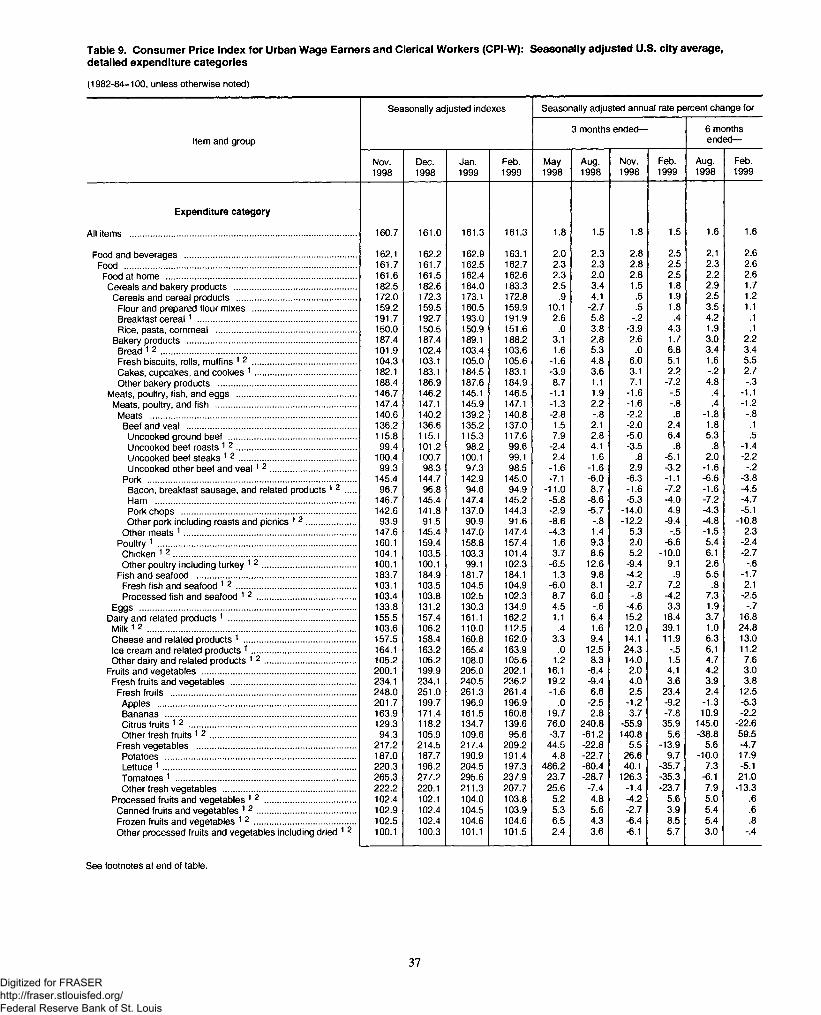
Table 9. Consumer Price Index for Urban Wage Earners and Clerical Workers (CPI-W): Seasonally adjusted U.S. city average,detailed expenditure categories
(1982-84=100, unless otherwise noted)
Seasonally adjusted indexes Seasonally adjusted annual rate percent change for
Item and group3 months ended— 6 months
ended—
Nov.1998
Dec.1998
Jan.1999
Feb.1999
May1998
Aug.1998
Nov.1998
Feb.1999
Aug.1998
Feb.1999
Expenditure category
All items .............................................................................................. 160.7 161.0 161.3 161.3 1.8 1.5 1.8 1.5 1.6 1.6
Food and beverages ........................................................................ 162.1 162.2 162.9 163.1 2.0 2.3 2.8 2.5 2.1 2.6Food ................................................................................................. 161.7 161.7 162.5 162.7 2.3 2.3 2.8 2.5 2.3 2.6
Food at home ............................................................................... 161.6 161.5 162.4 162.6 2.3 2.0 2.8 2.5 2.2 2.6Cereals and bakery products ................................................... 182.5 182.6 184.0 183.3 2.5 3.4 1.5 1.8 2.9 1.7
Cereals and cereal products .................................................. 172.0 172.3 173.1 172.8 .9 4.1 .5 1.9 2.5 1.2Flour and prepared flour mixes ........................................... 159.2 159.5 160.5 159.9 10.1 -2.7 .5 1.8 3.5 1.1Breakfast ce rea l1 .................................................................. 191.7 192.7 193.0 191.9 2.6 5.8 -.2 .4 4.2 .1Rice, pasta, cornmeal .......................................................... 150.0 150.5 150.9 151.6 .0 3.8 -3.9 4.3 1.9 .1
Bakery products ...................................................................... 187.4 187.4 189.1 188.2 3.1 2.8 2.6 1.7 3.0 2.2Bread 1 2 ................................................................................. 101.9 102.4 103.4 103.6 1.6 5.3 .0 6.8 3.4 3.4Fresh biscuits, rolls, muffins 1 2 ........................................... 104.3 103.1 105.0 105.6 -1.6 4.8 6.0 5.1 1.6 5.5Cakes, cupcakes, and cookies 1 .......................................... 182.1 183.1 184.5 183.1 -3.9 3.6 3.1 2.2 -.2 2.7Other bakery products ......................................................... 188.4 186.9 187.6 184.9 8.7 1.1 7.1 -7.2 4.8 -.3
Meats, poultry, fish, and eggs .................................................. 146.7 146.2 145.1 146.5 -1.1 1.9 -1.6 -.5 .4 -1.1Meats, poultry, and fish .......................................................... 147.4 147.1 145.9 147.1 -1.3 2.2 -1.6 -.8 .4 -1.2
Meats ...................................................................................... 140.6 140.2 139.2 140.8 -2.8 -.8 -2.2 .6 -1.8 -.8Beef and veal ....................................................................... 136.2 136.6 135.2 137.0 1.5 2.1 -2.0 2.4 1.8 .1
Uncooked ground beef ..................................................... 115.8 115.1 115.3 117.6 7.9 2.8 -5.0 6.4 5.3 .5Uncooked beef roasts 1 2 .................................................. 99.4 101.2 98.2 99.6 -2.4 4.1 -3.5 .8 .8 -1.4Uncooked beef steaks 1 2 ................................................. 100.4 100.7 100.1 99.1 2.4 1.6 .8 -5.1 2.0 -2.2Uncooked other beef and v e a l1 2 .................................... 99.3 98.3 97.3 98.5 -1.6 -1.6 2.9 -3.2 -1.6 -.2
Pork ....................................................................................... 145.4 144.7 142.9 145.0 -7.1 -6.0 -6.3 -1.1 -6.6 -3.8Bacon, breakfast sausage, and related products 1 2 .... 96.7 96.8 94.6 94.9 -11.0 8.7 -1.6 -7.2 -1.6 -4.5Ham ................................................................................... 146.7 145.4 147.4 145.2 -5.8 -8.6 -5.3 -4.0 -7.2 -4.7Pork chops ......................................................................... 142.6 141.8 137.0 144.3 -2.9 -5.7 -14.0 4.9 -4.3 -5.1Other pork including roasts and picnics 1 2 ..................... 93.9 91.5 90.9 91.6 -8.6 -.8 -12.2 -9.4 -4.8 -10.8
Other meats 1 ........................................................................ 147.6 145.4 147.0 147.4 -4.3 1.4 5.3 -.5 -1.5 2.3Poultry 1 .................................................................................. 160.1 159.4 158.8 157.4 1.6 9.3 2.0 -6.6 5.4 -2.4Chicken 1 2 ............................................................................ 104.1 103.5 103.3 101.4 3.7 8.6 5.2 -10.0 6.1 -2.7Other poultry including turkey 1 2 ....................................... 100.1 100.1 99.1 102.3 -6.5 12.6 -9.4 9.1 2.6 -.6
Fish and seafood .................................................................. 183.7 184.9 181.7 184.1 1.3 9.8 -4.2 .9 5.5 -1.7Fresh fish and seafood 1 2 .................................................. 103.1 103.5 104.5 104.9 -6.0 8.1 -2.7 7.2 .8 2.1Processed fish and seafood 1 2 ......................................... 103.4 103.8 102.5 102.3 8.7 6.0 -.8 -4.2 7.3 -2.5
Eggs .......................................................................................... 133.8 131.2 130.3 134.9 4.5 -.6 -4.6 3.3 1.9 -.7Dairy and related products 1 ..................................................... 155.5 157.4 161.1 162.2 1.1 6.4 15.2 18.4 3.7 16.8
Milk 1 2 ....................................................................................... 103.6 106.2 110.0 112.5 .4 1.6 12.0 39.1 1.0 24.8Cheese and related products 1 .............................................. 157.5 158.4 160.8 162.0 3.3 9.4 14.1 11.9 6.3 13.0Ice cream and related products 1 ........................................... 164.1 163.2 165.4 163.9 .0 12.5 24.3 -.5 6.1 11.2Other dairy and related products 1 2 ...................................... 105.2 106.2 108.0 105.6 1.2 8.3 14.0 1.5 4.7 7.6
Fruits and vegetables ................................................................ 200.1 199.9 205.0 202.1 16.1 -6.4 2.0 4.1 4.2 3.0Fresh fruits and vegetables .................................................... 234.1 234.1 240.5 236.2 19.2 -9.4 4.0 3.6 3.9 3.8
Fresh fruits ............................................................................. 248.0 251.0 261.3 261.4 -1.6 6.6 2.5 23.4 2.4 12.5Apples ................................................................................... 201.7 199.7 196.9 196.9 .0 -2.5 -1.2 -9.2 -1.3 -5.3Bananas ............................................................................... 163.9 171.4 161.5 160.6 19.7 2.8 3.7 -7.8 10.9 -2.2Citrus fruits 1 2 ...................................................................... 129.3 118.2 134.7 139.6 76.0 240.8 -55.9 35.9 145.0 -22.6Other fresh fruits 1 2 ............................................................. 94.3 105.9 109.6 95.6 -3.7 -61.2 140.8 5.6 -38.8 59.5
Fresh vegetables .................................................................. 217.2 214.5 217.4 209.2 44.5 -22.8 5.5 -13.9 5.6 -4.7Potatoes ............................................................................... 187.0 187.7 190.9 191.4 4.8 -22.7 26.6 9.7 -10.0 17.9Lettuce 1 ................................................................................ 220.3 196.2 204.5 197.3 486.2 -80.4 40.1 -35.7 7.3 -5.1Tomatoes 1 ........................................................................... 265.3 277.2 295.6 237.9 23.7 -28.7 126.3 -35.3 -6.1 21.0Other fresh vegetables ....................................................... 222.2 220.1 211.3 207.7 25.6 -7.4 -1.4 -23.7 7.9 -13.3
Processed fruits and vegetables 1 2 ...................................... 102.4 102.1 104.0 103.8 5.2 4.8 -4.2 5.6 5.0 .6Canned fruits and vegetables 1 2 ......................................... 102.9 102.4 104.5 103.9 5.3 5.6 -2.7 3.9 5.4 .6Frozen fruits and vegetables 1 2 .......................................... 102.5 102.4 104.6 104.6 6.5 4.3 -6.4 8.5 5.4 .8Other processed fruits and vegetables including dried 1 2 100.1 100.3 101.1 101.5 2.4 3.6 -6.1 5.7 3.0 -.4
See footnotes at end of table.
37Digitized for FRASER http://fraser.stlouisfed.org/ Federal Reserve Bank of St. Louis
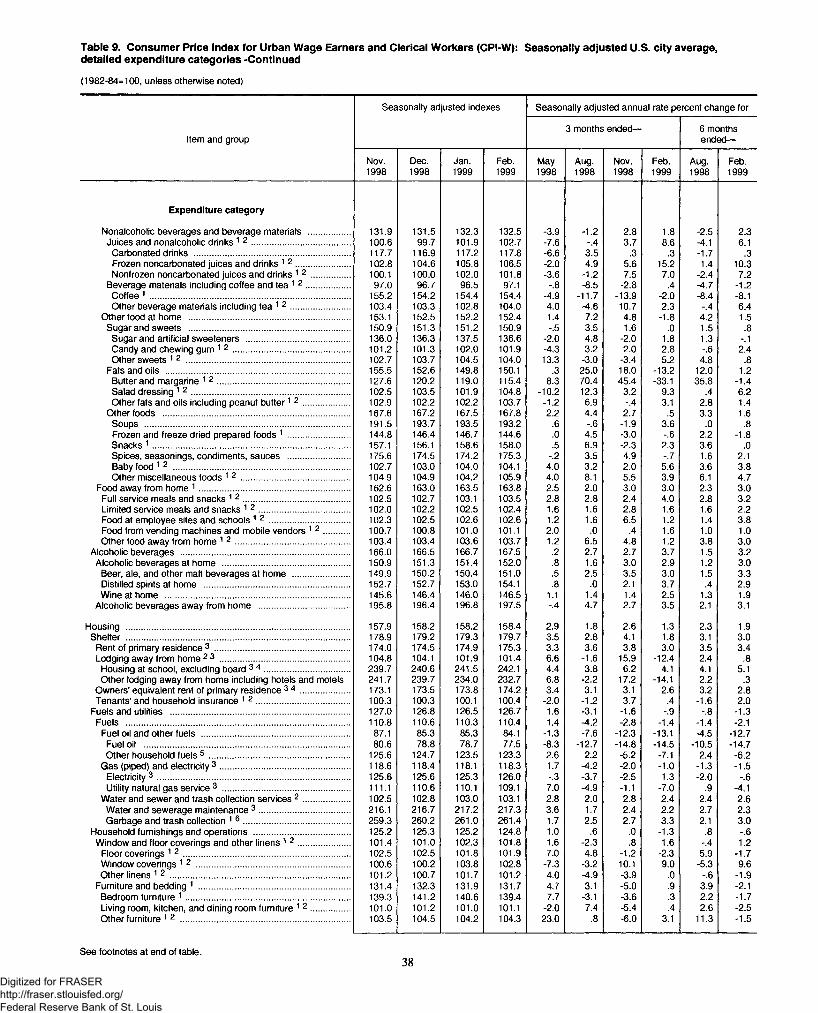
Table 9. Consumer Price Index for Urban Wage Earners and Clerical Workers (CPI-W): Seasonally adjusted U.S. city average,detailed expenditure categories -Continued
(1982-84=100, unless otherwise noted)
Seasonally adjusted indexes Seasonally adjusted annual rate percent change for
Item and group3 months ended— 6 months
ended—
Nov.1998
Dec.1998
Jan.1999
Feb.1999
May1998
Aug.1998
Nov.1998
Feb.1999
Aug.1998
Feb.1999
Expenditure category
Nonalcoholic beverages and beverage materials ................. 131.9 131.5 132.3 132.5 -3.9 -1.2 2.8 1.8 -2.5 2.3Juices and nonalcoholic drinks 1 2 ......................................... 100.6 99.7 101.9 102.7 -7.6 -.4 3.7 8.6 -4.1 6.1
Carbonated drinks ................................................................. 117.7 116.9 117.2 117.8 -6.6 3.5 .3 .3 -1.7 .3Frozen noncarbonated juices and drinks 1 2 ....................... 102.8 104.6 105.8 106.5 -2.0 4.9 5.6 15.2 1.4 10.3Nonfrozen noncarbonated juices and drinks 1 2 ................ 100.1 100.0 102.0 101.8 -3.6 -1.2 7.5 7.0 -2.4 7.2
Beverage materials including coffee and tea 1 2 .................. 97.0 96.7 96.5 97.1 -.8 -8.5 -2.8 .4 -4.7 -1.2Coffee 1 ................................................................................... 155.2 154.2 154.4 154.4 -4.9 -11.7 -13.9 -2.0 -8.4 -8.1Other beverage materials including tea 1 2 ......................... 103.4 103.3 102.8 104.0 4.0 -4.6 10.7 2.3 -.4 6.4
Other food at home ................................................................... 153.1 152.5 152.2 152.4 1.4 7.2 4.8 -1.8 4.2 1.5Sugar and sweets ................................................................... 150.9 151.3 151.2 150.9 -.5 3.5 1.6 .0 1.5 .8
Sugar and artificial sweeteners ........................................... 136.0 136.3 137.5 136.6 -2.0 4.8 -2.0 1.8 1.3 -.1Candy and chewing gum 1 2 ................................................. 101.2 101.3 102.0 101.9 -4.3 3.2 2.0 2.8 -.6 2.4Other sweets 1 2 .................................................................... 102.7 103.7 104.5 104.0 13.3 -3.0 -3.4 5.2 4.8 .8
Fats and oils ............................................................................. 155.5 152.6 149.8 150.1 .3 25.0 18.0 -13.2 12.0 1.2Butter and margarine 1 2 ....................................................... 127.6 120.2 119.0 115.4 8.3 70.4 45.4 -33.1 35.8 -1.4Salad dressing 1 2 .................................................................. 102.5 103.5 101.9 104.8 -10.2 12.3 3.2 9.3 .4 6.2Other fats and oils including peanut bu tter1 2 ................... 102.9 102.2 102.2 103.7 -1.2 6.9 -.4 3.1 2.8 1.4
Other foods .............................................................................. 167.6 167.2 167.5 167.8 2.2 4.4 2.7 .5 3.3 1.6Soups ...................................................................................... 191.5 193.7 193.5 193.2 .6 -.6 -1.9 3.6 .0 .8Frozen and freeze dried prepared foods 1 .......................... 144.8 146.4 146.7 144.6 .0 4.5 -3.0 -.6 2.2 -1.8Snacks 1 .................................................................................. 157.1 156.1 158.6 158.0 .5 6.9 -2.3 2.3 3.6 .0Spices, seasonings, condiments, sauces .......................... 175.6 174.5 174.2 175.3 -.2 3.5 4.9 -.7 1.6 2.1Baby food 12 .......................................................................... 102.7 103.0 104.0 104.1 4.0 3.2 2.0 5.6 3.6 3.8Other miscellaneous foods 1 2 ............................................. 104.9 104.9 104.2 105.9 4.0 8.1 5.5 3.9 6.1 4.7
Food away from home 1 ............................................................... 162.6 163.0 163.5 163.8 2.5 2.0 3.0 3.0 2.3 3.0Full service meals and snacks 1 2 ............................................ 102.5 102.7 103.1 103.5 2.8 2.8 2.4 4.0 2.8 3.2Limited service meals and snacks 1 2 ......................... ............ 102.0 102.2 102.5 102.4 1.6 1.6 2.8 1.6 1.6 2.2Food at employee sites and schools 12 ................................. 102.3 102.5 102.6 102.6 1.2 1.6 6.5 1.2 1.4 3.8Food from vending machines and mobile vendors 1 2 ........... 100.7 100.8 101.0 101.1 2.0 .0 .4 1.6 1.0 1.0Other food away from home 1 2 ................................................ 103.4 103.4 103.6 103.7 1.2 6.5 4.8 1.2 3.8 3.0
Alcoholic beverages ...................................................................... 166.0 166.5 166.7 167.5 .2 2.7 2.7 3.7 1.5 3.2Alcoholic beverages at home ..................................................... 150.9 151.3 151.4 152.0 .8 1.6 3.0 2.9 1.2 3.0
Beer, ale, and other malt beverages at home ........................ 149.9 150.2 150.4 151.0 .5 2.5 3.5 3.0 1.5 3.3Distilled spirits at home ............................................................. 152.7 152.7 153.0 154.1 .8 .0 2.1 3.7 .4 2.9Wine at home ............................................................................. 145.6 146.4 146.0 146.5 1.1 1.4 1.4 2.5 1.3 1.9
Alcoholic beverages away from home ...................................... 195.8 196.4 196.8 197.5 -.4 4.7 2.7 3.5 2.1 3.1
Housing ............................................................................................. 157.9 158.2 158.2 158.4 2.9 1.8 2.6 1.3 2.3 1.9Shelter ............................................................................................. 178.9 179.2 179.3 179.7 3.5 2.8 4.1 1.8 3.1 3.0
Rent of primary residence 3 ........................................................ 174.0 174.5 174.9 175.3 3.3 3.6 3.8 3.0 3.5 3.4Lodging away from home 2 3 ...................................................... 104.8 104.1 101.9 101.4 6.6 -1.6 15.9 -12.4 2.4 .8Housing at school, excluding board 3 4 .................................... 239.7 240.6 241.5 242.1 4.4 3.8 6.2 4.1 4.1 5.1Other lodging away from home including hotels and motels 241.7 239.7 234.0 232.7 6.8 -2.2 17.2 -14.1 2.2 .3
Owners’ equivalent rent of primary residence 3 4 .................... 173.1 173.5 173.8 174.2 3.4 3.1 3.1 2.6 3.2 2.8Tenants’ and household insurance 1 2 ....................................... 100.3 100.3 100.1 100.4 -2.0 -1.2 3.7 .4 -1.6 2.0
Fuels and utilities ........................................................................... 127.0 126.8 126.5 126.7 1.6 -3.1 -1.6 -.9 -.8 -1.3Fuels ............................................................................................. 110.8 110.6 110.3 110.4 1.4 -4.2 -2.8 -1.4 -1.4 -2.1
Fuel oil and other fuels .............................................................. 87.1 85.3 85.3 84.1 -1.3 -7.6 -12.3 -13.1 -4.5 -12.7Fuel oil ...................................................................................... 80.6 78.8 78.7 77.5 -8.3 -12.7 -14.8 -14.5 -10.5 -14.7Other household fuels 5 ........................................................... 125.6 124.7 123.5 123.3 2.6 2.2 -5.2 -7.1 2.4 -6.2
Gas (piped) and electricity 3 ...................................................... 118.6 118.4 118.1 118.3 1.7 -4.2 -2.0 -1.0 -1.3 -1.5Electricity 3 ................................................................................ 125.6 125.6 125.3 126.0 -.3 -3.7 -2.5 1.3 -2.0 -.6Utility natural gas service 3 ..................................................... 111.1 110.6 110.1 109.1 7.0 -4.9 -1.1 -7.0 .9 -4.1
Water and sewer and trash collection services 2 ................... 102.5 102.8 103.0 103.1 2.8 2.0 2.8 2.4 2.4 2.6Water and sewerage maintenance 3 ...................................... 216.1 216.7 217.2 217.3 3.6 1.7 2.4 2.2 2.7 2.3Garbage and trash collection 1 6 ............................................ 259.3 260.2 261.0 261.4 1.7 2.5 2.7 3.3 2.1 3.0
Household furnishings and operations ........................................ 125.2 125.3 125.2 124.8 1.0 .6 .0 -1.3 .8 -.6Window and floor coverings and other linens 1 2 ...................... 101.4 101.0 102.3 101.8 1.6 -2.3 .8 1.6 -.4 1.2
Floor coverings 1 2 ..................................................................... 102.5 102.5 101.8 101.9 7.0 4.8 -1.2 -2.3 5.9 -1.7Window coverings 1 2 ................................................................ 100.6 100.2 103.8 102.8 -7.3 -3.2 10.1 9.0 -5.3 9.6Other linens 1 2 ........................................................................... 101.2 100.7 101.7 101.2 4.0 -4.9 -3.9 .0 -.6 -1.9
Furniture and bedding 1 ............................................................... 131.4 132.3 131.9 131.7 4.7 3.1 -5.0 .9 3.9 -2.1Bedroom furniture 1 ..................................................................... 139.3 141.2 140.6 139.4 7.7 -3.1 -3.6 .3 2.2 -1.7Living room, kitchen, and dining room furniture 1 2 ................ 101.0 101.2 101.0 101.1 -2.0 7.4 -5.4 .4 2.6 -2.5Other furniture 1 2 ....................................................................... 103.5 104.5 104.2 104.3 23.0 .8 -6.0 3.1 11.3 -1.5
See footnotes at end of table.38
Digitized for FRASER http://fraser.stlouisfed.org/ Federal Reserve Bank of St. Louis
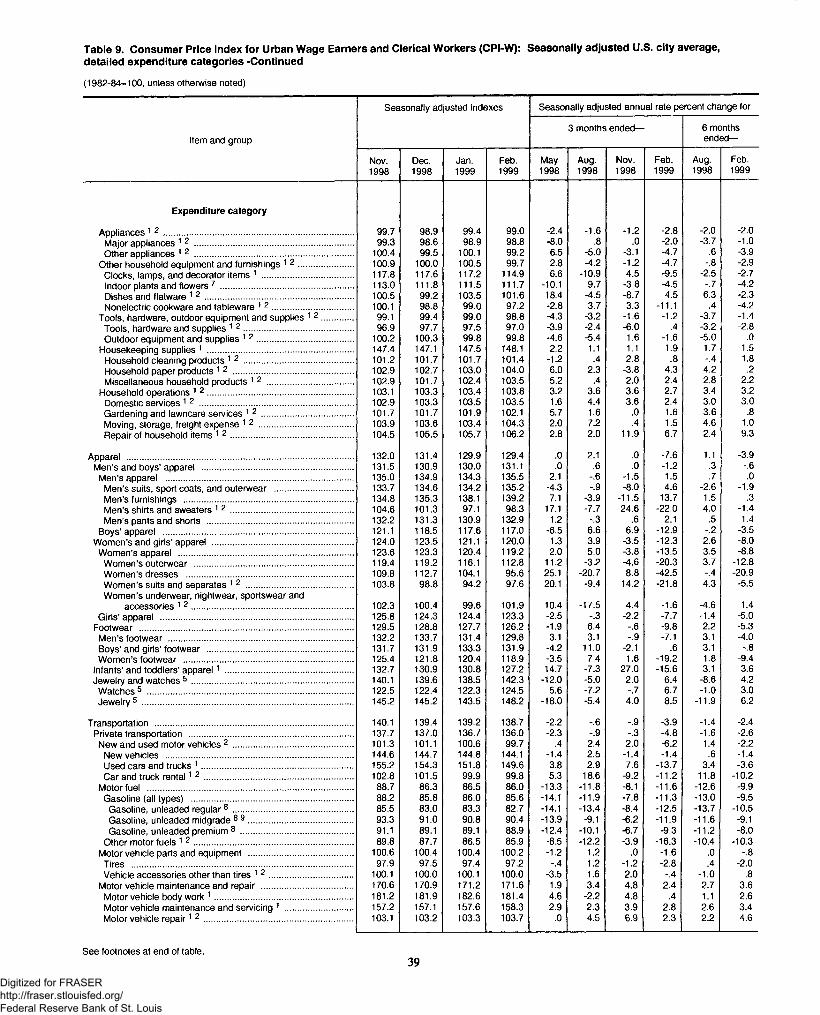
Table 9. Consumer Price Index for Urban Wage Earners and Clerical Workers (CPI-W): Seasonally adjusted U.S. city average,detailed expenditure categories -Continued
(1982-84=100, unless otherwise noted)
Seasonally adjusted indexes Seasonally adjusted annual rate percent change for
Item and group3 months ended— 6 months
ended—
Nov.1998
Dec.1998
Jan.1999
Feb.1999
May1998
Aug.1998
Nov.1998
Feb.1999
Aug.1998
Feb.1999
Expenditure category
Appliances 1 2 ............................................................................... 99.7 98.9 99.4 99.0 -2.4 -1.6 -1.2 -2.8 -2.0 -2.0Major appliances 1 2 .................................................................. 99.3 98.6 98.9 98.8 -8.0 .8 .0 -2.0 -3.7 -1.0Other appliances 1 2 .................................................................. 100.4 99.5 100.1 99.2 6.5 -5.0 -3.1 -4.7 .6 -3.9
Other household equipment and furnishings 1 2 ....................... 100.9 100.0 100.5 99.7 2.8 -4.2 -1.2 -4.7 -.8 -2.9Clocks lamps, and decorator items 1 ...................................... 117.8 117.6 117.2 114.9 6.6 -10.9 4.5 -9.5 -2.5 -2.7Indoor plants and flowers 7 ....................................................... 113.0 111.8 111.5 111.7 -10.1 9.7 -3.8 -4.5 -.7 -4.2Dishes and flatware 1 2 .............................................................. 100.5 99.2 103.5 101.6 18.4 -4.5 -8.7 4.5 6.3 -2.3Nonelectric cookware and tableware 1 2 .................................. 100.1 98.8 99.0 97.2 -2.8 3.7 3.3 -11.1 .4 -4.2
Tools hardware outdoor equipment and supplies 1 2 ............. 99.1 99.4 99.0 98.8 -4.3 -3.2 -1.6 -1.2 -3.7 -1.4Tools hardware and supplies 1 2 .............................................. 96.9 97.7 97.5 97.0 -3.9 -2.4 -6.0 .4 -3.2 -2.8Outdoor equipment and supplies 1 2 ........................................ 100.2 100.3 99.8 99.8 -4.6 -5.4 1.6 -1.6 -5.0 .0
Housekeeping supplies 1 ............................................................. 147.4 147.1 147.5 148.1 2.2 1.1 1.1 1.9 1.7 1.5Household cleaning products 1 2 .............................................. 101.2 101.7 101.7 101.4 -1.2 .4 2.8 .8 -.4 1.8Household paper products 1 2 .................................................. 102.9 102.7 103.0 104.0 6.0 2.3 -3.8 4.3 4.2 .2Miscellaneous household products 12 .................................... 102.9 101.7 102.4 103.5 5.2 .4 2.0 2.4 2.8 2.2
Household operations 1 2 ............................................................. 103.1 103.3 103.4 103.8 3.2 3.6 3.6 2.7 3.4 3.2Domestic services 1 2 ................................................................ 102.9 103.3 103.5 103.5 1.6 4.4 3.6 2.4 3.0 3.0Gardening and lawncare services 1 2 ...................................... 101.7 101.7 101.9 102.1 5.7 1.6 .0 1.6 3.6 .8Moving storage freight expense 1 2 ....................................... 103.9 103.6 103.4 104.3 2.0 7.2 .4 1.5 4.6 1.0Repair of household items 1 2 ................................................... 104.5 105.5 105.7 106.2 2.8 2.0 11.9 6.7 2.4 9.3
Apparel .............................................................................................. 132.0 131.4 129.9 129.4 .0 2.1 .0 -7.6 1.1 -3.9Men’s and boys’ apparel ............................................................... 131.5 130.9 130.0 131.1 .0 .6 .0 -1.2 .3 -.6
Men’s apparel .............................................................................. 135.0 134.9 134.3 135.5 2.1 -.6 -1.5 1.5 .7 .0Men’s suits, sport coats, and outerwear ................................. 133.7 134.6 134.2 135.2 -4.3 -.9 -8.0 4.6 -2.6 -1.9Men’s furnishings ...................................................................... 134.8 135.3 138.1 139.2 7.1 -3.9 -11.5 13.7 1.5 .3Men’s shirts and sweaters 1 2 ................................................... 104.6 101.3 97.1 98.3 17.1 -7.7 24.6 -22.0 4.0 -1.4Men’s pants and shorts ............................................................. 132.2 131.3 130.9 132.9 1.2 -.3 .6 2.1 .5 1.4
Boys’ apparel ............................................................................... 121.1 118.5 117.6 117.0 -6.5 6.6 6.9 -12.9 -.2 -3.5Women’s and girls’ apparel ........................................................... 124.0 123.5 121.1 120.0 1.3 3.9 -3.5 -12.3 2.6 -8.0
Women’s apparel ......................................................................... 123.6 123.3 120.4 119.2 2.0 5.0 -3.8 -13.5 3.5 -8.8Women’s outerwear .................................................................. 119.4 119.2 116.1 112.8 11.2 -3.2 -4.6 -20.3 3.7 -12.8Women’s dresses ...................................................................... 109.8 112.7 104.1 95.6 25.1 -20.7 8.8 -42.5 -.4 -20.9Women’s suits and separates 1 2 ............................................. 103.8 98.8 94.2 97.6 20.1 -9.4 14.2 -21.8 4.3 -5.5Women's underwear, nightwear, sportswear and
accessories 1 2 ................................................................... 102.3 100.4 99.6 101.9 10.4 -17.5 4.4 -1.6 -4.6 1.4Girls’ apparel ................................................................................ 125.8 124.3 124.4 123.3 -2.5 -.3 -2.2 -7.7 -1.4 -5.0
Footwear ......................................................................................... 129.5 128.8 127.7 126.2 -1.9 6.4 -.6 -9.8 2.2 -5.3Men’s footwear ............................................................................. 132.2 133.7 131.4 129.8 3.1 3.1 -.9 -7.1 3.1 -4.0Boys’ and girls’ footwear ............................................................. 131.7 131.9 133.3 131.9 -4.2 11.0 -2.1 .6 3.1 -.8Women’s footwear ....................................................................... 125.4 121.8 120.4 118.9 -3.5 7.4 1.6 -19.2 1.8 -9.4
Infants’ and toddlers’ apparel1 ..................................................... 132.7 130.9 130.8 127.2 14.7 -7.3 27.0 -15.6 3.1 3.6Jewelry and watches 5 .................................................................. 140.1 139.6 138.5 142.3 -12.0 -5.0 2.0 6.4 -8.6 4.2
Watches 5 ...................................................................................... 122.5 122.4 122.3 124.5 5.6 -7.2 -.7 6.7 -1.0 3.0Jewelry 5 ........................................................................................ 145.2 145.2 143.5 148.2 -18.0 -5.4 4.0 8.5 -11.9 6.2
Transportation ................................................................................... 140.1 139.4 139.2 138.7 -2.2 -.6 -.9 -3.9 -1.4 -2.4Private transportation .................................................................... 137.7 137.0 136.7 136.0 -2.3 -.9 -.3 -4.8 -1.6 -2.6
New and used motor vehicles 2 .................................................. 101.3 101.1 100.6 99.7 .4 2.4 2.0 -6.2 1.4 -2.2New vehicles .............................................................................. 144.6 144.7 144.8 144.1 -1.4 2.5 -1.4 -1.4 .6 -1.4Used cars and trucks 1 ............................................................... 155.2 154.3 151.8 149.6 3.8 2.9 7.6 -13.7 3.4 -3.6Car and truck renta l1 2 .............................................................. 102.8 101.5 99.9 99.8 5.3 18.6 -9.2 -11.2 11.8 -10.2
Motor fuel ...................................................................................... 88.7 86.3 86.5 86.0 -13.3 -11.8 -8.1 -11.6 -12.6 -9.9Gasoline (all types) ................................................................... 88.2 85.8 86.0 85.6 -14.1 -11.9 -7.8 -11.3 -13.0 -9.5
Gasoline, unleaded regular ® .................................................. 85.5 83.0 83.3 82.7 -14.1 -13.4 -8.4 -12.5 -13.7 -10.5Gasoline, unleaded midgrade ® 9 ............................................ 93.3 91.0 90.8 90.4 -13.9 -9.1 -6.2 -11.9 -11.6 -9.1Gasoline, unleaded premium 8 ............................................... 91.1 89.1 89.1 88.9 -12.4 -10.1 -6.7 -9.3 -11.2 -8.0
Other motor fuels 1 2 .................................................................. 89.8 87.7 86.5 85.9 -8.5 -12.2 -3.9 -16.3 -10.4 -10.3Motor vehicle parts and equipment ............................................ 100.6 100.4 100.4 100.2 -1.2 1.2 .0 -1.6 .0 -.8
Tires ............................................................................................ 97.9 97.5 97.4 97.2 -.4 1.2 -1.2 -2.8 .4 -2.0Vehicle accessories other than tires 1 2 ................................... 100.1 100.0 100.1 100.0 -3.5 1.6 2.0 -.4 -1.0 .8
Motor vehicle maintenance and repair ...................................... 170.6 170.9 171.2 171.6 1.9 3.4 4.8 2.4 2.7 3.6Motor vehicle body work 1 .......................................................... 181.2 181.9 182.6 181.4 4.6 -2.2 4.8 .4 1.1 2.6Motor vehicle maintenance and servicing 1 ........................... 157.2 157.1 157.6 158.3 2.9 2.3 3.9 2.8 2.6 3.4Motor vehicle repa ir1 2 .............................................................. 103.1 103.2 103.3 103.7 .0 4.5 6.9 2.3 2.2 4.6
See footnotes at end of table.39
Digitized for FRASER http://fraser.stlouisfed.org/ Federal Reserve Bank of St. Louis
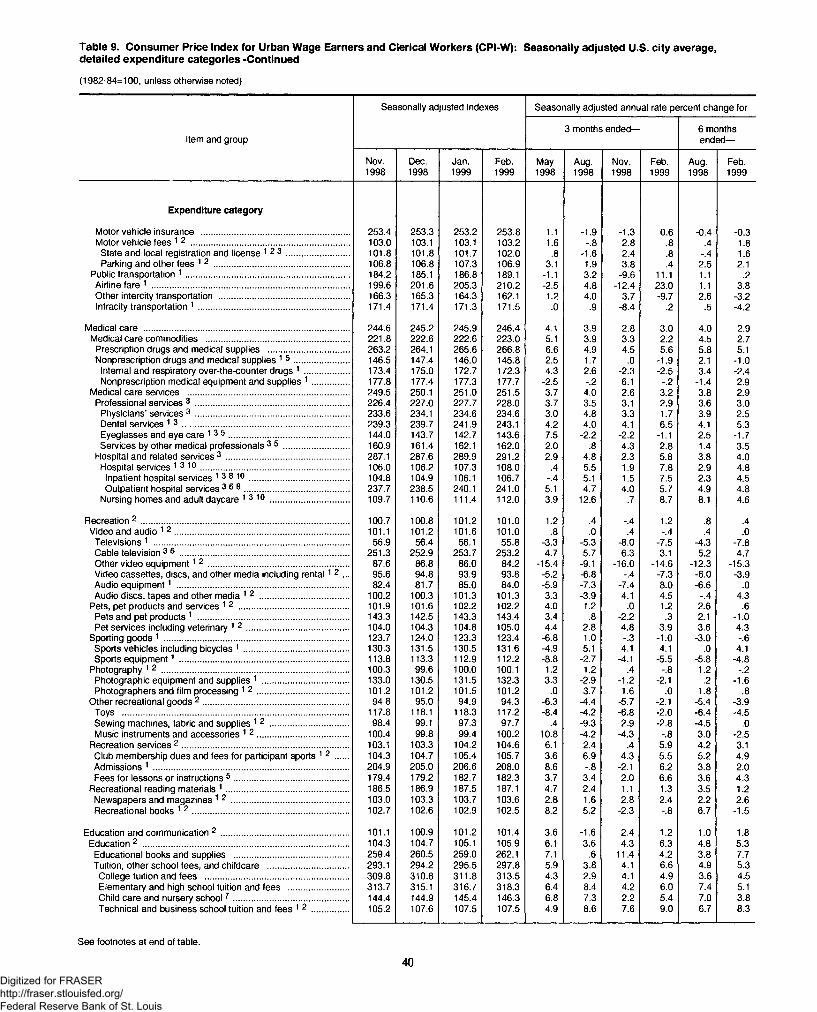
Table 9. Consumer Price Index for Urban Wage Earners and Clerical Workers (CPI-W): Seasonally adjusted U.S. city average,detailed expenditure categories -Continued
(1982-84=100, unless otherwise noted)
Seasonally adjusted indexes Seasonally adjusted annual rate percent change for
Item and group3 months ended— 6 months
ended—
Nov.1998
Dec.1998
Jan.1999
Feb.1999
May1998
Aug.1998
Nov.1998
Feb.1999
Aug.1998
Feb.1999
Expenditure category
Motor vehicle insurance .............................................................. 253.4 253.3 253.2 253.8 1.1 -1.9 -1.3 0.6 -0.4 -0.3Motor vehicle fees 1 2 .................................................................. 103.0 103.1 103.1 103.2 1.6 -.8 2.8 .8 .4 1.8
State and local registration and license 1 2 3 .......................... 101.8 101.8 101.7 102.0 .8 -1.6 2.4 .8 -.4 1.6Parking and other fees 1 2 ........................................................ 106.8 106.8 107.3 106.9 3.1 1.9 3.8 .4 2.5 2.1
Public transportation 1 .................................................................... 184.2 185.1 186.8 189.1 -1.1 3.2 -9.6 11.1 1.1 .2Airline fare 1 .................................................................................. 199.6 201.6 205.3 210.2 -2.5 4.8 -12.4 23.0 1.1 3.8Other intercity transportation ...................................................... 166.3 165.3 164.3 162.1 1.2 4.0 3.7 -9.7 2.6 -3.2Intracity transportation 1 ............................................................... 171.4 171.4 171.3 171.5 .0 .9 -8.4 .2 .5 -4.2
Medical care ...................................................................................... 244.6 245.2 245.9 246.4 4.1 3.9 2.8 3.0 4.0 2.9Medical care commodities ............................................................ 221.8 222.6 222.6 223.0 5.1 3.9 3.3 2.2 4.5 2.7
Prescription drugs and medical supplies .................................. 263.2 264.1 265.6 266.8 6.6 4.9 4.5 5.6 5.8 5.1Nonprescription drugs and medical supplies 1 5 ....................... 146.5 147.4 146.0 145.8 2.5 1.7 .0 -1.9 2.1 -1.0
Internal and respiratory over-the-counter drugs 1 ................... 173.4 175.0 172.7 172.3 4.3 2.6 -2.3 -2.5 3.4 -2.4Nonprescription medical equipment and supplies 1 ............... 177.8 177.4 177.3 177.7 -2.5 -.2 6.1 -.2 -1.4 2.9
Medical care services ................................................................... 249.5 250.1 251.0 251.5 3.7 4.0 2.6 3.2 3.8 2.9Professional services 3 ................................................................ 226.4 227.0 227.7 228.0 3.7 3.5 3.1 2.9 3.6 3.0
Physicians’ services 3 ................................................................ 233.6 234.1 234.6 234.6 3.0 4.8 3.3 1.7 3.9 2.5Dental services 1 3 ...................................................................... 239.3 239.7 241.9 243.1 4.2 4.0 4.1 6.5 4.1 5.3Eyeglasses and eye care 1 3 5 .................................................. 144.0 143.7 142.7 143.6 7.5 -2.2 -2.2 -1.1 2.5 -1.7Services by other medical professionals 3 5 ........................... 160.9 161.4 162.1 162.0 2.0 .8 4.3 2.8 1.4 3.5
Hospital and related services 3 ................................................... 287.1 287.6 289.9 291.2 2.9 4.8 2.3 5.8 3.8 4.0Hospital services 1 3 1 0 .............................................................. 106.0 106.2 107.3 108.0 .4 5.5 1.9 7.8 2.9 4.8
Inpatient hospital services 138 1 0 ......................................... 104.8 104.9 106.1 106.7 -.4 5.1 1.5 7.5 2.3 4.5Outpatient hospital services 3 6 8 ............................................ 237.7 238.5 240.1 241.0 5.1 4.7 4.0 5.7 4.9 4.8
Nursing homes and adult daycare 1310 ................................. 109.7 110.6 111.4 112.0 3.9 12.6 .7 8.7 8.1 4.6
Recreation 2 ....................................................................................... 100.7 100.8 101.2 101.0 1.2 .4 -.4 1.2 .8 .4Video and audio 1 2 ......................................................................... 101.1 101.2 101.6 101.0 .8 .0 .4 -.4 .4 .0
Televisions 1 ................................................................................. 56.9 56.4 56.1 55.8 -3.3 -5.3 -8.0 -7.5 -4.3 -7.8Cable television 3 6 ...................................................................... 251.3 252.9 253.7 253.2 4.7 5.7 6.3 3.1 5.2 4.7Other video equipment1 2 ........................................................... 87.6 86.8 86.0 84.2 -15.4 -9.1 -16.0 -14.6 -12.3 -15.3Video cassettes, discs, and other media including renta l1 2 ... 95.6 94.8 93.9 93.8 -5.2 -6.8 -.4 -7.3 -6.0 -3.9Audio equipment1 ........................................................................ 82.4 81.7 85.0 84.0 -5.9 -7.3 -7.4 8.0 -6.6 .0Audio discs, tapes and other media 1 2 ..................................... 100.2 100.3 101.3 101.3 3.3 -3.9 4.1 4.5 -.4 4.3
Pets, pet products and services 1 2 .............................................. 101.9 101.6 102.2 102.2 4.0 1.2 .0 1.2 2.6 .6Pets and pet products 1 ................................ .............................. 143.3 142.5 143.3 143.4 3.4 .8 -2.2 .3 2.1 -1.0Pet services including veterinary 1 2 ........................................... 104.0 104.3 104.8 105.0 4.4 2.8 4.8 3.9 3.6 4.3
Sporting goods 1 ............................................................................. 123.7 124.0 123.3 123.4 -6.8 1.0 -.3 -1.0 -3.0 -.6Sports vehicles including bicycles 1 ............................................ 130.3 131.5 130.5 131.6 -4.9 5.1 4.1 4.1 .0 4.1Sports equipment1 ...................................................................... 113.8 113.3 112.9 112.2 -8.8 -2.7 -4.1 -5.5 -5.8 -4.8
Photography 1 2 .............................................................................. 100.3 99.6 100.0 100.1 1.2 1.2 .4 -.8 1.2 -.2Photographic equipment and supplies 1 .................................... 133.0 130.5 131.5 132.3 3.3 -2.9 -1.2 -2.1 .2 -1.6Photographers and film processing 1 2 ...................................... 101.2 101.2 101.5 101.2 .0 3.7 1.6 .0 1.8 .8
Other recreational goods 2 ............................................................. 94.8 95.0 94.9 94.3 -6.3 -4.4 -5.7 -2.1 -5.4 -3.9Toys .............................................................................................. 117.8 118.1 118.3 117.2 -8.4 -4.2 -6.8 -2.0 -6.4 -4.5Sewing machines, fabric and supplies 1 2 ................................. 98.4 99.1 97.3 97.7 .4 -9.3 2.9 -2.8 -4.5 .0Music instruments and accessories 1 2 ...................................... 100.4 99.8 99.4 100.2 10.8 -4.2 -4.3 -.8 3.0 -2.5
Recreation services 2 ..................................................................... 103.1 103.3 104.2 104.6 6.1 2.4 .4 5.9 4.2 3.1Club membership dues and fees for participant sports 1 2 ..... 104.3 104.7 105.4 105.7 3.6 6.9 4.3 5.5 5.2 4.9Admissions 1 ................................................................................. 204.9 205.0 206.6 208.0 8.6 -.8 -2.1 6.2 3.8 2.0Fees for lessons or instructions 5 ................................................ 179.4 179.2 182.7 182.3 3.7 3.4 2.0 6.6 3.6 4.3
Recreational reading materials 1 ................................................... 186.5 186.9 187.5 187.1 4.7 2.4 1.1 1.3 3.5 1.2Newspapers and magazines 1 2 ................................................. 103.0 103.3 103.7 103.6 2.8 1.6 2.8 2.4 2.2 2.6Recreational books 1 2 ................................................................. 102.7 102.6 102.9 102.5 8.2 5.2 -2.3 -.8 6.7 -1.5
Education and communication 2 ..................................................... 101.1 100.9 101.2 101.4 3.6 -1.6 2.4 1.2 1.0 1.8Education 2 ...................................................................................... 104.3 104.7 105.1 105.9 6.1 3.6 4.3 6.3 4.8 5.3
Educational books and supplies ................................................ 259.4 260.5 259.0 262.1 7.1 .6 11.4 4.2 3.8 7.7Tuition, other school fees, and childcare .................................. 293.1 294.2 295.5 297.8 5.9 3.8 4.1 6.6 4.9 5.3
College tuition and fees ............................................................ 309.8 310.8 311.8 313.5 4.3 2.9 4.1 4.9 3.6 4.5Elementary and high school tuition and fees ......................... 313.7 315.1 316.7 318.3 6.4 8.4 4.2 6.0 7.4 5.1Child care and nursery school7 ................................................ 144.4 144.9 145.4 146.3 6.8 7.3 2.2 5.4 7.0 3.8Technical and business school tuition and fees 1 2 ............... 105.2 107.6 107.5 107.5 4.9 8.6 7.6 9.0 6.7 8.3
See footnotes at end of table.
40Digitized for FRASER http://fraser.stlouisfed.org/ Federal Reserve Bank of St. Louis
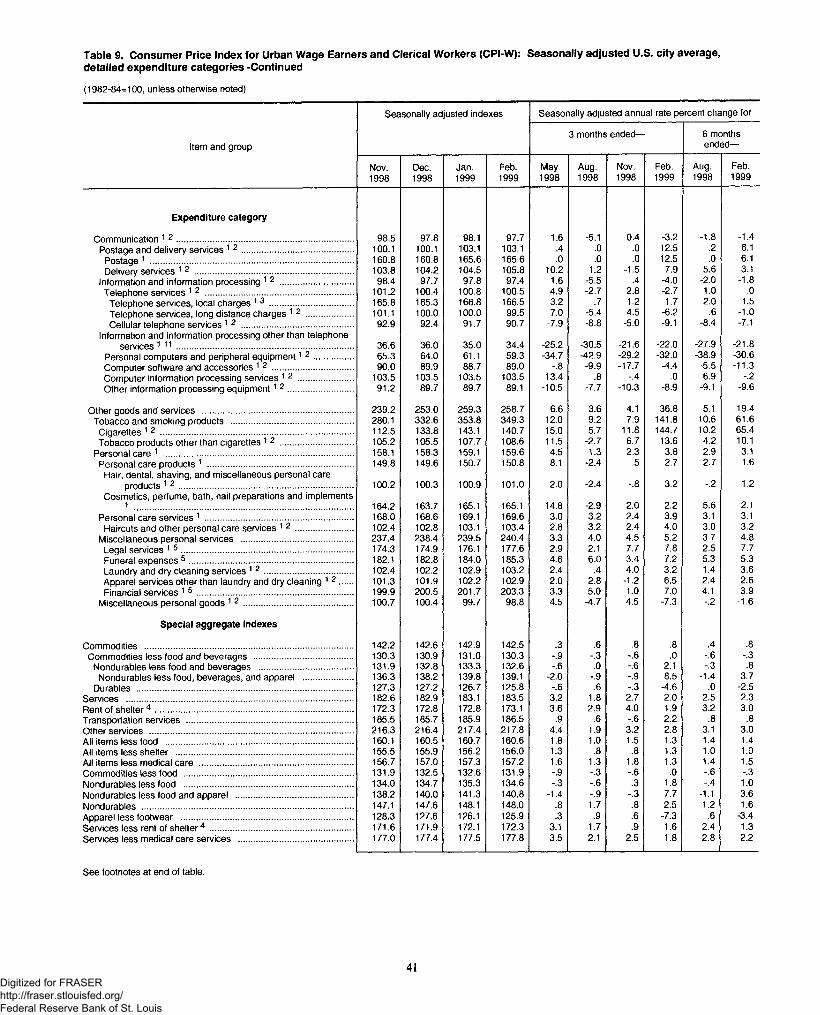
Table 9. Consumer Price Index for Urban Wage Earners and Clerical Workers (CPI-W): Seasonally adjusted U.S. city average,detailed expenditure categories -Continued
(1982-84=100, unless otherwise noted)
Seasonally adjusted indexes Seasonally adjusted annual rate percent change for
Item and group3 months ended— 6 months
ended—
Nov.1998
Dec.1998
Jan.1999
Feb.1999
May1998
Aug.1998
Nov.1998
Feb.1999
Aug.1998
Feb.1999
Expenditure category
Communication 1 2 .......................................................................... 98.5 97.8 98.1 97.7 1.6 -5.1 0.4 -3.2 -1.8 -1.4Postage and delivery services 1 2 ............................................... 100.1 100.1 103.1 103.1 .4 .0 .0 12.5 .2 6.1
Postage 1 ..................................................................................... 160.8 160.8 165.6 165.6 .0 .0 .0 12.5 .0 6.1Delivery services 1 2 .................................................................. 103.8 104.2 104.5 105.8 10.2 1.2 -1.5 7.9 5.6 3.1
Information and information processing 1 2 .............................. 98.4 97.7 97.8 97.4 1.6 -5.5 .4 -4.0 -2.0 -1.8Telephone services 12 .............................................................. 101.2 100.4 100.8 100.5 4.9 -2.7 2.8 -2.7 1.0 .0
Telephone services, local charges 1 3 ................................... 165.8 165.3 166.8 166.5 3.2 .7 1.2 1.7 2.0 1.5Telephone services, long distance charges 12 .................... 101.1 100.0 100.0 99.5 7.0 -5.4 4.5 -6.2 .6 -1.0Cellular telephone services 1 2 .............................................. 92.9 92.4 91.7 90.7 -7.9 -8.8 -5.0 -9.1 -8.4 -7.1
Information and information processing other than telephoneservices 1 1 1 .......................................................................... 36.6 36.0 35.0 34.4 -25.2 -30.5 -21.6 -22.0 -27.9 -21.8
Personal computers and peripheral equipment1 2 ................ 65.3 64.0 61.1 59.3 -34.7 -42.9 -29.2 -32.0 -38.9 -30.6Computer software and accessories 1 2 .................................. 90.0 89.9 88.7 89.0 -.8 -9.9 -17.7 -4.4 -5.5 -11.3Computer information processing services 1 2 ....................... 103.5 103.5 103.5 103.5 13.4 .8 -.4 .0 6.9 -.2Other information processing equipment1 2 ........................... 91.2 89.7 89.7 89.1 -10.5 -7.7 -10.3 -8.9 -9.1 -9.6
Other goods and services ............................................................... 239.2 253.0 259.3 258.7 6.6 3.6 4.1 36.8 5.1 19.4Tobacco and smoking products ................................................... 280.1 332.6 353.8 349.3 12.0 9.2 7.9 141.8 10.6 61.6
Cigarettes 1 2 ................................................................................ 112.5 133.8 143.1 140.7 15.0 5.7 11.8 144.7 10.2 65.4Tobacco products other than cigarettes 1 2 ............................... 105.2 105.5 107.7 108.6 11.5 -2.7 6.7 13.6 4.2 10.1
Personal care 1 ............................................................................... 158.1 158.3 159.1 159.6 4.5 1.3 2.3 3.8 2.9 3.1Personal care products 1 ............................................................. 149.8 149.6 150.7 150.8 8.1 -2.4 .5 2.7 2.7 1.6
Hair, dental, shaving, and miscellaneous personal careproducts 1 2 ......................................................................... 100.2 100.3 100.9 101.0 2.0 -2.4 -.8 3.2 -.2 1.2
Cosmetics, perfume, bath, nail preparations and implements 1 164.2 163.7 165.1 165.1 14.8 -2.9 2.0 2.2 5.6 2.1
Personal care services 1 .............................................................. 168.0 168.6 169.1 169.6 3.0 3.2 2.4 3.9 3.1 3.1Haircuts and other personal care services 1 2 ........................ 102.4 102.8 103.1 103.4 2.8 3.2 2.4 4.0 3.0 3.2
Miscellaneous personal services ............................................... 237.4 238.4 239.5 240.4 3.3 4.0 4.5 5.2 3.7 4.8Legal services 1 5 ........................................................................ 174.3 174.9 176.1 177.6 2.9 2.1 7.7 7.8 2.5 7.7Funeral expenses 5 .................................................................... 182.1 182.8 184.0 185.3 4.6 6.0 3.4 7.2 5.3 5.3Laundry and dry cleaning services 1 2 ..................................... 102.4 102.2 102.9 103.2 2.4 .4 4.0 3.2 1.4 3.6Apparel services other than laundry and dry cleaning 1 2 ..... 101.3 101.9 102.2 102.9 2.0 2.8 -1.2 6.5 2.4 2.6Financial services 1 5 ................................................................. 199.9 200.5 201.7 203.3 3.3 5.0 1.0 7.0 4.1 3.9
Miscellaneous personal goods 1 2 ............................................. 100.7 100.4 99.7 98.8 4.5 -4.7 4.5 -7.3 -.2 -1.6
Special aggregate indexes
Commodities ....................................................................................... 142.2 142.6 142.9 142.5 .3 .6 .8 .8 .4 .8Commodities less food and beverages ......................................... 130.3 130.9 131.0 130.3 -.9 -.3 -.6 .0 -.6 -.3
Nondurables less food and beverages ....................................... 131.9 132.8 133.3 132.6 -.6 .0 -.6 2.1 -.3 .8Nondurables less food, beverages, and apparel ..................... 136.3 138.2 139.8 139.1 -2.0 -.9 -.9 8.5 -1.4 3.7
Durables .......................................................................................... 127.3 127.2 126.7 125.8 -.6 .6 -.3 -4.6 .0 -2.5Services ............................................................................................... 182.6 182.9 183.1 183.5 3.2 1.8 2.7 2.0 2.5 2.3Rent of shelter4 ................................................................................... 172.3 172.8 172.8 173.1 3.6 2.9 4.0 1.9 3.2 3.0Transportation services ..................................................................... 185.5 185.7 185.9 186.5 .9 .6 -.6 2.2 .8 .8Other services ..................................................................................... 216.3 216.4 217.4 217.8 4.4 1.9 3.2 2.8 3.1 3.0All items less food .............................................................................. 160.1 160.5 160.7 160.6 1.8 1.0 1.5 1.3 1.4 1.4All items less shelter .......................................................................... 155.5 155.9 156.2 156.0 1.3 .8 .8 1.3 1.0 1.0All items less medical care ................................................................ 156.7 157.0 157.3 157.2 1.6 1.3 1.8 1.3 1.4 1.5Commodities less food ....................................................................... 131.9 132.5 132.6 131.9 -.9 -.3 -.6 .0 -.6 -.3Nondurables less food ....................................................................... 134.0 134.7 135.3 134.6 -.3 -.6 .3 1.8 -.4 1.0Nondurables less food and apparel ................................................. 138.2 140.0 141.3 140.8 -1.4 -.9 -.3 7.7 -1.1 3.6Nondurables ........................................................................................ 147.1 147.6 148.1 148.0 .8 1.7 .8 2.5 1.2 1.6Apparel less footwear ........................................................................ 128.3 127.6 126.1 125.9 .3 .9 .6 -7.3 .6 -3.4Services less rent of shelter4 ............................................................ 171.6 171.9 172.1 172.3 3.1 1.7 .9 1.6 2.4 1.3Services less medical care services ................................................ 177.0 177.4 177.5 177.8 3.5 2.1 2.5 1.8 2.8 2.2
See footnotes at end of table.
41Digitized for FRASER http://fraser.stlouisfed.org/ Federal Reserve Bank of St. Louis
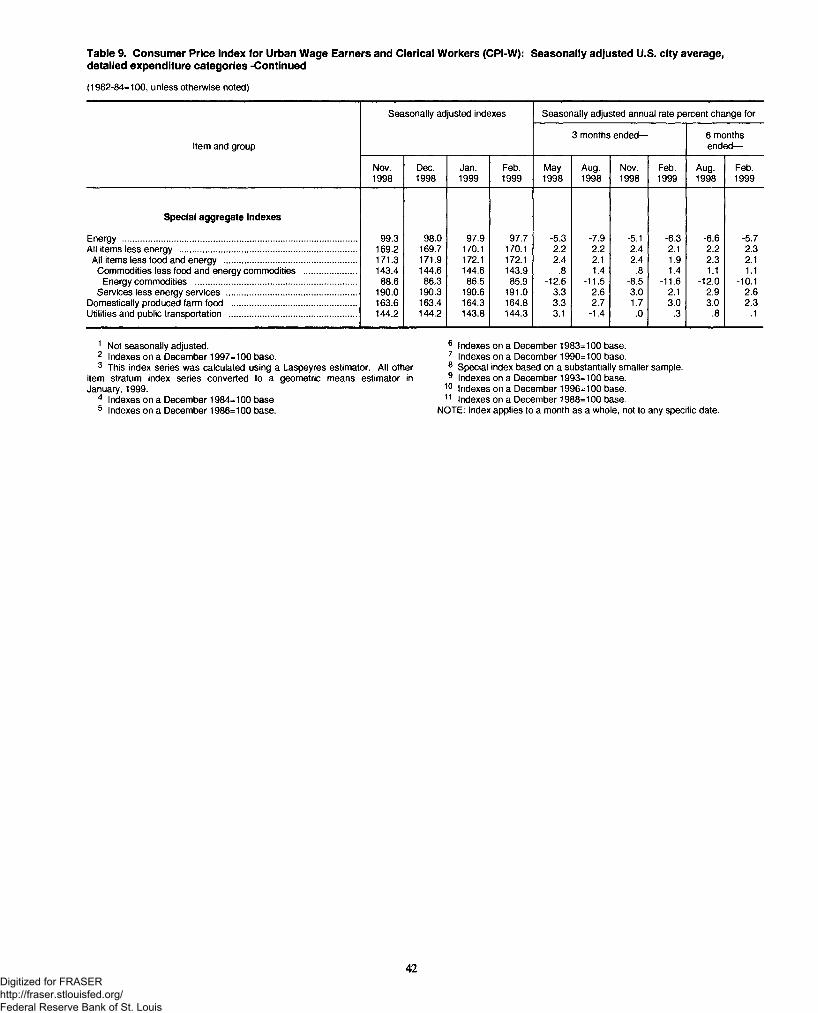
Table 9. Consumer Price Index for Urban Wage Earners and Clerical Workers (CPI-W): Seasonally adjusted U.S. city average,detailed expenditure categories -Continued
(1982-84=100, unless otherwise noted)
Seasonally adjusted indexes Seasonally adjusted annual rate percent change for
Item and group3 months ended— 6 months
ended—
Nov.1998
Dec.1998
Jan.1999
Feb.1999
May1998
Aug.1998
Nov.1998
Feb.1999
Aug.1998
Feb.1999
Special aggregate indexes
Energy .................................................................................................. 99.3 98.0 97.9 97.7 -5.3 -7.9 -5.1 -6.3 -6.6 -5.7All items less energy .......................................................................... 169.2 169.7 170.1 170.1 2.2 2.2 2.4 2.1 2.2 2.3
All items less food and energy ....................................................... 171.3 171.9 172.1 172.1 2.4 2.1 2.4 1.9 2.3 2.1Commodities less food and energy commodities ...................... 143.4 144.6 144.6 143.9 .8 1.4 .8 1.4 1.1 1.1
Energy commodities ................................................................... 88.6 86.3 86.5 85.9 -12.6 -11.5 -8.5 -11.6 -12.0 -10.1Services less energy services ...................................................... 190.0 190.3 190.6 191.0 3.3 2.6 3.0 2.1 2.9 2.6
Domestically produced farm food .................................................... 163.6 163.4 164.3 164.8 3.3 2.7 1.7 3.0 3.0 2.3Utilities and public transportation ..................................................... 144.2 144.2 143.8 144.3 3.1 -1.4 .0 .3 .8 .1
1 Not seasonally adjusted.2 Indexes on a December 1997=100 base.3 This index series was calculated using a Laspeyres estimator. AH other
item stratum index series converted to a geometric means estimator in January, 1999.
4 Indexes on a December 1984=100 base5 Indexes on a December 1986=100 base.
6 Indexes on a December 1983=100 base.7 Indexes on a December 1990=100 base.8 Special index based on a substantially smaller sample.9 Indexes on a December 1993=100 base.
10 Indexes on a December 1996=100 base.11 Indexes on a December 1988= 100 base.
NOTE: Index applies to a month as a whole, not to any specific date.
42Digitized for FRASER http://fraser.stlouisfed.org/ Federal Reserve Bank of St. Louis
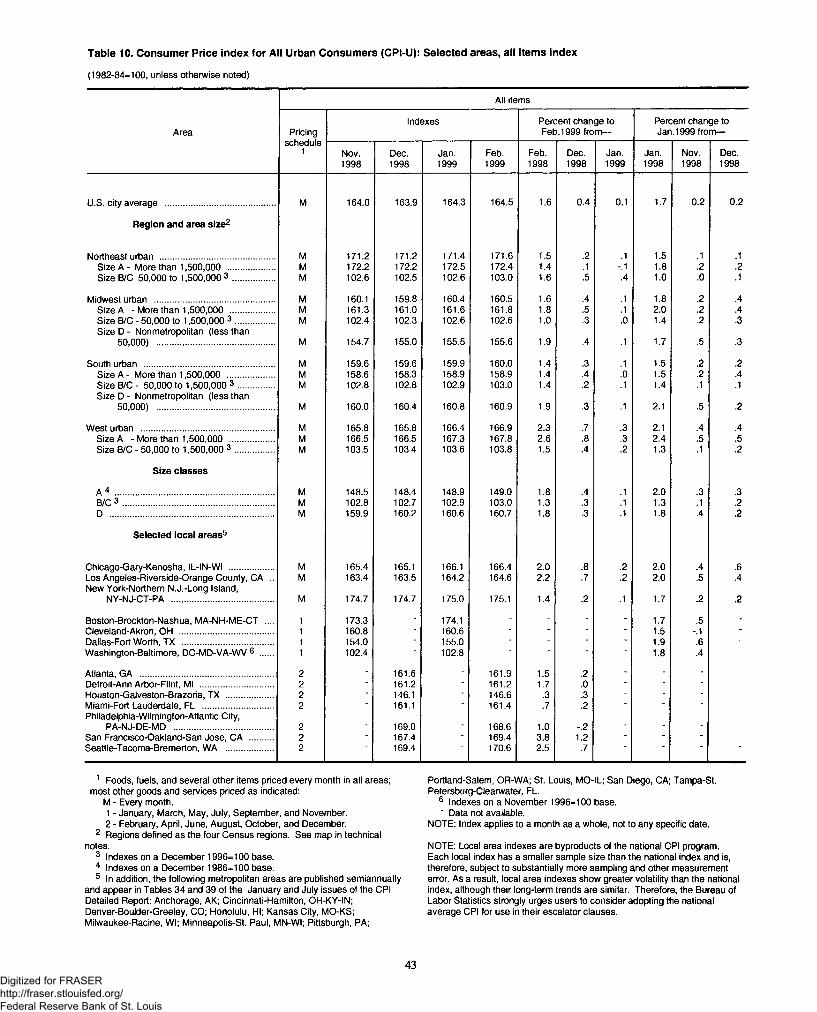
Table 10. Consumer Price index for All Urban Consumers (CPI-U): Selected areas, all items index
(1982-84=100, unless otherwise noted)
All items
Area Pricingschedule
1
Indexes Percent change to Feb. 1999 from—
Percent change to Jan. 1999 from—
Nov.1998
Dec.1998
Jan.1999
Feb.1999
Feb.1998
Dec.1998
Jan.1999
Jan.1998
Nov.1998
Dec.1998
U.S. city average .............................................. M 164.0 163.9 164.3 164.5 1.6 0.4 0.1 1.7 0.2 0.2
Region and area size2
Northeast urban ................................................ M 171.2 171.2 171.4 171.6 1.5 .2 .1 1.5 .1 .1Size A - More than 1,500,000 .................... M 172.2 172.2 172.5 172.4 1.4 .1 -.1 1.8 .2 .2Size B/C 50,000 to 1,500,000 3 ................. M 102.6 102.5 102.6 103.0 1.6 .5 .4 1.0 .0 .1
Midwest urban .................................................. M 160.1 159.8 160.4 160.5 1.6 .4 .1 1.8 .2 .4Size A - More than 1,500,000 .................. M 161.3 161.0 161.6 161.8 1.8 .5 .1 2.0 .2 .4Size B/C - 50,000 to 1,500,000 3 ................ M 102.4 102.3 102.6 102.6 1.0 .3 .0 1.4 .2 .3Size D - Nonmetropolitan (less than
50,000) ................................................. M 154.7 155.0 155.5 155.6 1.9 .4 .1 1.7 .5 .3
South urban ...................................................... M 159.6 159.6 159.9 160.0 1.4 .3 .1 1.5 .2 .2Size A - More than 1,500,000 .................... M 158.6 158.3 158.9 158.9 1.4 .4 .0 1.5 .2 .4Size B/C - 50,000 to 1,500,000 3 ............... M 102.8 102.8 102.9 103.0 1.4 .2 .1 1.4 .1 .1Size D - Non metropolitan (less than
50,000) ................................................. M 160.0 160.4 160.8 160.9 1.9 .3 .1 2.1 .5 .2
West urban ....................................................... M 165.8 165.8 166.4 166.9 2.3 .7 .3 2.1 .4 .4Size A - More than 1,500,000 .................. M 166.5 166.5 167.3 167.8 2.6 .8 .3 2.4 .5 .5Size B/C - 50,000 to 1,500,000 3 ................ M 103.5 103.4 103.6 103.8 1.5 .4 .2 1.3 .1 .2
Size classes
A 4 .................................................................. M 148.5 148.4 148.9 149.0 1.8 .4 .1 2.0 .3 .3B/C 3 ............................................................... M 102.8 102.7 102.9 103.0 1.3 .3 .1 1.3 .1 .2D .................................................................... M 159.9 160.2 160.6 160.7 1.8 .3 .1 1.8 .4 .2
Selected local areas5
Chicago-Gary-Kenosha, IL-IN-WI .................. M 165.4 165.1 166.1 166.4 2.0 .8 .2 2.0 .4 .6Los Angeles-Riverside-Orange County, CA .. M 163.4 163.5 164.2 164.6 2.2 .7 .2 2.0 .5 .4New York-Northern N.J.-Long Island,
NY-NJ-CT-PA ........................................... M 174.7 174.7 175.0 175.1 1.4 .2 .1 1.7 .2 .2
Boston-Brockton-Nashua, MA-NH-ME-CT .... 1 173.3 - 174.1 - - - - 1.7 .5 -Cleveland-Akron, OH ....................................... 1 160.8 - 160.6 - - - - 1.5 -.1 -Dallas-Fort Worth, TX ...................................... 1 154.0 - 155.0 - - - - 1.9 .6Washington-Baltimore, DC-MD-VA-WV 6 1 102.4 ■ 102.8 ■ ■ ■ ■ 1.8 .4
Atlanta, GA ........................................................ 2 - 161.6 - 161.9 1.5 .2 - - -Detroit-Ann Arbor-Flint, Ml ............................... 2 - 161.2 - 161.2 1.7 .0 - - -Houston-Galveston-Brazoria, TX .................... 2 - 146.1 - 146.6 .3 .3 - - -Miami-Fort Lauderdale, FL ............................. 2 - 161.1 - 161.4 .7 .2 - - -Philadelphia-Wilmington-Atlantic City,
PA-NJ-DE-MD ......................................... 2 * 169.0 - 168.6 1.0 -.2 - - -San Francisco-Oakland-San Jose, CA .......... 2 - 167.4 - 169.4 3.8 1.2 - - -Seattle-Tacoma-Bremerton, WA .................... 2 169.4 170.6 2.5 .7
1 Foods, fuels, and several other items priced every month in all areas; most other goods and services priced as indicated:
M - Every month.1 - January, March, May, July, September, and November.2 - February, April, June, August, October, and December.
2 Regions defined as the four Census regions. See map in technical notes.
3 Indexes on a December 1996=100 base.4 Indexes on a December 1986=100 base.5 In addition, the following metropolitan areas are published semiannually
and appear in Tables 34 and 39 of the January and July issues of the CPIDetailed Report: Anchorage, AK; Cincinnati-Hamilton, OH-KY-IN; Denver-Boulder-Greeley, CO; Honolulu, HI; Kansas City, MO-KS; Milwaukee-Racine, Wl; Minneapolis-St. Paul, MN-WI; Pittsburgh, PA;
Portland-Salem, OR-WA; St. Louis, MO-IL; San Diego, CA; Tampa-St. Petersburg-Clearwater, FL.
6 Indexes on a November 1996=100 base." Data not available.
NOTE: Index applies to a month as a whole, not to any specific date.
NOTE: Local area indexes are byproducts of the national CPI program.Each local index has a smaller sample size than the national index and is, therefore, subject to substantially more sampling and other measurement error. As a result, local area indexes show greater volatility than the national index, although their long-term trends are similar. Therefore, the Bureau of Labor Statistics strongly urges users to consider adopting the national average CPI for use in their escalator clauses.
43Digitized for FRASER http://fraser.stlouisfed.org/ Federal Reserve Bank of St. Louis
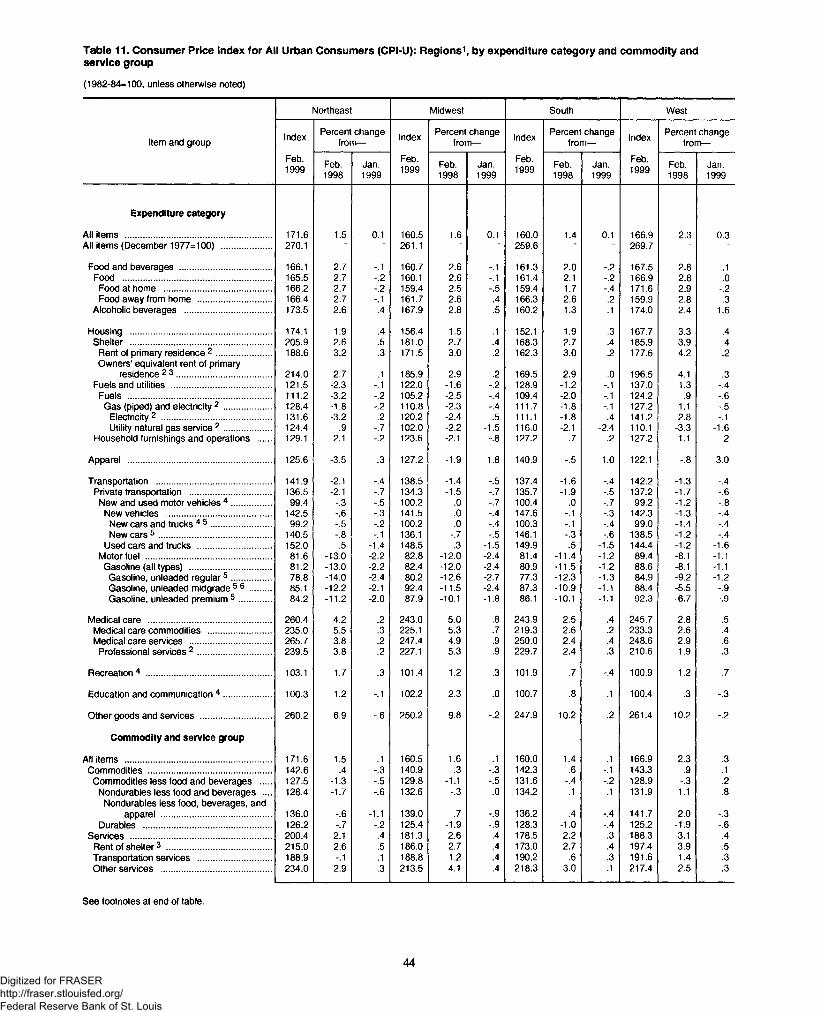
Table 11. Consumer Price Index for All Urban Consumers (CPI-U): Regions1, by expenditure category and commodity andservice group
(1982-84=100, unless otherwise noted)
Northeast Midwest South West
Item and group Index Percent change from— Index Percent change
from— Index Percent change from— Index Percent change
from—
Feb.1999 Feb.
1998Jan.1999
Feb.1999 Feb.
1998Jan.1999
Feb.1999 Feb.
1998Jan.1999
Feb.1999 Feb.
1998Jan.1999
Expenditure category
All items ............................................................. 171.6 1.5 0.1 160.5 1.6 0.1 160.0 1.4 0.1 166.9 2.3 0.3All items (December 1977= 100) ..................... 270.1 ■ ■ 261.1 ■ * 259.6 ■ ■ 269.7 ■ ■
Food and beverages ...................................... 166.1 2.7 -.1 160.7 2.6 -.1 161.3 2.0 -.2 167.5 2.8 .1Food .............................................................. 165.5 2.7 -.2 160.1 2.6 -.1 161.4 2.1 -.2 166.9 2.8 .0
Food at home ............................................. 166.2 2.7 -.2 159.4 2.5 -.5 159.4 1.7 -.4 171.6 2.9 -.2Food away from home ............................... 166.4 2.7 -.1 161.7 2.6 .4 166.3 2.6 .2 159.9 2.8 .3
Alcoholic beverages .................................... 173.5 2.6 .4 167.9 2.8 .5 160.2 1.3 .1 174.0 2.4 1.6
Housing ........................................................... 174.1 1.9 .4 156.4 1.5 .1 152.1 1.9 .3 167.7 3.3 .4Shelter ........................................................... 205.9 2.6 .5 181.0 2.7 .4 168.3 2.7 .4 185.9 3.9 .4
Rent of primary residence 2 ....................... 188.6 3.2 .3 171.5 3.0 .2 162.3 3.0 .2 177.6 4.2 .2Owners’ equivalent rent of primary
residence 2 3 ....................................... 214.0 2.7 .1 185.9 2.9 .2 169.5 2.9 .0 196.5 4.1 .3Fuels and utilities .......................................... 121.5 -2.3 -.1 122.0 -1.6 -.2 128.9 -1.2 -.1 137.0 1.3 -.4
Fuels ............................................................ 111.2 -3.2 -.2 105.2 -2.5 -.4 109.4 -2.0 -.1 124.2 .9 -.6Gas (piped) and electricity 2 .................... 128.4 -1.8 -.2 110.8 -2.3 -.4 111.7 -1.8 -.1 127.2 1.1 -.5
Electricity2 .............................................. 131.6 -3.2 .2 120.2 -2.4 .5 111.1 -1.8 .4 141.2 2.8 -.1Utility natural gas service 2 .................... 124.4 .9 -.7 102.0 -2.2 -1.5 116.0 -2.1 -2.4 110.1 -3.3 -1.6
Household furnishings and operations ..... 129.1 2.1 -.2 123.6 -2.1 -.8 127.2 .7 .2 127.2 1.1 .2
Apparel ............................................................ 125.6 -3.5 .3 127.2 -1.9 1.8 140.9 -.5 1.0 122.1 -.8 3.0
Transportation ................................................ 141.9 -2.1 -.4 138.5 -1.4 -.5 137.4 -1.6 -.4 142.2 -1.3 -.4Private transportation .................................. 136.5 -2.1 -.7 134.3 -1.5 -.7 135.7 -1.9 -.5 137.2 -1.7 -.6
New and used motor vehicles 4 ................. 99.4 -.3 -.5 100.2 .0 -.7 100.4 .0 -.7 99.2 -1.2 -.8New vehicles ............................................ 142.5 -.6 -.3 141.5 .0 -.4 147.6 -.1 -.3 142.3 -1.3 -.4
New cars and trucks 4 5 ......................... 99.2 -.5 -.2 100.2 .0 -.4 100.3 -.1 -.4 99.0 -1.4 -.4New cars 5 ............................................... 140.5 -.8 -.1 136.1 -.7 -.5 146.1 -.3 -.6 138.5 -1.2 -.4
Used cars and trucks ............................... 152.0 .5 -1.4 148.5 .3 -1.5 149.9 .5 -1.5 144.4 -1.2 -1.6Motor fuel .................................................... 81.6 -13.0 -2.2 82.8 -12.0 -2.4 81.4 -11.4 -1.2 89.4 -8.1 -1.1
Gasoline (all types) .................................. 81.2 -13.0 -2.2 82.4 -12.0 -2.4 80.9 -11.5 -1.2 88.6 -8.1 -1.1Gasoline, unleaded regular5 ................. 78.8 -14.0 -2.4 80.2 -12.6 -2.7 77.3 -12.3 -1.3 84.9 -9.2 -1.2Gasoline, unleaded midgrade 56 ......... 85.1 -12.2 -2.1 92.4 -11.5 -2.4 87.3 -10.9 -1.1 88.4 -5.5 -.9Gasoline, unleaded premium 5 ............. 84.2 -11.2 -2.0 87.9 -10.1 -1.8 86.1 -10.1 -1.1 92.3 -6.7 -.9
Medical care ................................................... 260.4 4.2 .2 243.0 5.0 .8 243.9 2.5 .4 245.7 2.8 .5Medical care commodities .......................... 235.0 5.5 .3 225.1 5.3 .7 219.3 2.6 .2 233.3 2.6 .4Medical care services .................................. 265.7 3.8 .2 247.4 4.9 .9 250.0 2.4 .4 248.6 2.9 .6
Professional services 2 ............................... 239.5 3.8 .2 227.1 5.3 .9 229.7 2.4 .3 210.6 1.9 .3
Recreation4 .................................................... 103.1 1.7 .3 101.4 1.2 .3 101.9 .7 -.4 100.9 1.2 .7
Education and communication 4 .................... 100.3 1.2 -.1 102.2 2.3 .0 100.7 .8 .1 100.4 .3 -.3
Other goods and services .............................. 260.2 6.9 -.6 250.2 9.8 -.2 247.9 10.2 .2 261.4 10.2 -.2
Commodity and service group
Allitems ............................................................. 171.6 1.5 .1 160.5 1.6 .1 160.0 1.4 .1 166.9 2.3 .3Commodities ................................................... 142.6 .4 -.3 140.9 .3 -.3 142.3 .6 -.1 143.3 .9 .1
Commodities less food and beverages ..... 127.5 -1.3 -.5 129.8 -1.1 -.5 131.6 -.4 -.2 128.9 -.3 .2Nondurables less food and beverages .... 128.4 -1.7 -.6 132.6 -.3 .0 134.2 .1 .1 131.9 1.1 .8
Nondurables less food, beverages, andapparel .............................................. 136.0 -.6 -1.1 139.0 .7 -.9 136.2 .4 -.4 141.7 2.0 -.3
Durables ..................................................... 126.2 -.7 -.2 125.4 -1.9 -.9 128.3 -1.0 -.4 125.2 -1.9 -.6Services ........................................................... 200.4 2.1 .4 181.3 2.6 .4 178.5 2.2 .3 188.3 3.1 .4
Rent of shelter3 ............................................ 215.0 2.6 .5 186.0 2.7 .4 173.0 2.7 .4 197.4 3.9 .5Transportation services ............................... 188.9 -.1 .1 188.8 1.2 .4 190.2 .6 .3 191.6 1.4 .3Other services .............................................. 234.0 2.9 .3 213.5 4.1 .4 218.3 3.0 .1 217.4 2.5 .3
See footnotes at end of table.
44Digitized for FRASER http://fraser.stlouisfed.org/ Federal Reserve Bank of St. Louis
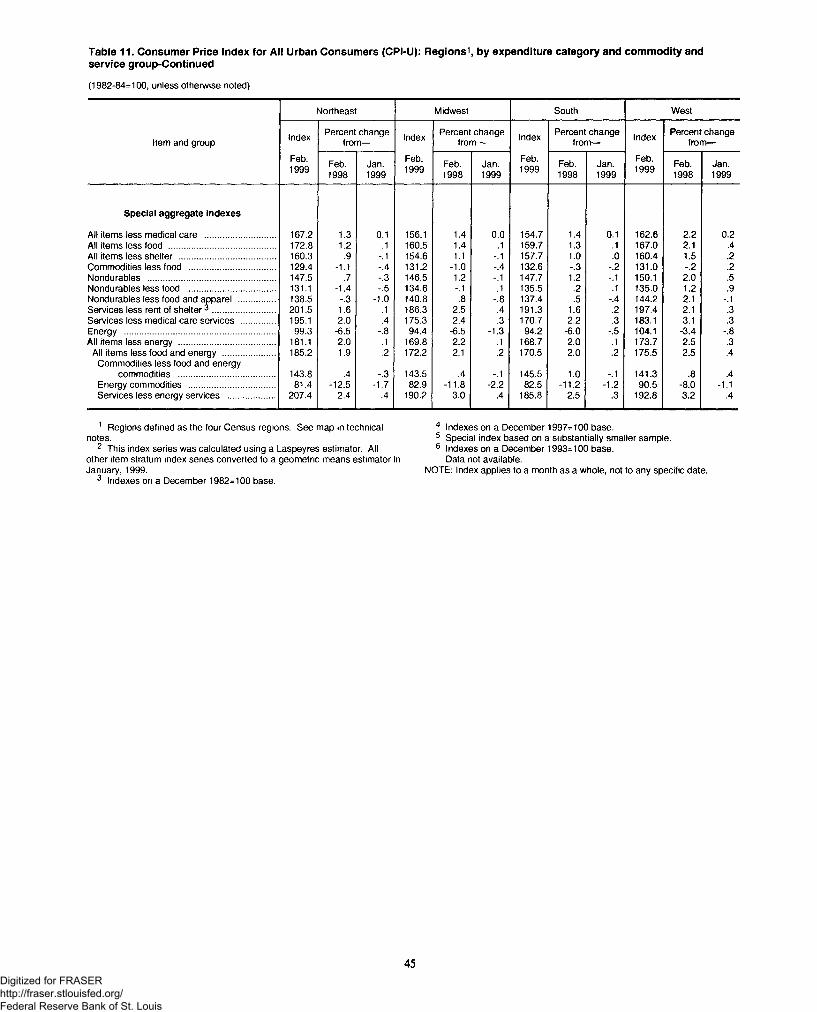
Table 11. Consumer Price Index for All Urban Consumers (CPI-U): Regions1, by expenditure category and commodity andservice group-Continued
(1982-84=100, unless otherwise noted)
Northeast Midwest South West
Item and group Index Percent change from— Index Percent change
from— Index Percent change from— Index Percent change
from—
Feb.1999 Feb.
1998Jan.1999
Feb.1999 Feb.
1998Jan.1999
Feb.1999 Feb.
1998Jan.1999
Feb.1999 Feb.
1998Jan.1999
Special aggregate indexes
All items less medical care ............................. 167.2 1.3 0.1.1
156.1 1.4 0.0 154.7 1.4 0.1 162.6 2.2 0.2All items less food ............................................ 172.8 1.2 160.5 1.4 .1 159.7 1.3 .1 167.0 2.1 .4All items less shelter ........................................ 160.3 .9 -.1 154.6 1.1 -.1 157.7 1.0 .0 160.4 1.5 .2Commodities less food .................................... 129.4 -1.1 -.4 131.2 -1.0 -.4 132.6 -.3 -.2 131.0 -.2 .2Nondurables ..................................................... 147.5 .7 -.3 146.5 1.2 -.1 147.7 1.2 -.1 150.1 2.0 .5Nondurables less food ..................................... 131.1 -1.4 -.5 134.6 -.1 .1 135.5 .2 .1 135.0 1.2 .9Nondurables less food and apparel ............... 138.5 -.3 -1.0 140.8 .8 -.8 137.4 .5 -.4 144.2 2.1 -.1Services less rent of shelter ^ .......................... 201.5 1.6 .1 186.3 2.5 .4 191.3 1.6 .2 197.4 2.1 .3Services less medical care services .............. 195.1 2.0 .4 175.3 2.4 .3 170.7 2.2 .3 183.1 3.1 .3Energy ............................................................... 99.3 -6.5 -.8 94.4 -6.5 -1.3 94.2 -6.0 -.5 104.1 -3.4 -.8All items less energy ........................................ 181.1 2.0 .1 169.8 2.2 .1 168.7 2.0 .1 173.7 2.5 .3
All items less food and energy ..................... 185.2 1.9 .2 172.2 2.1 .2 170.5 2.0 .2 175.5 2.5 .4Commodities less food and energy
commodities ........................................Energy commodities ....................................Services less energy services ....................
143.881.4
207.4
.4-12.5
2.4
-.3-1.7
.4
143.582.9
190.2
.4-11.8
3.0
-.1-2.2
.4
145.582.5
185.8
1.0-11.2
2.5
-.1-1.2
.3
141.390.5
192.8
.8-8.03.2
.4-1.1
.4
1 Regions defined as the four Census regions. See map in technical notes.
2 This index series was calculated using a Laspeyres estimator. All other item stratum index series converted to a geometric means estimator in January, 1999.
3 Indexes on a December 1982=100 base.
4 Indexes on a December 1997=100 base.5 Special index based on a substantially smaller sample.6 Indexes on a December 1993=100 base.' Data not available.
NOTE: Index applies to a month as a whole, not to any specific date.
45Digitized for FRASER http://fraser.stlouisfed.org/ Federal Reserve Bank of St. Louis
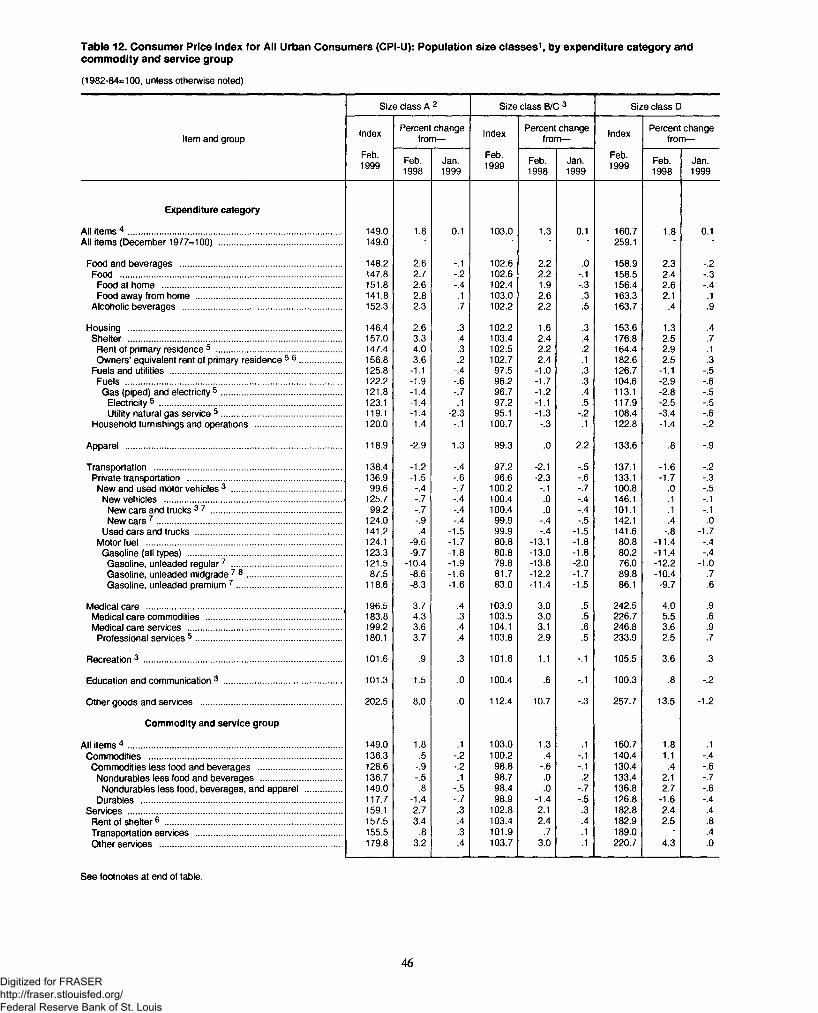
Table 12. Consumer Price Index for All Urban Consumers (CPI-U): Population size classes1, by expenditure category andcommodity and service group
(1982-84=100, unless otherwise noted)
Size class A 2 Size class B/C 3 Size class D
Item and group Index Percent change from— Index Percent change
from— Index Percent change from—
Feb.1999 Feb.
1998Jan.1999
Feb.1999 Feb.
1998Jan.1999
Feb.1999 Feb.
1998Jan.1999
Expenditure category
All items 4 ......................................................................................... 149.0 1.8 0.1 103.0 1.3 0.1 160.7 1.8 0.1All items (December 1977= 100) ................................................... 149.0 ■ ' ■ ■ 259.1 ■ ■
Food and beverages ................................................................... 148.2 2.6 -.1 102.6 2.2 .0 158.9 2.3 -.2Food ............................................................................................ 147.8 2.7 -.2 102.6 2.2 -.1 158.5 2.4 -.3
Food at home ........................................................................... 151.8 2.6 -.4 102.4 1.9 -.3 156.4 2.6 -.4Food away from home ............................................................. 141.8 2.8 .1 103.0 2.6 .3 163.3 2.1 .1
Alcoholic beverages .................................................................. 152.3 2.3 .7 102.2 2.2 .5 163.7 .4 .9
Housing ......................................................................................... 146.4 2.6 .3 102.2 1.6 .3 153.6 1.3 .4Shelter ......................................................................................... 157.0 3.3 .4 103.4 2.4 .4 176.8 2.5 .7
Rent of primary residence 5 .................................................... 147.4 4.0 .3 102.5 2.2 .2 164.4 2.9 .1Owners’ equivalent rent of primary residence 5 6 ................. 156.8 3.6 .2 102.7 2.4 .1 182.6 2.5 .3
Fuels and utilities ....................................................................... 125.8 -1.1 -.4 97.5 -1.0 .3 126.7 -1.1 -.5Fuels .......................................................................................... 122.2 -1.9 -.6 96.2 -1.7 .3 104.6 -2.9 -.6
Gas (piped) and electricity 5 .................................................. 121.8 -1.4 -.7 96.7 -1.2 .4 113.1 -2.8 -.5Electricity5 ............................................................................ 123.1 -1.4 .1 97.2 -1.1 .5 117.9 -2.5 -.5Utility natural gas service 5 .................................................. 119.1 -1.4 -2.3 95.1 -1.3 -.2 108.4 -3.4 -.6
Household furnishings and operations .................................... 120.0 1.4 -.1 100.7 -.3 .1 122.8 -1.4 -.2
Apparel .......................................................................................... 118.9 -2.9 1.3 99.3 .0 2.2 133.6 .8 -.9
Transportation .............................................................................. 138.4 -1.2 -.4 97.2 -2.1 -.5 137.1 -1.6 -.2Private transportation ................................................................ 136.9 -1.5 -.6 96.6 -2.3 -.6 133.1 -1.7 -.3
New and used motor vehicles 3 .............................................. 99.6 -.4 -.7 100.2 -.1 -.7 100.8 .0 -.5New vehicles .......................................................................... 125.7 -.7 -.4 100.4 .0 -.4 146.1 .1 -.1
New cars and trucks 3 7 ...................................................... 99.2 -.7 -.4 100.4 .0 -.4 101.1 .1 -.1New cars 7 ............................................................................. 124.0 -.9 -.4 99.9 -.4 -.5 142.1 .4 .0
Used cars and trucks ............................................................. 141.2 .4 -1.5 99.9 -.4 -1.5 141.6 -.8 -1.7Motor fuel ................................................................................. 124.1 -9.6 -1.7 80.8 -13.1 -1.8 80.8 -11.4 -.4
Gasoline (all types) ................................................................ 123.3 -9.7 -1.8 80.8 -13.0 -1.8 80.2 -11.4 -.4Gasoline, unleaded regular7 .............................................. 121.5 -10.4 -1.9 79.8 -13.8 -2.0 76.0 -12.2 -1.0Gasoline, unleaded midgrade 7 8 ....................................... 87.5 -8.6 -1.6 81.7 -12.2 -1.7 89.8 -10.4 .7Gasoline, unleaded premium 7 ............................................ 118.6 -8.3 -1.6 83.0 -11.4 -1.5 86.1 -9.7 .6
Medical care ................................................................................. 196.5 3.7 .4 103.9 3.0 .5 242.5 4.0 .9Medical care commodities ........................................................ 183.8 4.3 .3 103.5 3.0 .5 226.7 5.5 .6Medical care services ................................................................ 199.2 3.6 .4 104.1 3.1 .6 246.8 3.6 .9
Professional services 5 ............................................................. 180.1 3.7 .4 103.8 2.9 .5 233.9 2.5 .7
Recreation3 .................................................................................. 101.6 .9 .3 101.6 1.1 -.1 105.5 3.6 .3
Education and communication 3 ................................................. 101.3 1.5 .0 100.4 .6 -.1 100.3 .8 -.2
Other goods and services ........................................................... 202.5 8.0 .0 112.4 10.7 -.3 257.7 13.5 -1.2
Commodity and service group
All items 4 ......................................................................................... 149.0 1.8 .1 103.0 1.3 .1 160.7 1.8 .1Commodities ................................................................................ 136.3 .5 -.2 100.2 .4 -.1 140.4 1.1 -.4
Commodities less food and beverages ................................... 128.6 -.9 -.2 98.8 -.6 -.1 130.4 .4 -.6Nondurables less food and beverages .................................. 136.7 -.5 .1 98.7 .0 .2 133.4 2.1 -.7
Nondurables less food, beverages, and apparel ............... 149.0 .8 -.5 98.4 .0 -.7 136.8 2.7 -.6Durables .................................................................................... 117.7 -1.4 -.7 98.9 -1.4 -.5 126.8 -1.6 -.4
Services ......................................................................................... 159.1 2.7 .3 102.8 2.1 .3 182.8 2.4 .4Rent of shelter6 .......................................................................... 157.5 3.4 .4 103.4 2.4 .4 182.9 2.5 .8Transportation sen/ices ............................................................. 155.5 .8 .3 101.9 .7 .1 189.0 - .4Other services ............................................................................ 179.8 3.2 .4 103.7 3.0 .1 220.7 4.3 .0
See footnotes at end of table.
46Digitized for FRASER http://fraser.stlouisfed.org/ Federal Reserve Bank of St. Louis
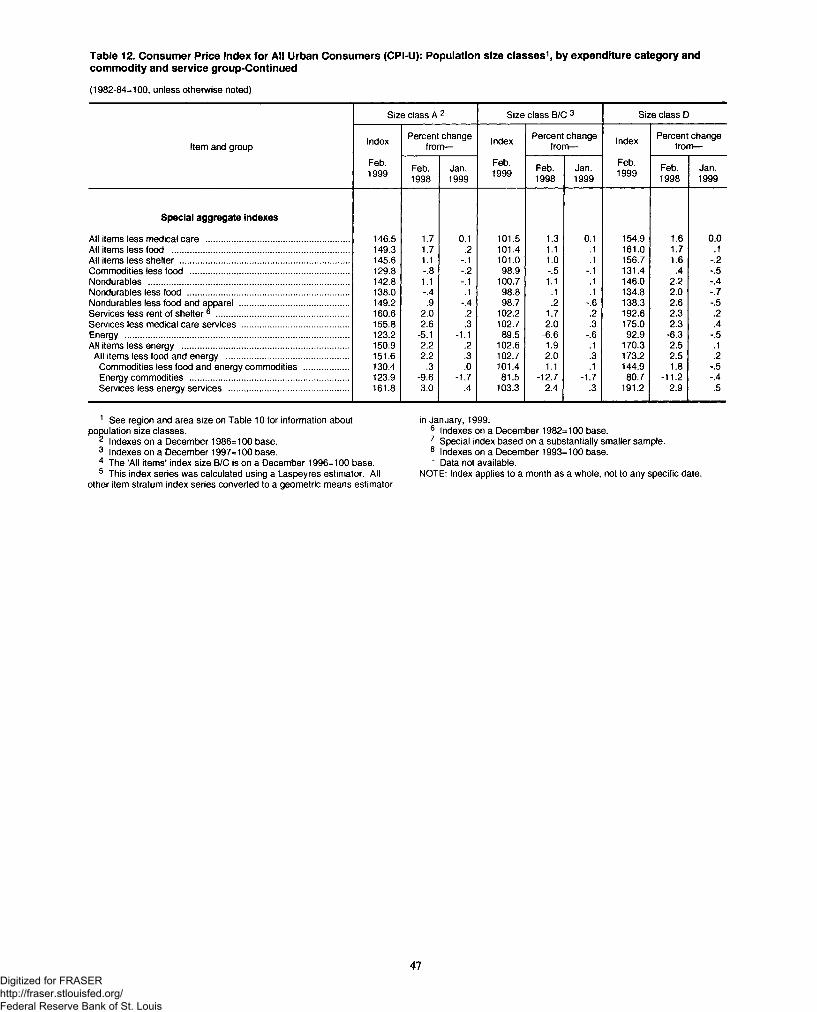
Table 12. Consumer Price Index for All Urban Consumers (CPI-U): Population size classes1, by expenditure category andcommodity and service group-Continued
(1982-84=100, unless otherwise noted)
Size class A 2 Size class B/C 3 Size class D
Item and group Index Percent change from— Index Percent change
from— Index Percent change from—
Feb.1999 Feb.
1998Jan.1999
Feb.1999 Feb.
1998Jan.1999
Feb.1999 Feb.
1998Jan.1999
Special aggregate indexes
All items less medical care ............................................................ 146.5 1.7 0.1 101.5 1.3 0.1 154.9 1.6 0.0All items less food .......................................................................... 149.3 1.7 .2 101.4 1.1 161.0 1.7 .1All items less shelter ....................................................................... 145.6 1.1 -.1 101.0 1.0 156.7 1.6 -.2Commodities less food .................................................................. 129.8 -.8 -.2 98.9 -.5 -.1 131.4 .4 -.5Nondurables .................................................................................... 142.8 1.1 -.1 100.7 1.1 146.0 2.2 -.4Nondurables less food ................................................................... 138.0 -.4 .1 98.8 .1 134.8 2.0 -.7Nondurables less food and apparel ..............................................Services less rent of shelter ® .......................................................
149.2 .9 -.4 98.7 .2 -’6 138.3 2.6 -.5160.6 2.0 .2 102.2 1.7 .2 192.6 2.3 .2
Services less medical care services ............................................ 155.8 2.6 .3 102.7 2.0 .3 175.0 2.3 .4Energy ............................................................................................. 123.2 -5.1 -1.1 89.5 -6.6 -.6 92.9 -6.3 -.5All items less energy ..................................................................... 150.9 2.2 .2 102.6 1.9 .1 170.3 2.5 .1
All items less food and energy ................................................... 151.6 2.2 .3 102.7 2.0 .3 173.2 2.5 .2Commodities less food and energy commodities ................... 130.4 .3 .0 101.4 1.1 .1 144.9 1.8 -.5Energy commodities .................................................................. 123.9 -9.6 -1.7 81.5 -12.7 -1.7 80.7 -11.2 -.4Services less energy services .................................................. 161.8 3.0 .4 103.3 2.4 .3 191.2 2.9 .5
1 See region and area size on Table 10 for information about population size classes.
2 Indexes on a December 1986=100 base.3 Indexes on a December 1997=100 base.4 The ’All items’ index size B/C is on a December 1996=100 base.5 This index series was calculated using a Laspeyres estimator. All
other item stratum index series converted to a geometric means estimator
in January, 1999.6 Indexes on a December 1982=100 base.7 Special index based on a substantially smaller sample.8 Indexes on a December 1993=100 base.* Data not available.
NOTE: Index applies to a month as a whole, not to any specific date.
47Digitized for FRASER http://fraser.stlouisfed.org/ Federal Reserve Bank of St. Louis
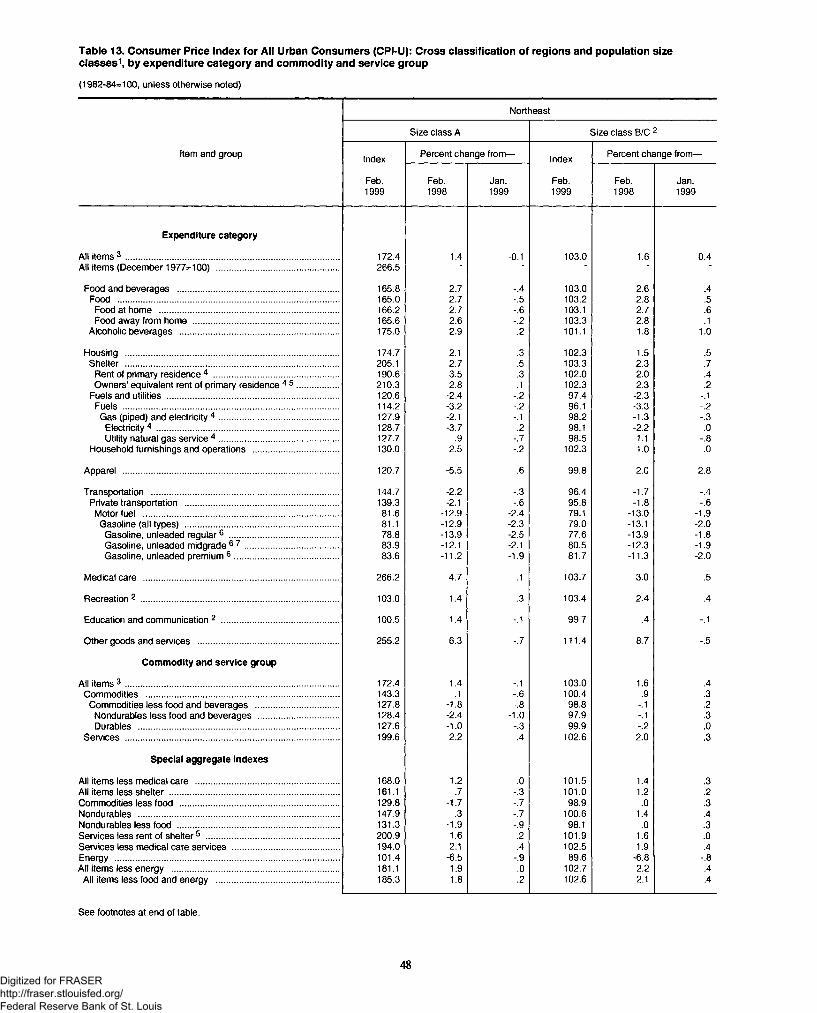
Table 13. Consumer Price Index for All Urban Consumers (CPI-U): Cross classification of regions and population sizeclasses1, by expenditure category and commodity and service group
(1982-84=100, unless otherwise noted)
Northeast
Size class A Size class B /C :2
Item and group Index Percent change from— Index Percent change from—
Feb.1999
Feb.1998
Jan.1999
Feb.1999
Feb.1998
Jan.1999
Expenditure category
All items 3 ......................................................................................... 172.4 1.4 -0.1 103.0 1.6 0.4All items (December 1977=100) ................................................... 266.5 " ' " ~
Food and beverages ................................................................... 165.8 2.7 -.4 103.0 2.6 .4Food ............................................................................................ 165.0 2.7 -.5 103.2 2.8 .5
Food at home ........................................................................... 166.2 2.7 -.6 103.1 2.7 .6Food away from home ............................................................. 165.6 2.6 -.2 103.3 2.8 .1
Alcoholic beverages .............................................................. 175.0 2.9 .2 101.1 1.8 1.0
Housing ......................................................................................... 174.7 2.1 .3 102.3 1.5 .5Shelter ......................................................................................... 205.1 2.7 .5 103.3 2.3 .7
Rent of primary residence 4 .................................................... 190.6 3.5 .3 102.0 2.0 .4Owners’ equivalent rent of primary residence 4 5 ................. 210.3 2.8 .1 102.3 2.3 .2
Fuels and utilities ........................................................................ 120.6 -2.4 -.2 97.4 -2.3 -.1Fuels .......................................................................................... 114.2 -3.2 -.2 96.1 -3.3 -.2
Gas (piped) and electricity 4 .................................................. 127.9 -2.1 -.1 98.2 -1.3 -.3Electricity4 ............................................................................ 128.7 -3.7 .2 98.1 -2.2 .0Utility natural gas service 4 .................................................. 127.7 .9 -.7 98.5 1.1 -.8
Household furnishings and operations .................................... 130.0 2.5 -.2 102.3 1.0 .0
Apparel .......................................................................................... 120.7 -5.5 -.6 99.8 2.0 2.8
Transportation .............................................................................. 144.7 -2.2 -.3 96.4 -1.7 -.4Private transportation ................................................................ 139.3 -2.1 -.6 95.8 -1.8 -.6Motor fuel ................................................................................. 81.6 -12.9 -2.4 79.1 -13.0 -1.9
Gasoline (all types) ................................................................ 81.1 -12.9 -2.3 79.0 -13.1 -2.0Gasoline, unleaded regular6 ............................................. 78.8 -13.9 -2.5 77.6 -13.9 -1.8Gasoline, unleaded midgrade 6 7 ....................................... 83.9 -12.1 -2.1 80.5 -12.3 -1.9Gasoline, unleaded premium 6 ........................................... 83.6 -11.2 -1.9 81.7 -11.3 -2.0
Medical care ................................................................................. 266.2 4.7 .1 103.7 3.0 .5
Recreation 2 .................................................................................. 103.0 1.4 .3 103.4 2.4 .4
Education and communication 2 ................................................. 100.5 1.4 -.1 99.7 .4 -.1
Other goods and services ........................................................... 255.2 6.3 -.7 111.4 8.7 -.5
Commodity and service group
All items 3 ......................................................................................... 172.4 1.4 -.1 103.0 1.6 .4Commodities ................................................................................ 143.3 .1 -.6 100.4 .9 .3
Commodities less food and beverages ................................... 127.8 -1.8 -.8 98.8 -.1 .2Nondurables less food and beverages .................................. 128.4 -2.4 -1.0 97.9 -.1 .3Durables .................................................................................... 127.6 -1.0 -.3 99.9 -.2 .0
Services ......................................................................................... 199.6 2.2 .4 102.6 2.0 .3
Special aggregate indexes
All items less medical care ............................................................ 168.0 1.2 .0 101.5 1.4 .3All items less shelter ....................................................................... 161.1 .7 -.3 101.0 1.2 .2Commodities less food .................................................................. 129.8 -1.7 -.7 98.9 .0 .3Nondurables .................................................................................... 147.9 .3 -.7 100.6 1.4 .4Nondurables less food ................................................................... 131.3 -1.9 -.9 98.1 .0 .3Services less rent of shelter5 ....................................................... 200.9 1.6 .2 101.9 1.6 .0Services less medical care services ............................................. 194.0 2.1 .4 102.5 1.9 .4Energy ............................................................................................. 101.4 -6.5 -.9 89.6 -6.8 -.8All items less energy ...................................................................... 181.1 1.9 .0 102.7 2.2 .4
All items less food and energy ................................................... 185.3 1.8 .2 102.6 2.1 .4
See footnotes at end of table.
48Digitized for FRASER http://fraser.stlouisfed.org/ Federal Reserve Bank of St. Louis

Table 13. Consumer Price Index for All Urban Consumers (CPI-U): Cross classification of regions and population sizeclasses1, by expenditure category and commodity and service group-Continued
(1982-84=100, unless otherwise noted)
Midwest
Size class A Size class B/C 2 Size class D
Item and group Index Percent change from—
Index Percent change from— Index Percent change
from—
Feb.1999 Feb.
1998Jan.1999
Feb.1999 Feb.
1998Jan.1999
Feb.1999 Feb.
1998Jan.1999
Expenditure category
All items 3 ......................................................................................... 161.8 1.8 0.1 102.6 1.0 0.0 155.6 1.9 0.1All items (December 1977-100) ................................................... 267.2 249.4
Food and beverages ................................................................... 163.8 3.0 -.2 102.7 2.1 -.2 153.4 1.5 .3Food ............................................................................................ 163.4 3.1 -.2 102.6 2.0 -.2 152.4 1.5 .2
Food at home ........................................................................... 164.1 3.3 -.5 102.3 1.6 -.6 149.0 1.5 .1Food away from home ............................................................. 162.5 2.7 .2 103.2 2.8 .4 159.4 1.6 .5
Alcoholic beverages .................................................................. 168.0 2.7 .4 103.8 3.3 .5 167.6 .3 .9
Housing ......................................................................................... 157.1 1.7 .1 101.9 1.2 .2 147.6 1.0 .3Shelter ......................................................................................... 183.1 2.8 .4 103.2 2.4 .3 166.2 3.2 .7
Rent of primary residence 4 .................................................... 176.2 3.5 .2 102.2 2.0 .1 155.3 2.8 .4Owners’ equivalent rent of primary residence 4 5 ................. 188.2 3.2 .3 102.4 2.0 .1 173.6 2.9 .4
Fuels and utilities ........................................................................ 118.6 -2.1 -.8 98.1 -.3 .7 128.4 -3.5 -.7Fuels .......................................................................................... 104.3 -3.1 -.9 97.1 -.8 .7 99.4 -5.2 -1.2Gas (piped) and electricity 4 .................................................. 107.5 -2.9 -.9 97.5 -.5 .7 107.7 -5.1 -1.2
Electricity4 ............................................................................ 117.1 -3.3 .3 100.2 .1 1.2 105.4 -5.7 -.9Utility natural gas service 4 .................................................. 98.2 -2.3 -2.4 93.6 -1.4 .1 113.2 -4.2 -1.5
Household furnishings and operations .................................... 118.9 -1.3 -1.1 99.8 -2.5 -.6 118.5 -3.7 -.3
Apparel .......................................................................................... 123.8 -1.6 2.7 97.4 -4.7 .9 147.6 6.4 -.3
Transportation .............................................................................. 140.7 -.6 -.3 97.5 -2.4 -.9 131.3 -2.5 -.5Private transportation ................................................................ 137.3 -.9 -.5 97.1 -2.5 -.9 125.2 -2.4 -.5Motor fuel .................................................................................. 84.9 -10.2 -1.6 82.3 -14.2 -3.7 77.9 -12.8 -1.0
Gasoline (all types) ................................................................ 84.4 -10.1 -1.6 82.3 -14.2 -3.7 77.0 -12.8 -1.2Gasoline, unleaded regular6 .............................................. 82.7 -10.6 -1.8 81.5 -14.8 -3.9 73.5 -13.9 -2.3Gasoline, unleaded midgrade 6 7 ....................................... 92.7 -9.6 -1.4 83.0 -13.6 -3.9 91.4 -11.5 1.2Gasoline, unleaded premium 6 ............................................ 88.1 -8.7 -1.2 85.0 -12.1 -3.1 84.0 -9.1 1.7
Medical care .................................................................................. 242.2 6.0 .6 104.4 3.3 1.2 235.8 5.7 .9
Recreation 2 ................................................................................... 101.0 .2 .2 101.6 2.4 .5 103.5 3.2 .0
Education and communication 2 ................................................. 103.3 2.9 .1 101.2 1.9 -.2 98.2 -.7 -.5
Other goods and services ........................................................... 254.1 8.6 -.1 112.6 10.5 -.1 244.6 14.8 -1.3
Commodity and service group
All items 3 ......................................................................................... 161.8 1.8 .1 102.6 1.0 .0 155.6 1.9 .1Commodities ................................................................................. 142.3 .6 -.2 99.6 -.6 -.5 140.4 1.3 -.4
Commodities less food and beverages ................................... 129.7 -.8 -.2 98.0 -2.0 -.6 133.2 1.2 -.7Nondurables less food and beverages .................................. 133.6 .0 .6 98.1 -1.9 -.6 139.4 4.2 -.9Durables .................................................................................... 122.9 -1.5 -1.0 97.8 -2.3 -.8 125.0 -2.7 -.6
Sen/ices ......................................................................................... 181.8 2.7 .3 103.2 2.4 .4 172.1 2.4 .3
Special aggregate indexes
All items less medical care ............................................................ 157.8 1.6 .1 101.3 .8 -.1 149.9 1.6 -.1All items less shelter ....................................................................... 155.5 1.4 .0 101.0 .6 -.1 152.9 1.5 -.2Commodities less food .................................................................. 131.4 -.6 -.2 98.2 -1.8 -.6 134.2 1.1 -.7Nondurables .................................................................................... 148.9 1.6 .2 100.4 .1 -.3 146.9 2.9 -.3Nondurables less food ................................................................... 135.8 .1 .6 98.4 -1.6 -.5 141.0 4.1 -.8Services less rent of shelter5 ........................................................ 186.7 2.6 .3 103.3 2.5 .6 181.1 1.9 .1Services less medical care services ............................................. 176.4 2.5 .3 103.0 2.3 .3 163.9 2.0 .3Energy ............................................................................................. 95.6 -5.9 -1.1 90.3 -6.9 -1.2 88.8 -8.3 -1.1All items less energy ...................................................................... 170.7 2.3 .2 102.5 1.7 .1 165.1 2.7 .1
All items less food and energy ................................................... 172.6 2.3 .3 102.5 1.6 .2 168.0 3.1 .1
See footnotes at end of table.
49Digitized for FRASER http://fraser.stlouisfed.org/ Federal Reserve Bank of St. Louis
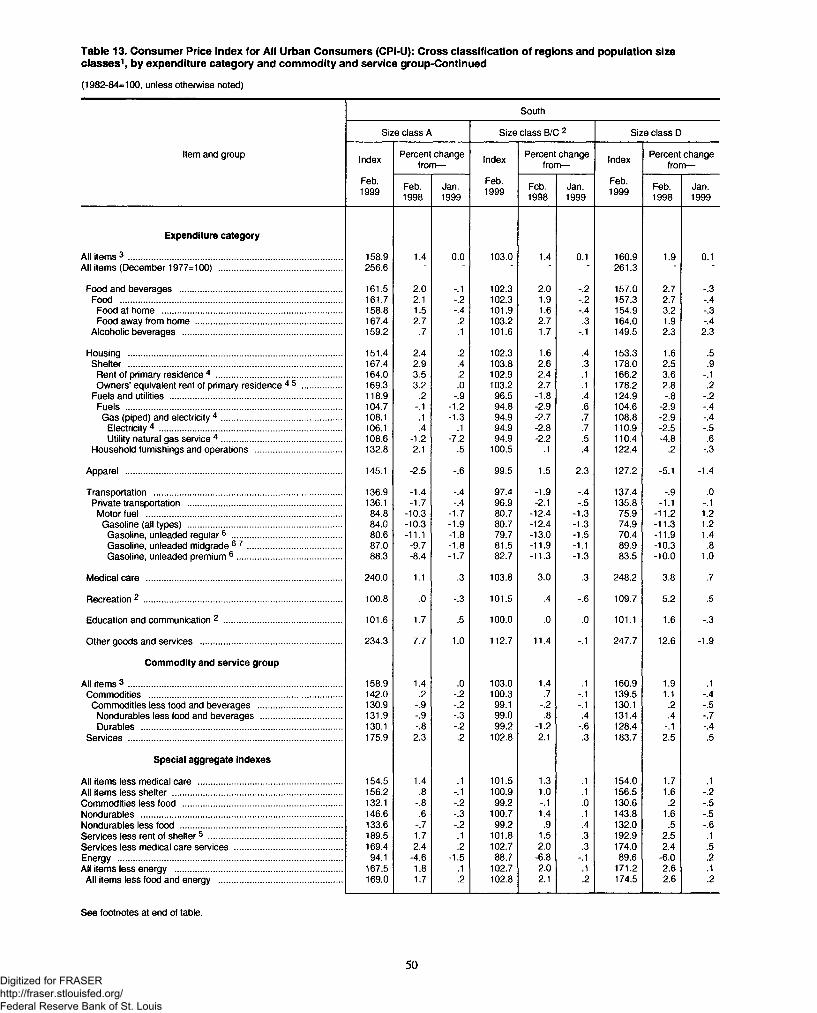
Table 13. Consumer Price Index for All Urban Consumers (CPI-U): Cross classification of regions and population sizeclasses1, by expenditure category and commodity and service group-Continued
(1982-84=100, unless otherwise noted)
South
Size class A Size class B/C 2 Size class D
Item and group Index Percent change from— Index Percent change
from— Index Percent change from—
Feb.1999 Feb.
1998Jan.1999
Feb.1999 Feb.
1998Jan.1999
Feb.1999 Feb.
1998Jan.1999
Expenditure category
All items 3 ......................................................................................... 158.9 1.4 0.0 103.0 1.4 0.1 160.9 1.9 0.1All items (December 1977=100) ................................................... 256.6 ■ ■ ■ ■ - 261.3 ■ ■
Food and beverages ................................................................... 161.5 2.0 -.1 102.3 2.0 -.2 157.0 2.7 -.3Food ............................................................................................ 161.7 2.1 -.2 102.3 1.9 -.2 157.3 2.7 -.4
Food at home ........................................................................... 158.8 1.5 -.4 101.9 1.6 -.4 154.9 3.2 -.3Food away from home ............................................................. 167.4 2.7 .2 103.2 2.7 .3 164.0 1.9 -.4
Alcoholic beverages .................................................................. 159.2 .7 .1 101.6 1.7 -.1 149.5 2.3 2.3
Housing ......................................................................................... 151.4 2.4 .2 102.3 1.6 .4 153.3 1.6 .5Shelter ......................................................................................... 167.4 2.9 .4 103.8 2.6 .3 178.0 2.5 .9
Rent of primary residence 4 .................................................... 164.0 3.5 .2 102.9 2.4 .1 166.2 3.6 -.1Owners’ equivalent rent of primary residence 4 5 ................. 169.3 3.2 .0 103.2 2.7 .1 178.2 2.8 .2
Fuels and utilities ........................................................................ 118.9 .2 -.9 96.5 -1.8 .4 124.9 -.8 -.2Fuels .......................................................................................... 104.7 -.1 -1.2 94.8 -2.9 .6 104.6 -2.9 -.4Gas (piped) and electricity 4 .................................................. 108.1 .1 -1.3 94.9 -2.7 .7 108.8 -2.9 -.4
Electricity4 ............................................................................ 106.1 .4 .1 94.9 -2.8 .7 110.9 -2.5 -.5Utility natural gas service 4 .................................................. 108.6 -1.2 -7.2 94.9 -2.2 .5 110.4 -4.8 .6
Household furnishings and operations .................................... 132.8 2.1 .5 100.5 .1 .4 122.4 .2 -.3
Apparel .......................................................................................... 145.1 -2.5 -.6 99.5 1.5 2.3 127.2 -5.1 -1.4
Transportation .............................................................................. 136.9 -1.4 -.4 97.4 -1.9 -.4 137.4 -.9 .0Private transportation ................................................................ 136.1 -1.7 -.4 96.9 -2.1 -.5 135.8 -1.1 -.1
Motor fuel ................................................................................. 84.8 -10.3 -1.7 80.7 -12.4 -1.3 75.9 -11.2 1.2Gasoline (all types) ................................................................ 84.0 -10.3 -1.9 80.7 -12.4 -1.3 74.9 -11.3 1.2
Gasoline, unleaded regular6 .............................................. 80.6 -11.1 -1.8 79.7 -13.0 -1.5 70.4 -11.9 1.4Gasoline, unleaded midgrade 6 7 ....................................... 87.0 -9.7 -1.8 81.5 -11.9 -1.1 89.9 -10.3 .8Gasoline, unleaded premium 6 ............................................ 88.3 -8.4 -1.7 82.7 -11.3 -1.3 83.5 -10.0 1.0
Medical care ................................................................................. 240.0 1.1 .3 103.8 3.0 .3 248.2 3.8 .7
Recreation 2 ................................................................................... 100.8 .0 -.3 101.5 .4 -.6 109.7 5.2 .5
Education and communication 2 ................................................. 101.6 1.7 .5 100.0 .0 .0 101.1 1.6 -.3
Other goods and sen/ices ........................................................... 234.3 7.7 1.0 112.7 11.4 -.1 247.7 12.6 -1.9
Commodity and service group
All items 3 ......................................................................................... 158.9 1.4 .0 103.0 1.4 .1 160.9 1.9 .1Commodities ................................................................................ 142.0 .2 -.2 100.3 .7 -.1 139.5 1.1 -.4
Commodities less food and beverages ................................... 130.9 -.9 -.2 99.1 -.2 -.1 130.1 .2 -.5Nondurables less food and beverages .................................. 131.9 -.9 -.3 99.0 .8 .4 131.4 .4 -.7Durables .................................................................................... 130.1 -.8 -.2 99.2 -1.2 -.6 128.4 -.1 -.4
Services ......................................................................................... 175.9 2.3 .2 102.8 2.1 .3 183.7 2.5 .5
Special aggregate indexes
All items less medical care ............................................................ 154.5 1.4 .1 101.5 1.3 .1 154.0 1.7 .1All items less shelter ....................................................................... 156.2 .8 -.1 100.9 1.0 .1 156.5 1.6 -.2Commodities less food .................................................................. 132.1 -.8 -.2 99.2 -.1 .0 130.6 .2 -.5Nondurables .................................................................................... 146.6 .6 -.3 100.7 1.4 .1 143.8 1.6 -.5Nondurables less food .................................................................... 133.6 -.7 -.2 99.2 .9 .4 132.0 .5 -.6Services less rent of shelter5 ........................................................ 189.5 1.7 .1 101.8 1.5 .3 192.9 2.5 .1Services less medical care services ............................................. 169.4 2.4 .2 102.7 2.0 .3 174.0 2.4 .5Energy .............................................................................................. 94.1 -4.6 -1.5 88.7 -6.8 -.1 89.6 -6.0 .2AH items less energy ...................................................................... 167.5 1.8 .1 102.7 2.0 .1 171.2 2.6 .1
All items less food and energy ................................................... 169.0 1.7 .2 102.8 2.1 .2 174.5 2.6 .2
See footnotes at end of table.
50Digitized for FRASER http://fraser.stlouisfed.org/ Federal Reserve Bank of St. Louis
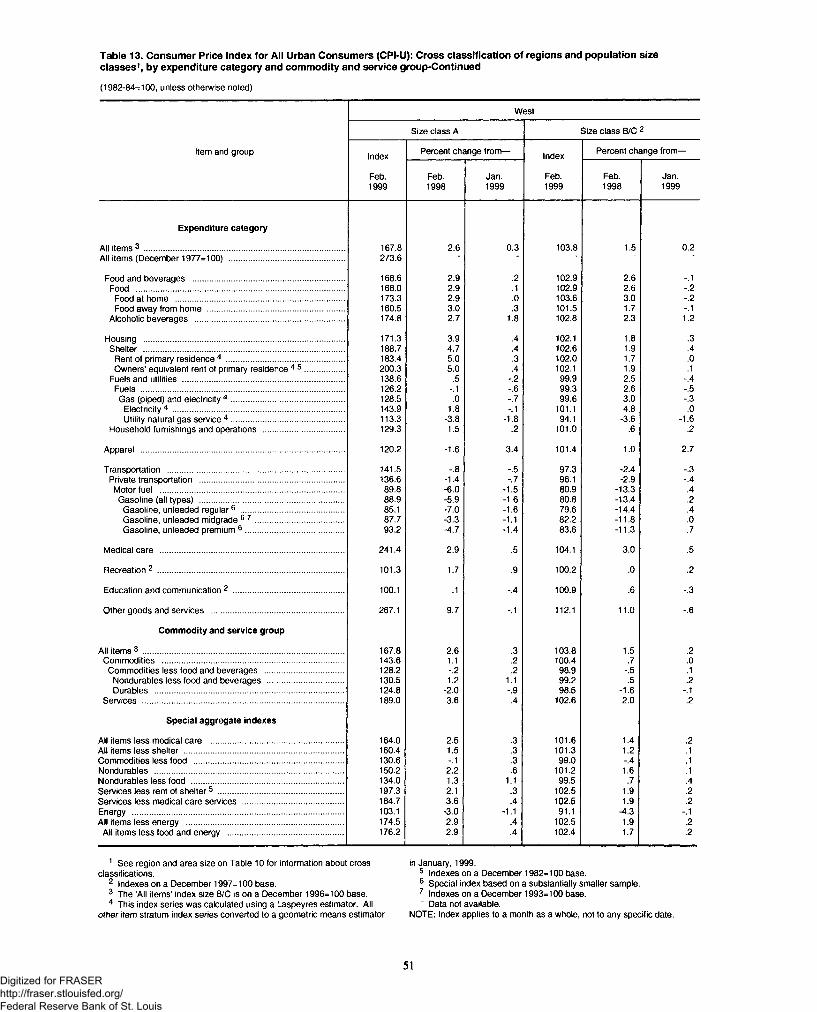
Table 13. Consumer Price Index for All Urban Consumers (CPI-U): Cross classification of regions and population sizeclasses1, by expenditure category and commodity and service group-Continued
(1982-84=100, unless otherwise noted)
West
Size class A Size class B/C 2
Item and group Index Percent change from— Index Percent change from—
Feb.1999
Feb.1998
Jan.1999
Feb.1999
Feb.1998
Jan.1999
Expenditure category
All items 3 .................................................................................... 167.8 2.6 0.3 103.8 1.5 0.2All items (December 1977=100) ................................................ 273.6 ' ' '
Food and beverages ............................................................... 168.6 2.9 .2 102.9 2.6 -.1Food ....................................................................................... 168.0 2.9 .1 102.9 2.6 -.2Food at home ...................................................................... 173.3 2.9 .0 103.6 3.0 -.2Food away from home ......................................................... 160.5 3.0 .3 101.5 1.7 -.1
Alcoholic beverages .............................................................. 174.8 2.7 1.8 102.8 2.3 1.2
Housing .................................................................................... 171.3 3.9 .4 102.1 1.8 .3Shelter .................................................................................... 188.7 4.7 .4 102.6 1.9 .4
Rent of primary residence 4 ................................................. 183.4 5.0 .3 102.0 1.7 .0Owners’ equivalent rent of primary residence 4 5 ................ 200.3 5.0 .4 102.1 1.9 .1
Fuels and utilities ................................................................... 138.6 .5 -.2 99.9 2.5 -.4Fuels ..................................................................................... 126.2 -.1 -.6 99.3 2.6 -.5Gas (piped) and electricity 4 ............................................... 128.5 .0 -.7 99.6 3.0 -.3
Electricity4 ........................................................................ 143.9 1.8 -.1 101.1 4.8 .0Utility natural gas service 4 ............................................... 113.3 -3.8 -1.8 94.1 -3.6 -1.6
Household furnishings and operations .................................. 129.3 1.5 .2 101.0 .6 .2
Apparel ..................................................................................... 120.2 -1.6 3.4 101.4 1.0 2.7
Transportation .......................................................................... 141.5 -.8 -.5 97.3 -2.4 -.3Private transportation ............................................................ 136.6 -1.4 -.7 96.1 -2.9 -.4Motor fuel ............................................................................. 89.8 -6.0 -1.5 80.9 -13.3 .4Gasoline (all types) ............................................................ 88.9 -5.9 -1.6 80.8 -13.4 .2
Gasoline, unleaded regular6 ........................................... 85.1 -7.0 -1.6 79.6 -14.4 .4Gasoline, unleaded midgrade 6 7 ..................................... 87.7 -3.3 -1.1 82.2 -11.8 .0Gasoline, unleaded premium 6 ......................................... 93.2 -4.7 -1.4 83.6 -11.3 .7
Medical care ............................................................................. 241.4 2.9 .5 104.1 3.0 .5
Recreation 2 .............................................................................. 101.3 1.7 .9 100.2 .0 .2
Education and communication 2 .............................................. 100.1 .1 -.4 100.9 .6 -.3
Other goods and services ....................................................... 267.1 9.7 -.1 112.1 11.0 -.6
Commodity and service group
All items 3 .................................................................................... 167.8 2.6 .3 103.8 1.5 .2Commodities ............................................................................ 143.6 1.1 .2 100.4 .7 .0Commodities less food and beverages ................................. 128.2 -.2 .2 98.9 -.5 .1
Nondurables less food and beverages ................................ 130.5 1.2 1.1 99.2 .5 .2Durables ............................................................................... 124.8 -2.0 -.9 98.5 -1.6 -.1
Services .................................................................................... 189.0 3.6 .4 102.6 2.0 .2
Special aggregate indexes
All items less medical care ........................................................ 164.0 2.5 .3 101.6 1.4 .2All items less shelter .................................................................. 160.4 1.5 .3 101.3 1.2 .1Commodities less food .............................................................. 130.6 -.1 .3 99.0 -.4 .1Nondurables ............................................................................... 150.2 2.2 .6 101.2 1.6 .1Nondurables less food ............................................................... 134.0 1.3 1.1 99.5 .7 .4Services less rent of shelter5 .................................................... 197.3 2.1 .3 102.5 1.9 .2Services less medical care services .......................................... 184.7 3.6 .4 102.5 1.9 .2Energy ........................................................................................ 103.1 -3.0 -1.1 91.1 -4.3 -.1All items less energy ................................................................. 174.5 2.9 .4 102.5 1.9 .2
All items less food and energy ................................................ 176.2 2.9 .4 102.4 1.7 .2
1 See region and area size on Table 10 for information about cross classifications.
2 Indexes on a December 1997=100 base.3 The ’All items’ index size B/C is on a December 1996=100 base.4 This index series was calculated using a Laspeyres estimator. All
other item stratum index series converted to a geometric means estimator
in January, 1999.5 Indexes on a December 1982=100 base.6 Special index based on a substantially smaller sample.7 Indexes on a December 1993=100 base.' Data not available.
NOTE: Index applies to a month as a whole, not to any specific date.
51Digitized for FRASER http://fraser.stlouisfed.org/ Federal Reserve Bank of St. Louis
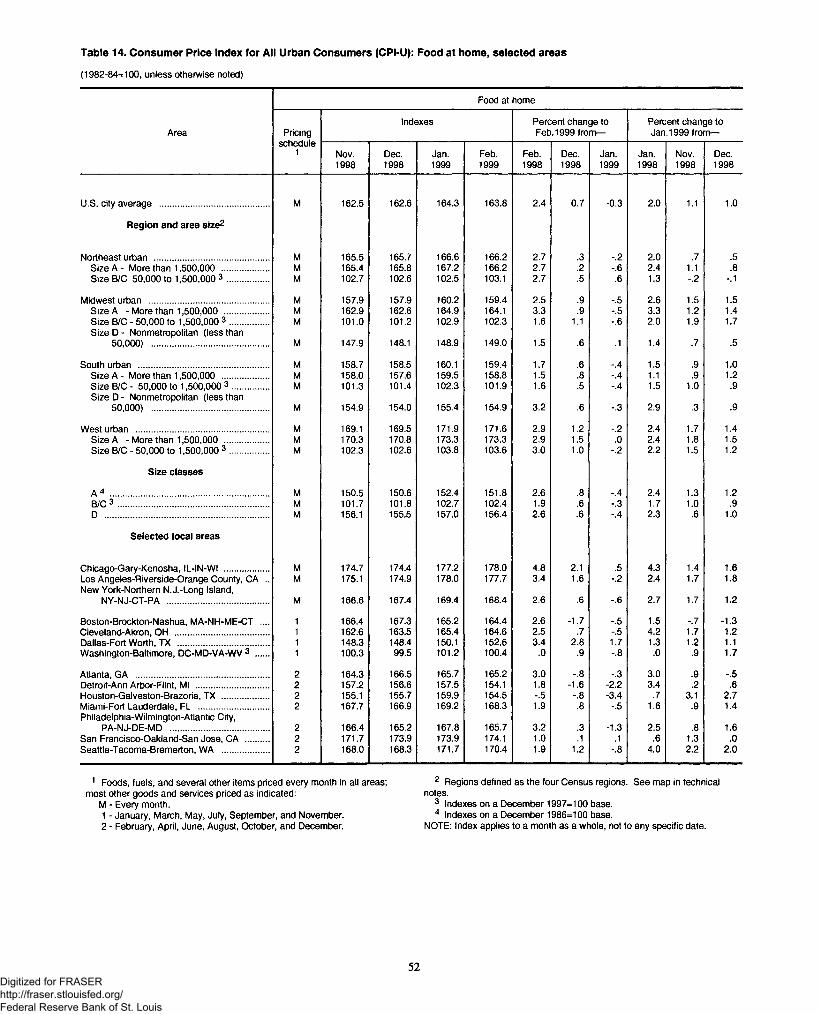
Table 14. Consumer Price Index for All Urban Consumers (CPI-U): Food at home, selected areas
(1982-84=100, unless otherwise noted)
Food at home
Area Pricingschedule
1
Indexes Percent change to Feb. 1999 from—
Percent change to Jan. 1999 from—
Nov.1998
Dec.1998
Jan.1999
Feb.1999
Feb.1998
Dec.1998
Jan.1999
Jan.1998
Nov.1998
Dec.1998
U.S. city average .............................................. M 162.5 162.6 164.3 163.8 2.4 0.7 -0.3 2.0 1.1 1.0
Region and area size2
Northeast urban ................................................ M 165.5 165.7 166.6 166.2 2.7 .3 -.2 2.0 .7 .5Size A - More than 1,500,000 .................... M 165.4 165.8 167.2 166.2 2.7 .2 -.6 2.4 1.1 .8Size B/C 50,000 to 1,500,000 3 ................. M 102.7 102.6 102.5 103.1 2.7 .5 .6 1.3 -.2 -.1
Midwest urban .................................................. M 157.9 157.9 160.2 159.4 2.5 .9 -.5 2.6 1.5 1.5Size A - More than 1,500,000 ................... M 162.9 162.6 164.9 164.1 3.3 .9 -.5 3.3 1.2 1.4Size B/C - 50,000 to 1,500,000 3 ................ M 101.0 101.2 102.9 102.3 1.6 1.1 -.6 2.0 1.9 1.7Size D - Nonmetropolitan (less than
50,000) ................................................. M 147.9 148.1 148.9 149.0 1.5 .6 .1 1.4 .7 .5
South urban ...................................................... M 158.7 158.5 160.1 159.4 1.7 .6 -.4 1.5 .9 1.0Size A - More than 1,500,000 ................... M 158.0 157.6 159.5 158.8 1.5 .8 -.4 1.1 .9 1.2Size B/C - 50,000 to 1,500,000 3 ............... M 101.3 101.4 102.3 101.9 1.6 .5 -.4 1.5 1.0 .9Size D - Nonmetropolitan (less than
50,000) ................................................. M 154.9 154.0 155.4 154.9 3.2 .6 -.3 2.9 .3 .9
West urban ....................................................... M 169.1 169.5 171.9 171.6 2.9 1.2 -.2 2.4 1.7 1.4Size A - More than 1,500,000 .................. M 170.3 170.8 173.3 173.3 2.9 1.5 .0 2.4 1.8 1.5Size B/C - 50,000 to 1,500,000 3 ................ M 102.3 102.6 103.8 103.6 3.0 1.0 -.2 2.2 1.5 1.2
Size classes
A 4 .................................................................. M 150.5 150.6 152.4 151.8 2.6 .8 -.4 2.4 1.3 1.2B/C 3 ............................................................... M 101.7 101.8 102.7 102.4 1.9 .6 -.3 1.7 1.0 .9D .................................................................... M 156.1 155.5 157.0 156.4 2.6 .6 -.4 2.3 .6 1.0
Selected local areas
Chicago-Gary-Kenosha, IL-IN-WI .................. M 174.7 174.4 177.2 178.0 4.8 2.1 .5 4.3 1.4 1.6Los Angeles-Riverside-Orange County, CA .. M 175.1 174.9 178.0 177.7 3.4 1.6 -.2 2.4 1.7 1.8New York-Northern N.J.-Long Island,
NY-NJ-CT-PA .......................................... M 166.6 167.4 169.4 168.4 2.6 .6 -.6 2.7 1.7 1.2
Boston-Brockton-Nashua, MA-NH-ME-CT .... 1 166.4 167.3 165.2 164.4 2.6 -1.7 -.5 1.5 -.7 -1.3Cleveland-Akron, OH ....................................... 1 162.6 163.5 165.4 164.6 2.5 .7 -.5 4.2 1.7 1.2Dallas-Fort Worth, TX ...................................... 1 148.3 148.4 150.1 152.6 3.4 2.8 1.7 1.3 1.2 1.1Washington-Baltimore, DC-MD-VA-WV 3 ..... 1 100.3 99.5 101.2 100.4 .0 .9 -.8 .0 .9 1.7
Atlanta, GA ........................................................ 2 164.3 166.5 165.7 165.2 3.0 -.8 -.3 3.0 .9 -.5Detroit-Ann Arbor-Flint, Ml .............................. 2 157.2 156.6 157.5 154.1 1.8 -1.6 -2.2 3.4 .2 .6Houston-Galveston-Brazoria, TX .................... 2 155.1 155.7 159.9 154.5 -.5 -.8 -3.4 .7 3.1 2.7Miami-Fort Lauderdale, FL ............................. 2 167.7 166.9 169.2 168.3 1.9 .8 -.5 1.6 .9 1.4Philadelphia-Wilmington-Atlantic City,
PA-NJ-DE-MD ......................................... 2 166.4 165.2 167.8 165.7 3.2 .3 -1.3 2.5 .8 1.6San Francisco-Oakland-San Jose, CA .......... 2 171.7 173.9 173.9 174.1 1.0 .1 .1 .6 1.3 .0Seattle-Tacoma-Bremerton, WA .................... 2 168.0 168.3 171.7 170.4 1.9 1.2 -.8 4.0 2.2 2.0
1 Foods, fuels, and several other items priced every month in all areas; most other goods and services priced as indicated:
M - Every month.1 - January, March, May, July, September, and November.2 - February, April, June, August, October, and December.
2 Regions defined as the four Census regions. See map in technical notes.
3 Indexes on a December 1997=100 base.4 Indexes on a December 1986=100 base.
NOTE: Index applies to a month as a whole, not to any specific date.
52Digitized for FRASER http://fraser.stlouisfed.org/ Federal Reserve Bank of St. Louis
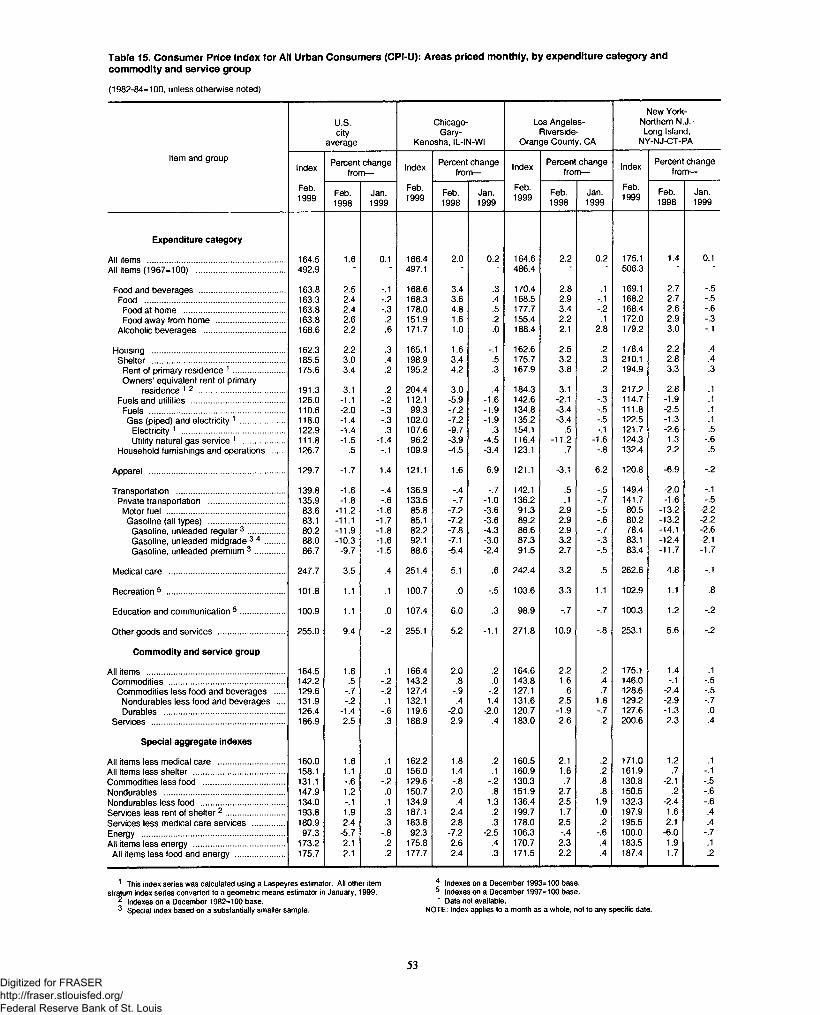
Table 15. Consumer Price Index for All Urban Consumers (CPI-U): Areas priced monthly, by expenditure category andcommodity and service group
(1982-84=100, unless otherwise noted)
U.S.city
average
Chicago- Gary-
Kenosha, IL-IN-WI
Los Angeles- Riverside-
Orange County, CA
New York- Northern N.J.- Long Island,
NY-NJ-CT-PA
Item and groupIndex Percent change
from— Index Percent change from— Index Percent change
from— Index Percent change from—
Feb.1999 Feb.
1998Jan.1999
Feb.1999 Feb.
1998Jan.1999
Feb.1999 Feb.
1998Jan.1999
Feb.1999 Feb.
1998Jan.1999
Expenditure category
All items ......................................................... 164.5 1.6 0.1 166.4 2.0 0.2 164.6 2.2 0.2 175.1 1.4 0.1All items (1967-100) ..................................... 492.9 ■ ' 497.1 " 486.4 506.3
Food and beverages .................................... 163.8 2.5 -.1 168.6 3.4 .3 170.4 2.8 .1 169.1 2.7 -.5Food .......................................................... 163.3 2.4 -.2 168.3 3.6 .4 168.5 2.9 -.1 168.2 2.7 -.5Food at home .......................................... 163.8 2.4 -.3 178.0 4.8 .5 177.7 3.4 -.2 168.4 2.6 -.6Food away from home ............................. 163.8 2.6 .2 151.9 1.6 .2 155.4 2.2 .1 172.0 2.9 -.3
Alcoholic beverages .................................. 168.6 2.2 .6 171.7 1.0 .0 188.4 2.1 2.8 179.2 3.0 -.1
Housing ....................................................... 162.3 2.2 .3 165.1 1.6 -.1 162.6 2.5 .2 178.4 2.2 .4Shelter ....................................................... 185.5 3.0 .4 198.9 3.4 .5 175.7 3.2 .3 210.1 2.8 .4
Rent of primary residence 1 ..................... 175.6 3.4 .2 195.2 4.2 .3 167.9 3.8 .2 194.9 3.3 .3Owners’ equivalent rent of primary
residence 1 2 ..................................... 191.3 3.1 .2 204.4 3.0 .4 184.3 3.1 .3 217.2 2.8 .1Fuels and utilities ....................................... 126.0 -1.1 -.2 112.1 -5.9 -1.6 142.6 -2.1 -.3 114.7 -1.9 .1Fuels ........................................................ 110.6 -2.0 -.3 99.3 -7.2 -1.9 134.8 -3.4 -.5 111.8 -2.5 .1Gas (piped) and electricity 1 .................. 118.0 -1.4 -.3 102.0 -7.2 -1.9 135.2 -3.4 -.5 122.5 -1.3 .1
Electricity 1 ........................................... 122.9 -1.4 .3 107.6 -9.7 .3 154.1 .5 -.1 121.7 -2.6 .5Utility natural gas service 1 .................. 111.8 -1.5 -1.4 96.2 -3.9 -4.5 116.4 -11.2 -1.6 124.3 1.3 -.6
Household furnishings and operations ..... 126.7 .5 -.1 109.9 -4.5 -3.4 123.1 .7 -.8 132.4 2.2 .5
Apparel ........................................................ 129.7 -1.7 1.4 121.1 1.6 6.9 121.1 -3.1 6.2 120.8 -6.9 -.2
Transportation ............................................. 139.8 -1.6 -.4 136.9 -.4 -.7 142.1 .5 -.5 149.4 -2.0 -.1Private transportation ................................ 135.9 -1.8 -.6 133.5 -.7 -1.0 136.2 .1 -.7 141.7 -1.6 -.5Motor fuel ................................................. 83.6 -11.2 -1.6 85.8 -7.2 -3.6 91.3 2.9 -.5 80.5 -13.2 -2.2Gasoline (all types) ................................ 83.1 -11.1 -1.7 85.1 -7.2 -3.6 89.2 2.9 -.6 80.2 -13.2 -2.2Gasoline, unleaded regular3 ............... 80.2 -11.9 -1.8 82.2 -7.8 -4.3 86.6 2.9 -.7 78.4 -14.1 -2.6Gasoline, unleaded midgrade 3 4 ........ 88.0 -10.3 -1.6 92.1 -7.1 -3.0 87.3 3.2 -.3 83.1 -12.4 -2.1Gasoline, unleaded premium 3 ............ 86.7 -9.7 -1.5 88.6 -5.4 -2.4 91.5 2.7 -.5 83.4 -11.7 -1.7
Medical care ................................................ 247.7 3.5 .4 251.4 5.1 .6 242.4 3.2 .5 262.6 4.8 -.1
Recreation 5 ................................................. 101.8 1.1 .1 100.7 .0 -.5 103.6 3.3 1.1 102.9 1.1 .8
Education and communication 5 .................. 100.9 1.1 .0 107.4 6.0 .3 98.9 -.7 -.7 100.3 1.2 -.2
Other goods and services ............................ 255.0 9.4 -.2 255.1 5.2 -1.1 271.8 10.9 -.8 253.1 5.6 -.2
Commodity and service group
All items ......................................................... 164.5 1.6 .1 166.4 2.0 .2 164.6 2.2 .2 175.1 1.4 .1Commodities ................................................ 142.2 .5 -.2 143.2 .8 .0 143.8 1.6 .4 146.0 -.1 -.5
Commodities less food and beverages .... 129.6 -.7 -.2 127.4 -.9 -.2 127.1 .6 .7 128.6 -2.4 -.5Nondurables less food and beverages .... 131.9 -.2 .1 132.1 .4 1.4 131.6 2.5 1.8 129.2 -2.9 -.7Durables .................................................. 126.4 -1.4 -.6 119.6 -2.0 -2.0 120.7 -1.9 -.7 127.6 -1.3 .0
Services ....................................................... 186.9 2.5 .3 188.9 2.9 .4 183.0 2.6 .2 200.6 2.3 .4
Special aggregate indexes
All items less medical care ............................ 160.0 1.6 .1 162.2 1.8 .2 160.5 2.1 .2 171.0 1.2 .1All items less shelter ...................................... 158.1 1.1 .0 156.0 1.4 .1 160.9 1.6 .2 161.9 .7 -.1Commodities less food .................................. 131.1 -.6 -.2 129.6 -.8 -.2 130.3 .7 .8 130.8 -2.1 -.5Nondurables .................................................. 147.9 1.2 .0 150.7 2.0 .8 151.9 2.7 .8 150.5 .2 -.6Nondurables less food ................................... 134.0 -.1 .1 134.9 .4 1.3 136.4 2.5 1.9 132.3 -2.4 -.6Services less rent of shelter2 ........................ 193.8 1.9 .3 187.1 2.4 .2 199.7 1.7 .0 197.9 1.6 .4Services less medical care sen/ices ............. 180.9 2.4 .3 183.8 2.8 .3 178.0 2.5 .2 195.5 2.1 .4Energy ........................................................... 97.3 -5.7 -.8 92.3 -7.2 -2.5 106.3 -.4 -.6 100.0 -6.0 -.7All items less energy ...................................... 173.2 2.1 .2 175.8 2.6 .4 170.7 2.3 .4 183.5 1.9 .1
All items less food and energy .................... 175.7 2.1 .2 177.7 2.4 .3 171.5 2.2 .4 187.4 1.7 .2
1 This index series was calculated using a Laspeyres estimator. All other item stratum index series converted to a geometric means estimator in January, 1999.
2 Indexes on a December 1982=100 base.3 Special index based on a substantially smaller sample.
4 Indexes on a December 1993=100 base.5 Indexes on a December 1997=100 base.' Data not available.
NOTE: Index applies to a month as a whole, not to any specific date.
53Digitized for FRASER http://fraser.stlouisfed.org/ Federal Reserve Bank of St. Louis
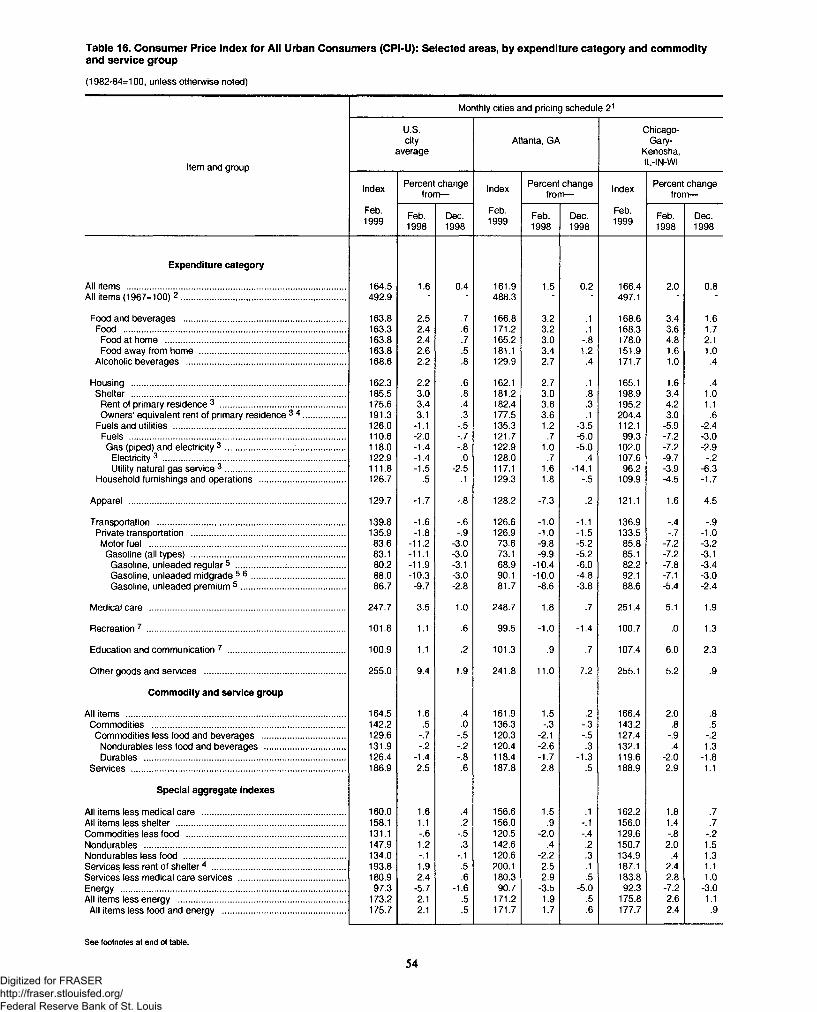
Table 16. Consumer Price Index for All Urban Consumers (CPI-U): Selected areas, by expenditure category and commodityand service group
(1982-84=100, unless otherwise noted)
Monthly cities and pricing schedule 21
Item and group
U.S.city
averageAtlanta, GA
Chicago-Gary-
Kenosha,IL-IN-WI
Index Percent change from— Index Percent change
from— Index Percent change from—
Feb.1999 Feb.
1998Dec.1998
Feb.1999 Feb.
1998Dec.1998
Feb.1999 Feb.
1998Dec.1998
Expenditure category
All items ........................................................................................... 164.5 1.6 0.4 161.9 1.5 0.2 166.4 2.0 0.8All items (1967=100) 2 .................................................................... 492.9 ■ ■ 488.3 ■ ■ 497.1 ■ ■
Food and beverages ................................................................... 163.8 2.5 .7 166.8 3.2 .1 168.6 3.4 1.6Food ............................................................................................ 163.3 2.4 .6 171.2 3.2 .1 168.3 3.6 1.7
Food at home ........................................................................... 163.8 2.4 .7 165.2 3.0 -.8 178.0 4.8 2.1Food away from home ............................................................. 163.8 2.6 .5 181.1 3.4 1.2 151.9 1.6 1.0
Alcoholic beverages .................................................................. 168.6 2.2 .8 129.9 2.7 .4 171.7 1.0 .4
Housing ......................................................................................... 162.3 2.2 .6 162.1 2.7 .1 165.1 1.6 .4Shelter ......................................................................................... 185.5 3.0 .8 181.2 3.0 .8 198.9 3.4 1.0
Rent of primary residence 3 .................................................... 175.6 3.4 .4 182.4 3.6 .3 195.2 4.2 1.1Owners’ equivalent rent of primary residence 3 4 ................. 191.3 3.1 .3 177.5 3.6 .1 204.4 3.0 .6
Fuels and utilities ....................................................................... 126.0 -1.1 -.5 135.3 1.2 -3.5 112.1 -5.9 -2.4Fuels .......................................................................................... 110.6 -2.0 -.7 121.7 .7 -5.0 99.3 -7.2 -3.0Gas (piped) and electricity 3 ............................ ..................... 118.0 -1.4 -.8 122.9 1.0 -5.0 102.0 -7.2 -2.9
Electricity 3 ............................................................................ 122.9 -1.4 .0 128.0 .7 .4 107.6 -9.7 -.2Utility natural gas service 3 .................................................. 111.8 -1.5 -2.5 117.1 1.6 -14.1 96.2 -3.9 -6.3
Household furnishings and operations .................................... 126.7 .5 .1 129.3 1.8 -.5 109.9 -4.5 -1.7
Apparel .......................................................................................... 129.7 -1.7 -.8 128.2 -7.3 .2 121.1 1.6 4.5
Transportation .............................................................................. 139.8 -1.6 -.6 126.6 -1.0 -1.1 136.9 -.4 -.9Private transportation ................................................................ 135.9 -1.8 -.9 126.9 -1.0 -1.5 133.5 -.7 -1.0Motor fuel .................................................................................. 83.6 -11.2 -3.0 73.6 -9.8 -5.2 85.8 -7.2 -3.2
Gasoline (all types) ................................................................ 83.1 -11.1 -3.0 73.1 -9.9 -5.2 85.1 -7.2 -3.1Gasoline, unleaded regular5 ............................................. 80.2 -11.9 -3.1 68.9 -10.4 -6.0 82.2 -7.8 -3.4Gasoline, unleaded midgrade 5 6 ....................................... 88.0 -10.3 -3.0 90.1 -10.0 -4.8 92.1 -7.1 -3.0Gasoline, unleaded premium 5 ........................................... 86.7 -9.7 -2.8 81.7 -8.6 -3.8 88.6 -5.4 -2.4
Medical care ................................................................................. 247.7 3.5 1.0 248.7 1.8 .7 251.4 5.1 1.9
Recreation 7 ................................................................................... 101.8 1.1 .6 99.5 -1.0 -1.4 100.7 .0 1.3
Education and communication 7 ................................................. 100.9 1.1 .2 101.3 .9 .7 107.4 6.0 2.3
Other goods and services ........................................................... 255.0 9.4 1.9 241.8 11.0 7.2 255.1 5.2 .9
Commodity and service group
All items ........................................................................................... 164.5 1.6 .4 161.9 1.5 .2 166.4 2.0 .8Commodities ................................................................................. 142.2 .5 .0 136.3 -.3 -.3 143.2 .8 .5
Commodities less food and beverages ................................... 129.6 -.7 -.5 120.3 -2.1 -.5 127.4 -.9 -.2Nondurables less food and beverages .................................. 131.9 -.2 -.2 120.4 -2.6 .3 132.1 .4 1.3Durables .................................................................................... 126.4 -1.4 -.8 118.4 -1.7 -1.3 119.6 -2.0 -1.8
Services ......................................................................................... 186.9 2.5 .6 187.8 2.8 .5 188.9 2.9 1.1
Special aggregate indexes
All items less medical care ............................................................ 160.0 1.6 .4 156.6 1.5 .1 162.2 1.8 .7All items less shelter ....................................................................... 158.1 1.1 .2 156.0 .9 -.1 156.0 1.4 .7Commodities less food .................................................................. 131.1 -.6 -.5 120.5 -2.0 -.4 129.6 -.8 -.2Nondurables .................................................................................... 147.9 1.2 .3 142.6 .4 .2 150.7 2.0 1.5Nondurables less food ................................................................... 134.0 -.1 -.1 120.6 -2.2 .3 134.9 .4 1.3Services less rent of shelter4 ....................................................... 193.8 1.9 .5 200.1 2.5 .1 187.1 2.4 1.1Services less medical care services ............................................. 180.9 2.4 .6 180.3 2.9 .5 183.8 2.8 1.0Energy .............................................................................................. 97.3 -5.7 -1.6 90.7 -3.5 -5.0 92.3 -7.2 -3.0All items less energy ...................................................................... 173.2 2.1 .5 171.2 1.9 .5 175.8 2.6 1.1
All items less food and energy ................................................... 175.7 2.1 .5 171.7 1.7 .6 177.7 2.4 .9
See footnotes at end of table.
54Digitized for FRASER http://fraser.stlouisfed.org/ Federal Reserve Bank of St. Louis
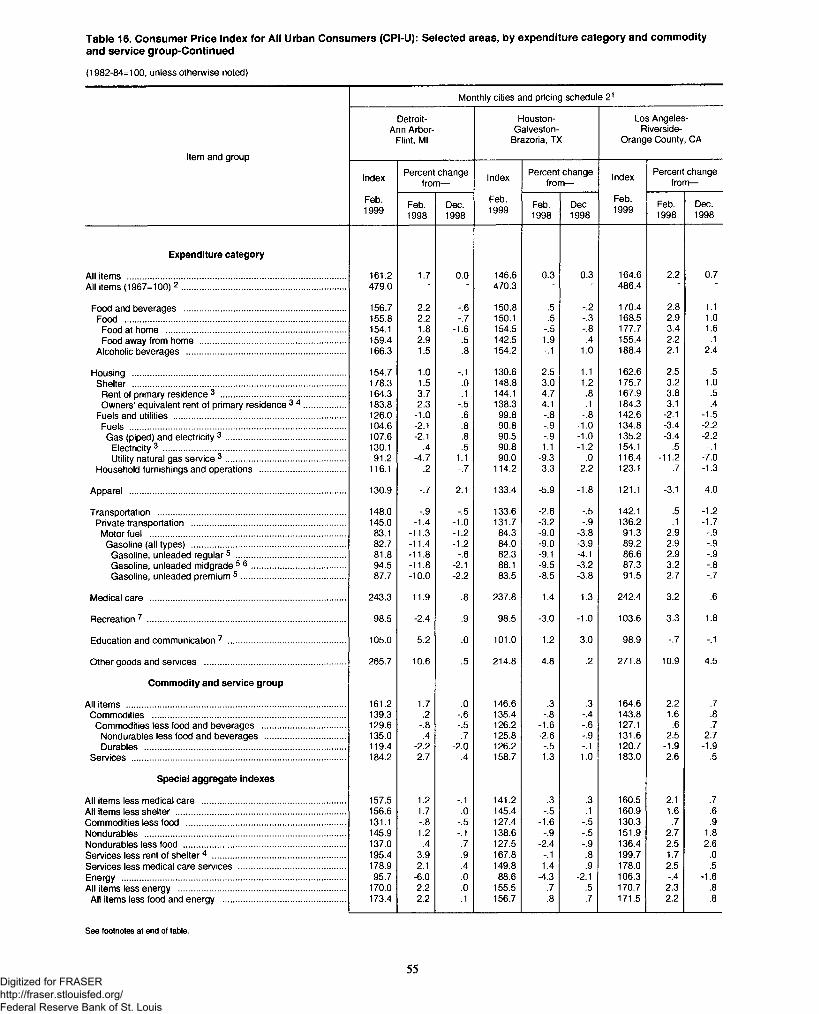
Table 16. Consumer Price Index for All Urban Consumers (CPI-U): Selected areas, by expenditure category and commodityand service group-Continued
(1982-84=100, unless otherwise noted)
Monthly cities and pricing schedule 21
Item and group
Detroit- Ann Arbor-
Flint, Ml
Houston- Galveston-
Brazoria, TX
Los Angeles- Riverside-
Orange County, CA
Index Percent change from— Index Percent change
from— Index Percent change from—
Feb.1999 Feb.
1998Dec.1998
Feb.1999 Feb.
1998Dec.1998
Feb.1999 Feb.
1998Dec.1998
Expenditure category
All items ........................................................................................... 161.2 1.7 0.0 146.6 0.3 0.3 164.6 2.2 0.7All items (1967-100) 2 .................................................................... 479.0 470.3 486.4 - -
Food and beverages ................................................................... 156.7 2.2 -.6 150.8 .5 -.2 170.4 2.8 1.1Food ............................................................................................ 155.8 2.2 -.7 150.1 .5 -.3 168.5 2.9 1.0
Food at home ................ .......................................................... 154.1 1.8 -1.6 154.5 -.5 -.8 177.7 3.4 1.6Food away from home ............................................................. 159.4 2.9 .5 142.5 1.9 .4 155.4 2.2 .1
Alcoholic beverages .................................................................. 166.3 1.5 .8 154.2 -.1 1.0 188.4 2.1 2.4
Housing ......................................................................................... 154.7 1.0 -.1 130.6 2.5 1.1 162.6 2.5 .5Shelter ......................................................................................... 178.3 1.5 .0
.1148.8 3.0 1.2 175.7 3.2 1.0
Rent of primary residence 3 .................................................... 164.3 3.7 144.1 4.7 .8 167.9 3.8 .5Owners’ equivalent rent of primary residence 3 4 ................. 183.8 2.3 -.5 138.3 4.1 .1 184.3 3.1 .4
Fuels and utilities ........................................................................ 126.0 -1.0 .6 99.8 -.8 -.8 142.6 -2.1 -1.5Fuels .......................................................................................... 104.6 -2.1 .8 90.8 -.9 -1.0 134.8 -3.4 -2.2Gas (piped) and electricity 3 .................................................. 107.6 -2.1 .8 90.5 -.9 -1.0 135.2 -3.4 -2.2
Electricity 3 ............................................................................ 130.1 .4 .5 90.8 1.1 -1.2 154.1 .5 -.1Utility natural gas service 3 .................................................. 91.2 -4.7 1.1 90.0 -9.3 .0 116.4 -11.2 -7.0
Household furnishings and operations .................................... 116.1 .2 -.7 114.2 3.3 2.2 123.1 .7 -1.3
Apparel .......................................................................................... 130.9 -.7 2.1 133.4 -5.9 -1.8 121.1 -3.1 4.0
Transportation .............................................................................. 148.0 -.9 -.5 133.6 -2.6 -.5 142.1 .5 -1.2Private transportation ................................................................ 145.0 -1.4 -1.0 131.7 -3.2 -.9 136.2 .1 -1.7
Motor fuel ................................................................................. 83.1 -11.3 -1.2 84.3 -9.0 -3.8 91.3 2.9 -.9Gasoline (all types) ................................................................ 82.7 -11.4 -1.2 84.0 -9.0 -3.9 89.2 2.9 -.9
Gasoline unleaded regular5 .............................................. 81.8 -11.8 -.6 82.3 -9.1 -4.1 86.6 2.9 -.9Gasoline, unleaded midgrade 5 ® ....................................... 94.5 -11.8 -2.1 88.1 -9.5 -3.2 87.3 3.2 -.8Gasoline, unleaded premium 5 ........................................... 87.7 -10.0 -2.2 83.5 -8.5 -3.8 91.5 2.7 -.7
Medical care ................................................................................. 243.3 11.9 .8 237.8 1.4 1.3 242.4 3.2 .6
Recreation 7 .................................................................................. 98.5 -2.4 .9 98.5 -3.0 -1.0 103.6 3.3 1.8
Education and communication 7 ................................................. 105.0 5.2 .0 101.0 1.2 3.0 98.9 -.7 -.1
Other goods and services ........................................................... 265.7 10.6 .5 214.8 4.8 .2 271.8 10.9 4.5
Commodity and service group
All items ........................................................................................... 161.2 1.7 .0 146.6 .3 .3 164.6 2.2 .7Commodities ................................................................................ 139.3 .2 -.6 135.4 -.8 -.4 143.8 1.6 .8
Commodities less food and beverages ................................... 129.6 -.8 -.5 126.2 -1.6 -.6 127.1 .6 .7Nondurables less food and beverages .................................. 135.0 .4 .7 125.8 -2.6 -.9 131.6 2.5 2.7Durables .................................................................................... 119.4 -2.2 -2.0 126.2 -.5 -.1 120.7 -1.9 -1.9
Services ......................................................................................... 184.2 2.7 .4 158.7 1.3 1.0 183.0 2.6 .5
Special aggregate indexes
All items less medical care ............................................................ 157.5 1.2 -.1 141.2 .3 .3 160.5 2.1 .7All items less shelter ....................................................................... 156.6 1.7 .0 145.4 -.5 .1 160.9 1.6 .6Commodities less food .................................................................. 131.1 -.8 -.5 127.4 -1.6 -.5 130.3 .7 .9Nondurables .................................................................................... 145.9 1.2 -.1 138.6 -.9 -.5 151.9 2.7 1.8Nondurables less food ................................................................... 137.0 .4 .7 127.5 -2.4 -.9 136.4 2.5 2.6Services less rent of shelter4 ....................................................... 195.4 3.9 .9 167.8 -.1 .8 199.7 1.7 .0Services less medical care services ............................................ 178.9 2.1 .4 149.8 1.4 .9 178.0 2.5 .5Energy ............................................................................................. 95.7 -6.0 .0 88.6 -4.3 -2.1 106.3 -.4 -1.6All items less energy ..................................................................... 170.0 2.2 .0 155.5 .7 .5 170.7 2.3 .8
All items less food and energy ................................................... 173.4 2.2 .1 156.7 .8 .7 171.5 2.2 .8
See footnotes at end of table.
55Digitized for FRASER http://fraser.stlouisfed.org/ Federal Reserve Bank of St. Louis
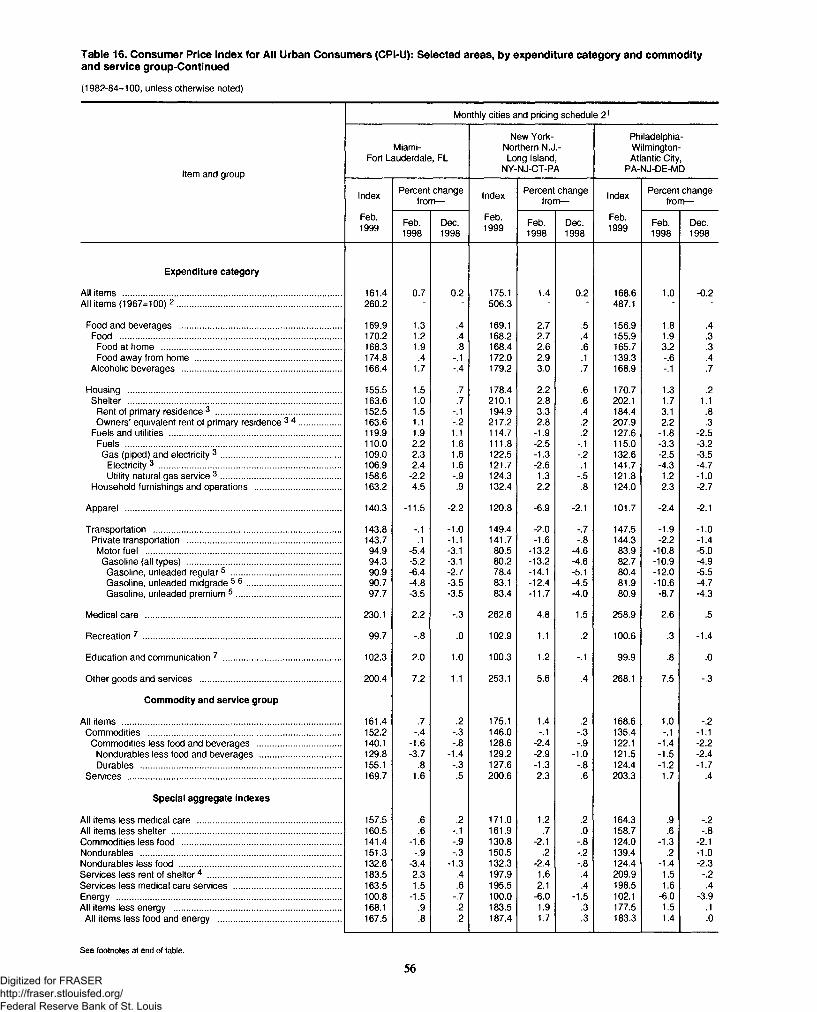
Table 16. Consumer Price Index for All Urban Consumers (CPI-U): Selected areas, by expenditure category and commodityand service group-Continued
(1982-84=100, unless otherwise noted)
Monthly cities and pricing schedule 21
Item and group
Miami- Fort Lauderdale, FL
New York- Northern N.J.- Long Island,
NY-NJ-CT-PA
Philadelphia- Wilmington- Atlantic City,
PA-NJ-DE-MD
Index Percent change from— Index Percent change
from— Index Percent change from—
Feb.1999 Feb.
1998Dec.1998
Feb.1999 Feb.
1998Dec.1998
Feb.1999 Feb.
1998Dec.1998
Expenditure category
All items ........................................................................................... 161.4 0.7 0.2 175.1 1.4 0.2 168.6 1.0 -0.2All items (1967=100) 2 .................................................................... 260.2 ■ * 506.3 - ■ 487.1 ■ ■
Food and beverages ................................................................... 169.9 1.3 .4 169.1 2.7 .5 156.9 1.8 .4Food ............................................................................................ 170.2 1.2 .4 168.2 2.7 .4 155.9 1.9 .3
Food at home ........................................................................... 168.3 1.9 .8 168.4 2.6 .6 165.7 3.2 .3Food away from home ............................................................. 174.8 .4 -.1 172.0 2.9 .1 139.3 -.6 .4
Alcoholic beverages .................................................................. 166.4 1.7 -.4 179.2 3.0 .7 168.9 -.1 .7
Housing ......................................................................................... 155.5 1.5 .7 178.4 2.2 .6 170.7 1.3 .2Shelter ......................................................................................... 163.6 1.0 .7 210.1 2.8 .6 202.1 1.7 1.1
Rent of primary residence 3 .................................................... 152.5 1.5 -.1 194.9 3.3 .4 184.4 3.1 .8Owners’ equivalent rent of primary residence 3 4 ................. 163.6 1.1 -.2 217.2 2.8 .2 207.9 2.2 .3
Fuels and utilities ....................................................................... 119.9 1.9 1.1 114.7 -1.9 .2 127.6 -1.8 -2.5Fuels .......................................................................................... 110.0 2.2 1.6 111.8 -2.5 -.1 115.0 -3.3 -3.2Gas (piped) and electricity 3 .................................................. 109.0 2.3 1.6 122.5 -1.3 -.2 132.6 -2.5 -3.5
Electricity3 ............................................................................ 106.9 2.4 1.6 121.7 -2.6 .1 141.7 -4.3 -4.7Utility natural gas service 3 .................................................. 158.6 -2.2 -.9 124.3 1.3 -.5 121.8 1.2 -1.0
Household furnishings and operations .................................... 163.2 4.5 .9 132.4 2.2 .8 124.0 2.3 -2.7
Apparel .......................................................................................... 140.3 -11.5 -2.2 120.8 -6.9 -2.1 101.7 -2.4 -2.1
Transportation .............................................................................. 143.8 -.1 -1.0 149.4 -2.0 -.7 147.5 -1.9 -1.0Private transportation ................................................................ 143.7 .1 -1.1 141.7 -1.6 -.8 144.3 -2.2 -1.4
Motor fuel ................................................................................. 94.9 -5.4 -3.1 80.5 -13.2 -4.6 83.9 -10.8 -5.0Gasoline (all types) ................................................................ 94.3 -5.2 -3.1 80.2 -13.2 -4.6 82.7 -10.9 -4.9Gasoline, unleaded regular5 .............................................. 90.9 -6.4 -2.7 78.4 -14.1 -5.1 80.4 -12.0 -5.5Gasoline, unleaded midgrade 5 6 ....................................... 90.7 -4.8 -3.5 83.1 -12.4 -4.5 81.9 -10.6 -4.7Gasoline, unleaded premium 5 ........................................... 97.7 -3.5 -3.5 83.4 -11.7 -4.0 80.9 -8.7 -4.3
Medical care ................................................................................. 230.1 2.2 -.3 262.6 4.8 1.5 258.9 2.6 .5
Recreation 7 .................................................................................. 99.7 -.8 .0 102.9 1.1 .2 100.6 .3 -1.4
Education and communication 7 ................................................. 102.3 2.0 1.0 100.3 1.2 -.1 99.9 .8 .0
Other goods and services ........................................................... 200.4 7.2 1.1 253.1 5.6 .4 268.1 7.5 -.3
Commodity and service group
All items ........................................................................................... 161.4 .7 .2 175.1 1.4 .2 168.6 1.0 -.2Commodities ................................................................................ 152.2 -.4 -.3 146.0 -.1 -.3 135.4 -.1 -1.1
Commodities less food and beverages ................................... 140.1 -1.6 -.8 128.6 -2.4 -.9 122.1 -1.4 -2.2Nondurables less food and beverages .................................. 129.8 -3.7 -1.4 129.2 -2.9 -1.0 121.5 -1.5 -2.4Durables .................................................................................... 155.1 .8 -.3 127.6 -1.3 -.8 124.4 -1.2 -1.7
Services ......................................................................................... 169.7 1.6 .5 200.6 2.3 .6 203.3 1.7 .4
Special aggregate indexes
All items less medical care ............................................................ 157.5 .6 .2 171.0 1.2 .2 164.3 .9 -.2All items less shelter ....................................................................... 160.5 .6 -.1 161.9 .7 .0 158.7 .6 -.8Commodities less food .................................................................. 141.4 -1.6 -.9 130.8 -2.1 -.8 124.0 -1.3 -2.1Nondurables .................................................................................... 151.3 -.9 -.3 150.5 .2 -.2 139.4 .2 -1.0Nondurables less food ................................................................... 132.6 -3.4 -1.3 132.3 -2.4 -.8 124.4 -1.4 -2.3Services less rent of shelter4 ........................................................ 183.5 2.3 .4 197.9 1.6 .4 209.9 1.5 -.2Services less medical care services ............................................. 163.5 1.5 .6 195.5 2.1 .4 198.5 1.6 .4Energy .............................................................................................. 100.8 -1.5 -.7 100.0 -6.0 -1.5 102.1 -6.0 -3.9All items less energy ...................................................................... 168.1 .9 .2 183.5 1.9 .3 177.5 1.5 .1
All items less food and energy ................................................... 167.5 .8 .2 187.4 1.7 .3 183.3 1.4 .0
See footnotes at end of table.
56Digitized for FRASER http://fraser.stlouisfed.org/ Federal Reserve Bank of St. Louis
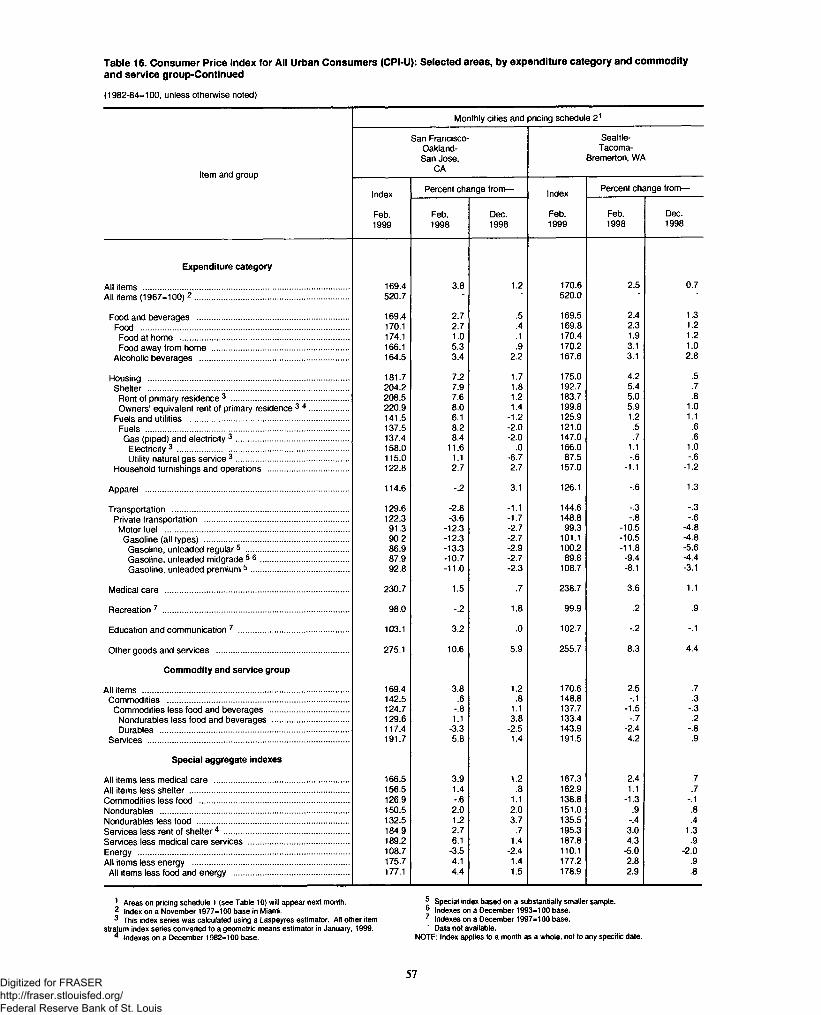
Table 16. Consumer Price Index for All Urban Consumers (CPI-U): Selected areas, by expenditure category and commodityand service group-Continued
(1982-84=100, unless otherwise noted)
Monthly cities and pricing schedule 21
Item and group
San Francisco- Oakland- San Jose,
CA
Seattle- Tacoma-
Bremerton, WA
Index Percent change from— Index Percent change from—
Feb.1999
Feb.1998
Dec.1998
Feb.1999
Feb.1998
Dec.1998
Expenditure category
All items ...................................................................................... 169.4 3.8 1.2 170.6 2.5 0.7All items (1967-100) 2 ................................................................ 520.7 520.0
Food and beverages ............................................................... 169.4 2.7 .5 169.5 2.4 1.3Food ....................................................................................... 170.1 2.7 .4 169.8 2.3 1.2Food at home ...................................................................... 174.1 1.0 .1 170.4 1.9 1.2Food away from home ......................................................... 166.1 5.3 .9 170.2 3.1 1.0
Alcoholic beverages .............................................................. 164.5 3.4 2.2 167.6 3.1 2.8
Housing .................................................................................... 181.7 7.2 1.7 175.0 4.2 .5Shelter .................................................................................... 204.2 7.9 1.8 192.7 5.4 .7
Rent of primary residence 3 ................................................. 208.5 7.6 1.2 183.7 5.0 .8Owners’ equivalent rent of primary residence 3 4 ................ 220.9 8.0 1.4 199.8 5.9 1.0
Fuels and utilities ................................................................... 141.5 6.1 -1.2 125.9 1.2 1.1Fuels ..................................................................................... 137.5 8.2 -2.0 121.0 .5 .6Gas (piped) and electricity 3 ............................................... 137.4 8.4 -2.0 147.0 .7 .6
Electricity 3 ....................................................................... 158.0 11.6 .0 166.0 1.1 1.0Utility natural gas service 3 ............................................... 115.0 1.1 -6.7 87.5 -.6 -.6
Household furnishings and operations .................................. 122.8 2.7 2.7 157.0 -1.1 -1.2
Apparel ..................................................................................... 114.6 -.2 3.1 126.1 -.6 1.3
Transportation ......................................................................... 129.6 -2.8 -1.1 144.6 -.3 -.3Private transportation ............................................................ 122.3 -3.6 -1.7 148.8 -.8 -.6Motor fuel ............................................................................. 91.3 -12.3 -2.7 99.3 -10.5 -4.8Gasoline (all types) ............................................................ 90.2 -12.3 -2.7 101.1 -10.5 -4.8Gasoline, unleaded regular5 ........................................... 86.9 -13.3 -2.9 100.2 -11.8 -5.6Gasoline, unleaded midgrade 5 6 ..................................... 87.9 -10.7 -2.7 89.8 -9.4 -4.4Gasoline, unleaded premium 5 ......................................... 92.8 -11.0 -2.3 108.7 -8.1 -3.1
Medical care ............................................................................. 230.7 1.5 .7 238.7 3.6 1.1
Recreation 7 .............................................................................. 98.0 -.2 1.8 99.9 .2 .9
Education and communication 7 .............................................. 103.1 3.2 .0 102.7 -.2 -.1
Other goods and services ....................................................... 275.1 10.6 5.9 255.7 8.3 4.4
Commodity and service group
All items ...................................................................................... 169.4 3.8 1.2 170.6 2.5 .7Commodities ............................................................................ 142.5 .6 .8 148.8 -.1 .3
Commodities less food and beverages ................................. 124.7 -.8 1.1 137.7 -1.5 -.3Nondurables less food and beverages ................................ 129.6 1.1 3.8 133.4 -.7 .2Durables ............................................................................... 117.4 -3.3 -2.5 143.9 -2.4 -.8
Services .................................................................................... 191.7 5.8 1.4 191.5 4.2 .9
Special aggregate indexes
All items less medical care ........................................................ 166.5 3.9 1.2 167.3 2.4 .7All items less shelter .................................................................. 156.5 1.4 .8 162.9 1.1 .7Commodities less food .............................................................. 126.9 -.6 1.1 138.8 -1.3 -.1Nondurables ............................................................................... 150.5 2.0 2.0 151.0 .9 .8Nondurables less food ............................................................... 132.5 1.2 3.7 135.5 -.4 .4Services less rent of shelter4 .................................................... 184.9 2.7 .7 195.3 3.0 1.3Services less medical care services .......................................... 189.2 6.1 1.4 187.8 4.3 .9Energy ........................................................................................ 108.7 -3.5 -2.4 110.1 -5.0 -2.0All items less energy ................................................................. 175.7 4.1 1.4 177.2 2.8 .9All items less food and energy ................................................ 177.1 4.4 1.5 178.9 2.9 .8
1 Areas on pricing schedule 1 (see Table 10) will appear next month. 5 Special index based on a substantially smaller sample.2 Index on a November 1977=100 base in Miami. ® Indexes on a December 1993=100 base.3 This index series was calculated using a Laspeyres estimator. All other item 7 Indexes on a December 1997=100 base,
stratum index series converted to a geometric means estimator in January, 1999. ’ Data not available.4 Indexes on a December 1982=100 base. NOTE: Index applies to a month as a whole, not to any specific date.
57Digitized for FRASER http://fraser.stlouisfed.org/ Federal Reserve Bank of St. Louis
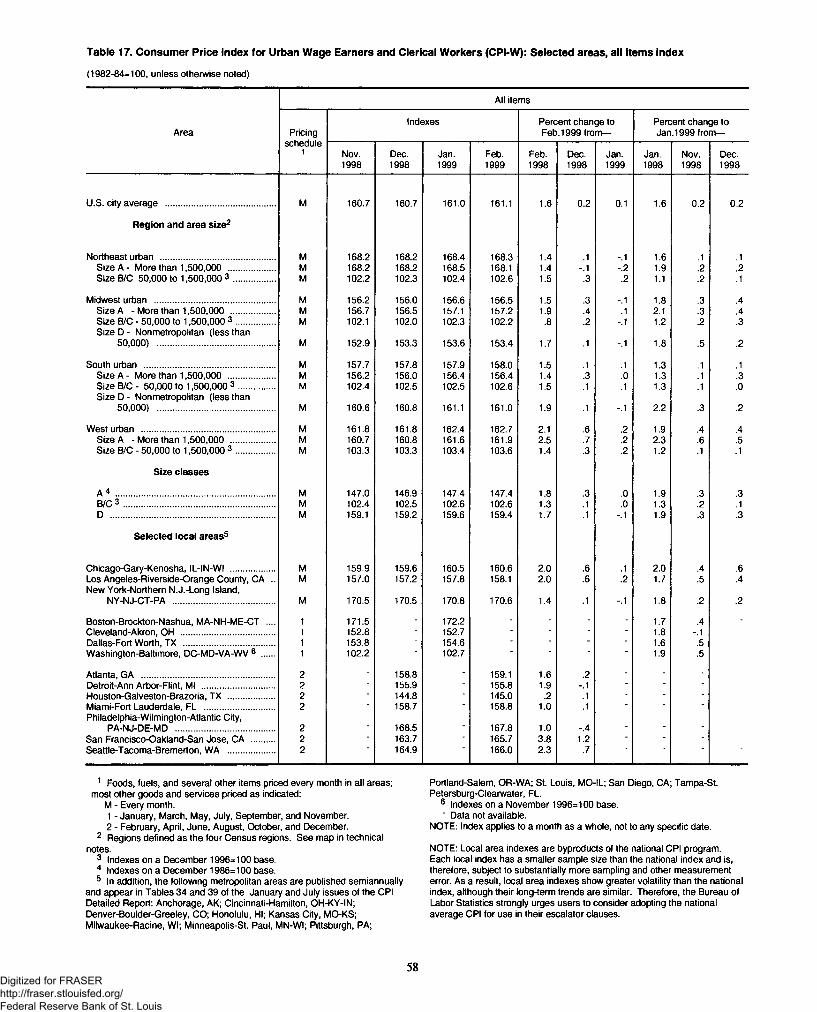
(1982-84=100, unless otherwise noted)
Table 17. Consumer Price Index for Urban Wage Earners and Clerical Workers (CPI-W): Selected areas, all items index
All items
Area Pricingschedule
1
Indexes Percent change to Feb. 1999 from—
Percent change to Jan. 1999 from—
Nov.1998
Dec.1998
Jan.1999
Feb.1999
Feb.1998
Dec.1998
Jan.1999
Jan.1998
Nov.1998
Dec.1998
U.S. city average .............................................. M 160.7 160.7 161.0 161.1 1.6 0.2 0.1 1.6 0.2 0.2
Region and area size2
Northeast urban ................................................ M 168.2 168.2 168.4 168.3 1.4 .1 -.1 1.6 .1 .1Size A - More than 1,500,000 .................... M 168.2 168.2 168.5 168.1 1.4 -.1 -.2 1.9 .2 .2Size B/C 50,000 to 1,500,000 3 ................. M 102.2 102.3 102.4 102.6 1.5 .3 .2 1.1 .2 .1
Midwest urban .................................................. M 156.2 156.0 156.6 156.5 1.5 .3 -.1 1.8 .3 .4Size A - More than 1,500,000 .................. M 156.7 156.5 157.1 157.2 1.9 .4 .1 2.1 .3 .4Size B/C - 50,000 to 1,500,000 3 ................ M 102.1 102.0 102.3 102.2 .8 .2 -.1 1.2 .2 .3Size D - Non metropolitan (less than
50,000) ................................................. M 152.9 153.3 153.6 153.4 1.7 .1 -.1 1.8 .5 .2
South urban ...................................................... M 157.7 157.8 157.9 158.0 1.5 .1 .1 1.3 .1 .1Size A - More than 1,500,000 .................... M 156.2 156.0 156.4 156.4 1.4 .3 .0 1.3 .1 .3Size B/C - 50,000 to 1,500,000 3 ............... M 102.4 102.5 102.5 102.6 1.5 .1 .1 1.3 .1 .0Size D - Non metropolitan (less than
50,000) ................................................. M 160.6 160.8 161.1 161.0 1.9 .1 -.1 2.2 .3 .2
West urban ........................................................ M 161.8 161.8 162.4 162.7 2.1 .6 .2 1.9 .4 .4Size A - More than 1,500,000 ................... M 160.7 160.8 161.6 161.9 2.5 .7 .2 2.3 .6 .5Size B/C - 50,000 to 1,500,000 3 ................ M 103.3 103.3 103.4 103.6 1.4 .3 .2 1.2 .1 .1
Size classes
A 4 .................................................................. M 147.0 146.9 147.4 147.4 1.8 .3 .0 1.9 .3 .3B/C 3 ............................................................... M 102.4 102.5 102.6 102.6 1.3 .1 .0 1.3 .2 .1D ..................................................................... M 159.1 159.2 159.6 159.4 1.7 .1 -.1 1.9 .3 .3
Selected local areas5
Chicago-Gary-Kenosha, IL-IN-WI .................. M 159.9 159.6 160.5 160.6 2.0 .6 .1 2.0 .4 .6Los Angeles-Riverside-Orange County, CA .. M 157.0 157.2 157.8 158.1 2.0 .6 .2 1.7 .5 .4New York-Northern N.J.-Long Island,
NY-NJ-CT-PA .......................................... M 170.5 170.5 170.8 170.6 1.4 .1 -.1 1.8 .2 .2
Boston-Brockton-Nashua, MA-NH-ME-CT .... 1 171.5 - 172.2 - - - - 1.7 .4 -Cleveland-Akron, OH ....................................... 1 152.8 - 152.7 - - - - 1.8 -.1Dallas-Fort Worth, TX ...................................... 1 153.8 - 154.6 - - - - 1.6 .5Washington-Baltimore, DC-MD-VA-WV 6 ..... 1 102.2 * 102.7 ■ ■ ■ ~ 1.9 .5
Atlanta, GA ....................................................... 2 - 158.8 - 159.1 1.6 .2 - - -Detroit-Ann Arbor-Flint, Ml .............................. 2 - 155.9 - 155.8 1.9 -.1 - - -Houston-Galveston-Brazoria, TX ................... 2 - 144.8 - 145.0 .2 .1 - - -Miami-Fort Lauderdale, FL ............................. 2 - 158.7 - 158.8 1.0 .1 - - -Philadelphia-Wilmington-Atlantic City,
PA-NJ-DE-MD ......................................... 2 ■ 168.5 ■ 167.8 1.0 -.4 ■ ■ "San Francisco-Oakland-San Jose, CA .......... 2 - 163.7 - 165.7 3.8 1.2 - - -Seattle-Tacoma-Bremerton, WA .................... 2 164.9 166.0 2.3 .7
1 Foods, fuels, and several other items priced every month in all areas; most other goods and services priced as indicated:
M - Every month.1 - January, March, May, July, September, and November.2 - February, April, June, August, October, and December.
2 Regions defined as the four Census regions. See map in technical notes.
3 Indexes on a December 1996=100 base.4 Indexes on a December 1986=100 base.5 In addition, the following metropolitan areas are published semiannually
and appear in Tables 34 and 39 of the January and July issues of the CPIDetailed Report: Anchorage, AK; Cincinnati-Hamilton, OH-KY-IN; Denver-Boulder-Greeley, CO; Honolulu, HI; Kansas City, MO-KS; Milwaukee-Racine, Wl; Minneapolis-St. Paul, MN-WI; Pittsburgh, PA;
Portland-Salem, OR-WA; St. Louis, MO-IL; San Diego, CA; Tampa-St. Petersburg-Clearwater, FL.
6 Indexes on a November 1996=100 base.' Data not available.
NOTE: Index applies to a month as a whole, not to any specific date.
NOTE: Local area indexes are byproducts of the national CPI program.Each local index has a smaller sample size than the national index and is, therefore, subject to substantially more sampling and other measurement error. As a result, local area indexes show greater volatility than the national index, although their long-term trends are similar. Therefore, the Bureau of Labor Statistics strongly urges users to consider adopting the national average CPI for use in their escalator clauses.
58Digitized for FRASER http://fraser.stlouisfed.org/ Federal Reserve Bank of St. Louis
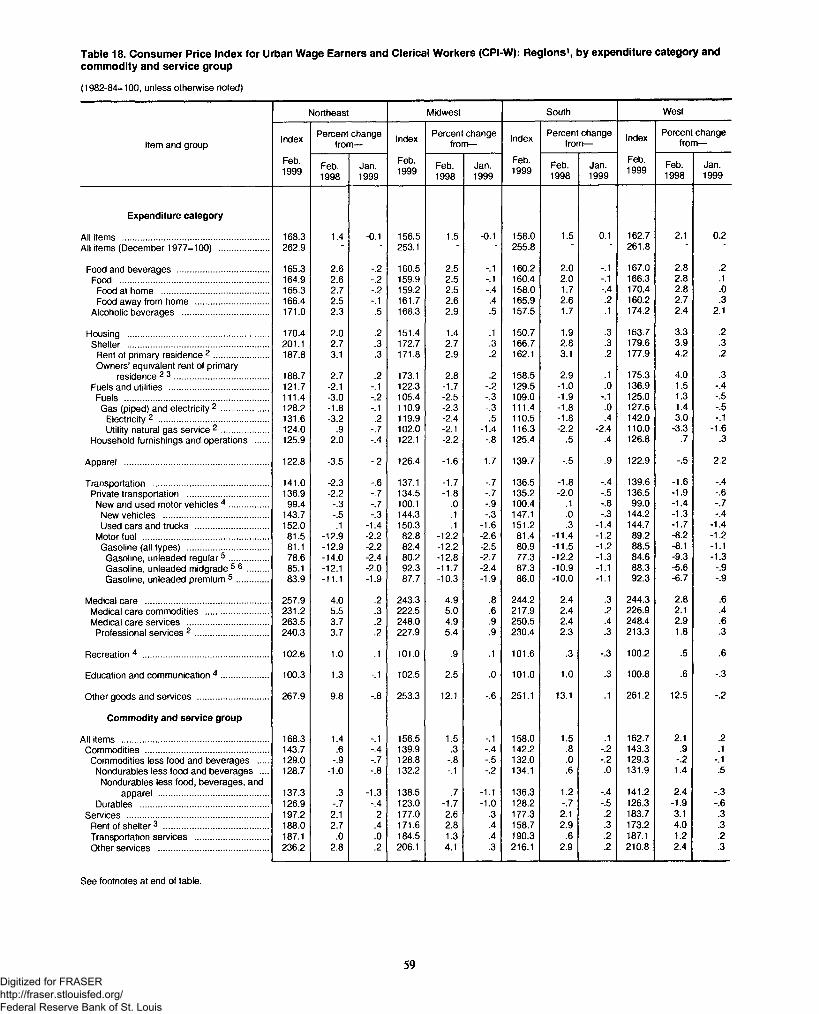
Table 18. Consumer Price Index for Urban Wage Earners and Clerical Workers (CPI-W): Regions1, by expenditure category andcommodity and service group
(1982-84=100, unless otherwise noted)
Northeast Midwest South West
Item and groupIndex Percent change
from— Index Percent change from— Index Percent change
from— Index Percent change from—
Feb.1999 Feb.
1998Jan.1999
Feb.1999 Feb.
1998Jan.1999
Feb.1999 Feb.
1998Jan.1999
Feb.1999 Feb.
1998Jan.1999
Expenditure category
All items ............................................................. 168.3 1.4 -0.1 156.5 1.5 -0.1 158.0 1.5 0.1 162.7 2.1 0.2All items (December 1977-100) ..................... 262.9 ' ' 253.1 255.8 261.8
Food and beverages ...................................... 165.3 2.6 -.2 160.5 2.5 -.1 160.2 2.0 -.1 167.0 2.8 .2Food .............................................................. 164.9 2.6 -.2 159.9 2.5 -.1 160.4 2.0 -.1 166.3 2.8 .1
Food at home ............................................. 165.3 2.7 -.2 159.2 2.5 -.4 158.0 1.7 -.4 170.4 2.8 .0Food away from home .............................. 166.4 2.5 -.1 161.7 2.6 .4 165.9 2.6 .2 160.2 2.7 .3
Alcoholic beverages .................................... 171.0 2.3 .5 168.3 2.9 .5 157.5 1.7 .1 174.2 2.4 2.1
Housing ........................................................... 170.4 2.0 .2 151.4 1.4 .1 150.7 1.9 .3 163.7 3.3 .2Shelter ........................................................... 201.1 2.7 .3 172.7 2.7 .3 166.7 2.8 .3 179.6 3.9 .3
Rent of primary residence 2 ....................... 187.8 3.1 .3 171.8 2.9 .2 162.1 3.1 .2 177.9 4.2 .2Owners’ equivalent rent of primary
4.0 .3residence 2 3 ....................................... 188.7 2.7 .2 173.1 2.8 .2 158.5 2.9 .1 175.3Fuels and utilities ......................................... 121.7 -2.1 -.1 122.3 -1.7 -.2 129.5 -1.0 .0 136.9 1.5 -.4Fuels ............................................................ 111.4 -3.0 -.2 105.4 -2.5 -.3 109.0 -1.9 -.1 125.0 1.3 -.5Gas (piped) and electricity 2 .................... 128.2 -1.8 -.1 110.9 -2.3 -.3 111.4 -1.8 .0 127.6 1.4 -.5
Electricity 2 .............................................. 131.6 -3.2 .2 119.9 -2.4 .5 110.5 -1.8 .4 142.0 3.0 -.1Utility natural gas service 2 .................... 124.0 .9 -.7 102.0 -2.1 -1.4 116.3 -2.2 -2.4 110.0 -3.3 -1.6
Household furnishings and operations ..... 125.9 2.0 -.4 122.1 -2.2 -.8 125.4 .5 .4 126.8 .7 .3
Apparel ............................................................ 122.8 -3.5 -.2 126.4 -1.6 1.7 139.7 -.5 .9 122.9 -.5 2.2
Transportation ................................................ 141.0 -2.3 -.6 137.1 -1.7 -.7 136.5 -1.8 -.4 139.6 -1.6 -.4Private transportation .................................. 136.9 -2.2 -.7 134.5 -1.8 -.7 135.2 -2.0 -.5 136.5 -1.9 -.6
New and used motor vehicles 4 ................ 99.4 -.3 -.7 100.1 .0 -.9 100.4 .1 -.8 99.0 -1.4 -.7New vehicles ............................................ 143.7 -.5 -.3 144.3 .1 -.3 147.1 .0 -.3 144.2 -1.3 -.4Used cars and trucks .............................. 152.0 .1 -1.4 150.3 .1 -1.6 151.2 .3 -1.4 144.7 -1.7 -1.4
Motor fuel .................................................... 81.5 -12.9 -2.2 82.8 -12.2 -2.6 81.4 -11.4 -1.2 89.2 -8.2 -1.2Gasoline (all types) .................................. 81.1 -12.9 -2.2 82.4 -12.2 -2.5 80.9 -11.5 -1.2 88.5 -8.1 -1.1
Gasoline, unleaded regular5 ................ 78.6 -14.0 -2.4 80.2 -12.8 -2.7 77.3 -12.2 -1.3 84.6 -9.3 -1.3Gasoline, unleaded midgrade 5 6 ......... 85.1 -12.1 -2.0 92.3 -11.7 -2.4 87.3 -10.9 -1.1 88.3 -5.6 -.9Gasoline, unleaded premium 5 ............. 83.9 -11.1 -1.9 87.7 -10.3 -1.9 86.0 -10.0 -1.1 92.3 -6.7 -.9
Medical care ................................................... 257.9 4.0 .2 243.3 4.9 .8 244.2 2.4 .3 244.3 2.8 .6Medical care commodities .......................... 231.2 5.5 .3 222.5 5.0 .6 217.9 2.4 .2 226.9 2.1 .4Medical care services .................................. 263.5 3.7 .2 248.0 4.9 .9 250.5 2.4 .4 248.4 2.9 .6
Professional sen/ices 2 .............................. 240.3 3.7 .2 227.9 5.4 .9 230.4 2.3 .3 213.3 1.8 .3
Recreation 4 .................................................... 102.6 1.0 .1 101.0 .9 .1 101.6 .3 -.3 100.2 .5 .6
Education and communication 4 .................... 100.3 1.3 -.1 102.5 2.5 .0 101.0 1.0 .3 100.8 .6 -.3
Other goods and services ............................. 267.9 9.8 -.8 253.3 12.1 -.6 251.1 13.1 .1 261.2 12.5 -.2
Commodity and service group
All items ............................................................. 168.3 1.4 -.1 156.5 1.5 -.1 158.0 1.5 .1 162.7 2.1 .2Commodities ................................................... 143.7 .6 -.4 139.9 .3 -.4 142.2 .8 -.2 143.3 .9 .1
Commodities less food and beverages .... 129.0 -.9 -.7 128.8 -.8 -.5 132.0 .0 -.2 129.3 -.2 -.1Nondurables less food and beverages .... 128.7 -1.0 -.8 132.2 -.1 -.2 134.1 .6 .0 131.9 1.4 .5
Nondurables less food, beverages, andapparel .............................................. 137.3 .3 -1.3 138.5 .7 -1.1 136.3 1.2 -.4 141.2 2.4 -.3
Durables ..................................................... 126.9 -.7 -.4 123.0 -1.7 -1.0 128.2 -.7 -.5 126.3 -1.9 -.6Sen/ices ........................................................... 197.2 2.1 .2 177.0 2.6 .3 177.3 2.1 .2 183.7 3.1 .3
Rent of shelter3 ............................................ 188.0 2.7 .4 171.6 2.8 .4 158.7 2.9 .3 173.2 4.0 .3Transportation services .............................. 187.1 .0 .0 184.5 1.3 .4 190.3 .6 .2 187.1 1.2 .2Other services .............................................. 236.2 2.8 .2 206.1 4.1 .3 216.1 2.9 .2 210.8 2.4 .3
See footnotes at end of table.
59Digitized for FRASER http://fraser.stlouisfed.org/ Federal Reserve Bank of St. Louis
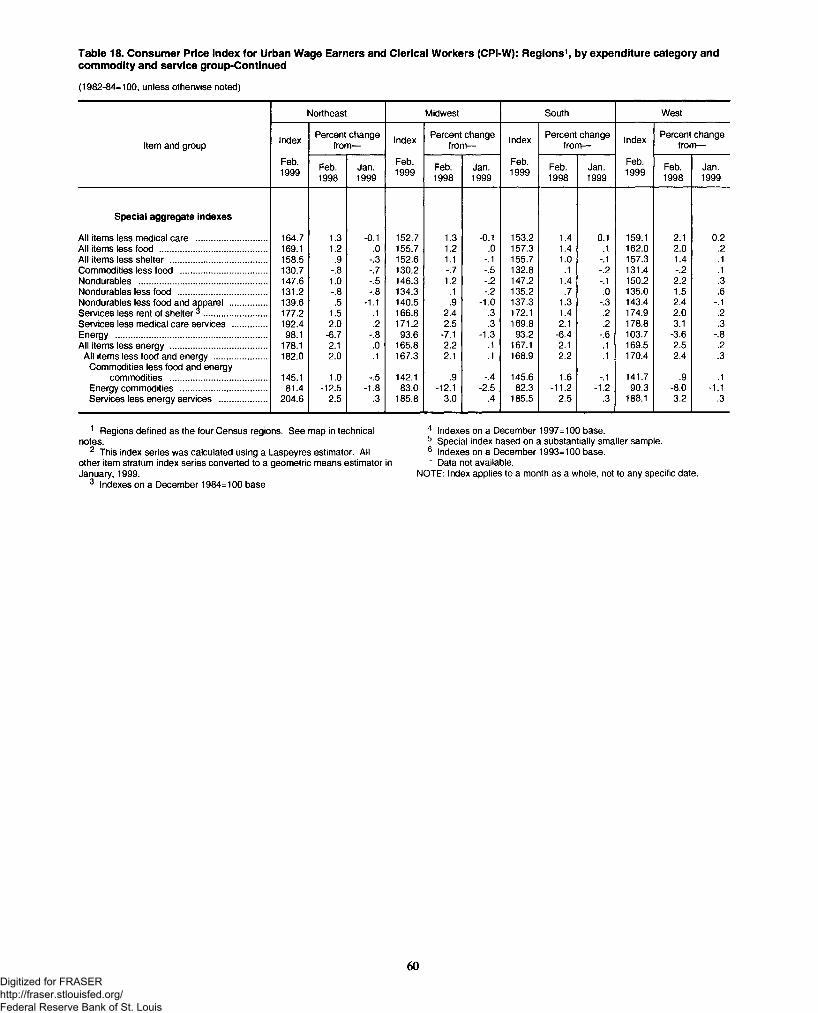
Table 18. Consumer Price Index for Urban Wage Earners and Clerical Workers (CPI-W): Regions1, by expenditure category andcommodity and service group-Continued
(1982-84=100, unless otherwise noted)
Northeast Midwest South West
Item and group Index Percent change from— Index Percent change
from— Index Percent change from— Index Percent change
from—
Feb.1999 Feb.
1998Jan.1999
Feb.1999 Feb.
1998Jan.1999
Feb.1999 Feb.
1998Jan.1999
Feb.1999 Feb.
1998Jan.1999
Special aggregate indexes
All items less medical care ............................. 164.7 1.3 -0.1 152.7 1.3 -0.1 153.2 1.4 0.1.1
159.1 2.1 0.2All items less food ............................................. 169.1 1.2 .0 155.7 1.2
1.1.0 157.3 1.4 162.0 2.0 .2
All items less shelter ........................................ 158.5 .9 -.3 152.6 -.1 155.7 1.0 -.1 157.3 1.4 .1.1Commodities less food .................................... 130.7 -.8 -.7 130.2 -.7 -.5 132.8 .1 -.2 131.4 -.2
Nondurables ..................................................... 147.6 1.0 -.5 146.3 1.2 -.2 147.2 1.4 -.1 150.2 2.2 .3Nondurables less food ..................................... 131.2 -.8 -.8 134.3 .1 -.2 135.2 .7 .0 135.0 1.5 .6Nondurables less food and apparel ............... 139.6 .5 -1.1
.1140.5 .9 -1.0 137.3 1.3 -.3 143.4 2.4 -.1
Services less rent of shelter ^ .......................... 177.2 1.5 166.8 2.4 .3 172.1 1.4 .2 174.9 2.0 .2Services less medical care services .............. 192.4 2.0 .2 171.2 2.5 .3 169.8 2.1 .2 178.8 3.1 .3Energy ............................................................... 98.1 -6.7 -.8 93.6 -7.1 -1.3 93.2 -6.4 -.6 103.7 -3.6 -.8All items less energy ........................................ 178.1 2.1 .0 165.8 2.2 .1 167.1 2.1 .1 169.5 2.5 .2
All items less food and energy ...................... 182.0 2.0 .1 167.3 2.1 .1 168.9 2.2 .1 170.4 2.4 .3
.1Commodities less food and energy
commodities ........................................ 145.1 1.0 -.5 142.1 .9 -.4 145.6 1.6 -.1 141.7 .9Energy commodities .................................... 81.4 -12.5 -1.8 83.0 -12.1 -2.5 82.3 -11.2 -1.2 90.3 -8.0 -1.1Services less energy services .................... 204.6 2.5 .3 185.8 3.0 .4 185.5 2.5 .3 188.1 3.2 .3
1 Regions defined as the four Census regions. See map in technical notes.
2 This index series was calculated using a Laspeyres estimator. All other item stratum index series converted to a geometric means estimator in January, 1999.
3 Indexes on a December 1984=100 base
4 Indexes on a December 1997=100 base.5 Special index based on a substantially smaller sample.6 Indexes on a December 1993=100 base.' Data not available.
NOTE: Index applies to a month as a whole, not to any specific date.
60Digitized for FRASER http://fraser.stlouisfed.org/ Federal Reserve Bank of St. Louis
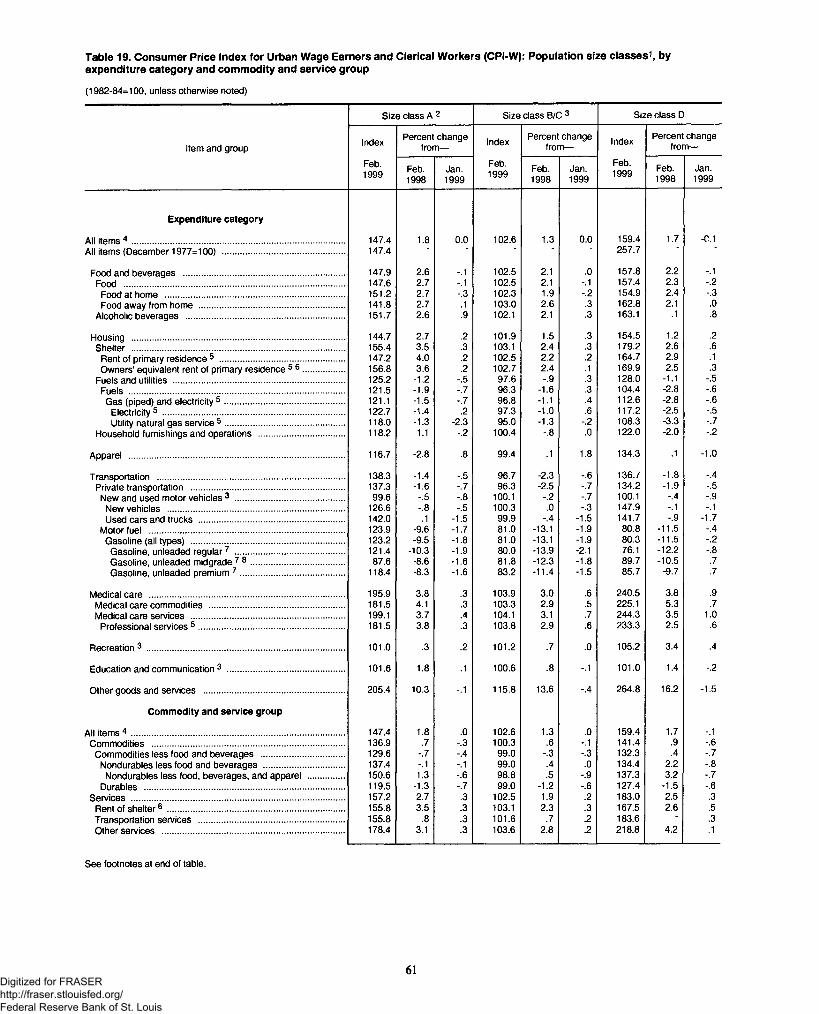
Table 19. Consumer Price Index for Urban Wage Earners and Clerical Workers (CPI-W): Population size classes1, byexpenditure category and commodity and service group
(1982-84=100, unless otherwise noted)
Size class A 2 Size class B/C 3 Size class D
Item and groupIndex Percent change
from— Index Percent change from—
Index Percent change from—
Feb.1999 Feb.
1998Jan.1999
Feb.1999 Feb.
1998Jan.1999
Feb.1999 Feb.
1998Jan.1999
Expenditure category
All items 4 ......................................................................................... 147.4 1.8 0.0 102.6 1.3 0.0 159.4 1.7 -0.1All items (December 1977-100) ................................................... 147.4 257.7
Food and beverages ................................................................... 147.9 2.6 -.1 102.5 2.1 .0 157.8 2.2 -.1Food ............................................................................................ 147.6 2.7 -.1 102.5 2.1 -.1 157.4 2.3 -.2
Food at home ........................................................................... 151.2 2.7 -.3 102.3 1.9 -.2 154.9 2.4 -.3Food away from home ............................................................. 141.8 2.7 .1 103.0 2.6 .3 162.8 2.1 .0
Alcoholic beverages .................................................................. 151.7 2.6 .9 102.1 2.1 .3 163.1 .1 .8
Housing ......................................................................................... 144.7 2.7 .2 101.9 1.5 .3 154.5 1.2 .2Shelter ......................................................................................... 155.4 3.5 .3 103.1 2.4 .3 179.2 2.6 .6
Rent of primary residence 5 .................................................... 147.2 4.0 .2 102.5 2.2 .2 164.7 2.9 .1Owners’ equivalent rent of primary residence 5 6 ................. 156.8 3.6 .2 102.7 2.4 .1 169.9 2.5 .3
Fuels and utilities ....................................................................... 125.2 -1.2 -.5 97.6 -.9 .3 128.0 -1.1 -.5Fuels .......................................................................................... 121.5 -1.9 -.7 96.3 -1.6 .3 104.4 -2.8 -.6
Gas (piped) and electricity 5 .................................................. 121.1 -1.5 -.7 96.8 -1.1 .4 112.6 -2.8 -.6Electricity5 ............................................................................ 122.7 -1.4 .2 97.3 -1.0 .6 117.2 -2.5 -.5Utility natural gas service 5 .................................................. 118.0 -1.3 -2.3 95.0 -1.3 -.2 108.3 -3.3 -.7
Household furnishings and operations .................................... 118.2 1.1 -.2 100.4 -.8 .0 122.0 -2.0 -.2
Apparel .......................................................................................... 116.7 -2.8 .8 99.4 .1 1.8 134.3 .1 -1.0
Transportation .............................................................................. 138.3 -1.4 -.5 96.7 -2.3 -.6 136.7 -1.8 -.4Private transportation ................................................................ 137.3 -1.6 -.7 96.3 -2.5 -.7 134.2 -1.9 -.5New and used motor vehicles 3 .............................................. 99.6 -.5 -.8 100.1 -.2 -.7 100.1 -.4 -.9
New vehicles .......................................................................... 126.6 -.8 -.5 100.3 .0 -.3 147.9 -.1 -.1Used cars and trucks ............................................................. 142.0 .1 -1.5 99.9 -.4 -1.5 141.7 -.9 -1.7
Motor fuel ................................................................................. 123.9 -9.6 -1.7 81.0 -13.1 -1.9 80.8 -11.5 -.4Gasoline (all types) ................................................................ 123.2 -9.5 -1.8 81.0 -13.1 -1.9 80.3 -11.5 -.2
Gasoline, unleaded regular7 .............................................. 121.4 -10.3 -1.9 80.0 -13.9 -2.1 76.1 -12.2 -.8Gasoline, unleaded midgrade 7 8 ....................................... 87.6 -8.6 -1.6 81.8 -12.3 -1.8 89.7 -10.5 .7Gasoline, unleaded premium 7 ........................................... 118.4 -8.3 -1.6 83.2 -11.4 -1.5 85.7 -9.7 .7
Medical care ................................................................................. 195.9 3.8 .3 103.9 3.0 .6 240.5 3.8 .9Medical care commodities ........................................................ 181.5 4.1 .3 103.3 2.9 .5 225.1 5.3 .7Medical care services ................................................................ 199.1 3.7 .4 104.1 3.1 .7 244.3 3.5 1.0
Professional services 5 ............................................................. 181.5 3.8 .3 103.8 2.9 .6 233.3 2.5 .6
Recreation3 .................................................................................. 101.0 .3 .2 101.2 .7 .0 105.2 3.4 .4
Education and communication 3 ................................................. 101.6 1.8 .1 100.6 .8 -.1 101.0 1.4 -.2
Other goods and services ........................................................... 205.4 10.3 -.1 115.8 13.6 -.4 264.8 16.2 -1.5
Commodity and service group
All items 4 ......................................................................................... 147.4 1.8 .0 102.6 1.3 .0 159.4 1.7 -.1Commodities ................................................................................ 136.9 .7 -.3 100.3 .6 -.1 141.4 .9 -.6
Commodities less food and beverages ................................... 129.6 -.7 -.4 99.0 -.3 -.3 132.3 .4 -.7Nondurables less food and beverages .................................. 137.4 -.1 -.1 99.0 .4 .0 134.4 2.2 -.8
Nondurables less food, beverages, and apparel ............... 150.6 1.3 -.6 98.8 .5 -.9 137.3 3.2 -.7Durables .................................................................................... 119.5 -1.3 -.7 99.0 -1.2 -.6 127.4 -1.5 -.6
Services ......................................................................................... 157.2 2.7 .3 102.5 1.9 .2 183.0 2.5 .3Rent of shelter6 .......................................................................... 155.8 3.5 .3 103.1 2.3 .3 167.5 2.6 .5Transportation services ............................................................. 155.8 .8 .3 101.6 .7 .2 183.6 ■ .3Other sen/ices ............................................................................ 178.4 3.1 .3 103.6 2.8 .2 218.8 4.2 .1
See footnotes at end of table.
61Digitized for FRASER http://fraser.stlouisfed.org/ Federal Reserve Bank of St. Louis
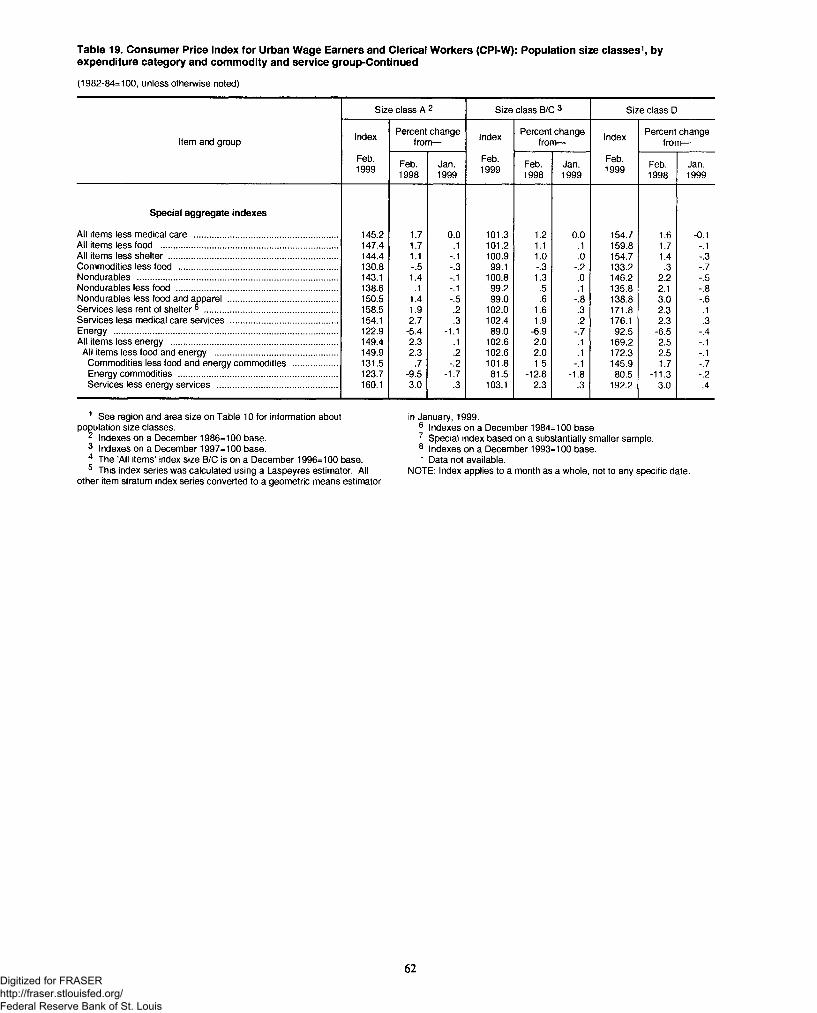
(1982-84=100, unless otherwise noted)
Table 19. Consumer Price Index for Urban Wage Earners and Clerical Workers (CPI-W): Population size classes1, byexpenditure category and commodity and service group-Continued
Size class A 2 Size class B/C 3 Size class D
Item and group Index Percent change from— Index Percent change
from— Index Percent change from—
Feb.1999 Feb.
1998Jan.1999
Feb.1999 Feb.
1998Jan.1999
Feb.1999 Feb.
1998Jan.1999
Special aggregate indexes
All items less medical care ............................................................ 145.2 1.7 0.0 101.3 1.2 0.0 154.7 1.6 -0.1All items less food .......................................................................... 147.4 1.7 .1 101.2 1.1 .1 159.8 1.7 -.1All items less shelter ...................................................................... 144.4 1.1 -.1 100.9 1.0 .0 154.7 1.4 -.3Commodities less food .................................................................. 130.8 -.5 -.3 99.1 -.3 -.2 133.2 .3 -.7Nondurables ................................................................................... 143.1 1.4 -.1 100.8 1.3 .0 146.2 2.2 -.5Nondurables less food ................................................................... 138.6 .1 -.1 99.2 .5 .1 135.8 2.1 -.8Nondurables less food and apparel ..............................................Services less rent of shelter ® .......................................................
150.5 1.4 -.5 99.0 .6 -.8 138.8 3.0 -.6158.5 1.9 .2 102.0 1.6 .3 171.8 2.3 .1
Services less medical care services ............................................. 154.1 2.7 .3 102.4 1.9 .2 176.1 2.3 .3Energy ............................................................................................. 122.9 -5.4 -1.1 89.0 -6.9 -.7 92.5 -6.5 -.4All items less energy ..................................................................... 149.4 2.3 .1 102.6 2.0 .1 169.2 2.5 -.1All items less food and energy ................................................... 149.9 2.3 .2 102.6 2.0 .1 172.3 2.5 -.1
Commodities less food and energy commodities .................. 131.5 .7 -.2 101.8 1.5 -.1 145.9 1.7 -.7Energy commodities .................................................................. 123.7 -9.5 -1.7 81.5 -12.8 -1.8 80.5 -11.3 -.2Services less energy services .................................................. 160.1 3.0 .3 103.1 2.3 .3 192.2 3.0 .4
1 See region and area size on Table 10 for information about population size classes.
2 Indexes on a December 1986=100 base.3 Indexes on a December 1997=100 base.4 The ’All items’ index size B/C is on a December 1996=100 base.5 This index series was calculated using a Laspeyres estimator. All
other item stratum index series converted to a geometric means estimator
in January, 1999.6 Indexes on a December 1984=100 base7 Special index based on a substantially smaller sample.8 Indexes on a December 1993=100 base.' Data not available.
NOTE: Index applies to a month as a whole, not to any specific date.
62Digitized for FRASER http://fraser.stlouisfed.org/ Federal Reserve Bank of St. Louis
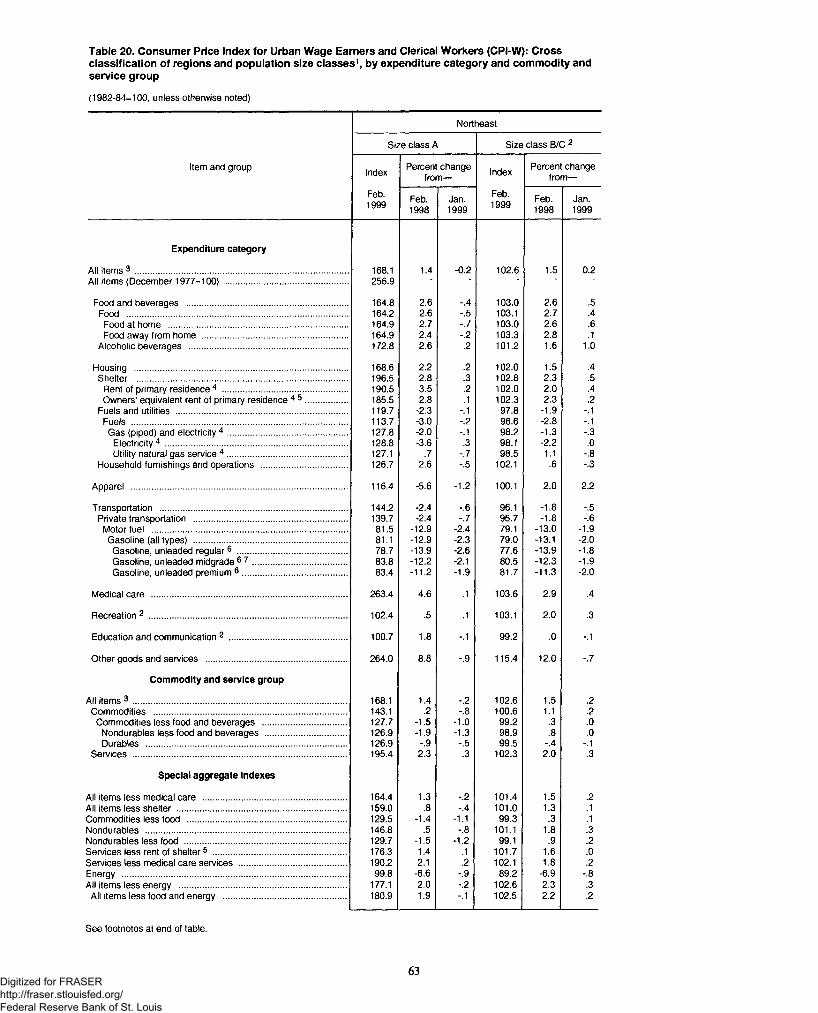
Table 20. Consumer Price Index for Urban Wage Earners and Clerical Workers (CPI-W): Crossclassification of regions and population size classes1, by expenditure category and commodity andservice group
(1982-84=100, unless otherwise noted)
Northeast
Size class A Size class B/C 2
Item and group Index Percent change from— Index Percent change
from—
Feb.1999 Feb.
1998Jan.1999
Feb.1999 Feb.
1998Jan.1999
Expenditure category
All items 3 ......................................................................................... 168.1 1.4 -0.2 102.6 1.5 0.2All items (December 1977=100) ................................................... 256.9 ' ' '
Food and beverages ................................................................... 164.8 2.6 -.4 103.0 2.6 .5Food ............................................................................................ 164.2 2.6 -.5 103.1 2.7 .4
Food at home ........................................................................... 164.9 2.7 -.7 103.0 2.6 .6Food away from home ............................................................. 164.9 2.4 -.2 103.3 2.8 .1
Alcoholic beverages .................................................................. 172.8 2.6 .2 101.2 1.6 1.0
Housing ......................................................................................... 168.6 2.2 .2 102.0 1.5 .4Shelter ......................................................................................... 196.5 2.8 .3 102.8 2.3 .5
Rent of primary residence 4 .................................................... 190.5 3.5 .2 102.0 2.0 .4Owners’ equivalent rent of primary residence 4 5 ................. 185.5 2.8 .1 102.3 2.3 .2
Fuels and utilities ........................................................................ 119.7 -2.3 -.1 97.8 -1.9 -.1Fuels .......................................................................................... 113.7 -3.0 -.2 96.6 -2.8 -.1Gas (piped) and electricity 4 .................................................. 127.8 -2.0 -.1 98.2 -1.3 -.3
Electricity 4 ............................................................................ 128.8 -3.6 .3 98.1 -2.2 .0Utility natural gas service 4 .................................................. 127.1 .7 -.7 98.5 1.1 -.8
Household furnishings and operations .................................... 126.7 2.6 -.5 102.1 .6 -.3
Apparel .......................................................................................... 116.4 -5.6 -1.2 100.1 2.0 2.2
Transportation .............................................................................. 144.2 -2.4 -.6 96.1 -1.8 -.5Private transportation ................................................................ 139.7 -2.4 -.7 95.7 -1.8 -.6Motor fuel ................................................................................. 81.5 -12.9 -2.4 79.1 -13.0 -1.9
Gasoline (all types) ................................................................ 81.1 -12.9 -2.3 79.0 -13.1 -2.0Gasoline, unleaded regular6 .............................................. 78.7 -13.9 -2.6 77.6 -13.9 -1.8Gasoline, unleaded midgrade 6 7 ....................................... 83.8 -12.2 -2.1 80.5 -12.3 -1.9Gasoline, unleaded premium 6 ............................................ 83.4 -11.2 -1.9 81.7 -11.3 -2.0
Medical care .................................................................................. 263.4 4.6 .1 103.6 2.9 .4
Recreation 2 ................................................................................... 102.4 .5 .1 103.1 2.0 .3
Education and communication 2 ................................................. 100.7 1.8 -.1 99.2 .0 -.1
Other goods and services ........................................................... 264.0 8.8 -.9 115.4 12.0 -.7
Commodity and service group
All items 3 ......................................................................................... 168.1 1.4 -.2 102.6 1.5 .2Commodities ................................................................................ 143.1 .2 -.8 100.6 1.1 .2
Commodities less food and beverages ................................... 127.7 -1.5 -1.0 99.2 .3 .0Nondurables less food and beverages .................................. 126.9 -1.9 -1.3 98.9 .8 .0Durables .................................................................................... 126.9 -.9 -.5 99.5 -.4 -.1
Services ......................................................................................... 195.4 2.3 .3 102.3 2.0 .3
Special aggregate indexes
All items less medical care ............................................................ 164.4 1.3 -.2 101.4 1.5 .2All items less shelter ....................................................................... 159.0 .8 -.4 101.0 1.3 .1Commodities less food .................................................................. 129.5 -1.4 -1.1 99.3 .3 .1Nondurables .................................................................................... 146.8 .5 -.8 101.1 1.8 .3Nondurables less food ................................................................... 129.7 -1.5 -1.2 99.1 .9 .2Services less rent of shelter5 ........................................................ 176.3 1.4 .1 101.7 1.6 .0Services less medical care services ............................................. 190.2 2.1 .2 102.1 1.8 .2Energy ............................................................................................. 99.8 -6.6 -.9 89.2 -6.9 -.8All items less energy ...................................................................... 177.1 2.0 -.2 102.6 2.3 .3
All items less food and energy ................................................... 180.9 1.9 -.1 102.5 2.2 .2
See footnotes at end of table.
63Digitized for FRASER http://fraser.stlouisfed.org/ Federal Reserve Bank of St. Louis
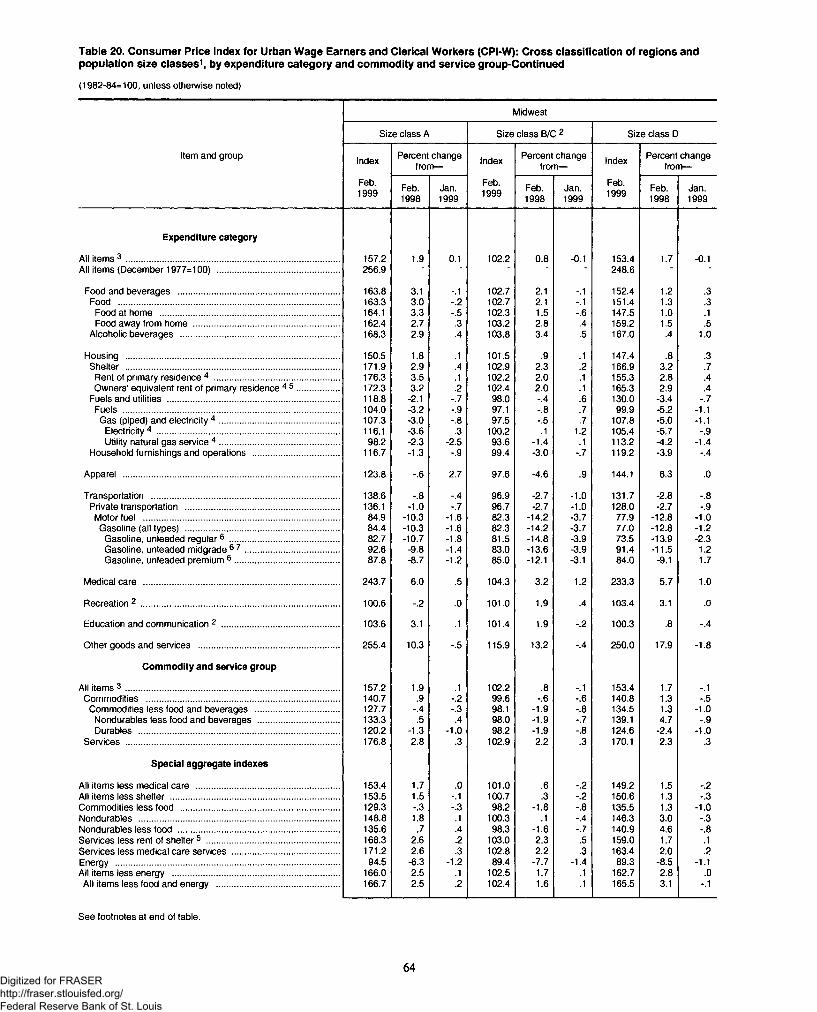
Table 20. Consumer Price Index for Urban Wage Earners and Clerical Workers (CPI-W): Cross classification of regions andpopulation size classes1, by expenditure category and commodity and service group-Continued
(1982-84=100, unless otherwise noted)
Midwest
Size class A Size class B/C 2 Size class D
Item and group Index Percent change from— Index Percent change
from— Index Percent change from—
Feb.1999 Feb.
1998Jan.1999
Feb.1999 Feb.
1998Jan.1999
Feb.1999 Feb.
1998Jan.1999
Expenditure category
All items 3 ......................................................................................... 157.2 1.9 0.1 102.2 0.8 -0.1 153.4 1.7 -0.1All items (December 1977=100) ................................................... 256.9 ' ■ ' ' ■ 248.6 ■ ~
Food and beverages ................................................................... 163.8 3.1 -.1 102.7 2.1 -.1 152.4 1.2 .3Food ............................................................................................ 163.3 3.0 -.2 102.7 2.1 -.1 151.4 1.3 .3
Food at home ........................................................................... 164.1 3.3 -.5 102.3 1.5 -.6 147.5 1.0 .1Food away from home ............................................................. 162.4 2.7 .3 103.2 2.8 .4 159.2 1.5 .5
Alcoholic beverages .................................................................. 168.3 2.9 .4 103.8 3.4 .5 167.0 .4 1.0
Housing ......................................................................................... 150.5 1.8 .1 101.5 .9 .1 147.4 .8 .3Shelter ......................................................................................... 171.9 2.9 .4 102.9 2.3 .2 166.9 3.2 .7
Rent of primary residence 4 .................................................... 176.3 3.5 .1 102.2 2.0 .1 155.3 2.8 .4Owners’ equivalent rent of primary residence 4 5 .................. 172.3 3.2 .2 102.4 2.0 .1 165.3 2.9 .4
Fuels and utilities ........................................................................ 118.8 -2.1 -.7 98.0 -.4 .6 130.0 -3.4 -.7Fuels .......................................................................................... 104.0 -3.2 -.9 97.1 -.8 .7 99.9 -5.2 -1.1
Gas (piped) and electricity 4 .................................................. 107.3 -3.0 -.8 97.5 -.5 .7 107.8 -5.0 -1.1Electricity 4 ............................................................................ 116.1 -3.6 .3 100.2 .1 1.2 105.4 -5.7 -.9Utility natural gas service 4 .................................................. 98.2 -2.3 -2.5 93.6 -1.4 .1 113.2 -4.2 -1.4
Household furnishings and operations .................................... 116.7 -1.3 -.9 99.4 -3.0 -.7 119.2 -3.9 -.4
Apparel .......................................................................................... 123.8 -.6 2.7 97.6 -4.6 .9 144.1 6.3 .0
Transportation .............................................................................. 138.6 -.8 -.4 96.9 -2.7 -1.0 131.7 -2.8 -.8Private transportation ................................................................ 136.1 -1.0 -.7 96.7 -2.7 -1.0 128.0 -2.7 -.9Motor fuel .................................................................................. 84.9 -10.3 -1.6 82.3 -14.2 -3.7 77.9 -12.8 -1.0Gasoline (all types) ................................................................ 84.4 -10.3 -1.6 82.3 -14.2 -3.7 77.0 -12.8 -1.2
Gasoline, unleaded regular6 .............................................. 82.7 -10.7 -1.8 81.5 -14.8 -3.9 73.5 -13.9 -2.3Gasoline, unleaded midgrade 6 7 ....................................... 92.6 -9.8 -1.4 83.0 -13.6 -3.9 91.4 -11.5 1.2Gasoline, unleaded premium 6 ........................................... 87.8 -8.7 -1.2 85.0 -12.1 -3.1 84.0 -9.1 1.7
Medical care .................................................................................. 243.7 6.0 .5 104.3 3.2 1.2 233.3 5.7 1.0
Recreation 2 ................................................................................... 100.6 -.2 .0 101.0 1.9 .4 103.4 3.1 .0
Education and communication 2 ................................................. 103.6 3.1 .1 101.4 1.9 -.2 100.3 .8 -.4
Other goods and services ........................................................... 255.4 10.3 -.5 115.9 13.2 -.4 250.0 17.9 -1.8
Commodity and service group
All items 3 ......................................................................................... 157.2 1.9 .1 102.2 .8 -.1 153.4 1.7 -.1Commodities ................................................................................ 140.7 .9 -.2 99.6 -.6 -.6 140.8 1.3 -.5
Commodities less food and beverages ................................... 127.7 -.4 -.3 98.1 -1.9 -.8 134.5 1.3 -1.0Nondurables less food and beverages .................................. 133.3 .5 .4 98.0 -1.9 -.7 139.1 4.7 -.9Durables .................................................................................... 120.2 -1.3 -1.0 98.2 -1.9 -.8 124.6 -2.4 -1.0
Services ......................................................................................... 176.8 2.8 .3 102.9 2.2 .3 170.1 2.3 .3
Special aggregate indexes
All items less medical care ............................................................ 153.4 1.7 .0 101.0 .6 -.2 149.2 1.5 -.2All items less shelter ...................................................................... 153.5 1.5 -.1 100.7 .3 -.2 150.6 1.3 -.3Commodities less food .................................................................. 129.3 -.3 -.3 98.2 -1.8 -.8 135.5 1.3 -1.0Nondurables .................................................................................... 148.8 1.8 .1 100.3 .1 -.4 146.3 3.0 -.3Nondurables less food ................................................................... 135.6 .7 .4 98.3 -1.6 -.7 140.9 4.6 -.8Services less rent of shelter5 ....................................................... 168.3 2.6 .2 103.0 2.3 .5 159.0 1.7 .1Services less medical care services ............................................. 171.2 2.6 .3 102.8 2.2 .3 163.4 2.0 .2Energy ............................................................................................. 94.5 -6.3 -1.2 89.4 -7.7 -1.4 89.3 -8.5 -1.1All items less energy ...................................................................... 166.0 2.5 .1 102.5 1.7 .1 162.7 2.8 .0All items less food and energy ................................................... 166.7 2.5 .2 102.4 1.6 .1 165.5 3.1 -.1
See footnotes at end of table.
64Digitized for FRASER http://fraser.stlouisfed.org/ Federal Reserve Bank of St. Louis
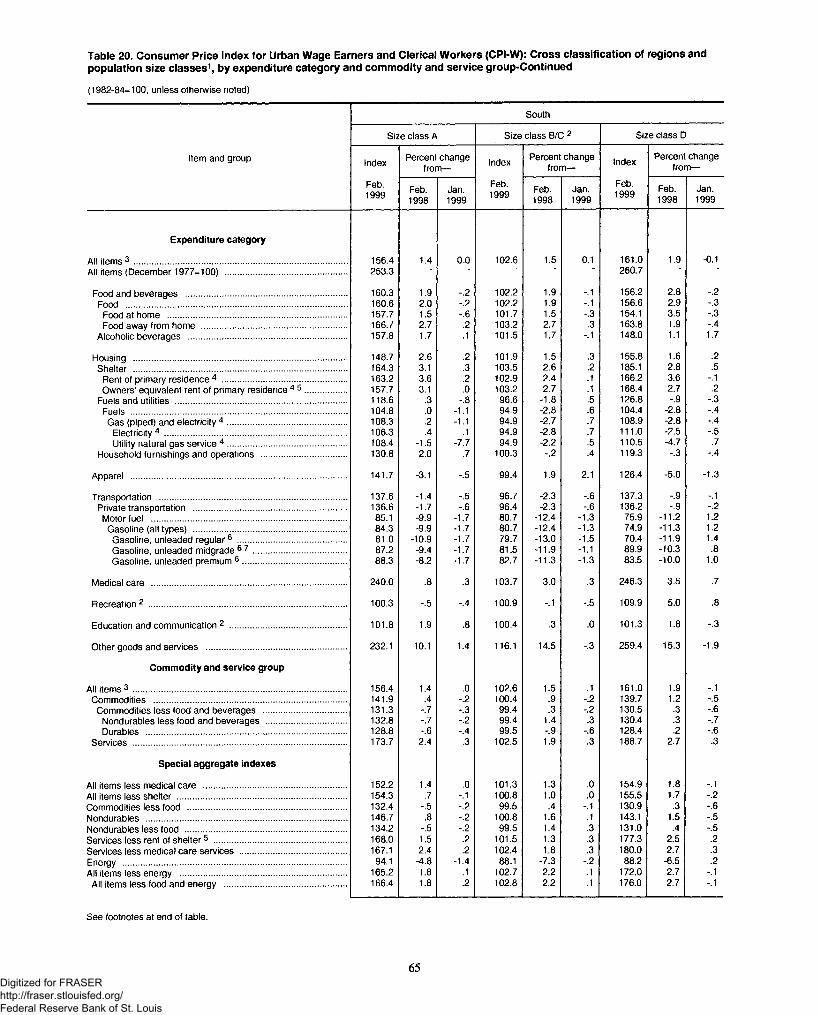
Table 20. Consumer Price Index for Urban Wage Earners and Clerical Workers (CPI-W): Cross classification of regions andpopulation size classes1, by expenditure category and commodity and service group-Continued
(1982-84=100, unless otherwise noted)
South
Size class A Size class B/C 2 Size class D
Item and group Index Percent change from— Index Percent change
from— Index Percent change from—
Feb.1999 Feb.
1998Jan.1999
Feb.1999 Feb.
1998Jan.1999
Feb.1999 Feb.
1998Jan.1999
Expenditure category
All items 3 ......................................................................................... 156.4 1.4 0.0 102.6 1.5 0.1 161.0 1.9 -0.1All items (December 1977-100) ................................................... 253.3 - - 260.7 - -
Food and beverages ................................................................... 160.3 1.9 -.2 102.2 1.9 -.1 156.2 2.8 -.2Food ............................................................................................ 160.6 2.0 -.2 102.2 1.9 -.1 156.6 2.9 -.3
Food at home ........................................................................... 157.7 1.5 -.6 101.7 1.5 -.3 154.1 3.5 -.3Food away from home ............................................................. 166.7 2.7 .2 103.2 2.7 .3 163.8 1.9 -.4
Alcoholic beverages .................................................................. 157.8 1.7 .1 101.5 1.7 -.1 148.0 1.1 1.7
Housing ......................................................................................... 148.7 2.6 .2 101.9 1.5 .3 155.8 1.6 .2Shelter ......................................................................................... 164.3 3.1 .3 103.5 2.6 .2 185.1 2.8 .5
Rent of primary residence 4 .................................................... 163.2 3.6 .2 102.9 2.4 .1 166.2 3.6 -.1Owners’ equivalent rent of primary residence 4 5 ................. 157.7 3.1 .0 103.2 2.7 .1 168.4 2.7 .2
Fuels and utilities ....................................................................... 118.6 .3 -.8 96.6 -1.8 .5 126.8 -.9 -.3Fuels .......................................................................................... 104.8 .0 -1.1 94.9 -2.8 .6 104.4 -2.8 -.4Gas (piped) and electricity 4 .................................................. 108.3 .2 -1.1 94.9 -2.7 .7 108.9 -2.8 -.4
Electricity 4 ............................................................................ 106.3 .4 .1 94.9 -2.8 .7 111.0 -2.5 -.5Utility natural gas service 4 .................................................. 108.4 -1.5 -7.7 94.9 -2.2 .5 110.5 -4.7 .7
Household furnishings and operations .................................. 130.8 2.0 .7 100.3 -.2 .4 119.3 -.3 -.4
Apparel .......................................................................................... 141.7 -3.1 -.5 99.4 1.9 2.1 126.4 -5.0 -1.3
Transportation .............................................................................. 137.6 -1.4 -.5 96.7 -2.3 -.6 137.3 -.9 -.1Private transportation ................................................................ 136.6 -1.7 -.6 96.4 -2.3 -.6 136.2 -.9 -.2Motor fuel ................................................................................. 85.1 -9.9 -1.7 80.7 -12.4 -1.3 75.9 -11.2 1.2
Gasoline (all types) ................................................................ 84.3 -9.9 -1.7 80.7 -12.4 -1.3 74.9 -11.3 1.2Gasoline unleaded regular6 .............................................. 81.0 -10.9 -1.7 79.7 -13.0 -1.5 70.4 -11.9 1.4Gasoline unleaded midgrade 6 7 ....................................... 87.2 -9.4 -1.7 81.5 -11.9 -1.1 89.9 -10.3 .8Gasoline, unleaded premium ® ........................................... 88.3 -8.2 -1.7 82.7 -11.3 -1.3 83.5 -10.0 1.0
Medical care ................................................................................. 240.0 .8 .3 103.7 3.0 .3 246.3 3.5 .7
Recreation 2 ................................................................................... 100.3 -.5 -.4 100.9 -.1 -.5 109.9 5.0 .8
Education and communication 2 ................................................. 101.8 1.9 .8 100.4 .3 .0 101.3 1.8 -.3
Other goods and services .......................................................... 232.1 10.1 1.4 116.1 14.5 -.3 259.4 15.3 -1.9
Commodity and service group
All items 3 ......................................................................................... 156.4 1.4 .0 102.6 1.5 .1 161.0 1.9 -.1Commodities ................................................................................ 141.9 .4 -.2 100.4 .9 -.2 139.7 1.2 -.5
Commodities less food and beverages ................................... 131.3 -.7 -.3 99.4 .3 -.2 130.5 .3 -.6Nondurables less food and beverages .................................. 132.8 -.7 -.2 99.4 1.4 .3 130.4 .3 -.7Durables .................................................................................... 128.8 -.6 -.4 99.5 -.9 -.6 128.4 .2 -.6
Services ......................................................................................... 173.7 2.4 .3 102.5 1.9 .3 188.7 2.7 .3
Special aggregate indexes
All items less medical care ............................................................ 152.2 1.4 .0 101.3 1.3 .0 154.9 1.8 -.1All items less shelter ....................................................................... 154.3 .7 -.1 100.8 1.0 .0 155.5 1.7 -.2Commodities less food .................................................................. 132.4 -.5 -.2 99.5 .4 -.1 130.9 .3 -.6Nondurables ................................................................................... 146.7 .8 -.2 100.8 1.6 .1 143.1 1.5 -.5Nondurables less food ................................................................... 134.2 -.5 -.2 99.5 1.4 .3 131.0 .4 -.5Services less rent of shelter5 ....................................................... 168.0 1.5 .2 101.5 1.3 .3 177.3 2.5 .2Services less medical care services ............................................ 167.1 2.4 .2 102.4 1.8 .3 180.0 2.7 .3Energy ......................................................................................... 94.1 -4.8 -1.4 88.1 -7.3 -.2 88.2 -6.5 .2All items less energy ..................................................................... 165.2 1.8 .1 102.7 2.2 .1 172.0 2.7 -.1
All items less food and energy ................................................... 166.4 1.8 .2 102.8 2.2 .1 176.0 2.7 -.1
See footnotes at end of table.
65Digitized for FRASER http://fraser.stlouisfed.org/ Federal Reserve Bank of St. Louis
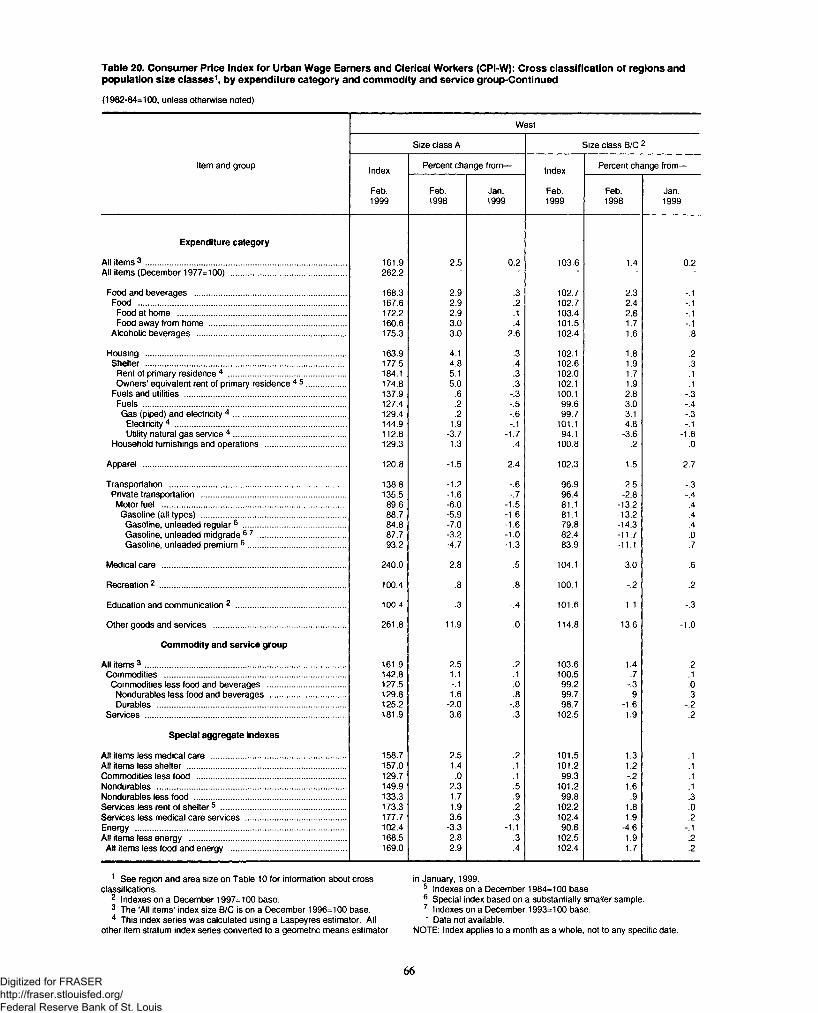
Table 20. Consumer Price Index for Urban Wage Earners and Clerical Workers (CPI-W): Cross classification of regions andpopulation size classes1, by expenditure category and commodity and service group-Continued
(1982-84=100, unless otherwise noted)
West
Size class A Size class B/C:2
Item and group Index Percent change from— Index Percent change from—
Feb.1999
Feb.1998
Jan.1999
Feb.1999
Feb.1998
Jan.1999
Expenditure category
All items 3 .................................................................................... 161.9 2.5 0.2 103.6 1.4 0.2All items (December 1977=100) ................................................ 262.2 * ■ ■ *
Food and beverages ............................................................... 168.3 2.9 .3 102.7 2.3 -.1Food ....................................................................................... 167.6 2.9 .2 102.7 2.4 -.1Food at home ...................................................................... 172.2 2.9 .1 103.4 2.8 -.1Food away from home ......................................................... 160.6 3.0 .4 101.5 1.7 -.1
Alcoholic beverages .............................................................. 175.3 3.0 2.6 102.4 1.6 .8
Housing ................................................................................... 163.9 4.1 .3 102.1 1.8 .2Shelter ................................................................................... 177.5 4.8 .4 102.6 1.9 .3
Rent of primary residence 4 ................................................. 184.1 5.1 .3 102.0 1.7 .1Owners’ equivalent rent of primary residence 4 5 ................ 174.8 5.0 .3 102.1 1.9 .1
Fuels and utilities ................................................................... 137.9 .6 -.3 100.1 2.8 -.3Fuels ..................................................................................... 127.4 .2 -.5 99.6 3.0 -.4Gas (piped) and electricity 4 ............................................... 129.4 .2 -.6 99.7 3.1 -.3
Electricity4 ....................................................................... 144.9 1.9 -.1 101.1 4.8 -.1Utility natural gas service 4 ............................................... 112.8 -3.7 -1.7 94.1 -3.6 -1.6
Household furnishings and operations .................................. 129.3 1.3 .4 100.8 .2 .0
Apparel ..................................................................................... 120.8 -1.5 2.4 102.3 1.5 2.7
Transportation ......................................................................... 138.8 -1.2 -.6 96.9 -2.5 -.3Private transportation ............................................................ 135.5 -1.6 -.7 96.4 -2.8 -.4Motor fuel ............................................................................. 89.6 -6.0 -1.5 81.1 -13.2 .4
Gasoline (all types) ............................................................ 88.7 -5.9 -1.6 81.1 -13.2 .4Gasoline, unleaded regular6 ........................................... 84.8 -7.0 -1.6 79.8 -14.3 .4Gasoline, unleaded midgrade 6 7 ..................................... 87.7 -3.2 -1.0 82.4 -11.7 .0Gasoline, unleaded premium 6 ......................................... 93.2 -4.7 -1.3 83.9 -11.1 .7
Medical care ............................................................................. 240.0 2.8 .5 104.1 3.0 .6
Recreation2 .............................................................................. 100.4 .8 .8 100.1 -.2 .2
Education and communication 2 .............................................. 100.4 .3 -.4 101.6 1.1 -.3
Other goods and services ....................................................... 261.8 11.9 .0 114.8 13.6 -1.0
Commodity and service group
All items 3 .................................................................................... 161.9 2.5 .2 103.6 1.4 .2Commodities ............................................................................ 142.8 1.1 .1 100.5 .7 .1Commodities less food and beverages ................................. 127.5 -.1 .0 99.2 -.3 .0
Nondurables less food and beverages ............................... 129.8 1.6 .8 99.7 .9 .3Durables ............................................................................... 125.2 -2.0 -.8 98.7 -1.6 -.2
Sen/ices ..;................................................................................. 181.9 3.6 .3 102.5 1.9 .2
Special aggregate indexes
All items less medical care ........................................................ 158.7 2.5 .2 101.5 1.3 .1All items less shelter .................................................................. 157.0 1.4 .1 101.2 1.2 .1Commodities less food .............................................................. 129.7 .0 .1 99.3 -.2 .1Nondurables ............................................................................... 149.9 2.3 .5 101.2 1.6 .1Nondurables less food ............................................................... 133.3 1.7 .9 99.8 .9 .3Services less rent of shelter5 .................................................... 173.3 1.9 .2 102.2 1.8 .0Services less medical care sen/ices .......................................... 177.7 3.6 .3 102.4 1.9 .2Energy ........................................................................................ 102.4 -3.3 -1.1 90.8 -4.6 -.1All items less energy ................................................................. 168.5 2.8 .3 102.5 1.9 .2All items less food and energy ................................................ 169.0 2.9 .4 102.4 1.7 .2
1 See region and area size on Table 10 for information about cross classifications.
2 Indexes on a December 1997=100 base.3 The ’All items’ index size B/C is on a December 1996=100 base.4 This index series was calculated using a Laspeyres estimator. All
other item stratum index series converted to a geometric means estimator
in January, 1999.5 Indexes on a December 1984=100 base6 Special index based on a substantially smaller sample.7 Indexes on a December 1993=100 base.‘ Data not available.
NOTE: Index applies to a month as a whole, not to any specific date.
66Digitized for FRASER http://fraser.stlouisfed.org/ Federal Reserve Bank of St. Louis
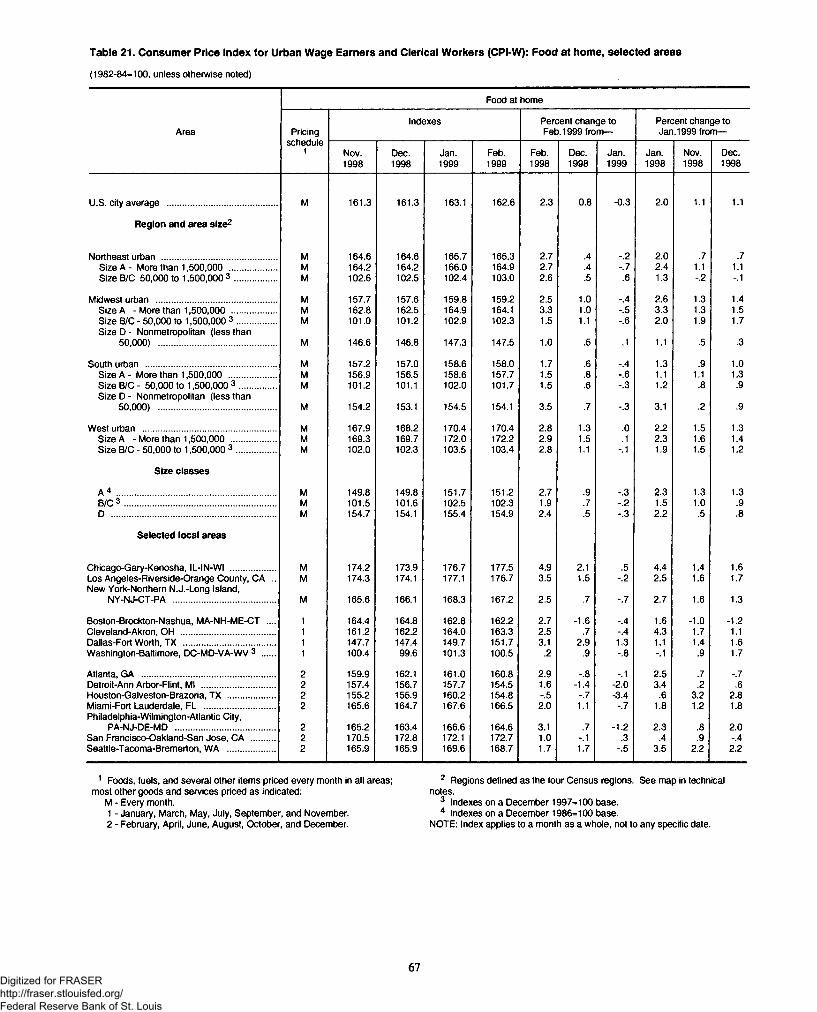
Table 21. Consumer Price Index for Urban Wage Earners and Clerical Workers (CPI-W): Food at home, selected areas
(1982-84= 100, unless otherwise noted)
Food at home
Area Pricingschedule
1
Indexes Percent change to Feb. 1999 from—
Percent change to Jan. 1999 from—
Nov.1998
Dec.1998
Jan.1999
Feb.1999
Feb.1998
Dec.1998
Jan.1999
Jan.1998
Nov.1998
Dec.1998
U.S. city average .............................................. M 161.3 161.3 163.1 162.6 2.3 0.8 -0.3 2.0 1.1 1.1
Region and area size2
Northeast urban ................................................ M 164.6 164.6 165.7 165.3 2.7 .4 -.2 2.0 .7 .7Size A - More than 1,500,000 .................... M 164.2 164.2 166.0 164.9 2.7 .4 -.7 2.4 1.1 1.1Size B/C 50,000 to 1,500,000 3 .................. M 102.6 102.5 102.4 103.0 2.6 .5 .6 1.3 -.2 -.1
Midwest urban .................................................. M 157.7 157.6 159.8 159.2 2.5 1.0 -.4 2.6 1.3 1.4Size A -M ore than 1,500,000 ................... M 162.8 162.5 164.9 164.1 3.3 1.0 -.5 3.3 1.3 1.5Size B/C - 50,000 to 1,500,000 3 ................. M 101.0 101.2 102.9 102.3 1.5 1.1 -.6 2.0 1.9 1.7Size D - Nonmetropolitan (less than
50,000) ................................................. M 146.6 146.8 147.3 147.5 1.0 .5 .1 1.1 .5 .3
South urban ....................................................... M 157.2 157.0 158.6 158.0 1.7 .6 -.4 1.3 .9 1.0Size A - More than 1,500,000 .................... M 156.9 156.5 158.6 157.7 1.5 .8 -.6 1.1 1.1 1.3Size B/C - 50,000 to 1,500,000 3 ............... M 101.2 101.1 102.0 101.7 1.5 .6 -.3 1.2 .8 .9Size D - Nonmetropolitan (less than
50,000) ................................................. M 154.2 153.1 154.5 154.1 3.5 .7 -.3 3.1 .2 .9
West urban ........................................................ M 167.9 168.2 170.4 170.4 2.8 1.3 .0 2.2 1.5 1.3Size A - More than 1,500,000 ................... M 169.3 169.7 172.0 172.2 2.9 1.5 .1 2.3 1.6 1.4Size B/C - 50,000 to 1,500,000 3 ................. M 102.0 102.3 103.5 103.4 2.8 1.1 -.1 1.9 1.5 1.2
Size classes
A 4 .................................................................. M 149.8 149.8 151.7 151.2 2.7 .9 -.3 2.3 1.3 1.3B/C 3 ............................................................... M 101.5 101.6 102.5 102.3 1.9 .7 -.2 1.5 1.0 .9D ..................................................................... M 154.7 154.1 155.4 154.9 2.4 .5 -.3 2.2 .5 .8
Selected local areas
Chicago-Gary-Kenosha, IL-IN-WI ................... M 174.2 173.9 176.7 177.5 4.9 2.1 .5 4.4 1.4 1.6Los Angeles-Riverside-Orange County, CA .. M 174.3 174.1 177.1 176.7 3.5 1.5 -.2 2.5 1.6 1.7New York-Northern N.J.-Long Island,
NY-NJ-CT-PA ........................................... M 165.6 166.1 168.3 167.2 2.5 .7 -.7 2.7 1.6 1.3
Boston-Brockton-Nashua, MA-NH-ME-CT .... 1 164.4 164.8 162.8 162.2 2.7 -1.6 -.4 1.6 -1.0 -1.2Cleveland-Akron, OH ....................................... 1 161.2 162.2 164.0 163.3 2.5 .7 -.4 4.3 1.7 1.1Dallas-Fort Worth, TX ...................................... 1 147.7 147.4 149.7 151.7 3.1 2.9 1.3 1.1 1.4 1.6Washington-Baltimore, DC-MD-VA-WV 3 ..... 1 100.4 99.6 101.3 100.5 .2 .9 -.8 -.1 .9 1.7
Atlanta, GA ........................................................ 2 159.9 162.1 161.0 160.8 2.9 -.8 -.1 2.5 .7 -.7Detroit-Ann Arbor-Flint, Ml ............................... 2 157.4 156.7 157.7 154.5 1.6 -1.4 -2.0 3.4 .2 .6Houston-Galveston-Brazoria, TX .................... 2 155.2 155.9 160.2 154.8 -.5 -.7 -3.4 .6 3.2 2.8Miami-Fort Lauderdale, FL .............................. 2 165.6 164.7 167.6 166.5 2.0 1.1 -.7 1.8 1.2 1.8Philadelphia-Wilmington-Atlantic City,
PA-NJ-DE-MD .......................................... 2 165.2 163.4 166.6 164.6 3.1 .7 -1.2 2.3 .8 2.0San Francisco-Oakland-San Jose, CA .......... 2 170.5 172.8 172.1 172.7 1.0 -.1 .3 .4 .9 -.4Seattle-Tacoma-Bremerton, WA .................... 2 165.9 165.9 169.6 168.7 1.7 1.7 -.5 3.5 2.2 2.2
1 Foods, fuels, and several other items priced every month in all areas; 2 Regions defined as the four Census regions. See map in technicalmost other goods and services priced as indicated: notes.
M - Every month. 3 Indexes on a December 1997=100 base.1 - January, March, May, July, September, and November. 4 Indexes on a December 1986=100 base.2 - February, April, June, August, October, and December. NOTE: Index applies to a month as a whole, not to any specific date.
67Digitized for FRASER http://fraser.stlouisfed.org/ Federal Reserve Bank of St. Louis
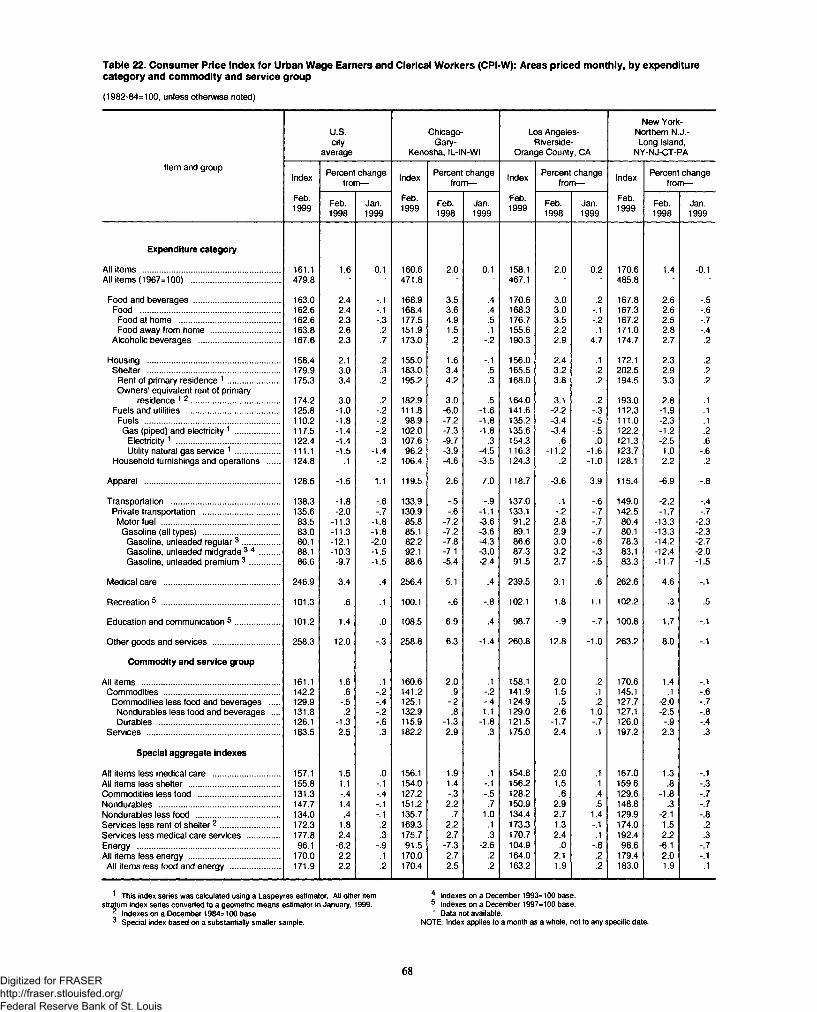
Table 22. Consumer Price Index for Urban Wage Earners and Clerical Workers (CPI-W): Areas priced monthly, by expenditurecategory and commodity and service group
(1982-84=100, unless otherwise noted)
U.S.city
average
Chicago- Gary-
Kenosha, IL-IN-WI
Los Angeles- Riverside-
Orange County, CA
New York- Northern N.J.- Long Island,
NY-NJ-CT-PA
Item and groupIndex Percent change
from— Index Percent change from— Index Percent change
from— Index Percent change from—
Feb.1999 Feb.
1998Jan.1999
Feb.1999 Feb.
1998Jan.1999
Feb.1999 Feb.
1998Jan.1999
Feb.1999 Feb.
1998Jan.1999
Expenditure category
All items ......................................................... 161.1 1.6 0.1 160.6 2.0 0.1 158.1 2.0 0.2 170.6 1.4 -0.1All items (1967=100) ..................................... 479.8 ■ ■ 471.8 ■ ■ 467.1 ■ ■ 485.8 ■ ■
Food and beverages .................................... 163.0 2.4 -.1 168.9 3.5 .4 170.6 3.0 .2 167.8 2.6 -.5Food .......................................................... 162.6 2.4 -.1 168.4 3.6 .4 168.3 3.0 -.1 167.3 2.6 -.6Food at home .......................................... 162.6 2.3 -.3 177.5 4.9 .5 176.7 3.5 -.2 167.2 2.5 -.7Food away from home ............................. 163.8 2.6 .2 151.9 1.5 .1 155.6 2.2 .1 171.0 2.8 -.4
Alcoholic beverages .................................. 167.6 2.3 .7 173.0 .2 -.2 190.3 2.9 4.7 174.7 2.7 .2
Housing ....................................................... 158.4 2.1 .2 155.0 1.6 -.1 156.0 2.4 .1 172.1 2.3 .2Shelter ....................................................... 179.9 3.0 .3 183.0 3.4 .5 165.5 3.2 .2 202.5 2.9 .2
Rent of primary residence 1 ...................... 175.3 3.4 .2 195.2 4.2 .3 168.0 3.8 .2 194.5 3.3 .2Owners’ equivalent rent of primary
residence 1 2 ..................................... 174.2 3.0 .2 182.9 3.0 .5 164.0 3.1 .2 193.0 2.8 .1Fuels and utilities ....................................... 125.8 -1.0 -.2 111.8 -6.0 -1.6 141.6 -2.2 -.3 112.3 -1.9 .1
Fuels ........................................................ 110.2 -1.8 -.2 98.9 -7.2 -1.8 135.2 -3.4 -.5 111.0 -2.3 .1Gas (piped) and electricity 1 ................... 117.5 -1.4 -.2 102.0 -7.3 -1.8 135.6 -3.4 -.5 122.2 -1.2 .2
Electricity 1 ........................................... 122.4 -1.4 .3 107.6 -9.7 .3 154.3 .6 .0 121.3 -2.5 .6Utility natural gas service 1 .................. 111.1 -1.5 -1.4 96.2 -3.9 -4.5 116.3 -11.2 -1.6 123.7 1.0 -.6
Household furnishings and operations 124.8 .1 -.2 106.4 -4.6 -3.5 124.3 .2 -1.0 128.1 2.2 .2
Apparel ........................................................ 128.5 -1.5 1.1 119.5 2.6 7.0 118.7 -3.6 3.9 115.4 -6.9 -.8
Transportation ............................................. 138.3 -1.8 -.6 133.9 -.5 -.9 137.0 .1 -.6 149.0 -2.2 -.4Private transportation ................................ 135.6 -2.0 -.7 130.9 -.6 -1.1 133.1 -.2 -.7 142.5 -1.7 -.7Motor fuel ................................................. 83.5 -11.3 -1.8 85.8 -7.2 -3.6 91.2 2.8 -.7 80.4 -13.3 -2.3Gasoline (all types) ................................ 83.0 -11.3 -1.8 85.1 -7.2 -3.6 89.1 2.9 -.7 80.1 -13.3 -2.3Gasoline, unleaded regular3 ................ 80.1 -12.1 -2.0 82.2 -7.8 -4.3 86.6 3.0 -.6 78.3 -14.2 -2.7Gasoline, unleaded midgrade 3 4 ........ 88.1 -10.3 -1.5 92.1 -7.1 -3.0 87.3 3.2 -.3 83.1 -12.4 -2.0Gasoline, unleaded premium 3 ............. 86.6 -9.7 -1.5 88.6 -5.4 -2.4 91.5 2.7 -.5 83.3 -11.7 -1.5
Medical care ................................................ 246.9 3.4 .4 256.4 5.1 .4 239.5 3.1 .6 262.6 4.6 -.1
Recreation 5 ................................................. 101.3 .6 .1 100.1 -.6 -.8 102.1 1.8 1.1 102.2 .3 .5
Education and communication 5 ................... 101.2 1.4 .0 108.5 6.9 .4 98.7 -.9 -.7 100.8 1.7 -.1
Other goods and services ............................ 258.3 12.0 -.3 258.8 6.3 -1.4 260.8 12.8 -1.0 263.2 8.0 -.1
Commodity and service group
All items ......................................................... 161.1 1.6 .1 160.6 2.0 .1 158.1 2.0 .2 170.6 1.4 -.1Commodities ................................................ 142.2 .6 -.2 141.2 .9 -.2 141.9 1.5 .1 145.1 .1 -.6
Commodities less food and beverages .... 129.9 -.5 -.4 125.1 -.2 -.4 124.9 .5 .2 127.7 -2.0 -.7Nondurables less food and beverages .... 131.8 .2 -.2 132.9 .8 1.1 129.0 2.6 1.0 127.1 -2.5 -.8Durables .................................................. 126.1 -1.3 -.6 115.9 -1.3 -1.8 121.5 -1.7 -.7 126.0 -.9 -.4
Services ....................................................... 183.5 2.5 .3 182.2 2.9 .3 175.0 2.4 .1 197.2 2.3 .3
Special aggregate indexes
All items less medical care ............................ 157.1 1.5 .0 156.1 1.9 .1 154.8 2.0 .1 167.0 1.3 -.1All items less shelter ...................................... 155.8 1.1 -.1 154.0 1.4 -.1 156.2 1.5 .1 159.6 .8 -.3Commodities less food .................................. 131.3 -.4 -.4 127.2 -.3 -.5 128.2 .6 .4 129.6 -1.8 -.7Nondurables .................................................. 147.7 1.4 -.1 151.2 2.2 .7 150.9 2.9 .5 148.8 .3 -.7Nondurables less food ................................... 134.0 .4 -.1 135.7 .7 1.0 134.4 2.7 1.4 129.9 -2.1 -.8Services less rent of shelter2 ......................... 172.3 1.8 .2 169.3 2.2 .1 173.3 1.3 -.1 174.0 1.5 .2Sen/ices less medical care services .............. 177.8 2.4 .3 175.7 2.7 .3 170.7 2.4 .1 192.4 2.2 .3Energy ........................................................... 96.1 -6.2 -.9 91.5 -7.3 -2.6 104.9 .0 -.6 98.6 -6.1 -.7All items less energy ...................................... 170.0 2.2 .1 170.0 2.7 .2 164.0 2.1 .2 179.4 2.0 -.1All items less food and energy ..................... 171.9 2.2 .2 170.4 2.5 .2 163.2 1.9 .2 183.0 1.9 .1
1 This index series was calculated using a Laspeyres estimator. All other item 4 Indexes on a December 1993=100 base, stratum index series converted to a geometric means estimator in January, 1999. 5 Indexes on a December 1997=100 base.
2 Indexes on a December 1984=100 base ' Data not available.3 Special index based on a substantially smaller sample. NOTE: Index applies to a month as a whole, not to any specific date.
68Digitized for FRASER http://fraser.stlouisfed.org/ Federal Reserve Bank of St. Louis
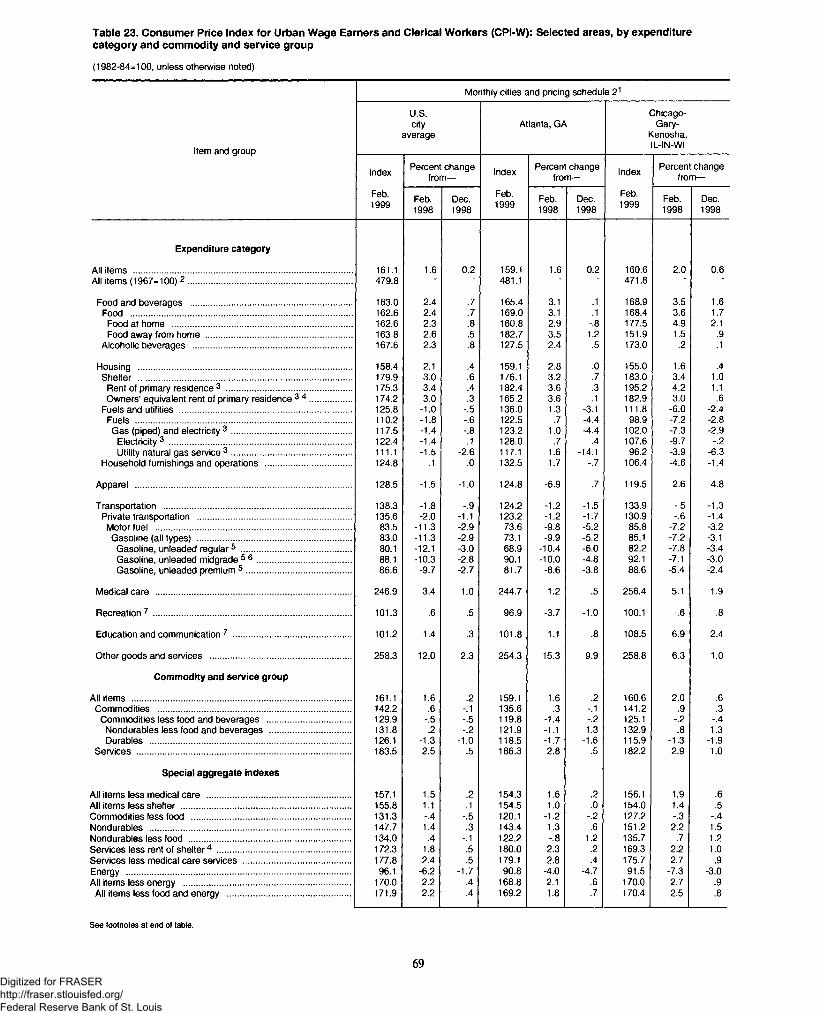
Table 23. Consumer Price Index for Urban Wage Earners and Clerical Workers (CPI-W): Selected areas, by expenditurecategory and commodity and service group
(1982-84=100, unless otherwise noted)
Monthly cities and pricing schedule 2 1
Item and group
U.S.city
averageAtlanta, GA
Chicago-Gary-
Kenosha,IL-IN-WI
Index Percent change from— Index Percent change
from— Index Percent change from—
Feb.1999 Feb.
1998Dec.1998
Feb.1999 Feb.
1998Dec.1998
Feb.1999 Feb.
1998Dec.1998
Expenditure category
All items ........................................................................................... 161.1 1.6 0.2 159.1 1.6 0.2 160.6 2.0 0.6All items (1967=100) 2 .................................................................... 479.8 ■ ' 481.1 ■ ' 471.8 '
Food and beverages ................................................................... 163.0 2.4 .7 165.4 3.1 .1 168.9 3.5 1.6Food ............................................................................................ 162.6 2.4 .7 169.0 3.1 .1 168.4 3.6 1.7
Food at home ........................................................................... 162.6 2.3 .8 160.8 2.9 -.8 177.5 4.9 2.1Food away from home ............................................................. 163.8 2.6 .5 182.7 3.5 1.2 151.9 1.5 .9
Alcoholic beverages .................................................................. 167.6 2.3 .8 127.5 2.4 .5 173.0 .2 .1
Housing ......................................................................................... 158.4 2.1 .4 159.1 2.8 .0 155.0 1.6 .4Shelter ......................................................................................... 179.9 3.0 .6 176.1 3.2 .7 183.0 3.4 1.0
Rent of primary residence 3 .................................................... 175.3 3.4 .4 182.4 3.6 .3 195.2 4.2 1.1Owners’ equivalent rent of primary residence 3 4 ................. 174.2 3.0 .3 165.2 3.6 .1 182.9 3.0 .6
Fuels and utilities ........................................................................ 125.8 -1.0 -.5 136.0 1.3 -3.1 111.8 -6.0 -2.4Fuels .......................................................................................... 110.2 -1.8 -.6 122.5 .7 -4.4 98.9 -7.2 -2.8Gas (piped) and electricity 3 .................................................. 117.5 -1.4 -.8 123.2 1.0 -4.4 102.0 -7.3 -2.9
Electricity3 ............................................................................ 122.4 -1.4 .1 128.0 .7 .4 107.6 -9.7 -.2Utility natural gas service 3 .................................................. 111.1 -1.5 -2.6 117.1 1.6 -14.1 96.2 -3.9 -6.3
Household furnishings and operations .................................... 124.8 .1 .0 132.5 1.7 -.7 106.4 -4.6 -1.4
Apparel .......................................................................................... 128.5 -1.5 -1.0 124.8 -6.9 .7 119.5 2.6 4.8
Transportation .............................................................................. 138.3 -1.8 -.9 124.2 -1.2 -1.5 133.9 -.5 -1.3Private transportation ................................................................ 135.6 -2.0 -1.1 123.2 -1.2 -1.7 130.9 -.6 -1.4
Motor fuel .................................................................................. 83.5 -11.3 -2.9 73.6 -9.8 -5.2 85.8 -7.2 -3.2Gasoline (all types) ................................................................ 83.0 -11.3 -2.9 73.1 -9.9 -5.2 85.1 -7.2 -3.1
Gasoline, unleaded regular5 .............................................. 80.1 -12.1 -3.0 68.9 -10.4 -6.0 82.2 -7.8 -3.4Gasoline, unleaded midgrade 5 6 ....................................... 88.1 -10.3 -2.8 90.1 -10.0 -4.8 92.1 -7.1 -3.0Gasoline, unleaded premium 5 ............................................ 86.6 -9.7 -2.7 81.7 -8.6 -3.8 88.6 -5.4 -2.4
Medical care ................................................................................. 246.9 3.4 1.0 244.7 1.2 .5 256.4 5.1 1.9
Recreation 7 ................................................................................... 101.3 .6 .5 96.9 -3.7 -1.0 100.1 -.6 .8
Education and communication 7 ................................................. 101.2 1.4 .3 101.8 1.1 .8 108.5 6.9 2.4
Other goods and services ........................................................... 258.3 12.0 2.3 254.3 15.3 9.9 258.8 6.3 1.0
Commodity and service group
All items ........................................................................................... 161.1 1.6 .2 159.1 1.6 .2 160.6 2.0 .6Commodities ................................................................................ 142.2 .6 -.1 135.6 .3 -.1 141.2 .9 .3
Commodities less food and beverages ................................... 129.9 -.5 -.5 119.8 -1.4 -.2 125.1 -.2 -.4Nondurables less food and beverages .................................. 131.8 .2 -.2 121.9 -1.1 1.3 132.9 .8 1.3Durables .................................................................................... 126.1 -1.3 -1.0 118.5 -1.7 -1.6 115.9 -1.3 -1.9
Services ......................................................................................... 183.5 2.5 .5 186.3 2.8 .5 182.2 2.9 1.0
Special aggregate indexes
All items less medical care ............................................................ 157.1 1.5 .2 154.3 1.6 .2 156.1 1.9 .6All items less shelter ....................................................................... 155.8 1.1 .1 154.5 1.0 .0 154.0 1.4 .5Commodities less food .................................................................. 131.3 -.4 -.5 120.1 -1.2 -.2 127.2 -.3 -.4Nondurables .................................................................................... 147.7 1.4 .3 143.4 1.3 .6 151.2 2.2 1.5Nondurables less food ................................................................... 134.0 .4 -.1 122.2 -.8 1.2 135.7 .7 1.2Services less rent of shelter4 ........................................................ 172.3 1.8 .5 180.0 2.3 .2 169.3 2.2 1.0Services less medical care services ............................................. 177.8 2.4 .5 179.1 2.8 .4 175.7 2.7 .9Energy .............................................................................................. 96.1 -6.2 -1.7 90.8 -4.0 -4.7 91.5 -7.3 -3.0All items less energy ...................................................................... 170.0 2.2 .4 168.8 2.1 .6 170.0 2.7 .9
All items less food and energy ................................................... 171.9 2.2 .4 169.2 1.8 .7 170.4 2.5 .8
See footnotes at end of table.
69Digitized for FRASER http://fraser.stlouisfed.org/ Federal Reserve Bank of St. Louis
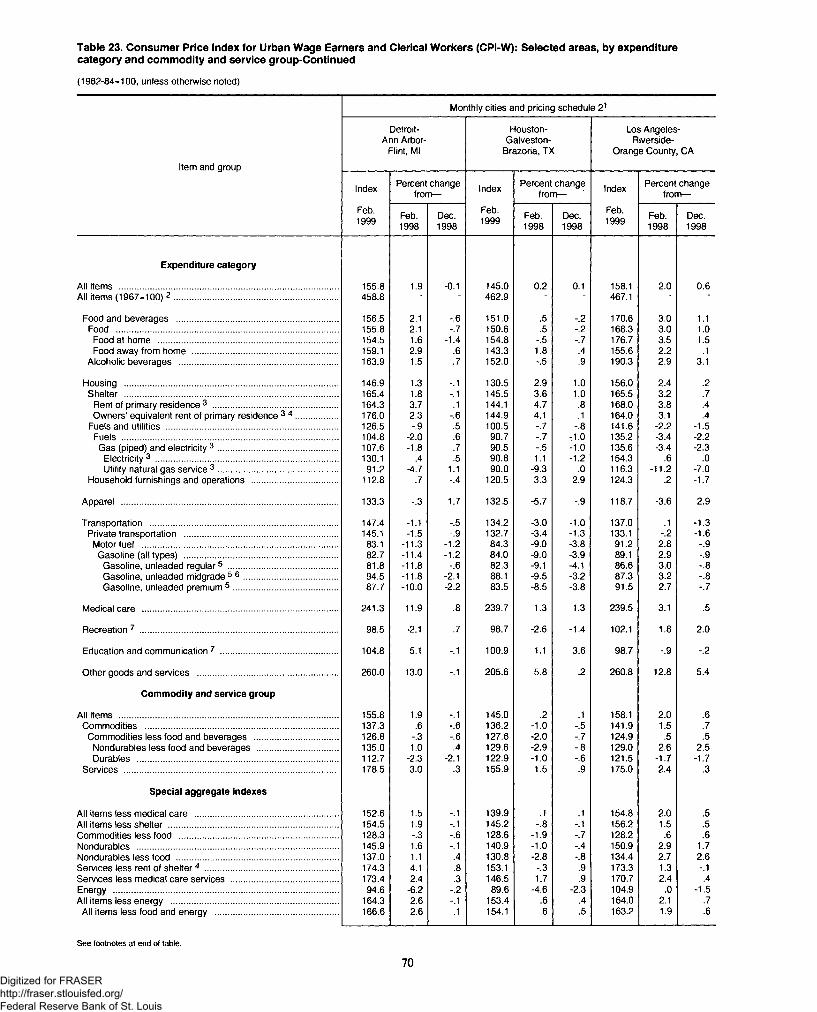
Table 23. Consumer Price Index for Urban Wage Earners and Clerical Workers (CPI-W): Selected areas, by expenditurecategory and commodity and service group-Continued
(1982-84=100, unless otherwise noted)
Monthly cities and pricing schedule 21
Item and group
Detroit- Ann Arbor-
Flint, Ml
Houston- Galveston-
Brazoria, TX
Los Angeles- Riverside-
Orange County, CA
Index Percent change from— Index Percent change
from— Index Percent change from—
Feb.1999 Feb.
1998Dec.1998
Feb.1999 Feb.
1998Dec.1998
Feb.1999 Feb.
1998Dec.1998
Expenditure category
All items ........................................................................................... 155.8 1.9 -0.1 145.0 0.2 0.1 158.1 2.0 0.6All items (1967=100) 2 .................................................................... 458.8 ■ ■ 462.9 ■ ■ 467.1 ■ ■
Food and beverages ................................................................... 156.5 2.1 -.6 151.0 .5 -.2 170.6 3.0 1.1Food ............................................................................................ 155.8 2.1 -.7 150.6 .5 -.2 168.3 3.0 1.0
Food at home ........................................................................... 154.5 1.6 -1.4 154.8 -.5 -.7 176.7 3.5 1.5Food away from home ............................................................. 159.1 2.9 .6 143.3 1.8 .4 155.6 2.2 .1
Alcoholic beverages .................................................................. 163.9 1.5 .7 152.0 -.5 .9 190.3 2.9 3.1
Housing ......................................................................................... 146.9 1.3 -.1 130.5 2.9 1.0 156.0 2.4 .2Shelter ......................................................................................... 165.4 1.8 -.1 145.5 3.6 1.0 165.5 3.2 .7
Rent of primary residence 3 .................................................... 164.3 3.7 .1 144.1 4.7 .8 168.0 3.8 .4Owners’ equivalent rent of primary residence 3 4 ................. 176.0 2.3 -.6 144.9 4.1 .1 164.0 3.1 .4
Fuels and utilities ........................................................................ 126.5 -.9 .5 100.5 -.7 -.8 141.6 -2.2 -1.5Fuels .......................................................................................... 104.8 -2.0 .6 90.7 -.7 -1.0 135.2 -3.4 -2.2
Gas (piped) and electricity 3 .................................................. 107.6 -1.8 .7 90.5 -.5 -1.0 135.6 -3.4 -2.3Electricity3 ............................................................................ 130.1 .4 .5 90.8 1.1 -1.2 154.3 .6 .0Utility natural gas service 3 .................................................. 91.2 -4.7 1.1 90.0 -9.3 .0 116.3 -11.2 -7.0
Household furnishings and operations .................................... 112.8 .7 -.4 120.5 3.3 2.9 124.3 .2 -1.7
Apparel .......................................................................................... 133.3 -.3 1.7 132.5 -5.7 -.9 118.7 -3.6 2.9
Transportation .............................................................................. 147.4 -1.1 -.5 134.2 -3.0 -1.0 137.0 .1 -1.3Private transportation ................................................................ 145.1 -1.5 -.9 132.7 -3.4 -1.3 133.1 -.2 -1.6
Motor fuel .................................................................................. 83.1 -11.3 -1.2 84.3 -9.0 -3.8 91.2 2.8 -.9Gasoline (all types) ................................................................ 82.7 -11.4 -1.2 84.0 -9.0 -3.9 89.1 2.9 -.9
Gasoline, unleaded regular5 .............................................. 81.8 -11.8 -.6 82.3 -9.1 -4.1 86.6 3.0 -.8Gasoline, unleaded midgrade 5 6 ....................................... 94.5 -11.8 -2.1 88.1 -9.5 -3.2 87.3 3.2 -.8Gasoline, unleaded premium 5 ............................................ 87.7 -10.0 -2.2 83.5 -8.5 -3.8 91.5 2.7 -.7
Medical care .................................................................................. 241.3 11.9 .8 239.7 1.3 1.3 239.5 3.1 .5
Recreation 7 .................................................................................. 98.5 -2.1 .7 98.7 -2.6 -1.4 102.1 1.8 2.0
Education and communication 7 ................................................. 104.8 5.1 -.1 100.9 1.1 3.6 98.7 -.9 -.2
Other goods and services ........................................................... 260.0 13.0 -.1 205.6 5.8 .2 260.8 12.8 5.4
Commodity and service group
All items ........................................................................................... 155.8 1.9 -.1 145.0 .2 .1 158.1 2.0 .6Commodities ................................................................................ 137.3 .6 -.6 136.2 -1.0 -.5 141.9 1.5 .7
Commodities less food and beverages ................................... 126.8 -.3 -.6 127.6 -2.0 -.7 124.9 .5 .5Nondurables less food and beverages .................................. 135.0 1.0 .4 129.6 -2.9 -.8 129.0 2.6 2.5Durables .................................................................................... 112.7 -2.3 -2.1 122.9 -1.0 -.6 121.5 -1.7 -1.7
Services ......................................................................................... 178.5 3.0 .3 155.9 1.5 .9 175.0 2.4 .3
Special aggregate indexes
All items less medical care ............................................................ 152.6 1.5 -.1 139.9 .1 .1 154.8 2.0 .5All items less shelter ....................................................................... 154.5 1.9 -.1 145.2 -.8 -.1 156.2 1.5 .5Commodities less food .................................................................. 128.3 -.3 -.6 128.6 -1.9 -.7 128.2 .6 .6Nondurables .................................................................................... 145.9 1.6 -.1 140.9 -1.0 -.4 150.9 2.9 1.7Nondurables less food ................................................................... 137.0 1.1 .4 130.8 -2.8 -.8 134.4 2.7 2.6Services less rent of shelter4 ....................................................... 174.3 4.1 .8 153.1 -.3 .9 173.3 1.3 -.1Services less medical care services ............................................. 173.4 2.4 .3 146.5 1.7 .9 170.7 2.4 .4Energy .............................................................................................. 94.6 -6.2 -.2 89.6 -4.6 -2.3 104.9 .0 -1.5All items less energy ...................................................................... 164.3 2.6 -.1 153.4 .6 .4 164.0 2.1 .7
All items less food and energy ................................................... 166.6 2.6 .1 154.1 .6 .5 163.2 1.9 .6
See footnotes at end of table.
70Digitized for FRASER http://fraser.stlouisfed.org/ Federal Reserve Bank of St. Louis

Table 23. Consumer Price Index for Urban Wage Earners and Clerical Workers (CPI-W): Selected areas, by expenditurecategory and commodity and service group-Continued
(1982-84=100, unless otherwise noted)
Monthly cities and pricing schedule 21
Item and group
Miami- Fort Lauderdale, FL
New York- Northern N.J.- Long Island,
NY-NJ-CT-PA
Philadelphia- Wilmington- Atlantic City,
PA-NJ-DE-MD
Index Percent change from— Index Percent change
from— Index Percent change from—
Feb.1999 Feb.
1998Dec.1998
Feb.1999 Feb.
1998Dec.1998
Feb.1999 Feb.
1998Dec.1998
Expenditure category
All items ........................................................................................... 158.8 1.0 0.1 170.6 1.4 0.1 167.8 1.0 -0.4All items (1967=100) 2 .................................................................... 258.0 ■ ■ 485.8 ■ " 487.4
Food and beverages ................................................................... 168.8 1.4 .5 167.8 2.6 .5 157.6 1.7 .6Food ............................................................................................ 169.7 1.3 .5 167.3 2.6 .5 156.6 1.9 .6
Food at home ........................................................................... 166.5 2.0 1.1 167.2 2.5 .7 164.6 3.1 .7Food away from home ............................................................. 177.1 .4 -.2 171.0 2.8 .1 139.7 -.5 .4
Alcoholic beverages .................................................................. 154.3 1.9 -.7 174.7 2.7 1.0 172.6 .0 .9
Housing ......................................................................................... 154.2 1.4 .5 172.1 2.3 .4 172.7 1.4 -.1Shelter ......................................................................................... 163.0 1.1 .3 202.5 2.9 .4 206.1 1.9 .9
Rent of primary residence 3 .................................................... 152.5 1.5 -.1 194.5 3.3 .4 184.4 3.1 .8Owners’ equivalent rent of primary residence 3 4 ................. 157.3 1.0 -.2 193.0 2.8 .2 184.9 2.2 .3
Fuels and utilities ........................................................................ 119.9 1.8 1.0 112.3 -1.9 .1 128.1 -1.8 -2.5Fuels .......................................................................................... 110.1 2.1 1.5 111.0 -2.3 -.1 114.5 -3.5 -3.2Gas (piped) and electricity 3 .................................................. 109.0 2.3 1.5 122.2 -1.2 -.1 132.3 -2.6 -3.6
Electricity3 ............................................................................ 106.9 2.4 1.6 121.3 -2.5 .1 141.7 -4.3 -4.7Utility natural gas service 3 .......................... ....................... 158.6 -2.2 -.9 123.7 1.0 -.5 121.8 1.2 -1.0
Household furnishings and operations .................................... 163.9 3.7 1.3 128.1 2.2 .2 124.7 2.1 -2.6
Apparel .......................................................................................... 146.0 -8.0 -2.9 115.4 -6.9 -3.1 99.6 -2.2 -2.7
Transportation .............................................................................. 141.3 .0 -1.1 149.0 -2.2 -1.0 146.8 -2.4 -1.4Private transportation ................................................................ 141.3 .1 -1.2 142.5 -1.7 -1.2 144.4 -2.6 -1.8Motor fuel .................................................................................. 94.9 -5.4 -3.1 80.4 -13.3 -4.6 83.9 -10.8 -5.0
Gasoline (all types) ................................................................ 94.3 -5.2 -3.1 80.1 -13.3 -4.6 82.7 -10.9 -4.9Gasoline, unleaded regular5 ............................................. 90.9 -6.4 -2.7 78.3 -14.2 -5.1 80.4 -12.1 -5.5Gasoline, unleaded midgrade 5 6 ....................................... 90.7 -4.8 -3.5 83.1 -12.4 -4.4 81.9 -10.6 -4.7Gasoline, unleaded premium 5 ........................................... 97.7 -3.5 -3.5 83.3 -11.7 -3.9 80.9 -8.7 -4.3
Medical care ................................................................................. 228.1 2.2 -.3 262.6 4.6 1.4 253.9 2.4 .5
Recreation 7 ................................................................................... 99.9 -.4 .1 102.2 .3 .3 100.3 .1 -1.5
Education and communication 7 ................................................. 103.0 2.5 1.4 100.8 1.7 -.1 99.8 1.8 .2
Other goods and services ........................................................... 193.5 7.7 1.0 263.2 8.0 1.1 266.9 9.0 -.5
Commodity and service group
All items ........................................................................................... 158.8 1.0 .1 170.6 1.4 .1 167.8 1.0 -.4Commodities ................................................................................. 150.9 .0 -.5 145.1 .1 -.4 138.0 .3 -1.1
Commodities less food and beverages ................................... 139.8 -.9 -1.1 127.7 -2.0 -1.3 124.3 -.6 -2.3Nondurables less food and beverages .................................. 129.9 -2.3 -1.5 127.1 -2.5 -1.2 120.5 -.7 -2.7Durables .................................................................................... 152.5 .7 -.6 126.0 -.9 -1.4 128.2 -.6 -1.7
Services ......................................................................................... 167.6 1.8 .5 197.2 2.3 .4 203.3 1.7 .3
Special aggregate indexes
All items less medical care ............................................................ 155.4 .9 .1 167.0 1.3 .0 164.2 .9 -.4All items less shelter ....................................................................... 157.4 .9 -.1 159.6 .8 -.1 157.6 .7 -.9Commodities less food .................................................................. 140.3 -.8 -1.1 129.6 -1.8 -1.2 126.2 -.6 -2.2Nondurables .................................................................................... 150.5 -.3 -.4 148.8 .3 -.3 139.8 .6 -.9Nondurables less food ................................................................... 131.2 -2.0 -1.5 129.9 -2.1 -1.1 123.6 -.6 -2.4Services less rent of she lter4 ....................................................... 162.1 2.4 .5 174.0 1.5 .3 182.1 1.4 -.4Services less medical care services ............................................. 162.0 1.6 .4 192.4 2.2 .3 199.1 1.7 .3Energy ............................................................................................. 98.6 -1.8 -.9 98.6 -6.1 -1.6 99.9 -6.3 -3.8All items less energy ..................................................................... 166.5 1.2 .1 179.4 2.0 .2 177.5 1.6 -.1All items less food and energy ................................................... 165.9 1.1 .0 183.0 1.9 .2 184.0 1.5 -.3
See footnotes at end of table.
71Digitized for FRASER http://fraser.stlouisfed.org/ Federal Reserve Bank of St. Louis
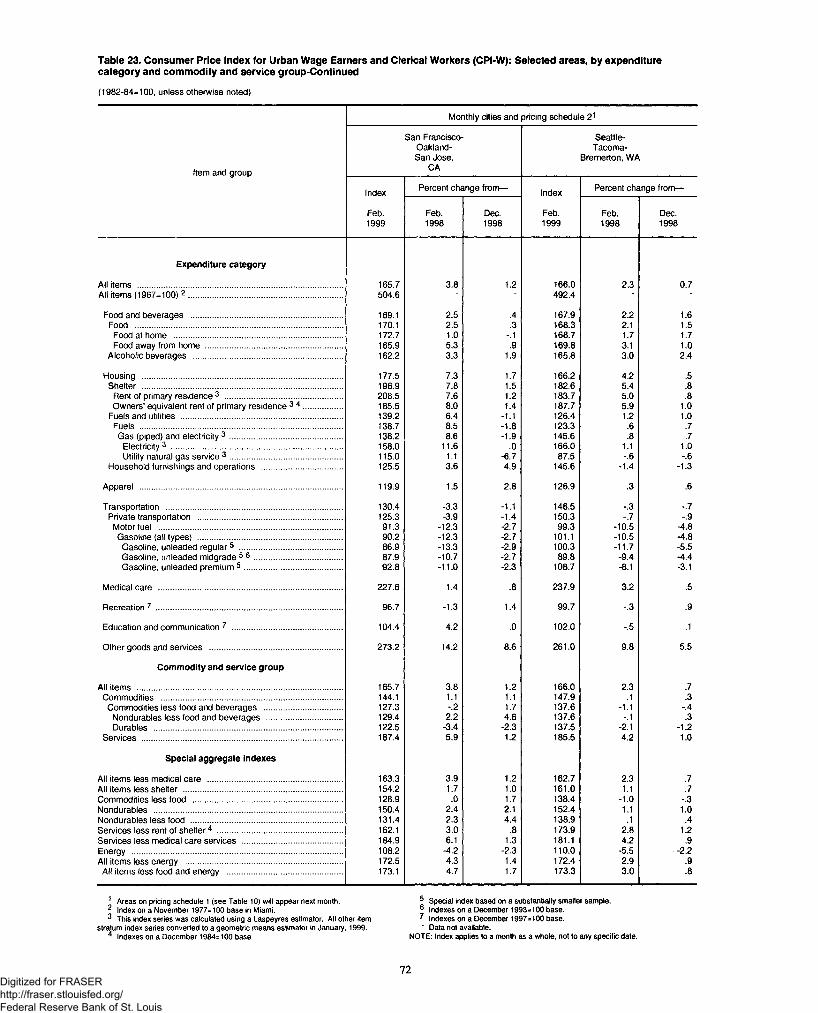
Table 23. Consumer Price Index for Urban Wage Earners and Clerical Workers (CPI-W): Selected areas, by expenditurecategory and commodity and service group-Continued
(1982-84=100, unless otherwise noted)
Monthly cities and pricing schedule 21
Item and group
San Francisco- Oakland- San Jose,
CA
Seattle- Tacoma-
Bremerton, WA
Index Percent change from— Index Percent change from—
Feb.1999
Feb.1998
Dec.1998
Feb.1999
Feb.1998
Dec.1998
Expenditure category
All items ...................................................................................... 165.7 3.8 1.2 166.0 2.3 0.7All items (1967=100) 2 ................................................................ 504.6 ' " 492.4 ■ ■
Food and beverages ............................................................... 169.1 2.5 .4 167.9 2.2 1.6Food ....................................................................................... 170.1 2.5 .3 168.3 2.1 1.5
Food at home ...................................................................... 172.7 1.0 -.1 168.7 1.7 1.7Food away from home ......................................................... 165.9 5.3 .9 169.8 3.1 1.0
Alcoholic beverages .............................................................. 162.2 3.3 1.9 165.8 3.0 2.4
Housing ................................................................................... 177.5 7.3 1.7 166.2 4.2 .5Shelter ................................................................................... 196.9 7.8 1.5 182.6 5.4 .8
Rent of primary residence 3 ................................................. 208.5 7.6 1.2 183.7 5.0 .8Owners’ equivalent rent of primary residence 3 4 ................ 185.5 8.0 1.4 187.7 5.9 1.0
Fuels and utilities ................................................................... 139.2 6.4 -1.1 126.4 1.2 1.0Fuels .................................................................................... 138.7 8.5 -1.8 123.3 .6 .7Gas (piped) and electricity 3 ............................................... 138.2 8.6 -1.9 145.6 .8 .7
Electricity3 ....................................................................... 158.0 11.6 .0 166.0 1.1 1.0Utility natural gas service 3 ............................................... 115.0 1.1 -6.7 87.5 -.6 -.6
Household furnishings and operations .................................. 125.5 3.6 4.9 145.6 -1.4 -1.3
Apparel ................................... ................................................. 119.9 1.5 2.8 126.9 .3 .6
Transportation ......................................................................... 130.4 -3.3 -1.1 146.5 -.3 -.7Private transportation ............................................................ 125.3 -3.9 -1.4 150.3 -.7 -.9Motor fuel ............................................................................. 91.3 -12.3 -2.7 99.3 -10.5 -4.8Gasoline (all types) ............................................................ 90.2 -12.3 -2.7 101.1 -10.5 -4.8Gasoline, unleaded regular5 ........................................... 86.9 -13.3 -2.9 100.3 -11.7 -5.5Gasoline, unleaded midgrade 5 6 ..................................... 87.9 -10.7 -2.7 89.8 -9.4 -4.4Gasoline, unleaded premium 5 ......................................... 92.8 -11.0 -2.3 108.7 -8.1 -3.1
Medical care ............................................................................. 227.6 1.4 .8 237.9 3.2 .5
Recreation 7 ............................................................................................. 96.7 -1.3 1.4 99.7 -.3 .9
Education and communication 7 .............................................. 104.4 4.2 .0 102.0 -.5 .1
Other goods and services ....................................................... 273.2 14.2 8.6 261.0 9.8 5.5
Commodity and service group
All items ...................................................................................... 165.7 3.8 1.2 166.0 2.3 .7Commodities ........................................................................... 144.1 1.1 1.1 147.9 .1 .3
Commodities less food and beverages ................................ 127.3 -.2 1.7 137.6 -1.1 -.4Nondurables less food and beverages ................................ 129.4 2.2 4.6 137.6 -.1 .3Durables .............................................................................. 122.5 -3.4 -2.3 137.5 -2.1 -1.2
Services .................................................................................... 187.4 5.9 1.2 185.5 4.2 1.0
Special aggregate indexes
All items less medical care ........................................................ 163.3 3.9 1.2 162.7 2.3 .7All items less shelter .................................................................. 154.2 1.7 1.0 161.0 1.1 .7Commodities less food .............................................................. 128.9 .0 1.7 138.4 -1.0 -.3Nondurables ............................................................................... 150.4 2.4 2.1 152.4 1.1 1.0Nondurables less food ............................................................... 131.4 2.3 4.4 138.9 .1 .4Services less rent of shelter4 .................................................... 162.1 3.0 .8 173.9 2.8 1.2Services less medical care services .......................................... 184.9 6.1 1.3 181.1 4.2 .9Energy ........................................................................................ 108.2 -4.2 -2.3 110.0 -5.5 -2.2All items less energy ................................................................. 172.5 4.3 1.4 172.4 2.9 .9All items less food and energy ................................................ 173.1 4.7 1.7 173.3 3.0 .8
1 Areas on pricing schedule 1 (see Table 10) will appear next month. 5 Special index based on a substantially smaller sample.2 Index on a November 1977=100 base in Miami. ® Indexes on a December 1993=100 base.3 This index series was calculated using a Laspeyres estimator. All other item 7 Indexes on a December 1997=100 base,
stratum index series converted to a geometric means estimator in January, 1999. * Data not available.4 Indexes on a December 1984=100 base NOTE: Index applies to a month as a whole, not to any specific date.
72Digitized for FRASER http://fraser.stlouisfed.org/ Federal Reserve Bank of St. Louis
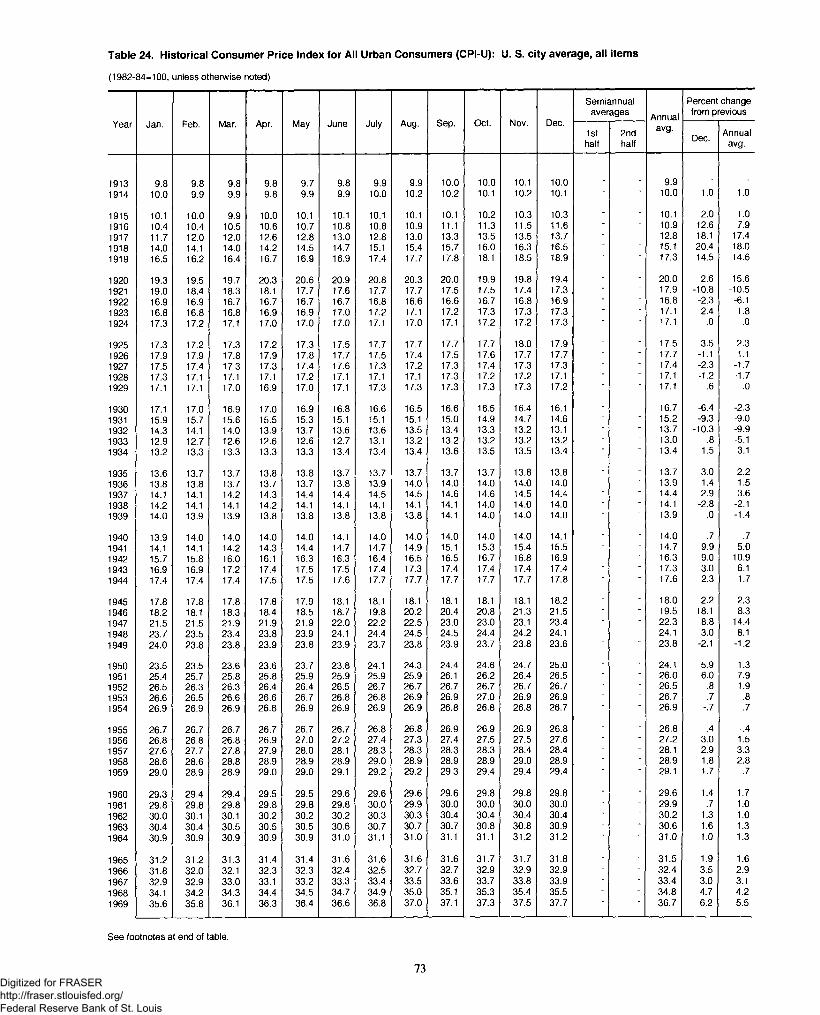
19131914
19151916191719181919
19201921192219231924
19251926192719281929
19301931193219331934
19351936193719381939
19401941194219431944
19451946194719481949
19501951195219531954
19551956195719581959
19601961196219631964
19651966196719681969
Historical Consumer Price Index for All Urban Consumers (CPI-U): U. S. city average, all items
MOO, unless otherwise noted)
Jan. Feb. Mar. Apr. May June July Aug. Sep. Oct. Nov. Dec.
Semiannualaverages Annual
avg.
Percent change from previous
1sthalf
2ndhalf Dec. Annual
avg.
9.8 9.8 9.8 9.8 9.7 9.8 9.9 9.9 10.0 10.0 10.1 10.0 9.910.0 9.9 9.9 9.8 9.9 9.9 10.0 10.2 10.2 10.1 10.2 10.1 10.0 1.0 1.0
10.1 10.0 9.9 10.0 10.1 10.1 10.1 10.1 10.1 10.2 10.3 10.3 - - 10.1 2.0 1.010.4 10.4 10.5 10.6 10.7 10.8 10.8 10.9 11.1 11.3 11.5 11.6 - ■ 10.9 12.6 7.911.7 12.0 12.0 12.6 12.8 13.0 12.8 13.0 13.3 13.5 13.5 13.7 ■ ■ 12.8 18.1 17.414.0 14.1 14.0 14.2 14.5 14.7 15.1 15.4 15.7 16.0 16.3 16.5 - - 15.1 20.4 18.016.5 16.2 16.4 16.7 16.9 16.9 17.4 17.7 17.8 18.1 18.5 18.9 17.3 14.5 14.6
19.3 19.5 19.7 20.3 20.6 20.9 20.8 20.3 20.0 19.9 19.8 19.4 - - 20.0 2.6 15.619.0 18.4 18.3 18.1 17.7 17.6 17.7 17.7 17.5 17.5 17.4 17.3 - - 17.9 -10.8 -10.516.9 16.9 16.7 16.7 16.7 16.7 16.8 16.6 16.6 16.7 16.8 16.9 - • 16.8 -2.3 -6.116.8 16.8 16.8 16.9 16.9 17.0 17.2 17.1 17.2 17.3 17.3 17.3 - ■ 17.1 2.4 1.817.3 17.2 17.1 17.0 17.0 17.0 17.1 17.0 17.1 17.2 17.2 17.3 17.1 .0 .0
17.3 17.2 17.3 17.2 17.3 17.5 17.7 17.7 17.7 17.7 18.0 17.9 - - 17.5 3.5 2.317.9 17.9 17.8 17.9 17.8 17.7 17.5 17.4 17.5 17.6 17.7 17.7 - - 17.7 -1.1 1.117.5 17.4 17.3 17.3 17.4 17.6 17.3 17.2 17.3 17.4 17.3 17.3 ■ ■ 17.4 -2.3 -1.717.3 17.1 17.1 17.1 17.2 17.1 17.1 17.1 17.3 17.2 17.2 17.1 ■ ■ 17.1 -1.2 -1.717.1 17.1 17.0 16.9 17.0 17.1 17.3 17.3 17.3 17.3 17.3 17.2 17.1 .6 .0
17.1 17.0 16.9 17.0 16.9 16.8 16.6 16.5 16.6 16.5 16.4 16.1 - - 16.7 -6.4 -2.315.9 15.7 15.6 15.5 15.3 15.1 15.1 15.1 15.0 14.9 14.7 14.6 - • 15.2 -9.3 -9.014.3 14.1 14.0 13.9 13.7 13.6 13.6 13.5 13.4 13.3 13.2 13.1 ■ ■ 13.7 -10.3 -9.912.9 12.7 12.6 12.6 12.6 12.7 13.1 13.2 13.2 13.2 13.2 13.2 ■ ■ 13.0 .8 -5.113.2 13.3 13.3 13.3 13.3 13.4 13.4 13.4 13.6 13.5 13.5 13.4 13.4 1.5 3.1
13.6 13.7 13.7 13.8 13.8 13.7 13.7 13.7 13.7 13.7 13.8 13.8 - - 13.7 3.0 2.213.8 13.8 13.7 13.7 13.7 13.8 13.9 14.0 14.0 14.0 14.0 14.0 • • 13.9 1.4 1.514.1 14.1 14.2 14.3 14.4 14.4 14.5 14.5 14.6 14.6 14.5 14.4 ■ ■ 14.4 2.9 3.614.2 14.1 14.1 14.2 14.1 14.1 14.1 14.1 14.1 14.0 14.0 14.0 - • 14.1 -2.8 -2.114.0 13.9 13.9 13.8 13.8 13.8 13.8 13.8 14.1 14.0 14.0 14.0 13.9 .0 -1.4
13.9 14.0 14.0 14.0 14.0 14.1 14.0 14.0 14.0 14.0 14.0 14.1 - - 14.0 .7 .714.1 14.1 14.2 14.3 14.4 14.7 14.7 14.9 15.1 15.3 15.4 15.5 - ■ 14.7 9.9 5.015.7 15.8 16.0 16.1 16.3 16.3 16.4 16.5 16.5 16.7 16.8 16.9 - - 16.3 9.0 10.916.9 16.9 17.2 17.4 17.5 17.5 17.4 17.3 17.4 17.4 17.4 17.4 - ■ 17.3 3.0 6.117.4 17.4 17.4 17.5 17.5 17.6 17.7 17.7 17.7 17.7 17.7 17.8 17.6 2.3 1.7
17.8 17.8 17.8 17.8 17.9 18.1 18.1 18.1 18.1 18.1 18.1 18.2 - - 18.0 2.2 2.318.2 18.1 18.3 18.4 18.5 18.7 19.8 20.2 20.4 20.8 21.3 21.5 - - 19.5 18.1 8.321.5 21.5 21.9 21.9 21.9 22.0 22.2 22.5 23.0 23.0 23.1 23.4 - ■ 22.3 8.8 14.423.7 23.5 23.4 23.8 23.9 24.1 24.4 24.5 24.5 24.4 24.2 24.1 - - 24.1 3.0 8.124.0 23.8 23.8 23.9 23.8 23.9 23.7 23.8 23.9 23.7 23.8 23.6 23.8 -2.1 -1.2
23.5 23.5 23.6 23.6 23.7 23.8 24.1 24.3 24.4 24.6 24.7 25.0 - - 24.1 5.9 1.325.4 25.7 25.8 25.8 25.9 25.9 25.9 25.9 26.1 26.2 26.4 26.5 • - 26.0 6.0 7.926.5 26.3 26.3 26.4 26.4 26.5 26.7 26.7 26.7 26.7 26.7 26.7 ■ ■ 26.5 .8 1.926.6 26.5 26.6 26.6 26.7 26.8 26.8 26.9 26.9 27.0 26.9 26.9 - - 26.7 .7 .826.9 26.9 26.9 26.8 26.9 26.9 26.9 26.9 26.8 26.8 26.8 26.7 ‘ 26.9 -.7 .7
26.7 26.7 26.7 26.7 26.7 26.7 26.8 26.8 26.9 26.9 26.9 26.8 - - 26.8 .4 -.426.8 26.8 26.8 26.9 27.0 27.2 27.4 27.3 27.4 27.5 27.5 27.6 ■ ■ 27.2 3.0 1.527.6 27.7 27.8 27.9 28.0 28.1 28.3 28.3 28.3 28.3 28.4 28.4 - - 28.1 2.9 3.328.6 28.6 28.8 28.9 28.9 28.9 29.0 28.9 28.9 28.9 29.0 28.9 - - 28.9 1.8 2.829.0 28.9 28.9 29.0 29.0 29.1 29.2 29.2 29.3 29.4 29.4 29.4 ' 29.1 1.7 .7
29.3 29.4 29.4 29.5 29.5 29.6 29.6 29.6 29.6 29.8 29.8 29.8 - - 29.6 1.4 1.729.8 29.8 29.8 29.8 29.8 29.8 30.0 29.9 30.0 30.0 30.0 30.0 - - 29.9 .7 1.030.0 30.1 30.1 30.2 30.2 30.2 30.3 30.3 30.4 30.4 30.4 30.4 - - 30.2 1.3 1.030.4 30.4 30.5 30.5 30.5 30.6 30.7 30.7 30.7 30.8 30.8 30.9 - - 30.6 1.6 1.330.9 30.9 30.9 30.9 30.9 31.0 31.1 31.0 31.1 31.1 31.2 31.2 ' " 31.0 1.0 1.3
31.2 31.2 31.3 31.4 31.4 31.6 31.6 31.6 31.6 31.7 31.7 31.8 - - 31.5 1.9 1.631.8 32.0 32.1 32.3 32.3 32.4 32.5 32.7 32.7 32.9 32.9 32.9 - - 32.4 3.5 2.932.9 32.9 33.0 33.1 33.2 33.3 33.4 33.5 33.6 33.7 33.8 33.9 - - 33.4 3.0 3.134.1 34.2 34.3 34.4 34.5 34.7 34.9 35.0 35.1 35.3 35.4 35.5 - - 34.8 4.7 4.235.6 35.8 36.1 36.3 36.4 36.6 36.8 37.0 37.1 37.3 37.5 37.7 36.7 6.2 5.5
73Digitized for FRASER http://fraser.stlouisfed.org/ Federal Reserve Bank of St. Louis
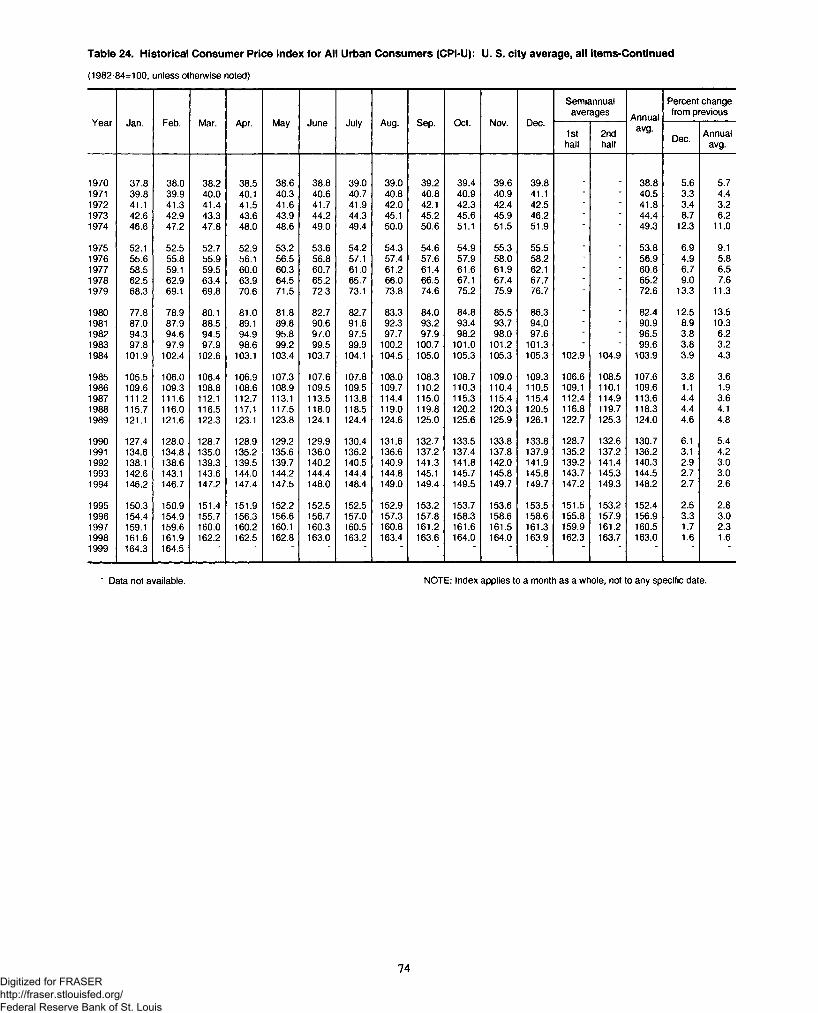
Table 24. Historical Consumer Price Index for All Urban Consumers (CPI-U): U. S. city average, all items-Continued
(1982-84=100, unless otherwise noted)
Year Jan. Feb. Mar. Apr. May June July Aug. Sep. Oct. Nov. Dec.
Semiannualaverages Annual
Percent change from previous
1sthalf
2ndhalf
avg.Dec. Annual
avg.
1970 37.8 38.0 38.2 38.5 38.6 38.8 39.0 39.0 39.2 39.4 39.6 39.8 38.8 5.6 5.71971 39.8 39.9 40.0 40.1 40.3 40.6 40.7 40.8 40.8 40.9 40.9 41.1 - - 40.5 3.3 4.41972 41.1 41.3 41.4 41.5 41.6 41.7 41.9 42.0 42.1 42.3 42.4 42.5 - - 41.8 3.4 3.21973 42.6 42.9 43.3 43.6 43.9 44.2 44.3 45.1 45.2 45.6 45.9 46.2 - - 44.4 8.7 6.21974 46.6 47.2 47.8 48.0 48.6 49.0 49.4 50.0 50.6 51.1 51.5 51.9 ■ ■ 49.3 12.3 11.0
1975 52.1 52.5 52.7 52.9 53.2 53.6 54.2 54.3 54.6 54.9 55.3 55.5 - - 53.8 6.9 9.11976 55.6 55.8 55.9 56.1 56.5 56.8 57.1 57.4 57.6 57.9 58.0 58.2 - - 56.9 4.9 5.81977 58.5 59.1 59.5 60.0 60.3 60.7 61.0 61.2 61.4 61.6 61.9 62.1 - - 60.6 6.7 6.51978 62.5 62.9 63.4 63.9 64.5 65.2 65.7 66.0 66.5 67.1 67.4 67.7 - - 65.2 9.0 7.61979 68.3 69.1 69.8 70.6 71.5 72.3 73.1 73.8 74.6 75.2 75.9 76.7 ~ ■ 72.6 13.3 11.3
1980 77.8 78.9 80.1 81.0 81.8 82.7 82.7 83.3 84.0 84.8 85.5 86.3 - - 82.4 12.5 13.51981 87.0 87.9 88.5 89.1 89.8 90.6 91.6 92.3 93.2 93.4 93.7 94.0 - - 90.9 8.9 10.31982 94.3 94.6 94.5 94.9 95.8 97.0 97.5 97.7 97.9 98.2 98.0 97.6 - - 96.5 3.8 6.21983 97.8 97.9 97.9 98.6 99.2 99.5 99.9 100.2 100.7 101.0 101.2 101.3 - - 99.6 3.8 3.21984 101.9 102.4 102.6 103.1 103.4 103.7 104.1 104.5 105.0 105.3 105.3 105.3 102.9 104.9 103.9 3.9 4.3
1985 105.5 106.0 106.4 106.9 107.3 107.6 107.8 108.0 108.3 108.7 109.0 109.3 106.6 108.5 107.6 3.8 3.61986 109.6 109.3 108.8 108.6 108.9 109.5 109.5 109.7 110.2 110.3 110.4 110.5 109.1 110.1 109.6 1.1 1.91987 111.2 111.6 112.1 112.7 113.1 113.5 113.8 114.4 115.0 115.3 115.4 115.4 112.4 114.9 113.6 4.4 3.61988 115.7 116.0 116.5 117.1 117.5 118.0 118.5 119.0 119.8 120.2 120.3 120.5 116.8 119.7 118.3 4.4 4.11989 121.1 121.6 122.3 123.1 123.8 124.1 124.4 124.6 125.0 125.6 125.9 126.1 122.7 125.3 124.0 4.6 4.8
1990 127.4 128.0 128.7 128.9 129.2 129.9 130.4 131.6 132.7 133.5 133.8 133.8 128.7 132.6 130.7 6.1 5.41991 134.6 134.8 135.0 135.2 135.6 136.0 136.2 136.6 137.2 137.4 137.8 137.9 135.2 137.2 136.2 3.1 4.21992 138.1 138.6 139.3 139.5 139.7 140.2 140.5 140.9 141.3 141.8 142.0 141.9 139.2 141.4 140.3 2.9 3.01993 142.6 143.1 143.6 144.0 144.2 144.4 144.4 144.8 145.1 145.7 145.8 145.8 143.7 145.3 144.5 2.7 3.01994 146.2 146.7 147.2 147.4 147.5 148.0 148.4 149.0 149.4 149.5 149.7 149.7 147.2 149.3 148.2 2.7 2.6
1995 150.3 150.9 151.4 151.9 152.2 152.5 152.5 152.9 153.2 153.7 153.6 153.5 151.5 153.2 152.4 2.5 2.81996 154.4 154.9 155.7 156.3 156.6 156.7 157.0 157.3 157.8 158.3 158.6 158.6 155.8 157.9 156.9 3.3 3.01997 159.1 159.6 160.0 160.2 160.1 160.3 160.5 160.8 161.2 161.6 161.5 161.3 159.9 161.2 160.5 1.7 2.31998 161.6 161.9 162.2 162.5 162.8 163.0 163.2 163.4 163.6 164.0 164.0 163.9 162.3 163.7 163.0 1.6 1.61999 164.3 164.5
" Data not available. NOTE: Index applies to a month as a whole, not to any specific date.
74Digitized for FRASER http://fraser.stlouisfed.org/ Federal Reserve Bank of St. Louis
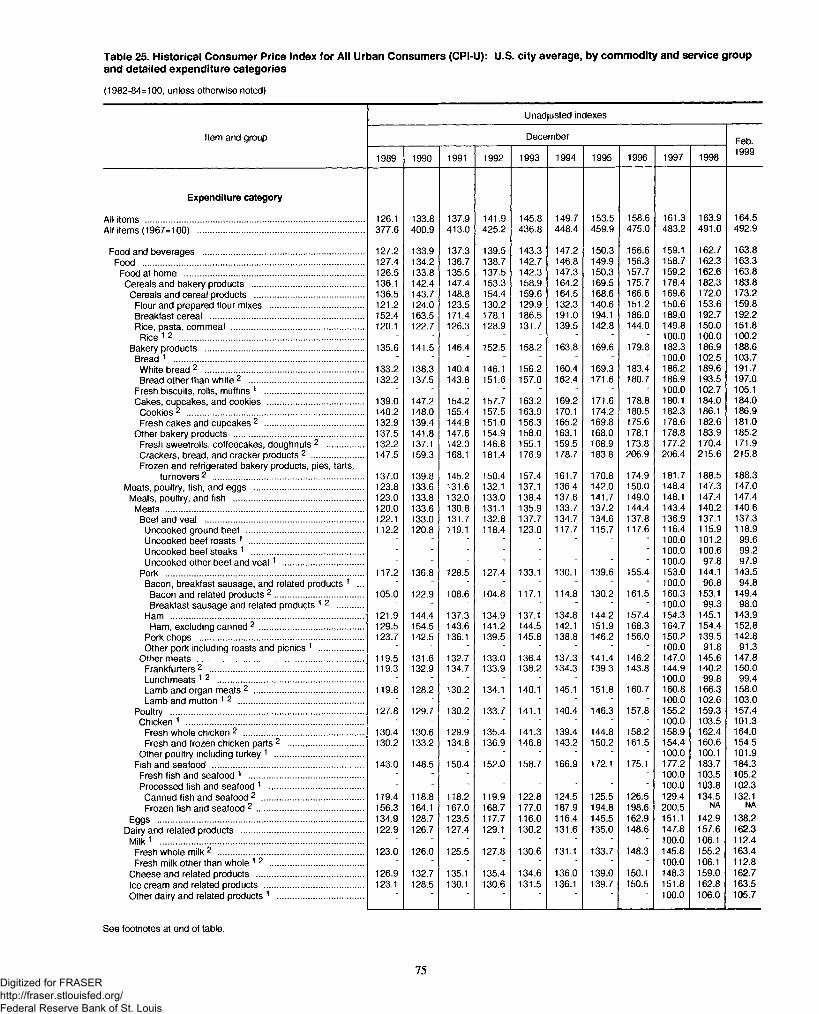
Table 25. Historical Consumer Price Index for All Urban Consumers (CPI-U): U.S. city average, by commodity and service groupand detailed expenditure categories
(1982-84=100, unless otherwise noted)
Unadjusted indexes
Item and group December Feb.
1989 1990 1991 1992 1993 1994 1995 1996 1997 1998 1999
Expenditure category
All items ........................................................................................... 126.1 133.8 137.9 141.9 145.8 149.7 153.5 158.6 161.3 163.9 164.5All items (1967-100) ..................................................................... 377.6 400.9 413.0 425.2 436.8 448.4 459.9 475.0 483.2 491.0 492.9
Food and beverages ................................................................... 127.2 133.9 137.3 139.5 143.3 147.2 150.3 156.6 159.1 162.7 163.8Food ............................................................................................ 127.4 134.2 136.7 138.7 142.7 146.8 149.9 156.3 158.7 162.3 163.3
Food at home ........................................................................... 126.5 133.8 135.5 137.5 142.3 147.3 150.3 157.7 159.2 162.6 163.8Cereals and bakery products ............................................... 136.1 142.4 147.4 153.3 158.9 164.2 169.5 175.7 178.4 182.3 183.8
Cereals and cereal products .............................................. 136.5 143.7 148.8 154.4 159.6 164.5 168.6 166.6 169.6 172.0 173.2Flour and prepared flour mixes ....................................... 121.2 124.0 123.5 130.2 129.9 132.3 140.6 151.2 150.6 153.6 159.8Breakfast cereal ................................................................ 152.4 163.5 171.4 178.1 186.5 191.0 194.1 186.0 189.0 192.7 192.2Rice, pasta, cornmeal ....................................................... 120.1 122.7 126.3 128.9 131.7 139.5 142.8 144.0 149.8 150.0 151.8
Rice 1 2 ............................................................................. - - - - - - - - 100.0 100.0 100.2Bakery products .................................................................. 135.6 141.5 146.4 152.5 158.2 163.8 169.6 179.8 182.3 186.9 188.6
Bread 1 ............................................................................... - - - - - ■ ■ ■ 100.0 102.5 103.7White bread 2 .................................................................. 133.2 138.3 140.4 146.1 156.2 160.4 169.3 183.4 186.2 189.6 191.7Bread other than white 2 ................................................ 132.2 137.5 143.8 151.6 157.0 162.4 171.6 180.7 186.9 193.5 197.0
Fresh biscuits, rolls, muffins 1 ......................................... - - - - - - - - 100.0 102.7 105.1Cakes, cupcakes, and cookies ........................................ 139.0 147.2 154.2 157.7 163.2 169.2 171.6 178.8 180.1 184.0 184.0
Cookies2 .......................................................................... 140.2 148.0 155.4 157.5 163.9 170.1 174.2 180.5 182.3 186.1 186.9Fresh cakes and cupcakes 2 ......................................... 132.9 139.4 144.8 151.0 156.3 165.2 169.8 175.6 178.6 182.6 181.0
Other bakery products ...................................................... 137.5 141.8 147.6 154.9 158.0 163.1 168.0 178.1 178.8 183.9 185.2Fresh sweetrolls, coffeecakes, doughnuts 2 ............... 132.2 137.1 142.0 146.8 155.1 159.5 168.9 173.8 177.2 170.4 171.9Crackers, bread, and cracker products 2 ...................... 147.5 159.3 168.1 181.4 176.9 178.7 183.8 206.9 206.4 215.6 215.8Frozen and refrigerated bakery products, pies, tarts,
turnovers 2 ............................................................... 137.0 139.8 145.2 150.4 157.4 161.7 170.8 174.9 181.7 188.5 188.3Meats, poultry, fish, and eggs .............................................. 123.8 133.6 131.6 132.1 137.1 136.4 142.0 150.0 148.4 147.3 147.0
Meats, poultry, and fish ...................................................... 123.0 133.8 132.0 133.0 138.4 137.6 141.7 149.0 148.1 147.4 147.4Meats ................................................................................... 120.0 133.6 130.8 131.1 135.9 133.7 137.2 144.4 143.4 140.2 140.6
Beef and veal .................................................................. 122.1 133.0 131.7 132.8 137.7 134.7 134.6 137.8 136.9 137.1 137.3Uncooked ground beef ................................................. 112.2 120.8 119.1 118.4 123.0 117.7 115.7 117.6 116.4 115.9 118.9Uncooked beef roasts 1 ................................................ - - - - - - - ■ 100.0 101.2 99.6Uncooked beef steaks 1 ............................................... - - - - - - - - 100.0 100.6 99.2Uncooked other beef and v e a l1 ................................. - - - - - ■ ■ ■ 100.0 97.8 97.9
Pork ................................................................................... 117.2 136.8 128.5 127.4 133.1 130.1 139.6 155.4 153.0 144.1 143.5Bacon, breakfast sausage, and related products 1 ... - - - - - - ■ ■ 100.0 96.8 94.8
Bacon and related products 2 ..................................... 105.0 122.9 108.6 104.8 117.1 114.8 130.2 161.5 160.3 153.1 149.4Breakfast sausage and related products 12 ........... - - - - - - - ■ 100.0 99.3 98.0
Ham ................................................................................ 121.9 144.4 137.3 134.9 137.1 134.8 144.2 157.4 154.3 145.1 143.9Ham, excluding canned 2 ........................................... 129.5 154.5 143.6 141.2 144.5 142.1 151.9 168.3 164.7 154.4 152.8
Pork chops .................................................................... 123.7 142.5 136.1 139.5 145.8 138.8 146.2 156.0 150.2 139.5 142.8Other pork including roasts and picnics 1 .................. • - • • ■ ■ ■ ■ 100.0 91.8 91.3
Other meats ..................................................................... 119.5 131.6 132.7 133.0 136.4 137.3 141.4 146.2 147.0 145.6 147.8Frankfurters 2 ................................................................ 119.3 132.9 134.7 133.9 138.2 134.3 139.3 143.8 144.9 140.2 150.0Lunch meats 1 2 ............................................................. - - - - - - - - 100.0 99.8 99.4Lamb and organ meats 2 .............................................. 119.8 128.2 130.2 134.1 140.1 145.1 151.8 160.7 160.8 166.3 158.0Lamb and mutton 1 2 .................................................... - - - - - - - - 100.0 102.6 103.0
Poultry ................................................................................ 127.8 129.7 130.2 133.7 141.1 140.4 146.3 157.8 155.2 159.3 157.4Chicken 1 .......................................................................... - - - - - - - - 100.0 103.5 101.3
Fresh whole chicken 2 .................................................. 130.4 130.6 129.9 135.4 141.3 139.4 144.8 158.2 158.9 162.4 164.0Fresh and frozen chicken parts 2 ............................... 130.2 133.2 134.8 136.9 146.8 143.2 150.2 161.5 154.4 160.6 154.5
Other poultry including turkey 1 ............ ........................ - - - - - ■ ■ ■ 100.0 100.1 101.9Fish and seafood ............................................................... 143.0 148.5 150.4 152.0 158.7 166.9 172.1 175.1 177.2 183.7 184.3
Fresh fish and seafood 1 ................................................ - - - - - - - - 100.0 103.5 105.2Processed fish and seafood 1 ....................................... - - - - - - - - 100.0 103.8 102.3Canned fish and seafood 2 .......................................... 119.4 118.8 118.2 119.9 122.8 124.5 125.5 126.5 129.4 134.5 132.1Frozen fish and seafood 2 ............................................ 156.3 164.1 167.0 168.7 177.0 187.9 194.8 198.6 200.5 NA NA
Eggs ...................................................................................... 134.9 128.7 123.5 117.7 116.0 116.4 145.5 162.9 151.1 142.9 138.2Dairy and related products ................................................... 122.9 126.7 127.4 129.1 130.2 131.6 135.0 148.6 147.8 157.6 162.3
M ilk1 ..................................................................................... - - - - - - - - 100.0 106.1 112.4Fresh whole milk 2 ............................................................. 123.0 126.0 125.5 127.8 130.6 131.1 133.7 148.3 145.8 155.2 163.4Fresh milk other than whole 1 2 ....................................... - - - - - - - - 100.0 106.1 112.8
Cheese and related products ............................................. 126.9 132.7 135.1 135.4 134.6 136.0 139.0 150.1 148.3 159.0 162.7Ice cream and related products ......................................... 123.1 128.5 130.1 130.6 131.5 136.1 139.7 150.5 151.8 162.8 163.5Other dairy and related products 1 .................................... 100.0 106.0 105.7
See footnotes at end of table.
75Digitized for FRASER http://fraser.stlouisfed.org/ Federal Reserve Bank of St. Louis
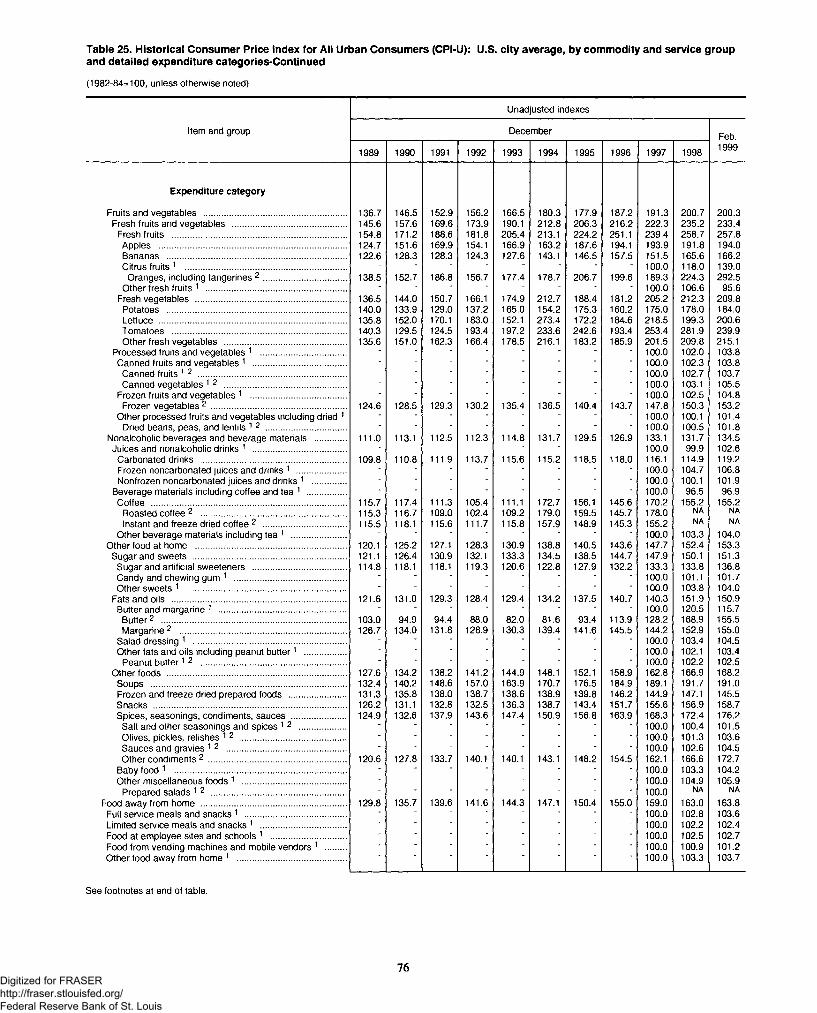
Table 25. Historical Consumer Price Index for All Urban Consumers (CPI-U): U.S. city average, by commodity and service groupand detailed expenditure categories-Continued
(1982-84=100, unless otherwise noted)
Unadjusted indexes
Item and group December Feb.
1989 1990 1991 1992 1993 1994 1995 1996 1997 1998 1999
Expenditure category
Fruits and vegetables ............................................................ 136.7 146.5 152.9 156.2 166.5 180.3 177.9 187.2 191.3 200.7 200.3Fresh fruits and vegetables ................................................ 145.6 157.6 169.6 173.9 190.1 212.8 206.3 216.2 222.3 235.2 233.4
Fresh fruits ......................................................................... 154.8 171.2 188.6 181.8 205.4 213.1 224.2 251.1 239.4 258.7 257.8Apples .............................................................................. 124.7 151.6 169.9 154.1 166.9 163.2 187.6 194.1 193.9 191.8 194.0Bananas ........................................................................... 122.6 128.3 128.3 124.3 127.6 143.1 146.5 157.5 151.5 165.6 166.2Citrus fruits 1 ................................................................... - - - - - - - - 100.0 118.0 139.0
Oranges, including tangerines 2 ................................... 138.5 152.7 186.8 156.7 177.4 178.7 206.7 199.6 189.3 224.3 292.5Other fresh fruits 1 ........................................................... - ■ ' * - - - - 100.0 106.6 95.6
Fresh vegetables ............................................................... 136.5 144.0 150.7 166.1 174.9 212.7 188.4 181.2 205.2 212.3 209.8Potatoes ........................................................................... 140.0 133.9 129.0 137.2 165.0 154.2 175.3 160.2 175.0 178.0 184.0Lettuce .............................................................................. 135.8 152.0 170.1 183.0 152.1 273.4 172.2 184.6 218.5 199.3 200.6Tomatoes ......................................................................... 140.3 129.5 124.5 193.4 197.2 233.6 242.6 193.4 253.4 281.9 239.9Other fresh vegetables ................................................... 135.6 151.0 162.3 166.4 178.5 216.1 183.2 185.9 201.5 209.8 215.1
Processed fruits and vegetables 1 .................................... - - - - - - - - 100.0 102.0 103.8Canned fruits and vegetables 1 ....................................... - - - - - - - - 100.0 102.3 103.8
Canned fruits 1 2 .............................................................. - - - * ■ - - - 100.0 102.7 103.7Canned vegetables 1 2 ................................................... - - - - - - - - 100.0 103.1 105.5
Frozen fruits and vegetables 1 ........................................ - - - - - - - - 100.0 102.5 104.8Frozen vegetables 2 ........................................................ 124.6 128.5 129.3 130.2 135.4 136.5 140.4 143.7 147.8 150.3 153.2
Other processed fruits and vegetables including dried 1 - - - - - - - - 100.0 100.1 101.4Dried beans, peas, and lentils 1 2 ................................. - - - ■ ■ ■ ■ - 100.0 100.5 101.8
Nonalcoholic beverages and beverage materials ............. 111.0 113.1 112.5 112.3 114.8 131.7 129.5 126.9 133.1 131.7 134.5Juices and nonalcoholic drinks 1 ....................................... - - - - - - - - 100.0 99.9 102.6
Carbonated drinks ............................................................. 109.8 110.8 111.9 113.7 115.6 115.2 118.5 118.0 116.1 114.9 119.2Frozen noncarbonated juices and drinks 1 ..................... - - - - - - - - 100.0 104.7 106.8Nonfrozen noncarbonated juices and drinks 1 .............. - - - - - - - - 100.0 100.1 101.9
Beverage materials including coffee and tea 1 ................ - - - - - - - - 100.0 96.5 96.9Coffee ................................................................................. 115.7 117.4 111.3 105.4 111.1 172.7 156.1 145.6 170.2 155.2 155.2
Roasted coffee 2 ............................................................. 115.3 116.7 109.0 102.4 109.2 179.0 159.5 145.7 178.0 NA NA
Instant and freeze dried coffee 2 ................................... 115.5 118.1 115.6 111.7 115.8 157.9 148.9 145.3 155.2 NA NA
Other beverage materials including tea 1 ....................... - - - - - - - - 100.0 103.3 104.0Other food at home ............................................................... 120.1 125.2 127.1 128.3 130.9 138.8 140.5 143.6 147.7 152.4 153.3
Sugar and sweets ................................................................ 121.1 126.4 130.9 132.1 133.3 134.5 138.5 144.7 147.9 150.1 151.3Sugar and artificial sweeteners ....................................... 114.8 118.1 118.1 119.3 120.6 122.8 127.9 132.2 133.3 133.8 136.8Candy and chewing gum 1 ............................................... - - - - - - - - 100.0 101.1 101.7Other sweets 1 .................................................................. - - * ■ • - - - 100.0 103.8 104.0
Fats and oils ......................................................................... 121.6 131.0 129.3 128.4 129.4 134.2 137.5 140.7 140.3 151.9 150.9Butter and margarine 1 ..................................................... - - - - - - - - 100.0 120.5 115.7
Butter2 ............................................................................. 103.0 94.9 94.4 88.0 82.0 81.6 93.4 113.9 128.2 168.9 155.5Margarine 2 ..................................................................... 126.7 134.0 131.8 128.9 130.3 139.4 141.6 145.5 144.2 152.9 155.0
Salad dressing 1 ................................................................ - - - - - - - - 100.0 103.4 104.5Other fats and oils including peanut butter1 ................. • • ■ ■ ■ ■ ■ ■ 100.0 102.1 103.4
Peanut bu tte r1 2 ............................................................ - - ■ - * - ■ - 100.0 102.2 102.5Other foods ........................................................................... 127.6 134.2 138.2 141.2 144.9 148.1 152.1 158.9 162.8 166.9 168.2
Soups ................................................................................. 132.4 140.2 148.6 157.0 163.9 170.7 176.5 184.9 189.1 191.7 191.0Frozen and freeze dried prepared foods ........................ 131.3 135.8 138.0 138.7 138.6 138.9 139.8 146.2 144.9 147.1 145.5Snacks ................................................................................ 126.2 131.1 132.8 132.5 136.3 138.7 143.4 151.7 155.6 156.9 158.7Spices, seasonings, condiments, sauces ....................... 124.9 132.6 137.9 143.6 147.4 150.9 156.8 163.9 168.3 172.4 176.2
Salt and other seasonings and spices 1 2 ................... - * - - - - - - 100.0 100.4 101.5Olives, pickles, relishes 1 2 ............................................ - • • ■ - - - - 100.0 101.3 103.6Sauces and gravies 1 2 .................................................. - - - - - - - - 100.0 102.6 104.5Other condiments 2 ......................................................... 120.6 127.8 133.7 140.1 140.1 143.1 148.2 154.5 162.1 166.6 172.7
Baby food 1 ....................................................................... - - - - - - - - 100.0 103.3 104.2Other miscellaneous foods 1 ........................................... - - - - - - - - 100.0 104.9 105.9
Prepared salads 1 2 ........................................................ - - - - - - - - 100.0 NA NA
Food away from home ............................................................ 129.8 135.7 139.6 141.6 144.3 147.1 150.4 155.0 159.0 163.0 163.8Full service meals and snacks 1 .......................................... - - - - - - - - 100.0 102.8 103.6Limited service meals and snacks 1 .................................... - - - - - - - - 100.0 102.2 102.4Food at employee sites and schools 1 ............................... - - - - - - - - 100.0 102.5 102.7Food from vending machines and mobile vendors 1 ......... - - • - * - - - 100.0 100.9 101.2Other food away from home 1 ............................................. 100.0 103.3 103.7
See footnotes at end of table.
76Digitized for FRASER http://fraser.stlouisfed.org/ Federal Reserve Bank of St. Louis
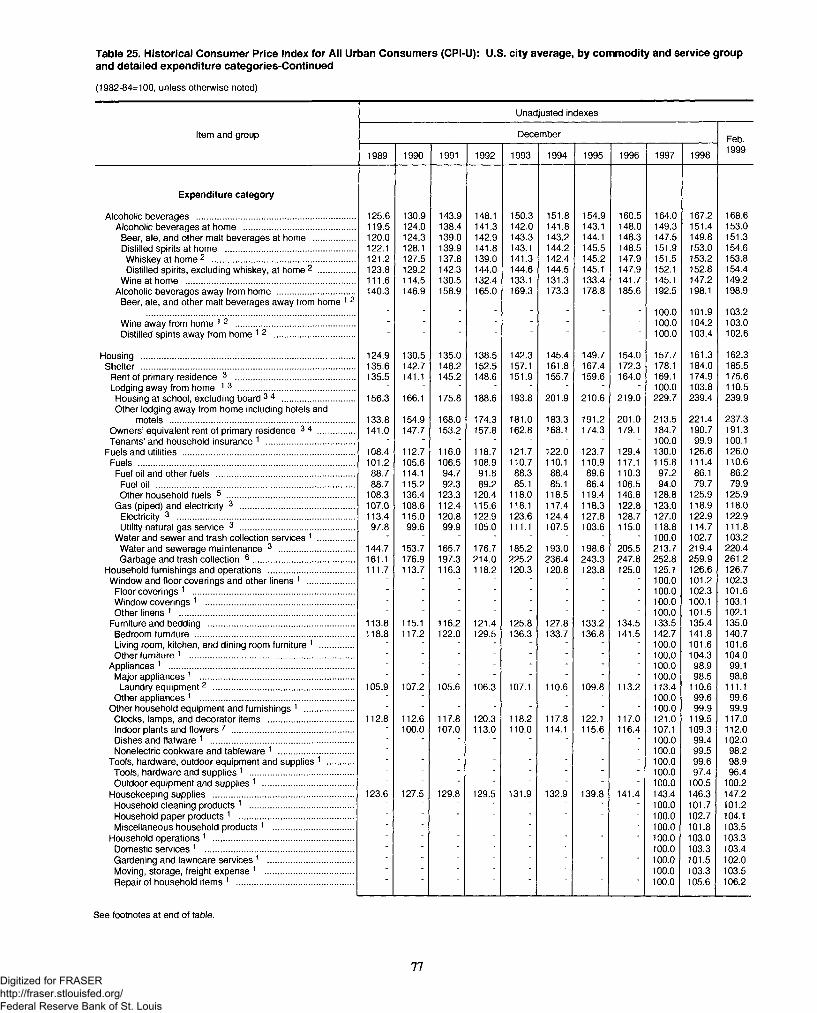
Table 25. Historical Consumer Price Index for All Urban Consumers (CPI-U): U.S. city average, by commodity and service groupand detailed expenditure categories-Continued
(1982-84=100, unless otherwise noted)
Unadjusted indexes
Item and group December Feb.
1989 1990 1991 1992 1993 1994 1995 1996 1997 1998 1999
Expenditure category
Alcoholic beverages .................................................................. 125.6 130.9 143.9 148.1 150.3 151.8 154.9 160.5 164.0 167.2 168.6Alcoholic beverages at home .............................................. 119.5 124.0 138.4 141.3 142.0 141.8 143.1 148.0 149.3 151.4 153.0
Beer, ale, and other malt beverages at home ................. 120.0 124.3 139.0 142.9 143.3 143.2 144.1 148.3 147.5 149.8 151.3Distilled spirits at home ...................................................... 122.1 128.1 139.9 141.8 143.1 144.2 145.5 148.5 151.9 153.0 154.6Whiskey at home 2 ............................................................ 121.2 127.5 137.8 139.0 141.3 142.4 145.2 147.9 151.5 153.2 153.8Distilled spirits, excluding whiskey, at home 2 ............... 123.8 129.2 142.3 144.0 144.6 144.5 145.1 147.9 152.1 152.8 154.4
Wine at home ...................................................................... 111.6 114.5 130.5 132.4 133.1 131.3 133.4 141.7 145.1 147.2 149.2Alcoholic beverages away from home ................................ 140.3 146.9 158.9 165.0 169.3 173.3 178.8 185.6 192.5 198.1 198.9
Beer, ale, and other malt beverages away from home 1 2- - - - - ■ - ■ 100.0 101.9 103.2
Wine away from home 1 2 .................................................. - - - - - - - - 100.0 104.2 103.0Distilled spirits away from home 1 2 ................................. “ ' ' " 100.0 103.4 102.6
Housing ................................................... ..................................... 124.9 130.5 135.0 138.5 142.3 145.4 149.7 154.0 157.7 161.3 162.3Shelter ......................................................................................... 135.6 142.7 148.2 152.5 157.1 161.8 167.4 172.3 178.1 184.0 185.5
Rent of primary residence 3 .................................................. 135.5 141.1 145.2 148.6 151.9 155.7 159.6 164.0 169.1 174.9 175.6Lodging away from home 1 3 ................................................. - - - - - - • ■ 100.0 103.8 110.5Housing at school, excluding board 3 4 .............................. 156.3 166.1 175.8 188.6 193.8 201.9 210.6 219.0 229.7 239.4 239.9Other lodging away from home including hotels and
motels ............................................................................. 133.8 154.9 168.0 174.3 181.0 183.3 191.2 201.0 213.5 221.4 237.3Owners’ equivalent rent of primary residence 3 4 ............... 141.0 147.7 153.2 157.8 162.8 168.1 174.3 179.1 184.7 190.7 191.3Tenants’ and household insurance 1 ..................................... - - - - - - - ■ 100.0 99.9 100.1
Fuels and utilities ....................................................................... 108.4 112.7 116.0 118.7 121.7 122.0 123.7 129.4 130.0 126.6 126.0Fuels .......................................................................................... 101.2 105.6 106.5 108.9 110.7 110.1 110.9 117.1 115.8 111.4 110.6
Fuel oil and other fuels ......................................................... 88.7 114.1 94.7 91.8 88.3 88.4 89.6 110.3 97.2 86.1 86.2Fuel oil ................................... ............................................... 88.7 115.2 92.3 89.2 85.1 85.1 86.4 106.5 94.0 79.7 79.9Other household fuels 5 ..................................................... 108.3 136.4 123.3 120.4 118.0 118.5 119.4 146.8 128.8 125.9 125.9
Gas (piped) and electricity 3 ................................................ 107.0 108.6 112.4 115.6 118.1 117.4 118.3 122.8 123.0 118.9 118.0Electricity 3 .......................................................................... 113.4 115.0 120.8 122.9 123.6 124.4 127.8 128.7 127.0 122.9 122.9Utility natural gas service 3 ................................................ 97.8 99.6 99.9 105.0 111.1 107.5 103.6 115.0 118.8 114.7 111.8
Water and sewer and trash collection services 1 ............... - - - - - - - - 100.0 102.7 103.2Water and sewerage maintenance 3 ............................... 144.7 153.7 165.7 176.7 185.2 193.0 198.6 205.5 213.7 219.4 220.4Garbage and trash collection 6 .......................................... 161.1 176.9 197.3. 214.0 225.2 236.4 243.3 247.8 252.8 259.9 261.2
Household furnishings and operations .................................... 111.7 113.7 116.3 118.2 120.3 120.8 123.8 125.0 125.1 126.6 126.7Window and floor coverings and other linens 1 ................... - - - - - - - - 100.0 101.2 102.3
Floor coverings 1 ................................................................... - - - - - - - - 100.0 102.3 101.6Window coverings 1 .............................................................. ■ • ■ - ■ * ■ • 100.0 100.1 103.1Other linens 1 .................................................................. ...... - - - - - - - - 100.0 101.5 102.1
Furniture and bedding ............................................................. 113.8 115.1 116.2 121.4 125.8 127.8 133.2 134.5 133.5 135.4 135.0Bedroom furniture .................................................................. 118.8 117.2 122.0 129.5 136.3 133.7 136.8 141.5 142.7 141.8 140.7Living room, kitchen, and dining room furniture 1 .............. - - - - - - - - 100.0 101.6 101.6Other furniture 1 .................................................................... - - - - - - - - 100.0 104.3 104.0
Appliances 1 ............................................................................. - - - - - - - - 100.0 98.9 99.1Major appliances 1 ................................................................ ■ ■ ■ ■ ■ ■ ■ ■ 100.0 98.5 98.8
Laundry equipment2 ........................................................... 105.9 107.2 105.6 106.3 107.1 110.6 109.8 113.2 113.4 110.6 111.1Other appliances 1 ................................................................ - - - - - - - - 100.0 99.6 99.6
Other household equipment and furnishings 1 .................... • • - - - - - - 100.0 99.9 99.9Clocks, lamps, and decorator items ................................... 112.8 112.6 117.8 120.3 118.2 117.8 122.1 117.0 121.0 119.5 117.0Indoor plants and flowers 7 ................................................... - 100.0 107.0 113.0 110.0 114.1 115.6 116.4 107.1 109.3 112.0Dishes and flatware 1 ........................................................... - - - - - - - - 100.0 99.4 102.0Nonelectric cookware and tableware 1 ............................... - - - - - - - - 100.0 99.5 98.2
Tools, hardware, outdoor equipment and supplies 1 ........... - - - - - - - - 100.0 99.6 98.9Tools, hardware and supplies 1 ........................................... ■ ■ ■ - ■ ■ - - 100.0 97.4 96.4Outdoor equipment and supplies 1 ...................................... ■ ■ ■ ■ ■ ~ - • 100.0 100.5 100.2
Housekeeping supplies ........................................................... 123.6 127.5 129.8 129.5 131.9 132.9 139.8 141.4 143.4 146.3 147.2Household cleaning products 1 ........................................... ■ ■ ■ • ■ ■ ■ ■ 100.0 101.7 101.2Household paper products 1 ................................................ ■ ■ ■ ■ ■ ■ ■ ■ 100.0 102.7 104.1Miscellaneous household products 1 ................................. ■ ■ ■ • ■ ■ ■ ■ 100.0 101.8 103.5
Household operations 1 ........................................................... ■ ■ - - - ■ - - 100.0 103.0 103.3Domestic services 1 .............................................................. ■ ■ ■ * ■ ■ - ■ 100.0 103.3 103.4Gardening and lawncare services 1 .................................... - - - - - - - - 100.0 101.5 102.0Moving, storage, freight expense 1 ..................................... ■ ■ ■ ■ ■ ■ ■ - 100.0 103.3 103.5Repair of household items 1 ................................................. 100.0 105.6 106.2
See footnotes at end of table.
77Digitized for FRASER http://fraser.stlouisfed.org/ Federal Reserve Bank of St. Louis

Table 25. Historical Consumer Price Index for All Urban Consumers (CPI-U): U.S. city average, by commodity and service groupand detailed expenditure categories-Continued
(1982-84=100, unless otherwise noted)
Unadjusted indexes
Item and group DecemberFeb.
1989 1990 1991 1992 1993 1994 1995 1996 1997 1998 1999
Expenditure category
Apparel .......................................................................................... 119.2 125.3 129.6 131.4 132.6 130.5 130.6 130.3 131.6 130.7 129.7Men’s and boys’ apparel ........................................................... 118.8 122.3 125.9 127.1 127.5 125.3 126.0 127.8 131.2 130.3 129.9
Men’s apparel ........................................................................... 120.6 124.5 128.3 130.0 130.0 128.2 128.3 130.4 133.7 133.1 133.7Men’s suits, sport coats, and outerwear ............................. 124.7 128.2 131.3 132.8 137.4 136.0 133.7 133.3 135.8 133.2 133.8Men’s furnishings .................................................................. 117.4 119.8 122.2 123.6 123.0 122.7 120.0 124.6 134.1 133.1 135.2Men’s shirts and sweaters 1 ................................................. - - - - - - - - 100.0 100.6 97.7Men’s pants and shorts ........................................................ 116.7 121.9 126.1 129.2 127.8 125.8 127.0 129.2 129.0 128.9 134.0
Boys’ apparel ............................................................................ 111.4 113.0 116.2 115.0 117.1 113.2 116.2 116.8 120.7 118.8 115.2Women’s and girls’ apparel ...................................................... 116.4 123.5 128.4 129.1 130.6 125.7 124.7 123.3 123.6 122.4 120.6
Women’s apparel .................................................................... 116.5 124.2 128.0 128.4 131.0 125.3 124.1 123.0 123.7 123.0 120.6Women’s outerwear .............................................................. 108.9 117.2 121.1 126.2 131.8 119.0 123.5 126.1 126.7 122.1 109.7Women’s dresses .................................................................. 122.5 131.1 128.0 130.7 127.2 113.1 114.7 108.1 102.7 107.2 98.8Women’s suits and separates 1 .......................................... - - - - - - - - 100.0 98.2 97.3Women’s underwear, nightwear, sportswear and
accessories 1 ................................................................. - ■ ■ - - - - - 100.0 100.4 101.8Girls’ apparel ............................................................................ 116.1 120.2 130.8 133.5 129.1 128.2 128.7 125.0 123.6 119.4 120.9
Footwear ..................................................................................... 114.7 118.4 121.8 125.1 125.8 123.6 124.1 125.9 128.2 127.5 124.8Men’s footwear ......................................................................... 122.0 125.6 129.4 132.9 133.2 132.2 131.6 131.1 131.4 132.4 130.1Boys’ and girls’ footwear ........................................................ 118.5 122.9 122.7 121.5 122.1 123.3 125.2 130.4 133.5 133.3 129.8Women’s footwear ................................................................... 107.5 110.9 115.5 120.6 121.5 117.1 117.8 119.6 122.7 120.6 118.1
Infants’ and toddlers’ apparel ................................................... 115.3 125.6 129.2 130.7 127.1 131.3 128.7 126.9 125.8 129.6 126.4Jewelry and watches 5 ............................................................... 121.5 129.4 134.4 138.2 140.6 147.7 147.7 140.3 138.9 136.1 143.4
Watches 5 .................................................................................. 107.7 110.4 114.1 112.7 118.7 124.6 130.6 122.6 122.2 120.5 124.2Jewelry5 .................................................................................... 125.5 134.9 140.2 145.5 146.8 154.3 152.6 145.4 143.6 140.5 148.8
Transportation .............................................................................. 115.2 127.2 125.3 129.0 132.1 137.1 139.1 145.2 143.2 140.7 139.8Private transportation ................................................................ 113.9 125.1 123.4 126.7 128.6 134.9 136.6 141.7 140.0 137.2 135.9
New and used motor vehicles 1 ............................................. - - - - 94.1 98.3 100.7 101.7 100.0 100.9 99.9New vehicles .......................................................................... 121.9 124.3 128.3 131.3 135.6 140.1 142.8 145.4 144.1 144.1 143.8
New cars and trucks 1 2 ..................................................... - - - * - - - - 100.0 100.0 99.8New cars 2 ............................................................................. 121.8 123.5 127.6 130.5 134.2 138.5 140.7 143.0 141.5 141.3 140.8New trucks 2 6 ....................................................................... 120.7 125.8 129.6 132.9 139.0 144.1 148.2 151.5 151.4 152.1 152.4New motorcycles 2 5 ............................................................. 114.2 117.4 123.7 128.7 138.0 148.9 156.5 162.4 163.7 164.3 163.8
Used cars and trucks ............................................................. 119.7 117.1 120.1 129.0 139.3 151.5 158.2 155.6 147.9 153.1 148.3Car and truck renta l1 ............................................................ - - - - - - - - 100.0 101.5 100.0
Motor fuel ................................................................................. 85.8 117.1 98.4 100.2 94.8 100.4 96.4 108.6 101.9 86.2 83.6Gasoline (all types) ................................................................ 85.5 117.0 98.1 100.1 94.2 100.2 96.0 107.9 101.3 85.7 83.1
Gasoline, unleaded regular2 ............................................. 83.1 115.4 96.1 97.9 91.3 97.9 93.6 106.1 99.1 82.8 80.2Gasoline, unleaded midgrade 2 8 ...................................... - - - - 100.0 105.3 100.6 112.4 105.9 90.7 88.0Gasoline, unleaded premium 2 ........................................... 89.9 118.7 101.4 103.2 98.3 103.4 98.4 109.1 103.0 89.2 86.7
Other motor fuels 1 ................................................................ - * • - - - - - 100.0 87.7 86.0Motor vehicle parts and equipment ....................................... 101.1 102.0 103.6 103.0 101.4 101.9 102.4 102.3 101.4 101.2 100.9Tires ........................................................................................ 99.1 99.0 101.3 100.8 99.4 101.6 101.8 101.8 99.0 98.6 98.4Vehicle accessories other than tires 1 ................................ - - - - - - - - 100.0 99.9 99.5
Vehicle parts and equipment other than tires 2 ............... 107.3 109.4 110.2 109.5 107.7 106.3 107.3 107.0 108.2 108.3 107.9Motor oil, coolant, and fluids 2 ........................................... 109.8 117.5 118.4 118.1 118.8 126.0 130.0 132.0 131.8 130.8 130.9
Motor vehicle maintenance and repair ................................. 126.9 132.5 138.4 143.2 147.7 151.9 155.7 160.6 164.7 169.6 170.4Motor vehicle body work ....................................................... 133.9 138.5 141.9 145.8 150.0 155.7 161.2 168.6 176.2 181.5 181.0Motor vehicle maintenance and servicing .......................... 122.5 127.0 133.8 136.6 139.4 141.3 144.2 148.2 152.1 156.5 157.6Motor vehicle repa ir1 ............................................................ - - - - - - - - 100.0 103.0 103.5
Motor vehicle insurance ......................................................... 171.5 184.4 199.1 212.2 222.8 230.4 240.2 249.3 255.3 254.5 254.4Motor vehicle fees 1 ................................................................ - - - - - - - - 100.0 103.1 103.2
State and local registration and license 1 3 ........................ - - - - - - - - 100.0 101.4 101.6Parking and other fees 1 ...................................................... - • ■ - - - - - 100.0 107.0 107.2
Parking fees and tolls 1 2 .................................................... - ■ - - - - - - 100.0 107.4 107.3Automobile service clubs 1 2 ............................................. * ■ • - - - - - 100.0 100.9 101.3
Public transportation .................................................................. 131.7 154.4 149.8 158.2 176.5 165.6 170.7 189.9 184.3 188.4 193.1Airline fare ................................................................................ 134.8 165.4 155.4 165.7 193.8 175.3 178.4 204.7 194.8 202.8 211.4Other intercity transportation .................................................. 139.2 148.4 152.0 152.2 148.0 151.4 152.6 155.2 156.3 161.1 158.9
Ship fare 1 * ............................................................................ - • * * - - - - 100.0 104.6 100.8Intracity transportation ............................................................. 125.9 135.6 140.8 147.8 152.0 153.5 165.2 174.7 176.6 171.9 172.1
See footnotes at end of table.
78Digitized for FRASER http://fraser.stlouisfed.org/ Federal Reserve Bank of St. Louis
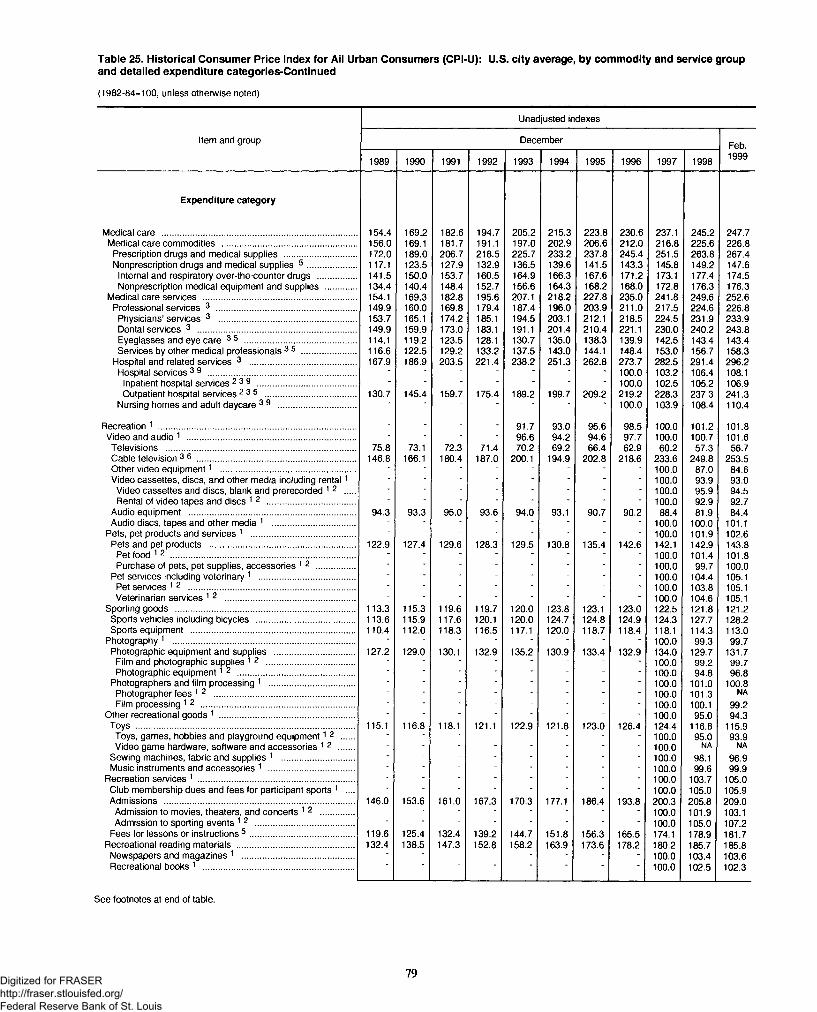
Table 25. Historical Consumer Price Index for Ail Urban Consumers (CPI-U): U.S. city average, by commodity and service groupand detailed expenditure categories-Continued
(1982-84=100, unless otherwise noted)
Unadjusted indexes
Item and group December Feb.
1989 1990 1991 1992 1993 1994 1995 1996 1997 1998 1999
Expenditure category
Medical care ................................................................................. 154.4 169.2 182.6 194.7 205.2 215.3 223.8 230.6 237.1 245.2 247.7Medical care commodities ........................................................ 156.0 169.1 181.7 191.1 197.0 202.9 206.6 212.0 216.8 225.6 226.8
Prescription drugs and medical supplies .............................. 172.0 189.0 206.7 218.5 225.7 233.2 237.8 245.4 251.5 263.8 267.4Nonprescription drugs and medical supplies 5 ..................... 117.1 123.5 127.9 132.9 136.5 139.6 141.5 143.3 145.8 149.2 147.6
Internal and respiratory over-the-counter drugs ................ 141.5 150.0 153.7 160.5 164.9 166.3 167.6 171.2 173.1 177.4 174.5Nonprescription medical equipment and supplies ............. 134.4 140.4 148.4 152.7 156.6 164.3 168.2 168.0 172.8 176.3 176.3
Medical care services ................................................................ 154.1 169.3 182.8 195.6 207.1 218.2 227.8 235.0 241.8 249.6 252.6Professional services 3 .......................................................... 149.9 160.0 169.8 179.4 187.4 196.0 203.9 211.0 217.5 224.6 226.8
Physicians’ services 3 ......................................................... 153.7 165.1 174.2 185.1 194.5 203.1 212.1 218.5 224.5 231.9 233.9Dental services 3 .................................................................. 149.9 159.9 173.0 183.1 191.1 201.4 210.4 221.1 230.0 240.2 243.8Eyeglasses and eye care 3 5 ............................................... 114.1 119.2 123.5 128.1 130.7 135.0 138.3 139.9 142.5 143.4 143.4Services by other medical professionals 3 5 ....................... 116.6 122.5 129.2 133.2 137.5 143.0 144.1 148.4 153.0 156.7 158.3
Hospital and related services 3 ............................................ 167.9 186.9 203.5 221.4 238.2 251.3 262.8 273.7 282.5 291.4 296.2Hospital sen/ices 3 9 .............................................................. - - - - - - - 100.0 103.2 106.4 108.1
Inpatient hospital services 23 9 ......................................... - - - - - - - 100.0 102.5 105.2 106.9Outpatient hospital services 2 35 ...................................... 130.7 145.4 159.7 175.4 189.2 199.7 209.2 219.2 228.3 237.3 241.3
Nursing homes and adult daycare 3 9 ................................ ' ' ' ■ ■ ■ ■ 100.0 103.9 108.4 110.4
Recreation 1 .................................................................................. - - - - 91.7 93.0 95.6 98.5 100.0 101.2 101.8Video and audio 1 ...................................................................... - - - - 96.6 94.2 94.6 97.7 100.0 100.7 101.6
Televisions ............................................................................... 75.8 73.1 72.3 71.4 70.2 69.2 66.4 62.9 60.2 57.3 56.7Cable television 3 6 .................................................................. 146.8 166.1 180.4 187.0 200.1 194.9 202.8 218.6 233.6 249.8 253.5Other video equipment1 ........................................................ - - - - - - - - 100.0 87.0 84.6Video cassettes, discs, and other media including renta l1 - - - - - - - 100.0 93.9 93.0
Video cassettes and discs, blank and prerecorded 1 2 - - - - - - - - 100.0 95.9 94.5Rental of video tapes and discs 1 2 ..................................... - - - - - - - - 100.0 92.9 92.7
Audio equipment ..................................................................... 94.3 93.3 95.0 93.6 94.0 93.1 90.7 90.2 88.4 81.9 84.4Audio discs, tapes and other media 1 .................................. - - - - - - - - 100.0 100.0 101.1
Pets, pet products and services 1 ........................................... - - - - - - - - 100.0 101.9 102.6Pets and pet products ............................................................. 122.9 127.4 129.6 128.3 129.5 130.8 135.4 142.6 142.1 142.9 143.8
Pet food 12 ............................................................................. - - - - - - - - 100.0 101.4 101.8Purchase of pets, pet supplies, accessories 1 2 ................ - - - - - - - - 100.0 99.7 100.0
Pet services including veterinary 1 ........................................ - - - - - - - - 100.0 104.4 105.1Pet services 1 2 ..................................................................... ■ - - - - - - - 100.0 103.8 105.1Veterinarian services 1 2 ...................................................... - - - - - - - - 100.0 104.6 105.1
Sporting goods ........................................................................... 113.3 115.3 119.6 119.7 120.0 123.8 123.1 123.0 122.5 121.8 121.2Sports vehicles including bicycles ......................................... 113.6 115.9 117.6 120.1 120.0 124.7 124.8 124.9 124.3 127.7 128.2Sports equipment .................................................................... 110.4 112.0 118.3 116.5 117.1 120.0 118.7 118.4 118.1 114.3 113.0
Photography 1 ............................................................................ - - - - - - - - 100.0 99.3 99.7Photographic equipment and supplies ................................. 127.2 129.0 130.1 132.9 135.2 130.9 133.4 132.9 134.0 129.7 131.7
Film and photographic supplies 1 2 ..................................... - - - - - - - - 100.0 99.2 99.7Photographic equipment1 2 ................................................. * • • - - - - - 100.0 94.8 96.8
Photographers and film processing 1 .................................... - - - - - - - - 100.0 101.0 100.8Photographer fees 1 2 ........................................................... - - - - - - - - 100.0 101.3 NAFilm processing 1 2 ................................................................ - - - - - - - - 100.0 100.1 99.2
Other recreational goods 1 ........................................................ - - - - - - - - 100.0 95.0 94.3Toys ................................................................................ .......... 115.1 116.8 118.1 121.1 122.9 121.8 123.0 126.4 124.4 116.8 115.9
Toys, games, hobbies and playground equipment1 2 . - - - - - - - - 100.0 95.0 93.9Video game hardware, software and accessories 1 2 - - - - - - - - 100.0 NA NA
Sewing machines, fabric and supplies 1 .............................. - - - - - - - - 100.0 98.1 96.9Music instruments and accessories 1 .................................... - - - - - - - - 100.0 99.6 99.9
Recreation services 1 ................................................................. - - - - - - - - 100.0 103.7 105.0Club membership dues and fees for participant sports 1 .... - - - - - - - - 100.0 105.0 105.9Admissions ............................................................................... 146.0 153.6 161.0 167.3 170.3 177.1 186.4 193.8 200.3 205.8 209.0
Admission to movies, theaters, and concerts 1 2 .............. - - - - - - - 100.0 101.9 103.1Admission to sporting events 1 2 ......................................... - - - - - - - - 100.0 105.0 107.2
Fees for lessons or instructions 5 ........................................... 119.6 125.4 132.4 139.2 144.7 151.8 156.3 165.5 174.1 178.9 181.7Recreational reading materials ................................................. 132.4 138.5 147.3 152.8 158.2 163.9 173.6 178.2 180.2 185.7 185.8
Newspapers and magazines 1 ............................................... - - - - - - - - 100.0 103.4 103.6Recreational books 1 ............................................................... 100.0 102.5 102.3
See footnotes at end of table.
79Digitized for FRASER http://fraser.stlouisfed.org/ Federal Reserve Bank of St. Louis
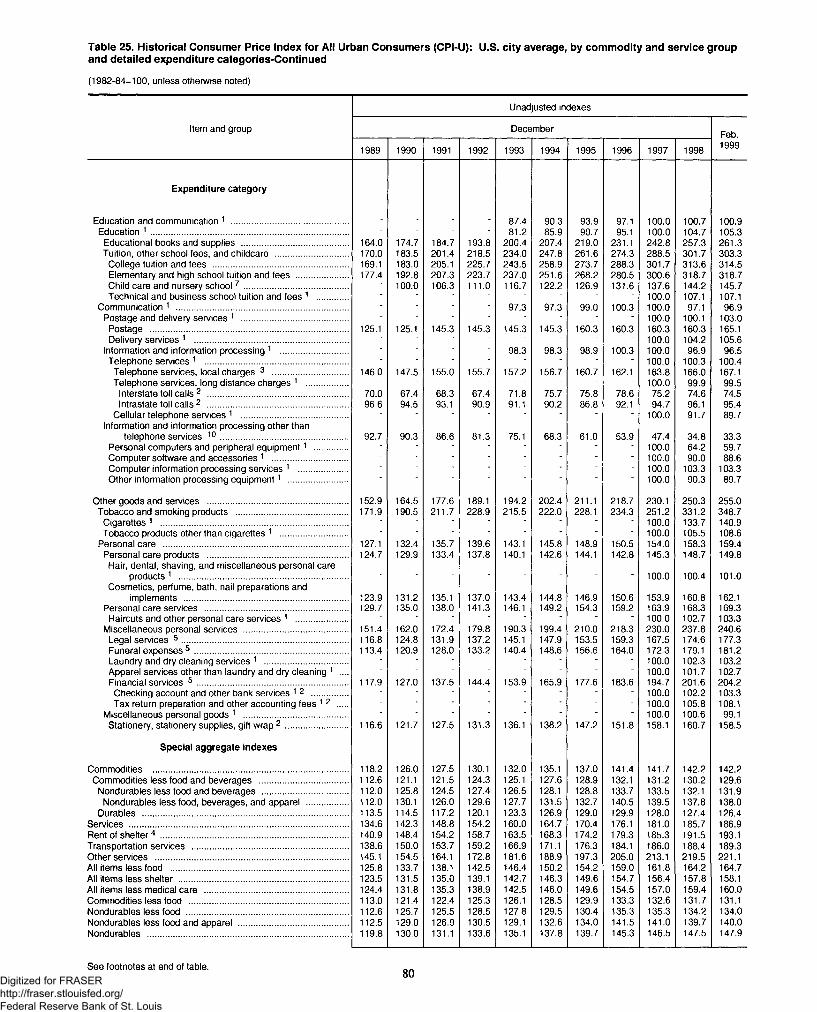
Table 25. Historical Consumer Price Index for All Urban Consumers (CPI-U): U.S. city average, by commodity and service groupand detailed expenditure categories-Continued
(1982-84=100, unless otherwise noted)
Unadjusted indexes
Item and group DecemberFeb.
1989 1990 1991 1992 1993 1994 1995 1996 1997 1998 1999
Expenditure category
Education and communication 1 ................................................. - - 87.4 90.3 93.9 97.1 100.0 100.7 100.9Education 1 .................................................................................. - - - - 81.2 85.9 90.7 95.1 100.0 104.7 105.3
Educational books and supplies ............................................ 164.0 174.7 184.7 193.8 200.4 207.4 219.0 231.1 242.8 257.3 261.3Tuition, other school fees, and childcare .............................. 170.0 183.5 201.4 218.5 234.0 247.8 261.6 274.3 288.5 301.7 303.3
College tuition and fees ........................................................ 169.1 183.0 205.1 225.7 243.5 258.9 273.7 288.3 301.7 313.6 314.5Elementary and high school tuition and fees ...................... 177.4 192.8 207.3 223.7 237.0 251.6 268.2 280.5 300.6 318.7 318.7Child care and nursery school 7 ........................................... - 100.0 106.3 111.0 116.7 122.2 126.9 131.6 137.6 144.2 145.7Technical and business school tuition and fees 1 ............. - - - - - - - - 100.0 107.1 107.1
Communication 1 ........................................................................ - - - - 97.3 97.3 99.0 100.3 100.0 97.1 96.9Postage and delivery services 1 ............................................ - - - - - - - - 100.0 100.1 103.0
Postage ................................................................................... 125.1 125.1 145.3 145.3 145.3 145.3 160.3 160.3 160.3 160.3 165.1Delivery services 1 ................................................................ - - - - - - - - 100.0 104.2 105.6
Information and information processing 1 ............................ - - - - 98.3 98.3 98.9 100.3 100.0 96.9 96.5Telephone services 1 ............................................................ - - - - - - - - 100.0 100.3 100.4
Telephone services, local charges 3 ............................... 146.0 147.5 155.0 155.7 157.2 156.7 160.7 162.1 163.8 166.0 167.1Telephone services, long distance charges 1 ................. - - - - - - - 100.0 99.9 99.5
Interstate toll calls 2 ........................................................... 70.0 67.4 68.3 67.4 71.8 75.7 75.8 78.6 75.2 74.6 74.5Intrastate toll calls 2 ........................................................... 96.6 94.5 93.1 90.9 91.1 90.2 86.8 92.1 94.7 96.1 95.4
Cellular telephone services 1 ............................................ - - - - - - - 100.0 91.7 89.7Information and information processing other than
telephone services 1 0 ..................................................... 92.7 90.3 86.6 81.3 75.1 68.3 61.0 53.9 47.4 34.8 33.3Personal computers and peripheral equipment1 .............. - - - - - - 100.0 64.2 59.7Computer software and accessories 1 ............................... ■ ■ ■ - • • ■ ■ 100.0 90.0 88.6Computer information processing services 1 .................... - - - - - - - 100.0 103.3 103.3Other information processing equipment1 ......................... 100.0 90.3 89.7
Other goods and services ........................................................... 152.9 164.5 177.6 189.1 194.2 202.4 211.1 218.7 230.1 250.3 255.0Tobacco and smoking products ............................................... 171.9 190.5 211.7 228.9 215.5 222.0 228.1 234.3 251.2 331.2 348.7
Cigarettes 1 .............................................................................. * - - - - - - - 100.0 133.7 140.9Tobacco products other than cigarettes 1 ............................ - • • ■ ■ • - 100.0 105.5 108.6
Personal care ............................................................................. 127.1 132.4 135.7 139.6 143.1 145.8 148.9 150.5 154.0 158.3 159.4Personal care products ........................................................... 124.7 129.9 133.4 137.8 140.1 142.6 144.1 142.8 145.3 148.7 149.8
Hair, dental, shaving, and miscellaneous personal careproducts 1 ...................................................................... - - - - - - - - 100.0 100.4 101.0
Cosmetics, perfume, bath, nail preparations andimplements .................................................................... 123.9 131.2 135.1 137.0 143.4 144.8 146.9 150.6 153.9 160.8 162.1
Personal care services ............................................................ 129.7 135.0 138.0 141.3 146.1 149.2 154.3 159.2 163.9 168.3 169.3Haircuts and other personal care services 1 ...................... - - - - - - - - 100.0 102.7 103.3
Miscellaneous personal services ........................................... 151.4 162.0 172.4 179.8 190.3 199.4 210.0 218.3 230.0 237.8 240.6Legal services 5 ..................................................................... 116.8 124.8 131.9 137.2 145.1 147.9 153.5 159.3 167.5 174.6 177.3Funeral expenses 5 ................................................................ 113.4 120.9 128.0 133.2 140.4 148.6 156.6 164.0 172.3 179.1 181.2Laundry and dry cleaning services 1 ................................... - - - - - - - - 100.0 102.3 103.2Apparel services other than laundry and dry cleaning 1 .... ■ ■ ■ * ■ ■ ■ 100.0 101.7 102.7Financial services 5 ............................................................... 117.9 127.0 137.5 144.4 153.9 165.9 177.6 183.6 194.7 201.6 204.2
Checking account and other bank services 1 2 ............... - - - - - - - - 100.0 102.2 103.3Tax return preparation and other accounting fees 12 .... - - - - - - - - 100.0 105.8 108.1
Miscellaneous personal goods 1 ........................................... - - - - - - - - 100.0 100.6 99.1Stationery, stationery supplies, gift wrap 2 .......................... 116.6 121.7 127.5 131.3 136.1 138.2 147.2 151.8 158.1 160.7 158.5
Special aggregate indexes
Commodities .................................................................................. 118.2 126.0 127.5 130.1 132.0 135.1 137.0 141.4 141.7 142.2 142.2Commodities less food and beverages ..................................... 112.6 121.1 121.5 124.3 125.1 127.6 128.9 132.1 131.2 130.2 129.6
Nondurables less food and beverages .................................... 112.0 125.8 124.5 127.4 126.5 128.1 128.8 133.7 133.5 132.1 131.9Nondurables less food, beverages, and apparel ................. 112.0 130.1 126.0 129.6 127.7 131.5 132.7 140.5 139.5 137.8 138.0
Durables ...................................................................................... 113.5 114.5 117.2 120.1 123.3 126.9 129.0 129.9 128.0 127.4 126.4Services ........................................................................................... 134.6 142.3 148.8 154.2 160.0 164.7 170.4 176.1 181.0 185.7 186.9Rent of shelter4 .............................................................................. 140.9 148.4 154.2 158.7 163.5 168.3 174.2 179.3 185.3 191.5 193.1Transportation services ................................................................. 138.6 150.0 153.7 159.2 166.9 171.1 176.3 184.1 186.0 188.4 189.3Other services ................................................................................ 145.1 154.5 164.1 172.8 181.6 188.9 197.3 205.0 213.1 219.5 221.1All items less food .......................................................................... 125.8 133.7 138.1 142.5 146.4 150.2 154.2 159.0 161.8 164.2 164.7All items less shelter ....................................................................... 123.5 131.5 135.0 139.1 142.7 146.3 149.6 154.7 156.4 157.8 158.1All items less medical care ............................................................ 124.4 131.8 135.3 138.9 142.5 146.0 149.6 154.5 157.0 159.4 160.0Commodities less food .................................................................. 113.0 121.4 122.4 125.3 126.1 128.5 129.9 133.3 132.6 131.7 131.1Nondurables less food .................................................................... 112.6 125.7 125.5 128.5 127.8 129.5 130.4 135.3 135.3 134.2 134.0Nondurables less food and apparel .............................................. 112.5 129.0 126.9 130.5 129.1 132.6 134.0 141.5 141.0 139.7 140.0Nondurables .................................................................................... 119.8 130.0 131.1 133.6 135.1 137.8 139.7 145.3 146.5 147.5 147.9
See footnotes at end of table. 80Digitized for FRASER http://fraser.stlouisfed.org/ Federal Reserve Bank of St. Louis
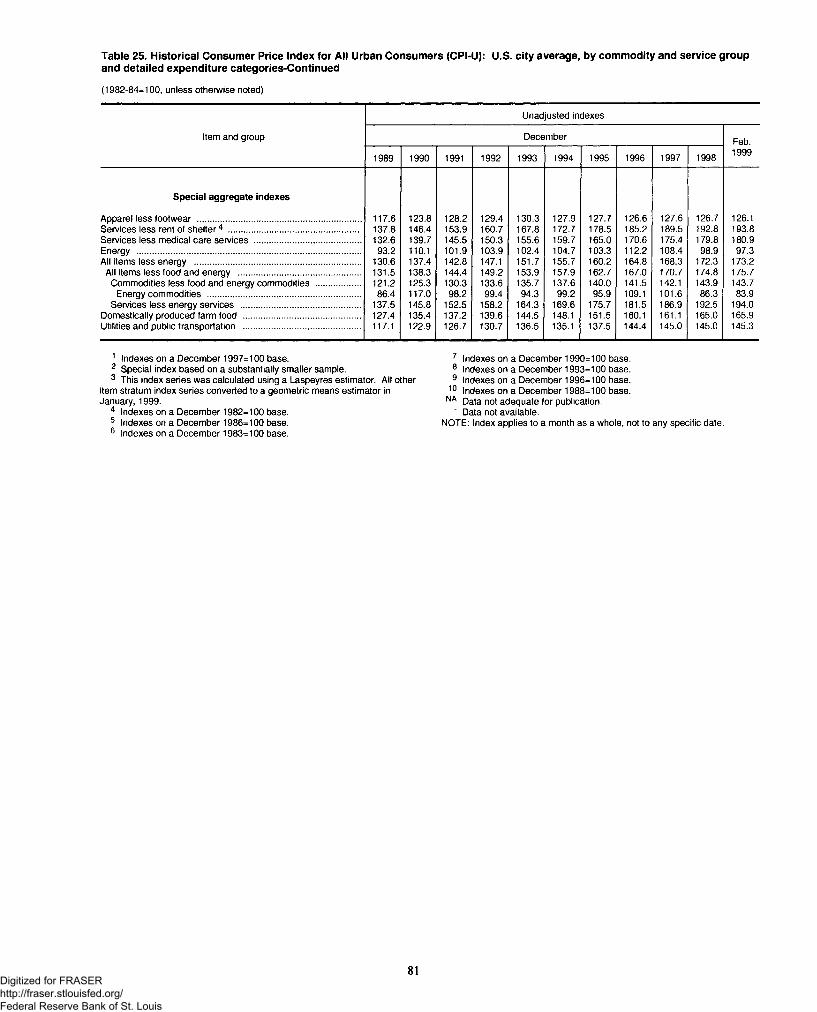
Table 25. Historical Consumer Price Index for All Urban Consumers (CPI-U): U.S. city average, by commodity and service groupand detailed expenditure categories-Continued
(1982-84=100, unless otherwise noted)
Unadjusted indexes
Item and group December Feb.
1989 1990 1991 1992 1993 1994 1995 1996 1997 1998 1999
Special aggregate indexes
Apparel less footwear .................................................................... 117.6 123.8 128.2 129.4 130.3 127.9 127.7 126.6 127.6 126.7 126.1Services less rent of shelter4 ....................................................... 137.8 146.4 153.9 160.7 167.8 172.7 178.5 185.2 189.5 192.8 193.8Services less medical care services ............................................ 132.6 139.7 145.5 150.3 155.6 159.7 165.0 170.6 175.4 179.8 180.9Energy ............................................................................................. 93.2 110.1 101.9 103.9 102.4 104.7 103.3 112.2 108.4 98.9 97.3All items less energy ..................................................................... 130.6 137.4 142.8 147.1 151.7 155.7 160.2 164.8 168.3 172.3 173.2
All items less food and energy ................................................... 131.5 138.3 144.4 149.2 153.9 157.9 162.7 167.0 170.7 174.8 175.7Commodities less food and energy commodities .................. 121.2 125.3 130.3 133.6 135.7 137.6 140.0 141.5 142.1 143.9 143.7
Energy commodities ................................................................ 86.4 117.0 98.2 99.4 94.3 99.2 95.9 109.1 101.6 86.3 83.9Services less energy services .................................................. 137.5 145.8 152.5 158.2 164.3 169.6 175.7 181.5 186.9 192.5 194.0
Domestically produced farm food ................................................. 127.4 135.4 137.2 139.6 144.5 148.1 151.5 160.1 161.1 165.0 165.9Utilities and public transportation ................................................. 117.1 122.9 126.7 130.7 136.5 135.1 137.5 144.4 145.0 145.0 145.3
1 Indexes on a December 1997=100 base.2 Special index based on a substantially smaller sample.3 This index series was calculated using a Laspeyres estimator. All other
item stratum index series converted to a geometric means estimator in January, 1999.
4 Indexes on a December 1982=100 base.5 Indexes on a December 1986=100 base.6 Indexes on a December 1983=100 base.
7 Indexes on a December 1990=100 base.8 Indexes on a December 1993=100 base.9 Indexes on a December 1996=100 base.
10 Indexes on a December 1988=100 base.NA Data not adequate for publication.
' Data not available.NOTE: Index applies to a month as a whole, not to any specific date.
81Digitized for FRASER http://fraser.stlouisfed.org/ Federal Reserve Bank of St. Louis
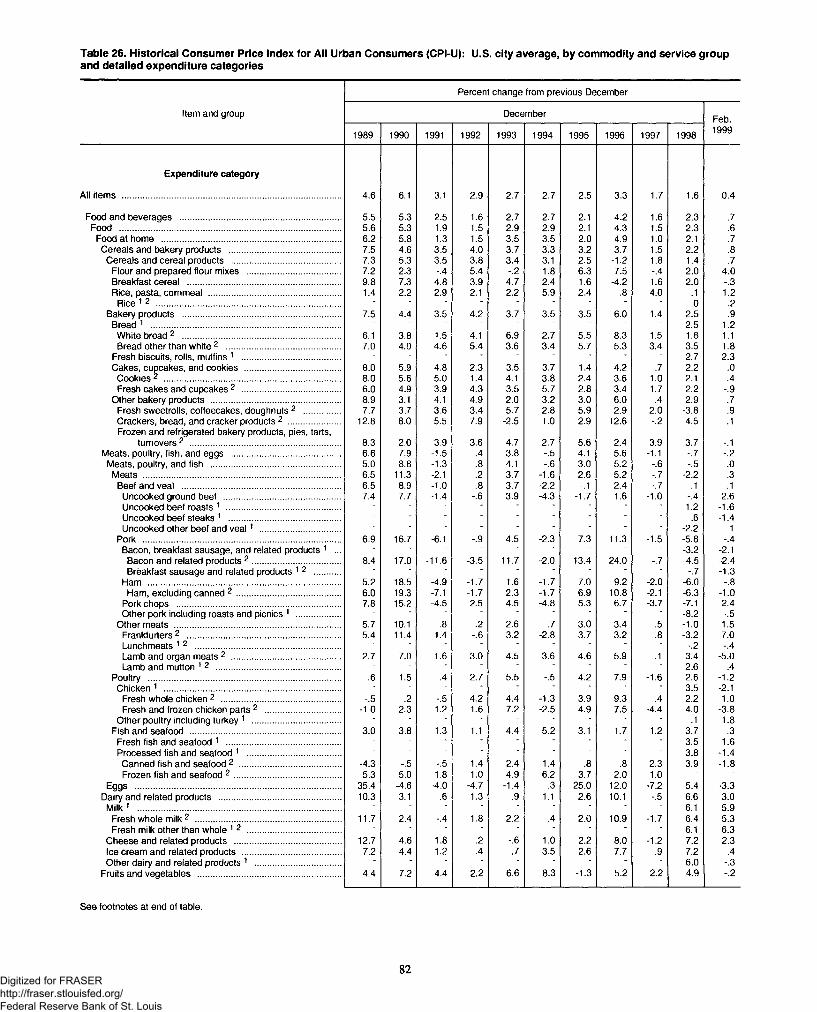
Table 26. Historical Consumer Price Index for All Urban Consumers (CPI-U): U.S. city average, by commodity and service groupand detailed expenditure categories
Percent change from previous December
Item and group December Feb.
1989 1990 1991 1992 1993 1994 1995 1996 1997 1998 1999
Expenditure category
All items ........................................................................................... 4.6 6.1 3.1 2.9 2.7 2.7 2.5 3.3 1.7 1.6 0.4
Food and beverages ................................................................... 5.5 5.3 2.5 1.6 2.7 2.7 2.1 4.2 1.6 2.3 .7Food ............................................................................................ 5.6 5.3 1.9 1.5 2.9 2.9 2.1 4.3 1.5 2.3 .6
Food at home ........................................................................... 6.2 5.8 1.3 1.5 3.5 3.5 2.0 4.9 1.0 2.1 .7Cereals and bakery products .............................................. 7.5 4.6 3.5 4.0 3.7 3.3 3.2 3.7 1.5 2.2 .8
Cereals and cereal products ............................................. 7.3 5.3 3.5 3.8 3.4 3.1 2.5 -1.2 1.8 1.4 .7Flour and prepared flour mixes ....................................... 7.2 2.3 -.4 5.4 -.2 1.8 6.3 7.5 -.4 2.0 4.0Breakfast cereal ................................................................ 9.8 7.3 4.8 3.9 4.7 2.4 1.6 -4.2 1.6 2.0 -.3Rice, pasta, cornmeal ....................................................... 1.4 2.2 2.9 2.1 2.2 5.9 2.4 .8 4.0 .1 1.2
Rice 1 2 ............................................................................. - - - - - - - - - .0 .2Bakery products .................................................................. 7.5 4.4 3.5 4.2 3.7 3.5 3.5 6.0 1.4 2.5 .9
Bread 1 ............................................................................... - - - - - - - - - 2.5 1.2White bread 2 .................................................................. 6.1 3.8 1.5 4.1 6.9 2.7 5.5 8.3 1.5 1.8 1.1Bread other than white 2 ................................................ 7.0 4.0 4.6 5.4 3.6 3.4 5.7 5.3 3.4 3.5 1.8
Fresh biscuits, rolls, muffins 1 ......................................... - - - - - - - - - 2.7 2.3Cakes, cupcakes, and cookies ........................................ 8.0 5.9 4.8 2.3 3.5 3.7 1.4 4.2 .7 2.2 .0
Cookies2 .......................................................................... 8.0 5.6 5.0 1.4 4.1 3.8 2.4 3.6 1.0 2.1 .4Fresh cakes and cupcakes 2 ......................................... 6.0 4.9 3.9 4.3 3.5 5.7 2.8 3.4 1.7 2.2 -.9
Other bakery products ...................................................... 8.9 3.1 4.1 4.9 2.0 3.2 3.0 6.0 .4 2.9 .7Fresh sweetrolls, coffeecakes, doughnuts 2 ............... 7.7 3.7 3.6 3.4 5.7 2.8 5.9 2.9 2.0 -3.8 .9Crackers, bread, and cracker products 2 ...................... 12.8 8.0 5.5 7.9 -2.5 1.0 2.9 12.6 -.2 4.5 .1Frozen and refrigerated bakery products, pies, tarts,
turnovers 2 ............................................................... 8.3 2.0 3.9 3.6 4.7 2.7 5.6 2.4 3.9 3.7 -.1Meats, poultry, fish, and eggs ............................................. 6.6 7.9 -1.5 .4 3.8 -.5 4.1 5.6 -1.1 -.7 -.2
Meats, poultry, and fish ...................................................... 5.0 8.8 -1.3 .8 4.1 -.6 3.0 5.2 -.6 -.5 .0Meats .................................................................................. 6.5 11.3 -2.1 .2 3.7 -1.6 2.6 5.2 -.7 -2.2 .3
Beef and veal .................................................................. 6.5 8.9 -1.0 .8 3.7 -2.2 -.1 2.4 -.7 .1 .1Uncooked ground beef ................................................. 7.4 7.7 -1.4 -.6 3.9 -4.3 -1.7 1.6 -1.0 -.4 2.6Uncooked beef roasts 1 ................................................ - - - - - - - - 1.2 -1.6Uncooked beef steaks 1 ............................................... - - - - - - - - - .6 -1.4Uncooked other beef and v e a l1 ................................. - - - - - - - - - -2.2 .1
Pork .................................................................................. 6.9 16.7 -6.1 -.9 4.5 -2.3 7.3 11.3 -1.5 -5.8 -.4Bacon, breakfast sausage, and related products 1 ... - - - - - - - - - -3.2 -2.1
Bacon and related products 2 ..................................... 8.4 17.0 -11.6 -3.5 11.7 -2.0 13.4 24.0 -.7 -4.5 -2.4Breakfast sausage and related products 12 ........... ■ • ■ ■ ■ ■ ■ ■ ■ -.7 -1.3
Ham ................................................................................ 5.2 18.5 -4.9 -1.7 1.6 -1.7 7.0 9.2 -2.0 -6.0 -.8Ham, excluding canned 2 ........................................... 6.0 19.3 -7.1 -1.7 2.3 -1.7 6.9 10.8 -2.1 -6.3 -1.0
Pork chops .................................................................... 7.8 15.2 -4.5 2.5 4.5 -4.8 5.3 6.7 -3.7 -7.1 2.4Other pork including roasts and picnics 1 .................. - - • • ■ * ■ ■ ■ -8.2 -.5
Other meats ..................................................................... 5.7 10.1 .8 .2 2.6 .7 3.0 3.4 .5 -1.0 1.5Frankfurters 2 ................................................................ 5.4 11.4 1.4 -.6 3.2 -2.8 3.7 3.2 .8 -3.2 7.0Lunch meats 12 ............................................................. - - - - - - - - - -.2 -.4Lamb and organ meats 2 ............................................. 2.7 7.0 1.6 3.0 4.5 3.6 4.6 5.9 .1 3.4 -5.0Lamb and mutton 1 2 .................................................... ■ • ■ ■ ■ ■ ■ ■ ■ 2.6 .4
Poultry ................................................................................ .6 1.5 .4 2.7 5.5 -.5 4.2 7.9 -1.6 2.6 -1.2Chicken 1 .......................................................................... - - - - - - - - - 3.5 -2.1
Fresh whole chicken 2 .................................................. -.5 .2 -.5 4.2 4.4 -1.3 3.9 9.3 .4 2.2 1.0Fresh and frozen chicken parts 2 ............................... -1.0 2.3 1.2 1.6 7.2 -2.5 4.9 7.5 -4.4 4.0 -3.8
Other poultry including turkey 1 ..................................... ■ ■ ■ ■ ■ ■ ■ ■ ~ .1 1.8Fish and seafood ............................................................... 3.0 3.8 1.3 1.1 4.4 5.2 3.1 1.7 1.2 3.7 .3
Fresh fish and seafood 1 ................................................ - - - - - - - - - 3.5 1.6Processed fish and seafood 1 ....................................... - - - - - - - - - 3.8 -1.4Canned fish and seafood 2 .......................................... -4.3 -.5 -.5 1.4 2.4 1.4 .8 .8 2.3 3.9 -1.8Frozen fish and seafood 2 ............................................ 5.3 5.0 1.8 1.0 4.9 6.2 3.7 2.0 1.0 - -
Eggs ...................................................................................... 35.4 -4.6 -4.0 -4.7 -1.4 .3 25.0 12.0 -7.2 -5.4 -3.3Dairy and related products ................................................... 10.3 3.1 .6 1.3 .9 1.1 2.6 10.1 -.5 6.6 3.0
M ilk 1 ..................................................................................... - - - - - - - - - 6.1 5.9Fresh whole milk 2 ............................................................. 11.7 2.4 -.4 1.8 2.2 .4 2.0 10.9 -1.7 6.4 5.3Fresh milk other than whole 1 2 ....................................... - - - - - - - - 6.1 6.3
Cheese and related products ............................................ 12.7 4.6 1.8 .2 -.6 1.0 2.2 8.0 -1.2 7.2 2.3Ice cream and related products ......................................... 7.2 4.4 1.2 .4 .7 3.5 2.6 7.7 .9 7.2 .4Other dairy and related products 1 .................................... ■ ■ ■ ■ ■ ■ ■ ■ ■ 6.0 -.3
Fruits and vegetables ............................................................ 4.4 7.2 4.4 2.2 6.6 8.3 -1.3 5.2 2.2 4.9 -.2
See footnotes at end of table.
82Digitized for FRASER http://fraser.stlouisfed.org/ Federal Reserve Bank of St. Louis
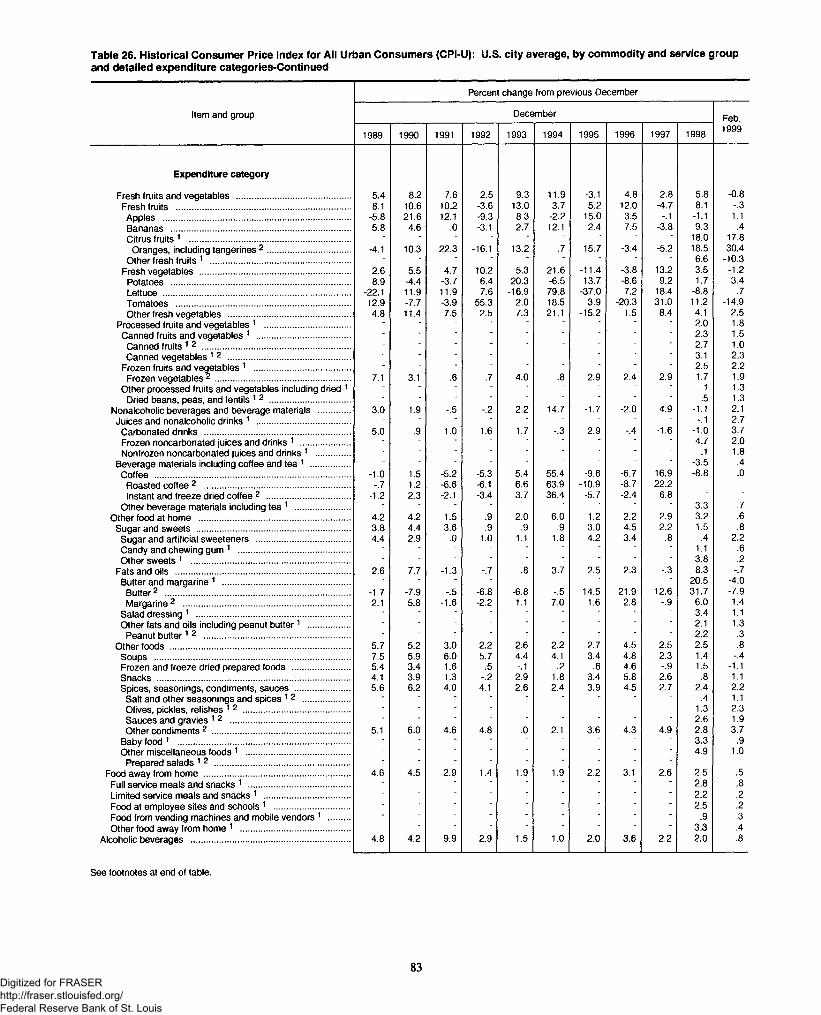
Table 26. Historical Consumer Price Index for All Urban Consumers (CPI-U): U.S. city average, by commodity and service groupand detailed expenditure categories-Continued
Percent change from previous December
Item and group December Feb.
1989 1990 1991 1992 1993 1994 1995 1996 1997 1998 1999
Expenditure category
Fresh fruits and vegetables ................................................ 5.4 8.2 7.6 2.5 9.3 11.9 -3.1 4.8 2.8 5.8 -0.8Fresh fruits ......................................................................... 8.1 10.6 10.2 -3.6 13.0 3.7 5.2 12.0 -4.7 8.1 -.3Apples .............................................................................. -5.8 21.6 12.1 -9.3 8.3 -2.2 15.0 3.5 -.1 -1.1 1.1Bananas ........................................................................... 5.8 4.6 .0 -3.1 2.7 12.1 2.4 7.5 -3.8 9.3 .4Citrus fruits 1 ................................................................... - - - - - - ■ • ■ 18.0 17.8
Oranges, including tangerines 2 ................................... -4.1 10.3 22.3 -16.1 13.2 .7 15.7 -3.4 -5.2 18.5 30.4Other fresh fruits 1 .......................................................... • • ■ ■ ■ ■ ' " 6.6 -10.3
Fresh vegetables ............................................................... 2.6 5.5 4.7 10.2 5.3 21.6 -11.4 -3.8 13.2 3.5 -1.2Potatoes ........................................................................... 8.9 -4.4 -3.7 6.4 20.3 -6.5 13.7 -8.6 9.2 1.7 3.4Lettuce .............................................................................. -22.1 11.9 11.9 7.6 -16.9 79.8 -37.0 7.2 18.4 -8.8 .7Tomatoes ......................................................................... 12.9 -7.7 -3.9 55.3 2.0 18.5 3.9 -20.3 31.0 11.2 -14.9Other fresh vegetables ................................................... 4.8 11.4 7.5 2.5 7.3 21.1 -15.2 1.5 8.4 4.1 2.5
Processed fruits and vegetables 1 .................................... * ■ ■ ■ ‘ " ' 2.0 1.8Canned fruits and vegetables 1 ....................................... ■ ■ ■ ' ' ‘ 2.3 1.5
Canned fruits 1 2 .............................................................. ~ ■ * ■ ■ " " ' 2.7 1.0Canned vegetables 1 2 ................................................... * ■ ■ ■ ■ ■ ■ 3.1 2.3
Frozen fruits and vegetables 1 ........................................Frozen vegetables 2 ........................................................
- ■ ■ ■ - ' " - ‘ 2.5 2.27.1 3.1 .6 .7 4.0 .8 2.9 2.4 2.9 1.7 1.9
Other processed fruits and vegetables including dried 1 ~ ■ ■ ■ ■ " ' ' ' .1 1.3Dried beans, peas, and lentils 1 2 .................................. ■ * “ .5 1.3
Nonalcoholic beverages and beverage materials ............. 3.0 1.9 -.5 -.2 2.2 14.7 -1.7 -2.0 4.9 -1.1 2.1Juices and nonalcoholic drinks 1 ....................................... * ■ ■ ■ ■ " ' -.1 2.7
Carbonated drinks ............................................................. 5.0 .9 1.0 1.6 1.7 -.3 2.9 -.4 -1.6 -1.0 3.7Frozen noncarbonated juices and drinks 1 ..................... - ■ ■ ■ ■ ~ ■ ■ 4.7 2.0Nonfrozen noncarbonated juices and drinks 1 .............. - ■ ■ ■ ■ " ■ ■ * .1 1.8
Beverage materials including coffee and tea 1 ................ - * • ■ ■ ■ ~ ■ ■ -3.5 .4Coffee ................................................................................. -1.0 1.5 -5.2 -5.3 5.4 55.4 -9.6 -6.7 16.9 -8.8 .0
Roasted coffee 2 ............................................................. -.7 1.2 -6.6 -6.1 6.6 63.9 -10.9 -8.7 22.2 ■ ■Instant and freeze dried coffee 2 ................................... -1.2 2.3 -2.1 -3.4 3.7 36.4 -5.7 -2.4 6.8 ■
Other beverage materials including tea 1 ....................... - * • ■ ■ ' ■ ■ 3.3 .7Other food at home ............................................................... 4.2 4.2 1.5 .9 2.0 6.0 1.2 2.2 2.9 3.2 .6
Sugar and sweets ................................................................ 3.8 4.4 3.6 .9 .9 .9 3.0 4.5 2.2 1.5 .8Sugar and artificial sweeteners ....................................... 4.4 2.9 .0 1.0 1.1 1.8 4.2 3.4 .8 .4 2.2Candy and chewing gum 1 ............................................... - • - ■ ■ ' ' ' ' 1.1 .6Other sweets 1 .................................................................. • ■ ■ ■ ‘ " ' 3.8 .2
Fats and oils ......................................................................... 2.6 7.7 -1.3 -.7 .8 3.7 2.5 2.3 -.3 8.3 -.7Butter and margarine 1 ..................................................... - - - ■ ■ ■ ' ■ ■ 20.5 -4.0
Butter2 ............................................................................. -1.7 -7.9 -.5 -6.8 -6.8 -.5 14.5 21.9 12.6 31.7 -7.9Margarine2 ...................................................................... 2.1 5.8 -1.6 -2.2 1.1 7.0 1.6 2.8 -.9 6.0 1.4
Salad dressing 1 ................................................................ * ■ ■ ■ ' ' ' ' 3.4 1.1Other fats and oils including peanut bu tter1 ................. ■ ' " " ' 2.1 1.3
Peanut bu tte r1 2 ............................................................. • ■ ■ ■ ■ ■ ■ ■ ' 2.2 .3Other foods ........................................................................... 5.7 5.2 3.0 2.2 2.6 2.2 2.7 4.5 2.5 2.5 .8
Soups .................................................................................. 7.5 5.9 6.0 5.7 4.4 4.1 3.4 4.8 2.3 1.4 -.4Frozen and freeze dried prepared foods ........................ 5.4 3.4 1.6 .5 -.1 .2 .6 4.6 -.9 1.5 -1.1Snacks ................................................................................ 4.1 3.9 1.3 -.2 2.9 1.8 3.4 5.8 2.6 .8 1.1Spices, seasonings, condiments, sauces ....................... 5.6 6.2 4.0 4.1 2.6 2.4 3.9 4.5 2.7 2.4 2.2
Salt and other seasonings and spices 1 2 .................... ■ ■ ■ ■ ■ - ~ ■ ' .4 1.1Olives, pickles, relishes 1 2 ............................................ ■ ■ ~ ■ ' ' ' " 1.3 2.3Sauces and gravies 1 2 .................................................. * ■ ■ ■ ■ ■ ■ ■ ■ 2.6 1.9Other condiments 2 ......................................................... 5.1 6.0 4.6 4.8 .0 2.1 3.6 4.3 4.9 2.8 3.7
Baby food 1 ........................................................................ - ~ ■ • ■ ■ ■ ■ ■ 3.3 .9Other miscellaneous foods 1 ........................................... - • ■ ■ ■ ■ ■ ■ 4.9 1.0
Prepared salads 12 ........................................................ - ■ ■ ■ ■ ■ ■ ■ ■ ■ ■Food away from home ............................................................. 4.6 4.5 2.9 1.4 1.9 1.9 2.2 3.1 2.6 2.5 .5
Full service meals and snacks 1 .......................................... - - ~ • ■ ■ ■ ■ ■ 2.8 .8Limited service meals and snacks1 .................................... • • ~ ■ ■ ■ ■ ■ - 2.2 .2Food at employee sites and schools1 ................................ - ■ ■ * ■ ■ ■ ■ ■ 2.5 .2Food from vending machines and mobile vendors 1 ......... ■ ■ ■ ■ - ■ ■ ■ ■ .9 .3Other food away from home 1 .............................................. - ■ ~ ■ ■ ■ ■ ■ ■ 3.3 .4
Alcoholic beverages .................................................................. 4.8 4.2 9.9 2.9 1.5 1.0 2.0 3.6 2.2 2.0 .8
See footnotes at end of table.
83Digitized for FRASER http://fraser.stlouisfed.org/ Federal Reserve Bank of St. Louis
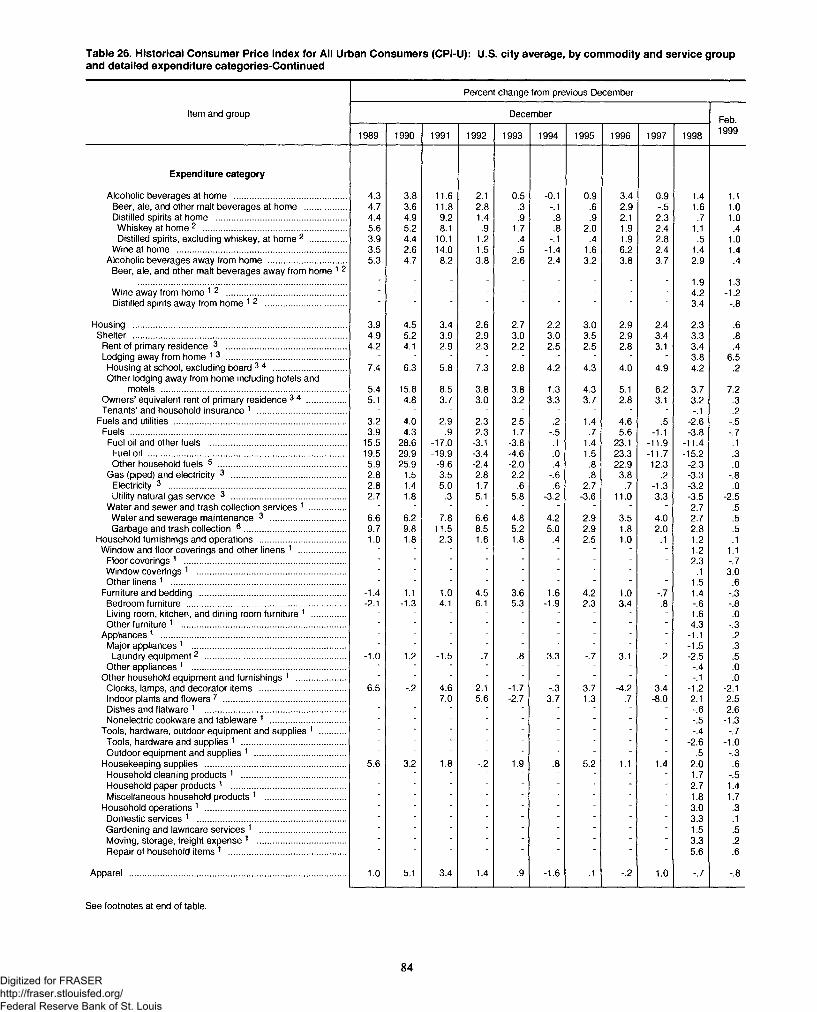
Table 26. Historical Consumer Price Index for All Urban Consumers (CPI-U): U.S. city average, by commodity and service groupand detailed expenditure categories-Continued
Percent change from previous December
Item and group DecemberFeb.
1989 1990 1991 1992 1993 1994 1995 1996 1997 1998 1999
Expenditure category
Alcoholic beverages at home ............................................... 4.3 3.8 11.6 2.1 0.5 -0.1 0.9 3.4 0.9 1.4 1.1Beer, ale, and other malt beverages at home ................. 4.7 3.6 11.8 2.8 .3 -.1 .6 2.9 -.5 1.6 1.0Distilled spirits at home ...................................................... 4.4 4.9 9.2 1.4 .9 .8 .9 2.1 2.3 .7 1.0Whiskey at home 2 ............................................................ 5.6 5.2 8.1 .9 1.7 .8 2.0 1.9 2.4 1.1 .4Distilled spirits, excluding whiskey, at home 2 ............... 3.9 4.4 10.1 1.2 .4 -.1 .4 1.9 2.8 .5 1.0
Wine at home ...................................................................... 3.5 2.6 14.0 1.5 .5 -1.4 1.6 6.2 2.4 1.4 1.4Alcoholic beverages away from home ................................ 5.3 4.7 8.2 3.8 2.6 2.4 3.2 3.8 3.7 2.9 .4
Beer, ale, and other malt beverages away from home 1 2- - - - - - - - - 1.9 1.3
Wine away from home 1 2 .................................................. - - - - - - - - 4.2 -1.2Distilled spirits away from home 1 2 .................................. ' ■ ‘ ■ ■ ■ ■ ■ ~ 3.4 -.8
Housing ......................................................................................... 3.9 4.5 3.4 2.6 2.7 2.2 3.0 2.9 2.4 2.3 .6Shelter ......................................................................................... 4.9 5.2 3.9 2.9 3.0 3.0 3.5 2.9 3.4 3.3 .8
Rent of primary residence 3 .................................................. 4.2 4.1 2.9 2.3 2.2 2.5 2.5 2.8 3.1 3.4 .4Lodging away from home 1 3 .................................................. - - - - - - - - 3.8 6.5Housing at school, excluding board 3 4 .............................. 7.4 6.3 5.8 7.3 2.8 4.2 4.3 4.0 4.9 4.2 .2Other lodging away from home including hotels and
motels ............................................................................. 5.4 15.8 8.5 3.8 3.8 1.3 4.3 5.1 6.2 3.7 7.2Owners’ equivalent rent of primary residence 3 4 ................ 5.1 4.8 3.7 3.0 3.2 3.3 3.7 2.8 3.1 3.2 .3Tenants’ and household insurance 1 ..................................... - * - - - - - - - -.1 .2
Fuels and utilities ........................................................................ 3.2 4.0 2.9 2.3 2.5 .2 1.4 4.6 .5 -2.6 -.5Fuels .......................................................................................... 3.9 4.3 .9 2.3 1.7 -.5 .7 5.6 -1.1 -3.8 -.7
Fuel oil and other fuels .......................................................... 15.5 28.6 -17.0 -3.1 -3.8 .1 1.4 23.1 -11.9 -11.4 .1Fuel oil .................................................................................. 19.5 29.9 -19.9 -3.4 -4.6 .0 1.5 23.3 -11.7 -15.2 .3Other household fuels 5 ..................................................... 5.9 25.9 -9.6 -2.4 -2.0 .4 .8 22.9 -12.3 -2.3 .0
Gas (piped) and electricity 3 ................................................ 2.8 1.5 3.5 2.8 2.2 -.6 .8 3.8 .2 -3.3 -.8Electricity 3 .......................................................................... 2.8 1.4 5.0 1.7 .6 .6 2.7 .7 -1.3 -3.2 .0Utility natural gas service 3 ................................................ 2.7 1.8 .3 5.1 5.8 -3.2 -3.6 11.0 3.3 -3.5 -2.5
Water and sewer and trash collection services 1 ............... - - - - - - - - - 2.7 .5Water and sewerage maintenance 3 ............................... 6.6 6.2 7.8 6.6 4.8 4.2 2.9 3.5 4.0 2.7 .5Garbage and trash collection 6 .......................................... 9.7 9.8 11.5 8.5 5.2 5.0 2.9 1.8 2.0 2.8 .5
Household furnishings and operations .................................... 1.0 1.8 2.3 1.6 1.8 .4 2.5 1.0 .1 1.2 .1Window and floor coverings and other linens 1 ................... - - - - - - - - - 1.2 1.1
Floor coverings 1 ................................................................... - - - - - - - - - 2.3 -.7Window coverings 1 .............................................................. ■ - - - - - - - - .1 3.0Other linens 1 ......................................................................... - - - - - - - - - 1.5 .6
Furniture and bedding ............................................................. -1.4 1.1 1.0 4.5 3.6 1.6 4.2 1.0 -.7 1.4 -.3Bedroom furniture .................................................................. -2.1 -1.3 4.1 6.1 5.3 -1.9 2.3 3.4 .8 -.6 -.8Living room, kitchen, and dining room furniture 1 .............. - - - - - - - - - 1.6 .0Other furniture 1 .................................................................... - - - - - - - - - 4.3 -.3
Appliances 1 ............................................................................. - - - - - - - - - -1.1 .2Major appliances 1 ................................................................ ■ ■ ■ ■ ■ ■ ■ • ■ -1.5 .3
Laundry equipment2 .......................................................... -1.0 1.2 -1.5 .7 .8 3.3 -.7 3.1 .2 -2.5 .5Other appliances 1 ................................................................ ■ ■ ■ ■ ■ ■ ■ ■ ■ -.4 .0
Other household equipment and furnishings 1 .................... ■ ■ ■ ■ • ■ ■ ■ • -.1 .0Clocks, lamps, and decorator items .................................... 6.5 -.2 4.6 2.1 -1.7 -.3 3.7 -4.2 3.4 -1.2 -2.1Indoor plants and flowers 7 ................................................... - - 7.0 5.6 -2.7 3.7 1.3 .7 -8.0 2.1 2.5Dishes and flatware 1 ............................................................ - - - - - - - - - -.6 2.6Nonelectric cookware and tableware 1 ............................... - - - - - - - - - -.5 -1.3
Tools, hardware, outdoor equipment and supplies 1 ........... - - - - - - - - - -.4 -.7Tools, hardware and supplies 1 ........................................... ■ • ■ - - - - - - -2.6 -1.0Outdoor equipment and supplies 1 ...................................... - - - - - - - - - .5 -.3
Housekeeping supplies ........................................................... 5.6 3.2 1.8 -.2 1.9 .8 5.2 1.1 1.4 2.0 .6Household cleaning products 1 ........................................... • • ■ - - - - - - 1.7 -.5Household paper products 1 ................................................ • ■ ■ - - - - - - 2.7 1.4Miscellaneous household products 1 ................................. - ■ * - • - - - - 1.8 1.7
Household operations 1 ........................................................... ■ ■ ■ ■ ■ • - - - 3.0 .3Domestic services 1 .............................................................. ■ ■ ■ ■ ■ - - ■ - 3.3 .1Gardening and lawncare services 1 .................................... - - - - - - - - - 1.5 .5Moving, storage, freight expense 1 ..................................... ■ ■ ■ ■ * • ■ ~ - 3.3 .2Repair of household items 1 ................................................. 5.6 .6
Apparel .......................................................................................... 1.0 5.1 3.4 1.4 .9 -1.6 .1 -.2 1.0 -.7 -.8
See footnotes at end of table.
84Digitized for FRASER http://fraser.stlouisfed.org/ Federal Reserve Bank of St. Louis
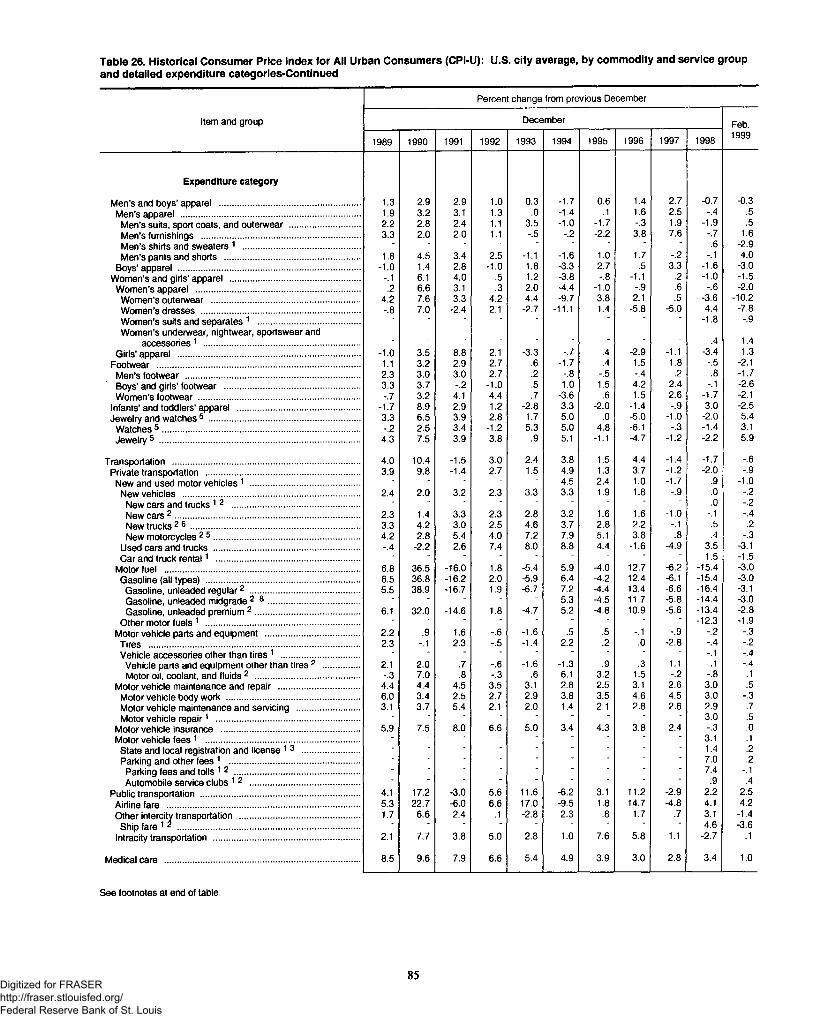
Table 26. Historical Consumer Price Index for All Urban Consumers (CPI-U): U.S. city average, by commodity and service groupand detailed expenditure categories-Continued
Percent change from previous December
Item and group December Feb.
1989 1990 1991 1992 1993 1994 1995 1996 1997 1998 1999
Expenditure category
Men’s and boys’ apparel ........................................................... 1.3 2.9 2.9 1.0 0.3 -1.7 0.6 1.4 2.7 -0.7 -0.3Men’s apparel ........................................................................... 1.9 3.2 3.1 1.3 .0 -1.4 .1 1.6 2.5 -.4 .5
Men’s suits sport coats, and outerwear ............................. 2.2 2.8 2.4 1.1 3.5 -1.0 -1.7 -.3 1.9 -1.9 .5Men’s furnishings .................................................................. 3.3 2.0 2.0 1.1 -.5 -.2 -2.2 3.8 7.6 -.7 1.6Men’s shirts and sweaters 1 ................................................. - - - - - - .6 -2.9Men’s pants and shorts ........................................................ 1.8 4.5 3.4 2.5 -1.1 -1.6 1.0 1.7 -.2 -.1 4.0
Boys’ apparel ......................................................................... -1.0 1.4 2.8 -1.0 1.8 -3.3 2.7 .5 3.3 -1.6 -3.0Women’s and girls’ apparel ...................................................... -.1 6.1 4.0 .5 1.2 -3.8 -.8 -1.1 .2 -1.0 -1.5
Women’s apparel ................................................................. .2 6.6 3.1 .3 2.0 -4.4 -1.0 -.9 .6 -.6 -2.0Women’s outerwear .............................................................. 4.2 7.6 3.3 4.2 4.4 -9.7 3.8 2.1 .5 -3.6 -10.2Women’s dresses .................................................................. -.8 7.0 -2.4 2.1 -2.7 -11.1 1.4 -5.8 -5.0 4.4 -7.8Women’s suits and separates 1 .......................................... - - - - - - -1.8 -.9Women’s underwear, nightwear, sportswear and
accessories 1 .................................................................. _ _ . . _ _ . .4 1.4
Girls’ apparel ............................................................................ -1.0 3.5 8.8 2.1 -3.3 -.7 .4 -2.9 -1.1 -3.4 1.3Footwear ..................................................................................... 1.1 3.2 2.9 2.7 .6 -1.7 .4 1.5 1.8 -.5 -2.1
Men’s footwear ............................................................... 2.3 3.0 3.0 2.7 .2 -.8 -.5 -.4 .2 .8 -1.7Boys’ and girls’ footwear ........................................................ 3.3 3.7 -.2 -1.0 .5 1.0 1.5 4.2 2.4 -.1 -2.6Women’s footwear ................................................................... -.7 3.2 4.1 4.4 .7 -3.6 .6 1.5 2.6 -1.7 -2.1
Infants’ and toddlers’ apparel ................................................... -1.7 8.9 2.9 1.2 -2.8 3.3 -2.0 -1.4 -.9 3.0 -2.5Jewelry and watches 5 ............................................................... 3.3 6.5 3.9 2.8 1.7 5.0 .0 -5.0 -1.0 -2.0 5.4
Watches 5 .................................................................................. -.2 2.5 3.4 -1.2 5.3 5.0 4.8 -6.1 -.3 -1.4 3.1jewelry 5 ................................................................................... 4.3 7.5 3.9 3.8 .9 5.1 -1.1 -4.7 -1.2 -2.2 5.9
Transportation .............................................................................. 4.0 10.4 -1.5 3.0 2.4 3.8 1.5 4.4 -1.4 -1.7 -.6Private transportation ............................................................... 3.9 9.8 -1.4 2.7 1.5 4.9 1.3 3.7 -1.2 -2.0 -.9
New and used motor vehicles 1 .............................................. - 4.5 2.4 1.0 -1.7 .9 -1.0New vehicles .......................................................................... 2.4 2.0 3.2 2.3 3.3 3.3 1.9 1.8 -.9 .0 -.2
New cars and trucks 1 2 ..................................................... - - - - - - .0 -.2New cars 2 ............................................................................. 2.3 1.4 3.3 2.3 2.8 3.2 1.6 1.6 -1.0 -.1 -.4New trucks 2 ® ....................................................................... 3.3 4.2 3.0 2.5 4.6 3.7 2.8 2.2 -.1 .5 .2New motorcycles 2 5 ............................................................. 4.2 2.8 5.4 4.0 7.2 7.9 5.1 3.8 .8 .4 -.3
Used cars and trucks ............................................................. -.4 -2.2 2.6 7.4 8.0 8.8 4.4 -1.6 -4.9 3.5 -3.1Car and truck renta l1 ............................................................ - - - - 1.5 -1.5
Motor fuel ................................................................................. 6.8 36.5 -16.0 1.8 -5.4 5.9 -4.0 12.7 -6.2 -15.4 -3.0Gasoline (all types) ................................................................ 6.5 36.8 -16.2 2.0 -5.9 6.4 -4.2 12.4 -6.1 -15.4 -3.0Gasoline, unleaded regular2 .............................................. 5.5 38.9 -16.7 1.9 -6.7 7.2 -4.4 13.4 -6.6 -16.4 -3.1Gasoline unleaded midgrade 2 ® ...................................... - 5.3 -4.5 11.7 -5.8 -14.4 -3.0Gasoline unleaded premium 2 ............................................ 6.1 32.0 -14.6 1.8 -4.7 5.2 -4.8 10.9 -5.6 -13.4 -2.8
Other motor fuels 1 ................................................................ - - - - - -12.3 -1.9Motor vehicle parts and equipment ....................................... 2.2 .9 1.6 -.6 -1.6 .5 .5 -.1 -.9 -.2 -.3Tires ........................................................................................ 2.3 -.1 2.3 -.5 -1.4 2.2 .2 .0 -2.8 -.4 -.2Vehicle accessories other than tires 1 ................................. - - - - - -.1 -.4
Vehicle parts and equipment other than tires 2 ............... 2.1 2.0 .7 -.6 -1.6 -1.3 .9 -.3 1.1 .1 -.4Motor oil, coolant, and fluids 2 ............................................ -.3 7.0 .8 -.3 .6 6.1 3.2 1.5 -.2 -.8 .1
Motor vehicle maintenance and repair .................................. 4.4 4.4 4.5 3.5 3.1 2.8 2.5 3.1 2.6 3.0 .5Motor vehicle body work ....................................................... 6.0 3.4 2.5 2.7 2.9 3.8 3.5 4.6 4.5 3.0 -.3Motor vehicle maintenance and servicing .......................... 3.1 3.7 5.4 2.1 2.0 1.4 2.1 2.8 2.6 2.9 .7Motor vehicle repa ir1 ............................................................ - - - - 3.0 .5
Motor vehicle insurance .......................................................... 5.9 7.5 8.0 6.6 5.0 3.4 4.3 3.8 2.4 -.3 .0Motor vehicle fe e s1 ................................................................ - - - 3.1 .1
State and local registration and license 1 3 ........................ - - - - - - - - - 1.4 .2Parking and other fees 1 ...................................................... - - - - - - - - - 7.0 .2
Parking fees and tolls 1 2 .................................................... - - - - - - - - - 7.4 -.1Automobile service clubs 1 2 .............................................. - - - - - - - - - .9 .4
Public transportation .................................................................. 4.1 17.2 -3.0 5.6 11.6 -6.2 3.1 11.2 -2.9 2.2 2.5Airline fare ................................................................................ 5.3 22.7 -6.0 6.6 17.0 -9.5 1.8 14.7 -4.8 4.1 4.2Other intercity transportation .................................................. 1.7 6.6 2.4 .1 -2.8 2.3 .8 1.7 .7 3.1 -1.4
Ship fare 12 .. .............................................................. - - - - 4.6 -3.6Intracity transportation ............................................................. 2.1 7.7 3.8 5.0 2.8 1.0 7.6 5.8 1.1 -2.7 .1
Medical care ................................................................................. 8.5 9.6 7.9 6.6 5.4 4.9 3.9 3.0 2.8 3.4 1.0
See footnotes at end of table.
85Digitized for FRASER http://fraser.stlouisfed.org/ Federal Reserve Bank of St. Louis
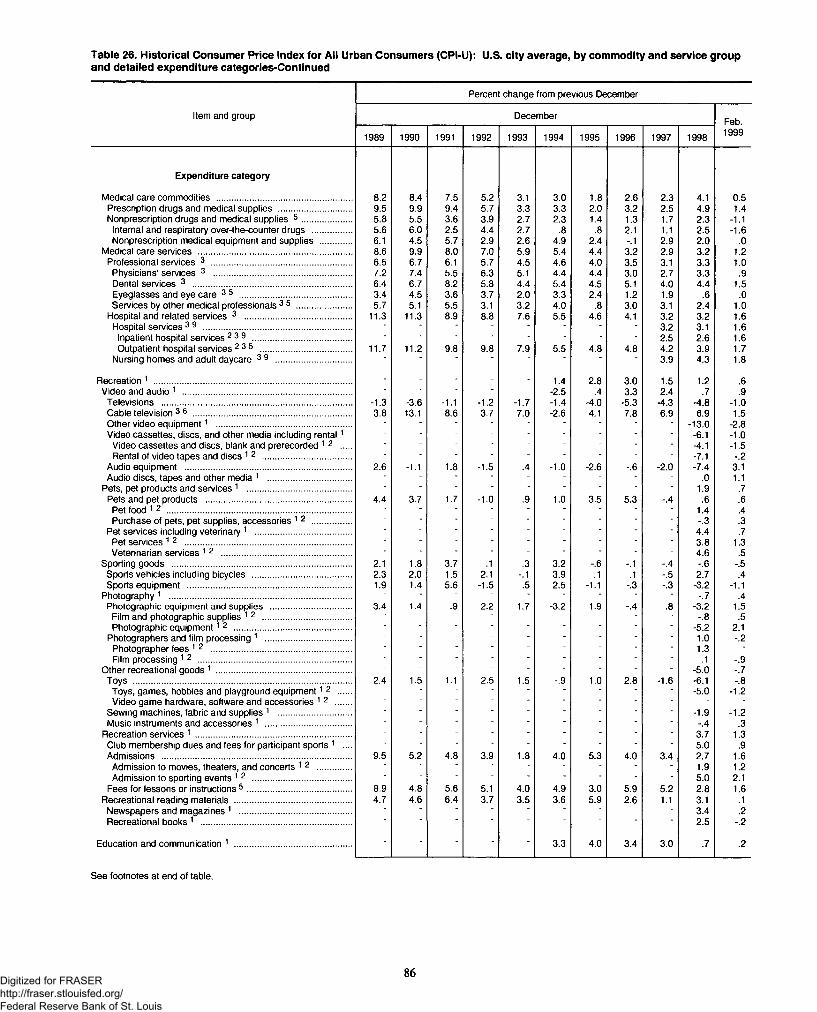
Table 26. Historical Consumer Price Index for All Urban Consumers (CPI-U): U.S. city average, by commodity and service groupand detailed expenditure categories-Continued
Percent change from previous December
Item and group DecemberFeb.
1989 1990 1991 1992 1993 1994 1995 1996 1997 1998 1999
Expenditure category
Medical care commodities ........................................................ 8.2 8.4 7.5 5.2 3.1 3.0 1.8 2.6 2.3 4.1 0.5Prescription drugs and medical supplies .............................. 9.5 9.9 9.4 5.7 3.3 3.3 2.0 3.2 2.5 4.9 1.4Nonprescription drugs and medical supplies 5 ..................... 5.8 5.5 3.6 3.9 2.7 2.3 1.4 1.3 1.7 2.3 -1.1
Internal and respiratory over-the-counter drugs ................ 5.6 6.0 2.5 4.4 2.7 .8 .8 2.1 1.1 2.5 -1.6Nonprescription medical equipment and supplies ............. 6.1 4.5 5.7 2.9 2.6 4.9 2.4 -.1 2.9 2.0 .0
Medical care services ................................................................ 8.6 9.9 8.0 7.0 5.9 5.4 4.4 3.2 2.9 3.2 1.2Professional services 3 ........................................................... 6.5 6.7 6.1 5.7 4.5 4.6 4.0 3.5 3.1 3.3 1.0
Physicians’ services 3 .......................................................... 7.2 7.4 5.5 6.3 5.1 4.4 4.4 3.0 2.7 3.3 .9Dental services 3 .................................................................. 6.4 6.7 8.2 5.8 4.4 5.4 4.5 5.1 4.0 4.4 1.5Eyeglasses and eye care 35 ............................................... 3.4 4.5 3.6 3.7 2.0 3.3 2.4 1.2 1.9 .6 .0Services by other medical professionals 3 5 ....................... 5.7 5.1 5.5 3.1 3.2 4.0 .8 3.0 3.1 2.4 1.0
Hospital and related services 3 ............................................. 11.3 11.3 8.9 8.8 7.6 5.5 4.6 4.1 3.2 3.2 1.6Hospital services 3 9 .............................................................. - - - - - - - - 3.2 3.1 1.6
Inpatient hospital services23 9 ......................................... - - - - - - - - 2.5 2.6 1.6Outpatient hospital services 23 5 ...................................... 11.7 11.2 9.8 9.8 7.9 5.5 4.8 4.8 4.2 3.9 1.7
Nursing homes and adult daycare 3 9 ................................ ' ■ ■ ■ ■ ■ ■ ■ 3.9 4.3 1.8
Recreation 1 .................................................................................. - - - - - 1.4 2.8 3.0 1.5 1.2 .6Video and audio 1 ....................................................................... - - - - - -2.5 .4 3.3 2.4 .7 .9
Televisions ............................................................................... -1.3 -3.6 -1.1 -1.2 -1.7 -1.4 -4.0 -5.3 -4.3 -4.8 -1.0Cable television 3 6 .................................................................. 3.8 13.1 8.6 3.7 7.0 -2.6 4.1 7.8 6.9 6.9 1.5Other video equipment1 ........................................................ - - - - - - - - - -13.0 -2.8Video cassettes, discs, and other media including ren ta l1 - - - - - - - - - -6.1 -1.0
Video cassettes and discs, blank and prerecorded 12 .... - - - - - - - - -4.1 -1.5Rental of video tapes and discs 1 2 ..................................... - - - - - - - - - -7.1 -.2
Audio equipment ..................................................................... 2.6 -1.1 1.8 -1.5 .4 -1.0 -2.6 -.6 -2.0 -7.4 3.1Audio discs, tapes and other media 1 ................................... - - - - - - - - .0 1.1
Pets, pet products and services 1 ........................................... - - - - - - - - 1.9 .7Pets and pet products ............................................................. 4.4 3.7 1.7 -1.0 .9 1.0 3.5 5.3 -.4 .6 .6Pet food 12 ............................................................................. - - - - - - - - - 1.4 .4Purchase of pets, pet supplies, accessories 1 2 ........... - - - - - - - - - -.3 .3
Pet services including veterinary 1 ........................................ • • ■ ■ - • ■ - - 4.4 .7Pet services 1 2 ...................................................................... - - * - - - - - - 3.8 1.3Veterinarian services 1 2 ...................................................... - - - - - - - - - 4.6 .5
Sporting goods ........................................................................... 2.1 1.8 3.7 .1 .3 3.2 -.6 -.1 -.4 -.6 -.5Sports vehicles including bicycles ......................................... 2.3 2.0 1.5 2.1 -.1 3.9 .1 .1 -.5 2.7 .4Sports equipment .................................................................... 1.9 1.4 5.6 -1.5 .5 2.5 -1.1 -.3 -.3 -3.2 -1.1
Photography 1 ............................................................................ - - - - - - ■ - - -.7 .4Photographic equipment and supplies .................................. 3.4 1.4 .9 2.2 1.7 -3.2 1.9 -.4 .8 -3.2 1.5
Film and photographic supplies 1 2 .....................................Photographic equipment12 .................................................
■ ■ * ■ ■ ■ ■ ■ -.8 .5■ * ■ ~ ■ ■ ■ ■ ■ -5.2 2.1
Photographers and film processing 1 .................................... ■ ■ ■ ~ ■ ■ ■ ■ ■ 1.0 -.2Photographer fees 1 2 .......................................................... ■ ■ ■ * ■ ■ ■ ■ ■ 1.3 •Film processing 1 2 ................................................................ ■ ■ ■ ■ ■ ■ ■ ■ ■ .1 -.9
Other recreational goods 1 ........................................................ ■ ■ ■ ■ * • ■ - - -5.0 -.7Toys ................................................................................ .......... 2.4 1.5 1.1 2.5 1.5 -.9 1.0 2.8 -1.6 -6.1 -.8
Toys, games, hobbies and playground equipment12 ..... - - - - - - - - - -5.0 -1.2Video game hardware, software and accessories 12 ....... ■ ■ ■ ■ ■ ■ • - - - ■
Sewing machines, fabric and supplies 1 .............................. - ■ - - - - - - - -1.9 -1.2Music instruments and accessories 1 .................................... ■ ■ ■ ■ ■ ■ • - - -.4 .3
Recreation services 1 ................................................................. - - - - - - - - 3.7 1.3Club membership dues and fees for participant sports 1 .... * - - - - - - - - 5.0 .9Admissions ............................................................................... 9.5 5.2 4.8 3.9 1.8 4.0 5.3 4.0 3.4 2.7 1.6
Admission to movies, theaters, and concerts 1 2 .............. - - - - - - - - - 1.9 1.2Admission to sporting events 1 2 ......................................... - - - - - - - - - 5.0 2.1
Fees for lessons or instructions 5 ........................................... 8.9 4.8 5.6 5.1 4.0 4.9 3.0 5.9 5.2 2.8 1.6Recreational reading materials ................................................. 4.7 4.6 6.4 3.7 3.5 3.6 5.9 2.6 1.1 3.1 .1
Newspapers and magazines 1 ............................................... ■ ■ ■ ■ ■ ■ • - - 3.4 .2Recreational books 1 ............................................................... 2.5 -.2
Education and communication 1 ................................................. - - - - - 3.3 4.0 3.4 3.0 .7 .2
See footnotes at end of table.
86Digitized for FRASER http://fraser.stlouisfed.org/ Federal Reserve Bank of St. Louis
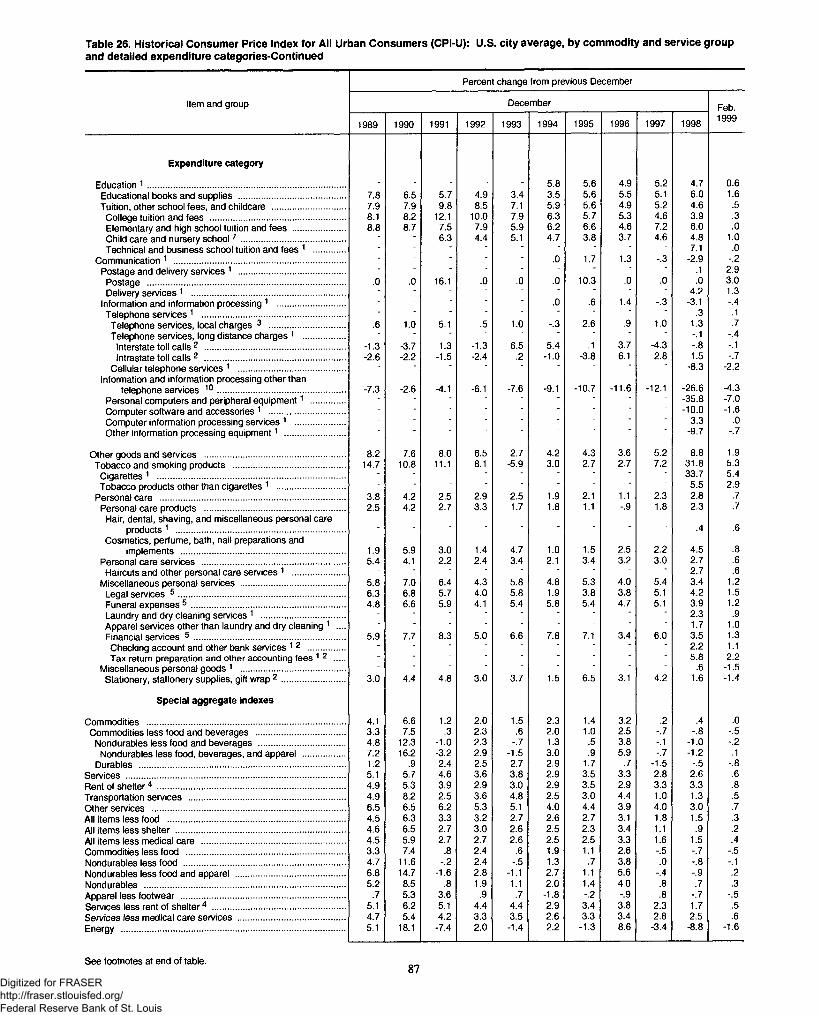
Table 26. Historical Consumer Price Index for All Urban Consumers (CPI-U): U.S. city average, by commodity and service groupand detailed expenditure categories-Continued
Percent change from previous December
Item and group December Feb.
1989 1990 1991 1992 1993 1994 1995 1996 1997 1998 1999
Expenditure category
Education 1 ................................................................................... - - - - - 5.8 5.6 4.9 5.2 4.7 0.6Educational books and supplies ............................................ 7.8 6.5 5.7 4.9 3.4 3.5 5.6 5.5 5.1 6.0 1.6Tuition, other school fees, and childcare .............................. 7.9 7.9 9.8 8.5 7.1 5.9 5.6 4.9 5.2 4.6 .5
College tuition and fees ........................................................ 8.1 8.2 12.1 10.0 7.9 6.3 5.7 5.3 4.6 3.9 .3Elementary and high school tuition and fees ...................... 8.8 8.7 7.5 7.9 5.9 6.2 6.6 4.6 7.2 6.0 .0Child care and nursery school7 ........................................... - - 6.3 4.4 5.1 4.7 3.8 3.7 4.6 4.8 1.0Technical and business school tuition and fees 1 ............. * ■ * ■ - ■ ‘ ' 7.1 .0
Communication 1 ........................................................................ - - ■ ■ ■ .0 1.7 1.3 -.3 -2.9 -.2Postage and delivery services 1 ............................................ ■ ■ ■ * ■ " " .1 2.9
Postage ................................................................................... .0 .0 16.1 .0 .0 .0 10.3 .0 .0 .0 3.0Delivery services 1 ................................................................ ■ ■ * " ' 4.2 1.3
Information and information processing 1 ............................ ■ ■ ■ ' " .0 .6 1.4 -.3 -3.1 -.4Telephone services 1 ............................................................ ■ ■ ■ ■ * ' '
1.0.3 .1
Telephone services, local charges 3 ................................ .6 1.0 5.1 .5 1.0 -.3 2.6 .9 1.3 .7Telephone services, long distance charges 1 ................. ■ ■ " -.1 -.4
Interstate toll calls 2 ........................................................... -1.3 -3.7 1.3 -1.3 6.5 5.4 .1 3.7 -4.3 -.8 -.1Intrastate toll calls 2 ........................................................... -2.6 -2.2 -1.5 -2.4 .2 -1.0 -3.8 6.1 2.8 1.5 -.7
Cellular telephone services 1 ............................................. - ■ ■ ■ ■ ■ " -8.3 -2.2Information and information processing other than
telephone services 1 0 ..................................................... -7.3 -2.6 -4.1 -6.1 -7.6 -9.1 -10.7 -11.6 -12.1 -26.6 -4.3Personal computers and peripheral equipment1 .............. * ■ ■ ' ' " ' -35.8 -7.0Computer software and accessories 1 ................................ ~ ■ -10.0 -1.6Computer information processing sen/ices 1 ..................... ' ■ ■ ' * " 3.3 .0Other information processing equipment1 ......................... -9.7 -.7
Other goods and services ........................................................... 8.2 7.6 8.0 6.5 2.7 4.2 4.3 3.6 5.2 8.8 1.9Tobacco and smoking products ............................................... 14.7 10.8 11.1 8.1 -5.9 3.0 2.7 2.7 7.2 31.8 5.3
Cigarettes 1 .............................................................................. ■ ■ * ' ' 33.7 5.4Tobacco products other than cigarettes 1 ............................ • ■ ■ " " ' ' 5.5 2.9
Personal care ............................................................................. 3.8 4.2 2.5 2.9 2.5 1.9 2.1 1.1 2.3 2.8 .7Personal care products ........................................................... 2.5 4.2 2.7 3.3 1.7 1.8 1.1 -.9 1.8 2.3 .7
Hair, dental, shaving, and miscellaneous personal care.4 .6products 1 ....................................................................... ■ ■ ■ ' ' " '
Cosmetics, perfume, bath, nail preparations and.8implements .................................................................... 1.9 5.9 3.0 1.4 4.7 1.0 1.5 2.5 2.2 4.5
Personal care services ............................................................ 5.4 4.1 2.2 2.4 3.4 2.1 3.4 3.2 3.0 2.7 .6Haircuts and other personal care services 1 ...................... - • * ■ ■ ■ ■ ‘ 2.7 .6
Miscellaneous personal services ............................................ 5.8 7.0 6.4 4.3 5.8 4.8 5.3 4.0 5.4 3.4 1.2Legal services 5 ...................................................................... 6.3 6.8 5.7 4.0 5.8 1.9 3.8 3.8 5.1 4.2 1.5Funeral expenses 5 ................................................................ 4.8 6.6 5.9 4.1 5.4 5.8 5.4 4.7 5.1 3.9 1.2Laundry and dry cleaning services 1 ................................... ■ ■ ■ " ‘ ' ' 2.3 .9Apparel sen/ices other than laundry and dry cleaning 1 .... ■ ■ ■ ’ ' 1.7 1.0Financial services 5 ............................................................... 5.9 7.7 8.3 5.0 6.6 7.8 7.1 3.4 6.0 3.5 1.3
Checking account and other bank services 1 2 ............... - ■ ■ ■ ■ ■ ■ ■ ~ 2.2 1.1Tax return preparation and other accounting fees 12 .... - ■ ■ - ■ ■ ■ * ~ 5.8 2.2
Miscellaneous personal goods 1 ............................................ ' .6 -1.5Stationery, stationery supplies, gift wrap 2 .......................... 3.0 4.4 4.8 3.0 3.7 1.5 6.5 3.1 4.2 1.6 -1.4
Special aggregate indexes
Commodities ................................................................................... 4.1 6.6 1.2 2.0 1.5 2.3 1.4 3.2 .2 .4 .0Commodities less food and beverages ..................................... 3.3 7.5 .3 2.3 .6 2.0 1.0 2.5 -.7 -.8 -.5
Nondurables less food and beverages .................................... 4.8 12.3 -1.0 2.3 -.7 1.3 .5 3.8 -.1 -1.0 -.2Nondurables less food, beverages, and apparel .................. 7.2 16.2 -3.2 2.9 -1.5 3.0 .9 5.9 -.7 -1.2 .1
Durables ...................................................................................... 1.2 .9 2.4 2.5 2.7 2.9 1.7 .7 -1.5 -.5 -.8Services ........................................................................................... 5.1 5.7 4.6 3.6 3.8 2.9 3.5 3.3 2.8 2.6 .6Rent of shelter4 .............................................................................. 4.9 5.3 3.9 2.9 3.0 2.9 3.5 2.9 3.3 3.3 .8Transportation services ................................................................. 4.9 8.2 2.5 3.6 4.8 2.5 3.0 4.4 1.0 1.3 .5Other services ................................................................................. 6.5 6.5 6.2 5.3 5.1 4.0 4.4 3.9 4.0 3.0 .7All items less food .......................................................................... 4.5 6.3 3.3 3.2 2.7 2.6 2.7 3.1 1.8 1.5 .3All items less shelter ....................................................................... 4.6 6.5 2.7 3.0 2.6 2.5 2.3 3.4 1.1 .9 .2All items less medical care ............................................................ 4.5 5.9 2.7 2.7 2.6 2.5 2.5 3.3 1.6 1.5 .4Commodities less food .................................................................. 3.3 7.4 .8 2.4 .6 1.9 1.1 2.6 -.5 -.7 -.5Nondurables less food ................................................................... 4.7 11.6 -.2 2.4 -.5 1.3 .7 3.8 .0 -.8 -.1Nondurables less food and apparel .............................................. 6.8 14.7 -1.6 2.8 -1.1 2.7 1.1 5.6 -.4 -.9 .2Nondurables .................................................................................... 5.2 8.5 .8 1.9 1.1 2.0 1.4 4.0 .8 .7 .3Apparel less footwear .................................................................... .7 5.3 3.6 .9 .7 -1.8 -.2 -.9 .8 -.7 -.5Services less rent of shelter4 ....................................................... 5.1 6.2 5.1 4.4 4.4 2.9 3.4 3.8 2.3 1.7 .5Services less medical care services ............................................. 4.7 5.4 4.2 3.3 3.5 2.6 3.3 3.4 2.8 2.5 .6Energy ............................................................................................. 5.1 18.1 -7.4 2.0 -1.4 2.2 -1.3 8.6 -3.4 -8.8 -1.6
See footnotes at end of table.87
Digitized for FRASER http://fraser.stlouisfed.org/ Federal Reserve Bank of St. Louis
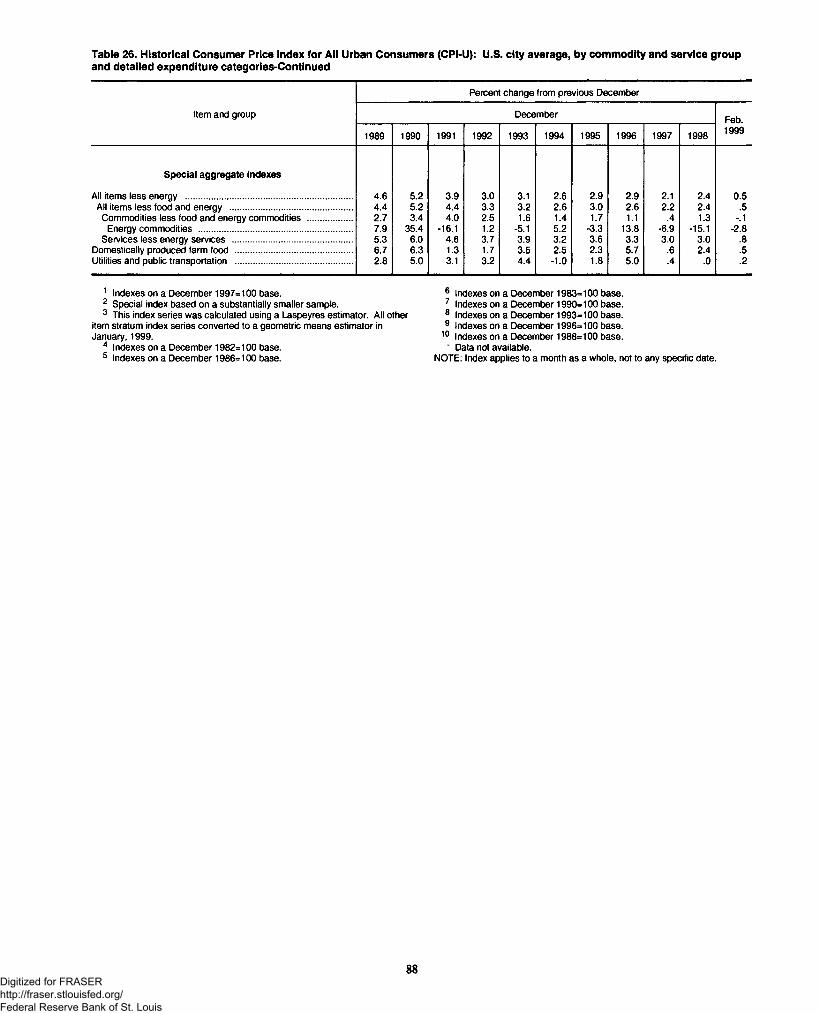
Table 26. Historical Consumer Price Index for All Urban Consumers (CPI-U): U.S. city average, by commodity and service groupand detailed expenditure categories-Continued
Percent change from previous December
Item and group December Feb.
1989 1990 1991 1992 1993 1994 1995 1996 1997 1998 1999
Special aggregate indexes
All items less energy ...................................................................... 4.6 5.2 3.9 3.0 3.1 2.6 2.9 2.9 2.1 2.4 0.5All items less food and energy ................................................... 4.4 5.2 4.4 3.3 3.2 2.6 3.0 2.6 2.2 2.4 .5
Commodities less food and energy commodities ................... 2.7 3.4 4.0 2.5 1.6 1.4 1.7 1.1 .4 1.3 -.1Energy commodities ................................................................ 7.9 35.4 -16.1 1.2 -5.1 5.2 -3.3 13.8 -6.9 -15.1 -2.8
Services less energy services .................................................. 5.3 6.0 4.6 3.7 3.9 3.2 3.6 3.3 3.0 3.0 .8Domestically produced farm food ................................................. 6.7 6.3 1.3 1.7 3.5 2.5 2.3 5.7 .6 2.4 .5Utilities and public transportation ................................................. 2.8 5.0 3.1 3.2 4.4 -1.0 1.8 5.0 .4 .0 .2
1 Indexes on a December 1997=100 base.2 Special index based on a substantially smaller sample.3 This index series was calculated using a Laspeyres estimator. All other
item stratum index series converted to a geometric means estimator in January, 1999.
4 Indexes on a December 1982=100 base.5 Indexes on a December 1986=100 base.
6 Indexes on a December 1983=100 base.7 Indexes on a December 1990=100 base.8 Indexes on a December 1993=100 base.9 Indexes on a December 1996=100 base.
10 Indexes on a December 1988=100 base.~ Data not available.
NOTE: Index applies to a month as a whole, not to any specific date.
88Digitized for FRASER http://fraser.stlouisfed.org/ Federal Reserve Bank of St. Louis
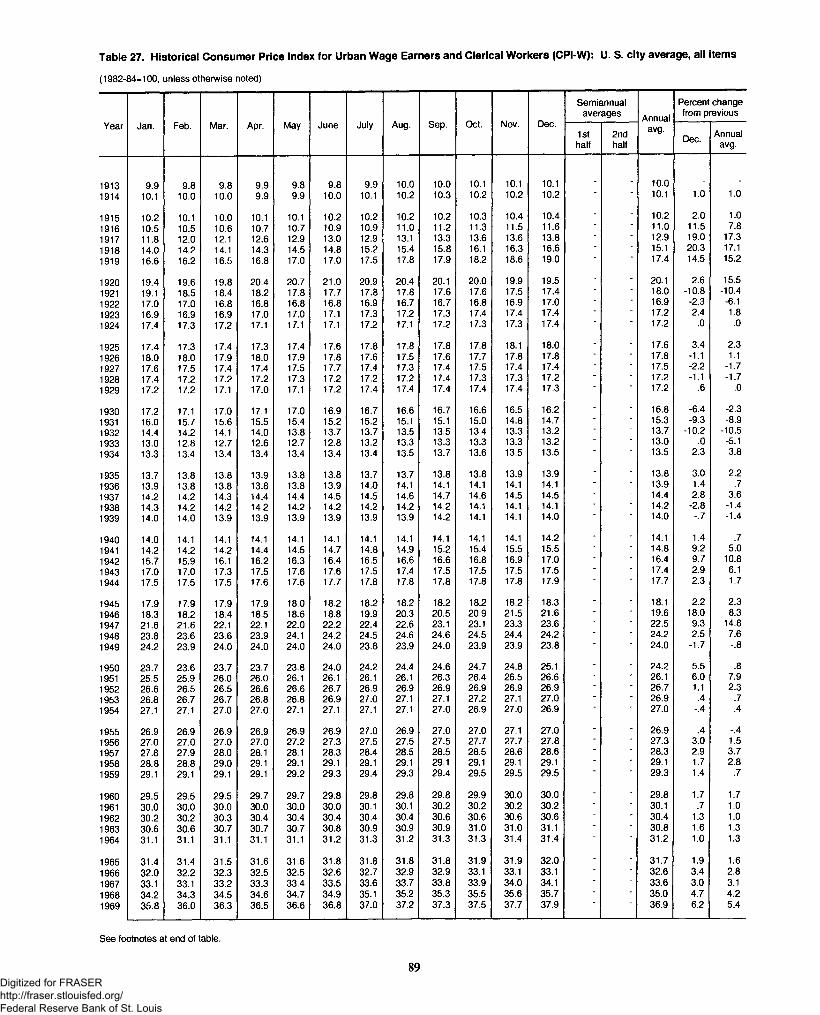
(îyuz-i
Year
19131914
19151916191719181919
19201921192219231924
19251926192719281929
19301931193219331934
19351936193719381939
19401941194219431944
19451946194719481949
19501951195219531954
19551956195719581959
19601961196219631964
19651966196719681969
7. Historical Consumer Price Index for Urban Wage Earners and Clerical Workers (CPI-W): U. S. city average, all items
U100, unless otherwise noted)
Jan. Feb. Mar. Apr. May June July Aug. Sep. Oct. Nov. Dec.
Semiannualaverages Annual
avg.
Percent change from previous
1sthalf
2ndhalf
Dec. Annualavg.
9.9 9.8 9.8 9.9 9.8 9.8 9.9 10.0 10.0 10.1 10.1 10.1 . . 10.0 _ .
10.1 10.0 10.0 9.9 9.9 10.0 10.1 10.2 10.3 10.2 10.2 10.2 10.1 1.0 1.0
10.2 10.1 10.0 10.1 10.1 10.2 10.2 10.2 10.2 10.3 10.4 10.4 - - 10.2 2.0 1.010.5 10.5 10.6 10.7 10.7 10.9 10.9 11.0 11.2 11.3 11.5 11.6 ■ ■ 11.0 11.5 7.811.8 12.0 12.1 12.6 12.9 13.0 12.9 13.1 13.3 13.6 13.6 13.8 • ■ 12.9 19.0 17.314.0 14.2 14.1 14.3 14.5 14.8 15.2 15.4 15.8 16.1 16.3 16.6 • ■ 15.1 20.3 17.116.6 16.2 16.5 16.8 17.0 17.0 17.5 17.8 17.9 18.2 18.6 19.0 17.4 14.5 15.2
19.4 19.6 19.8 20.4 20.7 21.0 20.9 20.4 20.1 20.0 19.9 19.5 - - 20.1 2.6 15.519.1 18.5 18.4 18.2 17.8 17.7 17.8 17.8 17.6 17.6 17.5 17.4 ■ ■ 18.0 -10.8 -10.417.0 17.0 16.8 16.8 16.8 16.8 16.9 16.7 16.7 16.8 16.9 17.0 • ■ 16.9 -2.3 -6.116.9 16.9 16.9 17.0 17.0 17.1 17.3 17.2 17.3 17.4 17.4 17.4 • ■ 17.2 2.4 1.817.4 17.3 17.2 17.1 17.1 17.1 17.2 17.1 17.2 17.3 17.3 17.4 17.2 .0 .0
17.4 17.3 17.4 17.3 17.4 17.6 17.8 17.8 17.8 17.8 18.1 18.0 - - 17.6 3.4 2.318.0 18.0 17.9 18.0 17.9 17.8 17.6 17.5 17.6 17.7 17.8 17.8 ■ ■ 17.8 -1.1 1.117.6 17.5 17.4 17.4 17.5 17.7 17.4 17.3 17.4 17.5 17.4 17.4 ■ ■ 17.5 -2.2 -1.717.4 17.2 17.2 17.2 17.3 17.2 17.2 17.2 17.4 17.3 17.3 17.2 * ■ 17.2 -1.1 -1.717.2 17.2 17.1 17.0 17.1 17.2 17.4 17.4 17.4 17.4 17.4 17.3 17.2 .6 .0
17.2 17.1 17.0 17.1 17.0 16.9 16.7 16.6 16.7 16.6 16.5 16.2 - - 16.8 -6.4 -2.316.0 15.7 15.6 15.5 15.4 15.2 15.2 15.1 15.1 15.0 14.8 14.7 • ■ 15.3 -9.3 -8.914.4 14.2 14.1 14.0 13.8 13.7 13.7 13.5 13.5 13.4 13.3 13.2 ■ ■ 13.7 -10.2 -10.513.0 12.8 12.7 12.6 12.7 12.8 13.2 13.3 13.3 13.3 13.3 13.2 ■ ■ 13.0 .0 -5.113.3 13.4 13.4 13.4 13.4 13.4 13.4 13.5 13.7 13.6 13.5 13.5 13.5 2.3 3.8
13.7 13.8 13.8 13.9 13.8 13.8 13.7 13.7 13.8 13.8 13.9 13.9 - - 13.8 3.0 2.213.9 13.8 13.8 13.8 13.8 13.9 14.0 14.1 14.1 14.1 14.1 14.1 ■ ■ 13.9 1.4 .714.2 14.2 14.3 14.4 14.4 14.5 14.5 14.6 14.7 14.6 14.5 14.5 • ■ 14.4 2.8 3.614.3 14.2 14.2 14.2 14.2 14.2 14.2 14.2 14.2 14.1 14.1 14.1 ■ ~ 14.2 -2.8 -1.414.0 14.0 13.9 13.9 13.9 13.9 13.9 13.9 14.2 14.1 14.1 14.0 14.0 -.7 -1.4
14.0 14.1 14.1 14.1 14.1 14.1 14.1 14.1 14.1 14.1 14.1 14.2 - - 14.1 1.4 .714.2 14.2 14.2 14.4 14.5 14.7 14.8 14.9 15.2 15.4 15.5 15.5 - - 14.8 9.2 5.015.7 15.9 16.1 16.2 16.3 16.4 16.5 16.6 16.6 16.8 16.9 17.0 - - 16.4 9.7 10.817.0 17.0 17.3 17.5 17.6 17.6 17.5 17.4 17.5 17.5 17.5 17.5 ■ ~ 17.4 2.9 6.117.5 17.5 17.5 17.6 17.6 17.7 17.8 17.8 17.8 17.8 17.8 17.9 ' ' 17.7 2.3 1.7
17.9 17.9 17.9 17.9 18.0 18.2 18.2 18.2 18.2 18.2 18.2 18.3 - - 18.1 2.2 2.318.3 18.2 18.4 18.5 18.6 18.8 19.9 20.3 20.5 20.9 21.5 21.6 - - 19.6 18.0 8.321.6 21.6 22.1 22.1 22.0 22.2 22.4 22.6 23.1 23.1 23.3 23.6 - ~ 22.5 9.3 14.823.8 23.6 23.6 23.9 24.1 24.2 24.5 24.6 24.6 24.5 24.4 24.2 - ■ 24.2 2.5 7.624.2 23.9 24.0 24.0 24.0 24.0 23.8 23.9 24.0 23.9 23.9 23.8 24.0 -1.7 -.8
23.7 23.6 23.7 23.7 23.8 24.0 24.2 24.4 24.6 24.7 24.8 25.1 - - 24.2 5.5 .825.5 25.9 26.0 26.0 26.1 26.1 26.1 26.1 26.3 26.4 26.5 26.6 • ~ 26.1 6.0 7.926.6 26.5 26.5 26.6 26.6 26.7 26.9 26.9 26.9 26.9 26.9 26.9 ■ ~ 26.7 1.1 2.326.8 26.7 26.7 26.8 26.8 26.9 27.0 27.1 27.1 27.2 27.1 27.0 ■ ~ 26.9 .4 .727.1 27.1 27.0 27.0 27.1 27.1 27.1 27.1 27.0 26.9 27.0 26.9 27.0 -.4 .4
26.9 26.9 26.9 26.9 26.9 26.9 27.0 26.9 27.0 27.0 27.1 27.0 - - 26.9 .4 -.427.0 27.0 27.0 27.0 27.2 27.3 27.5 27.5 27.5 27.7 27.7 27.8 - - 27.3 3.0 1.527.8 27.9 28.0 28.1 28.1 28.3 28.4 28.5 28.5 28.5 28.6 28.6 - - 28.3 2.9 3.728.8 28.8 29.0 29.1 29.1 29.1 29.1 29.1 29.1 29.1 29.1 29.1 ■ ■ 29.1 1.7 2.829.1 29.1 29.1 29.1 29.2 29.3 29.4 29.3 29.4 29.5 29.5 29.5 29.3 1.4 .7
29.5 29.5 29.5 29.7 29.7 29.8 29.8 29.8 29.8 29.9 30.0 30.0 - - 29.8 1.7 1.730.0 30.0 30.0 30.0 30.0 30.0 30.1 30.1 30.2 30.2 30.2 30.2 ■ ■ 30.1 .7 1.030.2 30.2 30.3 30.4 30.4 30.4 30.4 30.4 30.6 30.6 30.6 30.6 - - 30.4 1.3 1.030.6 30.6 30.7 30.7 30.7 30.8 30.9 30.9 30.9 31.0 31.0 31.1 - - 30.8 1.6 1.331.1 31.1 31.1 31.1 31.1 31.2 31.3 31.2 31.3 31.3 31.4 31.4 ■ ~ 31.2 1.0 1.3
31.4 31.4 31.5 31.6 31.6 31.8 31.8 31.8 31.8 31.9 31.9 32.0 - - 31.7 1.9 1.632.0 32.2 32.3 32.5 32.5 32.6 32.7 32.9 32.9 33.1 33.1 33.1 - - 32.6 3.4 2.833.1 33.1 33.2 33.3 33.4 33.5 33.6 33.7 33.8 33.9 34.0 34.1 - - 33.6 3.0 3.134.2 34.3 34.5 34.6 34.7 34.9 35.1 35.2 35.3 35.5 35.6 35.7 - - 35.0 4.7 4.235.8 36.0 36.3 36.5 36.6 36.8 37.0 37.2 37.3 37.5 37.7 37.9 36.9 6.2 5.4
89Digitized for FRASER http://fraser.stlouisfed.org/ Federal Reserve Bank of St. Louis
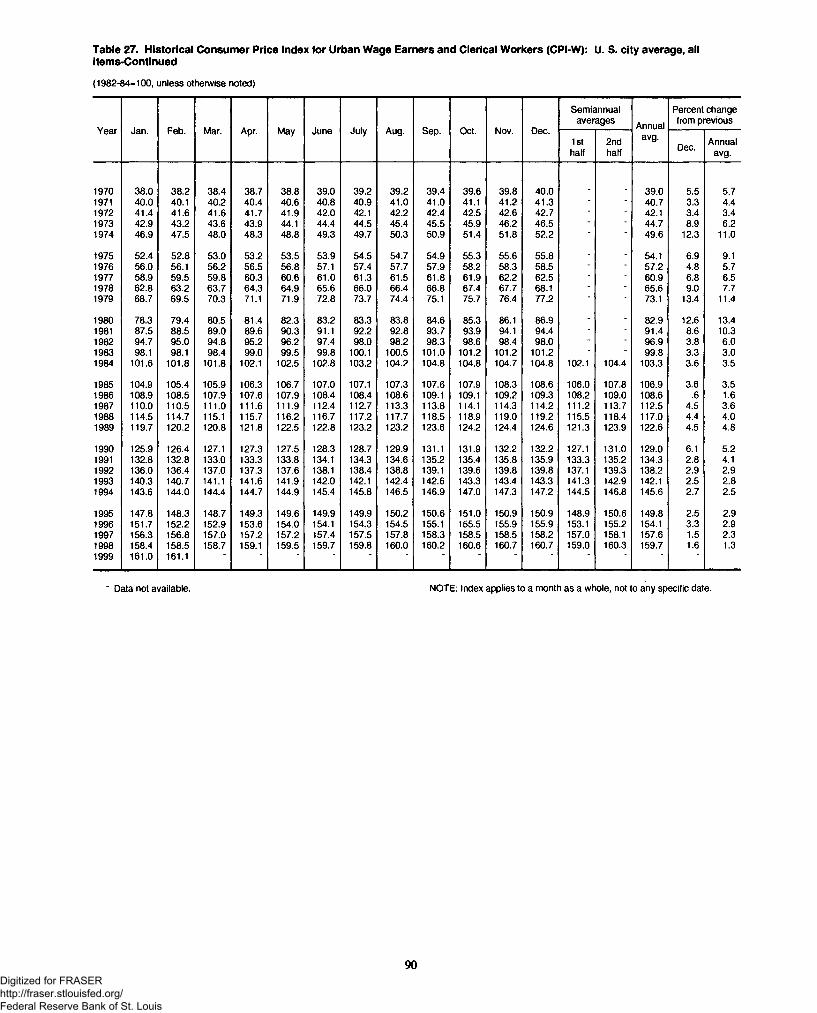
Table 27. Historical Consumer Price Index for Urban Wage Earners and Clerical Workers (CPI-W): U. S. city average, allitems-Continued
(1982-84=100, unless otherwise noted)
Year Jan. Feb. Mar. Apr. May June July Aug. Sep. Oct. Nov. Dec.
Semiannualaverages Annual
Percent change from previous
1sthalf
2ndhalf
avg.Dec. Annual
avg.
1970 38.0 38.2 38.4 38.7 38.8 39.0 39.2 39.2 39.4 39.6 39.8 40.0 39.0 5.5 5.71971 40.0 40.1 40.2 40.4 40.6 40.8 40.9 41.0 41.0 41.1 41.2 41.3 - - 40.7 3.3 4.41972 41.4 41.6 41.6 41.7 41.9 42.0 42.1 42.2 42.4 42.5 42.6 42.7 - - 42.1 3.4 3.41973 42.9 43.2 43.6 43.9 44.1 44.4 44.5 45.4 45.5 45.9 46.2 46.5 - - 44.7 8.9 6.21974 46.9 47.5 48.0 48.3 48.8 49.3 49.7 50.3 50.9 51.4 51.8 52.2 ■ ■ 49.6 12.3 11.0
1975 52.4 52.8 53.0 53.2 53.5 53.9 54.5 54.7 54.9 55.3 55.6 55.8 - - 54.1 6.9 9.11976 56.0 56.1 56.2 56.5 56.8 57.1 57.4 57.7 57.9 58.2 58.3 58.5 - - 57.2 4.8 5.71977 58.9 59.5 59.8 60.3 60.6 61.0 61.3 61.5 61.8 61.9 62.2 62.5 - - 60.9 6.8 6.51978 62.8 63.2 63.7 64.3 64.9 65.6 66.0 66.4 66.8 67.4 67.7 68.1 - - 65.6 9.0 7.71979 68.7 69.5 70.3 71.1 71.9 72.8 73.7 74.4 75.1 75.7 76.4 77.2 ■ * 73.1 13.4 11.4
1980 78.3 79.4 80.5 81.4 82.3 83.2 83.3 83.8 84.6 85.3 86.1 86.9 - - 82.9 12.6 13.41981 87.5 88.5 89.0 89.6 90.3 91.1 92.2 92.8 93.7 93.9 94.1 94.4 - - 91.4 8.6 10.31982 94.7 95.0 94.8 95.2 96.2 97.4 98.0 98.2 98.3 98.6 98.4 98.0 - - 96.9 3.8 6.01983 98.1 98.1 98.4 99.0 99.5 99.8 100.1 100.5 101.0 101.2 101.2 101.2 - - 99.8 3.3 3.01984 101.6 101.8 101.8 102.1 102.5 102.8 103.2 104.2 104.8 104.8 104.7 104.8 102.1 104.4 103.3 3.6 3.5
1985 104.9 105.4 105.9 106.3 106.7 107.0 107.1 107.3 107.6 107.9 108.3 108.6 106.0 107.8 106.9 3.6 3.51986 108.9 108.5 107.9 107.6 107.9 108.4 108.4 108.6 109.1 109.1 109.2 109.3 108.2 109.0 108.6 .6 1.61987 110.0 110.5 111.0 111.6 111.9 112.4 112.7 113.3 113.8 114.1 114.3 114.2 111.2 113.7 112.5 4.5 3.61988 114.5 114.7 115.1 115.7 116.2 116.7 117.2 117.7 118.5 118.9 119.0 119.2 115.5 118.4 117.0 4.4 4.01989 119.7 120.2 120.8 121.8 122.5 122.8 123.2 123.2 123.6 124.2 124.4 124.6 121.3 123.9 122.6 4.5 4.8
1990 125.9 126.4 127.1 127.3 127.5 128.3 128.7 129.9 131.1 131.9 132.2 132.2 127.1 131.0 129.0 6.1 5.21991 132.8 132.8 133.0 133.3 133.8 134.1 134.3 134.6 135.2 135.4 135.8 135.9 133.3 135.2 134.3 2.8 4.11992 136.0 136.4 137.0 137.3 137.6 138.1 138.4 138.8 139.1 139.6 139.8 139.8 137.1 139.3 138.2 2.9 2.91993 140.3 140.7 141.1 141.6 141.9 142.0 142.1 142.4 142.6 143.3 143.4 143.3 141.3 142.9 142.1 2.5 2.81994 143.6 144.0 144.4 144.7 144.9 145.4 145.8 146.5 146.9 147.0 147.3 147.2 144.5 146.8 145.6 2.7 2.5
1995 147.8 148.3 148.7 149.3 149.6 149.9 149.9 150.2 150.6 151.0 150.9 150.9 148.9 150.6 149.8 2.5 2.91996 151.7 152.2 152.9 153.6 154.0 154.1 154.3 154.5 155.1 155.5 155.9 155.9 153.1 155.2 154.1 3.3 2.91997 156.3 156.8 157.0 157.2 157.2 157.4 157.5 157.8 158.3 158.5 158.5 158.2 157.0 158.1 157.6 1.5 2.31998 158.4 158.5 158.7 159.1 159.5 159.7 159.8 160.0 160.2 160.6 160.7 160.7 159.0 160.3 159.7 1.6 1.31999 161.0 161.1
■ Data not available. NOTE: Index applies to a month as a whole, not to any specific date.
90Digitized for FRASER http://fraser.stlouisfed.org/ Federal Reserve Bank of St. Louis
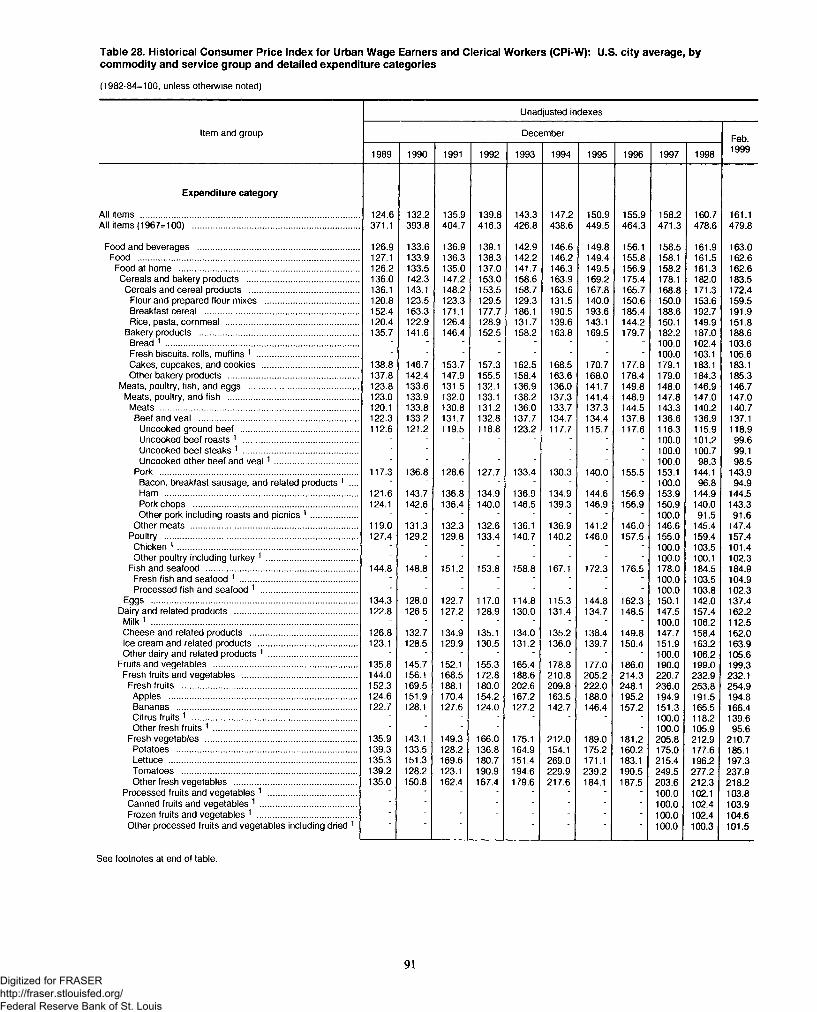
Table 28. Historical Consumer Price Index for Urban Wage Earners and Clerical Workers (CPi-W): U.S. city average, bycommodity and service group and detailed expenditure categories
(1982-84=100, unless otherwise noted)
Unadjusted indexes
Item and group DecemberFeb.
1989 1990 1991 1992 1993 1994 1995 1996 1997 1998 1999
Expenditure category
All items ........................................................................................... 124.6 132.2 135.9 139.8 143.3 147.2 150.9 155.9 158.2 160.7 161.1All items (1967=100) ..................................................................... 371.1 393.8 404.7 416.3 426.8 438.6 449.5 464.3 471.3 478.6 479.8
Food and beverages ................................................................... 126.9 133.6 136.9 139.1 142.9 146.6 149.8 156.1 158.5 161.9 163.0Food ............................................................................................ 127.1 133.9 136.3 138.3 142.2 146.2 149.4 155.8 158.1 161.5 162.6
Food at home ........................................................................... 126.2 133.5 135.0 137.0 141.7 146.3 149.5 156.9 158.2 161.3 162.6Cereals and bakery products ............................................... 136.0 142.3 147.2 153.0 158.6 163.9 169.2 175.4 178.1 182.0 183.5
Cereals and cereal products .............................................. 136.1 143.1 148.2 153.5 158.7 163.6 167.8 165.7 168.8 171.3 172.4Flour and prepared flour mixes ....................................... 120.8 123.5 123.3 129.5 129.3 131.5 140.0 150.6 150.0 153.6 159.5Breakfast cereal ................................................................ 152.4 163.3 171.1 177.7 186.1 190.5 193.6 185.4 188.6 192.7 191.9Rice, pasta, cornmeal ....................................................... 120.4 122.9 126.4 128.9 131.7 139.6 143.1 144.2 150.1 149.9 151.8
Bakery products .................................................................. 135.7 141.6 146.4 152.5 158.2 163.8 169.5 179.7 182.2 187.0 188.6Bread 1 ................................................................................ - - - - - - - - 100.0 102.4 103.6Fresh biscuits, rolls, muffins 1 .......................................... - - - - - - - - 100.0 103.1 105.6Cakes, cupcakes, and cookies ........................................ 138.8 146.7 153.7 157.3 162.5 168.5 170.7 177.8 179.1 183.1 183.1Other bakery products ...................................................... 137.8 142.4 147.9 155.5 158.4 163.6 168.0 178.4 179.0 184.3 185.3
Meats, poultry, fish, and eggs .............................................. 123.8 133.6 131.5 132.1 136.9 136.0 141.7 149.8 148.0 146.9 146.7Meats, poultry, and fish ...................................................... 123.0 133.9 132.0 133.1 138.2 137.3 141.4 148.9 147.8 147.0 147.0
Meats ................................................................................... 120.1 133.8 130.8 131.2 136.0 133.7 137.3 144.5 143.3 140.2 140.7Beef and veal .................................................................. 122.3 133.2 131.7 132.8 137.7 134.7 134.4 137.8 136.6 136.9 137.1
Uncooked ground beef ................................................. 112.6 121.2 119.5 118.8 123.2 117.7 115.7 117.6 116.3 115.9 118.9Uncooked beef roasts 1 ................................................. - - - - - - - 100.0 101.2 99.6Uncooked beef steaks 1 ................................................ - - - - - - 100.0 100.7 99.1Uncooked other beef and v e a l1 ................................... - - - - - - - - 100.0 98.3 98.5
Pork .................................................................................. 117.3 136.8 128.6 127.7 133.4 130.3 140.0 155.5 153.1 144.1 143.9Bacon, breakfast sausage, and related products 1 .... - - - - - - - 100.0 96.8 94.9Ham ................................................................................ 121.6 143.7 136.8 134.9 136.9 134.9 144.6 156.9 153.9 144.9 144.5Pork chops .................................................................... 124.1 142.6 136.4 140.0 146.5 139.3 146.9 156.9 150.9 140.0 143.3Other pork including roasts and picnics 1 ................... - - - - - - - - 100.0 91.5 91.6
Other meats ..................................................................... 119.0 131.3 132.3 132.6 136.1 136.9 141.2 146.0 146.6 145.4 147.4Poultry ................................................................................ 127.4 129.2 129.8 133.4 140.7 140.2 146.0 157.5 155.0 159.4 157.4Chicken 1 ........................................................................... - - - - - - - - 100.0 103.5 101.4Other poultry including turkey 1 ...................................... - - - - - - - - 100.0 100.1 102.3
Fish and seafood ............................................................... 144.8 148.8 151.2 153.8 158.8 167.1 172.3 176.5 178.0 184.5 184.9Fresh fish and seafood 1 ................................................. - - - - - - - - 100.0 103.5 104.9Processed fish and seafood 1 ........................................ - - - - - - - - 100.0 103.8 102.3
Eggs .............................................................................................. 134.3 128.0 122.7 117.0 114.8 115.3 144.8 162.3 150.1 142.0 137.4Dairy and related products ................................................... 122.8 126.5 127.2 128.9 130.0 131.4 134.7 148.5 147.5 157.4 162.2
M ilk1 ...................................................................................... - - - - - - - - 100.0 106.2 112.5Cheese and related products ............................................. 126.8 132.7 134.9 135.1 134.0 135.2 138.4 149.8 147.7 158.4 162.0Ice cream and related products ......................................... 123.1 128.5 129.9 130.5 131.2 136.0 139.7 150.4 151.9 163.2 163.9Other dairy and related products 1 ..................................... - - - - - - - - 100.0 106.2 105.6
Fruits and vegetables ............................................................ 135.8 145.7 152.1 155.3 165.4 178.8 177.0 186.0 190.0 199.0 199.3Fresh fruits and vegetables ................................................ 144.0 156.1 168.5 172.8 188.6 210.8 205.2 214.3 220.7 232.9 232.1
Fresh fruits ......................................................................... 152.3 169.5 188.1 180.0 202.6 209.8 222.0 248.1 236.0 253.8 254.9Apples .............................................................................. 124.6 151.9 170.4 154.2 167.2 163.5 188.0 195.2 194.9 191.5 194.8Bananas ........................................................................... 122.7 128.1 127.6 124.0 127.2 142.7 146.4 157.2 151.3 165.5 166.4Citrus fruits 1 .................................................................... - - - - - - - - 100.0 118.2 139.6Other fresh fruits 1 ............................................................ - - - - - - - - 100.0 105.9 95.6
Fresh vegetables ............................................................... 135.9 143.1 149.3 166.0 175.1 212.0 189.0 181.2 205.8 212.9 210.7Potatoes ......................... ................................................. 139.3 133.5 128.2 136.8 164.9 154.1 175.2 160.2 175.0 177.6 185.1Lettuce .............................................................................. 135.3 151.3 169.6 180.7 151.4 269.0 171.1 183.1 215.4 196.2 197.3Tomatoes .......................... .............................................. 139.2 128.2 123.1 190.9 194.6 229.9 239.2 190.5 249.5 277.2 237.9Other fresh vegetables ................................................... 135.0 150.8 162.4 167.4 179.6 217.6 184.1 187.5 203.6 212.3 218.2
Processed fruits and vegetables 1 ..................................... - - - - - - - - 100.0 102.1 103.8Canned fruits and vegetables 1 ........................................ • - - - - - - - 100.0 102.4 103.9Frozen fruits and vegetables 1 ......................................... - - - - - - - - 100.0 102.4 104.6Other processed fruits and vegetables including dried 1 100.0 100.3 101.5
See footnotes at end of table.
91Digitized for FRASER http://fraser.stlouisfed.org/ Federal Reserve Bank of St. Louis
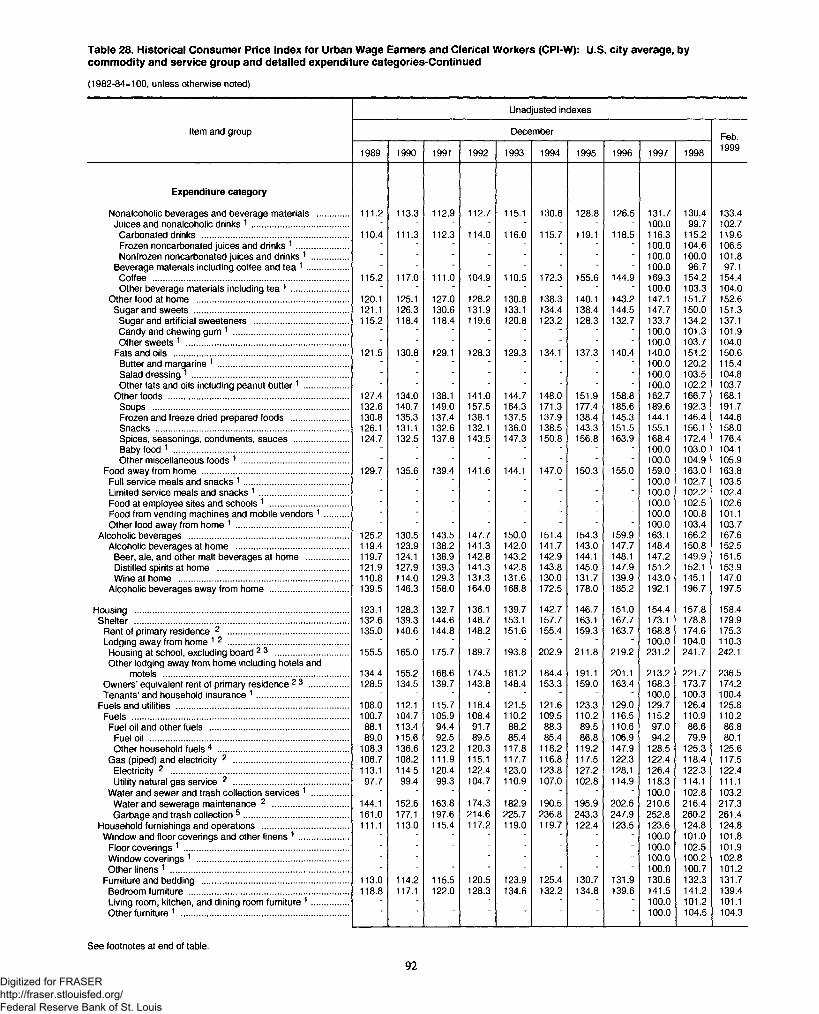
Table 28. Historical Consumer Price Index for Urban Wage Earners and Clerical Workers (CPI-W): U.S. city average, bycommodity and service group and detailed expenditure categories-Continued
(1982-84=100, unless otherwise noted)
Unadjusted indexes
Item and group December Feb.
1989 1990 1991 1992 1993 1994 1995 1996 1997 1998 1999
Expenditure category
Nonalcoholic beverages and beverage materials ............. 111.2 113.3 112.9 112.7 115.1 130.6 128.8 126.5 131.7 130.4 133.4Juices and nonalcoholic drinks 1 ........................................ - - - - - - - - 100.0 99.7 102.7
Carbonated drinks ............................................................. 110.4 111.3 112.3 114.0 116.0 115.7 119.1 118.5 116.3 115.2 119.6Frozen noncarbonated juices and drinks 1 ...................... - - - - - - - - 100.0 104.6 106.5Nonfrozen noncarbonated juices and drinks 1 ............... - - - - - - - - 100.0 100.0 101.8
Beverage materials including coffee and tea 1 ................. - - - - - - - - 100.0 96.7 97.1Coffee .................................................................................. 115.2 117.0 111.0 104.9 110.5 172.3 155.6 144.9 169.3 154.2 154.4Other beverage materials including tea 1 ........................ - - - - - - - - 100.0 103.3 104.0
Other food at home ............................................................... 120.1 125.1 127.0 128.2 130.8 138.3 140.1 143.2 147.1 151.7 152.6Sugar and sweets ................................................................ 121.1 126.3 130.6 131.9 133.1 134.4 138.4 144.5 147.7 150.0 151.3
Sugar and artificial sweeteners ....................................... 115.2 118.4 118.4 119.6 120.8 123.2 128.3 132.7 133.7 134.2 137.1Candy and chewing gum 1 ................................................ - - ' - - - - - 100.0 101.3 101.9Other sweets 1 ................................................................... - - ■ - - - - * 100.0 103.7 104.0
Fats and oils ......................................................................... 121.5 130.8 129.1 128.3 129.3 134.1 137.3 140.4 140.0 151.2 150.6Butter and margarine 1 ...................................................... - - - - - - - - 100.0 120.2 115.4Salad dressing 1 ................................................................. - - ■ - - * - - 100.0 103.5 104.8Other fats and oils including peanut bu tte r1 .................. - ■ ■ ■ - ■ - ■ 100.0 102.2 103.7
Other foods ........................................................................... 127.4 134.0 138.1 141.0 144.7 148.0 151.9 158.8 162.7 166.7 168.1Soups ................................................................................. 132.6 140.7 149.0 157.5 164.3 171.3 177.4 185.6 189.6 192.3 191.7Frozen and freeze dried prepared foods ........................ 130.8 135.3 137.4 138.1 137.5 137.9 138.4 145.3 144.1 146.4 144.6Snacks ................................................................................ 126.1 131.1 132.6 132.1 136.0 138.5 143.3 151.5 155.1 156.1 158.0Spices, seasonings, condiments, sauces ....................... 124.7 132.5 137.8 143.5 147.3 150.8 156.8 163.9 168.4 172.4 176.4Baby food 1 ......................................................................... - - - - - - - - 100.0 103.0 104.1Other miscellaneous foods 1 ............................................. - - - - - - 100.0 104.9 105.9
Food away from home ............................................................. 129.7 135.6 139.4 141.6 144.1 147.0 150.3 155.0 159.0 163.0 163.8Full service meals and snacks 1 ............................................ - - - - - - - - 100.0 102.7 103.5Limited service meals and snacks 1 ..................................... - - - - - - - 100.0 102.2 102.4Food at employee sites and schools 1 ................................. - - - - - - - - 100.0 102.5 102.6Food from vending machines and mobile vendors 1 .......... - - - - - - - - 100.0 100.8 101.1Other food away from home 1 ............................................... - - - - - - - - 100.0 103.4 103.7
Alcoholic beverages .................................................................. 125.2 130.5 143.5 147.7 150.0 151.4 154.3 159.9 163.1 166.2 167.6Alcoholic beverages at home ............................................... 119.4 123.9 138.2 141.3 142.0 141.7 143.0 147.7 148.4 150.8 152.5
Beer, ale, and other malt beverages at home ................. 119.7 124.1 138.9 142.8 143.2 142.9 144.1 148.1 147.2 149.9 151.5Distilled spirits at home ...................................................... 121.9 127.9 139.3 141.3 142.8 143.8 145.0 147.9 151.2 152.1 153.9Wine at home ....................................................................... 110.8 114.0 129.3 131.3 131.6 130.0 131.7 139.9 143.0 145.1 147.0
Alcoholic beverages away from home ................................. 139.5 146.3 158.0 164.0 168.8 172.5 178.0 185.2 192.1 196.7 197.5
Housing ......................................................................................... 123.1 128.3 132.7 136.1 139.7 142.7 146.7 151.0 154.4 157.8 158.4Shelter ......................................................................................... 132.6 139.3 144.6 148.7 153.1 157.7 163.1 167.7 173.1 178.8 179.9
Rent of primary residence 2 .................................................. 135.0 140.6 144.8 148.2 151.6 155.4 159.3 163.7 168.8 174.6 175.3Lodging away from home 1 2 .................................................. - - ■ ■ • - - • 100.0 104.0 110.3
Housing at school, excluding board 2 3 .............................. 155.5 165.0 175.7 189.7 193.8 202.9 211.8 219.2 231.2 241.7 242.1Other lodging away from home including hotels and
motels ............................................................................. 134.4 155.2 168.6 174.5 181.2 184.4 191.1 201.1 213.2 221.7 236.5Owners’ equivalent rent of primary residence 23 ................ 128.5 134.5 139.7 143.8 148.4 153.3 159.0 163.4 168.3 173.7 174.2Tenants’ and household insurance 1 ...................................... - - - - - - - - 100.0 100.3 100.4
Fuels and utilities ........................................................................ 108.0 112.1 115.7 118.4 121.5 121.6 123.3 129.0 129.7 126.4 125.8Fuels .......................................................................................... 100.7 104.7 105.9 108.4 110.2 109.5 110.2 116.5 115.2 110.9 110.2
Fuel oil and other fuels .......................................................... 88.1 113.4 94.4 91.7 88.2 88.3 89.5 110.6 97.0 86.6 86.8Fuel oil ................................................................................... 89.0 115.6 92.5 89.5 85.4 85.4 86.8 106.9 94.2 79.9 80.1Other household fuels 4 ...................................................... 108.3 136.6 123.2 120.3 117.8 118.2 119.2 147.9 128.5 125.3 125.6
Gas (piped) and electricity 2 ................................................ 106.7 108.2 111.9 115.1 117.7 116.8 117.5 122.3 122.4 118.4 117.5Electricity 2 .......................................................................... 113.1 114.5 120.4 122.4 123.0 123.8 127.2 128.1 126.4 122.3 122.4Utility natural gas service 2 ................................................ 97.7 99.4 99.3 104.7 110.9 107.0 102.8 114.9 118.3 114.1 111.1
Water and sewer and trash collection services 1 ............... - - - - - - - - 100.0 102.8 103.2Water and sewerage maintenance 2 ................................ 144.1 152.6 163.8 174.3 182.9 190.5 195.9 202.6 210.6 216.4 217.3Garbage and trash collection 5 ............................................ 161.0 177.1 197.6 214.6 225.7 236.8 243.3 247.9 252.8 260.2 261.4
Household furnishings and operations .................................... 111.1 113.0 115.4 117.2 119.0 119.7 122.4 123.5 123.6 124.8 124.8Window and floor coverings and other linens 1 ..................... ■ - • ■ - - - • 100.0 101.0 101.8
Floor coverings 1 ..................................................................... - ■ ■ ■ • ■ ■ ■ 100.0 102.5 101.9Window coverings 1 ............................................................... ■ ■ ■ ■ ■ ■ ■ * 100.0 100.2 102.8Other linens 1 .......................................................................... - - ■ ■ - ■ • ■ 100.0 100.7 101.2
Furniture and bedding ............................................................. 113.0 114.2 115.5 120.5 123.9 125.4 130.7 131.9 130.6 132.3 131.7Bedroom furniture .................................................................. 118.8 117.1 122.0 128.3 134.6 132.2 134.8 139.6 141.5 141.2 139.4Living room, kitchen, and dining room furniture 1 ............... - - - - - - - - 100.0 101.2 101.1Other furniture 1 ...................................................................... 100.0 104.5 104.3
See footnotes at end of table.
92Digitized for FRASER http://fraser.stlouisfed.org/ Federal Reserve Bank of St. Louis
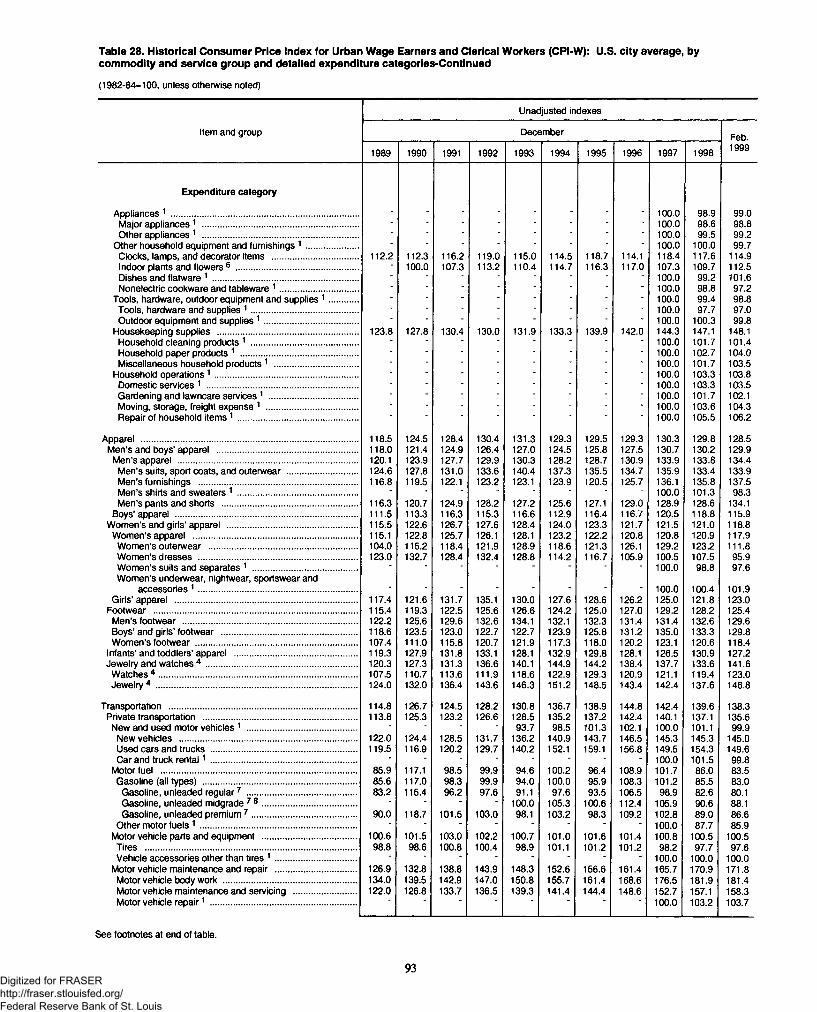
Table 28. Historical Consumer Price Index for Urban Wage Earners and Clerical Workers (CPI-W): U.S. city average, bycommodity and service group and detailed expenditure categories-Continued
(1982-84=100, unless otherwise noted)
Unadjusted indexes
Item and group December Feb.
1989 1990 1991 1992 1993 1994 1995 1996 1997 1998 1999
Expenditure category
Appliances 1 .............................................................................. - - - - - - - - 100.0 98.9 99.0Major appliances 1 ................................................................. ■ ■ ■ • • • • ~ 100.0 98.6 98.8Other appliances 1 ................................................................. • ■ ■ • • • * ■ 100.0 99.5 99.2
Other household equipment and furnishings 1 ...................... ■ * ■ ■ ■ * ■ ■ 100.0 100.0 99.7Clocks, lamps, and decorator items .................................... 112.2 112.3 116.2 119.0 115.0 114.5 118.7 114.1 118.4 117.6 114.9Indoor plants and flowers 6 ................................................... - 100.0 107.3 113.2 110.4 114.7 116.3 117.0 107.3 109.7 112.5Dishes and flatware 1 ............................................................. - ■ - - - - - - 100.0 99.2 101.6Nonelectric cookware and tableware 1 ................................. - - - - - - - - 100.0 98.8 97.2
Tools, hardware, outdoor equipment and supplies 1 ............ - - - - - - - - 100.0 99.4 98.8Tools, hardware and supplies 1 ............................................. ■ ■ ■ - - - - - 100.0 97.7 97.0Outdoor equipment and supplies 1 ....................................... - - - - - - - - 100.0 100.3 99.8
Housekeeping supplies ........................................................... 123.8 127.8 130.4 130.0 131.9 133.3 139.9 142.0 144.3 147.1 148.1Household cleaning products 1 ............................................. - - - - - - - ■ 100.0 101.7 101.4Household paper products 1 ................................................. ■ ■ ■ ■ ■ ■ ■ ■ 100.0 102.7 104.0Miscellaneous household products 1 ................................... - - ■ - - - - ■ 100.0 101.7 103.5
Household operations 1 ............................................................ - - - - - - - - 100.0 103.3 103.8Domestic services 1 ............................................................... * - - - - - • - 100.0 103.3 103.5Gardening and lawncare services 1 ..................................... - - - - - - - - 100.0 101.7 102.1Moving, storage, freight expense 1 ...................................... - - - - - - - - 100.0 103.6 104.3Repair of household items 1 .................................................. 100.0 105.5 106.2
Apparel .......................................................................................... 118.5 124.5 128.4 130.4 131.3 129.3 129.5 129.3 130.3 129.8 128.5Men’s and boys’ apparel ........................................................... 118.0 121.4 124.9 126.4 127.0 124.5 125.8 127.5 130.7 130.2 129.9
Men’s apparel ........................................................................... 120.1 123.9 127.7 129.9 130.3 128.2 128.7 130.9 133.9 133.8 134.4Men’s suits, sport coats, and outerwear ............................. 124.6 127.8 131.0 133.6 140.4 137.3 135.5 134.7 135.9 133.4 133.9Men’s furnishings .................................................................. 116.8 119.5 122.1 123.2 123.1 123.9 120.5 125.7 136.1 135.8 137.5Men’s shirts and sweaters 1 .................................................. - - - - - - - - 100.0 101.3 98.3Men’s pants and shorts ........................................................ 116.3 120.7 124.9 128.2 127.2 125.6 127.1 129.0 128.9 128.6 134.1
Boys’ apparel ............................................................................ 111.5 113.3 116.3 115.3 116.6 112.9 116.4 116.7 120.5 118.8 115.9Women’s and girls’ apparel ...................................................... 115.5 122.6 126.7 127.6 128.4 124.0 123.3 121.7 121.5 121.0 118.8
Women’s apparel .................................................................... 115.1 122.8 125.7 126.1 128.1 123.2 122.2 120.8 120.8 120.9 117.9Women’s outerwear .............................................................. 104.0 115.2 118.4 121.9 128.9 118.6 121.3 126.1 129.2 123.2 111.8Women’s dresses .................................................................. 123.0 132.7 128.4 132.4 128.8 114.2 116.7 105.9 100.5 107.5 95.9Women’s suits and separates 1 ............................................ - - - - - - - - 100.0 98.8 97.6Women’s underwear, nightwear, sportswear and
accessories 1 .................................................................. • - - - - - - - 100.0 100.4 101.9Girls’ apparel ............................................................................ 117.4 121.6 131.7 135.1 130.0 127.6 128.6 126.2 125.0 121.8 123.0
Footwear ..................................................................................... 115.4 119.3 122.5 125.6 126.6 124.2 125.0 127.0 129.2 128.2 125.4Men’s footwear ......................................................................... 122.2 125.6 129.6 132.6 134.1 132.1 132.3 131.4 131.4 132.6 129.6Boys’ and girls’ footwear ......................................................... 118.6 123.5 123.0 122.7 122.7 123.9 125.8 131.2 135.0 133.3 129.8Women’s footwear ................................................................... 107.4 111.0 115.8 120.7 121.9 117.3 118.0 120.2 123.1 120.6 118.4
Infants’ and toddlers’ apparel ................................................... 119.3 127.9 131.8 133.1 128.1 132.9 129.8 128.1 126.5 130.9 127.2Jewelry and watches 4 ............................................................... 120.3 127.3 131.3 136.6 140.1 144.9 144.2 138.4 137.7 133.6 141.6
Watches 4 ................................................................................... 107.5 110.7 113.6 111.9 118.6 122.9 129.3 120.9 121.1 119.4 123.0Jewelry4 .................................................................................... 124.0 132.0 136.4 143.6 146.3 151.2 148.5 143.4 142.4 137.6 146.8
Transportation .............................................................................. 114.8 126.7 124.5 128.2 130.8 136.7 138.9 144.8 142.4 139.6 138.3Private transportation ................................................................ 113.8 125.3 123.2 126.6 128.5 135.2 137.2 142.4 140.1 137.1 135.6
New and used motor vehicles 1 .............................................. - - - - 93.7 98.5 101.3 102.1 100.0 101.1 99.9New vehicles .......................................................................... 122.0 124.4 128.5 131.7 136.2 140.9 143.7 146.5 145.3 145.3 145.0Used cars and trucks ............................................................. 119.5 116.9 120.2 129.7 140.2 152.1 159.1 156.8 149.5 154.3 149.6Car and truck ren ta l1 ............................................................. - - ■ - - - - - 100.0 101.5 99.8
Motor fuel .................................................................................. 85.9 117.1 98.5 99.9 94.6 100.2 96.4 108.9 101.7 86.0 83.5Gasoline (all types) ................................................................ 85.6 117.0 98.3 99.9 94.0 100.0 95.9 108.3 101.2 85.5 83.0
Gasoline, unleaded regular7 .............................................. 83.2 115.4 96.2 97.6 91.1 97.6 93.5 106.5 98.9 82.6 80.1Gasoline, unleaded midgrade 7 8 ....................................... - - - - 100.0 105.3 100.6 112.4 105.9 90.6 88.1Gasoline, unleaded premium 7 ............................................ 90.0 118.7 101.5 103.0 98.1 103.2 98.3 109.2 102.8 89.0 86.6
Other motor fu e ls1 ................................................................. - - - - - - - - 100.0 87.7 85.9Motor vehicle parts and equipment ....................................... 100.6 101.5 103.0 102.2 100.7 101.0 101.6 101.4 100.8 100.5 100.5
Tires ........................................................................................ 98.8 98.6 100.8 100.4 98.9 101.1 101.2 101.2 98.2 97.7 97.6Vehicle accessories other than tires 1 .................................. - - - - - - - - 100.0 100.0 100.0
Motor vehicle maintenance and repair .................................. 126.9 132.8 138.8 143.9 148.3 152.6 156.6 161.4 165.7 170.9 171.8Motor vehicle body work ....................................................... 134.0 139.5 142.9 147.0 150.8 155.7 161.4 168.6 176.5 181.9 181.4Motor vehicle maintenance and servicing .......................... 122.0 126.8 133.7 136.5 139.3 141.4 144.4 148.6 152.7 157.1 158.3Motor vehicle repa ir1 ............................................................. 100.0 103.2 103.7
See footnotes at end of table.
93Digitized for FRASER http://fraser.stlouisfed.org/ Federal Reserve Bank of St. Louis
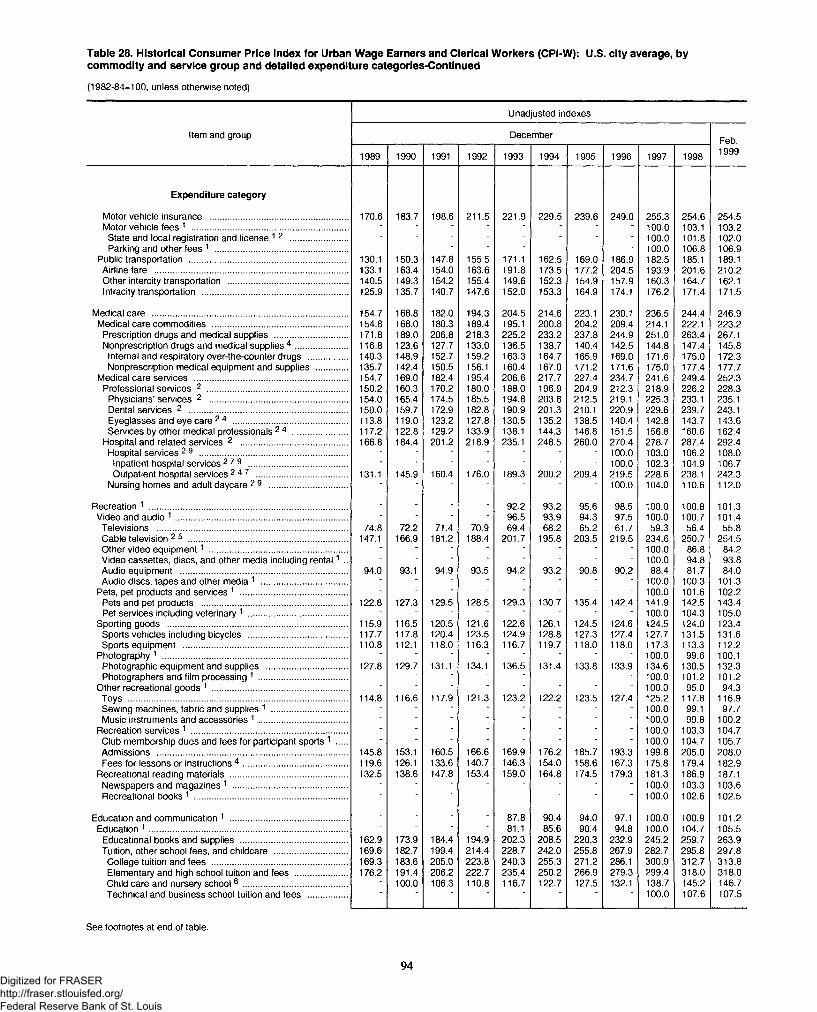
Table 28. Historical Consumer Price Index for Urban Wage Earners and Clerical Workers (CPI-W): U.S. city average, bycommodity and service group and detailed expenditure categories-Continued
(1982-84=100, unless otherwise noted)
Unadjusted indexes
Item and group December Feb.
1989 1990 1991 1992 1993 1994 1995 1996 1997 1998 1999
Expenditure category
Motor vehicle insurance ......................................................... 170.6 183.7 198.6 211.5 221.9 229.5 239.6 249.0 255.3 254.6 254.5Motor vehicle fees 1 ................................................................. - - - - - - - - 100.0 103.1 103.2
State and local registration and license 1 2 ........................ - - - - - - - - 100.0 101.8 102.0Parking and other fees 1 ....................................................... - - - - - - - - 100.0 106.8 106.9
Public transportation .................................................................. 130.1 150.3 147.8 155.5 171.1 162.5 169.0 186.9 182.5 185.1 189.1Airline fare ................................................................................. 133.1 163.4 154.0 163.6 191.8 173.5 177.2 204.5 193.9 201.6 210.2Other intercity transportation .................................................. 140.5 149.3 154.2 155.4 149.6 152.3 154.9 157.9 160.3 164.7 162.1Intracity transportation ............................................................. 125.9 135.7 140.7 147.6 152.0 153.3 164.9 174.1 176.2 171.4 171.5
Medical care .................................................................................. 154.7 168.8 182.0 194.3 204.5 214.6 223.1 230.1 236.5 244.4 246.9Medical care commodities ........................................................ 154.8 168.0 180.3 189.4 195.1 200.8 204.2 209.4 214.1 222.1 223.2
Prescription drugs and medical supplies .............................. 171.8 189.0 206.8 218.3 225.2 233.2 237.8 244.9 251.0 263.4 267.1Nonprescription drugs and medical supplies 4 ...................... 116.8 123.6 127.7 133.0 136.5 138.7 140.4 142.5 144.8 147.4 145.8
Internal and respiratory over-the-counter drugs ................ 140.3 148.9 152.7 159.2 163.3 164.7 165.9 169.0 171.6 175.0 172.3Nonprescription medical equipment and supplies ............. 135.7 142.4 150.5 156.1 160.4 167.0 171.2 171.6 175.0 177.4 177.7
Medical care services ................................................................ 154.7 169.0 182.4 195.4 206.6 217.7 227.4 234.7 241.6 249.4 252.3Professional services 2 .......................................................... 150.2 160.3 170.2 180.0 188.0 196.9 204.9 212.3 218.9 226.2 228.3
Physicians’ services 2 .......................................................... 154.0 165.4 174.5 185.5 194.8 203.6 212.5 219.1 225.3 233.1 235.1Dental services 2 .................................................................. 150.0 159.7 172.9 182.8 190.9 201.3 210.1 220.9 229.6 239.7 243.1Eyeglasses and eye care 2 4 ................................................ 113.8 119.0 123.2 127.8 130.5 135.2 138.5 140.4 142.8 143.7 143.6Services by other medical professionals 2 4 ....................... 117.2 122.8 129.2 133.9 138.1 144.3 146.8 151.5 156.8 160.6 162.4
Hospital and related services 2 ............................................. 166.8 184.4 201.2 218.9 235.1 248.5 260.0 270,4 278.7 287.4 292.4Hospital services 2 9 .............................................................. - - - - - - 100.0 103.0 106.2 108.0
Inpatient hospital services2 79 ......................................... - - - - - 100.0 102.3 104.9 106.7Outpatient hospital services2 4 7 ...................................... 131.1 145.9 160.4 176.0 189.3 200.2 209.4 219.5 228.6 238.1 242.3
Nursing homes and adult daycare 2 9 ................................. ■ ■ ' ' ' " ' 100.0 104.0 110.6 112.0
Recreation 1 ................................................................................... - - - - 92.2 93.2 95.6 98.5 100.0 100.8 101.3Video and audio 1 ........................................................................ - - - - 96.5 93.9 94.3 97.5 100.0 100.7 101.4
Televisions ............................................................................... 74.8 72.2 71.4 70.9 69.4 68.2 65.2 61.7 59.3 56.4 55.8Cable television 2 5 .................................................................. 147.1 166.9 181.2 188.4 201.7 195.8 203.5 219.5 234.6 250.7 254.5Other video equipment1 .......................................................... - - - - - - - - 100.0 86.8 84.2Video cassettes, discs, and other media including renta l1 .. - * • ■ ■ - • - 100.0 94.8 93.8Audio equipment ...................................................................... 94.0 93.1 94.9 93.5 94.2 93.2 90.8 90.2 88.4 81.7 84.0Audio discs, tapes and other media 1 .................................... - - - - - - - - 100.0 100.3 101.3
Pets, pet products and services 1 ............................................. - - - - - - - - 100.0 101.6 102.2Pets and pet products ............................................................. 122.8 127.3 129.5 128.5 129.3 130.7 135.4 142.4 141.9 142.5 143.4Pet services including veterinary 1 .......................................... - - - - - - - - 100.0 104.3 105.0
Sporting goods ........................................................................... 115.9 116.5 120.5 121.6 122.6 126.1 124.5 124.6 124.5 124.0 123.4Sports vehicles including bicycles ......................................... 117.7 117.8 120.4 123.5 124.9 128.8 127.3 127.4 127.7 131.5 131.6Sports equipment ............. ....................................................... 110.8 112.1 118.0 116.3 116.7 119.7 118.0 118.0 117.3 113.3 112.2
Photography 1 ............................................................................. - - ■ ■ • - - - 100.0 99.6 100.1Photographic equipment and supplies .................................. 127.8 129.7 131.1 134.1 136.5 131.4 133.8 133.9 134.6 130.5 132.3Photographers and film processing 1 ..................................... - * • ■ • - - - 100.0 101.2 101.2
Other recreational goods 1 ........................................................ ■ ■ ■ ~ ■ • ■ - 100.0 95.0 94.3Toys ........................................................................................... 114.8 116.6 117.9 121.3 123.2 122.2 123.5 127.4 125.2 117.8 116.9Sewing machines, fabric and supplies 1 ............................... - - - - - - - - 100.0 99.1 97.7Music instruments and accessories 1 ..................................... - - ■ ■ • - - - 100.0 99.8 100.2
Recreation services 1 ................................................................. - - - - - - - - 100.0 103.3 104.7Club membership dues and fees for participant sports 1 .... - - - - - - - - 100.0 104.7 105.7Admissions ............................................................................... 145.8 153.1 160.5 166.6 169.9 176.2 185.7 193.3 199.8 205.0 208.0Fees for lessons or instructions 4 ........................................... 119.6 126.1 133.6 140.7 146.3 154.0 158.6 167.3 175.8 179.4 182.9
Recreational reading materials ................................................. 132.5 138.6 147.8 153.4 159.0 164.8 174.5 179.3 181.3 186.9 187.1Newspapers and magazines 1 ................................................ - - * - * - - - 100.0 103.3 103.6Recreational books 1 ................................................................ 100.0 102.6 102.5
Education and communication 1 ................................................. - - - - 87.8 90.4 94.0 97.1 100.0 100.9 101.2Education 1 ................................................................................... - - - - 81.1 85.6 90.4 94.8 100.0 104.7 105.5
Educational books and supplies ............................................. 162.9 173.9 184.4 194.9 202.3 208.5 220.3 232.9 245.2 259.7 263.9Tuition, other school fees, and childcare .............................. 169.6 182.7 199.4 214.4 228.7 242.0 255.8 267.9 282.7 295.8 297.8
College tuition and fees ........................................................ 169.3 183.6 205.0 223.8 240.3 255.3 271.2 286.1 300.9 312.7 313.8Elementary and high school tuition and fees ................ ..... 176.2 191.4 206.2 222.7 235.4 250.2 266.9 279.3 299.4 318.0 318.0Child care and nursery school6 ............................................ - 100.0 106.3 110.8 116.7 122.7 127.5 132.1 138.7 145.2 146.7Technical and business school tuition and fees ................ 100.0 107.6 107.5
See footnotes at end of table.
94Digitized for FRASER http://fraser.stlouisfed.org/ Federal Reserve Bank of St. Louis
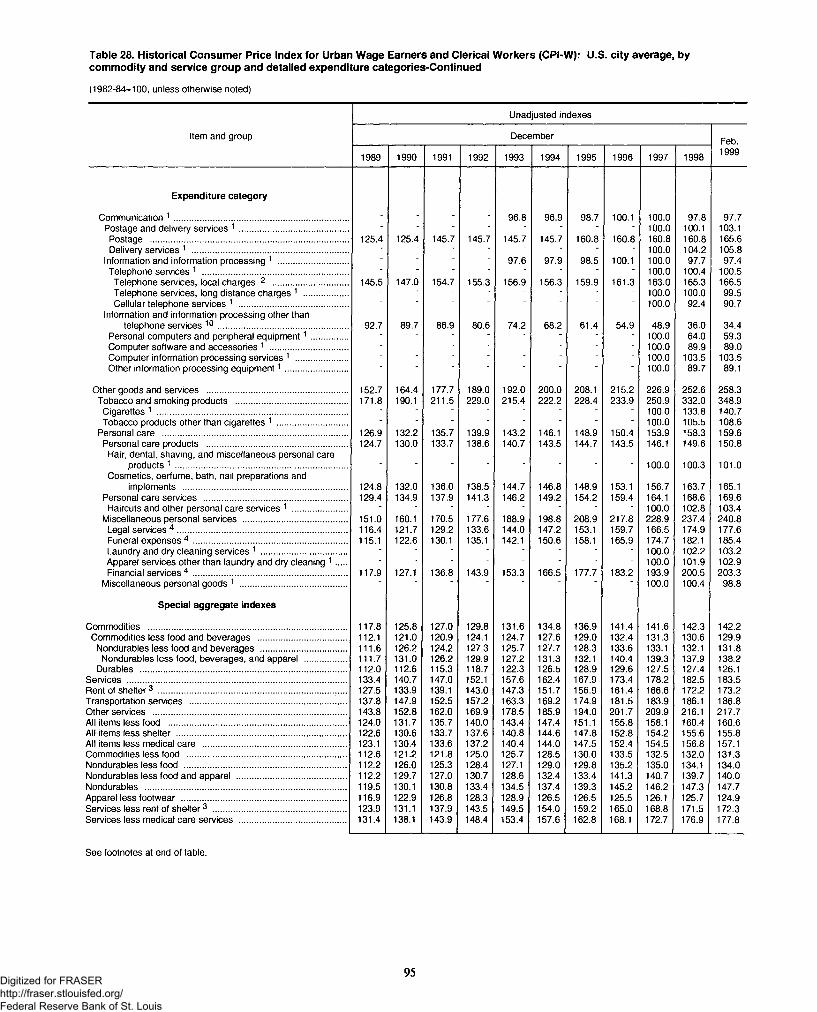
Table 28. Historical Consumer Price Index for Urban Wage Earners and Clerical Workers (CPI-W): U.S. city average, bycommodity and service group and detailed expenditure categories-Continued
(1982-84=100, unless otherwise noted)
Unadjusted indexes
Item and group December Feb.
1989 1990 1991 1992 1993 1994 1995 1996 1997 1998 1999
Expenditure category
Communication 1 ......................................................................... - - - - 96.8 96.9 98.7 100.1 100.0 97.8 97.7Postage and delivery services 1 .............................................. - - - - - - - - 100.0 100.1 103.1
Postage .................................................................................. 125.4 125.4 145.7 145.7 145.7 145.7 160.8 160.8 160.8 160.8 165.6Delivery services 1 ................................................................. - - - - - - - - 100.0 104.2 105.8
Information and information processing 1 ............................. - ■ - - 97.6 97.9 98.5 100.1 100.0 97.7 97.4Telephone services 1 ............................................................. - - - - - - - - 100.0 100.4 100.5
Telephone services, local charges 2 ............................... 145.5 147.0 154.7 155.3 156.9 156.3 159.9 161.3 163.0 165.3 166.5Telephone services, long distance charges 1 .................. - - - - - - - - 100.0 100.0 99.5Cellular telephone services 1 ............................................. - ■ - - - - - - 100.0 92.4 90.7
Information and information processing other thantelephone services 1 0 ...................................................... 92.7 89.7 86.9 80.6 74.2 68.2 61.4 54.9 48.9 36.0 34.4
Personal computers and peripheral equipment1 ............... - - - - - - - - 100.0 64.0 59.3Computer software and accessories 1 ................................ ■ ■ ■ ■ ■ * ■ ■ 100.0 89.9 89.0Computer information processing services 1 ...................... - - - - - - - - 100.0 103.5 103.5Other information processing equipment1 .......................... 100.0 89.7 89.1
Other goods and services ........................................................... 152.7 164.4 177.7 189.0 192.0 200.0 208.1 215.2 226.9 252.6 258.3Tobacco and smoking products ............................................... 171.8 190.1 211.5 229.0 215.4 222.2 228.4 233.9 250.9 332.0 348.9
Cigarettes 1 ............................................................................... - - - - - - - - 100.0 133.8 140.7Tobacco products other than cigarettes 1 ............................. - ■ ■ ■ • - - • 100.0 105.5 108.6
Personal care ............................................................................. 126.9 132.2 135.7 139.9 143.2 146.1 148.9 150.4 153.9 158.3 159.6Personal care products ........................................................... 124.7 130.0 133.7 138.6 140.7 143.5 144.7 143.5 146.1 149.6 150.8
Hair, dental, shaving, and miscellaneous personal careproducts 1 ........................................................................ - - - - - - - - 100.0 100.3 101.0
Cosmetics, perfume, bath, nail preparations andimplements .................................................................... 124.8 132.0 136.0 138.5 144.7 146.8 148.9 153.1 156.7 163.7 165.1
Personal care services ............................................................ 129.4 134.9 137.9 141.3 146.2 149.2 154.2 159.4 164.1 168.6 169.6Haircuts and other personal care services 1 ....................... - - - - - - - - 100.0 102.8 103.4
Miscellaneous personal services ........................................... 151.0 160.1 170.5 177.6 188.9 198.8 208.9 217.8 228.9 237.4 240.8Legal services 4 ....................................................................... 116.4 121.7 129.2 133.6 144.0 147.2 153.1 159.7 166.5 174.9 177.6Funeral expenses 4 ................................................................ 115.1 122.6 130.1 135.1 142.1 150.6 158.1 165.9 174.7 182.1 185.4Laundry and dry cleaning services 1 .................................... - - - - - - - - 100.0 102.2 103.2Apparel services other than laundry and dry cleaning 1 .... - ■ - - - - - - 100.0 101.9 102.9Financial services 4 ................................................................ 117.9 127.1 136.8 143.9 153.3 166.5 177.7 183.2 193.9 200.5 203.3
Miscellaneous personal goods 1 ............................................ ‘ ' ' ' " ' ' ' 100.0 100.4 98.8
Special aggregate indexes
Commodities ................................................................................... 117.8 125.8 127.0 129.8 131.6 134.8 136.9 141.4 141.6 142.3 142.2Commodities less food and beverages ..................................... 112.1 121.0 120.9 124.1 124.7 127.6 129.0 132.4 131.3 130.6 129.9
Nondurables less food and beverages .................................... 111.6 126.2 124.2 127.3 125.7 127.7 128.3 133.6 133.1 132.1 131.8Nondurables less food, beverages, and apparel ................. 111.7 131.0 126.2 129.9 127.2 131.3 132.1 140.4 139.3 137.9 138.2
Durables ...................................................................................... 112.0 112.6 115.3 118.7 122.3 126.5 128.9 129.6 127.5 127.4 126.1Services ........................................................................................... 133.4 140.7 147.0 152.1 157.6 162.4 167.9 173.4 178.2 182.5 183.5Rent of shelter3 .............................................................................. 127.5 133.9 139.1 143.0 147.3 151.7 156.9 161.4 166.6 172.2 173.2Transportation services ................................................................. 137.8 147.9 152.5 157.2 163.3 169.2 174.9 181.5 183.9 186.1 186.8Other services ................................................................................. 143.8 152.8 162.0 169.9 178.5 185.9 194.0 201.7 209.9 216.1 217.7All items less food .......................................................................... 124.0 131.7 135.7 140.0 143.4 147.4 151.1 155.8 158.1 160.4 160.6All items less shelter ....................................................................... 122.6 130.6 133.7 137.6 140.8 144.6 147.8 152.8 154.2 155.6 155.8All items less medical care ............................................................ 123.1 130.4 133.6 137.2 140.4 144.0 147.5 152.4 154.5 156.8 157.1Commodities less food .................................................................. 112.6 121.2 121.8 125.0 125.7 128.5 130.0 133.5 132.5 132.0 131.3Nondurables less food ................................................................... 112.2 126.0 125.3 128.4 127.1 129.0 129.8 135.2 135.0 134.1 134.0Nondurables less food and apparel .............................................. 112.2 129.7 127.0 130.7 128.6 132.4 133.4 141.3 140.7 139.7 140.0Nondurables .................................................................................... 119.5 130.1 130.8 133.4 134.5 137.4 139.3 145.2 146.2 147.3 147.7Apparel less footwear ..................................................................... 116.9 122.9 126.8 128.3 128.9 126.5 126.5 125.5 126.1 125.7 124.9Services less rent of shelter3 ....................................................... 123.9 131.1 137.9 143.5 149.5 154.0 159.2 165.0 168.8 171.5 172.3Services less medical care services ............................................ 131.4 138.1 143.9 148.4 153.4 157.6 162.8 168.1 172.7 176.9 177.8
See footnotes at end of table.
95Digitized for FRASER http://fraser.stlouisfed.org/ Federal Reserve Bank of St. Louis
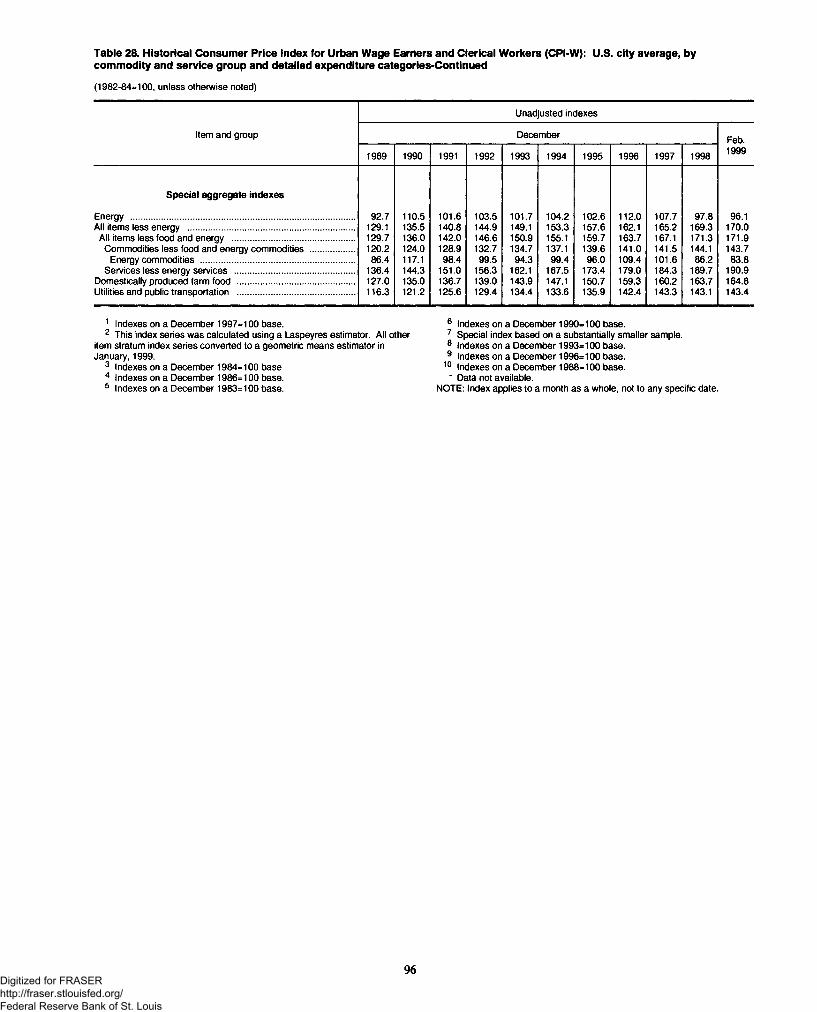
Table 28. Historical Consumer Price Index for Urban Wage Earners and Clerical Workers (CPI-W): U.S. city average, bycommodity and service group and detailed expenditure categories-Continued
(1982-84=100, unless otherwise noted)
Unadjusted indexes
Item and group December Feb.
1989 1990 1991 1992 1993 1994 1995 1996 1997 1998 1999
Special aggregate indexes
Energy ............................................................................................. 92.7 110.5 101.6 103.5 101.7 104.2 102.6 112.0 107.7 97.8 96.1All items less energy ..................................................................... 129.1 135.5 140.8 144.9 149.1 153.3 157.6 162.1 165.2 169.3 170.0
All items less food and energy ................................................... 129.7 136.0 142.0 146.6 150.9 155.1 159.7 163.7 167.1 171.3 171.9Commodities less food and energy commodities .................. 120.2 124.0 128.9 132.7 134.7 137.1 139.6 141.0 141.5 144.1 143.7
Energy commodities ................................................................ 86.4 117.1 98.4 99.5 94.3 99.4 96.0 109.4 101.6 86.2 83.8Services less energy services .................................................. 136.4 144.3 151.0 156.3 162.1 167.5 173.4 179.0 184.3 189.7 190.9
Domestically produced farm food ................................................. 127.0 135.0 136.7 139.0 143.9 147.1 150.7 159.3 160.2 163.7 164.8Utilities and public transportation ................................................. 116.3 121.2 125.6 129.4 134.4 133.6 135.9 142.4 143.3 143.1 143.4
1 Indexes on a December 1997=100 base.2 This index series was calculated using a Laspeyres estimator. All other
item stratum index series converted to a geometric means estimator in January, 1999.
3 Indexes on a December 1984=100 base4 Indexes on a December 1986=100 base.5 Indexes on a December 1983=100 base.
6 Indexes on a December 1990=100 base.7 Special index based on a substantially smaller sample.8 Indexes on a December 1993=100 base.9 Indexes on a December 1996=100 base.
10 Indexes on a December 1988=100 base.* Data not available.
NOTE: Index applies to a month as a whole, not to any specific date.
96Digitized for FRASER http://fraser.stlouisfed.org/ Federal Reserve Bank of St. Louis
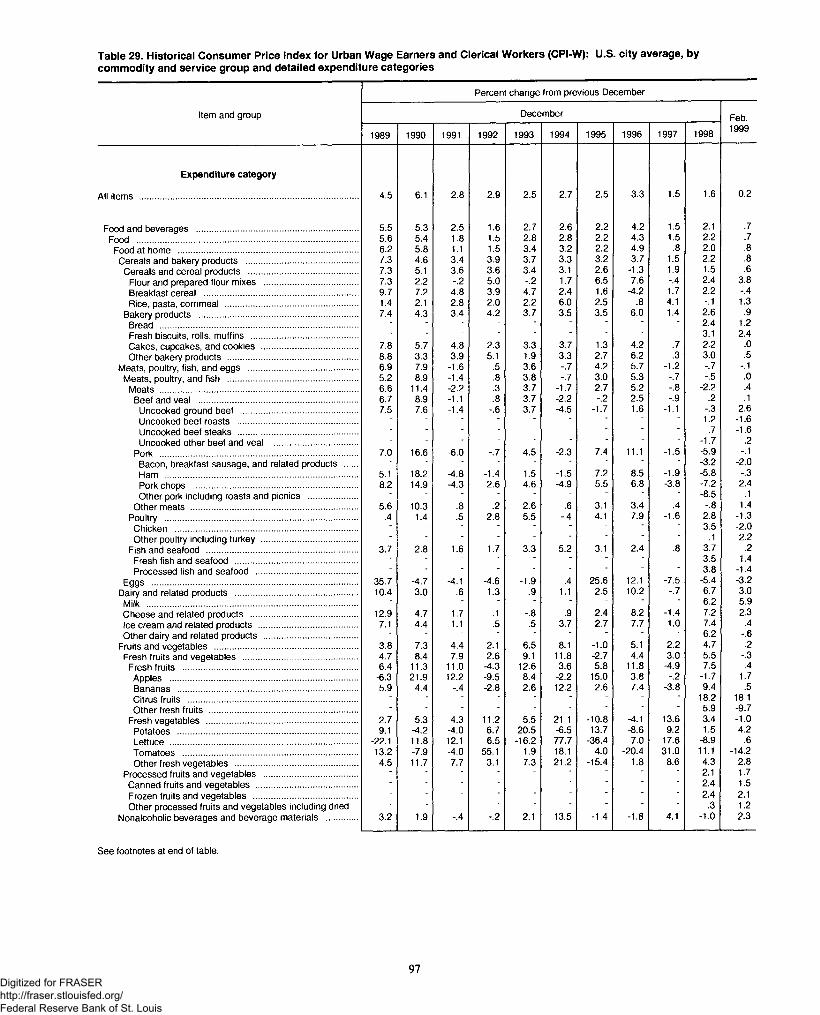
Table 29. Historical Consumer Price Index for Urban Wage Earners and Clerical Workers (CPI-W): U.S. city average, bycommodity and service group and detailed expenditure categories
Percent change from previous December
Item and group December Feb.
1989 1990 1991 1992 1993 1994 1995 1996 1997 1998 1999
Expenditure category
All items ........................................................................................... 4.5 6.1 2.8 2.9 2.5 2.7 2.5 3.3 1.5 1.6 0.2
Food and beverages ................................................................... 5.5 5.3 2.5 1.6 2.7 2.6 2.2 4.2 1.5 2.1 .7Food ............................................................................................ 5.6 5.4 1.8 1.5 2.8 2.8 2.2 4.3 1.5 2.2 .7
Food at home ........................................................................... 6.2 5.8 1.1 1.5 3.4 3.2 2.2 4.9 .8 2.0 .8Cereals and bakery products ............................................... 7.3 4.6 3.4 3.9 3.7 3.3 3.2 3.7 1.5 2.2 .8
Cereals and cereal products .............................................. 7.3 5.1 3.6 3.6 3.4 3.1 2.6 -1.3 1.9 1.5 .6Flour and prepared flour mixes ....................................... 7.3 2.2 -.2 5.0 -.2 1.7 6.5 7.6 -.4 2.4 3.8Breakfast cereal ................................................................ 9.7 7.2 4.8 3.9 4.7 2.4 1.6 -4.2 1.7 2.2 -.4Rice, pasta, cornmeal ....................................................... 1.4 2.1 2.8 2.0 2.2 6.0 2.5 .8 4.1 -.1 1.3
Bakery products .................................................................. 7.4 4.3 3.4 4.2 3.7 3.5 3.5 6.0 1.4 2.6 .9Bread .................................................................................. ■ ■ ■ ' " * 2.4 1.2Fresh biscuits, rolls, muffins ............................................ ■ ■ ■ ■ ■ ■ ' ' 3.1 2.4Cakes, cupcakes, and cookies ........................................ 7.8 5.7 4.8 2.3 3.3 3.7 1.3 4.2 .7 2.2 .0Other bakery products ...................................................... 8.8 3.3 3.9 5.1 1.9 3.3 2.7 6.2 .3 3.0 .5
Meats, poultry, fish, and eggs .............................................. 6.9 7.9 -1.6 .5 3.6 -.7 4.2 5.7 -1.2 -.7 -.1Meats, poultry, and fish ...................................................... 5.2 8.9 -1.4 .8 3.8 -.7 3.0 5.3 -.7 -.5 .0
Meats .................................................................................. 6.6 11.4 -2.2 .3 3.7 -1.7 2.7 5.2 -.8 -2.2 .4Beef and veal .................................................................. 6.7 8.9 -1.1 .8 3.7 -2.2 -.2 2.5 -.9 .2 .1
Uncooked ground beef ................................................. 7.5 7.6 -1.4 -.6 3.7 -4.5 -1.7 1.6 -1.1 -.3 2.6Uncooked beef roasts .................................................. ■ - • ■ ■ ■ ■ ' 1.2 -1.6Uncooked beef steaks .................................................. ■ ■ ■ ~ ■ ■ ' ' .7 -1.6Uncooked other beef and veal .................................... - - - - * ■ ■ ■ -1.7 .2
Pork .................................................................................. 7.0 16.6 -6.0 -.7 4.5 -2.3 7.4 11.1 -1.5 -5.9 -.1Bacon, breakfast sausage, and related products ..... - - - - - • ■ ■ -3.2 -2.0Ham ................................................................................ 5.1 18.2 -4.8 -1.4 1.5 -1.5 7.2 8.5 -1.9 -5.8 -.3Pork chops .................................................................... 8.2 14.9 -4.3 2.6 4.6 -4.9 5.5 6.8 -3.8 -7.2 2.4Other pork including roasts and picnics .................... • - ■ ■ ■ ■ ' ‘ -8.5 .1
1.4Other meats ...................................................................... 5.6 10.3 .8 .2 2.6 .6 3.1 3.4 .4 -.8Poultry ................................................................................ .4 1.4 .5 2.8 5.5 -.4 4.1 7.9 -1.6 2.8 -1.3
Chicken ............................................................................ - - - ■ • - ■ ■ ‘ 3.5 -2.0Other poultry including turkey ........................................ ■ ■ ■ _ ■ ■ ' .1 2.2
Fish and seafood ............................................................... 3.7 2.8 1.6 1.7 3.3 5.2 3.1 2.4 .8 3.7 .2Fresh fish and seafood ................................................... - - - ■ * ■ - ■ ' 3.5 1.4Processed fish and seafood .......................................... - - • ■ * ■ ■ ' 3.8 -1.4
Eggs ...................................................................................... 35.7 -4.7 -4.1 -4.6 -1.9 .4 25.6 12.1 -7.5 -5.4 -3.2Dairy and related products ................................................... 10.4 3.0 .6 1.3 .9 1.1 2.5 10.2 -.7 6.7 3.0Milk ........................................................................................ ■ - ■ * ■ * " ' 6.2 5.9Cheese and related products ............................................ 12.9 4.7 1.7 .1 -.8 .9 2.4 8.2 -1.4 7.2 2.3Ice cream and related products ......................................... 7.1 4.4 1.1 .5 .5 3.7 2.7 7.7 1.0 7.4 .4Other dairy and related products ....................................... • ■ ■ ■ ■ ■ ' ' 6.2 -.6
Fruits and vegetables ............................................................ 3.8 7.3 4.4 2.1 6.5 8.1 -1.0 5.1 2.2 4.7 .2Fresh fruits and vegetables ................................................ 4.7 8.4 7.9 2.6 9.1 11.8 -2.7 4.4 3.0 5.5 -.3
Fresh fruits ......................................................................... 6.4 11.3 11.0 -4.3 12.6 3.6 5.8 11.8 -4.9 7.5 .4Apples .............................................................................. -6.3 21.9 12.2 -9.5 8.4 -2.2 15.0 3.8 -.2 -1.7 1.7Bananas ........................................................................... 5.9 4.4 -.4 -2.8 2.6 12.2 2.6 7.4 -3.8 9.4 .5Citrus fruits ....................................................................... - - - - - - - - ■ 18.2 18.1Other fresh fruits .............................................................. - - - - ■ * ■ ■ ■ 5.9 -9.7
Fresh vegetables ............................................................... 2.7 5.3 4.3 11.2 5.5 21.1 -10.8 -4.1 13.6 3.4 -1.0Potatoes ........................................................................... 9.1 -4.2 -4.0 6.7 20.5 -6.5 13.7 -8.6 9.2 1.5 4.2Lettuce .............................................................................. -22.1 11.8 12.1 6.5 -16.2 77.7 -36.4 7.0 17.6 -8.9 .6Tomatoes ......................................................................... 13.2 -7.9 -4.0 55.1 1.9 18.1 4.0 -20.4 31.0 11.1 -14.2Other fresh vegetables ................................................... 4.5 11.7 7.7 3.1 7.3 21.2 -15.4 1.8 8.6 4.3 2.8
Processed fruits and vegetables ....................................... ■ • ■ ■ ■ * ' * ' 2.1 1.7Canned fruits and vegetables .......................................... ■ ■ ■ ■ ■ * ‘ ' ' 2.4 1.5Frozen fruits and vegetables ........................................... ■ ■ - ■ ■ ‘ ' 2.4 2.1Other processed fruits and vegetables including dried ■ ■ ■ * ■ ■ ' ' .3 1.2
Nonalcoholic beverages and beverage materials ............. 3.2 1.9 -.4 -.2 2.1 13.5 -1.4 -1.8 4.1 -1.0 2.3
See footnotes at end of table.
97Digitized for FRASER http://fraser.stlouisfed.org/ Federal Reserve Bank of St. Louis
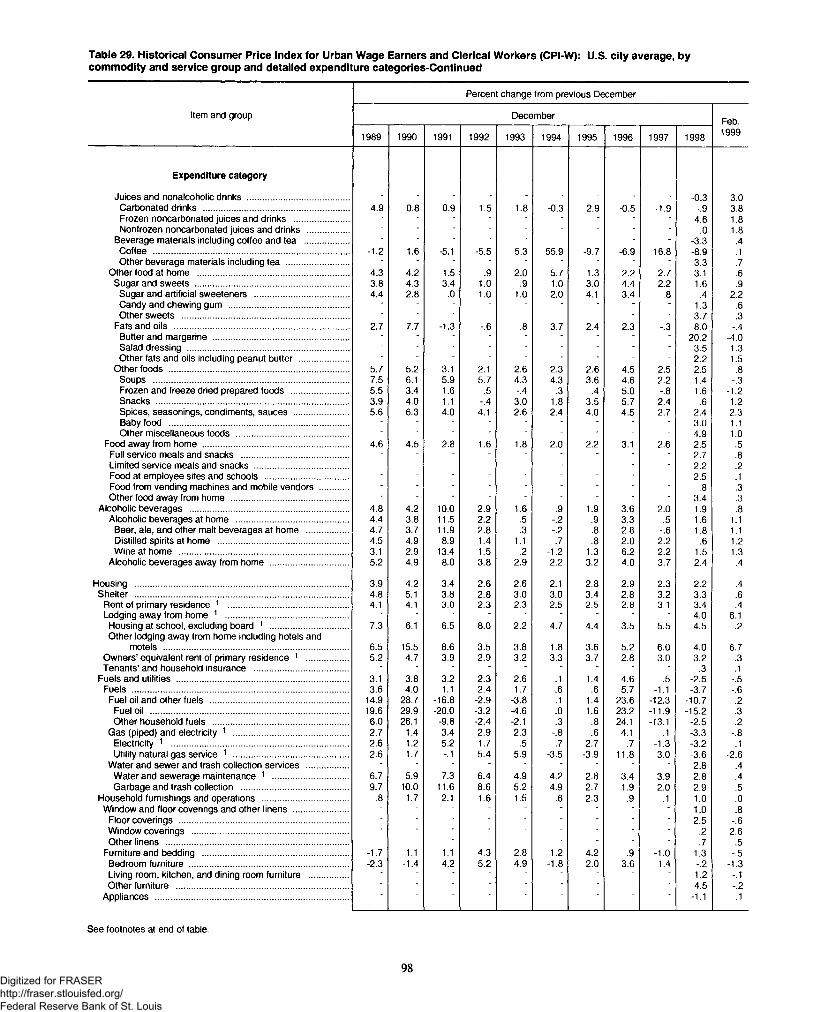
Table 29. Historical Consumer Price Index for Urban Wage Earners and Clerical Workers (CPI-W): U.S. city average, bycommodity and service group and detailed expenditure categories-Continued
Percent change from previous December
Item and group December Feb.
1989 1990 1991 1992 1993 1994 1995 1996 1997 1998 1999
Expenditure category
Juices and nonalcoholic drinks .......................................... - - - - - - - - - -0.3 3.0Carbonated drinks ............................................................. 4.9 0.8 0.9 1.5 1.8 -0.3 2.9 -0.5 -1.9 -.9 3.8Frozen noncarbonated juices and drinks ....................... - - - - - - - - - 4.6 1.8Nonfrozen noncarbonated juices and drinks ................. - - - - - - - - - .0 1.8
Beverage materials including coffee and tea .................. - - - - - - - - - -3.3 .4Coffee .................................................................................. -1.2 1.6 -5.1 -5.5 5.3 55.9 -9.7 -6.9 16.8 -8.9 .1Other beverage materials including tea .......................... - - - - - - - - - 3.3 .7
Other food at home ............................................................... 4.3 4.2 1.5 .9 2.0 5.7 1.3 2.2 2.7 3.1 .6Sugar and sweets ................................................................ 3.8 4.3 3.4 1.0 .9 1.0 3.0 4.4 2.2 1.6 .9
Sugar and artificial sweeteners ....................................... 4.4 2.8 .0 1.0 1.0 2.0 4.1 3.4 .8 .4 2.2Candy and chewing gum .................................................. - - - - - - - - - 1.3 .6Other sweets ...................................................................... - - - - - - - - 3.7 .3
Fats and oils ......................................................................... 2.7 7.7 -1.3 -.6 .8 3.7 2.4 2.3 -.3 8.0 -.4Butter and margarine ......................................................... - - - - - - - - - 20.2 -4.0Salad dressing ................................................................... - - - - - - - - - 3.5 1.3Other fats and oils including peanut butter ..................... - - - - - - - - - 2.2 1.5
Other foods ........................................................................... 5.7 5.2 3.1 2.1 2.6 2.3 2.6 4.5 2.5 2.5 .8Soups .................................................................................. 7.5 6.1 5.9 5.7 4.3 4.3 3.6 4.6 2.2 1.4 -.3Frozen and freeze dried prepared foods ........................ 5.5 3.4 1.6 .5 -.4 .3 .4 5.0 -.8 1.6 -1.2Snacks ................................................................................ 3.9 4.0 1.1 -.4 3.0 1.8 3.5 5.7 2.4 .6 1.2Spices, seasonings, condiments, sauces ....................... 5.6 6.3 4.0 4.1 2.6 2.4 4.0 4.5 2.7 2.4 2.3Baby food ........................................................................... - - - - - - - - - 3.0 1.1Other miscellaneous foods ............................................... - - - - - - - - 4.9 1.0
Food away from home ............................................................. 4.6 4.5 2.8 1.6 1.8 2.0 2.2 3.1 2.6 2.5 .5Full service meals and snacks ............................................. - - - - - - - - - 2.7 .8Limited service meals and snacks ....................................... - - - - - - 2.2 .2Food at employee sites and schools ................................... - - - - - - - - 2.5 .1Food from vending machines and mobile vendors ............ - - - - - - .8 .3Other food away from home ................................................. - - - - - - - - - 3.4 .3
Alcoholic beverages .................................................................. 4.8 4.2 10.0 2.9 1.6 .9 1.9 3.6 2.0 1.9 .8Alcoholic beverages at home ............................................... 4.4 3.8 11.5 2.2 .5 -.2 .9 3.3 .5 1.6 1.1
Beer, ale, and other malt beverages at home ................. 4.7 3.7 11.9 2.8 .3 -.2 .8 2.8 -.6 1.8 1.1Distilled spirits at home ...................................................... 4.5 4.9 8.9 1.4 1.1 .7 .8 2.0 2.2 .6 1.2Wine at home ...................................................................... 3.1 2.9 13.4 1.5 .2 -1.2 1.3 6.2 2.2 1.5 1.3
Alcoholic beverages away from home ................................. 5.2 4.9 8.0 3.8 2.9 2.2 3.2 4.0 3.7 2.4 .4
Housing ......................................................................................... 3.9 4.2 3.4 2.6 2.6 2.1 2.8 2.9 2.3 2.2 .4Shelter ......................................................................................... 4.8 5.1 3.8 2.8 3.0 3.0 3.4 2.8 3.2 3.3 .6
Rent of primary residence 1 .................................................. 4.1 4.1 3.0 2.3 2.3 2.5 2.5 2.8 3.1 3.4 .4Lodging away from home 1 ................................................... - - - - - - - - - 4.0 6.1Housing at school, excluding board 1 ................................. 7.3 6.1 6.5 8.0 2.2 4.7 4.4 3.5 5.5 4.5 .2Other lodging away from home including hotels and
motels ............................................................................. 6.5 15.5 8.6 3.5 3.8 1.8 3.6 5.2 6.0 4.0 6.7Owners’ equivalent rent of primary residence 1 ................. 5.2 4.7 3.9 2.9 3.2 3.3 3.7 2.8 3.0 3.2 .3Tenants’ and household insurance ....................................... - - - - - - - - - .3 .1
Fuels and utilities ........................................................................ 3.1 3.8 3.2 2.3 2.6 .1 1.4 4.6 .5 -2.5 -.5Fuels .......................................................................................... 3.6 4.0 1.1 2.4 1.7 -.6 .6 5.7 -1.1 -3.7 -.6
Fuel oil and other fuels .......................................................... 14.9 28.7 -16.8 -2.9 -3.8 .1 1.4 23.6 -12.3 -10.7 .2Fuel oil ................................................................................... 19.6 29.9 -20.0 -3.2 -4.6 .0 1.6 23.2 -11.9 -15.2 .3Other household fuels ......................................................... 6.0 26.1 -9.8 -2.4 -2.1 .3 .8 24.1 -13.1 -2.5 .2
Gas (piped) and electricity 1 ................................................ 2.7 1.4 3.4 2.9 2.3 -.8 .6 4.1 .1 -3.3 -.8Electricity 1 .................. ....................................................... 2.6 1.2 5.2 1.7 .5 .7 2.7 .7 -1.3 -3.2 .1Utility natural gas service 1 ................................................ 2.6 1.7 -.1 5.4 5.9 -3.5 -3.9 11.8 3.0 -3.6 -2.6
Water and sewer and trash collection services ................. - - - - - - - - - 2.8 .4Water and sewerage maintenance 1 ............................... 6.7 5.9 7.3 6.4 4.9 4.2 2.8 3.4 3.9 2.8 .4Garbage and trash collection ............................................. 9.7 10.0 11.6 8.6 5.2 4.9 2.7 1.9 2.0 2.9 .5
Household furnishings and operations .................................... .8 1.7 2.1 1.6 1.5 .6 2.3 .9 .1 1.0 .0Window and floor coverings and other linens ....................... - - - - - - - - - 1.0 .8
Floor coverings ...................................................................... ■ • ■ ■ • - - - - 2.5 -.6Window coverings ................................................................. ■ * ■ ■ ■ • ■ ■ ■ .2 2.6Other linens ............................................................................ - - • ■ ■ - - - - .7 .5
Furniture and bedding ............................................................. -1.7 1.1 1.1 4.3 2.8 1.2 4.2 .9 -1.0 1.3 -.5Bedroom furniture .................................................................. -2.3 -1.4 4.2 5.2 4.9 -1.8 2.0 3.6 1.4 -.2 -1.3Living room, kitchen, and dining room furniture ................ - - - - - - - - - 1.2 -.1Other furniture ........................................................................ - - - - - - - - 4.5 -.2
Appliances ................................................................................. -1.1 .1
See footnotes at end of table.
98Digitized for FRASER http://fraser.stlouisfed.org/ Federal Reserve Bank of St. Louis
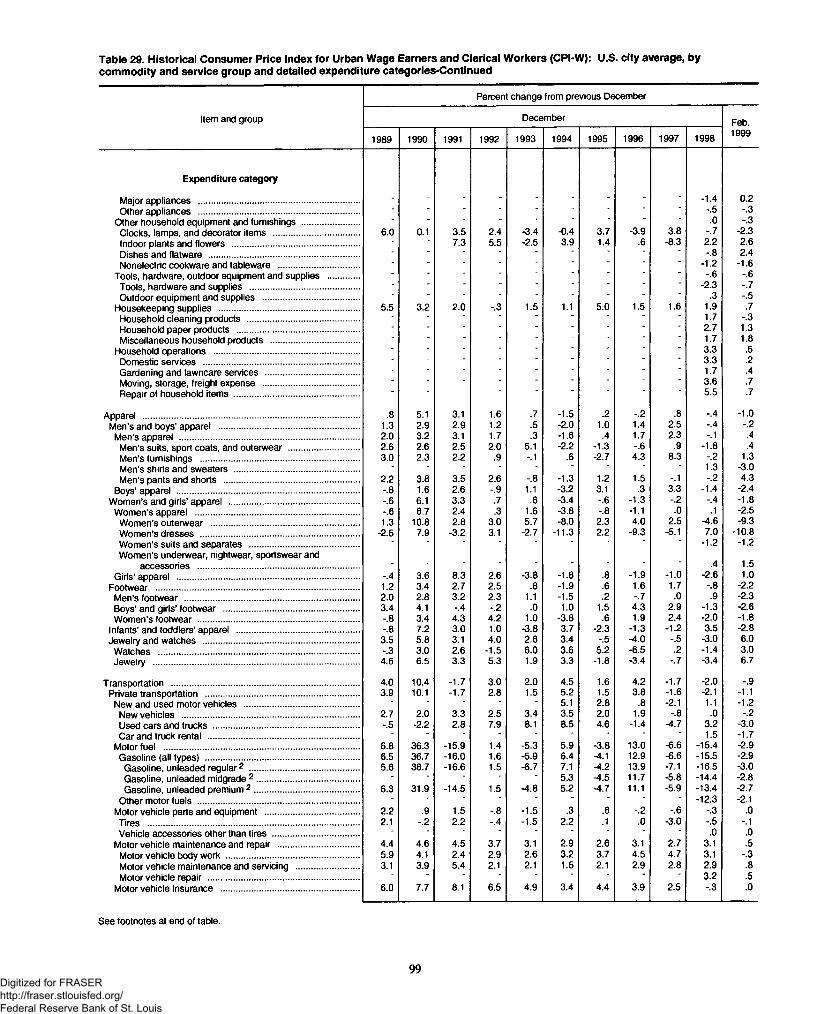
Table 29. Historical Consumer Price Index for Urban Wage Earners and Clerical Workers (CPI-W): U.S. city average, bycommodity and service group and detailed expenditure categories-Continued
Item and group
Percent change from previous December
December Feb.19991989 1990 1991 1992 1993 1994 1995 1996 1997 1998
Expenditure category
Major appliances ......................................................... - - - - - - - - - -1.4 0.2Other appliances ......................................................... ..... ■ ' ‘ ' -.5 -.3
Other household equipment and furnishings ................. ■ ■ ' " ‘ .0 -.3Clocks, lamps, and decorator items ............................ ..... 6.0 0.1 3.5 2.4 -3.4 -0.4 3.7 -3.9 3.8 -.7 -2.3Indoor plants and flowers ............................................ - - 7.3 5.5 -2.5 3.9 1.4 .6 -8.3 2.2 2.6Dishes and flatware ..................................................... ..... - * ■ ■ ■ ■ ■ ■ ‘ -.8 2.4Nonelectric cookware and tableware .......................... ..... • • * ■ ■ ■ ■ ■ ‘ -1.2 -1.6
Tools, hardware, outdoor equipment and supplies ...... ..... ■ ■ * ■ ■ ■ ■ ■ " -.6 -.6Tools, hardware and supplies ..................................... ■ ■ ■ ■ ■ " ‘ -2.3 -.7Outdoor equipment and supplies ................................ ■ ■ ■ ■ ■ ' ' " .3 -.5
Housekeeping supplies ................................................. 5.5 3.2 2.0 -.3 1.5 1.1 5.0 1.5 1.6 1.9 .7Household cleaning products ...................................... ■ - ‘ ' 1.7 -.3Household paper products .......................................... ..... ■ ■ ' ' 2.7 1.3Miscellaneous household products ............................. ■ 1.7 1.8
Household operations ................................................... ..... ■ ■ ■ * ■ ‘ ' ' 3.3 .5Domestic services ....................................................... ■ ' ' ‘ 3.3 .2Gardening and lawncare services ............................... ..... ■ ■ ■ ■ ■ ‘ ■ ' 1.7 .4Moving, storage, freight expense ................................ * ■ " ‘ 3.6 .7Repair of household items ........................................... 5.5 .7
Apparel ............................................................................... .8 5.1 3.1 1.6 .7 -1.5 .2 -.2 .8 -.4 -1.0Men’s and boys’ apparel ................................................. ..... 1.3 2.9 2.9 1.2 .5 -2.0 1.0 1.4 2.5 -.4 -.2Men’s apparel ................................................................. ..... 2.0 3.2 3.1 1.7 .3 -1.6 .4 1.7 2.3 -.1 .4
Men’s suits, sport coats, and outerwear ...................... .... 2.6 2.6 2.5 2.0 5.1 -2.2 -1.3 -.6 .9 -1.8 .4Men’s furnishings ........................................................ ..... 3.0 2.3 2.2 .9 -.1 .6 -2.7 4.3 8.3 -.2 1.3Men’s shirts and sweaters ........................................... ..... - • • ■ ■ ■ ■ ■ 1.3 -3.0Men’s pants and shorts ............................................... ..... 2.2 3.8 3.5 2.6 -.8 -1.3 1.2 1.5 -.1 -.2 4.3
Boys’ apparel .................................................................. ..... -.8 1.6 2.6 -.9 1.1 -3.2 3.1 .3 3.3 -1.4 -2.4Women’s and girls’ apparel ............................................. -.6 6.1 3.3 .7 .6 -3.4 -.6 -1.3 -.2 -.4 -1.8
Women’s apparel ........................................................... -.6 6.7 2.4 .3 1.6 -3.8 -.8 -1.1 .0 .1 -2.5Women’s outerwear .................................................... 1.3 10.8 2.8 3.0 5.7 -8.0 2.3 4.0 2.5 -4.6 -9.3Women’s dresses ......................................................... .. -2.5 7.9 -3.2 3.1 -2.7 -11.3 2.2 -9.3 -5.1 7.0 -10.8Women’s suits and separates ..................................... • ■ ■ ■ ■ ■ ■ ' -1.2 -1.2Women’s underwear, nightwear, sportswear and
accessories .......................................................... .. ■ ■ ■ ■ ■ ■ " .4 1.5Girls’ apparel .................................................................. -.4 3.6 8.3 2.6 -3.8 -1.8 .8 -1.9 -1.0 -2.6 1.0
Footwear .......................................................................... 1.2 3.4 2.7 2.5 .8 -1.9 .6 1.6 1.7 -.8 -2.2Men’s footwear ............................................................... 2.0 2.8 3.2 2.3 1.1 -1.5 .2 -.7 .0 .9 -2.3Boys’ and girls’ footwear ............................................... .. 3.4 4.1 -.4 -.2 .0 1.0 1.5 4.3 2.9 -1.3 -2.6Women’s footwear .......................................................... .. -.8 3.4 4.3 4.2 1.0 -3.8 .6 1.9 2.4 -2.0 -1.8
Infants’ and toddlers’ apparel .......................................... -.8 7.2 3.0 1.0 -3.8 3.7 -2.3 -1.3 -1.2 3.5 -2.8Jewelry and watches ........................................................ .. 3.5 5.8 3.1 4.0 2.6 3.4 -.5 -4.0 -.5 -3.0 6.0
Watches ......................................................................... -.3 3.0 2.6 -1.5 6.0 3.6 5.2 -6.5 .2 -1.4 3.0Jewelry ........................................................................... ..... 4.6 6.5 3.3 5.3 1.9 3.3 -1.8 -3.4 -.7 -3.4 6.7
Transportation .................................................................... 4.0 10.4 -1.7 3.0 2.0 4.5 1.6 4.2 -1.7 -2.0 -.9Private transportation ....................................................... ..... 3.9 10.1 -1.7 2.8 1.5 5.2 1.5 3.8 -1.6 -2.1 -1.1
New and used motor vehicles ....................................... . ■ • ■ ■ ■ 5.1 2.8 .8 -2.1 1.1 -1.2New vehicles ................................................................ 2.7 2.0 3.3 2.5 3.4 3.5 2.0 1.9 -.8 .0 -.2Used cars and trucks ................................................... ..... -.5 -2.2 2.8 7.9 8.1 8.5 4.6 -1.4 -4.7 3.2 -3.0Car and truck rental ...................................................... - - * • ■ ■ ■ ■ ■ 1.5 -1.7
Motor fuel ....................................................................... 6.8 36.3 -15.9 1.4 -5.3 5.9 -3.8 13.0 -6.6 -15.4 -2.9Gasoline (all types) ....................................................... 6.5 36.7 -16.0 1.6 -5.9 6.4 -4.1 12.9 -6.6 -15.5 -2.9Gasoline, unleaded regular2 ..................................... . 5.6 38.7 -16.6 1.5 -6.7 7.1 -4.2 13.9 -7.1 -16.5 -3.0Gasoline, unleaded midgrade 2 .................................. ..... - - ■ - ■ 5.3 -4.5 11.7 -5.8 -14.4 -2.8Gasoline, unleaded premium 2 ................................... . 6.3 31.9 -14.5 1.5 -4.8 5.2 -4.7 11.1 -5.9 -13.4 -2.7
Other motor fuels .......................................................... - • • ■ ■ ■ ■ ■ ■ -12.3 -2.1Motor vehicle parts and equipment ............................... 2.2 .9 1.5 -.8 -1.5 .3 .6 -.2 -.6 -.3 .0Tires ............................................................................. 2.1 -.2 2.2 -.4 -1.5 2.2 .1 .0 -3.0 -.5 -.1Vehicle accessories other than tires ............................ ... - - - - - ■ - • ■ .0 .0
Motor vehicle maintenance and repair .......................... ... 4.4 4.6 4.5 3.7 3.1 2.9 2.6 3.1 2.7 3.1 .5Motor vehicle body work .............................................. ... 5.9 4.1 2.4 2.9 2.6 3.2 3.7 4.5 4.7 3.1 -.3Motor vehicle maintenance and sen/icing ................... 3.1 3.9 5.4 2.1 2.1 1.5 2.1 2.9 2.8 2.9 .8Motor vehicle repair ...................................................... • ■ ■ ■ ■ ■ ■ ■ ■ 3.2 .5
Motor vehicle insurance ................................................ ..... 6.0 7.7 8.1 6.5 4.9 3.4 4.4 3.9 2.5 -.3 .0
See footnotes at end of table.
99Digitized for FRASER http://fraser.stlouisfed.org/ Federal Reserve Bank of St. Louis

Table 29. Historical Consumer Price Index for Urban Wage Earners and Clerical Workers (CPI-W): U.S. city average, bycommodity and service group and detailed expenditure categories-Continued
Percent change from previous December
Item and group December Feb.1989 1990 1991 1992 1993 1994 1995 1996 1997 1998 1999
Expenditure category
Motor vehicle fees ................................................................ 3.1 0.1State and local registration and license 1 ......................... - - - - - - - - - 1.8 .2Parking and other fees ...................................................... - - - - - - - - - 6.8 .1
Public transportation ............................................................... 3.7 15.5 -1.7 5.2 10.0 -5.0 4.0 10.6 -2.4 1.4 2.2Airline fare ............................................................................ 5.2 22.8 -5.8 6.2 17.2 -9.5 2.1 15.4 -5.2 4.0 4.3Other intercity transportation ............................................... 2.7 6.3 3.3 .8 -3.7 1.8 1.7 1.9 1.5 2.7 -1.6Intracity transportation .......................................................... 1.9 7.8 3.7 4.9 3.0 .9 7.6 5.6 1.2 -2.7 .1
Medical care ............................................................................. 8.3 9.1 7.8 6.8 5.2 4.9 4.0 3.1 2.8 3.3 1.0Medical care commodities ..................................................... 8.2 8.5 7.3 5.0 3.0 2.9 1.7 2.5 2.2 3.7 .5
Prescription drugs and medical supplies ............................. 9.5 10.0 9.4 5.6 3.2 3.6 2.0 3.0 2.5 4.9 1.4Nonprescription drugs and medical supplies ....................... 5.8 5.8 3.3 4.2 2.6 1.6 1.2 1.5 1.6 1.8 -1.1
Internal and respiratory over-the-counter drugs ................ 5.3 6.1 2.6 4.3 2.6 .9 .7 1.9 1.5 2.0 -1.5Nonprescription medical equipment and supplies ............ 7.2 4.9 5.7 3.7 2.8 4.1 2.5 .2 2.0 1.4 .2
Medical care services ............................................................. 8.4 9.2 7.9 7.1 5.7 5.4 4.5 3.2 2.9 3.2 1.2Professional services 1 ........................................................ 6.5 6.7 6.2 5.8 4.4 4.7 4.1 3.6 3.1 3.3 .9
Physicians’ services 1 ...................................................... 7.2 7.4 5.5 6.3 5.0 4.5 4.4 3.1 2.8 3.5 .9Dental services 1 ............................................................... 6.5 6.5 8.3 5.7 4.4 5.4 4.4 5.1 3.9 4.4 1.4Eyeglasses and eye care 1 .............................................. 3.6 4.6 3.5 3.7 2.1 3.6 2.4 1.4 1.7 .6 -.1Services by other medical professionals 1 ....................... 5.8 4.8 5.2 3.6 3.1 4.5 1.7 3.2 3.5 2.4 1.1
Hospital and related services 1 .......................................... 11.2 10.6 9.1 8.8 7.4 5.7 4.6 4.0 3.1 3.1 1.7Hospital services 1 ............................................................ - - - - - - - 3.0 3.1 1.7
Inpatient hospital services 12 .......................................... - - - - - - - 2.3 2.5 1.7Outpatient hospital services 1 2 ....................................... 12.0 11.3 9.9 9.7 7.6 5.8 4.6 4.8 4.1 4.2 1.8
Nursing homes and adult daycare 1 ................................. ' " ' ' ' ' 4.0 6.3 1.3
Recreation ................................................................................ - - - - 1.1 2.6 3.0 1.5 .8 .5Video and audio ..................................................................... - - - - -2.7 .4 3.4 2.6 .7 .7Televisions ........................................................................... -2.1 -3.5 -1.1 -.7 -2.1 -1.7 -4.4 -5.4 -3.9 -4.9 -1.1Cable television 1 ................................................................ 3.9 13.5 8.6 4.0 7.1 -2.9 3.9 7.9 6.9 6.9 1.5Other video equipment ......................................................... - - - - - - - - - -13.2 -3.0Video cassettes, discs, and other media including rental .... - - - - - - - - -5.2 -1.1Audio equipment .................................................................. 2.3 -1.0 1.9 -1.5 .7 -1.1 -2.6 -.7 -2.0 -7.6 2.8Audio discs, tapes and other media .................................... - - - - - - - - - .3 1.0
Pets, pet products and services ............................................ - - - - - - - - - 1.6 .6Pets and pet products .......................................................... 4.3 3.7 1.7 -.8 .6 1.1 3.6 5.2 -.4 .4 .6Pet services including veterinary ......................................... - • ■ ■ ■ ■ - - 4.3 .7
Sporting goods ....................................................................... 3.0 .5 3.4 .9 .8 2.9 -1.3 .1 -.1 -.4 -.5Sports vehicles including bicycles ....................................... 4.0 .1 2.2 2.6 1.1 3.1 -1.2 .1 .2 3.0 .1Sports equipment ................................................................. 1.7 1.2 5.3 -1.4 .3 2.6 -1.4 .0 -.6 -3.4 -1.0
Photography ........................................................................... • ■ ■ * - • ■ - • -.4 .5Photographic equipment and supplies ................................ 3.5 1.5 1.1 2.3 1.8 -3.7 1.8 .1 .5 -3.0 1.4Photographers and film processing ..................................... ■ ■ ■ ■ ■ ■ ■ • ■ 1.2 .0
Other recreational goods ........................................................ ■ * ■ ■ ■ • ■ • * -5.0 -.7Toys ...................................................................................... 2.2 1.6 1.1 2.9 1.6 -.8 1.1 3.2 -1.7 -5.9 -.8Sewing machines, fabric and supplies ................................ - • ■ • - - - * ■ -.9 -1.4Music instruments and accessories .................................... ■ ■ • ■ ■ ■ ■ ■ * -.2 .4
Recreation services ................................................................ - - - - - - - - - 3.3 1.4Club membership dues and fees for participant sports ...... - - • ■ - - - - - 4.7 1.0Admissions ........................................................................... 9.8 5.0 4.8 3.8 2.0 3.7 5.4 4.1 3.4 2.6 1.5Fees for lessons or instructions ........................................... 8.1 5.4 5.9 5.3 4.0 5.3 3.0 5.5 5.1 2.0 2.0
Recreational reading materials .............................................. 4.6 4.6 6.6 3.8 3.7 3.6 5.9 2.8 1.1 3.1 .1Newspapers and magazines ............................................... - - ■ ■ • - - - ■ 3.3 .3Recreational books ............................................................... 2.6 -.1
Education and communication ................................................ - - - - - 3.0 4.0 3.3 3.0 .9 .3Education ............................................................................... - - - - - 5.5 5.6 4.9 5.5 4.7 .8
Educational books and supplies .......................................... 7.8 6.8 6.0 5.7 3.8 3.1 5.7 5.7 5.3 5.9 1.6Tuition, other school fees, and childcare ............................. 8.0 7.7 9.1 7.5 6.7 5.8 5.7 4.7 5.5 4.6 .7
College tuition and fees ...................................................... 8.4 8.4 11.7 9.2 7.4 6.2 6.2 5.5 5.2 3.9 .4Elementary and high school tuition and fees ..................... 8.8 8.6 7.7 8.0 5.7 6.3 6.7 4.6 7.2 6.2 .0Child care and nursery school ........................................... - - 6.3 4.2 5.3 5.1 3.9 3.6 5.0 4.7 1.0Technical and business school tuition and fees ................ - • ■ ■ ■ • - ■ 7.6 -.1
Communication ...................................................................... .1 1.9 1.4 -.1 -2.2 -.1
See footnotes at end of table.
100Digitized for FRASER http://fraser.stlouisfed.org/ Federal Reserve Bank of St. Louis
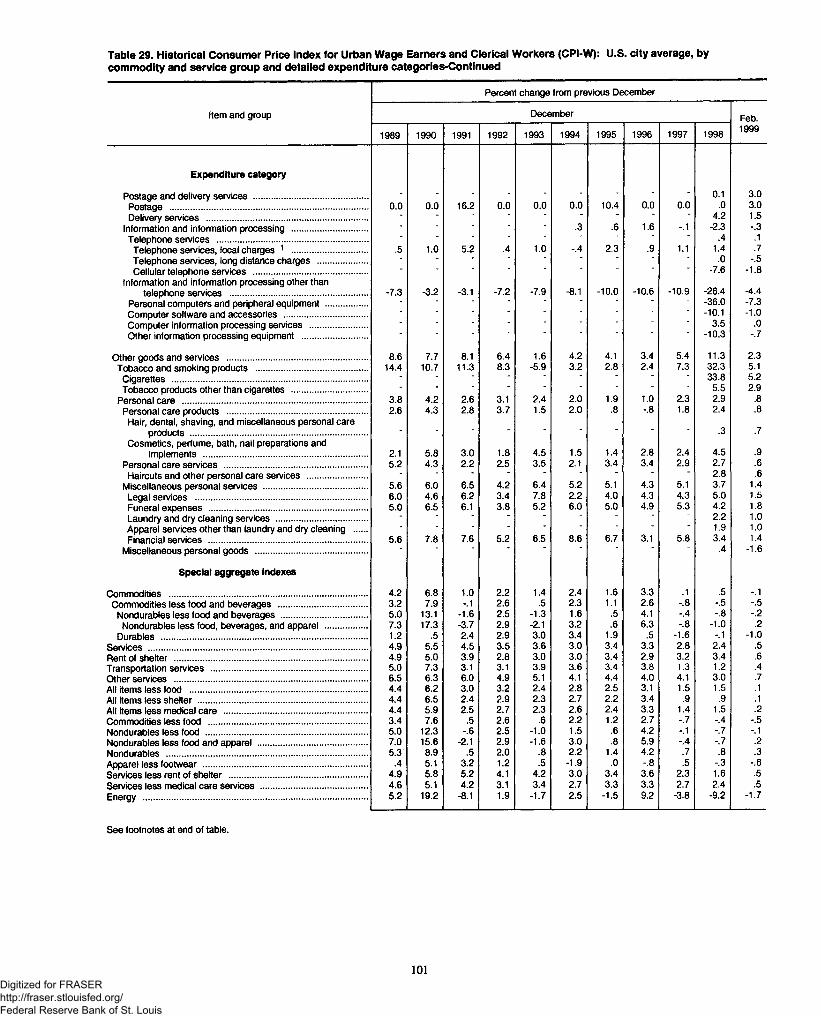
Table 29. Historical Consumer Price Index for Urban Wage Earners and Clerical Workers (CPI-W): U.S. city average, bycommodity and service group and detailed expenditure categories-Continued
Percent change from previous December
Item and group December Feb.
1989 1990 1991 1992 1993 1994 1995 1996 1997 1998 1999
Expenditure category
Postage and delivery services ............................................. - - - - - - - - - 0.1 3.0Postage .............................................................................. 0.0 0.0 16.2 0.0 0.0 0.0 10.4 0.0 0.0 .0 3.0Delivery services ................................................................ ■ ■ ■ ■ ■ ■ ■ ■ ' 4.2 1.5
Information and information processing .............................. ■ ■ ■ ■ .3 .6 1.6 -.1 -2.3 -.3Telephone sen/ices ........................................................... ■ ■ ■ ■ * '
1.1.4 .1
Telephone services, local charges 1 .............................. .5 1.0 5.2 .4 1.0 -.4 2.3 .9 1.4 .7Telephone services, long distance charges .................... ■ ■ * " .0 -.5Cellular telephone services ............................................. ■ ■ ' ' -7.6 -1.8
Information and information processing other thantelephone services ...................................................... -7.3 -3.2 -3.1 -7.2 -7.9 -8.1 -10.0 -10.6 -10.9 -26.4 -4.4
Personal computers and peripheral equipment ................. ■ * ■ ■ ■ ' ' * -36.0 -7.3Computer software and accessories ................................. ■ ■ ‘ ’ -10.1 -1.0Computer information processing sen/ices ....................... * ■ ' ' 3.5 .0Other information processing equipment .......................... -10.3 -.7
Other goods and services ....................................................... 8.6 7.7 8.1 6.4 1.6 4.2 4.1 3.4 5.4 11.3 2.3Tobacco and smoking products ............................................ 14.4 10.7 11.3 8.3 -5.9 3.2 2.8 2.4 7.3 32.3 5.1
Cigarettes ............................................................................. ■ ■ ■ ■ ' ' ' 33.8 5.2Tobacco products other than cigarettes .............................. ■ ■ ' ‘ 5.5 2.9
Personal care ......................................................................... 3.8 4.2 2.6 3.1 2.4 2.0 1.9 1.0 2.3 2.9 .8Personal care products ....................................................... 2.6 4.3 2.8 3.7 1.5 2.0 .8 -.8 1.8 2.4 .8Hair, dental, shaving, and miscellaneous personal care
.3 .7products ...................................................................... * ■ ■ ■ ' ' 'Cosmetics, perfume, bath, nail preparations and
2.8 2.4 .9implements ................................................................. 2.1 5.8 3.0 1.8 4.5 1.5 1.4 4.5Personal care services ........................................................ 5.2 4.3 2.2 2.5 3.5 2.1 3.4 3.4 2.9 2.7 .6Haircuts and other personal care services ........................ • ■ ■ ■ ■ ■ ■ ■ ' 2.8 .6
Miscellaneous personal services ......................................... 5.6 6.0 6.5 4.2 6.4 5.2 5.1 4.3 5.1 3.7 1.4Legal services .................................................................... 6.0 4.6 6.2 3.4 7.8 2.2 4.0 4.3 4.3 5.0 1.5Funeral expenses ............................................................... 5.0 6.5 6.1 3.8 5.2 6.0 5.0 4.9 5.3 4.2 1.8Laundry and dry cleaning services .................................... * ■ ■ ■ ■ ' ‘ 2.2 1.0Apparel services other than laundry and dry cleaning ..... ■ ■ ' ’ 1.9 1.0Financial services ............................................................... 5.6 7.8 7.6 5.2 6.5 8.6 6.7 3.1 5.8 3.4 1.4
Miscellaneous personal goods ............................................ .4 -1.6
Special aggregate indexes
Commodities .............................................................................. 4.2 6.8 1.0 2.2 1.4 2.4 1.6 3.3 .1 .5 -.1Commodities less food and beverages ................................... 3.2 7.9 -.1 2.6 .5 2.3 1.1 2.6 -.8 -.5 -.5
Nondurables less food and beverages .................................. 5.0 13.1 -1.6 2.5 -1.3 1.6 .5 4.1 -.4 -.8 -.2Nondurables less food, beverages, and apparel ................ 7.3 17.3 -3.7 2.9 -2.1 3.2 .6 6.3 -.8 -1.0 .2
Durables ................................................................................. 1.2 .5 2.4 2.9 3.0 3.4 1.9 .5 -1.6 -.1 -1.0Services ....................................................................................... 4.9 5.5 4.5 3.5 3.6 3.0 3.4 3.3 2.8 2.4 .5Rent of shelter ............................................................................ 4.9 5.0 3.9 2.8 3.0 3.0 3.4 2.9 3.2 3.4 .6Transportation services .............................................................. 5.0 7.3 3.1 3.1 3.9 3.6 3.4 3.8 1.3 1.2 .4Other services ............................................................................ 6.5 6.3 6.0 4.9 5.1 4.1 4.4 4.0 4.1 3.0 .7All items less food .......................................................................... 4.4 6.2 3.0 3.2 2.4 2.8 2.5 3.1 1.5 1.5 .1All items less shelter................................................................... 4.4 6.5 2.4 2.9 2.3 2.7 2.2 3.4 .9 .9 .1All items less medical care ......................................................... 4.4 5.9 2.5 2.7 2.3 2.6 2.4 3.3 1.4 1.5 .2Commodities less food .................................................................. 3.4 7.6 .5 2.6 .6 2.2 1.2 2.7 -.7 -.4 -.5Nondurables less food ................................................................ 5.0 12.3 -.6 2.5 -1.0 1.5 .6 4.2 -.1 -.7 -.1Nondurables less food and apparel ........................................... 7.0 15.6 -2.1 2.9 -1.6 3.0 .8 5.9 -.4 -.7 .2Nondurables ............................................................................... 5.3 8.9 .5 2.0 .8 2.2 1.4 4.2 .7 .8 .3Apparel less footwear ..................................................................... .4 5.1 3.2 1.2 .5 -1.9 .0 -.8 .5 -.3 -.6Services less rent of shelter ....................................................... 4.9 5.8 5.2 4.1 4.2 3.0 3.4 3.6 2.3 1.6 .5Services less medical care services .......................................... 4.6 5.1 4.2 3.1 3.4 2.7 3.3 3.3 2.7 2.4 .5Energy .............................................................................................. 5.2 19.2 -8.1 1.9 -1.7 2.5 -1.5 9.2 -3.8 -9.2 -1.7
See footnotes at end of table.
101Digitized for FRASER http://fraser.stlouisfed.org/ Federal Reserve Bank of St. Louis
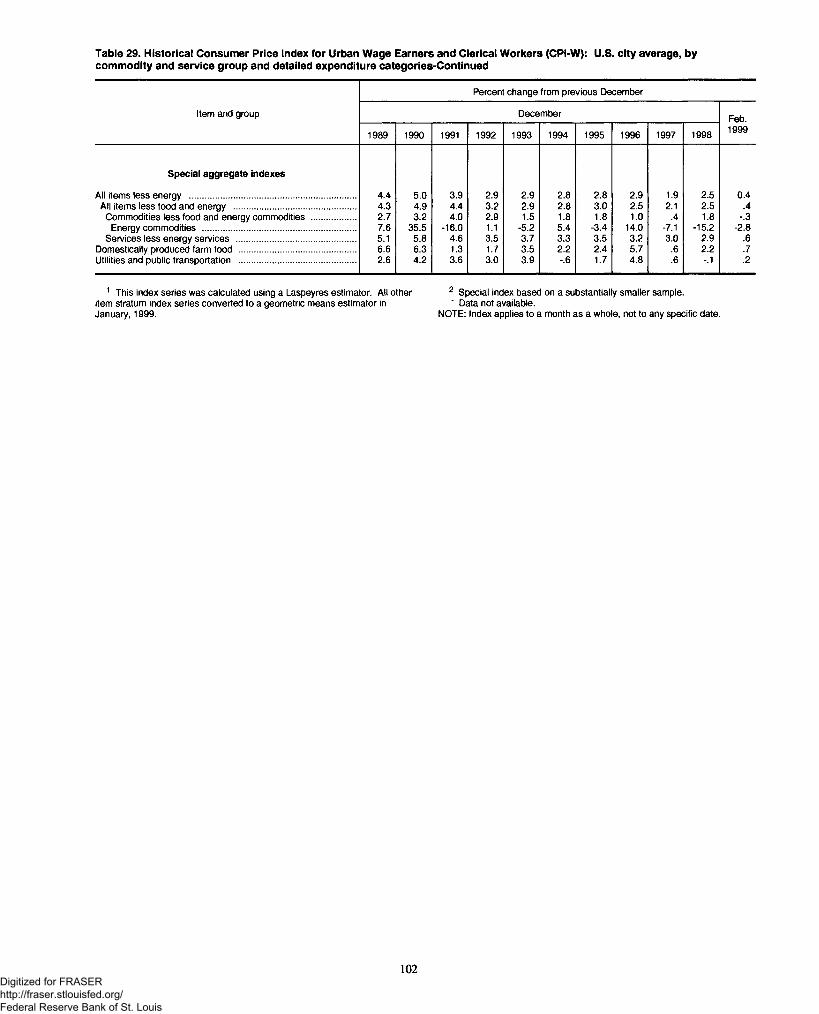
Table 29. Historical Consumer Price Index for Urban Wage Earners and Clerical Workers (CPI-W): U.S. city average, bycommodity and service group and detailed expenditure categories-Continued
Percent change from previous December
Item and group December Feb.
1989 1990 1991 1992 1993 1994 1995 1996 1997 1998 1999
Special aggregate indexes
All items less energy ..................................................................... 4.4 5.0 3.9 2.9 2.9 2.8 2.8 2.9 1.9 2.5 0.4All items less food and energy ................................................... 4.3 4.9 4.4 3.2 2.9 2.8 3.0 2.5 2.1 2.5 .4
Commodities less food and energy commodities .................. 2.7 3.2 4.0 2.9 1.5 1.8 1.8 1.0 .4 1.8 -.3Energy commodities ................................................................ 7.6 35.5 -16.0 1.1 -5.2 5.4 -3.4 14.0 -7.1 -15.2 -2.8
Services less energy services .................................................. 5.1 5.8 4.6 3.5 3.7 3.3 3.5 3.2 3.0 2.9 .6Domestically produced farm food ................................................. 6.6 6.3 1.3 1.7 3.5 2.2 2.4 5.7 .6 2.2 .7Utilities and public transportation ................................................. 2.6 4.2 3.6 3.0 3.9 -.6 1.7 4.8 .6 -.1 .2
1 This index series was calculated using a Laspeyres estimator. All other 2 Special index based on a substantially smaller sample,item stratum index series converted to a geometric means estimator in ' Data not available.January, 1999. NOTE: Index applies to a month as a whole, not to any specific date.
102Digitized for FRASER http://fraser.stlouisfed.org/ Federal Reserve Bank of St. Louis
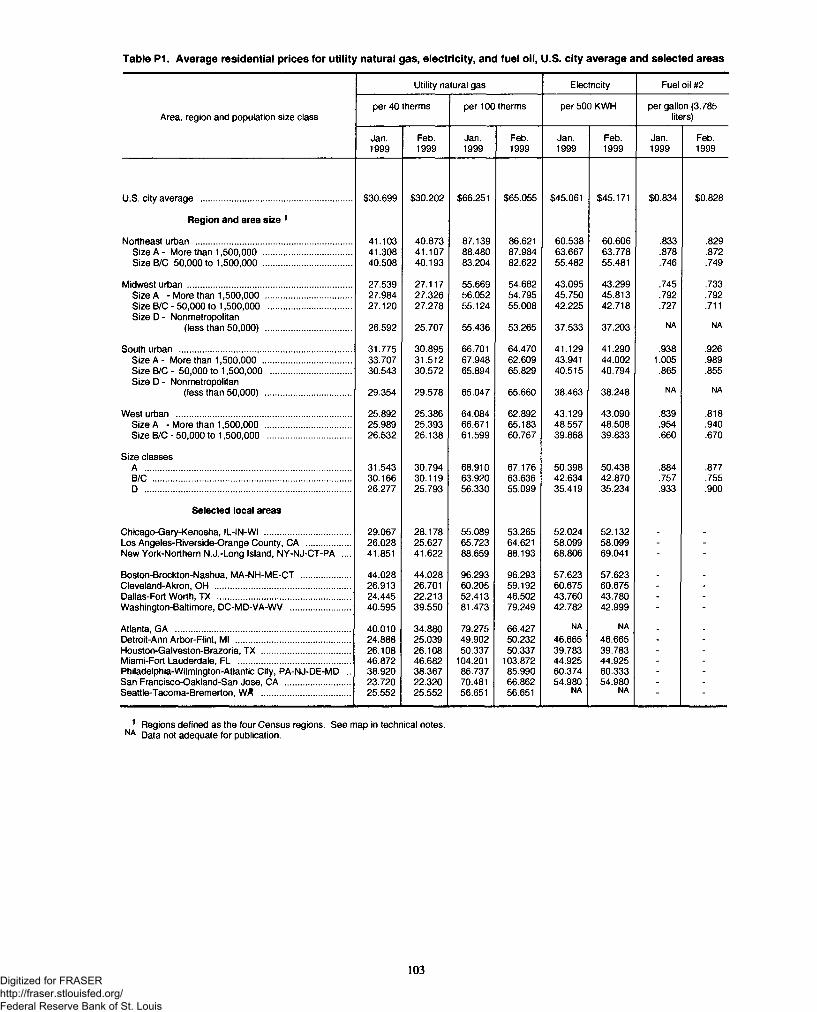
Table P1. Average residential prices for utility natural gas, electricity, and fuel oil, U.S. city average and selected areas
Utility natural gas Electricity Fuel oil #2
Area, region and population size classper 40 therms per 100 therms per 500 KWH per gallon (3.785
liters)
Jan.1999
Feb.1999
Jan.1999
Feb.1999
Jan.1999
Feb.1999
Jan.1999
Feb.1999
U.S. city average ............................................................... $30,699 $30,202 $66,251 $65,055 $45,061 $45,171 $0,834 $0,828
Region and area size 1
Northeast urban ................................................................. 41.103 40.873 87.139 86.621 60.538 60.606 .833 .829Size A - More than 1,500,000 ..................................... 41.308 41.107 88.480 87.984 63.667 63.778 .878 .872SizeB/C 50,000 to 1,500,000 ..................................... 40.508 40.193 83.204 82.622 55.482 55.481 .746 .749
Midwest u rb a n .................................................................... 27.539 27.117 55.669 54.682 43.095 43.299 .745 .733Size A - More than 1,500,000 .................................... 27.984 27.326 56.052 54.795 45.750 45.813 .792 .792S izeB /C -5 0 ,00 0 to 1,500,000 ................................... 27.120 27.278 55.124 55.008 42.225 42.718 .727 .711Size D - Non metropolitan
NA NA(less than 50,000) .................................... 26.592 25.707 55.436 53.265 37.533 37.203
South urban ........................................................................ 31.775 30.895 66.701 64.470 41.129 41.290 .938 .926Size A - More than 1,500,000 ..................................... 33.707 31.512 67.948 62.609 43.941 44.002 1.005 .989Size B/C - 50,000 to 1,500,000 .................................. 30.543 30.572 65.894 65.829 40.515 40.794 .865 .855Size D - Non metropolitan
NA NA(less than 50,000) .................................... 29.354 29.578 65.047 65.660 38.463 38.248
West urban ......................................................................... 25.892 25.386 64.084 62.892 43.129 43.090 .839 .818Size A - More than 1,500,000 .................................... 25.989 25.393 66.671 65.183 48.557 48.508 .954 .940Size B/C - 50,000 to 1,500,000 ................................... 26.532 26.138 61.599 60.767 39.868 39.833 .660 .670
Size classesA ...................................................................................... 31.543 30.794 68.910 67.176 50.398 50.438 .884 .877B/C ................................................................................... 30.166 30.119 63.920 63.636 42.634 42.870 .757 .755D ...................................................................................... 26.277 25.793 56.330 55.099 35.419 35.234 .933 .900
Selected local areas
Chicago-Gary-Kenosha, IL-IN-WI .................................... 29.067 28.178 55.089 53.265 52.024 52.132 _ .
Los Angeles-Riverside-Orange County, CA .................. 26.028 25.627 65.723 64.621 58.099 58.099 - -
New York-Northern N.J.-Long Island, NY-NJ-CT-PA .... 41.851 41.622 88.659 88.193 68.806 69.041 - -
Boston-Brockton-Nashua, MA-NH-ME-CT .................... 44.028 44.028 96.293 96.293 57.623 57.623 _ _
Cleveland-Akron, OH ........................................................ 26.913 26.701 60.205 59.192 60.675 60.675 - -
Dallas-Fort Worth, TX ....................................................... 24.445 22.213 52.413 46.502 43.760 43.780 - -
Washington-Baltimore, DC-MD-VA-WV ......................... 40.595 39.550 81.473 79.249 42.782 42.999 - -
Atlanta, GA ......................................................................... 40.010 34.880 79.275 66.427 NA NA _ _
Detroit-Ann Arbor-Flint, Ml ................................................ 24.888 25.039 49.902 50.232 46.665 46.665 - -
Houston-Galveston-Brazoria, TX ..................................... 26.108 26.108 50.337 50.337 39.783 39.783 - -
Miami-Fort Lauderdale, FL ............................................... 46.872 46.682 104.201 103.872 44.925 44.925 - -
Philadelphia-Wilmington-Atlantic City, PA-NJ-DE-MD .. 38.920 38.367 86.737 85.990 60.374 60.333 - -
San Francisco-Oakland-San Jose, CA ........................... 23.720 22.320 70.481 66.862 54.980 54.980 - -
Seattle-Tacoma-Bremerton, WA ..................................... 25.552 25.552 56.651 56.651 NA NA - -
1 Regions defined as the four Census regions. See map in technical notes. NA Data not adequate for publication.
103Digitized for FRASER http://fraser.stlouisfed.org/ Federal Reserve Bank of St. Louis
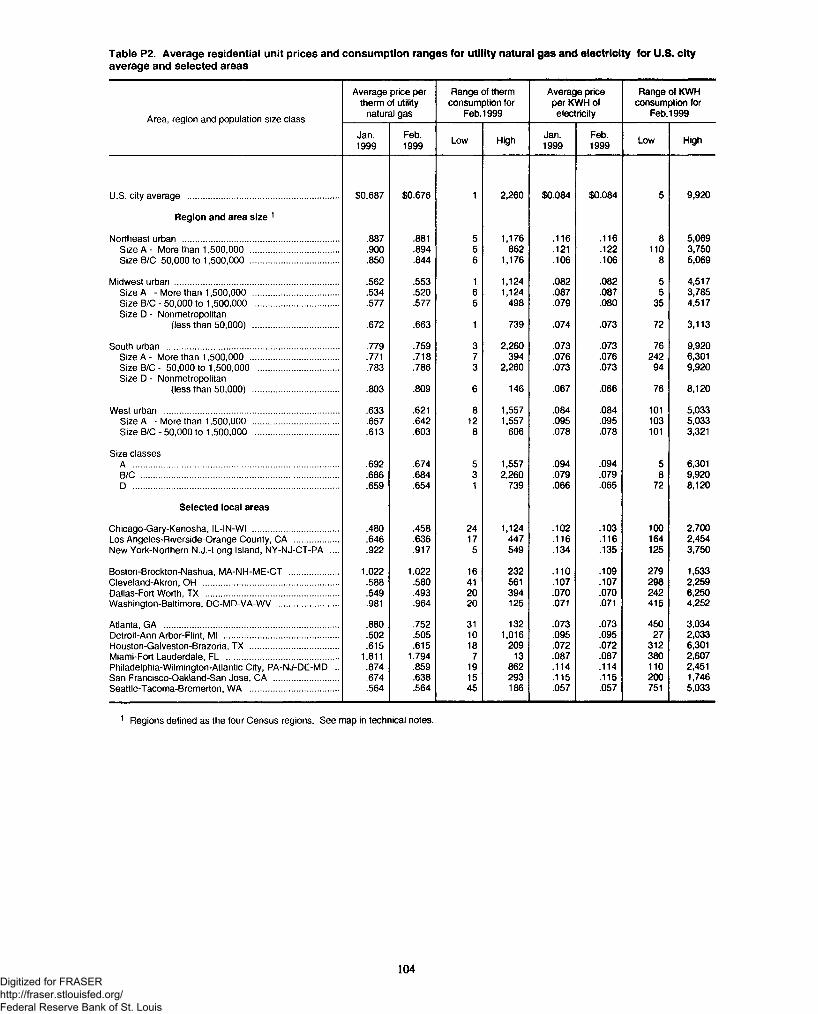
Table P2. Average residential unit prices and consumption ranges for utility natural gas and electricity for U.S. cityaverage and selected areas
Area, region and population size class
Average price per therm of utility
natural gas
Range of therm consumption for
Feb. 1999
Average price per KWH of electricity
Range of KWH consumption for
Feb. 1999
Jan.1999
Feb.1999 Low High Jan.
1999Feb.1999 Low High
U.S. city average ............................................................... $0.687 $0.676 1 2,260 $0.084 $0.084 5 9,920
Region and area size 1
Northeast urban ................................................................. .887 .881 5 1,176 .116 .116 8 5,069Size A - More than 1,500,000 ..................................... .900 .894 5 862 .121 .122 110 3,750Size B/C 50,000 to 1,500,000 ..................................... .850 .844 6 1,176 .106 .106 8 5,069
Midwest u rban .................................................................... .562 .553 1 1,124 .082 .082 5 4,517Size A - More than 1,500,000 .................................... .534 .520 6 1,124 .087 .087 5 3,785Size B/C - 50,000 to 1,500,000 ................................... .577 .577 5 498 .079 .080 35 4,517Size D - Nonmetropolitan
(less than 50,000) .................................... .672 .663 1 739 .074 .073 72 3,113
South urban ........................................................................ .779 .759 3 2,260 .073 .073 76 9,920Size A - More than 1,500,000 ..................................... .771 .718 7 394 .076 .076 242 6,301Size B/C - 50,000 to 1,500,000 .................................. .783 .786 3 2,260 .073 .073 94 9,920Size D - Nonmetropolitan
(less than 50,000) .................................... .803 .809 6 146 .067 .066 76 8,120
West urban ......................................................................... .633 .621 8 1,557 .084 .084 101 5,033Size A - More than 1,500,000 .................................... .657 .642 12 1,557 .095 .095 103 5,033Size B/C - 50,000 to 1,500,000 ................................... .613 .603 8 606 .078 .078 101 3,321
Size classesA ................ ..................................................................... .692 .674 5 1,557 .094 .094 5 6,301B/C .................................................................................. .686 .684 3 2,260 .079 .079 8 9,920D ...................................................................................... .659 .654 1 739 .066 .065 72 8,120
Selected local areas
Chicago-Gary-Kenosha, IL-IN-WI .................................... .480 .458 24 1,124 .102 .103 100 2,700Los Angeles-Riverside-Orange County, CA .................. .646 .636 17 447 .116 .116 164 2,454New York-Northern N.J.-Long Island, NY-NJ-CT-PA .... .922 .917 5 549 .134 .135 125 3,750
Boston-Brockton-Nashua, MA-NH-ME-CT ..................... 1.022 1.022 16 232 .110 .109 279 1,533Cleveland-Akron, OH ......................................................... .588 .580 41 561 .107 .107 298 2,259Dallas-Fort Worth, TX ....................................................... .549 .493 20 394 .070 .070 242 6,250Washington-Baltimore, DC-MD-VA-WV ......................... .981 .964 20 125 .071 .071 415 4,252
Atlanta, GA ......................................................................... .880 .752 31 132 .073 .073 450 3,034Detroit-Ann Arbor-Flint, Ml ................................................ .502 .505 10 1,016 .095 .095 27 2,033Houston-Galveston-Brazoria, TX ..................................... .615 .615 18 209 .072 .072 312 6,301Miami-Fort Lauderdale, FL ............................................... 1.811 1.794 7 13 .087 .087 380 2,607Philadelphia-Wilmington-Atlantic City, PA-NJ-DE-MD .. .874 .859 19 862 .114 .114 110 2,451San Francisco-Oakland-San Jose, CA ........................... .674 .638 15 293 .115 .115 200 1,746Seattle-Tacoma-Bremerton, WA ..................................... .564 .564 45 186 .057 .057 751 5,033
1 Regions defined as the four Census regions. See map in technical notes.
104Digitized for FRASER http://fraser.stlouisfed.org/ Federal Reserve Bank of St. Louis
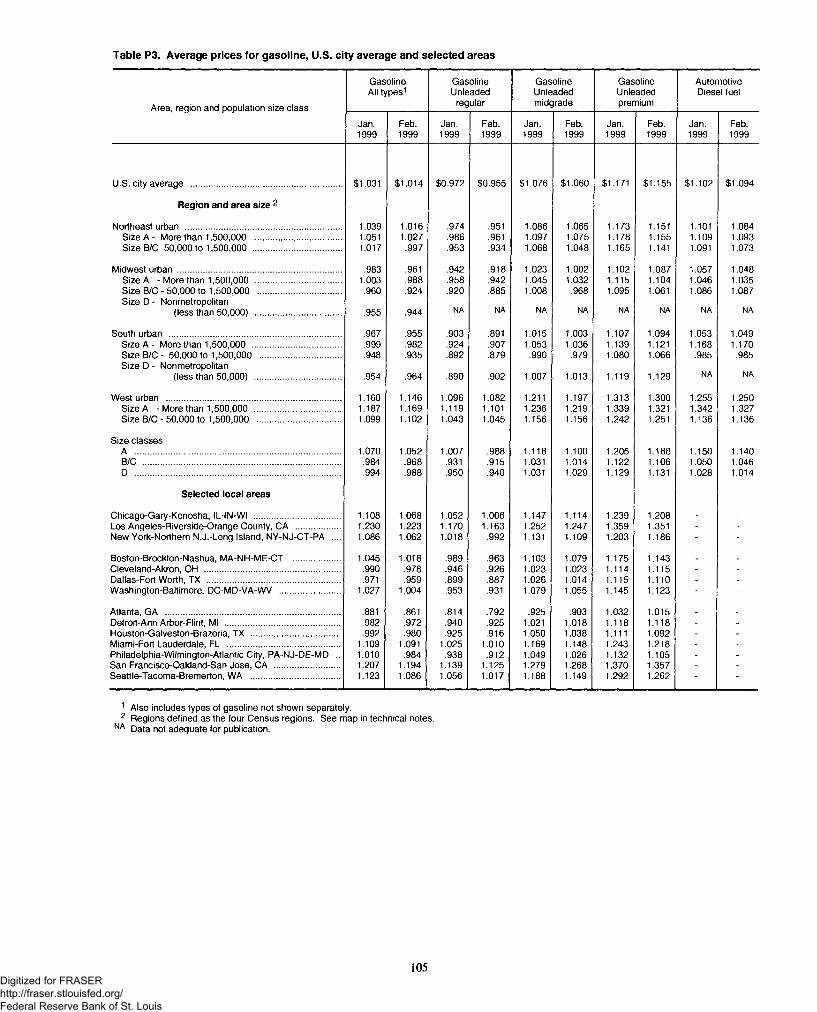
Table P3. Average prices for gasoline, U.S. city average and selected areas
Area, region and population size class
Gasoline All types1
GasolineUnleaded
regular
GasolineUnleadedmidgrade
GasolineUnleadedpremium
Automotive Diesel fuel
Jan.1999
Feb.1999
Jan.1999
Feb.1999
Jan.1999
Feb.1999
Jan.1999
Feb.1999
Jan.1999
Feb.1999
U.S. city average ............................................................... $1.031 $1.014 $0.972 $0.955 $1.076 $1.060 $1.171 $1.155 $1.102 $1.094
Region and area size 2
Northeast urban ................................................................. 1.039 1.016 .974 .951 1.086 1.065 1.173 1.151 1.101 1.084Size A - More than 1,500,000 ..................................... 1.051 1.027 .986 .961 1.097 1.075 1.178 1.155 1.109 1.093SizeB/C 50,000 to 1,500,000 ..................................... 1.017 .997 .953 .934 1.068 1.048 1.165 1.141 1.091 1.073
Midwest urban .................................................................... .983 .961 .942 .918 1.023 1.002 1.102 1.087 1.057 1.048Size A - More than 1,500,000 .................................... 1.003 .988 .958 .942 1.045 1.032 1.115 1.104 1.046 1.035Size B/C - 50,000 to 1,500,000 ................................... .960 .924 .920 .885 1.008 .968 1.095 1.061 1.086 1.087Size D - Nonmetropolitan
(less than 50,000) .................................... .955 .944 NA NA NA NA NA NA NA NA
South urban ........................................................................ .967 .955 .903 .891 1.015 1.003 1.107 1.094 1.053 1.049Size A - More than 1,500,000 ..................................... .999 .982 .924 .907 1.053 1.036 1.139 1.121 1.168 1.170Size B/C - 50,000 to 1,500,000 .................................. .948 .935 .892 .879 .990 .979 1.080 1.066 .985 .985Size D - Nonmetropolitan
NA NA(less than 50,000) .................................... .954 .964 .890 .902 1.007 1.013 1.119 1.129
West urban ......................................................................... 1.160 1.146 1.096 1.082 1.211 1.197 1.313 1.300 1.255 1.250Size A - More than 1,500,000 .................................... 1.187 1.169 1.119 1.101 1.236 1.219 1.339 1.321 1.342 1.327Size B/C - 50,000 to 1,500,000 ................................... 1.099 1.102 1.043 1.045 1.156 1.156 1.242 1.251 1.136 1.136
Size classesA ...................................................................................... 1.070 1.052 1.007 .988 1.118 1.100 1.205 1.188 1.150 1.140B/C .................................................................................. .984 .968 .931 .915 1.031 1.014 1.122 1.106 1.050 1.046D ...................................................................................... .994 .988 .950 .940 1.031 1.029 1.129 1.131 1.028 1.014
Selected local areas
Chicago-Gary-Kenosha, IL-IN-WI .................................... 1.108 1.068 1.052 1.006 1.147 1.114 1.239 1.208 -
Los Angeles-Riverside-Orange County, CA .................. 1.230 1.223 1.170 1.163 1.252 1.247 1.359 1.351 - -New York-Northern N.J.-Long Island, NY-NJ-CT-PA .... 1.086 1.062 1.018 .992 1.131 1.109 1.203 1.186 -
Boston-Brockton-Nashua, MA-NH-ME-CT ..................... 1.045 1.018 .989 .963 1.103 1.079 1.175 1.143 _
Cleveland-Akron, OH ........................................................ .990 .978 .946 .926 1.023 1.023 1.114 1.115 - -
Dallas-Fort Worth, TX ....................................................... .971 .959 .899 .887 1.026 1.014 1.115 1.110 - -
Washington-Baltimore, DC-MD-VA-WV ......................... 1.027 1.004 .953 .931 1.079 1.055 1.145 1.123 - -
Atlanta, GA ......................................................................... .881 .861 .814 .792 .925 .903 1.032 1.015 _
Detroit-Ann Arbor-Flint, Ml ................................................ .982 .972 .940 .925 1.021 1.018 1.118 1.118 - -
Houston-Galveston-Brazoria, TX ..................................... .992 .980 .925 .916 1.050 1.038 1.111 1.092 - -
Miami-Fort Lauderdale, FL ............................................... 1.109 1.091 1.025 1.010 1.169 1.148 1.243 1.218 - -
Philadelphia-Wilmington-Atlantic City, PA-NJ-DE-MD .. 1.010 .984 .938 .912 1.049 1.026 1.132 1.105 - -
San Francisco-Oakland-San Jose, CA ........................... 1.207 1.194 1.139 1.125 1.279 1.268 1.370 1.357 - -
Seattle-Tacoma-Bremerton, WA ..................................... 1.123 1.086 1.056 1.017 1.188 1.149 1.292 1.262 - -
1 Also includes types of gasoline not shown separately.2 Regions defined as the four Census regions. See map in technical notes.
NA Data not adequate for publication.
105Digitized for FRASER http://fraser.stlouisfed.org/ Federal Reserve Bank of St. Louis
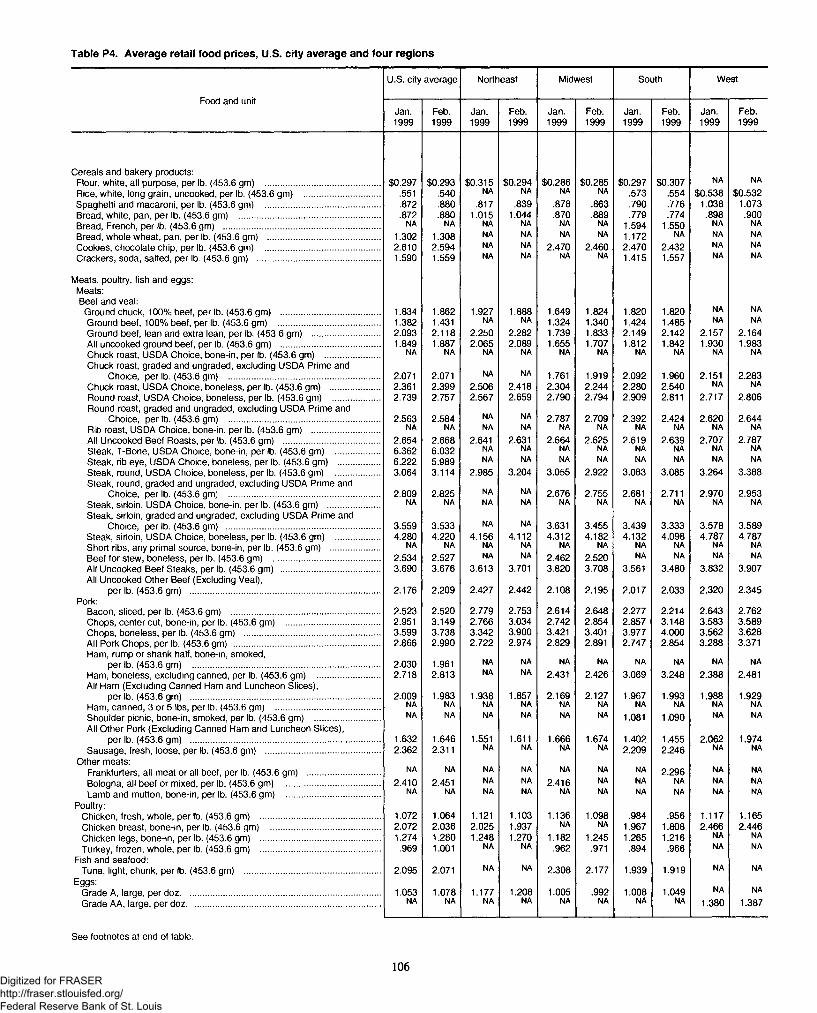
Table P4. Average retail food prices, U.S. city average and four regions
Food and unit
U.S. city average Northeast Midwest South West
Jan.1999
Feb.1999
Jan.1999
Feb.1999
Jan.1999
Feb.1999
Jan.1999
Feb.1999
Jan.1999
Feb.1999
Cereals and bakery products:Flour, white, all purpose, per lb. (453.6 gm) ................................................ $0,297 $0,293 $0,315 $0,294 $0,286 $0,285 $0,297 $0,307 NA NA
Rice, white, long grain, uncooked, per lb. (453.6 gm) ................................ .551 .540 NA NA NA NA .573 .554 $0,538 $0,532Spaghetti and macaroni, per lb. (453.6 gm) ................................................ .872 .880 .817 .839 .878 .863 .790 .776 1.038 1.073Bread, white, pan, per lb. (453.6 gm) ........................................................... .872 .880 1.015 1.044 .870 .889 .779 .774 .898 .900Bread, French, per lb. (453.6 gm) ................................................................. NA NA NA NA NA NA 1.594 1.550 NA NA
Bread, whole wheat, pan, per lb. (453.6 gm) ............................................... 1.302 1.308 NA NA NA NA 1.172 NA NA NA
Cookies, chocolate chip, per lb. (453.6 gm) ................................................ 2.610 2.594 NA NA 2.470 2.460 2.470 2.432 NA NA
Crackers, soda, salted, per lb. (453.6 gm) ................................................... 1.590 1.559 NA NA NA NA 1.415 1.557 NA NA
Meats, poultry, fish and eggs:Meats:Beef and veal:
Ground chuck, 100% beef, per lb. (453.6 gm) ......................................... 1.834 1.862 1.927 1.888 1.649 1.824 1.820 1.820 NA NA
Ground beef, 100% beef, per lb. (453.6 gm) .......................................... 1.382 1.431 NA NA 1.324 1.340 1.424 1.485 NA NA
Ground beef, lean and extra lean, per lb. (453.6 gm) ............................ 2.093 2.118 2.250 2.282 1.739 1.833 2.149 2.142 2.157 2.164All uncooked ground beef, per lb. (453.6 gm) ......................................... 1.849 1.887 2.065 2.089 1.655 1.707 1.812 1.842 1.930 1.983Chuck roast, USDA Choice, bone-in, per lb. (453.6 gm) ....................... NA NA NA NA NA NA NA NA NA NA
Chuck roast, graded and ungraded, excluding USDA Prime andChoice, per lb. (453.6 gm) ............................................................... 2.071 2.071 NA NA 1.761 1.919 2.092 1.960 2.151 2.283
Chuck roast, USDA Choice, boneless, per lb. (453.6 gm) ..................... 2.361 2.399 2.506 2.418 2.304 2.244 2.280 2.540 NA NA
Round roast, USDA Choice, boneless, per lb. (453.6 gm) .................... 2.739 2.757 2.567 2.659 2.790 2.794 2.909 2.811 2.717 2.806Round roast, graded and ungraded, excluding USDA Prime and
Choice, per lb. (453.6 gm) ............................................................... 2.563 2.584 NA NA 2.787 2.709 2.392 2.424 2.620 2.644Rib roast, USDA Choice, bone-in, per lb. (453.6 gm) ............................ NA NA NA NA NA NA NA NA NA NA
All Uncooked Beef Roasts, per lb. (453.6 gm) ........................................ 2.654 2.668 2.641 2.631 2.664 2.625 2.619 2.639 2.707 2.787Steak, T-Bone, USDA Choice, bone-in, per lb. (453.6 gm) .................. 6.362 6.032 NA NA NA NA NA NA NA NA
Steak, rib eye, USDA Choice, boneless, per lb. (453.6 gm) ................. 6.222 5.989 NA NA NA NA NA NA NA NA
Steak, round, USDA Choice, boneless, per lb. (453.6 gm) .................. 3.064 3.114 2.985 3.204 3.055 2.922 3.083 3.085 3.264 3.388Steak, round, graded and ungraded, excluding USDA Prime and
Choice, per lb. (453.6 gm) ............................................................... 2.809 2.825 NA NA 2.676 2.755 2.681 2.711 2.970 2.953Steak, sirloin, USDA Choice, bone-in, per lb. (453.6 gm) ...................... NA NA NA NA NA NA NA NA NA NA
Steak, sirloin, graded and ungraded, excluding USDA Prime andChoice, per lb. (453.6 gm) ................................................................ 3.559 3.533 NA NA 3.631 3.455 3.439 3.333 3.578 3.589
Steak, sirloin, USDA Choice, boneless, per lb. (453.6 gm) .................. 4.280 4.220 4.156 4.112 4.312 4.182 4.132 4.098 4.787 4.787Short ribs, any primal source, bone-in, per lb. (453.6 gm) ..................... NA NA NA NA NA NA NA NA NA NA
Beef for stew, boneless, per lb. (453.6 gm) ............................................. 2.534 2.527 NA NA 2.462 2.520 NA NA NA NA
All Uncooked Beef Steaks, per lb. (453.6 gm) ......................................... 3.690 3.676 3.613 3.701 3.820 3.708 3.561 3.480 3.832 3.907All Uncooked Other Beef (Excluding Veal),
per lb. (453.6 gm) ............................................................................... 2.176 2.209 2.427 2.442 2.108 2.195 2.017 2.033 2.320 2.345Pork:
Bacon, sliced, per lb. (453.6 gm) .............................................................. 2.523 2.520 2.779 2.753 2.614 2.648 2.277 2.214 2.643 2.762Chops, center cut, bone-in, per lb. (453.6 gm) ....................................... 2.951 3.149 2.766 3.034 2.742 2.854 2.857 3.148 3.583 3.589Chops, boneless, per lb. (453.6 gm) ......................................................... 3.599 3.738 3.342 3.900 3.421 3.401 3.977 4.000 3.562 3.628All Pork Chops, per lb. (453.6 gm) ............................................................. 2.866 2.990 2.722 2.974 2.829 2.891 2.747 2.854 3.288 3.371Ham, rump or shank half, bone-in, smoked,
per lb. (453.6 gm) .............................................................................. 2.030 1.961 NA NA NA NA NA NA NA NA
Ham, boneless, excluding canned, per lb. (453.6 gm) .......................... 2.718 2.813 NA NA 2.431 2.426 3.069 3.248 2.388 2.481All Ham (Excluding Canned Ham and Luncheon Slices),
per lb. (453.6 gm) ............................................................................... 2.009 1.983 1.938 1.857 2.169 2.127 1.967 1.993 1.988 1.929Ham, canned, 3 or 5 lbs, per lb. (453.6 gm) ............................................ NA NA NA NA NA NA NA NA NA NA
Shoulder picnic, bone-in, smoked, per lb. (453.6 gm) ........................... NA NA NA NA NA NA 1.081 1.090 NA NA
All Other Pork (Excluding Canned Ham and Luncheon Slices),per lb. (453.6 gm) ............................................................................... 1.632 1.646 1.551 1.611 1.666 1.674 1.402 1.455 2.062 1.974
Sausage, fresh, loose, per lb. (453.6 gm) ................................................ 2.362 2.311 NA NA NA NA 2.209 2.246 NA NA
Other meats:Frankfurters, all meat or all beef, per lb. (453.6 gm) .............................. NA NA NA NA NA NA NA 2.296 NA NA
Bologna, all beef or mixed, per lb. (453.6 gm) ........................................ 2.410 2.451 NA NA 2.416 NA NA NA NA NA
Lamb and mutton, bone-in, per lb. (453.6 gm) ....................................... NA NA NA NA NA NA NA NA NA NA
Poultry:Chicken, fresh, whole, per lb. (453.6 gm) .................................................. 1.072 1.064 1.121 1.103 1.136 1.098 .984 .956 1.117 1.165Chicken breast, bone-in, per lb. (453.6 gm) .............................................. 2.072 2.036 2.025 1.937 NA NA 1.967 1.808 2.466 2.446Chicken legs, bone-in, per lb. (453.6 gm) .................................................. 1.274 1.280 1.248 1.270 1.182 1.245 1.265 1.216 NA NA
Turkey, frozen, whole, per lb. (453.6 gm) .................................................. .969 1.001 NA NA .962 .971 .894 .966 NA NA
Fish and seafood:Tuna, light, chunk, per lb. (453.6 gm) ......................................................... 2.095 2.071 NA NA 2.308 2.177 1.939 1.919 NA NA
Eggs:Grade A, large, per doz.................................................................................... 1.053 1.078 1.177 1.208 1.005 .992 1.008 1.049 NA NA
Grade AA, large, per doz................................................................................. NA NA NA NA NA NA NA NA 1.380 1.387
See footnotes at end of table.
106Digitized for FRASER http://fraser.stlouisfed.org/ Federal Reserve Bank of St. Louis
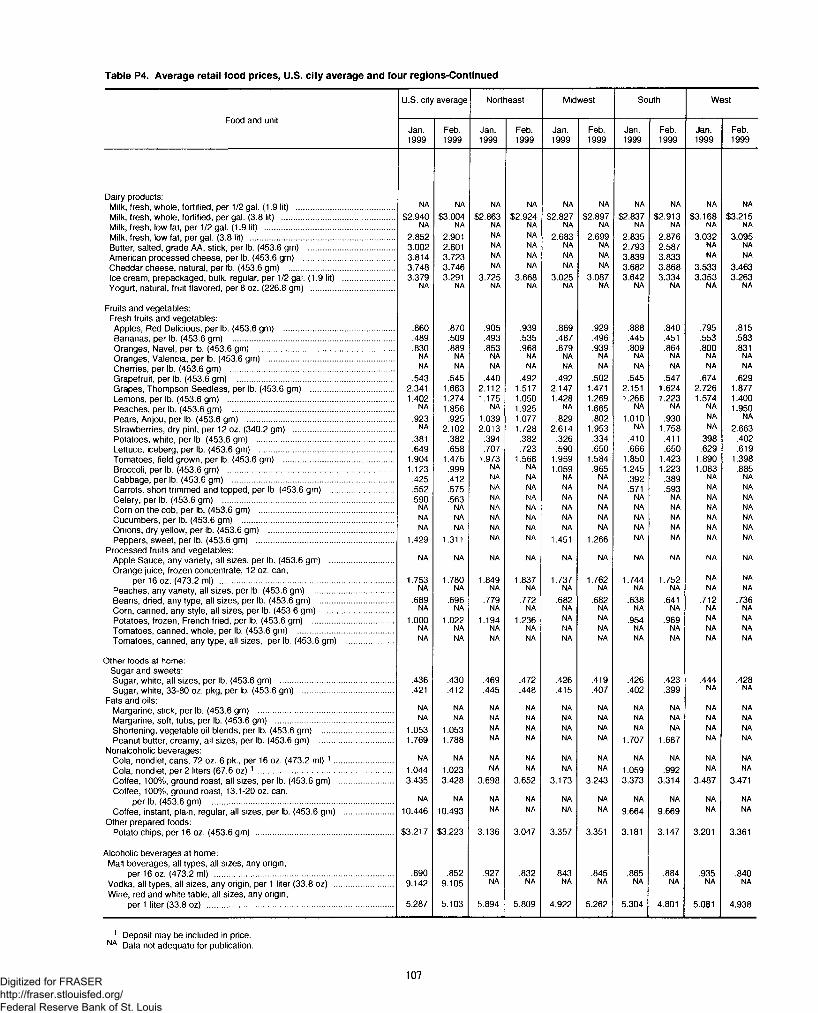
Table P4. Average retail food prices, U.S. city average and four regions-Continued
Food and unit
U.S. city average Northeast Midwest South West
Jan.1999
Feb.1999
Jan.1999
Feb.1999
Jan.1999
Feb.1999
Jan.1999
Feb.1999
Jan.1999
Feb.1999
Dairy products:NA NA NA NA NAMilk, fresh, whole, fortified, per 1/2 gal. (1.9 lit) ......................................... NA NA NA NA NA
Milk, fresh, whole, fortified, per gal. (3.8 lit) ............................................... $2,940 $3,004 $2,863 $2,924 $2,827 $2,897 $2,837 $2,913 $3,168 $3,215Milk, fresh, low fat, per 1/2 gal. (1.9 lit) ...................................................... NA NA NA NA NA NA NA NA NA NA
Milk, fresh, low fat, per gal. (3.8 lit) ............................................................ 2.852 2.901 NA NA 2.683 2.699 2.835 2.876 3.032 3.095Butter, salted, grade AA, stick, per lb. (453.6 gm) .................................... 3.002 2.801 NA NA NA NA 2.793 2.587 NA NA
American processed cheese, per lb. (453.6 gm) ...................................... 3.814 3.723 NA NA NA NA 3.839 3.833 NA NA
Cheddar cheese, natural, per lb. (453.6 gm) ............................................ 3.748 3.746 NA NA NA NA 3.682 3.868 3.533 3.463Ice cream, prepackaged, bulk, regular, per 1/2 gal. (1.9 lit) ..................... 3.379 3.291 3.725 3.668 3.025 3.087 3.642 3.334 3.353 3.263Yogurt, natural, fruit flavored, per 8 oz. (226.8 gm) ................................... NA NA NA NA NA NA NA NA NA NA
Fruits and vegetables:Fresh fruits and vegetables:Apples, Red Delicious, per lb. (453.6 gm) .............................................. .860 .870 .905 .939 .869 .929 .888 .840 .795 .815Bananas, per lb. (453.6 gm) ................................................................... .489 .509 .493 .535 .487 .496 .445 .451 .553 .583Oranges, Navel, per lb. (453.6 gm) ........................................................ .830 .889 .853 .968 .879 .939 .809 .864 .800 .831Oranges, Valencia, per lb. (453.6 gm) .................................................... NA NA NA NA NA NA NA NA NA NA
Cherries, per lb. (453.6 gm) .................................................................... NA NA NA NA NA NA NA NA NA NA
Grapefruit, per lb. (453.6 gm) ................................................................. .543 .545 .440 .492 .492 .502 .545 .547 .674 .629Grapes, Thompson Seedless, per lb. (453.6 gm) ................................... 2.341 1.663 2.112 1.517 2.147 1.471 2.151 1.624 2.726 1.877Lemons, per lb. (453.6 gm) ..................................................................... 1.402 1.274 1.175 1.050 1.428 1.269 1.266 1.223 1.574 1.400Peaches, per lb. (453.6 gm) ................................................................... NA 1.856 NA 1.925 NA 1.665 NA NA NA 1.950Pears, Anjou, per lb. (453.6 gm) ............................................................. .923 .925 1.039 1.077 .829 .802 1.010 .930 NA NA
Strawberries, dry pint, per 12 oz. (340.2 gm) .......................................... NA 2.102 2.013 1.728 2.614 1.953 NA 1.758 NA 2.663Potatoes, white, per lb. (453.6 gm) ......................................................... .381 .382 .394 .382 .326 .334 .410 .411 .398 .402Lettuce, iceberg, per lb. (453.6 gm) ........................................................ .649 .658 .707 .723 .590 .650 .666 .650 .629 .619Tomatoes, field grown, per lb. (453.6 gm) .............................................. 1.904 1.476 1.973 1.568 1.959 1.584 1.850 1.423 1.890 1.398Broccoli, per lb. (453.6 gm) ..................................................................... 1.123 .999 NA NA 1.059 .965 1.245 1.223 1.083 .885Cabbage, per lb. (453.6 gm) ................................................................... .425 .412 NA NA NA NA .392 .389 NA NA
Carrots, short trimmed and topped, per lb. (453.6 gm) ........................... .552 .575 NA NA NA NA .571 .593 NA NA
Celery, per lb. (453.6 gm) ....................................................................... .590 .563 NA NA NA NA NA NA NA NA
Corn on the cob, per lb. (453.6 gm) ........................................................ NA NA NA NA NA NA NA NA NA NA
Cucumbers, per lb. (453.6 gm) ............................................................... NA NA NA NA NA NA NA NA NA NA
Onions, dry yellow, per lb. (453.6 gm) .................................................... NA NA NA NA NA NA NA NA NA NA
Peppers, sweet, per lb. (453.6 gm) ......................................................... 1.429 1.311 NA NA 1.451 1.266 NA NA NA NA
Processed fruits and vegetables:Apple Sauce, any variety, all sizes, per lb. (453.6 gm) .......................... NA NA NA NA NA NA NA NA NA NA
Orange juice, frozen concentrate, 12 oz. can,NA NAper 16 oz. (473.2 ml) ........................................................................ 1.753 1.780 1.849 1.837 1.737 1.762 1.744 1.752
Peaches, any variety, all sizes, per lb. (453.6 gm) ................................. NA NA NA NA NA NA NA NA NA NA
Beans, dried, any type, all sizes, per lb. (453.6 gm) ............................... .689 .696 .779 .772 .682 .682 .638 .641 .712 .736Corn, canned, any style, all sizes, per lb. (453.6 gm) ............................. NA NA NA NA NA NA NA NA NA NA
Potatoes, frozen, French fried, per lb. (453.6 gm) .................................. 1.000 1.022 1.194 1.236 NA NA .954 .969 NA NA
Tomatoes, canned, whole, per lb. (453.6 gm) ........................................ NA NA NA NA NA NA NA NA NA NA
Tomatoes, canned, any type, all sizes, per lb. (453.6 gm) ................... NA NA NA NA NA NA NA NA NA NA
Other foods at home: Sugar and sweets:Sugar, white, all sizes, per lb. (453.6 gm) ............................................... .436 .430 .469 .472 .426 .419 .426 .423 .444 .428Sugar, white, 33-80 oz. pkg, per lb. (453.6 gm) ...................................... .421 .412 .445 .448 .415 .407 .402 .399 NA NA
Fats and oils:Margarine, stick, per lb. (453.6 gm) ........................................................ NA NA NA NA NA NA NA NA NA NA
Margarine, soft, tubs, per lb. (453.6 gm) ................................................. NA NA NA NA NA NA NA NA NA NA
Shortening, vegetable oil blends, per lb. (453.6 gm) .............................. 1.053 1.053 NA NA NA NA NA NA NA NA
Peanut butter, creamy, all sizes, per lb. (453.6 gm) ............................... 1.769 1.788 NA NA NA NA 1.707 1.687 NA NA
Nonalcoholic beverages:Cola, nondiet, cans, 72 oz. 6 pk., per 16 oz. (473.2 ml) 1 ........................ NA NA NA NA NA NA NA NA NA NA
Cola, nondiet, per 2 liters (67.6 oz) 1 ........................................................ 1.044 1.023 NA NA NA NA 1.059 .992 NA NA
Coffee, 100%, ground roast, all sizes, per lb. (453.6 gm) ...................... 3.435 3.428 3.698 3.652 3.173 3-243 3.373 3.314 3.487 3.471Coffee, 100%, ground roast, 13.1-20 oz. can,
per lb. (453.6 gm) ........................................................................... NA NA NA NA NA NA NA NA NA NA
Coffee, instant, plain, regular, all sizes, per lb. (453.6 gm) .................... 10.446 10.493 NA NA NA NA 9.664 9.669 NA NA
Other prepared foods:Potato chips, per 16 oz. (453.6 gm) ......................................................... $3,217 $3,223 3.136 3.047 3.357 3.351 3.181 3.147 3.201 3.361
Alcoholic beverages at home:Malt beverages, all types, all sizes, any origin,
per 16 oz. (473.2 ml) .......................................................................... .890 .852 .927 .832 .843 .845 .865 .884 .935 .840Vodka, all types, all sizes, any origin, per 1 liter (33.8 oz) ........................ 9.142 9.105 NA NA NA NA NA NA NA NA
Wine, red and white table, all sizes, any origin,per 1 liter (33.8 oz) ............................................................................. 5.287 5.103 5.894 5.809 4.922 5.262 5.304 4.801 5.081 4.938
1 Deposit may be included in price. NA Data not adequate for publication.
107Digitized for FRASER http://fraser.stlouisfed.org/ Federal Reserve Bank of St. Louis
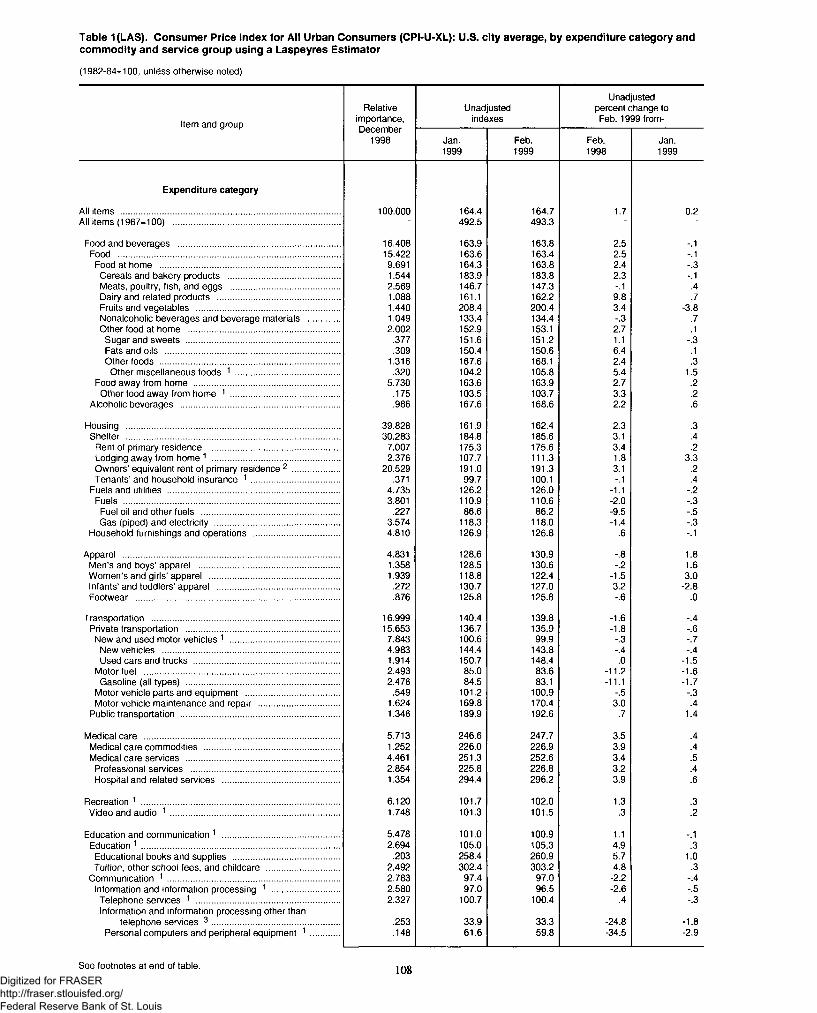
Table 1(LAS). Consumer Price Index for All Urban Consumers (CPI-U-XL): U.S. city average, by expenditure category andcommodity and service group using a Laspeyres Estimator
(1982-84=100, unless otherwise noted)
Item and group
Relativeimportance,December
1998
Unadjustedindexes
Unadjusted percent change to Feb. 1999 from-
Jan.1999
Feb.1999
Feb.1998
Jan.1999
Expenditure category
All items ............................................................................................ 100.000 164.4 164.7 1.7 0.2All items (1967=100) ...................................................................... ' 492.5 493.3 - "
Food and beverages ................................................................... 16.408 163.9 163.8 2.5 -.1Food ............................................................................................. 15.422 163.6 163.4 2.5 -.1
Food at home ........................................................................... 9.691 164.3 163.8 2.4 -.3Cereals and bakery products ............................................... 1.544 183.9 183.8 2.3 -.1Meats, poultry, fish, and eggs .............................................. 2.569 146.7 147.3 -.1 .4Dairy and related products ................................................... 1.088 161.1 162.2 9.8 .7Fruits and vegetables ............................................................ 1.440 208.4 200.4 3.4 -3.8Nonalcoholic beverages and beverage materials ............. 1.049 133.4 134.4 -.3 .7Other food at home ............................................................... 2.002 152.9 153.1 2.7 .1
Sugar and sweets ................................................................ .377 151.6 151.2 1.1 -.3Fats and oils ......................................................................... .309 150.4 150.6 6.4 .1Other foods ........................................................................... 1.316 167.6 168.1 2.4 .3
Other miscellaneous foods 1 ........................................... .320 104.2 105.8 5.4 1.5Food away from home ............................................................. 5.730 163.6 163.9 2.7 .2
Other food away from home 1 .............................................. .175 103.5 103.7 3.3 .2Alcoholic beverages .................................................................. .986 167.6 168.6 2.2 .6
Housing ......................................................................................... 39.828 161.9 162.4 2.3 .3Shelter ......................................................................................... 30.283 184.8 185.6 3.1 .4
Rent of primary residence ...................................................... 7.007 175.3 175.6 3.4 .2Lodging away from home 1 ..................................................... 2.376 107.7 111.3 1.8 3.3Owners’ equivalent rent of primary residence 2 .................... 20.529 191.0 191.3 3.1 .2Tenants’ and household insurance 1 ..................................... .371 99.7 100.1 -.1 .4
Fuels and utilities ........................................................................ 4.735 126.2 126.0 -1.1 -.2Fuels .......................................................................................... 3.801 110.9 110.6 -2.0 -.3
Fuel oil and other fuels .......................................................... .227 86.6 86.2 -9.5 -.5Gas (piped) and electricity .................................................... 3.574 118.3 118.0 -1.4 -.3
Household furnishings and operations .................................... 4.810 126.9 126.8 .6 -.1
Apparel .......................................................................................... 4.831 128.6 130.9 -.8 1.8Men’s and boys’ apparel ........................................................... 1.358 128.5 130.6 -.2 1.6Women’s and girls’ apparel ...................................................... 1.939 118.8 122.4 -1.5 3.0Infants’ and toddlers’ apparel ................................................... .272 130.7 127.0 3.2 -2.8Footwear ..................................................................................... .876 125.8 125.8 -.6 .0
Transportation .............................................................................. 16.999 140.4 139.8 -1.6 -.4Private transportation ................................................................ 15.653 136.7 135.9 -1.8 -.6
New and used motor vehicles 1 .............................................. 7.843 100.6 99.9 -.3 -.7New vehicles .......................................................................... 4.983 144.4 143.8 -.4 -.4Used cars and trucks ............................................................. 1.914 150.7 148.4 .0 -1.5
Motor fuel ................................................................................. 2.493 85.0 83.6 -11.2 -1.6Gasoline (all types) ................................................................ 2.476 84.5 83.1 -11.1 -1.7
Motor vehicle parts and equipment ....................................... .549 101.2 100.9 -.5 -.3Motor vehicle maintenance and repair .................................. 1.624 169.8 170.4 3.0 .4
Public transportation .................................................................. 1.346 189.9 192.6 .7 1.4
Medical care ............................. .................................................... 5.713 246.6 247.7 3.5 .4Medical care commodities ........................................................ 1.252 226.0 226.9 3.9 .4Medical care services ................................................................ 4.461 251.3 252.6 3.4 .5
Professional services .............................................................. 2.854 225.8 226.8 3.2 .4Hospital and related services ................................................. 1.354 294.4 296.2 3.9 .6
Recreation 1 ................................................................................... 6.120 101.7 102.0 1.3 .3Video and audio 1 ...................................................................... 1.748 101.3 101.5 .3 .2
Education and communication 1 ................................................. 5.478 101.0 100.9 1.1 -.1Education 1 ................................................................................... 2.694 105.0 105.3 4.9 .3
Educational books and supplies ............................................ .203 258.4 260.9 5.7 1.0Tuition, other school fees, and childcare .............................. 2.492 302.4 303.2 4.8 .3
Communication 1 ........................................................................ 2.783 97.4 97.0 -2.2 -.4Information and information processing 1 ............................ 2.580 97.0 96.5 -2.6 -.5Telephone services 1 ............................................................ 2.327 100.7 100.4 .4 -.3Information and information processing other than
telephone services 3 ..................................................... .253 33.9 33.3 -24.8 -1.8Personal computers and peripheral equipment 1 ............ .148 61.6 59.8 -34.5 -2.9
See footnotes at end of table. 108Digitized for FRASER http://fraser.stlouisfed.org/ Federal Reserve Bank of St. Louis
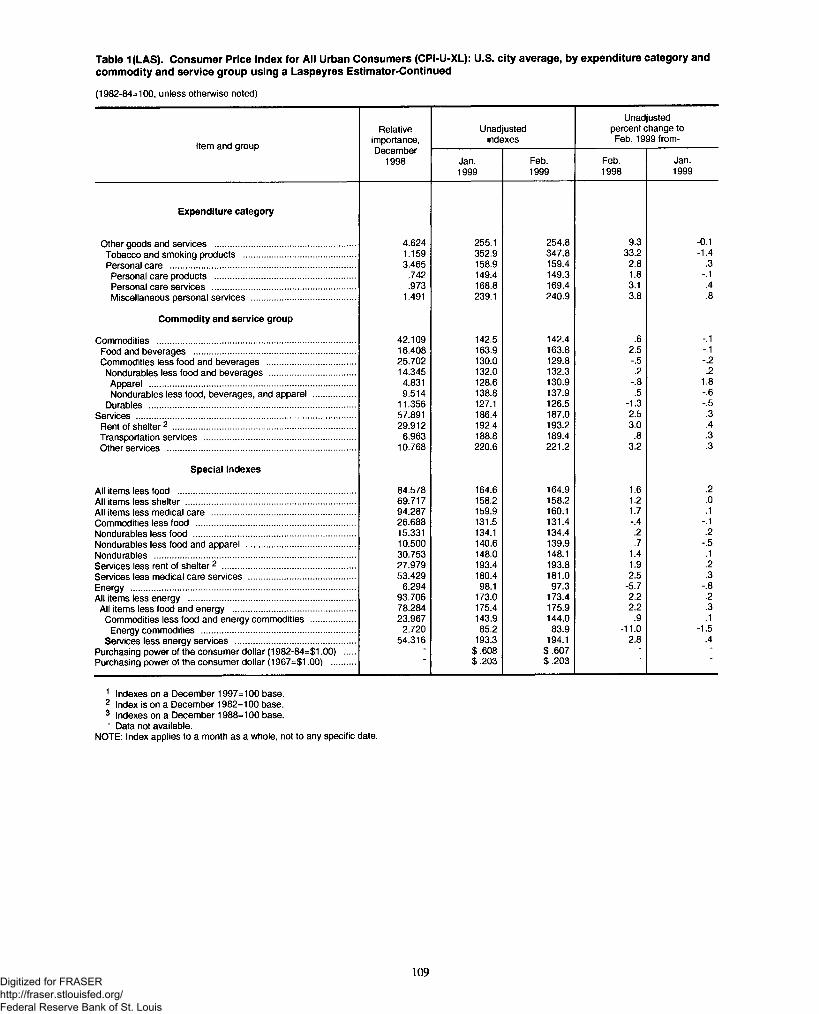
Table 1(LAS). Consumer Price Index for All Urban Consumers (CPI-U-XL): U.S. city average, by expenditure category andcommodity and service group using a Laspeyres Estimator-Continued
(1982-84=100, unless otherwise noted)
Item and group
Relativeimportance,December
1998
Unadjustedindexes
Unadjusted percent change to Feb. 1999 from-
Jan.1999
Feb.1999
Feb.1998
Jan.1999
Expenditure category
Other goods and services ........................................................... 4.624 255.1 254.8 9.3 -0.1Tobacco and smoking products ............................................... 1.159 352.9 347.8 33.2 -1.4Personal care ............................................................................. 3.465 158.9 159.4 2.8 .3
Personal care products ........................................................... .742 149.4 149.3 1.8 -.1Personal care services ............................................................ .973 168.8 169.4 3.1 .4Miscellaneous personal services ........................................... 1.491 239.1 240.9 3.8 .8
Commodity and service group
Commodities ................................................................................... 42.109 142.5 142.4 .6 -.1Food and beverages ................................................................... 16.408 163.9 163.8 2.5 -.1Commodities less food and beverages ..................................... 25.702 130.0 129.8 -.5 -.2
Nondurables less food and beverages .................................... 14.345 132.0 132.3 .2 .2Apparel ...................................................................................... 4.831 128.6 130.9 -.8 1.8Nondurables less food beverages, and apparel ................. 9.514 138.8 137.9 .5 -.6
Durables ................................................................................ 11.356 127.1 126.5 -1.3 -.5Services . ................................................................................ 57.891 186.4 187.0 2.5 .3
Rent of shelter2 ............................................................................ 29.912 192.4 193.2 3.0 .4Transportation services .... .......................................................... 6.963 188.8 189.4 .8 .3Other services .............................................................................. 10.768 220.6 221.2 3.2 .3
Special indexes
All items less food .......................................................................... 84.578 164.6 164.9 1.6 .2All items less shelter ....................................................................... 69.717 158.2 158.2 1.2 .0All items less medical care ............................................................ 94.287 159.9 160.1 1.7 .1Commodities less food .................................................................. 26.688 131.5 131.4 -.4 -.1Nondurables less food ................................................................... 15.331 134.1 134.4 .2 .2Nondurables less food and apparel .............................................. 10.500 140.6 139.9 .7 -.5Nondurables ................................................................................. 30.753 148.0 148.1 1.4 .1Services less rent of shelter2 ....................................................... 27.979 193.4 193.8 1.9 .2Services less medical care services ............................................ 53.429 180.4 181.0 2.5 .3Energy .............................................................................................. 6.294 98.1 97.3 -5.7 -.8All items less energy ...................................................................... 93.706 173.0 173.4 2.2 .2
All items less food and energy ................................................... 78.284 175.4 175.9 2.2 .3Commodities less food and energy commodities .................. 23.967 143.9 144.0 .9 .1
Energy commodities ................................................................ 2.720 85.2 83.9 -11.0 -1.5Services less energy services .................................................. 54.316 193.3 194.1 2.8 .4
Purchasing power of the consumer dollar (1982-84=$1.00) ....Purchasing power of the consumer dollar (1967=$1.00) ..........
$.608$.203
$.607$.203
■
1 Indexes on a December 1997=100 base.2 Index is on a December 1982=100 base.3 Indexes on a December 1988=100 base.' Data not available.
NOTE: Index applies to a month as a whole, not to any specific date.
109Digitized for FRASER http://fraser.stlouisfed.org/ Federal Reserve Bank of St. Louis
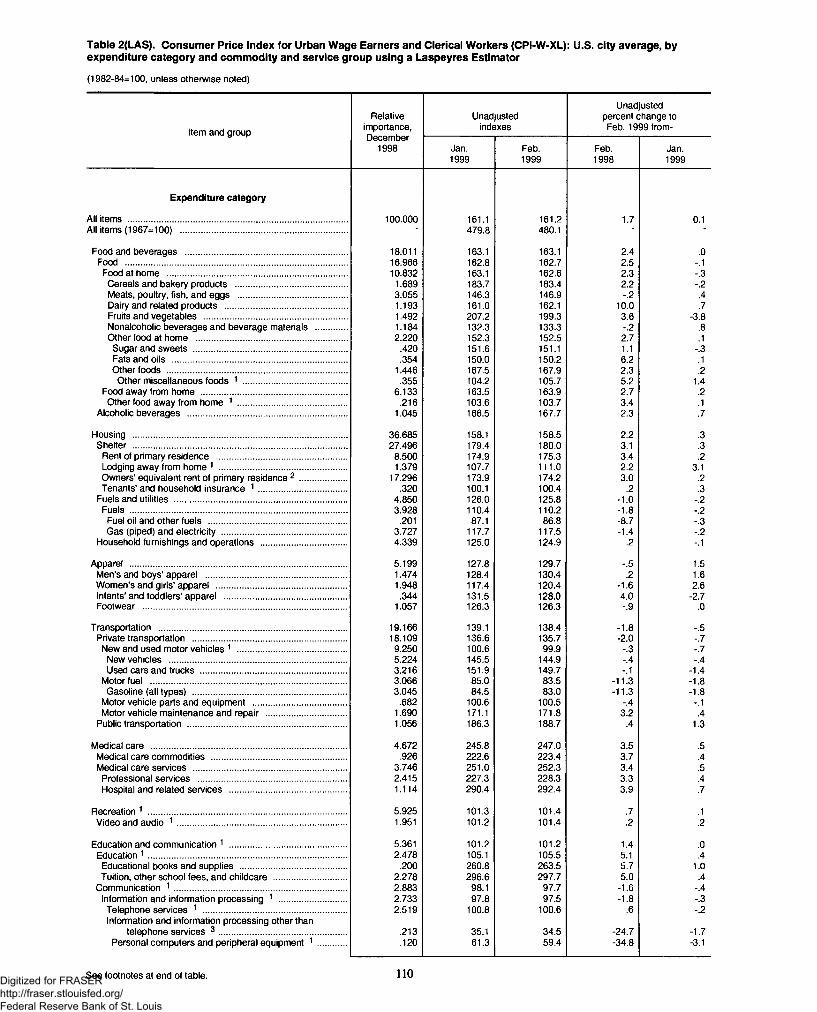
Table 2(LAS). Consumer Price Index for Urban Wage Earners and Clerical Workers (CPI-W-XL): U.S. city average, byexpenditure category and commodity and service group using a Laspeyres Estimator
(1982-84=100, unless otherwise noted)
Item and group
Relativeimportance,December
1998
Unadjustedindexes
Unadjusted percent change to Feb. 1999 from-
Jan.1999
Feb.1999
Feb.1998
Jan.1999
Expenditure category
All items ............................................................................................ 100.000 161.1 161.2 1.7 0.1All items (1967=100) ...................................................................... ■ 479.8 480.1 ■ ■
Food and beverages .................................................................... 18.011 163.1 163.1 2.4 .0Food ............................................................................................. 16.966 162.8 162.7 2.5 -.1
Food at home ........................................................................... 10.832 163.1 162.6 2.3 -.3Cereals and bakery products ............................................... 1.689 183.7 183.4 2.2 -.2Meats, poultry, fish, and eggs ............................................. 3.055 146.3 146.9 -.2 .4Dairy and related products ................................................... 1.193 161.0 162.1 10.0 .7Fruits and vegetables ............................................................ 1.492 207.2 199.3 3.6 -3.8Nonalcoholic beverages and beverage materials ............. 1.184 132.3 133.3 -.2 .8Other food at home ............................................................... 2.220 152.3 152.5 2.7 .1
Sugar and sweets ................................................................ .420 151.6 151.1 1.1 -.3Fats and oils ......................................................................... .354 150.0 150.2 6.2 .1Other foods ........................................................................... 1.446 167.5 167.9 2.3 .2
Other miscellaneous foods 1 ........................................... .355 104.2 105.7 5.2 1.4Food away from home ............................................................. 6.133 163.5 163.9 2.7 .2Other food away from home 1 ............................................. .216 103.6 103.7 3.4 .1
Alcoholic beverages .................................................................. 1.045 166.5 167.7 2.3 .7
Housing ......................................................................................... 36.685 158.1 158.5 2.2 .3Shelter ......................................................................................... 27.496 179.4 180.0 3.1 .3
Rent of primary residence ...................................................... 8.500 174.9 175.3 3.4 .2Lodging away from home 1 ..................................................... 1.379 107.7 111.0 2.2 3.1Owners’ equivalent rent of primary residence 2 .................... 17.296 173.9 174.2 3.0 .2Tenants’ and household insurance 1 ..................................... .320 100.1 100.4 .2 .3
Fuels and utilities ........................................................................ 4.850 126.0 125.8 -1.0 -.2Fuels .......................................................................................... 3.928 110.4 110.2 -1.8 -.2
Fuel oil and other fuels .......................................................... .201 87.1 86.8 -8.7 -.3Gas (piped) and electricity .................................................... 3.727 117.7 117.5 -1.4 -.2
Household furnishings and operations .................................... 4.339 125.0 124.9 .2 -.1
Apparel .......................................................................................... 5.199 127.8 129.7 -.5 1.5Men’s and boys’ apparel ........................................................... 1.474 128.4 130.4 .2 1.6Women’s and girls’ apparel ...................................................... 1.948 117.4 120.4 -1.6 2.6Infants’ and toddlers’ apparel ................................................... .344 131.5 128.0 4.0 -2.7Footwear ..................................................................................... 1.057 126.3 126.3 -.9 .0
Transportation .............................................................................. 19.166 139.1 138.4 -1.8 -.5Private transportation ................................................................ 18.109 136.6 135.7 -2.0 -.7
New and used motor vehicles 1 .............................................. 9.250 100.6 99.9 -.3 -.7New vehicles .......................................................................... 5.224 145.5 144.9 -.4 -.4Used cars and trucks ............................................................. 3.216 151.9 149.7 -.1 -1.4
Motor fuel .................................................................................. 3.066 85.0 83.5 -11.3 -1.8Gasoline (all types) ................................................................ 3.045 84.5 83.0 -11.3 -1.8
Motor vehicle parts and equipment ....................................... .682 100.6 100.5 -.4 -.1Motor vehicle maintenance and repair ................................. 1.690 171.1 171.8 3.2 .4
Public transportation .................................................................. 1.056 186.3 188.7 .4 1.3
Medical care .................................................................................. 4.672 245.8 247.0 3.5 .5Medical care commodities ........................................................ .926 222.6 223.4 3.7 .4Medical care services ................................................................ 3.746 251.0 252.3 3.4 .5
Professional services .............................................................. 2.415 227.3 228.3 3.3 .4Hospital and related services ................................................. 1.114 290.4 292.4 3.9 .7
Recreation 1 ................................................................................... 5.925 101.3 101.4 .7 .1Video and audio 1 ....................................................................... 1.951 101.2 101.4 .2 .2
Education and communication 1 ................................................. 5.361 101.2 101.2 1.4 .0Education 1 ................................................................................... 2.478 105.1 105.5 5.1 .4
Educational books and supplies ............................................ .200 260.8 263.5 5.7 1.0Tuition, other school fees, and childcare .............................. 2.278 296.6 297.7 5.0 .4
Communication 1 ........................................................................ 2.883 98.1 97.7 -1.6 -.4Information and information processing 1 ............................ 2.733 97.8 97.5 -1.8 -.3Telephone services 1 ............................................................ 2.519 100.8 100.6 .6 -.2Information and information processing other than
telephone services 3 ..................................................... .213 35.1 34.5 -24.7 -1.7Personal computers and peripheral equipment 1 ............ .120 61.3 59.4 -34.8 -3.1
See footnotes at end of table. 110Digitized for FRASER http://fraser.stlouisfed.org/ Federal Reserve Bank of St. Louis
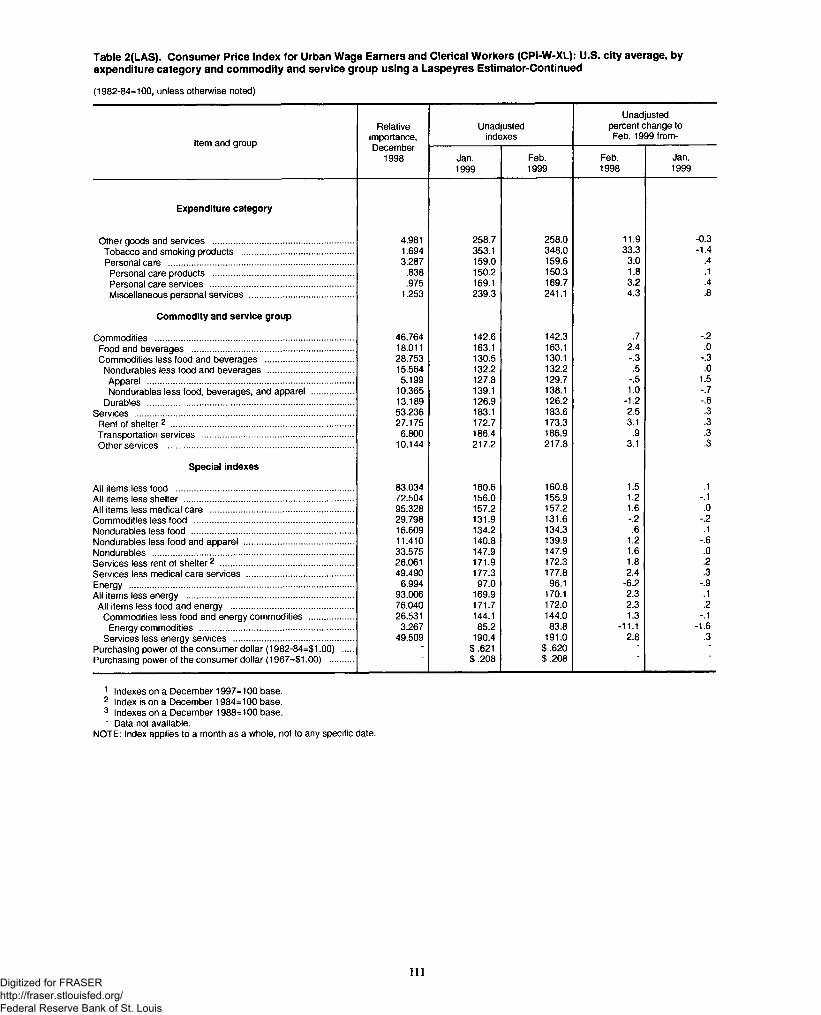
Table 2(LAS). Consumer Price Index for Urban Wage Earners and Clerical Workers (CPI-W-XL): U.S. city average, byexpenditure category and commodity and service group using a Laspeyres Estimator-Continued
(1982-84=100, unless otherwise noted)
Item and group
Relativeimportance,December
1998
Unadjustedindexes
Unadjusted percent change to Feb. 1999 from-
Jan.1999
Feb.1999
Feb.1998
Jan.1999
Expenditure category
Other goods and services ........................................................... 4.981 258.7 258.0 11.9 -0.3Tobacco and smoking products ............................................... 1.694 353.1 348.0 33.3 -1.4Personal care ............................................................................. 3.287 159.0 159.6 3.0 .4Personal care products ........................................................... .838 150.2 150.3 1.8 .1Personal care services ............................................................ .975 169.1 169.7 3.2 .4Miscellaneous personal services ........................................... 1.253 239.3 241.1 4.3 .8
Commodity and service group
Commodities ................................................................................... 46.764 142.6 142.3 .7 -.2Food and beverages ................................................................... 18.011 163.1 163.1 2.4 .0Commodities less food and beverages ..................................... 28.753 130.5 130.1 -.3 -.3
Nondurables less food and beverages .................................... 15.564 132.2 132.2 .5 .0Apparel ...................................................................................... 5.199 127.8 129.7 -.5 1.5Nondurables less food, beverages, and apparel ................. 10.365 139.1 138.1 1.0 -.7
Durables ...................................................................................... 13.189 126.9 126.2 -1.2 -.6Services ........................................................................................... 53.236 183.1 183.6 2.5 .3
Rent of shelter2 ............................................................................ 27.175 172.7 173.3 3.1 .3Transportation services ............................................................... 6.800 186.4 186.9 .9 .3Other services .............................................................................. 10.144 217.2 217.8 3.1 .3
Special indexes
All items less food .......................................................................... 83.034 160.6 160.8 1.5 .1All items less shelter ....................................................................... 72.504 156.0 155.9 1.2 -.1All items less medical care ............................................................ 95.328 157.2 157.2 1.6 .0Commodities less food .................................................................. 29.798 131.9 131.6 -.2 -.2Nondurables less food ................................................................... 16.609 134.2 134.3 .6 .1Nondurables less food and apparel ............................................. 11.410 140.8 139.9 1.2 -.6Nondurables .................................................................................... 33.575 147.9 147.9 1.6 .0Services less rent of she lter2 ....................................................... 26.061 171.9 172.3 1.8 .2Services less medical care services ............................................ 49.490 177.3 177.8 2.4 .3Energy ............................................................................................. 6.994 97.0 96.1 -6.2 -.9All items less energy ...................................................................... 93.006 169.9 170.1 2.3 .1
All items less food and energy ................................................... 76.040 171.7 172.0 2.3 .2Commodities less food and energy commodities .................. 26.531 144.1 144.0 1.3 -.1
Energy commodities ................................................................ 3.267 85.2 83.8 -11.1 -1.6Services less energy services .................................................. 49.509 190.4 191.0 2.8 .3
Purchasing power of the consumer dollar (1982-84=$1.00) .... ■ $.621 $.620 ■ 'Purchasing power of the consumer dollar (1967=$1.00) .......... $.208 $.208
1 Indexes on a December 1997=100 base.2 Index is on a December 1984=100 base.3 Indexes on a December 1988=100 base.' Data not available.
NOTE: Index applies to a month as a whole, not to any specific date.
Il lDigitized for FRASER http://fraser.stlouisfed.org/ Federal Reserve Bank of St. Louis
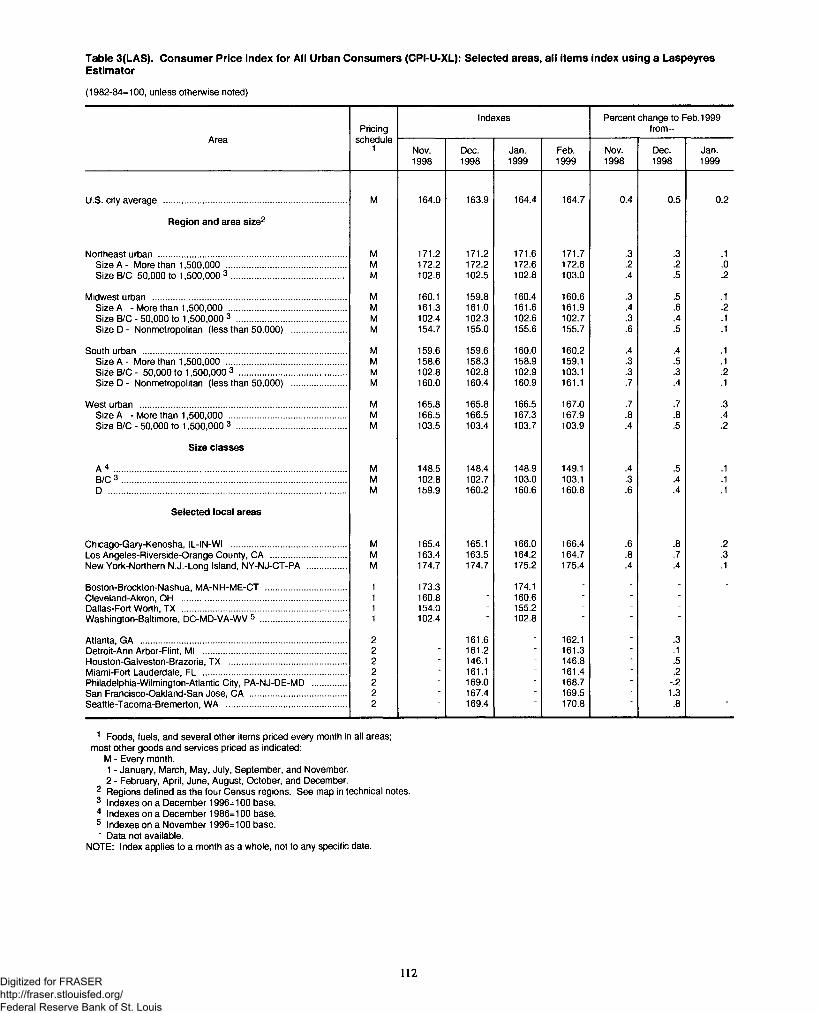
Table 3(LAS). Consumer Price Index for All Urban Consumers (CPI-U-XL): Selected areas, all items index using a LaspeyresEstimator
(1982-84=100, unless otherwise noted)
AreaPricing
schedule1
Indexes Percent change to Feb. 1999 from -
Nov.1998
Dec.1998
Jan.1999
Feb.1999
Nov.1998
Dec.1998
Jan.1999
U.S. city average ............................................................................ M 164.0 163.9 164.4 164.7 0.4 0.5 0.2
Region and area size2
Northeast urban .............................................................................. M 171.2 171.2 171.6 171.7 .3 .3 .1Size A - More than 1,500,000 .................................................. M 172.2 172.2 172.6 172.6 .2 .2 .0Size B/C 50,000 to 1,500,000 3 ................................................ M 102.6 102.5 102.8 103.0 .4 .5 .2
Midwest urban ................................................................................. M 160.1 159.8 160.4 160.6 .3 .5 .1Size A - More than 1,500,000 ................................................. M 161.3 161.0 161.6 161.9 .4 .6 .2Size B/C - 50,000 to 1,500,000 3 .............................................. M 102.4 102.3 102.6 102.7 .3 .4 .1Size D - Nonmetropolitan (less than 50,000) ....................... M 154.7 155.0 155.6 155.7 .6 .5 .1
South urban ..................................................................................... M 159.6 159.6 160.0 160.2 .4 .4 .1Size A - More than 1,500,000 .................................................. M 158.6 158.3 158.9 159.1 .3 .5 .1Size B/C - 50,000 to 1,500,000 3 ............................................ M 102.8 102.8 102.9 103.1 .3 .3 .2Size D - Nonmetropolitan (less than 50,000) ....................... M 160.0 160.4 160.9 161.1 .7 .4 .1
West urban ...................................................................................... M 165.8 165.8 166.5 167.0 .7 .7 .3Size A - More than 1,500,000 ................................................. M 166.5 166.5 167.3 167.9 .8 .8 .4Size B/C - 50,000 to 1,500,000 3 ............................................. M 103.5 103.4 103.7 103.9 .4 .5 .2
Size classes
A 4 ................................................................................................. M 148.5 148.4 148.9 149.1 .4 .5 .1B/C 3 .............................................................................................. M 102.8 102.7 103.0 103.1 .3 .4 .1D ................................................................................................... M 159.9 160.2 160.6 160.8 .6 .4 .1
Selected local areas
Chicago-Gary-Kenosha, IL-IN-WI ................................................ M 165.4 165.1 166.0 166.4 .6 .8 .2Los Angeles-Riverside-Orange County, CA ............................... M 163.4 163.5 164.2 164.7 .8 .7 .3New York-Northern N.J.-Long Island, NY-NJ-CT-PA ................ M 174.7 174.7 175.2 175.4 .4 .4 .1
Boston-Brockton-Nashua, MA-NH-ME-CT .................................. 1 173.3 - 174.1 - - - -Cleveland-Akron, OH .................................................................... 1 160.8 - 160.6 ■ • ■Dallas-Fort Worth, TX .................................................................... 1 154.0 - 155.2 - - -Washington-Baltimore, DC-MD-VA-WV 5 .................................... 1 102.4 102.8
Atlanta, GA ...................................................................................... 2 - 161.6 - 162.1 - .3Detroit-Ann Arbor-Flint, Ml ............................................................ 2 - 161.2 - 161.3 - .1Houston-Galveston-Brazoria, TX ................................................. 2 - 146.1 - 146.8 * .5Miami-Fort Lauderdale, FL ............................................................ 2 - 161.1 - 161.4 - .2Philadelphia-Wilmington-Atlantic City, PA-NJ-DE-MD .............. 2 - 169.0 - 168.7 - -.2San Francisco-Oakland-San Jose, CA ........................................ 2 ■ 167.4 ■ 169.5 ■ 1.3Seattle-Tacoma-Bremerton, WA .................................................. 2 169.4 170.8 .8
1 Foods, fuels, and several other items priced every month in all areas; most other goods and services priced as indicated:
M - Every month.1 - January, March, May, July, September, and November.2 - February, April, June, August, October, and December.
2 Regions defined as the four Census regions. See map in technical notes.3 Indexes on a December 1996=100 base.4 Indexes on a December 1986=100 base.5 Indexes on a November 1996=100 base.' Data not available.
NOTE: Index applies to a month as a whole, not to any specific date.
112Digitized for FRASER http://fraser.stlouisfed.org/ Federal Reserve Bank of St. Louis
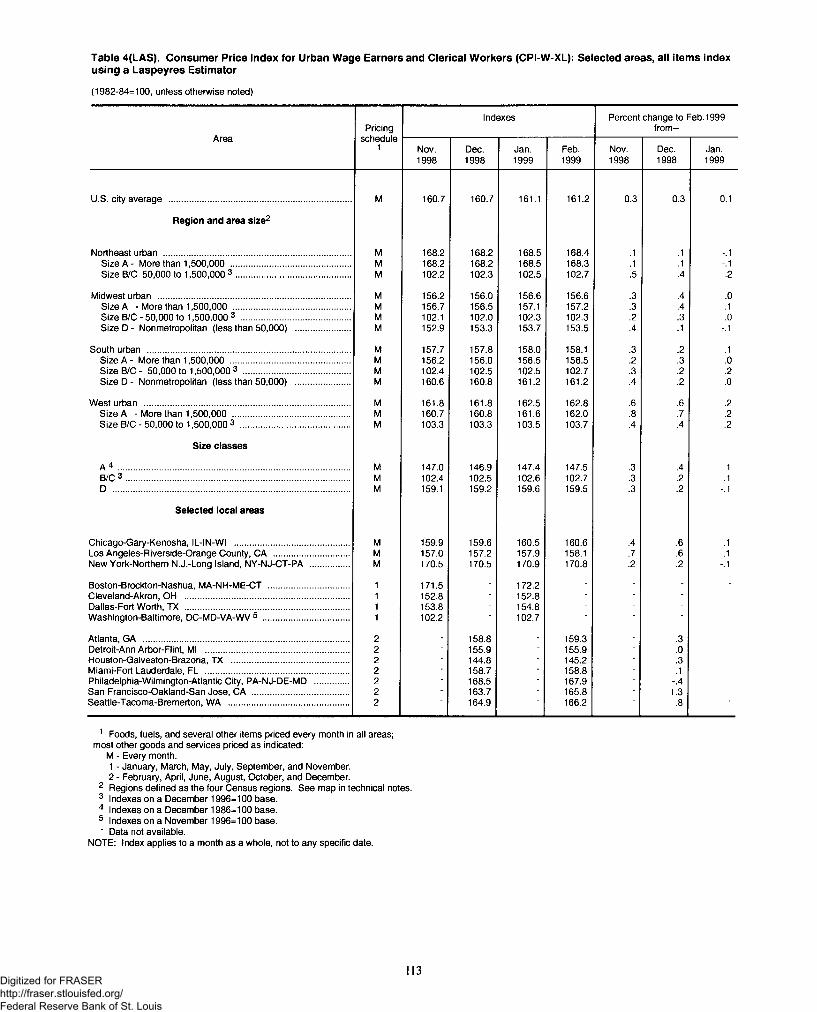
Table 4(LAS). Consumer Price Index for Urban Wage Earners and Clerical Workers (CPI-W-XL): Selected areas, all items indexusing a Laspeyres Estimator
(1982-84=100, unless otherwise noted)
AreaPricing
schedule1
Indexes Percent change to Feb. 1999 from -
Nov.1998
Dec.1998
Jan.1999
Feb.1999
Nov.1998
Dec.1998
Jan.1999
U.S. city average ............................................................................ M 160.7 160.7 161.1 161.2 0.3 0.3 0.1
Region and area size2
Northeast urban .............................................................................. M 168.2 168.2 168.5 168.4 .1 .1 -.1Size A - More than 1,500,000 .................................................. M 168.2 168.2 168.5 168.3 .1 .1 -.1Size B/C 50,000 to 1,500,000 3 ................................................ M 102.2 102.3 102.5 102.7 .5 .4 .2
Midwest urban ................................................................................ M 156.2 156.0 156.6 156.6 .3 .4 .0Size A - More than 1,500,000 ................................................. M 156.7 156.5 157.1 157.2 .3 .4 .1Size B/C - 50,000 to 1,500,000 3 .............................................. M 102.1 102.0 102.3 102.3 .2 .3 .0Size D - Nonmetropolitan (less than 50,000) ....................... M 152.9 153.3 153.7 153.5 .4 .1 -.1
South urban ..................................................................................... M 157.7 157.8 158.0 158.1 .3 .2 .1Size A - More than 1,500,000 .................................................. M 156.2 156.0 156.5 156.5 .2 .3 .0Size B/C - 50,000 to 1,500,000 3 ............................................. M 102.4 102.5 102.5 102.7 .3 .2 .2Size D - Nonmetropolitan (less than 50,000) ....................... M 160.6 160.8 161.2 161.2 .4 .2 .0
West urban ...................................................................................... M 161.8 161.8 162.5 162.8 .6 .6 .2Size A - More than 1,500,000 ................................................. M 160.7 160.8 161.6 162.0 .8 .7 .2Size B/C - 50,000 to 1,500,000 3 .............................................. M 103.3 103.3 103.5 103.7 .4 .4 .2
Size classes
A 4 ................................................................................................ M 147.0 146.9 147.4 147.5 .3 .4 1B/C 3 ............................................................................................. M 102.4 102.5 102.6 102.7 .3 .2 .1D ................................................................................................... M 159.1 159.2 159.6 159.5 .3 .2 -.1
Selected local areas
Chicago-Gary-Kenosha, IL-IN-WI ................................................ M 159.9 159.6 160.5 160.6 .4 .6 .1Los Angeles-Riverside-Orange County, CA ............................... M 157.0 157.2 157.9 158.1 .7 .6 .1New York-Northern N.J.-Long Island, NY-NJ-CT-PA ................ M 170.5 170.5 170.9 170.8 .2 .2 -.1
Boston-Brockton-Nashua, MA-NH-ME-CT .................................. 1 171.5 - 172.2 - - - -Cleveland-Akron, OH .................................................................... 1 152.8 - 152.8 - - -Dallas-Fort Worth, TX .................................................................... 1 153.8 - 154.8 - - -Washington-Baltimore, DC-MD-VA-WV 5 .................................... 1 102.2 ■ 102.7 ■ ■ ■
Atlanta, GA ...................................................................................... 2 - 158.8 - 159.3 - .3Detroit-Ann Arbor-Flint, Ml ............................................................ 2 - 155.9 - 155.9 - .0Houston-Galveston-Brazoria, TX ................................................. 2 - 144.8 - 145.2 - .3Miami-Fort Lauderdale, FL ............................................................ 2 158.7 - 158.8 - .1Philadelphia-Wilmington-Atlantic City, PA-NJ-DE-MD .............. 2 - 168.5 - 167.9 - -.4San Francisco-Oakland-San Jose, CA ........................................ 2 - 163.7 - 165.8 - 1.3Seattle-Tacoma-Bremerton, WA .................................................. 2 164.9 166.2 .8
1 Foods, fuels, and several other items priced every month in all areas; most other goods and services priced as indicated:
M - Every month.1 - January, March, May, July, September, and November.2 - February, April, June, August, October, and December.
2 Regions defined as the four Census regions. See map in technical notes.3 Indexes on a December 1996=100 base.4 Indexes on a December 1986=100 base.5 Indexes on a November 1996=100 base." Data not available.
NOTE: Index applies to a month as a whole, not to any specific date.
113Digitized for FRASER http://fraser.stlouisfed.org/ Federal Reserve Bank of St. Louis
Technical Note
Brief Explanation of the CPI
The Consumer Price Index (CPI) is a measure of the average change in prices over time in a fixed market basket of goods and services. The Bureau of Labor Statistics publishes CPIs for two population groups: (1) a CPI for All Urban Consumers (CPI-U) which covers approximately 87 percent of the total population and (2) a CPI for Urban Wage Earners and Clerical Workers (CPI-W) which covers 32 percent of the total population. The CPI-U includes, in addition to wage earners and clerical workers, groups such as professional, managerial, and technical workers, the self-employed, short-term workers, the unemployed, and retirees and others not in the labor force.
The CPI is based on prices of food, clothing, shelter, and fuels, transportation fares, charges for physicians’ and dentists’ services, drugs, and other goods and services that people buy for day-to-day living. Prices are collected in 87 urban areas across the country from about 50,000 housing units and approximately 23,000 retail establishments-department stores, supermarkets, hospitals, filling stations, and other types of stores and service establishments. All taxes directly associated with the purchase and use of items are included in the index. Prices of fuels and a few other items are obtained every month in all 87 locations. Prices of most other commodities and services are collected every month in the three largest metropolitan areas and every other month in other areas. Prices of most goods and services are obtained by personal visits or telephone calls by the Bureau’s trained representatives.
In calculating this index, price changes for the various items in each location are averaged together with weights that represent their importance in the spending of the appropriate population group. Local data are then combined to obtain a U.S. city average. Separate indexes are also published by size of city, by region of the country, for cross-classifications of regions and population-size classes, and for 26 local areas. Area indexes do not measure differences in the level of prices among cities; they only measure the average change in prices for each area since the base period.
The index measures price change from a designed reference date— 1982-84, which equals 100.0. An increase of 16.5 percent, for example, is shown as 116.5. This change can also be expressed in dollars as follows: the price of a base period market basket of goods and services in the CPI has risen from $10 in 1982-84 to $11.65.
For further details, see BLS Handbook o f Methods, Chapter 17, the Consumer Price Index, Bulletin 2490, April 1997.
Calculating index changesMovements of indexes from one month to another are usually expressed as percent changes, rather than changes in index points, because index point changes are affected by the level of the index in relation to its base period, while percent changes are not. The example below illustrates the computation of index point and percent changes.
Percent changes for 3-month and 6-month periods are expressed as annual rates and are computed according to the standard formula for compound growth rates. These data indicate what the percent change would be, if the current rate were maintained for a 12-month period.
Index point change
CPi 115.7Less previous index 111.2Equals index point change 4.5
Percent change
Index point difference 4.5Divided by the previous index 111.2Equals 0.040Results multiplied by one hundred 0.040x100Equals percent change 4.0
Energy pricesPrices are usually available for the U.S. city average, 13 large metropolitan areas, the 4 census regions, 3 size classifications, and 10 areas reflecting the 4 census regions cross-clas- sified by the 3 population sizes. However, not all energy commodities and services are used in every area of the country. Fuel oil, for example, is not a common heating fuel in some urban areas, particularly in the South and West. Where no average prices are available, the designation NA appears. This designation also appears, if the data sufficiency criteria have not been met in any given month. For example, if there are fewer than five usable fuel oil prices for a published city or region size class, no fuel oil prices for the area will be published.
All prices are collected monthly by BLS representatives in the urban areas priced for the CPI. Prices for natural gas and electricity include fuel and purchased gas adjustments and
114Digitized for FRASER http://fraser.stlouisfed.org/ Federal Reserve Bank of St. Louis
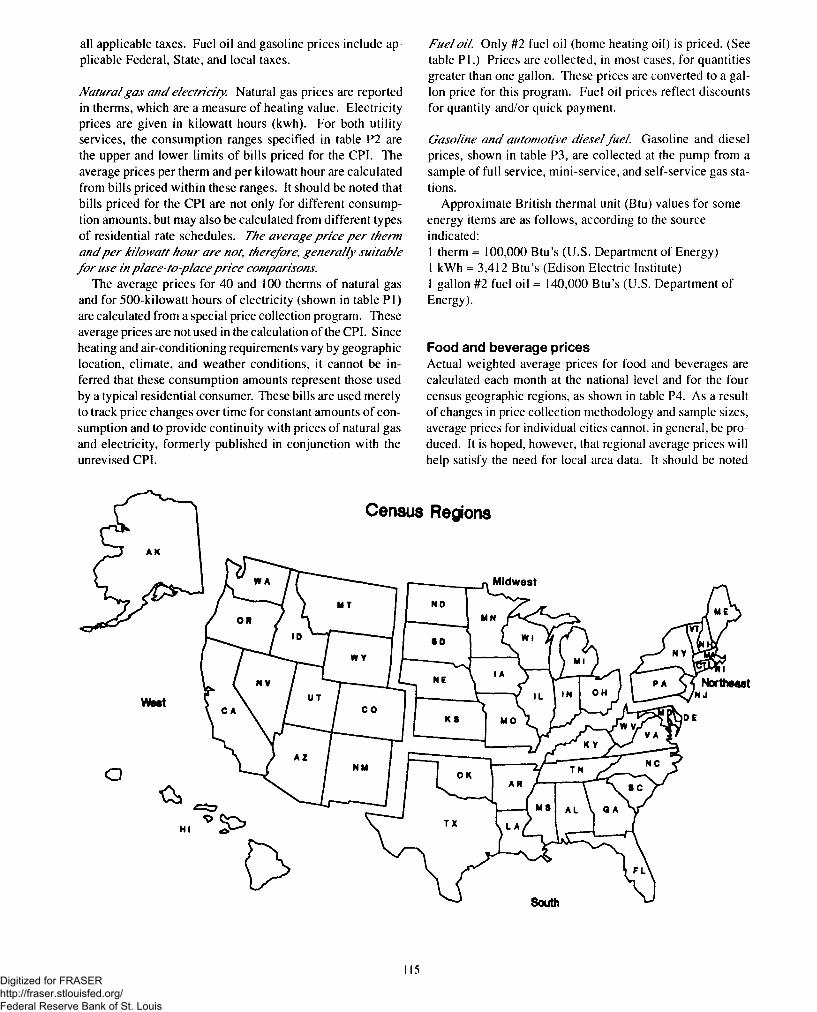
all applicable taxes. Fuel oil and gasoline prices include applicable Federal, State, and local taxes.
Natural gas and electricity. Natural gas prices are reported in therms, which are a measure of heating value. Electricity prices are given in kilowatt hours (kwh). For both utility services, the consumption ranges specified in table P2 are the upper and lower limits of bills priced for the CPI. The average prices per therm and per kilowatt hour are calculated from bills priced within these ranges. It should be noted that bills priced for the CPI are not only for different consumption amounts, but may also be calculated from different types of residential rate schedules. The average price per therm and per kilowatt hour are not, therefore, generally suitable fo r use in place-to-place price comparisons.
The average prices for 40 and 100 therms of natural gas and for 500-kilowatt hours of electricity (shown in table P I ) are calculated from a special price collection program. These average prices are not used in the calculation of the CPI. Since heating and air-conditioning requirements vary by geographic location, climate, and weather conditions, it cannot be inferred that these consumption amounts represent those used by a typical residential consumer. These bills are used merely to track price changes over time for constant amounts of consumption and to provide continuity with prices of natural gas and electricity, formerly published in conjunction with the unrevised CPI.
Fuel o il Only #2 fuel oil (home heating oil) is priced. (See table PI.) Prices are collected, in most cases, for quantities greater than one gallon. These prices are converted to a gallon price for this program. Fuel oil prices reflect discounts for quantity and/or quick payment.
Gasoline and automotive diesel fuel. Gasoline and diesel prices, shown in table P3, are collected at the pump from a sample of full service, mini-service, and self-service gas stations.
Approximate British thermal unit (Btu) values for some energy items are as follows, according to the source indicated:1 therm = 100,000 Btu’s (U.S. Department of Energy)1 kWh = 3,412 Btu’s (Edison Electric Institute)1 gallon #2 fuel oil = 140,000 Btu’s (U.S. Department of Energy).
Food and beverage pricesActual weighted average prices for food and beverages are calculated each month at the national level and for the four census geographic regions, as shown in table P4. As a result of changes in price collection methodology and sample sizes, average prices for individual cities cannot, in general, be produced. It is hoped, however, that regional average prices will help satisfy the need for local area data. It should be noted
Census Regions
Digitized for FRASER http://fraser.stlouisfed.org/ Federal Reserve Bank of St. Louis
that average prices for food in this report reflect variations in brand, quality, and size among geographic areas. Users of average food prices should be aware that these differences exist.
Because a number of food commodities are not available in all areas on a year-round basis, prices will not appear in some months for some regions or for the U.S. city average. In other instances, sufficient prices may not be available, due to temporary disruptions in supplies. Where no average prices are available, the designation NA appears. When a price is not available from an individual store in any month, an estimated price will be calculated for the missing item and used in computing the average price. In cases where the proportion of estimated prices used to calculate the average is considered too high, the average price is not published and NA appears for that item in the table.
Because of space limitations in the table, the description for each item is abbreviated. More detailed specifications are available from BLS regional offices or from the Washington office upon request.
Seasonally adjusted data and unadjusted dataBecause price data are used for different purposes by different groups, the Bureau of Labor Statistics publishes seasonally adjusted, as well as unadjusted changes, each month.
For analyzing general price trends in the economy, seasonally adjusted changes are usually preferred, since they eliminate the effect of changes that normally occur at the same time and in about the same magnitude every year— such as price movements resulting from changing climatic conditions, production cycles, model changeovers, holidays, and sales.
The unadjusted data are of primary interest to consumers concerned about the prices they actually pay. Unadjusted data also are used extensively for escalation purposes. Many collective bargaining contract agreements and pension plans, for example, tie compensation changes to the Consumer Price Index unadjusted for seasonal variation.
Seasonal factors used in computing seasonally adjusted indexes are derived by the X-12-ARIMA Seasonal Adjustment Method. The updated seasonal data at the end of 1977 replaced data from 1967 through 1977. Subsequent annual updates have replaced 5 years of seasonal data, e.g., data from 1993 through 1997 were replaced at the end of 1997. The seasonal movement of all items and 54 other aggregations is derived by combining the seasonal movement of 73 selected components. Each year, the seasonal status of every series is reevaluated, based on certain statistical criteria. If any of the 73 components change their seasonal adjustment status from seasonally adjusted to not seasonally adjusted, not seasonally adjusted data will be used for the last 5 years; but the seasonally adjusted indexes will be used before that period.
Seasonally adjusted data, including the All items index levels, are subject to revision for up to 5 years after their original release. For this reason, BLS advises against the use of these data in escalation agreements.
Effective with the calculation of the seasonal factors for 1990, the Bureau of Labor Statistics has used an enhanced
seasonal adjustment procedure called intervention analysis seasonal adjustment for some CPI series. Intervention analysis seasonal adjustment allows for better estimates of seasonally adjusted data. Extreme values or sharp movements, which might distort the seasonal pattern, are estimated and removed from the data, prior to calculation of seasonal factors. Beginning with the calculation of seasonal factors for 1996, X-12- ARIMA software has been used for intervention analysis seasonal adjustment.
For the fuel oil and the motor fuels indexes, this procedure is used to offset the effects that extreme price volatility would otherwise have had on the estimates of seasonally adjusted data for those series. For some women’s apparel indexes and the girls’ apparel index, the procedure is used to offset the effects of changes in pricing methodology. For the tobacco and smoking products index, this procedure is used to offset the effects of increases in excise taxes and wholesale tobacco prices. For some alcoholic beverage series, intervention analysis seasonal adjustment is used to offset the effects of excise tax increases. For the nonalcoholic beverages index, the procedure is used to offset the effects of a large increase in coffee prices, due to adverse weather. For the water and sewerage maintenance index, the procedure is used to account for a data collection anomaly.
A description of intervention analysis seasonal adjustment, as well as a list of unusual events modeled and seasonal factors for these items, can be obtained by writing to the Bureau of Labor Statistics, Division of Consumer Prices and Price Indexes, Washington, DC 20212, by calling Claire Me Anaw Gallagher at (202) 606-6968, or by e-mailing her (gallagfaer_c@bl&gov).
Since the release of seasonal adjustment factors for 1997, in February 1998, seasonal adjustment is performed using X -12-ARIMA. X -12-ARIMA is a new seasonal adjustment software package developed by the U.S. Department of Commerce, Bureau of the Census. The X -12-ARIMA seasonal adjustment program is an enhanced version of the X-11 Variant of the Census Method II seasonal adjustment program. The enhancements include a variety of new diagnostics and modeling tools to help the user detect and remedy any inadequacies in the seasonal adjustments obtained under the program options selected.
Metropolitan areasBLS publishes three major metropolitan areas monthly:
Chicago-Gary-Kenosha, IL-IN-WI Los Angeles-Riverside-Orange County, CA New York-Northern New Jersey-Long Island,
NY-NJ-CT-PA
Data for additional 11 metropolitan areas are published every other month [on an odd (January, M arch, etc.) or even (February, April, etc.) month schedule] for the following areas:
Atlanta, GA -evenBoston-Brockton-Nashua, MA-NH-ME-CT -odd
116Digitized for FRASER http://fraser.stlouisfed.org/ Federal Reserve Bank of St. Louis
Cleveland-Akron, OH -oddDallas-Fort Worth, TX -oddDetroit-Ann Arbor-Flint, MI -evenHouston-Galveston-Brazoria, TX -evenMiami-Fort Lauderdale, FL
PA-NJ-DE-MD -evenPhiladelphia-Wilmington-Atlantic City, -evenSan Francisco-Oakland-San Jose, CA -evenSeattle-Tacoma-Bremerton, WA -evenWashington-Baltimore, DC-MD-VA-WV -odd
(Note: The designation even or odd refers to the month during which the area’s price change is measured. Due to the time needed for processing, data are released 2 to 3 weeks into the following month.)Data are published for an additional group of 12 metropolitan areas on a semiannual basis. These indexes, which refer to the arithmetic average for the 6-month periods from January through June and July through December, are published with release of the CPI for July and January, respectively, in August and February for:
Anchorage, AKCincinnati-Hamilton, OH-KY-IN Denver-Boulder-Greeley, CO Honolulu, HI Kansas City, MO-KS Milwaukee-Racine, WI Minneapolis-St. Paul, MN-WI Pittsburgh, PA Portland-Salem, OR-WA San Diego, CA St. Louis, MO-ILTampa-St. Petersburg-Clearwater, FL
How to Obtain Consumer Price Index Information
Consumer Price Index (CPI) information is available from the Bureau of Labor Statistics (BLS) electronically, through publication subscriptions, and via telephone and fax through automated recordings. Information specialists are also available in the national and regional offices, to provide help and to respond to questions.
Electronic access to CPI dataBLS on the Internet. Through the Internet, BLS provides free, continuous access to published CPI data and press releases. The most recent month’s CPI is made available immediately at the time of release. Additionally, a database called LABSTAT, containing current and historical data for the CPI is accessible. Data and press releases from other BLS surveys are also available. The BLS site is accessible via the World Wide Web (WWW), Gopher, and File Transfer Protocol (FTP), as described below. Send e-mail to labstatJhdpdesk@bl&gov for help using any of these systems.
World Wide Web. BLS m aintains a Web site a t (http:// stats.bls.gov). This BLS hom epage provides access to LABSTAT, as well as links to program-specific homepages. The CPI homepage http://stats.bls.goy/cpihome.htm provides other CPI information, as well as indexes. This includes a brief explanation of methodology, frequently asked questions and answers, contacts for further information, and explanations of how the CPI handles special items, like medical care and housing. In addition, CPI press releases and historical data for metropolitan areas can be accessed by linking to regional office homepages from the main BLS Web site listed above.
FTP and Gopher. These tools provide access to CPI LABSTAT data, as well as documentation and press release files organized in hierarchical directories. Connect to stats.bls.gov using FTP or Gopher. Log on as ’’anonymous,” and use your complete Internet e-mail address as the password.
Subscriptions to CPI publicationsSummary data. Free, monthly, 2-page publication containing 1- and 12-month percent changes for selected U.S. city average Consumer Price Index for All Urban Consumers (CPI- U) and Consumer Price Index for Urban Wage Earners and Clerical Workers (CPI-W) index series. The all items index data for each local area are also included. To be added to the mailing list, write to: Office of Publications, Bureau of Labor S tatistics , 2 M assachusetts Avenue, NE, Room 2850, Washington, DC 20212-0001, or call (202) 606-7828 or any of the BLS regional offices listed below.
CPI D etailed Report. Most comprehensive report of the Consumer Price Index. This publication may be ordered by writing to: New Orders, Superintendent of Documents, P.O. Box 371954, Pittsburgh, PA, 15250-7954 or by calling (202) 512-1800. Subscriptions cost $27 per year.
M onthly Labor Review (MLR). The MLR provides selected CPI data included in a monthly summary of BLS data and occasional articles and methodological descriptions too extensive for inclusion in the CPI D etailed Report. The MLR costs $27 per year. This publication may be ordered by writing to: New Orders, Superintendent of Documents, P.O. Box 371954, Pittsburgh, PA 15250-7954 or by calling (202) 512- 1800.
Recorded CPI dataSummary CPI data are provided on 24-hour recorded messages. Detailed CPI information is available by calling (202) 606-STAT. A touch-tone telephone is recommended, as this system allows the user to select specific indexes from lists of available data.
Recorded summaries of CPI are also available by calling any one of the metropolitan area CPI hot lines listed below.
117Digitized for FRASER http://fraser.stlouisfed.org/ Federal Reserve Bank of St. Louis
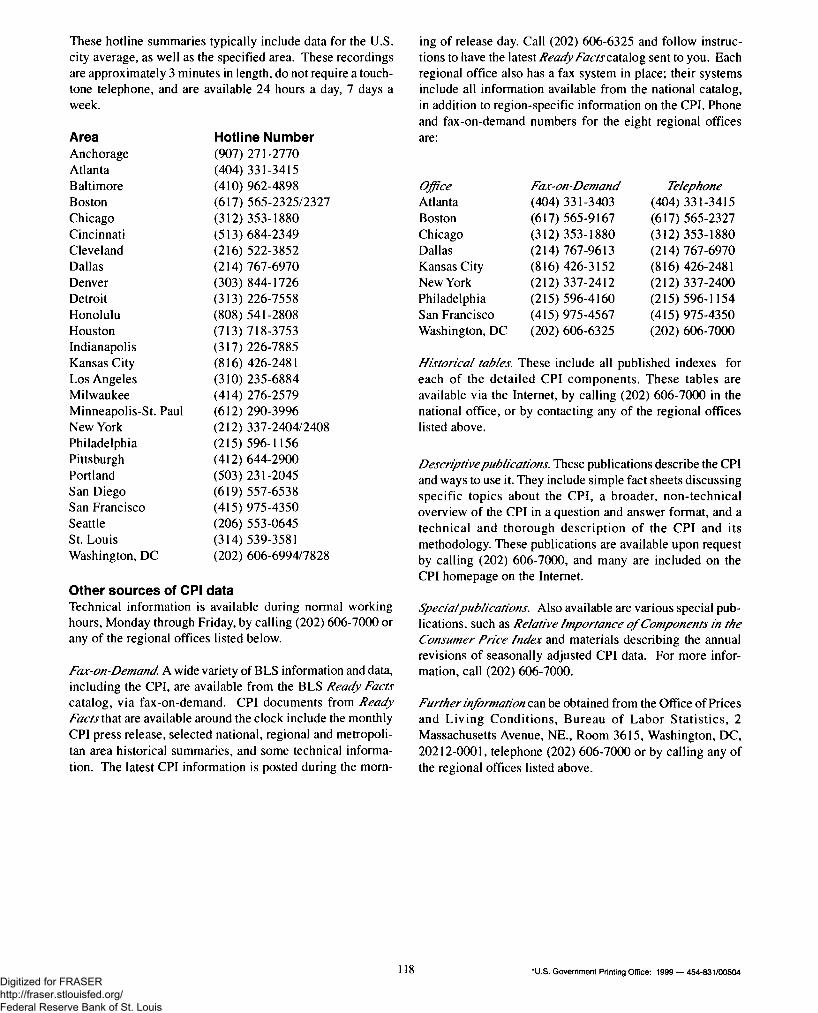
These hotline summaries typically include data for the U.S. city average, as well as the specified area. These recordings are approximately 3 minutes in length, do not require a touch- tone telephone, and are available 24 hours a day, 7 days a week.
AreaAnchorageAtlantaBaltimoreBostonChicagoCincinnatiClevelandDallasDenverDetroitHonoluluHoustonIndianapolisKansas CityLos AngelesMilwaukeeMinneapolis-St. PaulNew YorkPhiladelphiaPittsburghPortlandSan DiegoSan FranciscoSeattleSt. LouisWashington, DC
Hotline Number907) 271-2770 404) 331-3415 410) 962-4898 617) 565-2325/2327312) 353-1880 513) 684-2349 216) 522-3852214) 767-6970 303) 844-1726313) 226-7558 808) 541-2808 713) 718-3753 317) 226-7885 816) 426-2481 310) 235-6884414) 276-2579 612) 290-3996 212) 337-2404/2408215) 596-1156 412) 644-2900 503) 231-2045 619) 557-6538415) 975-4350 206) 553-0645314) 539-3581 202) 606-6994/7828
Other sources of CPI dataTechnical information is available during normal working hours, Monday through Friday, by calling (202) 606-7000 or any of the regional offices listed below.
Fax-on-Demand. A wide variety of BLS information and data, including the CPI, are available from the BLS Ready Facts catalog, via fax-on-demand. CPI documents from Ready Facts that are available around the clock include the monthly CPI press release, selected national, regional and metropolitan area historical summaries, and some technical information. The latest CPI information is posted during the morn
ing of release day. Call (202) 606-6325 and follow instructions to have the latest Ready Facts catalog sent to you. Each regional office also has a fax system in place; their systems include all information available from the national catalog, in addition to region-specific information on the CPI. Phone and fax-on-demand numbers for the eight regional officesare:
Office Atlanta Boston Chicago Dallas Kansas City New York Philadelphia San Francisco Washington, DC
Fax-on-Demand (404) 331-3403 (617) 565-9167 (312) 353-1880(214) 767-9613 (816) 426-3152 (212) 337-2412(215) 596-4160 (415) 975-4567 (202) 606-6325
Telephone (404) 331-3415 (617) 565-2327 (312) 353-1880(214) 767-6970 (816) 426-2481 (212) 337-2400(215) 596-1154 (415) 975-4350 (202) 606-7000
Historical tables. These include all published indexes for each of the detailed CPI com ponents. These tables are available via the Internet, by calling (202) 606-7000 in the national office, or by contacting any of the regional offices listed above.
Descriptive publications. These publications describe the CPI and ways to use it. They include simple fact sheets discussing specific topics about the CPI, a broader, non-technical overview of the CPI in a question and answer format, and a technical and thorough descrip tion o f the CPI and its methodology. These publications are available upon request by calling (202) 606-7000, and many are included on the CPI homepage on the Internet.
Special publications. Also available are various special publications, such as Relative Importance o f Components in the Consumer Price Index and materials describing the annual revisions of seasonally adjusted CPI data. For more information, call (202) 606-7000.
Further information can be obtained from the Office of Prices and Living C onditions, B ureau o f Labor S ta tis tics , 2 Massachusetts Avenue, NE., Room 3615, Washington, DC, 20212-0001, telephone (202) 606-7000 or by calling any of the regional offices listed above.
118 ‘ U.S. Government Printing Office: 1999 — 454-831/00504Digitized for FRASER http://fraser.stlouisfed.org/ Federal Reserve Bank of St. Louis