cramlington precision forge limited · north nelson ind. estate, cramlington, united kingdom ne23...
TRANSCRIPT

ANNUAL REPORT
for the year endedDecember 31, 2017
Cramlington Precision Forge Limited(Incorporated in United Kingdom)

1
Cramlington Precision Forge Limited,United Kingdom

2
Cramlington Precision Forge Limited,United Kingdom

3

4
Cramlington Precision Forge Limited,United Kingdom

5
6
Cramlington Precision Forge Limited,United Kingdom
7

8
Cramlington Precision Forge Limited,United Kingdom

9

10
Cramlington Precision Forge Limited,United Kingdom

11

12
Cramlington Precision Forge Limited,United Kingdom

13

14
Cramlington Precision Forge Limited,United Kingdom

15

16
Cramlington Precision Forge Limited,United Kingdom

17

18
Cramlington Precision Forge Limited,United Kingdom

19

20
Cramlington Precision Forge Limited,United Kingdom

21

22
Cramlington Precision Forge Limited,United Kingdom

23
Balance Sheet as at 31 December 2017
Particulars Note
As at31 December 2017
As at31 December 2016
GBP ` GBP `
ASSETS
Non-current assets
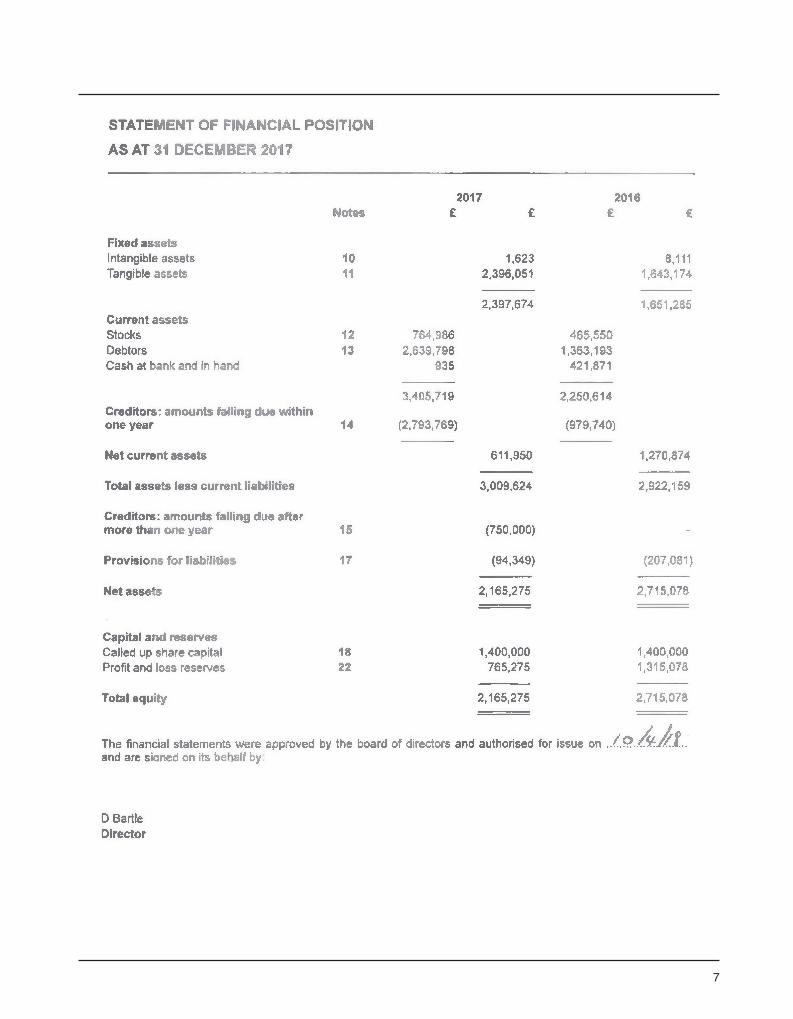
Property, plant and equipment 5 2,387,111 205,840,624 1,628,185 135,986,051
Intangible assets 6 1,623 139,914 8,111 677,395
Other non-current assets 7 8,939 770,810 14,988 1,251,798
2,397,673 206,751,348 1,651,284 137,915,244
Current assets
Inventories 8 764,986 65,964,743 465,550 38,882,703
Financial assets
- Trade receivables 9 2,083,400 179,651,582 1,205,115 100,651,180
- Cash and cash equivalents 10 2,103 181,342 421,871 35,234,665
Other current assets 7 581,900 50,177,237 158,078 13,202,635
3,432,389 295,974,904 2,250,614 187,971,183
Total assets 5,830,062 502,726,252 3,901,898 325,886,427
EQUITY AND LIABILITIES
Equity
Equity Share capital 11 1,400,000 120,722,000 1,400,000 116,928,000
Other equity 765,274 65,989,582 1,315,078 109,835,265
Total equity 2,165,274 186,711,582 2,715,078 226,763,265
Liabilities
Non-current liabilities
Financial liabilities
- Borrowings 12 750,000 64,672,500 - -
- Other fi nancial liabilities 15 - - - -
Deferred tax liabilities (Net) 13 94,349 8,135,715 207,081 17,295,405
844,349 72,808,215 207,081 17,295,405
Current liabilities
Financial liabilities
- Borrowings 12 657,458 56,692,603 - -
- Trade payables 14
Dues to others 1,825,090 157,377,511 814,315 68,011,568
- Other fi nancial liabilities 15 284,196 24,506,221 35,360 2,953,271
Other current liabilities 16 53,695 4,630,120 130,064 10,862,918
Total current liabilities 2,820,439 243,206,455 979,739 81,827,757
Total equity and liabilities 5,830,062 502,726,252 3,901,898 325,886,427
Notes 1 to 28 form an integral part of these fi nancial statements
This is the balance sheet referred to in our report of even date
TRANSLATED FINANCIAL STATEMENTS
24
Cramlington Precision Forge Limited,United Kingdom
Statement of Profi t and Loss for the year ended 31 December 2017
Note
Year ended31 December 2017
Year ended31 December 2016
GBP ` GBP `
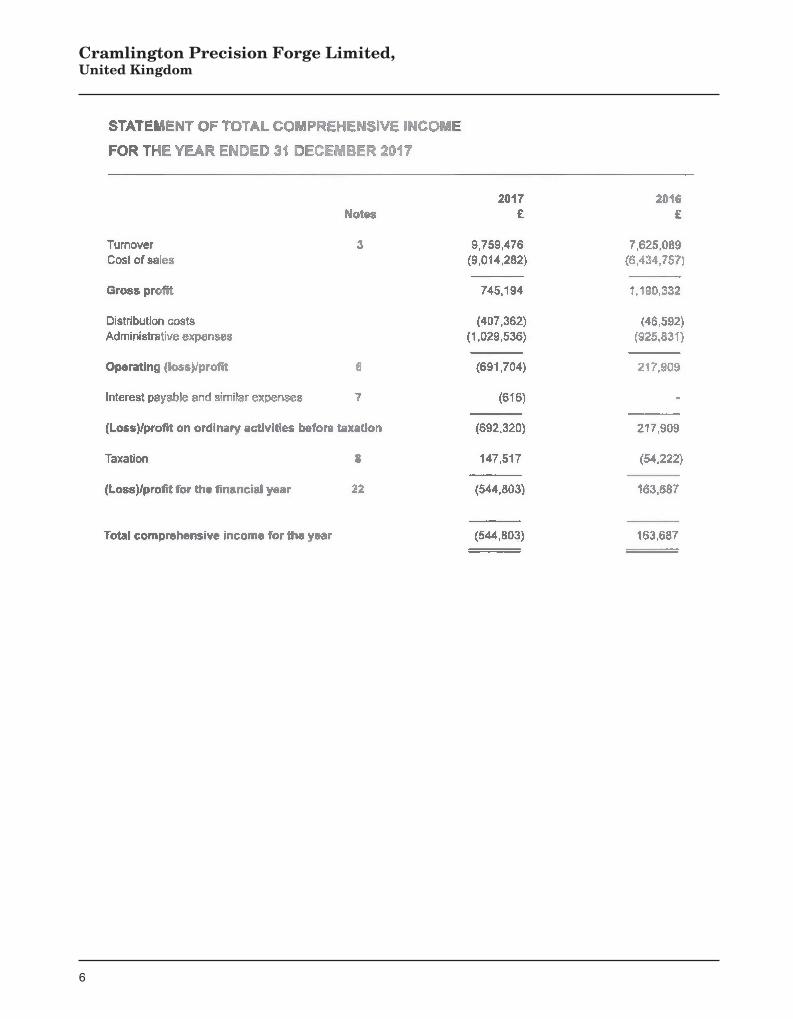
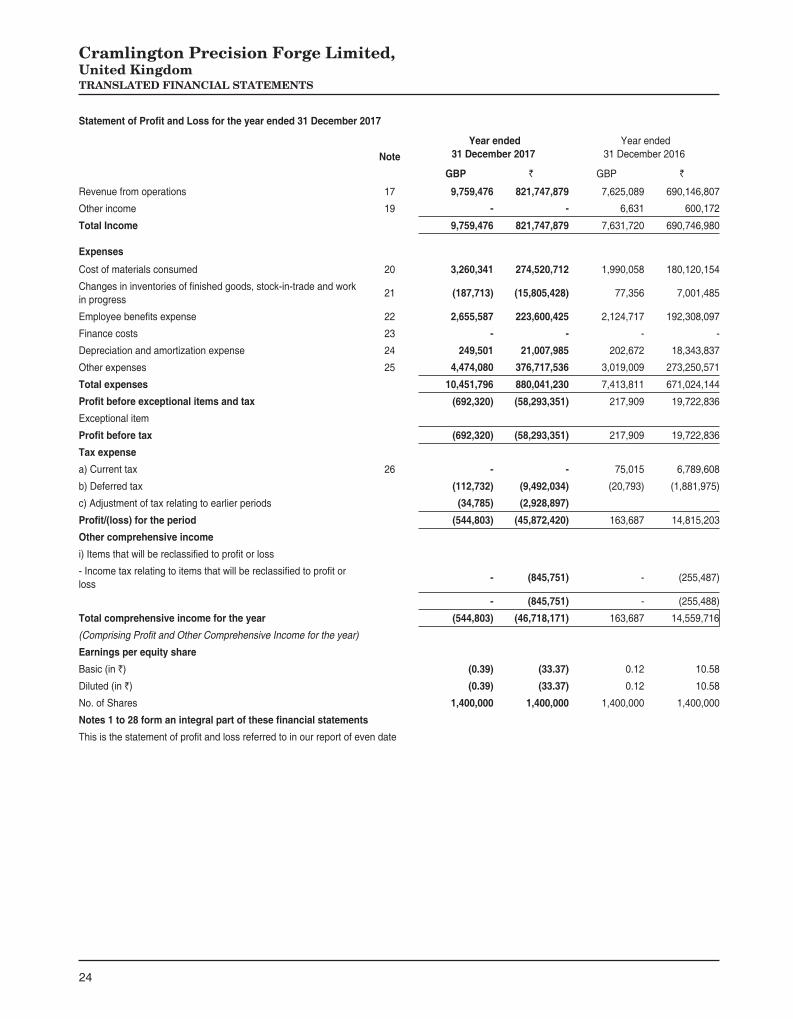
Revenue from operations 17 9,759,476 821,747,879 7,625,089 690,146,807
Other income 19 - - 6,631 600,172
Total Income 9,759,476 821,747,879 7,631,720 690,746,980
Expenses
Cost of materials consumed 20 3,260,341 274,520,712 1,990,058 180,120,154
Changes in inventories of fi nished goods, stock-in-trade and work in progress
21 (187,713) (15,805,428) 77,356 7,001,485
Employee benefi ts expense 22 2,655,587 223,600,425 2,124,717 192,308,097
Finance costs 23 - - - -
Depreciation and amortization expense 24 249,501 21,007,985 202,672 18,343,837
Other expenses 25 4,474,080 376,717,536 3,019,009 273,250,571
Total expenses 10,451,796 880,041,230 7,413,811 671,024,144
Profi t before exceptional items and tax (692,320) (58,293,351) 217,909 19,722,836
Exceptional item
Profi t before tax (692,320) (58,293,351) 217,909 19,722,836
Tax expense
a) Current tax 26 - - 75,015 6,789,608
b) Deferred tax (112,732) (9,492,034) (20,793) (1,881,975)
c) Adjustment of tax relating to earlier periods (34,785) (2,928,897)
Profi t/(loss) for the period (544,803) (45,872,420) 163,687 14,815,203
Other comprehensive income
i) Items that will be reclassifi ed to profi t or loss
- Income tax relating to items that will be reclassifi ed to profi t or loss
- (845,751) - (255,487)
- (845,751) - (255,488)
Total comprehensive income for the year (544,803) (46,718,171) 163,687 14,559,716
(Comprising Profi t and Other Comprehensive Income for the year)
Earnings per equity share
Basic (in `) (0.39) (33.37) 0.12 10.58
Diluted (in `) (0.39) (33.37) 0.12 10.58
No. of Shares 1,400,000 1,400,000 1,400,000 1,400,000
Notes 1 to 28 form an integral part of these fi nancial statements
This is the statement of profi t and loss referred to in our report of even date
TRANSLATED FINANCIAL STATEMENTS
25
TRANSLATED FINANCIAL STATEMENTS
Statements of Changes in Equity for the year ended 31 December 2017
A. Equity Share Capital
ParticularsAmount
GBP `
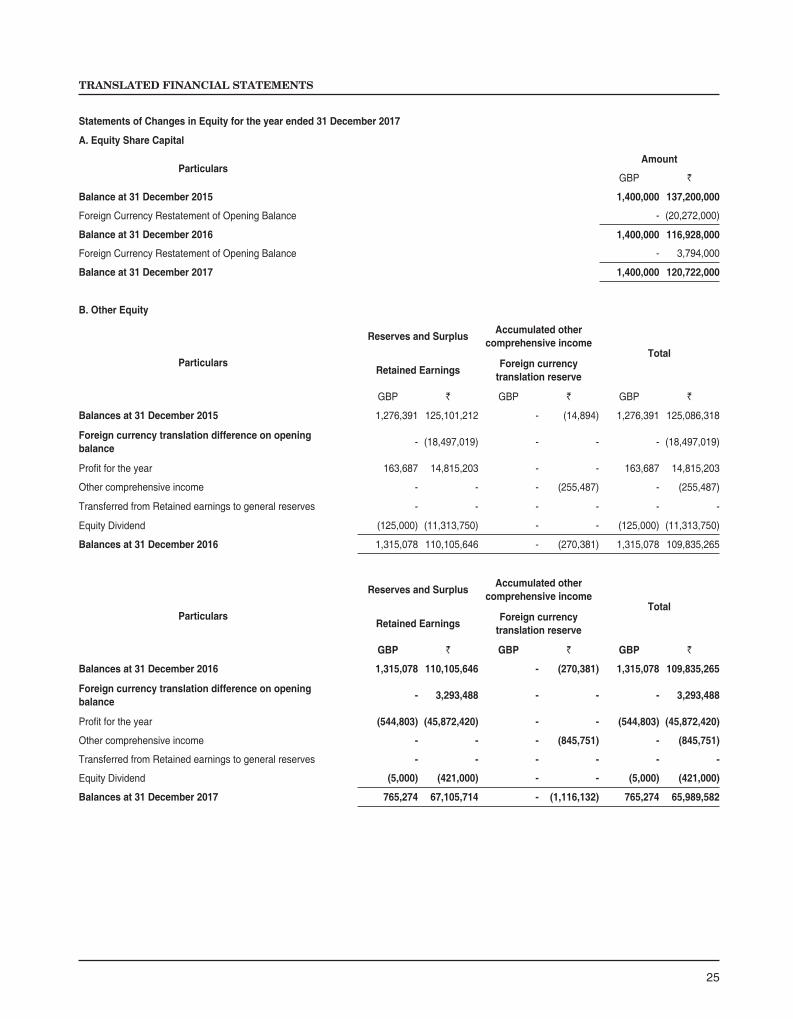
Balance at 31 December 2015 1,400,000 137,200,000
Foreign Currency Restatement of Opening Balance - (20,272,000)
Balance at 31 December 2016 1,400,000 116,928,000
Foreign Currency Restatement of Opening Balance - 3,794,000
Balance at 31 December 2017 1,400,000 120,722,000
B. Other Equity
Particulars
Reserves and SurplusAccumulated other
comprehensive incomeTotal
Retained EarningsForeign currency
translation reserve
GBP ` GBP ` GBP `
Balances at 31 December 2015 1,276,391 125,101,212 - (14,894) 1,276,391 125,086,318
Foreign currency translation difference on opening balance
- (18,497,019) - - - (18,497,019)
Profi t for the year 163,687 14,815,203 - - 163,687 14,815,203
Other comprehensive income - - - (255,487) - (255,487)
Transferred from Retained earnings to general reserves - - - - - -
Equity Dividend (125,000) (11,313,750) - - (125,000) (11,313,750)
Balances at 31 December 2016 1,315,078 110,105,646 - (270,381) 1,315,078 109,835,265
Particulars
Reserves and SurplusAccumulated other
comprehensive incomeTotal
Retained EarningsForeign currency
translation reserve
GBP ` GBP ` GBP `
Balances at 31 December 2016 1,315,078 110,105,646 - (270,381) 1,315,078 109,835,265
Foreign currency translation difference on opening balance
- 3,293,488 - - - 3,293,488
Profi t for the year (544,803) (45,872,420) - - (544,803) (45,872,420)
Other comprehensive income - - - (845,751) - (845,751)
Transferred from Retained earnings to general reserves - - - - - -
Equity Dividend (5,000) (421,000) - - (5,000) (421,000)
Balances at 31 December 2017 765,274 67,105,714 - (1,116,132) 765,274 65,989,582

26
Cramlington Precision Forge Limited,United KingdomTRANSLATED FINANCIAL STATEMENTS
Cash Flow statement for the year ended 31 December 2017
Year ended 31 December 2017
Year ended 31 December 2016
GBP ` GBP `
Cash fl ows from operating activities
Profi t before tax (692,320) (58,293,351) 217,909 19,722,836
Adjustments to reconcile net income to net cash provided by operating activities
Depreciation and amortization 249,501 21,007,985 202,672 18,343,837
Amortisation of leasehold property 6,048 509,326 6,049 547,496
Rectifi cation entry of historical liability balance - - (6,631) (600,172)
Operating profi t before working capital changes (436,771) (36,776,040) 419,999 38,013,997
Adjustments for:
(Decrease)/ increase in trade payables 1,010,775 85,107,276 (33,457) (3,028,183)
(Decrease)/ increase in other current liabilities 207,253 17,450,726 (132,586) (12,000,326)
Decrease/(Increase) in trade receivables (1,302,108) (109,637,475) (37,089) (3,356,945)
Decrease/(Increase) in inventories (299,436) (25,212,545) 84,791 7,674,470
Cash from/ (used) in operating activities (820,287) (69,068,058) 301,658 27,303,013
Direct taxes paid, net - - (75,015) (6,789,608)
Net cash from/ (used) in operating activities before extraordinary item (820,287) (69,068,058) 226,643 20,513,405
Proceeds from insurance company (fl ood loss) - - - -
Net cash from/ (used) in operating activities (820,287) (69,068,058) 226,643 20,513,405
B. Cash fl ow from investing activities
Purchase of assets (including capital work-in-progress and capital advances) (1,001,939) (84,363,264) (153,129) (13,859,706)
Net cash from/ (used) in investing activities (1,001,939) (84,363,264) (153,129) (13,859,706)
C. Cash fl ow from fi nancing activities
Redemption of Preference Shares - - (500,000) (45,255,000)
Proceeds from long-term borrowings 750,000 64,672,500 - -
Proceeds from Short-term borrowings 657,458 56,692,603 - -
Dividend Paid (5,000) (421,000) (125,000) (11,313,750)
Net cash generated from fi nancing activities 1,402,458 120,944,103 (625,000) (56,568,750)
D. Net cash fl ows during the year (419,768) (32,487,219) (551,486) (49,915,051)
E. Foreign Currency Translation Reserve Impact on cash fl ows - (2,566,104) (10,239,271)
F. Cash and cash equivalents at the beginning 421,871 35,234,665 973,357 95,388,987
G. Cash and cash equivalents at the end 2,103 181,342 421,871 35,234,665
Cash and cash equivalents comprise of:
Cash on hand 935 80,625 1,330 111,082
Balances with banks in current accounts 1,168 100,717 420,541 35,123,583
Cash and cash equivalents as per note 10 2,103 181,342 421,871 35,234,665

27
TRANSLATED FINANCIAL STATEMENTS
1 Corporate Information
Cramlington Precision Forge Limited (“CPFL” or ‘’the Company’’) was incorporated in UK.
The registered offi ce of the Company is situated at Unit 8, Atley Way, North Nelson Ind. Estate, Cramlington, United Kingdom NE23 9WA.
CPFL is in the business of manufacture and sale of precision forged (warm) components for application in heavy vehicles for on-highway and off-highway applications.
2 Basis of Preparation
The fi nancial statements of the Company have been prepared in accordance with Indian Accounting Standards (Ind AS) as prescribed by Ministry of Corporate Affairs under Companies (Indian Accounting Standards) Rules, 2015, provisions of the Companies Act 2013, to the extent notifi ed, pronouncements of the Institute of Chartered Accountants of India.
The fi nancial statements of the Company have been prepared in accordance United Kingdom Generally Accepted Accounting Practice (United Kingdom Accounting Standards and applicable law).
Carrying value of Plant, Property and Equipment, Investment Property under the Previous GAAP has been considered as the deemed cost for the purpose of transition to Ind AS.
3 Summary of accounting policies
3.1 Overall considerations
The fi nancial statements have been prepared applying the signifi cant accounting policies and measurement bases summarized below.
3.2 Foreign operations
In the Company’s fi nancial statements, all assets, liabilities and transactions in GBP are translated into INR. The functional currency (GBP) of the Company has remained unchanged during the reporting period.
Assets and liabilities have been translated into INR at the closing rate as at the reporting date. Income and expenses have been translated into INR at the average rate over the reporting period. Exchange differences are charged or credited to Other Comprehensive Income (OCI) and recognized in the currency translation reserve under equity.
3.3 Revenue
(i) Sale of products
Income of the Company is derived from sale of products and is net of any sales returns, rebates, discounts and trade discounts. Revenue is recognized when the Company has transferred to the buyer the signifi cant risks and rewards of ownership, which normally takes place upon delivery of goods to customers.
(ii) Rental Income
The Company also earns rental income from operating leases of its investment properties. Rental income is recognised in accordance with terms of lease.
3.4 Property, plant and equipment
As there is no change in the functional currency as at the date of transition, the Company has elected to adopt the carrying value of Plant property and equipment under the Previous GAAP as the deemed cost for the purpose of transition to Ind AS. Capital work in
Notes to fi nancial statements for the year ended 31st December 2017 Notes to fi nancial statements (Contd.)
progress, plant and equipment is stated at cost, net of accumulated depreciation and accumulated impairment losses, if any.
(i) Buildings and other equipment
Buildings and other equipment (comprising plant, fi ttings and furniture, vehicles etc.) are initially recognized at acquisition cost, including any costs directly attributable to bringing the assets to the location and condition necessary for them to be of use for company's business purposes. Buildings and other equipment are subsequently measured at cost less accumulated depreciation.
Depreciation is recognized on a straight-line basis, over the useful life of the buildings and other equipments. In respect of these assets, the useful life is detailed below:
Description Depreciation rateBuildings 5%Plant & Equipment 3.33% to 10%Furniture & Fixtures 10%
3.5 Intangible assets
Intangible assets include Software which are initially recognised at acquisition cost and subsequently amortised over the useful life. Amortisation is recognised on straight line basis at a rate of 33.33%
3.6 Leases (a) Operating leases All leases entered into are operating leases.
(b) Assets taken on lease Where the Company is a lessee, payments on operating lease
agreements are recognized as an expense on a straight-line basis over the lease term. Associated costs, such as maintenance and insurance, are expensed as incurred.
3.7 Investment property Investment properties are recognised initially at cost. Subsequent
to initial recognition, investment properties are stated at cost less accumulated depreciation.
The Company has depreciated assets based on Straight line method as per Schedule II to the Companies Act 2013.
3.8 Financial instruments Recognition, initial measurement and derecognition Financial assets (other than trade receivables) and fi nancial
liabilities are recognized when the Company becomes a party to the contractual provisions of the fi nancial instrument and are measured initially at fair value adjusted for transaction costs, except for those carried at fair value through profi t or loss which are measured initially at fair value. Trade receivables are recognised at their transaction value as the same do not contain signifi cant fi nancing component.
A payable is classifi ed as 'trade payable' if it is in respect of the amount due on account of goods purchased in the normal course of business. They are recognised at their transaction value as the same do not contain signifi cant fi nancing component.
Classifi cation and subsequent measurement of fi nancial assets: For the purpose of subsequent measurement, fi nancial assets are
classifi ed and measured based on the entity's business model for managing the fi nancial asset and the contractual cash fl ow characteristics of the fi nancial asset at:
• Amortised cost • Fair Value Through Other Comprehensive Income (FVTOCI) or • Fair Value Through Profi t or Loss (FVTPL)
28
Cramlington Precision Forge Limited,United KingdomTRANSLATED FINANCIAL STATEMENTS
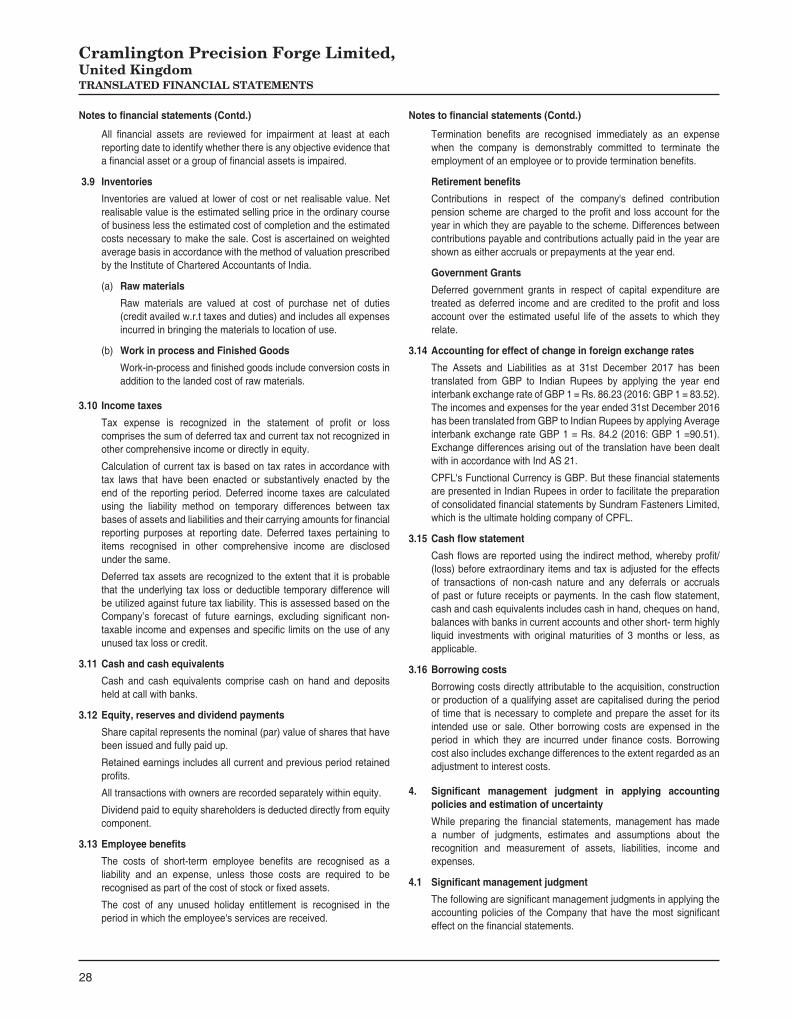
All fi nancial assets are reviewed for impairment at least at each reporting date to identify whether there is any objective evidence that a fi nancial asset or a group of fi nancial assets is impaired.
3.9 Inventories
Inventories are valued at lower of cost or net realisable value. Net realisable value is the estimated selling price in the ordinary course of business less the estimated cost of completion and the estimated costs necessary to make the sale. Cost is ascertained on weighted average basis in accordance with the method of valuation prescribed by the Institute of Chartered Accountants of India.
(a) Raw materials
Raw materials are valued at cost of purchase net of duties (credit availed w.r.t taxes and duties) and includes all expenses incurred in bringing the materials to location of use.
(b) Work in process and Finished Goods
Work-in-process and fi nished goods include conversion costs in addition to the landed cost of raw materials.
3.10 Income taxes
Tax expense is recognized in the statement of profi t or loss comprises the sum of deferred tax and current tax not recognized in other comprehensive income or directly in equity.
Calculation of current tax is based on tax rates in accordance with tax laws that have been enacted or substantively enacted by the end of the reporting period. Deferred income taxes are calculated using the liability method on temporary differences between tax bases of assets and liabilities and their carrying amounts for fi nancial reporting purposes at reporting date. Deferred taxes pertaining to items recognised in other comprehensive income are disclosed under the same.
Deferred tax assets are recognized to the extent that it is probable that the underlying tax loss or deductible temporary difference will be utilized against future tax liability. This is assessed based on the Company’s forecast of future earnings, excluding signifi cant non-taxable income and expenses and specifi c limits on the use of any unused tax loss or credit.
3.11 Cash and cash equivalents
Cash and cash equivalents comprise cash on hand and deposits held at call with banks.
3.12 Equity, reserves and dividend payments
Share capital represents the nominal (par) value of shares that have been issued and fully paid up.
Retained earnings includes all current and previous period retained profi ts.
All transactions with owners are recorded separately within equity.
Dividend paid to equity shareholders is deducted directly from equity component.
3.13 Employee benefi ts
The costs of short-term employee benefi ts are recognised as a liability and an expense, unless those costs are required to be recognised as part of the cost of stock or fi xed assets.
The cost of any unused holiday entitlement is recognised in the period in which the employee's services are received.
Termination benefi ts are recognised immediately as an expense when the company is demonstrably committed to terminate the employment of an employee or to provide termination benefi ts.
Retirement benefi ts
Contributions in respect of the company's defi ned contribution pension scheme are charged to the profi t and loss account for the year in which they are payable to the scheme. Differences between contributions payable and contributions actually paid in the year are shown as either accruals or prepayments at the year end.
Government Grants
Deferred government grants in respect of capital expenditure are treated as deferred income and are credited to the profi t and loss account over the estimated useful life of the assets to which they relate.
3.14 Accounting for effect of change in foreign exchange rates
The Assets and Liabilities as at 31st December 2017 has been translated from GBP to Indian Rupees by applying the year end interbank exchange rate of GBP 1 = Rs. 86.23 (2016: GBP 1 = 83.52). The incomes and expenses for the year ended 31st December 2016 has been translated from GBP to Indian Rupees by applying Average interbank exchange rate GBP 1 = Rs. 84.2 (2016: GBP 1 =90.51). Exchange differences arising out of the translation have been dealt with in accordance with Ind AS 21.
CPFL's Functional Currency is GBP. But these fi nancial statements are presented in Indian Rupees in order to facilitate the preparation of consolidated fi nancial statements by Sundram Fasteners Limited, which is the ultimate holding company of CPFL.
3.15 Cash fl ow statement
Cash fl ows are reported using the indirect method, whereby profi t/(loss) before extraordinary items and tax is adjusted for the effects of transactions of non-cash nature and any deferrals or accruals of past or future receipts or payments. In the cash fl ow statement, cash and cash equivalents includes cash in hand, cheques on hand, balances with banks in current accounts and other short- term highly liquid investments with original maturities of 3 months or less, as applicable.
3.16 Borrowing costs
Borrowing costs directly attributable to the acquisition, construction or production of a qualifying asset are capitalised during the period of time that is necessary to complete and prepare the asset for its intended use or sale. Other borrowing costs are expensed in the period in which they are incurred under fi nance costs. Borrowing cost also includes exchange differences to the extent regarded as an adjustment to interest costs.
4. Signifi cant management judgment in applying accounting policies and estimation of uncertainty
While preparing the fi nancial statements, management has made a number of judgments, estimates and assumptions about the recognition and measurement of assets, liabilities, income and expenses.
4.1 Signifi cant management judgment
The following are signifi cant management judgments in applying the accounting policies of the Company that have the most signifi cant effect on the fi nancial statements.
Notes to fi nancial statements (Contd.) Notes to fi nancial statements (Contd.)

29
TRANSLATED FINANCIAL STATEMENTS
4.2 Estimation of uncertainty
Information about estimates and assumptions that have the most signifi cant effect on recognition and measurement of assets, liabilities, income and expenses is provided below. Actual results may be substantially different.
4.3 Useful lives of depreciable assets
Management has reviewed its estimate of the useful lives of depreciable assets at each reporting date, based on the expected utility of the assets. Uncertainties in these estimates relate to technological obsolescence that may change the utility of assets including I.T assets.
Notes to fi nancial statements (Contd.)Notes to fi nancial statements (Contd.)
4.4 Inventories
Management has carefully estimated the net realizable values of inventories, taking into account the most reliable evidence available at each reporting date. The future realization of these inventories may be affected by market-driven changes.
4.5 Current and non-current classifi cation
All assets and liabilities have been classifi ed as current or non-current as per the Company's normal operating cycle.
5 a) PROPERTY, PLANT AND EQUIPMENT
Gross block Buildings Plant and Equipment Furniture and fi xtures Total
GBP ` GBP ` GBP ` GBP `
As at 31 December 2015 68,812 6,743,576 1,761,630 172,639,740 25,298 2,479,204 1,855,740 181,862,520
Additions - - 150,809 12,595,568 2,320 193,766 153,129 12,789,334
Disposal - - - - - - - -
Other Adjustments
- Exchange variation (Op. Bal restated) - (996,398) - (25,508,402) - (366,316) - (26,871,116)
As at 31 December 2016 68,812 5,747,178 1,912,439 159,726,906 27,618 2,306,654 2,008,869 167,780,738
Additions - - 882,760 76,120,395 119,179 10,276,805 1,001,939 86,397,200
Disposal - - - - - - - -
Other Adjustments
- Exchange variation (Op. Bal restated) - 186,481 - 5,182,710 - 74,845 - 5,444,036
As at 31 December 2017 68,812 5,933,659 2,795,199 241,030,011 146,797 12,658,304 3,010,808 259,621,974
Accumulated depreciation/ amortisation
As at 31 December 2015 3,220 315,593 178,594 17,502,212 2,903 284,462 184,717 18,102,267
For the year 3,279 296,739 185,599 16,798,565 7,089 641,624 195,967 17,736,928
Impairment for the year - - - - - - - -
Deduction on sale or discards - - - - - - - -
Other Adjustments
- Exchange variation (Op. Bal restated) - (46,630) - (2,586,041) - (42,031) - (2,674,702)
- Restating to Closing rate - CY Depreciation - (22,917) - (1,297,337) - (49,552) - (1,369,806)
As at 31 December 2016 6,499 542,785 364,193 30,417,399 9,992 834,503 380,684 31,794,687
For the year 3,373 284,011 219,830 18,509,686 19,810 1,667,998 243,013 20,461,695
Impairment for the year - - - - - - - -
Deduction on sale or discards - - - - - - - -
Other Adjustments
- Exchange variation (Op. Bal restated) - 17,612 - 986,963 - 27,077 - 1,031,652
- Restating to Closing rate - CY Depreciation - 6,847 - 446,255 - 40,214 - 493,316
As at 31 December 2017 9,872 851,255 584,023 50,360,303 29,802 2,569,792 623,697 53,781,350
Net block
As at 31 December 2016 62,313 5,204,393 1,548,246 129,309,507 17,626 1,472,151 1,628,185 135,986,051
As at 31 December 2017 58,940 5,082,404 2,211,176 190,669,708 116,995 10,088,512 2,387,111 205,840,624

30
Cramlington Precision Forge Limited,United KingdomTRANSLATED FINANCIAL STATEMENTS
Notes to fi nancial statements (Contd.)
6 INTANGIBLE ASSETS
Gross block Technical Know-How
GBP `
As at 31 December 2015 20,507 2,009,685
Additions -
Disposal - -
Other Adjustments
- Exchange variation (Op. Bal restated) - (296,940)
As at 31 December 2016 20,507 1,712,745
Additions -
Disposal - -
Other Adjustments
- Exchange variation (Op. Bal restated) - 55,574
As at 31 December 2017 20,507 1,768,319
Accumulated depreciation / amortisation
As at 31 December 2015 5,691 557,718
For the year 6,705 606,909
Impairment for the year - -
Deduction on sale or discards - -
Other Adjustments
- Exchange variation (Op. Bal restated) - (82,406)
- Restating to Closing rate - CY Depreciation - (46,871)
As at 31 December 2016 12,396 1,035,350
For the year 6,488 546,290
Impairment for the year - -
Deduction on sale or discards - -
Other Adjustments
- Exchange variation (Op. Bal restated) - 33,594
- Restating to Closing rate - CY Depreciation - 13,171
As at 31 December 2017 18,884 1,628,405
Net block
As at 31 December 2016 8,111 677,395
As at 31 December 2017 1,623 139,914

31
TRANSLATED FINANCIAL STATEMENTS
Notes to fi nancial statements (Contd.)
As at 31 December 2017 As at 31 December 2016
Long-term Short-term Long-term Short-term
GBP ` GBP ` GBP ` GBP `
7 OTHER ASSETS
(Unsecured, considered good)
Prepaid expenses - - 173,371 14,949,781 - - 78,213 6,532,341
Others - - 408,529 35,227,456 - - 79,865 6,670,294
Unamortised portion of leasehold land 8,939 770,810 - - 14,988 1,251,798 - -
8,939 770,810 581,900 50,177,237 14,988 1,251,798 158,078 13,202,635
As at 31 December 2017 As at 31 December 2016
Long-term Short-term Long-term Short-term
GBP ` GBP ` GBP ` GBP `
8 INVENTORIES
Raw Materials and components - - 247,542 21,345,547 - - 135,819 11,343,564
Work-in-process - - 422,928 36,469,081 - - 240,492 20,085,907
Finished Goods - - 94,516 8,150,115 - - 89,239 7,453,232
- - - -
- - 764,986 65,964,743 - - 465,550 38,882,703
As at 31 December 2017 As at 31 December 2016
Long-term Short-term Long-term Short-term
GBP ` GBP ` GBP ` GBP `
9 TRADE RECEIVABLES
(Unsecured, considered good unless otherwise stated)
Trade receivables - - 2,083,400 179,651,582 - - 1,205,115 100,651,180
- - 2,083,400 179,651,582 - - 1,205,115 100,651,180
As at 31 December 2017 As at 31 December 2016
Long-term Short-term Long-term Short-term
GBP ` GBP ` GBP ` GBP `
10 CASH AND BANK BALANCES
Cash and cash equivalents
Cash on hand - - 935 80,625 - - 1,330 111,082
Balances with banks in current accounts - - 1,168 100,717 - - 420,541 35,123,583
Total - - 2,103 181,342 - - 421,871 35,234,665

32
Cramlington Precision Forge Limited,United KingdomTRANSLATED FINANCIAL STATEMENTS
Notes to fi nancial statements (Contd.)
As at 31 December 2017
As at 31 December 2016
Number GBP ` Number GBP `
11 SHARE CAPITAL
Issued, subscribed and fully paid up
1,400,000 Common shares of GBP 1 each 1,400,000 1,400,000 120,722,000 1,400,000 1,400,000 116,928,000
1,400,000 1,400,000 120,722,000 1,400,000 1,400,000 116,928,000
a) There were no movement in the share capital during the current and previous year.
b) Shareholders holding more than 5% of the aggregate shares in the Company
Nos. % holding Nos. % holding
Sundram International Limited, UK(Previously Held by Sundram Fasteners Limited, Chennai)
1,400,000 100.00% 1,400,000 100.00%
1,400,000 100% 1,400,000 100%
c) Rights, preferences, restrictions
Equity shares
The Company has only one class of equity shares having a par value of GBP 1 per share. Each holder of equity share is entitled to one vote per share. The Company declares and pays dividends in GBP. In the event of liquidation of the Company, the holders of equity shares will be entitled to receive remaining assets of the Company, after distribution of all preferential amounts. The distribution will be in proportion to the number of equity shares held by the shareholders.
As at 31 December 2017
As at 31 December 2016
GBP ` GBP `
d) Dividends
Interim dividend declared and paid (for 31 December 2017/2016)
GBP 0.36 per share (31 December 2016: GBP 0.90 per share) 5,000 421,000 125,000 11,313,750
Dividend distribution tax - - - -
5,000 421,000 125,000 11,313,750

33
TRANSLATED FINANCIAL STATEMENTS
Notes to fi nancial statements (Contd.)
As at 31 December 2017 As at 31 December 2016
12 BORROWINGS Long-term Short-term Long-term Short-term
GBP ` GBP ` GBP ` GBP `
a) Secured
Term loan from banks 1,000,000 86,230,000 - -
Bank Overdrafts 657,458 56,692,603
1,000,000 86,230,000 657,458 56,692,603 - - - -
Less: Current maturities of long term borrowings 250,000 21,557,500
Total 750,000 64,672,500 657,458 56,692,603 - - - -
As at 31 December 2017 As at 31 December 2016
Long-term Short-term Long-term Short-term
13 Deferred tax liability, net GBP ` GBP ` GBP ` GBP `
The breakup of net deferred tax liability is as follows:
Deferred tax liability arising on account of :Timing difference between depreciation/ amortisation as per fi nancials and depreciation as per tax
94,349 7,574,525 - - 207,081 20,595,021 - -
Foreign exchange fl uctuation -Restatement of Opening balance
- 561,190 - - - (3,299,616) - -
A 94,349 8,135,715 - - 207,081 17,295,405 - -
Less: Deferred tax asset arising on account of :
Minimum Alternate Tax Credit Entitlement - - - - - - - -
Provision for employee benefi ts - - - - - - - -
Others - - - - - - - -
B - - - - - - - -
Net deferred tax liability (A-B) 94,349 8,135,715 - - 207,081 17,295,405 - -
Amount recognised in
01 January 2017Recognised in Other
comprehensive IncomeRecognised in Statement
of Profi t and loss31 December 2017
GBP ` GBP ` GBP ` GBP `
Deferred tax liability arising on account of :
Timing difference between depreciation/ amortisation as per fi nancials and depreciation as per tax
207,081 17,295,405 - - (112,732) (9,720,880) 94,349 7,574,525
Gain on fair valuation of investments - - - - - - - -
Others - - - - - - - -
Foreign exchange fl uctuation -Restatement of Opening balance
- - - - 561,190 - 561,190
Less: Deferred tax asset arising on account of :
Provision for employee benefi ts - - - - - - - -
Others - - - - - - - -
Total 207,081 17,295,405 - - (112,732) (9,159,690) 94,349 8,135,715

34
Cramlington Precision Forge Limited,United KingdomTRANSLATED FINANCIAL STATEMENTS
Notes to fi nancial statements (Contd.)
01 January 2016Recognised in Other
comprehensive IncomeRecognised in Statement
of Profi t and loss31 December 2016
GBP ` GBP ` GBP ` GBP `
Deferred tax liability arising on account of :
Timing difference between depreciation/ amortisation as per fi nancials and depreciation as per tax
227,874 22,331,652 - - (20,793) (1,736,631) 207,081 20,595,021
Gain on fair valuation of investments - - - - - - - -
Others - - - - - - - -
Foreign exchange fl uctuation -Restatement of Opening balance
- - - - (3,299,616) - (3,299,616)
Less: Deferred tax asset arising on account of :
Provision for employee benefi ts - - - - - - - -
Others - - - - - - - -
Total 227,874 22,331,652 - - (20,793) (5,036,247) 207,081 17,295,405
As at 31 December 2017 As at 31 December 2016
Long-term Short-term Long-term Short-term
GBP ` GBP ` GBP ` GBP `
14 TRADE PAYABLES
Dues to others - - 1,825,090 157,377,511 - - 814,315 68,011,568
- - 1,825,090 157,377,511 - - 814,315 68,011,568
As at 31 December 2017 As at 31 December 2016
Long-term Short-term Long-term Short-term
GBP ` GBP ` GBP ` GBP `
15 OTHER FINANCIAL LIABILITIES
Others
Current maturities of term loans from banks (Secured)
- - 250,000 21,557,500 - - - -
Non statutory dues - - 34,196 2,948,721 - - 35,360 2,953,271
Outstanding liabilities - - - - - - - -
- - 284,196 24,506,221 - - 35,360 2,953,271
16 OTHER CURRENT LIABILITIES
Statutory dues - - 53,695 4,630,120 - - 130,064 10,862,918
- - 53,695 4,630,120 - - 130,064 10,862,918

35
TRANSLATED FINANCIAL STATEMENTS
Notes to fi nancial statements (Contd.)
Year ended 31 December 2017
Year ended 31 December 2016
GBP ` GBP `
17 REVENUE FROM OPERATIONS
Sales of Products
Domestic Sales 35,486 2,987,921 17,165 1,553,604
Export Sales 9,614,049 809,502,926 7,562,443 684,476,741
9,649,535 812,490,847 7,579,608 686,030,345
Other Operating Revenue (Refer Note 18) 109,941 9,257,032 45,481 4,116,462
Revenue from operations (Net) 9,759,476 821,747,879 7,625,089 690,146,807
18 OTHER OPERATING REVENUE
Scrap Sales 109,941 9,257,032 45,481 4,116,462
Others (Amortization of Govt. grants) - - - -
109,941 9,257,032 45,481 4,116,462
19 OTHER INCOME
Miscellaneous Income - - 6,631 600,172
- - 6,631 600,172
20 COST OF RAW MATERIALS AND COMPONENTS CONSUMED
Opening stock of raw materials and components 135,819 11,343,564 143,254 14,038,892
Add : Exchange rate fl uctuation on account of average rate transferred to currency translation reserve
- 92,357 - (1,072,972)
Add : Purchases during the year 3,372,064 283,927,828 1,982,623 179,447,169
Less : Exchange rate fl uctuation on account of average rate transferred to currency translation reserve
- (502,510) - 949,372
Less: Closing stock of raw materials and components 247,542 21,345,547 135,819 11,343,564
3,260,341 274,520,712 1,990,058 180,120,154
21 CHANGES IN INVENTORIES OF FINISHED GOODS AND WORK-IN-PROGRESS
Finished goods
Opening stock 89,239 7,453,232 108,626 10,645,348
Less: Closing stock 94,516 8,150,115 89,239 7,453,232
Add / (Less) : Exchange rate fl uctuation on account of average rate transferred to currency translation reserve
- 252,551 - (1,437,389)
(5,277) (444,332) 19,387 1,754,727
Work in progress
Opening stock 240,492 20,085,907 298,461 29,249,178
Less: Closing stock 422,928 36,469,081 240,492 20,085,907
Add / (Less) : Exchange rate fl uctuation on account of average rate transferred to currency translation reserve
- 1,022,079 - (3,916,513)
(182,436) (15,361,096) 57,969 5,246,758
Net decrease in inventories (187,713) (15,805,428) 77,356 7,001,485
36
Cramlington Precision Forge Limited,United KingdomTRANSLATED FINANCIAL STATEMENTS
Notes to fi nancial statements (Contd.)
Year ended 31 December 2017
Year ended 31 December 2016
GBP ` GBP `
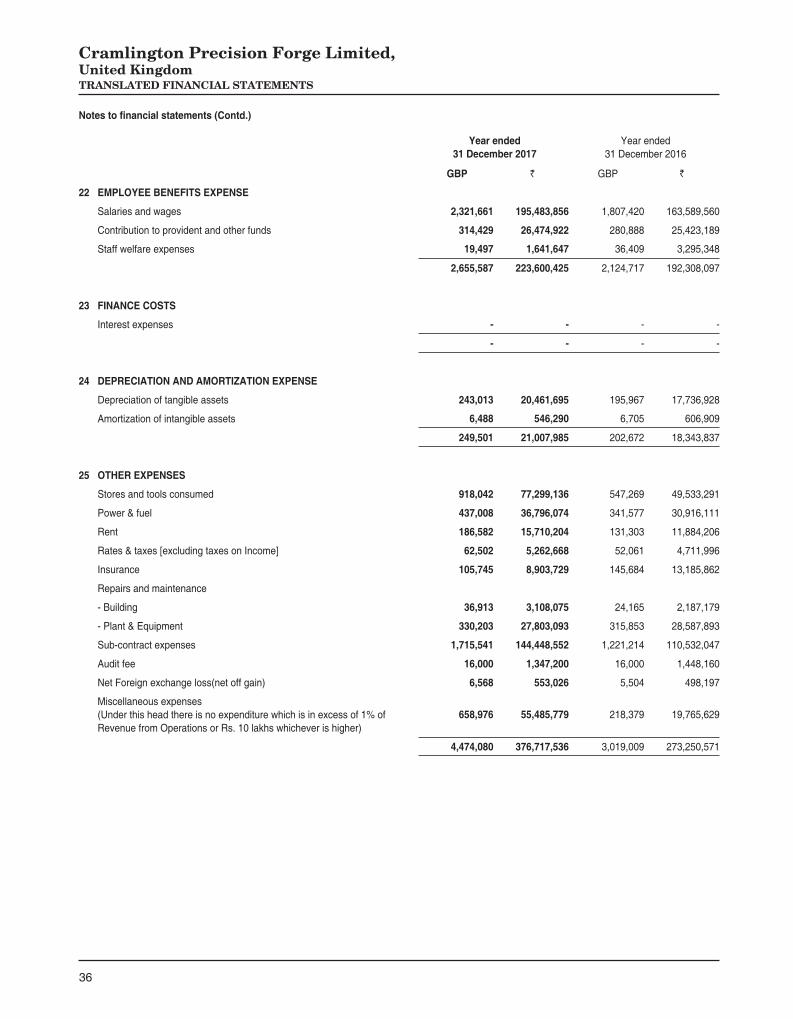
22 EMPLOYEE BENEFITS EXPENSE
Salaries and wages 2,321,661 195,483,856 1,807,420 163,589,560
Contribution to provident and other funds 314,429 26,474,922 280,888 25,423,189
Staff welfare expenses 19,497 1,641,647 36,409 3,295,348
2,655,587 223,600,425 2,124,717 192,308,097
23 FINANCE COSTS
Interest expenses - - - -
- - - -
24 DEPRECIATION AND AMORTIZATION EXPENSE
Depreciation of tangible assets 243,013 20,461,695 195,967 17,736,928
Amortization of intangible assets 6,488 546,290 6,705 606,909
249,501 21,007,985 202,672 18,343,837
25 OTHER EXPENSES
Stores and tools consumed 918,042 77,299,136 547,269 49,533,291
Power & fuel 437,008 36,796,074 341,577 30,916,111
Rent 186,582 15,710,204 131,303 11,884,206
Rates & taxes [excluding taxes on Income] 62,502 5,262,668 52,061 4,711,996
Insurance 105,745 8,903,729 145,684 13,185,862
Repairs and maintenance
- Building 36,913 3,108,075 24,165 2,187,179
- Plant & Equipment 330,203 27,803,093 315,853 28,587,893
Sub-contract expenses 1,715,541 144,448,552 1,221,214 110,532,047
Audit fee 16,000 1,347,200 16,000 1,448,160
Net Foreign exchange loss(net off gain) 6,568 553,026 5,504 498,197
Miscellaneous expenses(Under this head there is no expenditure which is in excess of 1% of Revenue from Operations or Rs. 10 lakhs whichever is higher)
658,976 55,485,779 218,379 19,765,629
4,474,080 376,717,536 3,019,009 273,250,571

37
TRANSLATED FINANCIAL STATEMENTS
Notes to fi nancial statements (Contd.)
Year ended 31 December 2017
Year ended 31 December 2016
GBP ` GBP `
26 INCOME TAX
The major components of income tax expense and the reconciliation of expected tax expense based on the domestic effective tax rate of Cramlington Precision Forge Limited at 19.25% and the reported tax expense in profi t or loss are as follows:
Profi t or loss section
Accounting profi t before tax (692,320) (58,293,351) 217,909 19,722,836
Accounting profi t before income tax
i) At UK’s statutory income tax rate of 19.25% (31 December 2016: 20%) (138,464) (11,658,670) 43,582 3,944,567
Other adjustments (9,053) (762,261) 10,640 963,066
(147,517) (12,420,931) 54,222 4,907,633
Tax expense comprises of:
Current income tax:
Current income tax charge (net of Minimum alternate tax) - - 75,015 6,789,608
Adjustments in respect of current income tax of previous year (34,785) (2,928,897) - -
Deferred tax:
Relating to origination and reversal of temporary differences (112,732) (9,492,034) (20,793) (1,881,975)
Income tax expense (147,517) (12,420,931) 54,222 4,907,633
Summary of signifi cant accounting policies and other explanatory information
27 Related party disclosures
Related Parties :
(I) Where Control exists:
(A) Ultimate Holding Company
Sundram Fasteners Ltd
(B) Holding Company
Sundram International Limited, UK
(II) Other Related Parties with whom transactions have been entered into during the year :
(A) Fellow Subsidiaries
Sundram Fasteners (Zhejiang) Limited, Republic Of China
Sundram International Inc., Michigan, USA
TVS Upasana Limited, Chennai
Sundram Non Conventional Energy Systems Limited, Chennai
Sundram Precision Components Limited, Chennai
Sundram Fasteners Investments Limited, Chennai.
TVS Infotech Limited, Chennai
TVS Infotech Inc., Michigan, USA
The Next Private Limited, Chennai

38
Cramlington Precision Forge Limited,United Kingdom
(III) Transactions with related parties referred in (I) and (II) above, in ordinary course of business:
Nature of transaction
Ultimate Holding Company
Holding CompanyFellow Subsidiary
Companies
GBP INR GBP INR GBP INR
Sales
Goods and Materials 13,625 1,147,225 - - - -
(5,850) (529,494) - - - -
Shares - - - - - -
(Redemption of Preference shares) (500,000) (47,495,000) - - - -
Dividend Paid / Payable
-Equity - - 5,000 421,000 - -
(125,000) (11,313,750) - - - -
-Preference - - - - - -
(30,000) (2,941,800) - - - -
Outstanding balancesDue to the Company
8,000 689,840 - - - -
(975) (81,442) - - - -
(Previous year fi gures are in brackets)
Notes to fi nancial statements (Contd.)
TRANSLATED FINANCIAL STATEMENTS

39
Not
es to
fi na
ncia
l sta
tem
ents
(Con
td.)
28 -
DIS
CLO
SU
RE
ON
FIN
AN
CIA
L IN
STR
UM
EN
T
Parti
cula
rs
31-D
ec-1
731
-Dec
-16
FVTP
LFV
OCI
Amor
tised
Cos
tTo
tal
FVTP
LFV
OCI
Amor
tised
Cos
tTo
tal
GBP
`GB
P`
GBP
`GB
P`
GBP
`GB
P`
GBP
`GB
P`
Fina
ncia
l Ass
ets
Curre
nt a
sset
s
Trad
e re
ceiva
bles
- -
- -
2,0
83,4
0017
9,65
1,58
2 2
,083
,400
179,
651,
582
- -
- -
1,2
05,1
1510
0,65
1,18
0 1
,205
,115
100,
651,
180
Cash
and
Cas
h eq
uiva
lent
s -
- -
- 2
,103
181
,342
2,1
03 1
81,3
42 -
- -
- 4
21,8
71 3
5,23
4,66
5 4
21,8
71 3
5,23
4,66
5
Tota
l Fin
anci
al A
sset
s -
- -
- 2
,085
,503
179,
832,
924
2,0
85,5
0317
9,83
2,92
4 -
- -
- 1
,626
,986
135,
885,
845
1,6
26,9
8613
5,88
5,84
5
Fina
ncia
l Lia
bilit
ies
Non-
curre
nt li
abili
ties
Borro
wing
s -
- -
- 7
50,0
00 6
4,67
2,50
0 7
50,0
00 6
4,67
2,50
0 -
- -
- -
- -
-
Curre
nt li
abili
ties
Borro
wing
s -
- -
- 6
57,4
58 5
6,69
2,60
3 6
57,4
58 5
6,69
2,60
3 -
- -
- -
- -
-
Trad
e pa
yabl
es -
- -
- 1
,825
,090
157
,377
,511
1,8
25,0
90 1
57,3
77,5
11 -
- -
- 8
14,3
15 6
8,01
1,56
8 8
14,3
15 6
8,01
1,56
8
Oth
er fi
nanc
ial li
abilit
ies
- -
- -
284
,196
24,
506,
221
284
,196
24,
506,
221
- -
- -
35,
360
2,9
53,2
71 3
5,36
0 2
,953
,271
Tota
l Fin
anci
al L
iabi
litie
s -
- -
- 3
,516
,744
303
,248
,835
3,5
16,7
44 3
03,2
48,8
35 -
- -
- 8
49,6
75 7
0,96
4,83
9 8
49,6
75 7
0,96
4,83
9
TRANSLATED FINANCIAL STATEMENTS