creating dashboards using web intelligence · september 9–11, 2013 anaheim, california creating...
TRANSCRIPT

September 9–11, 2013 Anaheim, California
Creating Dashboards using Web Intelligence
Session 8806
Alan Mayer – Solid Ground Technologies

3
Agenda
Introduction
Examining interactive features
Graphing relationships
Filtering using Input Controls
Driving behavior using prompts
Masking values using alerts
Controlling other documents and blocks
Using workspaces
Calling reports from other programs
Conclusion

4
Introduction
• Co-founded Integra Solutions in 1993
• Used BusinessObjects since 1992 (Version 2.2)
• Wrote the first BusinessObjects training manuals
• Over 75 Fortune 1000 customers before company was sold in 2007
• Presented at every national conference • Founded Solid Ground Technologies in 2009
• Different company – same principles • Specialize in BusinessObjects
consulting and training
Alan Mayer

5
Introduction
The focus of this presentation … Use available features to build interactive reports
Techniques will be shown using sample universes and data Most will work in either XI 3.1 or BI 4.0/4.1
4.0 specific techniques will be labeled as such
Everything seen today can be downloaded for at-home experimentation

6
Disclaimer
Not proposing to replace other dashboard tools Not the focus of Web Intelligence
Other tools are much stronger at visualization
With that said, the lines are beginning to blur … More web-based controls and graphics being added
Fast data sources could process data in near acceptable time (5 – 10 seconds)

7
Thinking Differently About Reports
Online reporting has changed Staging and refreshing massive reports not the goal
Selecting information on an exception basis is
Reports can satisfy this new goal Previous reports or report pieces serve as the building blocks
Emphasis on guided discovery
vs

8
Report Content
All queries and reports derived from e-Fashion universe
Initially installed with the software
Available for different databases
Rich enough to show most techniques

9
Key Expectations
Expectations from most dashboard users Response time less than 5 – 10 seconds ideally
Some users will tolerate longer times for REALLY good output
The fewer mouse clicks, the better
Simplest way to show the desired analysis

10
Agenda
Introduction
Examining interactive features
Graphing relationships
Filtering using Input Controls
Driving behavior using prompts
Masking values using alerts
Controlling documents and blocks
Using workspaces
Calling reports from other programs
Conclusion

11
Examining Interactive Features
Focusing on features that report readers use most often
Filter
Fold
Drill
The Tracking feature will not be discussed Neat concept – shows data changes before / after
BUT … requires two microcubes (data providers)
Twice the resources

12
Interactive Features Report
Show Regional Revenue by Year
Region variable created to group stores by geographic area (East / West). Report breaks placed on Region and Year. Revenue totaled.

13
Use the Interactive Toolbar (BI 4.x) to manipulate a report as a reader:
Interactive Controls

14
Use the Filter Bar control to activate online filters
Click the drop-down arrows to set the appropriate filter
Interactive Filtering

15
Use the Outline control to display Outline mode and break bars
Click the grey arrows or break numbers to fold / unfold Currently works in XI 3.1
BI 4.x only in Design mode
Interactive Folding
Must use breaks within the report for this feature to work. Tabs may be vertical (shown) or horizontal.

16
Plan the depth to drill using the Query Panel
Interactive Drilling
Use the Scope of Analysis Panel to limit the drill depth. This can be done for every navigation path (hierarchy in XI 3.1)
17
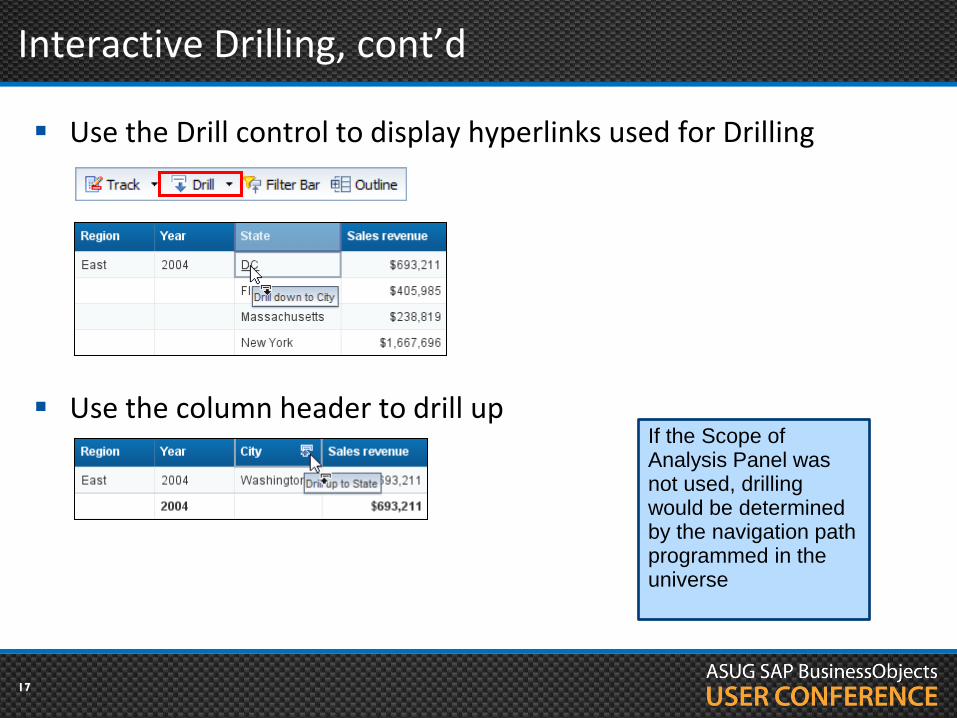
Use the Drill control to display hyperlinks used for Drilling
Use the column header to drill up
Interactive Drilling, cont’d
If the Scope of Analysis Panel was not used, drilling would be determined by the navigation path programmed in the universe

18
Skip to any level by right-clicking and choosing Drill By
Interactive Drilling, cont’d
Any block can be drilled on – charts as well as tables

19
Demonstration

20
Agenda
Introduction
Examining interactive features
Graphing relationships
Filtering using Input Controls
Driving behavior using prompts
Masking values using alerts
Controlling documents and blocks
Using workspaces
Calling reports from other programs
Conclusion

21
Let’s start with a simple report showing Revenue by Store
Visualizing Relationships

22
Use a Vertical column chart to show Revenue by Region
Column Charts

23
Add Year to the graph to see the annual trend …
Column Charts, cont’d

24
Use a Horizontal bar chart to show Store revenues
Bar Charts

25
The final result …
Revenue was sorted to show highest revenues first
Bar Charts, cont’d
Right-click on the chart and choose Sort > Sales Revenue > Ascending
26
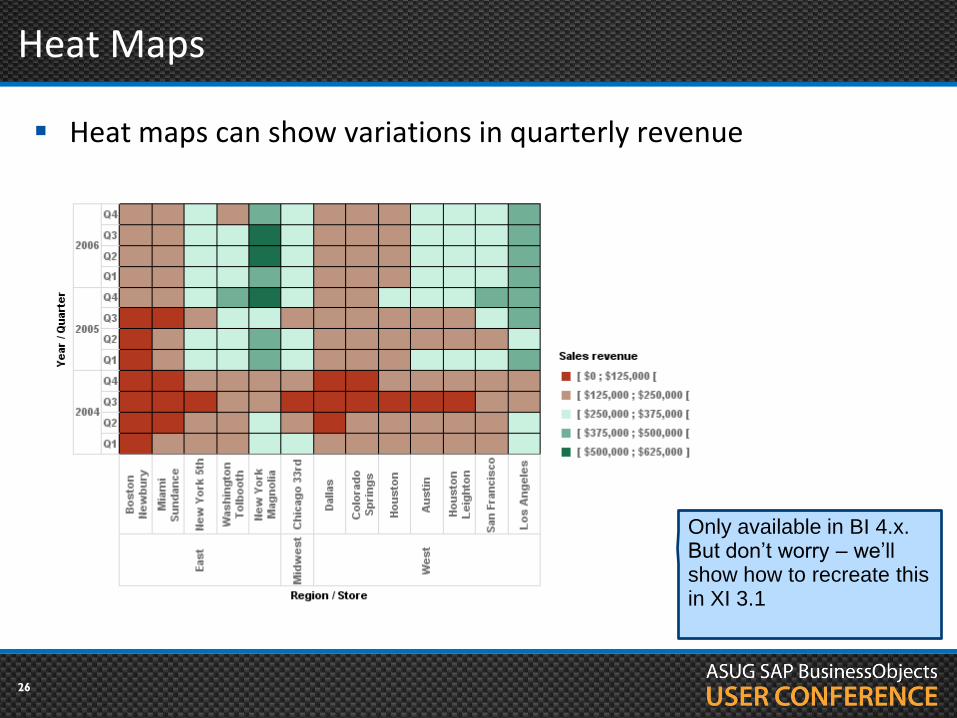
Heat maps can show variations in quarterly revenue
Heat Maps
Only available in BI 4.x. But don’t worry – we’ll show how to recreate this in XI 3.1

27
Tree maps can use size and color to show relationships
Tree Maps
Only available in BI 4.x. No way to recreate in XI 3.1

28
Combined charts allow for different types per data set
Look how a line is added to represent Average Revenue
Combined Charts
Popular technique for showing actual metrics against constants (Budget, SLA, …)

29
Demonstration

30
Agenda
Introduction
Examining interactive features
Graphing relationships
Filtering using Input Controls
Driving behavior using prompts
Masking values using alerts
Controlling documents and blocks
Using workspaces
Calling reports from other programs
Conclusion

31
Input controls can filter any report
Using Input Controls
Entry Field
Spinner
Slider
Combo Box
Radio Button
List
Check Box
List
Single Value Multi Value

32
Move to a report page to be filtered
Click on the Input Control Button
Select New
Choose a report object
Object from a query or report variable
Creating an Input Control

33
Choose the type of input control
Creating an Input Control, cont’d
The control selected determines if one value is filtered (Simple Selection) or many (Multiple Selections)

34
Select the block to be filtered
Creating an Input Control, cont’d
More than one block can be filtered by a single input control

35
Demonstration

36
Agenda
Introduction
Examining interactive features
Graphing relationships
Filtering using Input Controls
Driving behavior using prompts
Masking values using alerts
Controlling documents and blocks
Using workspaces
Calling reports from other programs
Conclusion

37
Prompts can be used to drive how the Webi interface looks
We’ll use prompts to allow report users
Sort their data
Swap report breaks
Reveal layers of visualization
Change from tables to charts dynamically
Each technique requires a little universe preparation
Additional objects will be required
Using Prompts

38
The secret to making prompts dynamic
Must be added to the universe
Created from metadata rather than tables
Cannot use them alone in a query
All follow the same IF-Then-Else formula:
Dynamic Objects
If @Prompt( ‘Prompt sentence',
'A',
{X,Y},,,)
= X,
table1.column1,
table2.column2) The conditional function used for IF-THEN-ELSE will vary by database.

39
First - create the Dynamic Sort object:
Second – sort on that object
Sorting Dynamically
IIF(@Prompt('Sort by','A',{'State','City'},,,)
= 'City',
Outlet_Lookup.City,
Outlet_Lookup.State)
What is sorted can be programmed this way, but the direction of the sort cannot.

40
The results:
Sorting Dynamically, cont’d

41
First - create the Dynamic Break object:
Second – break on that object
Breaking Dynamically
IIF(@Prompt('Break by','A',{'State','City'},,,)
= 'State',
Outlet_Lookup.State,
Outlet_Lookup.City)

42
Now to break from the ordinary!
Breaking Dynamically, cont’d

43
Even blocks can be displayed dynamically
Every block can be “hidden” based on a variable’s value
That value can be the result of a prompt
Blocks can be stacked on top of one another
Display Blocks Dynamically
Block 1
Block 2
Hide if: Layer = 2
Hide if: Layer = 1
This idea can be extended to create sets of blocks that appear one layer at a time.

44
This technique is simpler
No additional variable needed
Universe object is all that’s necessary
Set the properties of each block (Format > General)
Dynamic Blocks, cont’d
@Prompt('Display','A',{'Table','Graph'},,,)

45
This single technique can add great depth to a dashboard
Dynamic Blocks, cont’d

46
Demonstration

47
Agenda
Introduction
Examining interactive features
Graphing relationships
Filtering using Input Controls
Driving behavior using prompts
Masking values using alerts
Controlling documents and blocks
Using workspaces
Calling reports from other programs
Conclusion

48
Alerters can be used to apply formatting based on a condition
Reference variables in that condition for even more power
Remember that Heat Map input control?
You can build your own using alerters!
With more control …
Alerters – The Conditional Formatter
Conditional formatting must be applied in Design mode for BI4.x

49
Variables are like steroids for alerters
The complex logic is inside the variable
Allows conditions that couldn’t be accomplished otherwise
Creating Conditional Variables
Average Quarterly Revenue
=Average([Sales revenue]) In([Year];[Quarter])

50
Let’s show which quarters are above or below the average
Open the Conditional Alerter Editor
Analysis > Conditional > New Rule
Creating Conditional Rules

51
Both conditions can be defined by one rule
Creating Conditional Rules, cont’d
Notice how the Average Quarterly Revenue variable is used.

52
The results are stunning and within your control
The Final Alerter
Ranges for the Input Control heat map cannot be customized as easily.

53
Demonstration

54
Agenda
Introduction
Examining interactive features
Graphing relationships
Filtering using Input Controls
Driving behavior using prompts
Masking values using alerts
Controlling documents and blocks
Using workspaces
Calling reports from other programs
Conclusion

55
Sometimes one document isn’t enough
Only so much screen real estate
Users may need additional information at point
Makes the original dashboard more dynamic
Going Beyond One Document

56
Documents can be linked to others via prompts
Links are created in the source document
Those links answer prompts from a second document
Creating Links
Source Destination
State:
City:

57
Start with the Origin document
Decide which area should be dynamic
Cells around that area become the “context”
Creating Links, cont’d
Context: Year = 2006
Quarter = Q2
Store = e-Fashion Austin

58
Create a Destination document
Add prompts based on the context previously described
Any additional detail can be added
Format can be graphical or tabular
Creating Links, cont’d

59
Link Source to Destination
Right-click on the selected area
Linking > Add Document Link
Creating Links, cont’d
1
2
3
4
Refresh that document
Choose a new or existing window to display
Locate the document to link to
Map prompts from that document to objects in this one
60
Highlighted cells become hyperlinks
Click on any cell to “drill” to the Destination document
Drill Between Documents

61
Demonstration

62
Using Document Links has its drawbacks
The Destination document takes an entire window
Not easy to navigate back
Multiple queries are executed (at least two)
In BI 4.x, there is another way …
Called Element Links
One block can be linked to another
Regardless of formatting (table, graph, …)
The first block filters the second
Many advantages
Fewer queries
More interactivity on the same report page
Drilling Between Blocks

63
Blocks can be linked to others via objects or variables
Same concept as document links
Values from the first block control a second block
No prompts required
Creating Element Links
Store = e-Fashion Austin
Year = 2006
Destination block
Source block
Quarter = Q2
64
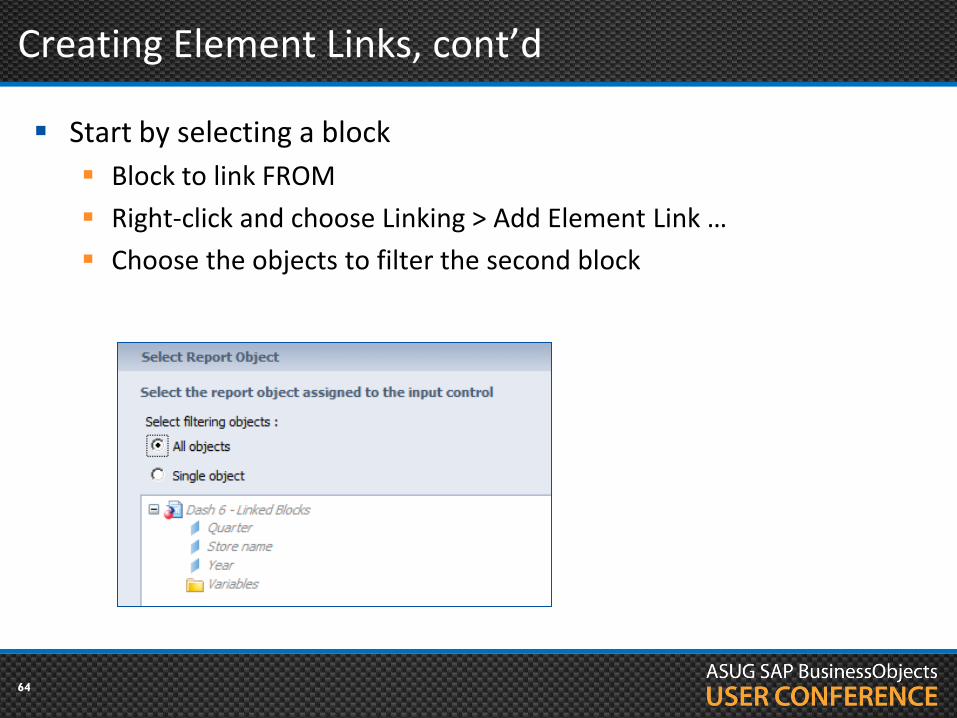
Start by selecting a block
Block to link FROM
Right-click and choose Linking > Add Element Link …
Choose the objects to filter the second block
Creating Element Links, cont’d

65
Define the input control
Yes … element links FILTER so are really input controls
Add a name and description
Creating Element Links, cont’d

66
Choose the block that will be filtered
Creating Element Links, cont’d

67
Demonstration

68
Agenda
Introduction
Examining interactive features
Graphing relationships
Filtering using Input Controls
Driving behavior using prompts
Masking values using alerts
Controlling documents and blocks
Using workspaces
Calling reports from other programs
Conclusion

69
BusinessObjects BI Workspaces arrange those report pieces
Formerly part of Dashboard Builder
Creates a frame from which report pieces can be mounted
Links can be created between pieces
Content links
Different than element or document links covered earlier
Introduces interaction between reports / pieces
Different types of reports and dashboards can be linked
What follows are the basics behind creating workspaces
Build the Framework First

70
The Workspace Editor
Start the Editor
Choose your content as modules
Add those modules here
Link those modules together
1
2
3
4

71
Adding Content
Modules control content
Many options to choose from
We’ll focus on Public reports

72
Arranging Content
Documents are dragged to the workspace from the Module Library

73
Selecting Report Pieces
Resize each module and select only the pieces you need
Piece 1
Piece 2

74
Use Content Linking to define how one module will drive the others
Link the Pieces
Create a connection between modules by dragging
1
Map parameters (prompts) between modules
2

75
Menus can be created
Offers more screen real estate
Content can be expanded beyond Webi documents
Crystal Reports
BI Dashboards (Xcelsius)
Web sites
Other included modules
Navigation Control
Viewers
Custom content
Other Workspace Notes

76
Demonstration

77
Agenda
Introduction
Examining interactive features
Graphing relationships
Filtering using Input Controls
Driving behavior using prompts
Masking values using alerts
Controlling other documents and blocks
Using workspaces
Calling reports from other programs
Conclusion

78
What about integrating Webi content from existing programs?
Other than BI Launch pad, Infoview, …
Common request for custom portals
“Custom” portal - an HTML application developed by your company
The initial user interface is handled from that application
All prompt values for the report are gathered, then …
Webi reports can be refreshed using OpenDocument
A BusinessObjects session must be previously established
If not, a login window will appear asking for credentials
Launching Reports From Other Programs

79
The OpenDocument command looks like a hyperlink
What appears below is a sample
Argument values in red
Launching Reports, cont’d
http://boxi4win05:8080/BOE/OpenDocument/opendoc/openDocument.jsp?
iDocID=AajYahfR9Z9Gh_BSbOiqNZM
&sIDType=CUID
&sType=wid
&sRefresh=Y
&lsMYear=2006

80
Document arguments
iDocID – Uniquely identifies the document
Example: iDocD=AajYahfR9Z9Gh_BSbOiqNZM
sDocName – Document Name (may not be unique)
Example: sDocName=2006+Sales
sIDType – The type of ID supplied (CUID, InfoObjectID)
Example: sIDType=CUID
sType – The type of document (wid = Webi)
Example: sType=wid
sInstance – Opens the latest instance (User, Last, Param)
Example: sInstance=Last
sRefresh – Refresh the document before viewing (Y, N)
Example: sRefresh=Y
Launching Reports, cont’d

81
Prompt arguments
lsC – Selects a Universe context
Example: lsC=Rentals
lsS<prompt> - Single value for a prompt
Example: lsSYear=2006
lsM<prompt> – One or more values for a prompt
Example: lsMCountries=USA;Germany
lsR<prompt> - Range of values for a prompt
Example: lsRDates=[Date(2013,07,01)..Date(2013,07,15)]
Launching Reports, cont’d

82
Last words of advice …
Use the plus sign to cover spaces in the URL
Example: sDocName=2006+Sales
Remove any trailing spaces in a prompt
Example:
Prompt is “Choose a year: “
lsSChoose+a+year:=
The length of the URL may be limited by the browser
Internet Explorer: 2083
Launching Reports, cont’d

83
Demonstration

84
Agenda
Introduction
Examining interactive features
Graphing relationships
Filtering using Input Controls
Driving behavior using prompts
Masking values using alerts
Controlling documents and blocks
Using workspaces
Calling reports from other programs
Conclusion

85
Online reporting is moving towards visualization
Report trends or exceptions first
Back this up with detailed information when necessary
Web Intelligence can satisfy both initiatives
Display graphs or summary tables to show the trend
Link to detailed graphs or reports to show details
Techniques in this presentation showed you how
Not a substitute for dedicated dashboard tools
Key Learnings

86
Questions?
Alan Mayer Session 8806 Creating Dashboards using Web Intelligence [email protected] 214-295-6250 (office) 214-755-5771 (mobile) 214-206-9003 (fax)

Thank you for participating.
Please provide feedback on this session by completing a short survey via the event
mobile application.
SESSION CODE: 8806
Learn more year-round at www.asug.com