credit suisse 2014 energy summit - seadrill · credit suisse 2014 energy summit ceo – per wullf...
TRANSCRIPT

Credit Suisse 2014 Energy SummitCEO – Per Wullf
Vail, Colorado, February 2014

Forward Looking Statements
The statements described in this presentation that are not historical facts are forward-looking statements
within the meaning of Section 27A of the Securities Act of 1933 and Section 21E of the Securities Exchange Act of
1934. Forward-looking statements which could be made include, but are not limited to, statements involving
prospects for the Company, expected revenues, capital expenditures, costs and results of operations and
contingencies and other factors discussed in the Company's most recent annual report on the Form 20-F for the year
ended December 31, 2012 and in the Company's other filings with the SEC, which are available free of charge on the
SEC's website at www.sec.gov. Should one or more of these risks or uncertainties materialize, or should underlying
assumptions prove incorrect, actual results may vary materially from those indicated. All subsequent written and oral
forward-looking statements attributable to the Company or to persons acting on our behalf are expressly qualified in
their entirety by reference to these risks and uncertainties. You should not place undue reliance on forward-looking
statements. Each forward-looking statement speaks only as of the date of the particular statement, and we undertake
no obligation to publicly update or revise any forward-looking statements. All non-GAAP financial measure
reconciliations to the most comparative GAAP measure are displayed in quantitative schedules on the company’s
web site at seadrill.com.
2

Seadrill Limited Overview
• Most modern fleet of all the major offshore drillers
• Diverse asset base of 69(1) units
– 34 drillships & semi-submersibles(11 Under Construction)
– 32 jack-up rigs (9 Under Construction)
– 3 tender rigs
• Global reach including harsh environment
• Current market capitalization ~ US$17 bn
• Broad customer base with contract backlog ~ US$20 bn
• Dividend annualized ~ US$1.8 bn
Market Leading Track Record of Value Creation
(1) Includes rigs contributed to Seadrill Partners.3
$0
$4
$8
$12
$16
$20
EquityIssuance
Dividends CurrentMarket Cap
ValueCreation

4
Establishing Vehicles to Offer Exposure to Key Themes
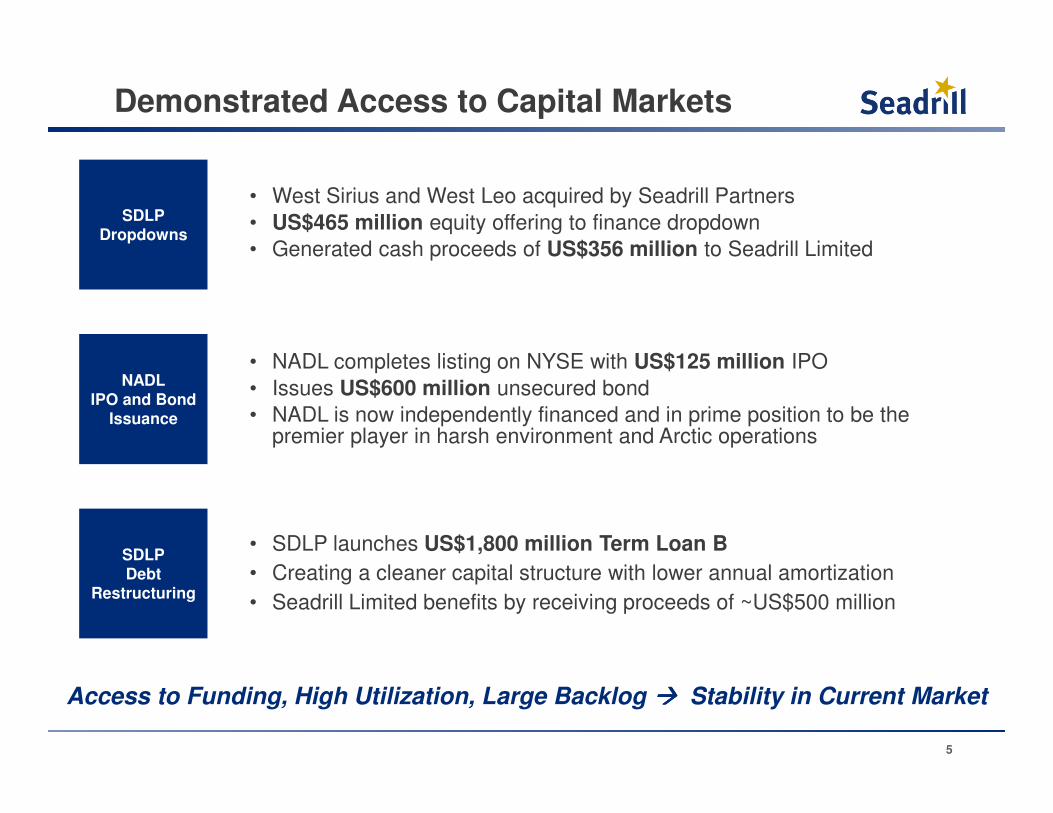
Demonstrated Access to Capital Markets
SDLPDropdowns
• West Sirius and West Leo acquired by Seadrill Partners
• US$465 million equity offering to finance dropdown
• Generated cash proceeds of US$356 million to Seadrill Limited
NADLIPO and Bond
Issuance
• NADL completes listing on NYSE with US$125 million IPO
• Issues US$600 million unsecured bond
• NADL is now independently financed and in prime position to be the premier player in harsh environment and Arctic operations
SDLPDebt
Restructuring
• SDLP launches US$1,800 million Term Loan B
• Creating a cleaner capital structure with lower annual amortization
• Seadrill Limited benefits by receiving proceeds of ~US$500 million
Access to Funding, High Utilization, Large Backlog ���� Stability in Current Market
5

Key Investment Highlights
6

Key Investment Highlights
� Significant Contracted Backlog Providing Dividend Visibility
� Innovative Capital Structure and Funding Strategy
Modern Fleet with Exposure to Premium Segments�
� Dividend Growth a Priority… While Maintaining Earnings Growth Profile
7
Global Operational Footprint�

8
Global Operational Footprint
Presence in all important oil and gas regions
Newbuilds 20 units
- 8 Drillships
- 3 Semis
- 1 HE jack-up
- 8 BE jack-ups
Americas12 units
- 4 Drillships
- 2 Semis
- 1 Semi-tender
- 8 Jack-ups
Africa –Middle East15 units
Brazil
North Atlantic
West Africa
Middle East
Asia Pacific
Gulf of Mexico
- 2 Tender rigs
- 8 Jack-ups
Asia Pacific10 units
- 4 HE Semis
- 2 HE Jack-ups
- 1 Drillship
North Atlantic7 units
London
- 2 Drillships- 5 Semis - 5 jack-up
- 5 Semis
Brazil5 units

Strategic Focus on Premium Asset Classes
…with a Modern Fleet…One of the largest Offshore Drillers…
Ultra-Deepwater Units Average Floater Age
Average Jack-Up AgeJack-Up Units
…and Exposure to Premium Segments
% of Jack-Up fleet >350’ Water Depth
% o
f T
ota
l Flo
ate
rs%
of
To
tal F
loa
ters
Nu
mb
er
of
un
its
Nu
mb
er
of
un
its
% Ultra-Deepwater of Total Floaters
Source: ODS Petrodata. 9

Longstanding Relationships with Leading Oil & Gas Companies
Current backlogUS$ Millions
2.9
5.6
4.1
3.2
4.7
1.4
10
0
1,000
2,000
3,000
4,000
5,000
6,000
7,000
2014 2015 2016 Remaining

Financial Flexibility
Jan-2014 Actual 2015 Illustrative
11
0
0.5
1
1.5
2
2.5
3
3.5
4
2014 2015 2016
Floaters Jack-ups
Capex Per Year (US$ billion)2013-2014 Financing Summary
Secured Financing
• 8 new facilities
• Total of US$ 5,310m
Unsecured Financing
• NOK 1,800m bond
• NOK 1,500m bond (NADL)
• US$ 500m bond
•US$600m Bond (NADL)
•US$125m NADL NYSE IPOMLP
• US$ 356m contribution to SDRL though the sale of Sirius and Leo
•Launched US$1,800m TLB
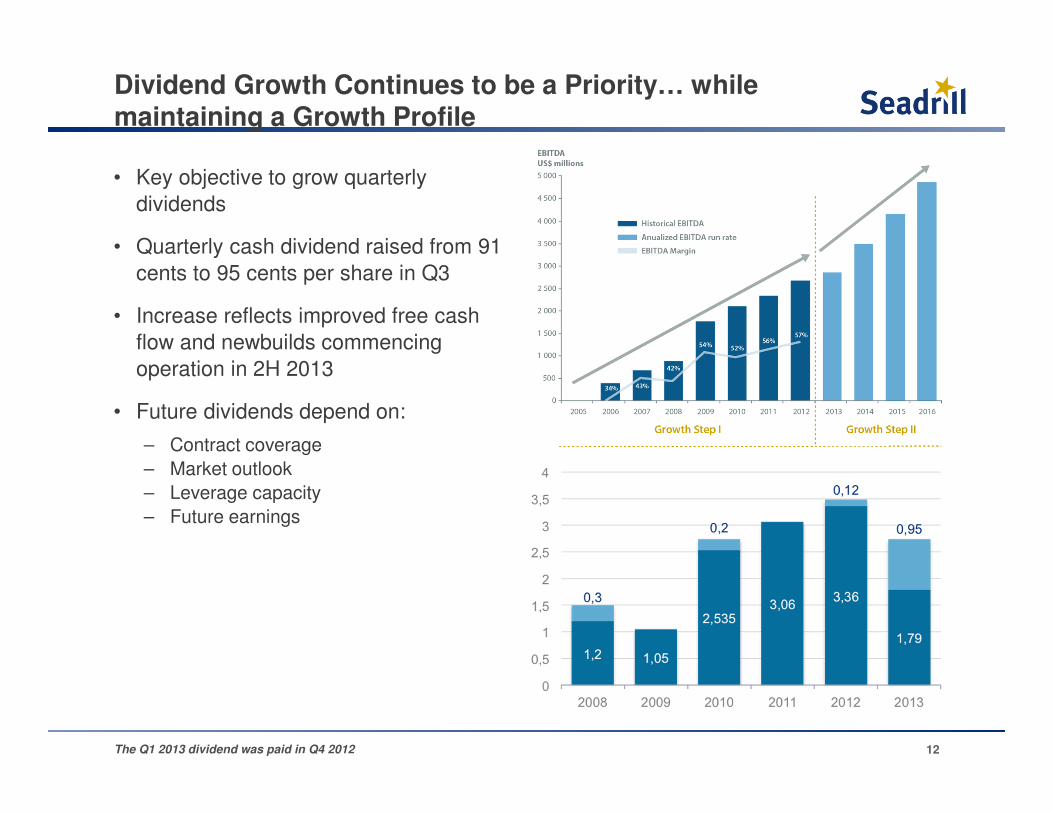
Dividend Growth Continues to be a Priority… while maintaining a Growth Profile
• Key objective to grow quarterly
dividends
• Quarterly cash dividend raised from 91
cents to 95 cents per share in Q3
• Increase reflects improved free cash
flow and newbuilds commencing
operation in 2H 2013
• Future dividends depend on:
– Contract coverage
– Market outlook
– Leverage capacity
– Future earnings
The Q1 2013 dividend was paid in Q4 2012 12

Market Outlook
Upstream Market Outlook
13

Source: IEA, IHS, Wood Mackenzie, EIA, ODS Petrodata.
Increased Service Intensity
400
500
600
700
22
23
24
25
2005 2006 2007 2008 2009 2010 2011 2012 2013
Num
ber
of
Rig
s C
ontr
acte
d
Mill
ion B
arr
els
per
Day
Total Offshore Production Total Offshore Rigs
14
More Rigs Working, but Declining Oil Production

Resources discovered and produced 2000-2012 (Billion boe)
-
20
40
60
80
100
120
140
1980 1985 1990 1995 2000 2005 2013
Shelf Deep Water Ultra deepwater
Discovered resources 1980 to 2013 (Billion boe)
Source: Rystad Energy research and analysis; UCube
Recent Discoveries to Become Produced Volumes
15

Ultra-Deepwater Production Growth Accelerating
16
Global liquids production, by land and water depth
Offshore ultra deep
Onshore
Million bbl/d 2012-2030CAGR = 1.3%
19%
2%
0%
1%
2012-2020CAGR
Source: Rystad Energy
30 mbbl/d
Thousand boe/d
Global offshore productionby water depth 1960 - 2040
16.4
2.5
0.5
0.9
Rep
lacem
en
t R
ati
o
0
10000
20000
30000
40000
50000
60000
70000
80000
1960 1970 1980 1990 2000 2010 2020 2030 2040
Shelf (to 400 ft) Deep water (400-5000 ft) Ultra deepwater (5000+ ft)
30 mbbl/d
16 mbbl/d
5 mbbl/d
16

Near Term Outlook
X-axis: total liquids production mbpd; Y-axis: avg Brent equivalent breakdown price, $/bblSource: Morgan Stanley and Rystad Energy
1
1
2014 Projects Pushed to 2015
• Block 32 � Total – Angola• Mad Dog 2� BP – Gulf of Mexico• Stampede � Hess – Gulf of Mexico• Chevron Indonesia� Chevron – Indonesia • Bonga� 2 rigs - Nigeria
17

Drilling Market Outlook
18

256316
455
60 (50)
189
0
50
100
150
200
250
300
350
400
450
500
Global Rig Supply & Demand Imbalance Favors Contractors
Significant Newbuilds Required to Bridge Expected Demand Gap
Newbuilds2014 - 2016
Current Floater Fleet
PotentialSupply
2020 DemandPossible Retirements
Additional Rig Requirements1
SupplyDemand
1 Includes Brazil rigsSource: Rystad Energy, DNB
3
0 1
8
21 21
28
17 18
2523
12
0
5
10
15
20
25
30
2005 2006 2007 2008 2009 2010 2011 2012 2013 2014 2015 2016
Ultra-Deep Water Deliveries
19
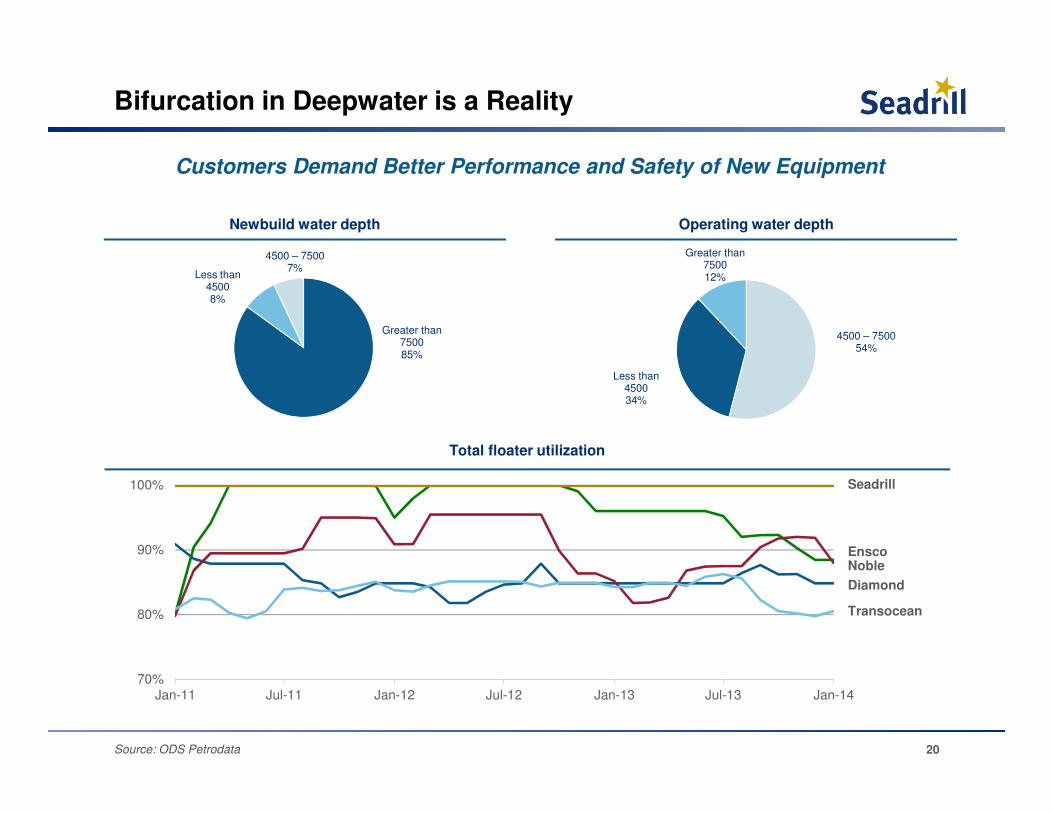
70%
80%
90%
100%
Jan-11 Jul-11 Jan-12 Jul-12 Jan-13 Jul-13 Jan-14
Newbuild water depth Operating water depth
Greater than 750085%
Less than 45008%
4500 – 75007%
Total floater utilization
Seadrill
NobleEnsco
Diamond
Transocean
4500 – 750054%
Less than 450034%
Greater than 750012%
Source: ODS Petrodata
Bifurcation in Deepwater is a Reality
Customers Demand Better Performance and Safety of New Equipment
20

Robust Jack-up Fundamentals
• In 2015 more than 220 of the currently contracted Jack-up fleet will be more than 30 years old
• 90 of the units will be more than 35 years old
• Scrapping & Conversion of older units increased in 2011 and 2012 with trend expected to continue
Age Development of Contracted Jack-up Fleet Jack-ups Removed from the Market
21
1017
26
90
51
67
90
220208
215 220232
0
50
100
150
200
250
2013 2014E 2015E 2020E
40 years or more 35 years or more 30 years or more
# of rigs
1
2
3
6
8
7
10
6
12
2
11
9
8
3
4
2
1 1 1
4
1 1 1 1
4
1
12
15
2
0
2
4
6
8
10
12
14
16
1980 1982 1984 1986 1988 1990 1992 1994 1996 1998 2000 2002 2004 2006 2008 2010 2012
# of rigs
Source: Pareto

Conclusion
22

23
Well Positioned to Weather the Storm…..
West Tellus
World oil demand and oil price* by scenario
Illustrative daily liquidity cushion
Floater supply and demand
(1) Based on LTM average for the West Sirius, West Leo, West Aquarius and West Capella(2) Assuming $1,700 million of debt @4.25%(3) Assuming 5% amortization per year(4) Based on average contrat dayrates for West Sirius, West Leo, West Aquarius and West Capella, assumes 95% utilization and 4.25% tax on revenuesSource: Morgan Stanley and Rystad Energy
Seadrill UDW Coverage 2014
(1) (2) (3) (4)(1)

• 32 Ultra-deepwater units built after 2000
• 2 Midwater semi-submersible rigs
• 29 High-specification jack-up rigs built after 2005
• 3 Harsh environment Jack-ups
• 3 Tender Rigs
Core Assets
Financial Investments
12% of SapuraKencana –
Market Value ~US$960mm
50.11% of Sevan Drilling –
Market Value ~US$200mm
39.9% of Archer –
Market Value ~US$245mm
24