creditmodeltm financial institutions
TRANSCRIPT

A STATE-OF-THE-ART SCORING MODEL FOR BANKS AND INSURANCE COMPANIES AUG 2017 1 WWW.SPGLOBAL.COM/MARKETINTELLIGENCE
Authors
George Tripolitakis,
Analyst, EMEA
Analytic Development Group
Georgios Angelopoulos, PhD
Senior Analyst, EMEA
Analytic Development Group
Yi Wu,
Researcher, EMEA
Analytic Development Group
Giorgio Baldassarri, PhD
Global Head of Analytic
Development Group
CreditModelTM
Financial Institutions
A State-of-the-Art Scoring Model for Banks and Insurance
Companies
Overview Developing a statistical model to assess the credit risk of financial institutions is a formidable challenge mainly because:
Financial institutions tend to be highly heterogeneous from a credit risk point of
view
The sector exhibits low default frequency The sector’s default frequency is volatile over time
Therefore it is common belief that the assessment of credit risk for such companies can only be conducted using an expert-judgement framework, such as that employed by
rating agencies, or a scorecard methodology that is usually inspired by and/or benchmarked with credit ratings.
Expert-judgement approaches are usually very successful in quantifying counterparty credit risk, but suffer from inherent operational limitations. Ratings tend to cover only a
limited number of financial institutions; scorecards require a significant amount of time and resources for the generation of a single assessment and each counterparty needs to be assessed individually.
A statistical model, that combines the advantages of an expert -judgement approach driven by ratings with an automated engine, was not available up to now, but is highly desirable in order to:
Assess the credit risk of financial institutions, expanding the universe of scored companies beyond what is normally covered by rating agencies and
Accelerate and scale the credit assessment process
At S&P Global Market Intelligence, we have managed to bridge this gap by developing a cutting-edge statistical model that is trained on S&P Global Ratings credit ratings and
uses company financials, macroeconomic and industry-specific factors to generate a letter-grade credit score, for public and private banks and insurance companies, globally, representing a purely statistical view of the credit strength of a financial institution.
1
Entity Coverage and Model Features The model applies to “Banks” and “Insurers”, (see Appendix A) as defined by S&P Global Market Intelligence’s Primary Industry Classifications (PICs), including Diversified and Regional Banks, Thrift and Mortgage Finance, Life and Health Insurance
companies, Multi-line Insurance companies, Property and Casualty Insurance companies, and Reinsurance companies. The model has been trained on S&P Global Ratings credit ratings, prior to group and government support considerations.
1 S&P Global Ratings does not contribute to or participate in the creation of credit scores
generated by S&P Global Market Intelligence.
CREDITMODEL FINANCIAL INSTITUTIONS
A STATE-OF-THE-ART SCORING MODEL FOR BANKS AND INSURANCE COMPANIES AUG 2017 2 WWW.SPGLOBAL.COM/MARKETINTELLIGENCE
Since the majority of entities rated by S&P Global Ratings are large financial institutions, we recommend using CreditModel™ Financial Institutions to assess the credit risk of entities with total assets greater than $100M
2.
Financial and Macroeconomic Factors
Our model utilizes both financial data from banks and insurance companies and the most relevant macroeconomic data for the banking and the insurance sectors, to generate a quantitative credit score that aims to statistically match S&P Global Ratings credit ratings.
Global Coverage
As the world has become more interconnected economically, financial institutions, investors, and multi-national corporations have shown more and more interest in the creditworthiness of banks and insurance companies around the globe. Our model
covers country, industry and sovereign risk for all 247 countries , reflecting their different operating environments and degrees of economic development. For country coverage, please refer to Appendix B.
Public and Private
Our model covers both privately held and publicly listed banks and insurance companies.
Primary Model Outputs
The model’s primary output is a letter grade score, expressed in lower-case. The score is calculated prior to any group or government support consideration, and is reported on a standalone basis and subject to a sovereign risk capping.
In addition, each score is mapped to one-, three- and five year implied default rates
using S&P Global Ratings observed historical default rates for the whole rated universe.
Parental and Government Support Overlay
S&P Global Market Intelligence has developed a statistical overlay that uses
quantifiable inputs to derive an assessment of the likelihood and extent of parental and government support (or burden) exerted on a company. A separate white paper describes more in detail the underlying methodology.
3
Pre-scored Database
We provide clients with access to estimates of creditworthiness for more than 5,000
banks and 1,000 insurers globally through time, spanning more than 10 years (when available)
4 and leveraging the S&P Capital IQ platform’s financials.
Additional Coverage
In addition to the pre-scored database, clients can also download the SNL platform’s
US Regulatory financials for 6000+ US banks and other financials for circa 4000 banks across several geographies, and then leverage our imputation techniques to generate a score via CreditModel Financial Institutions
5. Further details on the model
performance using the SNL platform’s financials can be found in the Appendix .
2
Lowercase nomenclature is used to differentiate S&P Global Market Intelligence credit model scores from the credit ratings issued by S&P Global Ratings . 3 See S&P Global Market Intelligence’s “Quantitative parental support overlay (May 2015)”
document, for the parental support methodology and S&P Global Market Intelligence’s “Quantitative support overlay for Government-related entities (May 2015)” document, for extraordinary government support methodology. 4 Date as of 1, July 2016.
5 A complete set of regulatory financials is available for US banks only, whereas Imputation can
be applied for other SNL Financials where Retained Earnings and Cash flow from operating

CREDITMODEL FINANCIAL INSTITUTIONS
A STATE-OF-THE-ART SCORING MODEL FOR BANKS AND INSURANCE COMPANIES AUG 2017 3 WWW.SPGLOBAL.COM/MARKETINTELLIGENCE
Sensitivity Analysis, Stress-Testing, Peer Comparison and Reporting
Consistent with all our scoring and PD models, clients can score any bank/insurance company using their own financials, change financial data and other input factors for a ‘what-if’ analysis or even stress-test input factors.
Through its S&P Capital IQ platform, S&P Global Market Intelligence offers Desktop and Excel tools that cover both scoring and what-if analysis, where many banks/insurance companies can be scored simultaneously for a single financial period, or one entity can be scored over multiple financial periods.
Surveillance dashboards allow the user to quickly compare creditworthiness and distribution of a portfolio of entities, covered by CreditModel Financial Institutions or any of our other models.
For every analysis, reports can be generated with a comprehensive summary
analysis, directly from Excel or dynamically linking the analysis to PowerPoint via PresCenter™ to efficiently replicate credit memos or senior management presentations.
Contribution Analysis
In addition to the sensitivity measures, clients can assess the “weight” or importance of contribution of a risk factor to the current credit score, through two contribution measures: the Absolute Contribution and the Relative Contribution.
The Absolute Contribution is obtained by first calculating the “Marginal Contribution”, i.e. the percentage change of the (numerical unrounded) credit score when among the actual inputs one variable at a time is set to its best possible value, thus effectively
“removing” or “switching off” the effect due to that variable. Next, the Absolute Contribution of a variable can be simply expressed as marginal contribution of the variable divided by summation of all marginal contributions of all variables. Thus,
Absolute Contributions of all input factors add to 100% and therefore provide a straightforward means to identify the main input(s) that drives a model output away from the best score ("aaa"). The higher the contribution value, the more the input “contributes” to the model output.
The Relative Contribution of a variable is obtained by first calculating the (numerical unrounded) score with all inputs set to their median values, and then the percentage change of the score when the corresponding variable is set to its actual value (all
others remaining at their median values). As such, the Relative Contribution of a variable can be positive or negative, and gives an idea about the extent to which the corresponding input drives the model output away from the "median case" (when all
inputs are set to their median values). The median values are based on the closest quarter for which financials are available, and include all pre-scored companies in the same industry and country, by default; users can alternatively opt to get country -level or industry-level medians.
Imputation
It is always desirable to have a model that can still offer a prediction when only partial information of a company is provided. The imputation methodology for CreditModel
Financial Institutions utilizes a Nearest Neighbor approach to identify companies with similar characteristics to the company with missing inputs; then we run a regression to estimate the missing input from similar companies with complete financials. Once the
missing input is estimated, along with non-missing variables, CreditModel Financial
activities are missing. The imputation model was trained using S&P Capital IQ platform financials, but works well also using SNL platform financials.
CREDITMODEL FINANCIAL INSTITUTIONS
A STATE-OF-THE-ART SCORING MODEL FOR BANKS AND INSURANCE COMPANIES AUG 2017 4 WWW.SPGLOBAL.COM/MARKETINTELLIGENCE
Institutions output is calculated in its normal way for a company. Please refer to the White Paper on Imputation for additional details.
6
Integration with other S&P Capital IQ platform Models
CreditModel Financial Institutions can be used on a standalone basis to generate
long-term credit scores, or in conjunction with other S&P Global Market Intelligence quantitative models, such as PD Model Market Signals Financial Institutions , to establish a timely credit surveillance framework on publicly listed financial institutions .
This allows for the detection of early warning signals when the market-driven view is diverging significantly from the long-term view offered by CreditModel.
Credit Risk Assessment for Banks and Insurers
A Tailored Framework
Although banks and insurance companies are often referred to as “financial institutions”, their business models are quite different, and thus present specific risk profiles, that may have profound consequences for the stability of the financial system
overall. This difference was clearly evidenced during the 2008 sub-prime mortgage crisis, when government interventions in the banking and insurance industry became necessary to avoid the melt-down of capital markets.
The core activity of banks is the collection of deposits and issuance of loans, in
addition to a variety of fee-based services. Insurers tend to focus on risk pooling and risk transformation. The former provide leverage to the economy and are the main vehicles of transmission of central banks’ monetary policies, while the latter provide consumers and businesses with protection against negative events.
Consequently the nature of common liabilities of banks, such as deposits, savings accounts and commercial paper, are short-term, thus bearing significant liquidity risks; in contrast, due to the long duration of liabilities of insurance companies, insurance
books of business of global groups can be wound-up by regulatory authorities in an orderly manner. [1]
S&P Global Ratings uses a separate rating approach for banks and for insurance companies. [2,3] S&P Global Market Intelligence’s CreditModel Financial Institutions
takes such differences into account by splitting banks and insurance companies into two separate groups, including only the relevant risk drivers.
A Differentiated Model Development Process
Trained on S&P Global Ratings and Financial Data
We trained CreditModel Financial Institutions using more than 10 years of S&P Global Rating’s historical ratings for banks and insurance companies, from 2001 and from 2005 respectively. We used standalone credit profiles (SACP) where available, or
stripped any group or parental support from the final rating if the standalone credit profile was unavailable, in order to obtain the credit profile of a company prior to any extraordinary support considerations. In total, we used more than 3300 observations
globally for banks, that we complemented with additional 595 internal standalone assessments to enrich our training dataset for banks. In addition, we collected 1354 observations for Insurers globally. We collected all relevant financial items for the
same companies, from S&P Global Market Intelligence’s standardized fundamentals database.
6 See S&P Global Market Intelligence’s “Imputation of missing company financial ratios (April
2015)” document.
CREDITMODEL FINANCIAL INSTITUTIONS
A STATE-OF-THE-ART SCORING MODEL FOR BANKS AND INSURANCE COMPANIES AUG 2017 5 WWW.SPGLOBAL.COM/MARKETINTELLIGENCE
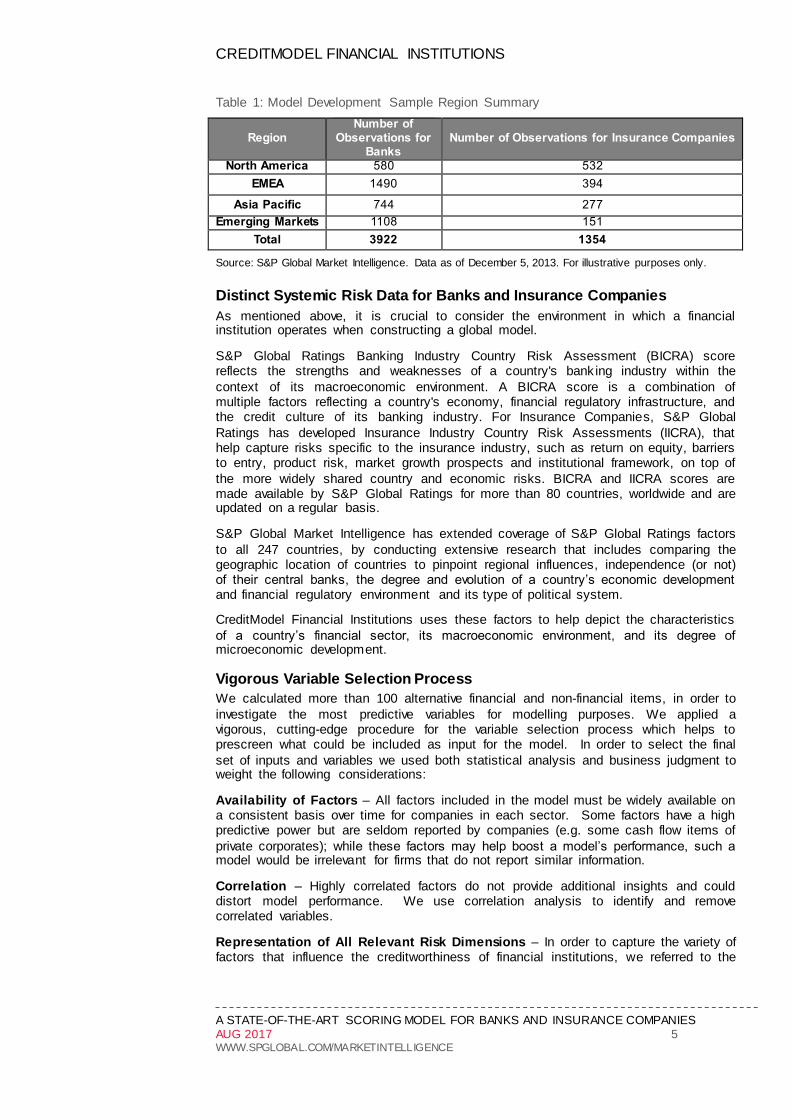
Table 1: Model Development Sample Region Summary
Region Number of
Observations for Banks
Number of Observations for Insurance Companies
North America 580 532
EMEA 1490 394
Asia Pacific 744 277
Emerging Markets 1108 151
Total 3922 1354
Source: S&P Global Market Intelligence. Data as of December 5, 2013. For illustrative purposes only.
Distinct Systemic Risk Data for Banks and Insurance Companies
As mentioned above, it is crucial to consider the environment in which a financial institution operates when constructing a global model.
S&P Global Ratings Banking Industry Country Risk Assessment (BICRA) score reflects the strengths and weaknesses of a country's bank ing industry within the
context of its macroeconomic environment. A BICRA score is a combination of multiple factors reflecting a country's economy, financial regulatory infrastructure, and the credit culture of its banking industry. For Insurance Companies, S&P Global
Ratings has developed Insurance Industry Country Risk Assessments (IICRA), that help capture risks specific to the insurance industry, such as return on equity, barriers to entry, product risk, market growth prospects and institutional framework, on top of
the more widely shared country and economic risks. BICRA and IICRA scores are made available by S&P Global Ratings for more than 80 countries, worldwide and are updated on a regular basis.
S&P Global Market Intelligence has extended coverage of S&P Global Ratings factors
to all 247 countries, by conducting extensive research that includes comparing the geographic location of countries to pinpoint regional influences, independence (or not) of their central banks, the degree and evolution of a country’s economic development and financial regulatory environment and its type of political system.
CreditModel Financial Institutions uses these factors to help depict the characteristics
of a country’s financial sector, its macroeconomic environment, and its degree of microeconomic development.
Vigorous Variable Selection Process
We calculated more than 100 alternative financial and non-financial items, in order to
investigate the most predictive variables for modelling purposes. We applied a vigorous, cutting-edge procedure for the variable selection process which helps to prescreen what could be included as input for the model. In order to select the final
set of inputs and variables we used both statistical analysis and business judgment to weight the following considerations:
Availability of Factors – All factors included in the model must be widely available on a consistent basis over time for companies in each sector. Some factors have a high predictive power but are seldom reported by companies (e.g. some cash flow items of
private corporates); while these factors may help boost a model’s performance, such a model would be irrelevant for firms that do not report similar information.
Correlation – Highly correlated factors do not provide additional insights and could distort model performance. We use correlation analysis to identify and remove correlated variables.
Representation of All Relevant Risk Dimensions – In order to capture the variety of factors that influence the creditworthiness of financial institutions, we referred to the
CREDITMODEL FINANCIAL INSTITUTIONS
A STATE-OF-THE-ART SCORING MODEL FOR BANKS AND INSURANCE COMPANIES AUG 2017 6 WWW.SPGLOBAL.COM/MARKETINTELLIGENCE
list of “risk dimensions”7 that S&P Global Ratings use for the analysis of financial
institutions, and classified each candidate variable into its corresponding risk
dimension, using expert judgement. Then, we selected the variables that would comprise these risk dimensions from a range of categories, including financial information, as well as economic and industry-based risk indicators to ensure a proper
balance of microeconomic and macroeconomic factors, similar to how a rating agency would analyze a bank or an insurance company. In addition to this, when possible, we tried to introduce appropriate quantitative proxies to cover those qualitative elements that rating agencies usually consider in their final assessment.
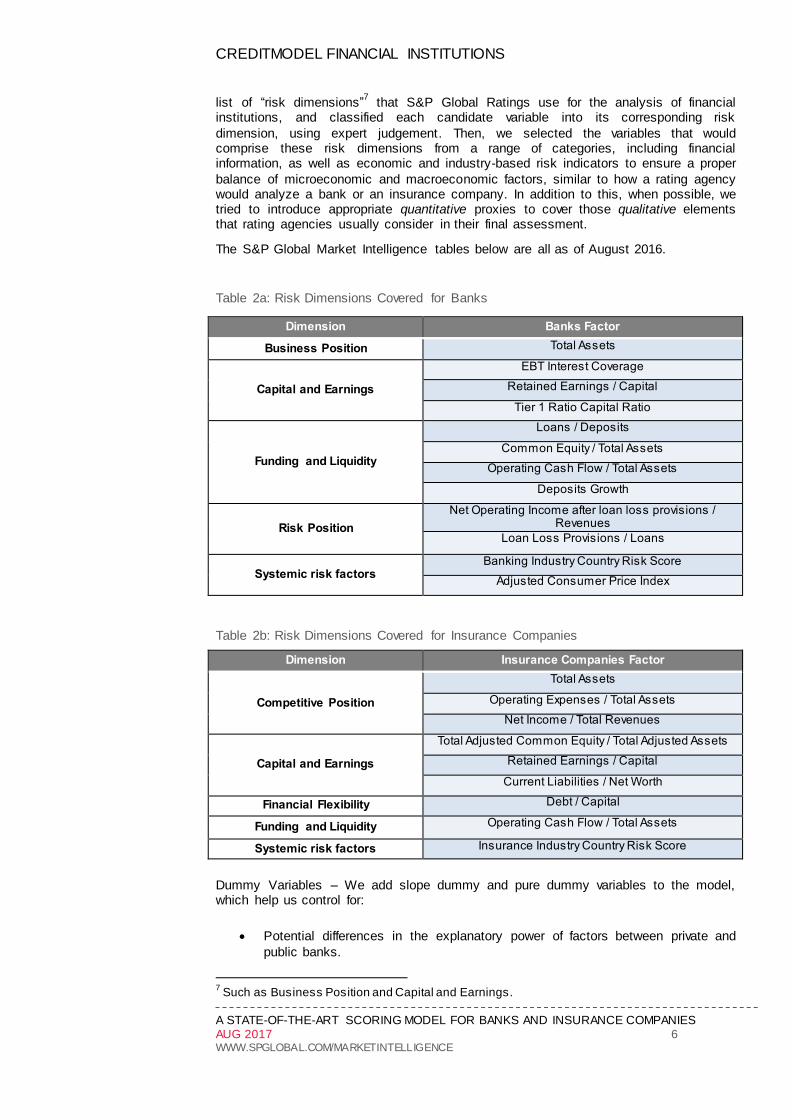
The S&P Global Market Intelligence tables below are all as of August 2016.
Table 2a: Risk Dimensions Covered for Banks
Dimension Banks Factor
Business Position Total Assets
Capital and Earnings
EBT Interest Coverage
Retained Earnings / Capital
Tier 1 Ratio Capital Ratio
Funding and Liquidity
Loans / Deposits
Common Equity / Total Assets
Operating Cash Flow / Total Assets
Deposits Growth
Risk Position
Net Operating Income after loan loss provisions / Revenues
Loan Loss Provisions / Loans
Systemic risk factors Banking Industry Country Risk Score
Adjusted Consumer Price Index
Table 2b: Risk Dimensions Covered for Insurance Companies
Dimension Insurance Companies Factor
Competitive Position
Total Assets
Operating Expenses / Total Assets
Net Income / Total Revenues
Capital and Earnings
Total Adjusted Common Equity / Total Adjusted Assets
Retained Earnings / Capital
Current Liabilities / Net Worth
Financial Flexibility Debt / Capital
Funding and Liquidity Operating Cash Flow / Total Assets
Systemic risk factors Insurance Industry Country Risk Score
Dummy Variables – We add slope dummy and pure dummy variables to the model, which help us control for:
Potential differences in the explanatory power of factors between private and
public banks.
7 Such as Business Position and Capital and Earnings.

CREDITMODEL FINANCIAL INSTITUTIONS
A STATE-OF-THE-ART SCORING MODEL FOR BANKS AND INSURANCE COMPANIES AUG 2017 7 WWW.SPGLOBAL.COM/MARKETINTELLIGENCE
Early warning signals such as low values for tier 1 capital as defined by the latest regulatory guidelines.
Table 3: Types of dummy variables
Dummy Type Factors Sector
Slope Dummy
Company Type (Private / Public) x Total Assets
Banks
Nonperforming assets / Total Assets Banks
Retained Earnings / Capital Banks
Pure Dummy Property and Casualty Sector Insurance
Extra Feature
Debt / Capital Insurance
Total Assets Insurance
Retained Earnings / Capital Insurance
Entity Type, Regional and Sector Segmentation
In order to achieve optimal model performance and stability of the results, the model
was separately trained for banks and insurance companies, and an additional regional segmentation was applied, looking at similarities of available financials and rating distributions, as well as taking into account other macroeconomic considerations.
Table 4a: Regional sub-models for Banks
Sub-Model Region Region
EU&NA NA North America
EU Europe
EM EM Emerging Markets
Other
AM Asia Mature
JPN Japan
PAC Pacific
Table 4b: Regional sub-models for Insurers
Sub-Model Region Region
NA EU NA North America
EU Europe
Non NA EU
EM Emerging Markets
AM Asia Mature
JPN Japan
PAC Pacific
Integration of Most Recent Regulatory Developments
It is imperative for a model to evolve with the market. So we have added to the model
factors that have become the focus of attention following changes in the regulatory environment. An example is our use of the tier-1 capital ratio that is being leveraged to discriminate banks with a value less than 6.6%.

CREDITMODEL FINANCIAL INSTITUTIONS
A STATE-OF-THE-ART SCORING MODEL FOR BANKS AND INSURANCE COMPANIES AUG 2017 8 WWW.SPGLOBAL.COM/MARKETINTELLIGENCE
Sophisticated Methodology
Most of the models available in the market only employ simple logistic regression
techniques. Our model employs an advanced generalization of the logistic regressions, based on the family of Exponential Density Functions. It uses the prior distribution of all S&P Global Ratings credit ratings in the training dataset as an
“anchor distribution”, and modifies it in proportion to how much the financials of a specific company deviate from those of companies used in the anchor distribution. The process of variable selection considers both linear terms and terms of higher
order, and selects the final variables according to k-fold Greedy Forward Approach, a widely-used statistical method that ensures a good fit out-of-sample and out-of-time.
The model uses a number of techniques, including variable transformations, which minimize the impact of extreme values. It also uses various constraints, which avoid
risk of model over-fitting without any loss of data as well as a more accurate estimation of the parameters and final output.
The model maximizes the maximum likelihood function within a Maximum Expected Utility, adapted to the case of multi-state ratings, and uses the Akaike Information
Criterion (AIC) to limit the maximum number of variables that are included (model parsimony). This optimization process ensures the model exhibits greater stability and out-of-time performance. Moreover, monotonicity constraints are applied to ensure that the model produces outputs that follow economic intuition.
Sovereign Cap
We assume that a financial institutions’ rating should not be better than the sovereign country rating at the same time. We apply this assumption to our result by capping any estimated score by the Sovereign Risk Score prevailing at that moment. The
sovereign risk score is the one belonging to the country where the firm is headquartered.
Sovereign foreign currency scores are used since local currency scores may underestimate the credit risk in the country. The sovereign foreign currency score is a
current opinion of a country’s overall capacity to meet its foreign currency -denominated financial obligations and is evaluated on the basis of the country’s individual credit characteristics.
S&P Global Market Intelligence produces the Sovereign foreign currency scores, by applying S&P Global Ratings Sovereign foreign currency rating for the countries
publicly rated by S&P Global Ratings and extending the coverage globally, also to sovereigns not covered by S&P Global Ratings, with a “proxy” mechanism that takes into account geographic proximity and a range of macroeconomic factors.
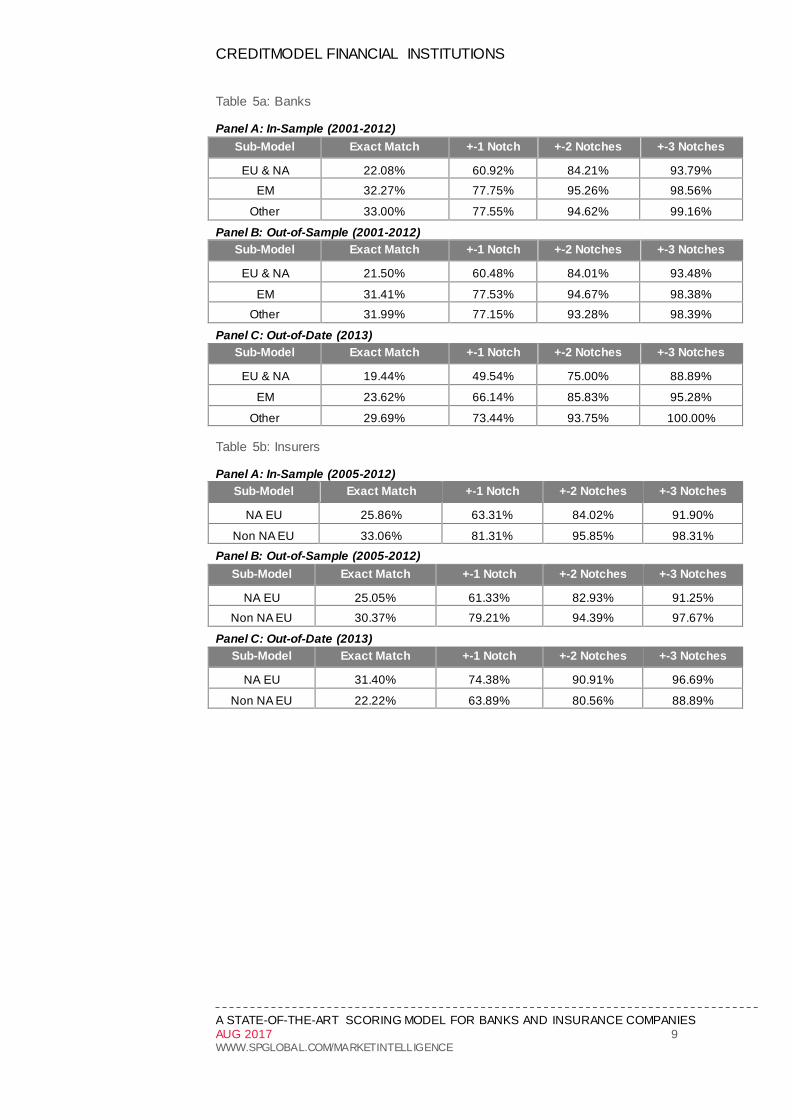
Model Performance
CreditModel Financial Institutions was trained on actual S&P Global Ratings credit ratings (prior to group or government support considerations) and outputs a score that aims to statistically match the rating by S&P Global Ratings. Thus, the model’s
performance can be best measured by looking at the Ratings agreement and other measures of (potential) model bias, both in-sample and out-of-sample, as shown in table 5 and Figure 1. The out-of-sample testing results are nicely aligned and
comparable to the in-sample performance, confirming the robustness of the training process.
The S&P Global Market Intelligence tables below are all as of August 2016, and refer to the S&P Capital IQ platform financials.
CREDITMODEL FINANCIAL INSTITUTIONS
A STATE-OF-THE-ART SCORING MODEL FOR BANKS AND INSURANCE COMPANIES AUG 2017 9 WWW.SPGLOBAL.COM/MARKETINTELLIGENCE
Table 5a: Banks
Panel A: In-Sample (2001-2012)
Sub-Model Exact Match +-1 Notch +-2 Notches +-3 Notches
EU & NA 22.08% 60.92% 84.21% 93.79%
EM 32.27% 77.75% 95.26% 98.56%
Other 33.00% 77.55% 94.62% 99.16%
Panel B: Out-of-Sample (2001-2012)
Sub-Model Exact Match +-1 Notch +-2 Notches +-3 Notches
EU & NA 21.50% 60.48% 84.01% 93.48%
EM 31.41% 77.53% 94.67% 98.38%
Other 31.99% 77.15% 93.28% 98.39%
Panel C: Out-of-Date (2013)
Sub-Model Exact Match +-1 Notch +-2 Notches +-3 Notches
EU & NA 19.44% 49.54% 75.00% 88.89%
EM 23.62% 66.14% 85.83% 95.28%
Other 29.69% 73.44% 93.75% 100.00%
Table 5b: Insurers
Panel A: In-Sample (2005-2012)
Sub-Model Exact Match +-1 Notch +-2 Notches +-3 Notches
NA EU 25.86% 63.31% 84.02% 91.90%
Non NA EU 33.06% 81.31% 95.85% 98.31%
Panel B: Out-of-Sample (2005-2012)
Sub-Model Exact Match +-1 Notch +-2 Notches +-3 Notches
NA EU 25.05% 61.33% 82.93% 91.25%
Non NA EU 30.37% 79.21% 94.39% 97.67%
Panel C: Out-of-Date (2013)
Sub-Model Exact Match +-1 Notch +-2 Notches +-3 Notches
NA EU 31.40% 74.38% 90.91% 96.69%
Non NA EU 22.22% 63.89% 80.56% 88.89%

CREDITMODEL FINANCIAL INSTITUTIONS
A STATE-OF-THE-ART SCORING MODEL FOR BANKS AND INSURANCE COMPANIES AUG 2017 10 WWW.SPGLOBAL.COM/MARKETINTELLIGENCE
The figures that follow show the consistency of the model performance by region as represented by the alignment with S&P Global Ratings credit ratings.
8
Figure 1: Banks Scores
Source: S&P Global Market Intelligence. Data as of December 5, 2013. For illustrative purposes only.
Figure 2: Banks Neutrality
Source: S&P Global Market Intelligence. Data as of December 5, 2013. For illustrative purposes only.
8 ‘Neutrality’ measures the average of the score differences (model score – SACP), while
‘absolute neutrality’ measures the average of the absolute differences (|model score – SACP). SACP is an abbreviation for standalone credit profile.
0
200
400
600
800
1000
1200
1400
16001
2
3
4
5
6
7
8
9
10
11
12
13
14
15
16
17
18
0
200
400
600
800
1000
1200
1400
1600
-0.5
0.0
0.5
1.0
1.5
2.0
2.5
3.0

CREDITMODEL FINANCIAL INSTITUTIONS
A STATE-OF-THE-ART SCORING MODEL FOR BANKS AND INSURANCE COMPANIES AUG 2017 11 WWW.SPGLOBAL.COM/MARKETINTELLIGENCE
Figure 3: Insurers Scores
Source: S&P Global Market Intelligence. Data as of December 5, 2013. For illustrative purposes only.
Figure 4: Insurers Neutrality
Source: S&P Global Market Intelligence. Data as of December 5, 2013. For illustrative purposes only.
The CreditModel Financial Institutions model performs equally well using SNL Platform financials. Refer to Appendix D for further details on model performance and
ratings agreement when using complete US Bank Regulatory financials, extracted from SNL Platform, or leveraging the imputation techniques.
CREDITMODEL FINANCIAL INSTITUTIONS
A STATE-OF-THE-ART SCORING MODEL FOR BANKS AND INSURANCE COMPANIES AUG 2017 12 WWW.SPGLOBAL.COM/MARKETINTELLIGENCE
Case Studies
Banks
Allied Irish Banks, p.l.c. provides banking and financial products and services to
personal, business, and corporate customers in the Republic of Ireland and the United Kingdom. It operates a network of 200 branches, 70 EBS outlets, and 16 business centers. Allied Irish Banks, p.l.c. was founded in 1825 and is headquartered in Dublin, Ireland. Allied Irish Banks was first rated by S&P Global Ratings in 1988.
Figure 5 shows the evolution of the Stand-Alone Credit Profile (SACP) and the CMFI score for the period 2005-2014. The scores presented are derived from the credit factors corresponding to the fiscal year before each scoring period. According to S&P
Global Ratings, among the main strengths of the company until 2008 are the high market share and its sound funding and liquidity levels.
9 On the other hand, the main
weakness is the high exposure to property-related lending in both Ireland and the U.K.
Although the company maintains its strong domestic market position after 2008, the unfavorable economic environment led to a weaker funding profile, weaker asset quality and low profitability. As a result, it was downgraded several times from 12
February 2009 until 2 February 2011 falling from an Issuer Credit Rating of A+ to BB. Its SACP has been even worse (b+) reflecting the government support for the issuer.
CMFI score closely follows the company’s consecutive downgrades since it mainly reflects its weakened financials. Specifically, EBT Interest Coverage, Retained
Earnings over Debt and Equity ratio constantly decrease from 2008 to 2011 and fall into negative levels beginning in the 2010 scoring period. Moreover, the Non-Performing Assets over Total Assets ratio increases to levels above 3.4% since the
2010 scoring period. The model score for the 2011 scoring period is signi ficantly deteriorated by the decrease in the Tier 1 Capital Ratio to 4.3%, which is below the model’s threshold of 6.6%, but it never differs by more than 2 notches vs . the
corresponding S&P Global Ratings rating. Both Non-Performing Assets and Tier 1 credit indicator value changes “activate” the model’s early warning signals. The reversal of the Tier 1 Capital Ratio, along with a significant increase of the Equity over
Equity and Debt ratio, affects positively the CMFI score which is gradually perfectly aligned with the SACP during the period 2012-2014.
9 Refer to S&P Global Ratings Full Analysis reports found in
https://www.capitaliq.com/CIQDotNet/GCPCompany/GCPTearsheet.aspx?leftlink=true&companyId=324875

CREDITMODEL FINANCIAL INSTITUTIONS
A STATE-OF-THE-ART SCORING MODEL FOR BANKS AND INSURANCE COMPANIES AUG 2017 13 WWW.SPGLOBAL.COM/MARKETINTELLIGENCE
Figure 5: Banks Case Study
Source: S&P Global Market Intelligence. Data as of June 3, 2015. For illustrative purposes only 10.
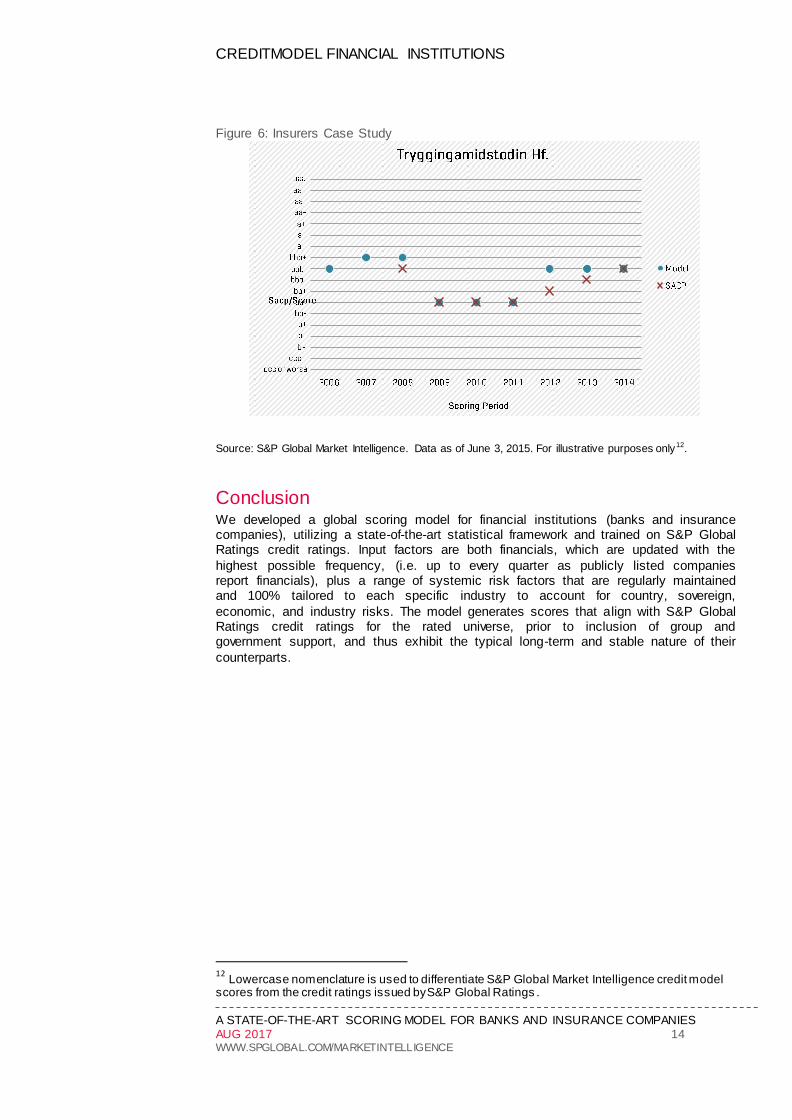
Insurers
Tryggingamidstodin Hhf (TM) was established in Reykjavik, Iceland, in 1956 to provide non-life insurance to the fisheries sector. In 1998 it became the first listed insurer in Iceland. Today, TM, together with its subsidiaries, provides a range of insurance
products and financial services to individuals and companies in Iceland. The company operates through Non-Life Insurance, Life Insurance, and Financial Operation segments. It offers life; marine, flight, and cargo; motor; general liability; accident and
health; and other insurance products. TM was first rated by S&P Global Ratings in early 2008 with ‘bbb’ (SACP - see figure below). One year later, in October 2009, TM was downgraded by three notches to ‘bb’ (SACP - junk category). TM’s
creditworthiness gradually improved until 2014, when it was finally rated with a standalone assessment of ‘bbb’, back to the investment grade category.
11 As we will
show below, the model successfully predicted and even anticipated the ratings’
movement despite the unusually high volatility of TM’s standalone assessment. TM’s ‘bbb’ assessment in 2008 reflected its good capitalization and competitive position, offset by its marginal operating performance. In 2009, TM was downgraded
to ‘bb’, in light of the filing for bankruptcy protection by its parent company (Stodir Hf) and exacerbated by TM’s heavy losses reported in 2008; net income to the company plunged 500% to -17640 (million ISK) resulting in the collapse of the company’s
retained earnings to -279 (million ISK). CM FI provided a strong signal showing the deterioration of the company’s creditworthiness, by scoring TM with ‘bb’ from a previous ‘bbb+’. TM’s model score remained stable at ‘bb’, well aligned with its
standalone assessment, until 2012, when the company’s model score improved significantly, largely due to TM’s strengthening liquidity and capital profile. TM’s improved operating performance also resulted in a gradual uplift of the company’s
standalone assessment, which finally converged with the model score (‘bbb’) in 2014. The figure that follows clearly shows that CreditModel FI anticipated the movement by S&P Global Ratings in the period between 2012 and 2014.
10
Lowercase nomenclature is used to differentiate S&P Global Market Intelligence credit model scores from the credit ratings issued by S&P Global Ratings . 11
Refer to S&P Global Ratings Full Analysis reports found in https://www.capitaliq.com/CIQDotNet/GCPCompany/GCPTearsheet.aspx?leftlink=true&companyId=20376386
1
2
3
4
5
6
7
8
9
10
11
12
13
14
15
16
17
18
CREDITMODEL FINANCIAL INSTITUTIONS
A STATE-OF-THE-ART SCORING MODEL FOR BANKS AND INSURANCE COMPANIES AUG 2017 14 WWW.SPGLOBAL.COM/MARKETINTELLIGENCE
Figure 6: Insurers Case Study
Source: S&P Global Market Intelligence. Data as of June 3, 2015. For illustrative purposes only12.
Conclusion We developed a global scoring model for financial institutions (banks and insurance companies), utilizing a state-of-the-art statistical framework and trained on S&P Global Ratings credit ratings. Input factors are both financials, which are updated with the
highest possible frequency, (i.e. up to every quarter as publicly listed companies report financials), plus a range of systemic risk factors that are regularly maintained and 100% tailored to each specific industry to account for country, sovereign,
economic, and industry risks. The model generates scores that align with S&P Global Ratings credit ratings for the rated universe, prior to inclusion of group and government support, and thus exhibit the typical long-term and stable nature of their
counterparts.
12
Lowercase nomenclature is used to differentiate S&P Global Market Intelligence credit model scores from the credit ratings issued by S&P Global Ratings .
1
2
3
4
5
6
7
8
9
10
11
12
13
14
15
16
17
18
CREDITMODEL FINANCIAL INSTITUTIONS
A STATE-OF-THE-ART SCORING MODEL FOR BANKS AND INSURANCE COMPANIES AUG 2017 15 WWW.SPGLOBAL.COM/MARKETINTELLIGENCE
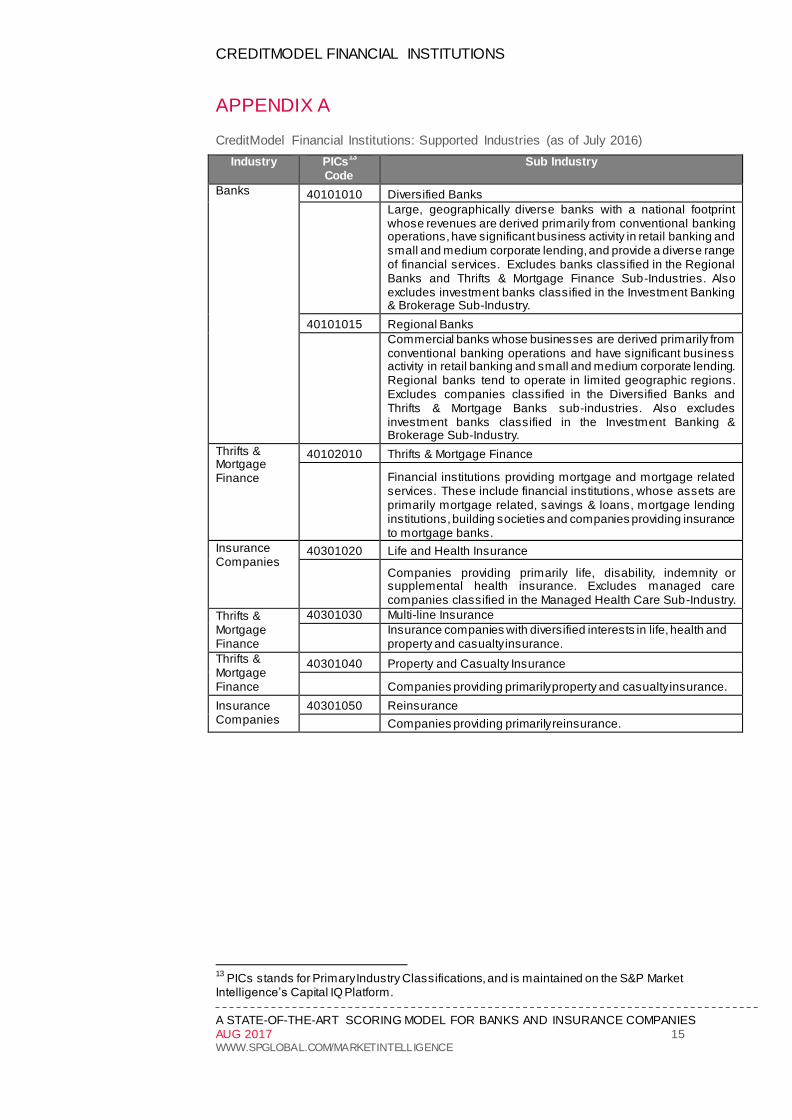
APPENDIX A
CreditModel Financial Institutions: Supported Industries (as of July 2016)
Industry PICs13
Code
Sub Industry
Banks 40101010 Diversified Banks
Large, geographically diverse banks with a national footprint whose revenues are derived primarily from conventional banking operations, have significant business activity in retail banking and small and medium corporate lending, and provide a diverse range of financial services. Excludes banks classified in the Regional Banks and Thrifts & Mortgage Finance Sub-Industries. Also excludes investment banks classified in the Investment Banking & Brokerage Sub-Industry.
40101015 Regional Banks
Commercial banks whose businesses are derived primarily from conventional banking operations and have significant business activity in retail banking and small and medium corporate lending. Regional banks tend to operate in limited geographic regions. Excludes companies classified in the Diversified Banks and Thrifts & Mortgage Banks sub-industries. Also excludes investment banks classified in the Investment Banking & Brokerage Sub-Industry.
Thrifts & Mortgage Finance
40102010 Thrifts & Mortgage Finance
Financial institutions providing mortgage and mortgage related services. These include financial institutions, whose assets are primarily mortgage related, savings & loans, mortgage lending institutions, building societies and companies providing insurance to mortgage banks.
Insurance Companies
40301020 Life and Health Insurance
Companies providing primarily life, disability, indemnity or supplemental health insurance. Excludes managed care companies classified in the Managed Health Care Sub-Industry.
Thrifts & Mortgage Finance
40301030 Multi-line Insurance
Insurance companies with diversified interests in life, health and property and casualty insurance.
Thrifts & Mortgage Finance
40301040 Property and Casualty Insurance
Companies providing primarily property and casualty insurance.
Insurance Companies
40301050 Reinsurance
Companies providing primarily reinsurance.
13
PICs stands for Primary Industry Classifications, and is maintained on the S&P Market Intelligence’s Capital IQ Platform.
CREDITMODEL FINANCIAL INSTITUTIONS
A STATE-OF-THE-ART SCORING MODEL FOR BANKS AND INSURANCE COMPANIES AUG 2017 16 WWW.SPGLOBAL.COM/MARKETINTELLIGENCE
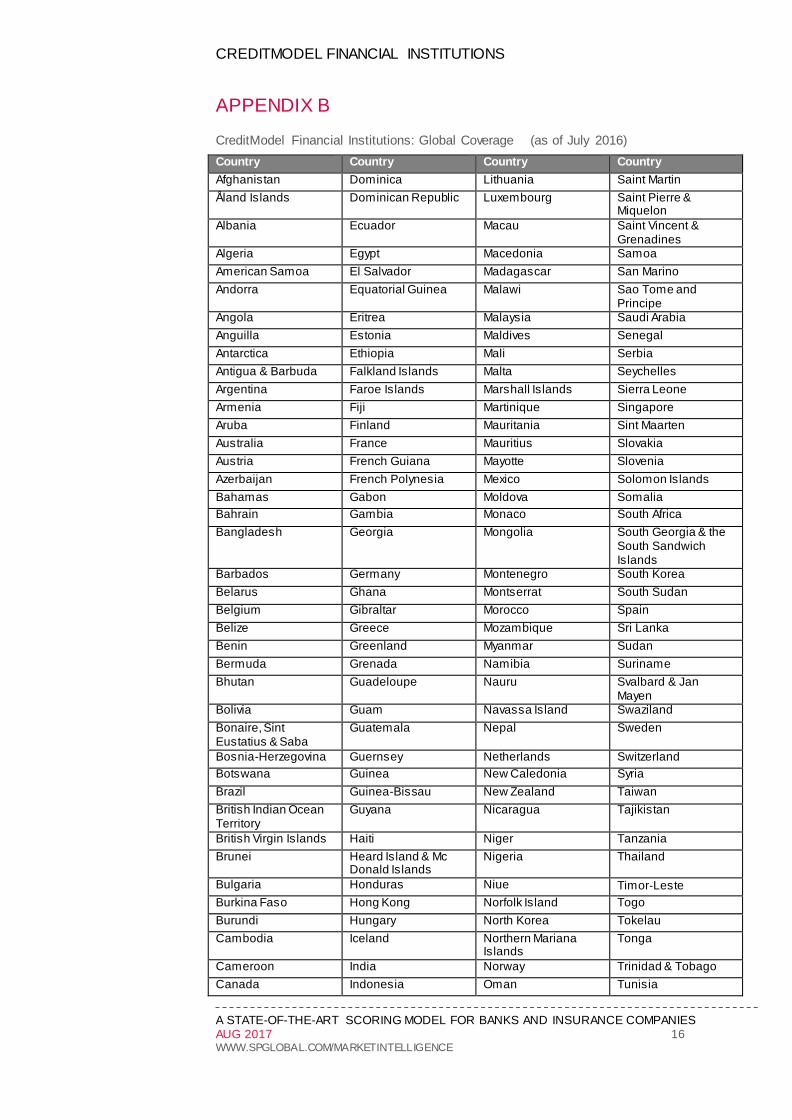
APPENDIX B
CreditModel Financial Institutions: Global Coverage (as of July 2016)
Country Country Country Country
Afghanistan Dominica Lithuania Saint Martin
Åland Islands Dominican Republic Luxembourg Saint Pierre & Miquelon
Albania Ecuador Macau Saint Vincent & Grenadines
Algeria Egypt Macedonia Samoa
American Samoa El Salvador Madagascar San Marino
Andorra Equatorial Guinea Malawi Sao Tome and Principe
Angola Eritrea Malaysia Saudi Arabia
Anguilla Estonia Maldives Senegal
Antarctica Ethiopia Mali Serbia
Antigua & Barbuda Falkland Islands Malta Seychelles
Argentina Faroe Islands Marshall Islands Sierra Leone
Armenia Fiji Martinique Singapore
Aruba Finland Mauritania Sint Maarten
Australia France Mauritius Slovakia
Austria French Guiana Mayotte Slovenia
Azerbaijan French Polynesia Mexico Solomon Islands
Bahamas Gabon Moldova Somalia
Bahrain Gambia Monaco South Africa
Bangladesh Georgia Mongolia South Georgia & the South Sandwich Islands
Barbados Germany Montenegro South Korea
Belarus Ghana Montserrat South Sudan
Belgium Gibraltar Morocco Spain
Belize Greece Mozambique Sri Lanka
Benin Greenland Myanmar Sudan
Bermuda Grenada Namibia Suriname
Bhutan Guadeloupe Nauru Svalbard & Jan Mayen
Bolivia Guam Navassa Island Swaziland
Bonaire, Sint Eustatius & Saba
Guatemala Nepal Sweden
Bosnia-Herzegovina Guernsey Netherlands Switzerland
Botswana Guinea New Caledonia Syria
Brazil Guinea-Bissau New Zealand Taiwan
British Indian Ocean Territory
Guyana Nicaragua Tajikistan
British Virgin Islands Haiti Niger Tanzania
Brunei Heard Island & Mc Donald Islands
Nigeria Thailand
Bulgaria Honduras Niue Timor‐Leste
Burkina Faso Hong Kong Norfolk Island Togo
Burundi Hungary North Korea Tokelau
Cambodia Iceland Northern Mariana Islands
Tonga
Cameroon India Norway Trinidad & Tobago
Canada Indonesia Oman Tunisia

CREDITMODEL FINANCIAL INSTITUTIONS
A STATE-OF-THE-ART SCORING MODEL FOR BANKS AND INSURANCE COMPANIES AUG 2017 17 WWW.SPGLOBAL.COM/MARKETINTELLIGENCE
Cape Verde Iran Pakistan Turkey
Cayman Islands Iraq Palau Turkmenistan
Central African Republic
Ireland Palestinian Authority Turks & Caicos Islands
Chad Isle of Man Panama Tuvalu
Channel Islands Israel Papua New Guinea Uganda
Chile Italy Paraguay Ukraine
China Jamaica Peru United Arab Emirates
Christmas Island Japan Philippines United Kingdom
Cocos (Keeling) Islands
Jersey Pitcairn Islands United States
Colombia Jordan Poland United States Virgin Islands
Comoros Kazakhstan Portugal Uruguay
Cook Islands Kenya Puerto Rico Uzbekistan
Costa Rica Kiribati Qatar Vanuatu
Côte d'Ivoire Kuwait Republic of the Congo Vatican City
Croatia Kyrgyzstan Réunion Venezuela
Cuba Laos Romania Vietnam
Curaçao Latvia Russia Wallis & Futuna
Cyprus Lebanon Rwanda Western Sahara
Czech Republic Lesotho Saint Barthélemy Yemen
Democratic Republic of the Congo
Liberia Saint Helena, Ascension & Tristan da Cunha
Zambia
Denmark Libya Saint Kitts & Nevis Zimbabwe
Djibouti Liechtenstein Saint Lucia
APPENDIX C
Model Development Sample Region Summary
Region # Observations # Observations
Banks Insurers
AM 379 143
EM 1108 151
EU 1490 394
JPN 213 87
NA 580 532
PAC 152 47
Total 3922 1354
Source: S&P Global Market Intelligence. Data as of December 5, 2013. For illustrative purposes only.

CREDITMODEL FINANCIAL INSTITUTIONS
A STATE-OF-THE-ART SCORING MODEL FOR BANKS AND INSURANCE COMPANIES AUG 2017 18 WWW.SPGLOBAL.COM/MARKETINTELLIGENCE
APPENDIX D
Table a: Comparing US Regulatory Bank Financials model scores from SNL platform with SACP Ratings
Sub-Model Exact Match
+/- 1 Notch
+/- 2 Notch
+/- 3 Notch
+/- 4 Notch
US Regulatory Financials
19.95% 57.86% 81.55% 94.26% 98.75%
Source: S&P Global Market Intelligence. Data as of June 30, 2017. For illustrative purposes only.
Table b: Comparing Imputed SNL Bank Financials model scores with SACP Ratings
Sub-
Model Exact Match
+/- 1 Notch
+/- 2 Notch
+/- 3 Notch
+/- 4 Notch
SNL_Imputed vs
SACP
Overall 23.87% 65.96% 88.26% 95.25% 98.81%
EU & NA 21.20% 59.21% 84.08% 93.03% 98.17%
EM 26.45% 72.80% 92.31% 97.00% 99.44%
Other 28.73% 77.97% 95.90% 99.78% 100.00%
Source: S&P Global Market Intelligence. Data as of June 30, 2017. For illustrative purposes only.

CREDITMODEL FINANCIAL INSTITUTIONS
A STATE-OF-THE-ART SCORING MODEL FOR BANKS AND INSURANCE COMPANIES AUG 2017 19 WWW.SPGLOBAL.COM/MARKETINTELLIGENCE
References
[1] Raj Singh, “Risk Management – Setting a new course”, Swiss Re (presented at the
European Commission, DG MARKT, 12 November 2010).
[2] Standard & Poor’s, “Banks: Quantitative Metrics for Rating Banks Globally:
Methodology and Assumptions” (17 July 2013), available on the Global Credi t Portal.
[3] Standard & Poor’s, “Insurers: Rating Methodology” (7 May 2013), available on the
Global Credit Portal.
[4] S&P Capital IQ, “CreditModel – Financial Institutions” (May 2015), Technical
Reference Guide
About S&P Global Market Intelligence
At S&P Global Market Intelligence, we know that not all information is important—
some of it is vital. We integrate financial and industry data, research and news into
tools that help track performance, generate alpha, identify investment ideas,
understand competitive and industry dynamics, perform valuation and assess credit
risk. Investment professionals, government agencies, corporations and universities
globally can gain the intelligence essential to making business and financial decisions
with conviction.
S&P Global Market Intelligence is a division of S&P Global (NYSE: SPGI), which
provides essential intelligence for individuals, companies and governments to make decisions with confidence. For more information, visit www.spglobal.com/marketintelligence.
CREDITMODEL FINANCIAL INSTITUTIONS
A STATE-OF-THE-ART SCORING MODEL FOR BANKS AND INSURANCE COMPANIES AUG 2017 20 WWW.SPGLOBAL.COM/MARKETINTELLIGENCE
Copyright © 2017 by S&P Global Market Intelligence, a division of S&P Global Inc. All rights reserved.
These materials have been prepared solely for information purposes based upon information generally available to the Public and from sources believed to be reliable. No content (including index data, ratings,
credit-related analyses and data, research, model, softw are or other application or output therefrom) or any part thereof (Content) may be modif ied, reverse engineered, reproduced or distributed in any form by any means, or stored in a database or retrieval system, w ithout the prior w ritten permission of S&P
Global Market Intelligence or its aff iliates (collectively, S&P Global). The Content shall not be used for any unlaw ful or unauthorized purposes. S&P Global and any third-party providers, (collectively S&P Global Parties) do not guarantee the accuracy, completeness, timeliness or availability of the Content. S&P Global Parties are not responsible for any errors or omissions, regardless of the cause, for the
results obtained from the use of the Content. THE CONTENT IS PROVIDED ON “AS IS” BASIS. S&P GLOBAL PARTIES DISCLAIM ANY AND ALL EXPRESS OR IMPLIED WARRANTIES, INCLUDING, BUT NOT LIMITED TO, ANY WARRANTIES OF MERCHANTABILITY OR FITNESS FOR A PARTICULAR PURPOSE OR USE, FREEDOM FROM BUGS, SOFTWARE ERRORS OR DEFECTS,
THAT THE CONTENT’S FUNCTIONING WILL BE UNINTERRUPTED OR THAT THE CONTENT WILL OPERATE WITH ANY SOFTWARE OR HARDWARE CONFIGURATION. In no event shall S&P Global Parties be liable to any party for any direct, indirect, incidental, exemplary, compensatory, punitive, special or consequential damages, costs, expenses, legal fees, or losses (including, w ithout limitation,
lost income or lost profits and opportunity costs or losses caused by negligence) in connection w ith any use of the Content even if advised of the possibility of such damages.
S&P Global Market Intelligence’s opinions, quotes and credit-related and other analyses are statements of opinion as of the date they are expressed and not statements of fact or recommendations to purchase, hold, or sell any securities or to make any investment decisions, and do not address the suitability of any security. S&P Global Market Intelligence assumes no obligation to update the Content
follow ing publication in any form or format. The Content should not be relied on and is not a substitute for the skill, judgment and experience of the user, its management, employees, advisors and/or clients when making investment and other business decisions. S&P Global Market Intelligence does not act as a f iduciary or an investment advisor except where registered as such. S&P Global keeps certain activities
of its divisions separate from each other in order to preserve the independence and objectivity of their respective activities. As a result, certain divisions of S&P Global may have information that is not available to other S&P Global divisions. S&P Global has established policies and procedures to maintain the confidentiality of certain non-public information received in connection w ith each analytical process.
S&P Global Ratings does not contribute to or participate in the creation of credit scores generated by S&P Global Market Intelligence. Low ercase nomenclature is used to differentiate S&P Global Market
Intelligence PD credit model scores from the credit ratings issued by S&P Global Ratings.
S&P Global may receive compensation for its ratings and certain analyses, normally from issuers or underw riters of securities or from obligors. S&P Global reserves the right to disseminate its opinions and
analyses. S&P Global's public ratings and analyses are made available on its Web sites,
www.standardandpoors.com (free of charge), and www.ratingsdirect.com and
www.globalcreditportal.com (subscription), and may be distributed through other means,
including via S&P Global publications and third-party redistributors. Additional information about our
ratings fees is available at www.standardandpoors.com/usratingsfees.
CONTACT US
Americas +1 877 863 1306
Europe, Middle East and Africa +44 (0)20 7176 1234
Asia Pacific +852 2533 3535
credit_analytics @spglobal.com
www.spglobal.com/mark
etintelligence