cristian e. acevedo, florida international university...
TRANSCRIPT

SEISMIC VULNERABILITY OF NON-SPECIAL BOUNDARY ELEMENT OF SHEAR WALL UNDER AXIAL FORCE REVERSALS
Cristian E. Acevedo, Florida International University Research Partner: Ariel Creagh
REU Site: University of California, Berkeley Research Advisor: Professor Jack P. Moehle
Graduate Advisors: Wael Hassan, PhD Candidate, Ahmet Can Tanyeri

II
ABSTRACT The poor building performance seen on the February 2010 Chile earthquake suggests experimental research on non-special boundary elements of shear walls be conducted. At the same time, provide a check on ACI Code 318-08 since Chile’s building code is very similar with major exceptions. The research presented here investigated the performance of two reinforce concrete specimens with non-special boundary element (as per ACI 318-08), under monotonic axial loading. The experimental results showed that shear walls with non-special boundary elements are non-ductile and are extremely weak under axial force reversals. Furthermore, revisions need to be made on ACI Code permitting the use of non-special boundary elements in buildings in the United States.

III
TABLE OF CONTENTS 1 INTRODUCTION .................................................................................................................. 1
1.1 BACKGROUND ........................................................................................................................... 1 1.2 RESEARCH OBJECTIVE AND SIGNIFICANCE .................................................................. 1 1.3 LITERATURE SURVEY............................................................................................................. 1
2 TEST SPECIMEN .................................................................................................................. 3 2.1 DESIGN CONSIDERATIONS .................................................................................................... 3 2.2 SPECIMEN DESIGN ................................................................................................................... 3
2.2.1 Material Properties ................................................................................................................. 4 2.3 CONSTRUCTION ........................................................................................................................ 5 2.4 TEST SETUP................................................................................................................................. 7
2.4.1 Tension Setup/Procedure........................................................................................................ 7 2.4.2 Compression Setup/Procedure ............................................................................................... 8
3 TEST RESULTS ..................................................................................................................... 9 3.1 TENSION TEST............................................................................................................................ 9 3.2 COMPRESSION TEST................................................................................................................ 9
4 DISCUSSION/ANALYSIS OF TEST RESULTS.............................................................. 11 4.1 TENSION TEST.......................................................................................................................... 11 4.2 COMPRESSION TEST.............................................................................................................. 11
5 CONCLUSION ..................................................................................................................... 14
6 REFERENCES...................................................................................................................... 15 7 ACKNOWLEDGEMENT.................................................................................................... 16

1
1 INTRODUCTION 1.1 BACKGROUND On February 27, 2010, an earthquake of Mw 8.8 struck the Central South Region of Chile; according to reconnaissance reports more than 50 reinforced concrete buildings were damaged as a result (EERI Special Earthquake Report, 2010). In addition, other reports indicate that most of these buildings had widely spaced transverse reinforcement or unconfined boundary elements (Moehle et. al, 2010). The failures sustained by the Chilean buildings are concerning since most of them were constructed using standards and engineering methods similar to those in the United States (U.S.). Moreover, there are buildings in the U.S. that have walls bounded with widely spaced transverse reinforcement as permitted by ACI 318-08. Nonetheless, these boundary elements are bent 135 degrees as opposed to those found in the Chilean buildings, which were bent 90 degrees. The failures observed in the Chilean buildings are yet to be understood. It is still unclear whether they were triggered by compression alone or tension following compression. Furthermore, these failures are triggers to take a closer look to the ACI 318-08 and revise it as needed.
1.2 RESEARCH OBJECTIVE AND SIGNIFICANCE In order to understand what contributed to these failures, rigorous research is needed. This paper provides the first steps of exploratory studies of unconfined (non-special) boundary elements. The objective of this research is to study the behavior of shear walls with non-special boundary elements under monotonic tensile and compressive axial loading. In addition, the shear wall boundary elements will follow ACI 318-08 provisions in order to provide a quick check on the code. 1.3 LITERATURE SURVEY Amendments to earthquake-resistant building codes are often considered when poor building performance is observed after an earthquake. The February 2010 Chile earthquake is a great example where poor structural performance of shear walls suggests code revisions. Most of the buildings that suffered significant damaged in Chile were built with non-special boundary elements in their shear walls (EERI Special Earthquake Report, 2010). Typically, these walls are confined with special boundary elements in order to sustain the lateral loads exerted by an earthquake. Nevertheless, in past post-earthquake studies, it has been reported that structures with non-special boundary elements also perform well during large earthquakes (Wallace and Moehle, 1992). Thus, it is not clear why was such failure observed now and not in past

2
earthquakes. Furthermore, no experimental research has been done on walls with such light reinforcement to reach any conclusions. Due to code ambiguity, most of the research conducted over the years has focused on incorporating analytical ways to properly discern when to use close confinement in walls (Wallace and Moehle, 1992). Going back to the example above, the Chilean code (NCh 433.Of96) is based on the ACI 318-95, except that closely spaced transverse reinforcement is not required at wall boundaries (Wallace and Hooper, 2010). Currently, the ACI 318-08 requires a displacement and neutral axis check in order to determine if special boundary elements are needed. Nonetheless, it allows the usage of non-special boundary elements as well where the special boundary criterion is not met. Thus, it is essential to examine these code provisions and verify what amendments need to be implemented. It is important to understand that during an earthquake, the walls of a building are subjected to strong axial loads due to lateral ground motion. Such axial forces were observed by reconnaissance reports in the February 2010 Chile earthquake (Wallace and Hooper, 2010). Moreover, based on previous research, the end-regions of a wall can be thought to behave as an axially loaded column (Chai and Elayer, 1999). Figure 1.1 shows a schematic of such idealization, it can be seen that the end-regions are exposed to reversed cyclic loadings due to the lateral loads of the earthquake; in turn, leading to buckling.
Figure 1.1: Earthquake lateral loads inducing axial forces on wall end-region: (a) cracks open under tension; (b) cracks close when load is reversed in compression (Chai and Elayer, 1999)

3
Taking a closer look at Figure 1.1, it can be seen that crack development and closure appears as a result of tension and compression loadings, respectively. In addition, experiments with columns containing special boundary elements show that the cracks follow the same spacing as the transverse reinforcement (Chai and Elayer, 1999). Nonetheless, these experiments did not address whether buckling of the column is attributed to compression alone or tension then compression; but rather focused on estimating the maximum tensile strain after reversed cyclic loadings. Other studies have showed that wall length and previously experienced tensile strain affects the properties of inelastic buckling of a wall (Pauley and Priestly, 1993). The latter can be related to reversed cyclic loading. According to recent findings, reversed cyclic loading can affect the important characteristics of reinforcing steel, i.e., diminishing yielding plateau, growth of the curvature in cyclic stress-strain response, Baushinger’s effect, low-cycle fatigue, stress relaxation, strength degradation, and buckling (Heo, Zhang, and Kunnath, 2009).
2 TEST SPECIMEN
2.1 DESIGN CONSIDERATIONS The specimens designed represent a portion of the end-regions of a shear wall where the boundary elements are found. Various configurations, such as using different reinforcement ratios and bar sizes, were contemplated in the design process of the specimens. Nevertheless, building and testing these different configurations would have taken more than the stipulated time of ten weeks. As a result, the final design was reduced to two specimens. The two main equations that were used for the design of the specimen are shown below.
C = 0.85fc’(Ag – Ast) + Astfy (Eq.1)
T = Astfy (Eq.2) The C and T stand for stress in reinforced concrete and stress in reinforcement, respectively. 2.2 SPECIMEN DESIGN The two specimens were built according to ACI 318-08 Section 21.9.6.5 for non-special boundary elements (NSBE). The dimensions were six inches thick by 12 inches deep by 36 inches high. The thickness chosen represented the actual thickness of a wall, while the depth and the height represented a section of the wall carefully chosen to prevent any slenderness problem when testing. The tension part of the test was the controlling factor in the overall design of the specimens. In order to pull one of the specimens in tension, special heavily reinforced concrete heads were designed to withstand the splitting forces (Refer to Section 2.4.2.1 for more details).

4
The steel reinforcement consisted of #6 longitudinal headed bars, #3 transverse reinforcement along the longitudinal bars, and #4 transverse reinforcement and #3 crossties for the heads. Figure 2.1 shows the specimen dimensions and detailing.
Figure 2.1: Specimen dimension and detailing
2.2.1 Material Properties 2.2.1.1 Concrete A special concrete mixture was developed by the laboratory to have a compressive strength of 4000 psi in two weeks. The reason for this mixture was to reduce curing time in order to complete the testing of specimens on time. Two batches were done per specimen, testing three concrete cylinders per batch. Table 2.1 shows the average compressive strength obtained from the 6 x 12 cylinders.

5
Table 1.1 Concrete Compressive Strength
Cylinder NSBE1 (psi) NSBE2 (psi) Average 5,780 6,171
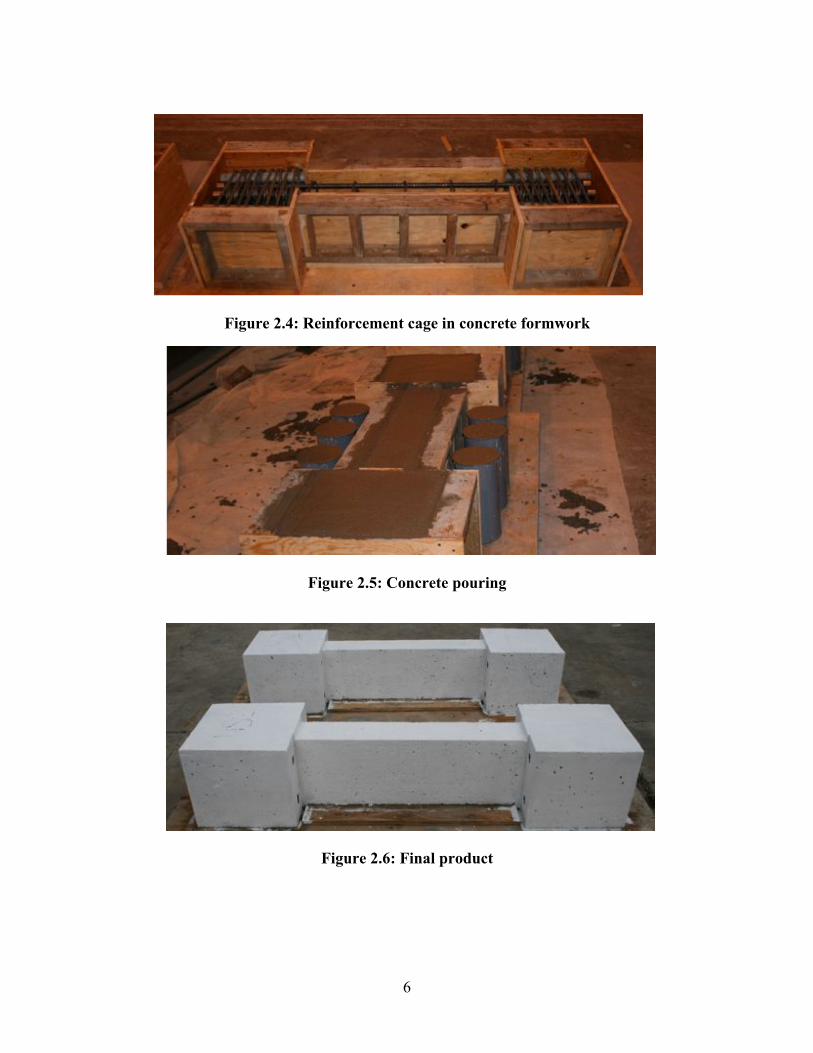
2.2.1.2 Steel A tensile test was conducted to verify the yielding stress of the main longitudinal reinforcement used for the specimens. The test corroborated a yielding stress of 67 ksi for #6 rebar. 2.3 CONSTRUCTION The construction process began with the concrete formwork, followed by the reinforcement cage, ending with the concrete pouring and curing. The concrete formwork was built using two by four lumber and plywood sheets. The entire construction sequence is shown in Figures 2.1 – 2.6. The whole construction process took approximately seven weeks.
Figure 2.2: Concrete formwork
Figure 2.3: Reinforcement cage
6
Figure 2.4: Reinforcement cage in concrete formwork
Figure 2.5: Concrete pouring
Figure 2.6: Final product

7
2.4 TEST SETUP Of the two specimens, one was tested in compression, while the other one was tested in tension followed by compression. 2.4.1 Tension Setup/Procedure The tension test was carried out to attain a four percent strain on the specimen. This value was chosen to reduce the contribution of the concrete when subjecting the specimen to compression. A special setup was constructed using a 300 kip hydraulic jack and W-Shape beams. Figure 2.7 shows a schematic of the setup.
Figure 2.7: Tension setup schematic
The heads of the specimen were attached to the setup using eight 1! in. diameter William Rods (131 kips per rod). In the system, the jack pushed in between two plates to pull the rods and in turn the specimen in tension. The loading rate was done in 20 kip increments until the yielding of the specimen was reached. At this point, the increments were based on the strain, i.e., one and a half percent strain followed by two percent strain and so on until the four percent strain was reached. Crack development was measured and marked at the end of each load increment. One of the main concerns of this test was the compressive force acting on the concrete heads caused by the action-reaction of the headed rebar and the rods. For this reason, the heads were overly reinforced to resist splitting forces. A total of six Novotechnik displacement transducers were used to measure the displacement of the specimen. Two of them measured the strain of the specimen, while the other four monitored any slippage between the concrete heads and the specimen. The transducers were attached to the specimen using special frames (see Figure 2.8). A pressure cell was also used to monitor the force being applied by the jack.

8
Figure 2.8: Tension setup
2.4.2 Compression Setup/Procedure The compression test was done using a Universal Testing Machine (UTM). The specimens were fixed in place using a special grout to reduce eccentricity (see Figure 2.9). The load rate was approximately one kip per second until failure.
Figure 2.9: Compression setup.
Two Novotechnik displacement transducers were used to measure lateral deflection at the center of the specimen as seen above. In addition, two wire potentiometers were used to measure the

9
axial displacement. The wire potentiometers were attached to the UTM instead of the specimen to prevent spalling concrete interference in the readings. A built-in load cell in the UTM measured the load.
3 TEST RESULTS
3.1 TENSION TEST The tension test was successfully completed. Figures 3.1-2 show NSBE1 after being pulled to four percent strain.
(a)
(b)
Figure 3.1: NSBE1 after tension test: (a) Plan view; (b) Side view
3.2 COMPRESSION TEST The figures below show the two specimens after the compression test was completed. Figures 3.2-3 show NSBE1 and NSBE2, respectively.

10
Figure 3.2: NSBE1 after compression
Figure 3.3: NSBE2 after compression

11
4 DISCUSSION/ANALYSIS OF TEST RESULTS 4.1 TENSION TEST During the test, cracks began to develop along the same spacing as the transverse reinforcement. When four percent strain was reached, more cracks began to appear in between the eight-inch spacing of the transverse reinforcement. The largest cracks measured on the specimen after four percent strain was approximately 0.21 inches. These cracks occurred at 1/3 from the top and bottom of the specimen. 4.2 COMPRESSION TEST The compression test provided interesting results regarding the behavior of NSBE. Figure 4.1 shows the graphical representation of NSB1 after tension and compression. The graph shows the strain relaxing after the tension force was removed.
Figure 4.1: NSBE1 graph after tension and compression

12
Pre-tensioning the specimen drastically reduced its compressive strength. The compressive strength of NSBE2 was outstanding in comparison to NSBE1. The maximum load that the two specimens were subjected to, were 115 kips for NSBE1 and 572 kips for NSBE2. It can clearly be seen that NSBE2 is five times stronger than NSBE1. Figure 4.2 provides a better representation of this strength difference.
Figure 4.2: NSBE1 vs. NSBE2
The non-ductile behavior shown by NSBE2 (see Figure 4.3) resembles the failure seen in the buildings in Chile, i.e., localized buckling and spalling. Comparing the two images further, it can be seen that the spalling slants downward from the top of the wall.

13
(a) (b)
Figure 4.3: Comparison: (a) Chilean shear wall; (b) NSBE2
From the results, the low performance exhibited by NSBE1 is quite alarming. Comparing the experimental value of 115 kips to the conservative value of approximately 270 kips (provided by Eq.3 from ACI Code 10.3.6.2) it can be seen that the ACI Code reduction factors do not account for pre-tensioning conditions.
C = 0.8(0.65)[0.85fc’(Ag – Ast) + Astfy] (Eq.3)

14
5 CONCLUSION An exploratory research was conducted to study the behavior of NSBE under axial force reversals. Due to time constraints, no rigorous analytical calculations were presented on this paper. Nevertheless, the analysis performed was sufficient enough to provide confident conclusions. This research revealed that shear walls with NSBE are extremely vulnerable to axial force reversals and have non-ductile behavior. Based on the results obtained, it can be said that most of the buildings in Chile failed locally due to compression, while others collapsed due to force reversals. More importantly, revisions need to be made on ACI Code 318-08 allowing the use of NSBE in buildings in the United States. Based on the calculations, the reduction factors used by the ACI Code 318-08 do not take into account pre-tensioning conditions. Future work will focus on rigorous analysis using finite element models.
15
6 REFERENCES 1. ACI Committee 318, Building Code Requirements for Structural Concrete (ACI 318-08) and
Commentary (ACI 318R-08), American Concrete Institute, Farmington Hills, MI, pp. 349-356.
2. Chai, Y.H., and Elayer, D.T. (1999). “Lateral Stability of Reinforced Concrete Columns
under Axial Reversed Cyclic Tension and Compression,” ACI Structural Journal, American Concrete Institute, V. 96, No. 5, pp. 780-789.
3. EERI Special Earthquake Report (2010). The Mw 8.8 Chile Earthquake of February 27,
2010, Earthquake Engineering Research Institute. Retrieved from http://www.eeri.org/site/images/eeri_newsletter/2010_pdf/Chile10_insert.pdf
4. Heo, Y., Zhang, G., and Kunnath, S. (2009). “Modeling Cyclic Behavior of Reinforcing
Steel: Relevance in Seismic Response Analysis of Reinforced Concrete Structures,” Key Engineering Materials, Vols. 400-402, pp. 301-309.
5. Moehle, J.P. (2010, June 2) Detailed Recommendations from 2 June 2010 Meeting. The 27
February 2010 Chile Earthquake: Implications for U.S. Building Codes and Standards. National Institute of Standards and Technology. Retrieved form http://www.nehrp.gov/library/ChileMeeting.htm
6. Wallace, J.W., and Moehle, J.P. (1992). “Ductility and Detailing Requirements of Bearing Wall Buildings,” Journal of Structural Engineering, American Society of Civil Engineers, V. 118, No. 6, pp. 1625-1643.
7. Wallace, J.W., and Hooper, J. (2010). Chile Earthquake – 2/27/2010. Implications for U.S.
Building Codes and Standards [Pdf]. Retrieved from http://www.nehrp.gov/chile/ChileEQMtg-WallacePresentation.pdf

16
7 ACKNOWLEDGEMENT This research was supported by the Pacific Earthquake Engineering Research (PEER) Center as a part of the 2010 PEER Internship Program. Funding was provided by NSF Network for Earthquake Engineering Simulation (NEES) Grand Challenge Project; grant numbers REU – EEC – 1005054 and Grand Challenge – CMMI – 0618804. The author would like to thank Professor Jack Moehle, PhD Candidate Wael Hassan, and Ahmet Can Tanyeri for their mentorship, Erico for its generous donation of steel bars, and Ariel Creagh and the staff in Davis Hall and Richmond Field Station at the University of California, Berkeley for their support.