cs8 - changing the topic, overall, how would you rate the
TRANSCRIPT

December 30, 2020 1
Total----------
Male----------
Female----------
18-34----------
35-54----------
55+----------
City ofVancouv
er----------
Rest ofMetro
Van----------
TOTALMetro
Van----------
Vancouver
Island----------
Rest ofBC
----------
<$75k----------
$75k+----------
(Z) (A) (B) (C) (D) (E) (F) (G) (H) (I) (J) (K) (L)
823 395 424 225 281 318 127 367 494 132 197 321 389100% 100% 100% 100% 100% 100% 100% 100% 100% 100% 100% 100% 100%
Unweighted Total 823 312 504 234 251 338 281 242 523 138 162 351 351125 80 43 30 32 63 20 44 65 31 29 45 6515% 20% 10% 13% 11% 20% 16% 12% 13% 23% 15% 14% 17%
B D GH420 210 209 105 141 173 60 195 255 64 101 148 20851% 53% 49% 47% 50% 54% 48% 53% 52% 48% 51% 46% 54%220 81 138 66 86 69 37 102 139 29 52 98 9727% 21% 33% 29% 31% 22% 29% 28% 28% 22% 27% 31% 25%
A E58 24 34 23 21 13 9 26 35 8 14 29 187% 6% 8% 10% 8% 4% 7% 7% 7% 6% 7% 9% 5%
E L545 290 252 136 173 236 81 239 320 95 130 194 27366% 73% 59% 60% 62% 74% 64% 65% 65% 71% 66% 60% 70%
B CD K278 105 172 89 107 82 46 128 174 38 66 127 11534% 27% 41% 40% 38% 26% 36% 35% 35% 29% 34% 40% 30%
A E E LNo Answer - - - - - - - - - - - - -
NET: Excellent/good
NET: Fair/poor
Comparison Groups: AB/CDE/FGHIJ/KLT-Test for Means, Z-Test for PercentagesUppercase letters indicate significance at the 95% level.
BASE: All respondents
Excellent
Good
Fair
Poor
CS8 - Changing the topic, overall, how would you rate the job that you feel you are doing in dealing with the COVID-19 situation on an emotional/personal level?
Gender (S1) Age Group (S2) Region (S3) HH Income (Z4)

December 30, 2020 2
Total----------
Male----------
Female----------
18-34----------
35-54----------
55+----------
City ofVancouv
er----------
Rest ofMetro
Van----------
TOTALMetro
Van----------
Vancouver
Island----------
Rest ofBC
----------
<$75k----------
$75k+----------
(Z) (A) (B) (C) (D) (E) (F) (G) (H) (I) (J) (K) (L)
823 395 424 225 281 318 127 367 494 132 197 321 389100% 100% 100% 100% 100% 100% 100% 100% 100% 100% 100% 100% 100%
Unweighted Total 823 312 504 234 251 338 281 242 523 138 162 351 351529 240 286 159 205 166 96 267 363 68 98 197 25964% 61% 68% 71% 73% 52% 76% 73% 73% 52% 50% 61% 67%
E E IJ IJ IJ593 266 324 172 218 203 104 276 381 84 128 221 30172% 67% 76% 77% 78% 64% 82% 75% 77% 64% 65% 69% 78%
A E E IJ IJ IJ K362 213 148 102 128 132 60 187 247 33 81 115 19544% 54% 35% 45% 46% 42% 47% 51% 50% 25% 41% 36% 50%
B I I I I K276 143 133 31 129 117 29 125 155 43 79 97 13934% 36% 31% 14% 46% 37% 23% 34% 31% 32% 40% 30% 36%
C C FH F F607 270 336 165 202 241 96 262 358 94 155 233 28674% 68% 79% 73% 72% 76% 76% 71% 72% 71% 79% 73% 73%
A731 345 382 201 249 281 118 321 439 118 174 276 35089% 87% 90% 89% 89% 88% 93% 87% 89% 89% 88% 86% 90%443 226 216 144 149 150 87 198 285 71 87 166 22354% 57% 51% 64% 53% 47% 69% 54% 58% 54% 44% 52% 57%
DE GHIJ GJ738 349 385 194 253 292 121 316 436 117 185 278 36390% 88% 91% 86% 90% 92% 95% 86% 88% 88% 94% 87% 93%
GH G GH K792 372 416 222 265 305 124 353 477 126 188 302 38196% 94% 98% 99% 94% 96% 98% 96% 97% 95% 96% 94% 98%
A DE K615 274 338 174 207 234 102 276 377 94 144 218 31475% 69% 80% 78% 74% 74% 80% 75% 76% 71% 73% 68% 81%
A K449 191 256 143 147 159 81 203 284 62 103 162 22055% 48% 60% 64% 53% 50% 64% 55% 57% 47% 53% 50% 57%
A DE I714 331 380 198 249 267 116 314 430 114 170 257 35687% 84% 90% 88% 89% 84% 91% 86% 87% 86% 86% 80% 92%
A K643 293 348 202 224 217 122 304 427 87 130 209 34278% 74% 82% 90% 80% 68% 96% 83% 86% 65% 66% 65% 88%
A DE E GHIJ IJ GIJ K454 187 263 145 168 141 92 213 305 62 87 162 23055% 47% 62% 64% 60% 44% 73% 58% 62% 47% 44% 51% 59%
A E E GHIJ J GIJ352 185 165 130 131 92 80 173 253 41 59 114 18743% 47% 39% 58% 47% 29% 63% 47% 51% 31% 30% 35% 48%
DE E GHIJ IJ GIJ K451 196 252 114 166 171 71 202 274 68 110 177 21855% 50% 59% 51% 59% 54% 56% 55% 55% 51% 56% 55% 56%
A277 128 149 66 99 112 38 119 156 39 82 108 12234% 33% 35% 29% 35% 35% 30% 32% 32% 29% 42% 34% 31%
F265 128 137 105 104 56 65 129 194 32 39 93 13132% 32% 32% 47% 37% 18% 51% 35% 39% 24% 20% 29% 34%
E E GHIJ IJ GIJNo Answer - - - - - - - - - - - - -
T-Test for Means, Z-Test for PercentagesUppercase letters indicate significance at the 95% level.
Playing sports
Volunteering
Visiting family/friends in long term care/hospitals
Going to the office/work
Comparison Groups: AB/CDE/FGHIJ/KL
Having dinner parties
Having house parties
Travelling in Canada
Travelling outside of Canada
Going to the gym/spin/yoga/fitness etc. classes
Shopping
Eating in restaurants
Going to bars/pubs/nightclubs
Visiting/seeing family
Visiting/seeing friends
BASE: All respondents
Going to movies
Going to concerts, theatre or other performances
Watching professional sporting events
Watching childrens’ events (sports, dance etc.)
P1 Summary - Social distancing and other regulations due to COVID-19 mean that British Columbians have had to give up doing a lot of different things. How much, if at all, do you miss each of the following as a result of the pandemic? - NET Total Miss Summary Table
Gender (S1) Age Group (S2) Region (S3) HH Income (Z4)

December 30, 2020 3
Total----------
Male----------
Female----------
18-34----------
35-54----------
55+----------
City ofVancouv
er----------
Rest ofMetro
Van----------
TOTALMetro
Van----------
Vancouver
Island----------
Rest ofBC
----------
<$75k----------
$75k+----------
(Z) (A) (B) (C) (D) (E) (F) (G) (H) (I) (J) (K) (L)
823 395 424 225 281 318 127 367 494 132 197 321 389100% 100% 100% 100% 100% 100% 100% 100% 100% 100% 100% 100% 100%
Unweighted Total 823 312 504 234 251 338 281 242 523 138 162 351 351152 73 79 44 70 38 33 71 104 18 30 67 6819% 18% 19% 20% 25% 12% 26% 19% 21% 14% 15% 21% 18%
E IJ377 167 207 115 134 128 63 195 258 50 68 130 19146% 42% 49% 51% 48% 40% 50% 53% 52% 38% 35% 41% 49%
E J IJ IJ294 155 137 66 76 152 31 100 131 64 98 124 13036% 39% 32% 29% 27% 48% 24% 27% 27% 48% 50% 39% 33%
CD FGH FGH529 240 286 159 205 166 96 267 363 68 98 197 25964% 61% 68% 71% 73% 52% 76% 73% 73% 52% 50% 61% 67%
E E IJ IJ IJNo Answer - - - - - - - - - - - - -Comparison Groups: AB/CDE/FGHIJ/KLT-Test for Means, Z-Test for PercentagesUppercase letters indicate significance at the 95% level.
BASE: All respondents
Miss a lot
Miss a little
Do not miss / not applicable
NET: Total miss
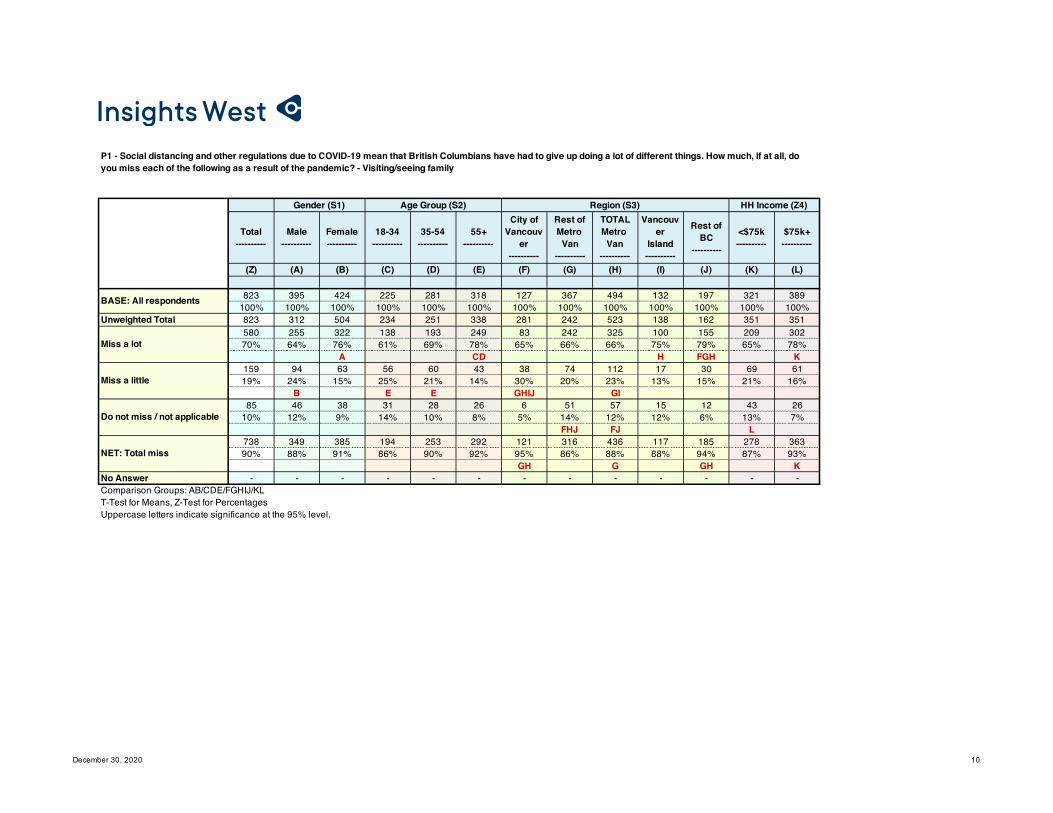
P1 - Social distancing and other regulations due to COVID-19 mean that British Columbians have had to give up doing a lot of different things. How much, if at all, do you miss each of the following as a result of the pandemic? - Going to movies
Gender (S1) Age Group (S2) Region (S3) HH Income (Z4)

December 30, 2020 4
Total----------
Male----------
Female----------
18-34----------
35-54----------
55+----------
City ofVancouv
er----------
Rest ofMetro
Van----------
TOTALMetro
Van----------
Vancouver
Island----------
Rest ofBC
----------
<$75k----------
$75k+----------
(Z) (A) (B) (C) (D) (E) (F) (G) (H) (I) (J) (K) (L)
823 395 424 225 281 318 127 367 494 132 197 321 389100% 100% 100% 100% 100% 100% 100% 100% 100% 100% 100% 100% 100%
Unweighted Total 823 312 504 234 251 338 281 242 523 138 162 351 351295 126 167 100 100 95 56 142 198 40 56 116 14236% 32% 39% 45% 36% 30% 44% 39% 40% 31% 28% 36% 36%
E IJ J298 140 157 72 119 108 48 134 182 44 72 105 16036% 35% 37% 32% 42% 34% 38% 37% 37% 33% 37% 33% 41%
C230 129 100 53 62 115 23 91 113 48 68 100 8728% 33% 24% 23% 22% 36% 18% 25% 23% 36% 35% 31% 22%
B CD FGH FGH L593 266 324 172 218 203 104 276 381 84 128 221 30172% 67% 76% 77% 78% 64% 82% 75% 77% 64% 65% 69% 78%
A E E IJ IJ IJ KNo Answer - - - - - - - - - - - - -Comparison Groups: AB/CDE/FGHIJ/KLT-Test for Means, Z-Test for PercentagesUppercase letters indicate significance at the 95% level.
BASE: All respondents
Miss a lot
Miss a little
Do not miss / not applicable
NET: Total miss
P1 - Social distancing and other regulations due to COVID-19 mean that British Columbians have had to give up doing a lot of different things. How much, if at all, do you miss each of the following as a result of the pandemic? - Going to concerts, theatre or other performances
Gender (S1) Age Group (S2) Region (S3) HH Income (Z4)

December 30, 2020 5
Total----------
Male----------
Female----------
18-34----------
35-54----------
55+----------
City ofVancouv
er----------
Rest ofMetro
Van----------
TOTALMetro
Van----------
Vancouver
Island----------
Rest ofBC
----------
<$75k----------
$75k+----------
(Z) (A) (B) (C) (D) (E) (F) (G) (H) (I) (J) (K) (L)
823 395 424 225 281 318 127 367 494 132 197 321 389100% 100% 100% 100% 100% 100% 100% 100% 100% 100% 100% 100% 100%
Unweighted Total 823 312 504 234 251 338 281 242 523 138 162 351 351158 101 57 45 55 58 23 81 104 15 39 44 9119% 25% 14% 20% 19% 18% 18% 22% 21% 11% 20% 14% 23%
B I I I K204 113 90 56 73 74 37 106 143 18 43 70 10525% 29% 21% 25% 26% 23% 29% 29% 29% 14% 22% 22% 27%
I I I461 182 276 123 153 185 67 180 247 99 115 206 19356% 46% 65% 55% 54% 58% 53% 49% 50% 75% 59% 64% 50%
A FGHJ L362 213 148 102 128 132 60 187 247 33 81 115 19544% 54% 35% 45% 46% 42% 47% 51% 50% 25% 41% 36% 50%
B I I I I KNo Answer - - - - - - - - - - - - -Comparison Groups: AB/CDE/FGHIJ/KLT-Test for Means, Z-Test for PercentagesUppercase letters indicate significance at the 95% level.
BASE: All respondents
Miss a lot
Miss a little
Do not miss / not applicable
NET: Total miss
P1 - Social distancing and other regulations due to COVID-19 mean that British Columbians have had to give up doing a lot of different things. How much, if at all, do you miss each of the following as a result of the pandemic? - Watching professional sporting events
Gender (S1) Age Group (S2) Region (S3) HH Income (Z4)

December 30, 2020 6
Total----------
Male----------
Female----------
18-34----------
35-54----------
55+----------
City ofVancouv
er----------
Rest ofMetro
Van----------
TOTALMetro
Van----------
Vancouver
Island----------
Rest ofBC
----------
<$75k----------
$75k+----------
(Z) (A) (B) (C) (D) (E) (F) (G) (H) (I) (J) (K) (L)
823 395 424 225 281 318 127 367 494 132 197 321 389100% 100% 100% 100% 100% 100% 100% 100% 100% 100% 100% 100% 100%
Unweighted Total 823 312 504 234 251 338 281 242 523 138 162 351 351131 57 74 9 71 50 10 66 75 18 37 48 6616% 14% 18% 4% 25% 16% 8% 18% 15% 14% 19% 15% 17%
CE C FH F F145 87 58 22 57 66 20 60 79 25 41 49 7318% 22% 14% 10% 20% 21% 15% 16% 16% 19% 21% 15% 19%
B C C547 252 291 194 152 201 97 242 339 90 118 224 25066% 64% 69% 86% 54% 63% 77% 66% 69% 68% 60% 70% 64%
DE GHJ G276 143 133 31 129 117 29 125 155 43 79 97 13934% 36% 31% 14% 46% 37% 23% 34% 31% 32% 40% 30% 36%
C C FH F FNo Answer - - - - - - - - - - - - -Comparison Groups: AB/CDE/FGHIJ/KLT-Test for Means, Z-Test for PercentagesUppercase letters indicate significance at the 95% level.
BASE: All respondents
Miss a lot
Miss a little
Do not miss / not applicable
NET: Total miss
P1 - Social distancing and other regulations due to COVID-19 mean that British Columbians have had to give up doing a lot of different things. How much, if at all, do you miss each of the following as a result of the pandemic? - Watching childrens’ events (sports, dance etc.)
Gender (S1) Age Group (S2) Region (S3) HH Income (Z4)

December 30, 2020 7
Total----------
Male----------
Female----------
18-34----------
35-54----------
55+----------
City ofVancouv
er----------
Rest ofMetro
Van----------
TOTALMetro
Van----------
Vancouver
Island----------
Rest ofBC
----------
<$75k----------
$75k+----------
(Z) (A) (B) (C) (D) (E) (F) (G) (H) (I) (J) (K) (L)
823 395 424 225 281 318 127 367 494 132 197 321 389100% 100% 100% 100% 100% 100% 100% 100% 100% 100% 100% 100% 100%
Unweighted Total 823 312 504 234 251 338 281 242 523 138 162 351 351154 53 100 45 63 46 28 70 98 19 36 61 6619% 13% 24% 20% 22% 14% 22% 19% 20% 15% 19% 19% 17%
A E454 217 236 120 139 195 68 191 260 75 119 171 21955% 55% 56% 53% 49% 61% 54% 52% 53% 57% 60% 53% 56%
D216 125 88 60 79 77 31 105 136 38 42 88 10326% 32% 21% 27% 28% 24% 24% 29% 28% 29% 21% 27% 27%
B607 270 336 165 202 241 96 262 358 94 155 233 28674% 68% 79% 73% 72% 76% 76% 71% 72% 71% 79% 73% 73%
ANo Answer - - - - - - - - - - - - -Comparison Groups: AB/CDE/FGHIJ/KLT-Test for Means, Z-Test for PercentagesUppercase letters indicate significance at the 95% level.
BASE: All respondents
Miss a lot
Miss a little
Do not miss / not applicable
NET: Total miss
P1 - Social distancing and other regulations due to COVID-19 mean that British Columbians have had to give up doing a lot of different things. How much, if at all, do you miss each of the following as a result of the pandemic? - Shopping
Gender (S1) Age Group (S2) Region (S3) HH Income (Z4)

December 30, 2020 8
Total----------
Male----------
Female----------
18-34----------
35-54----------
55+----------
City ofVancouv
er----------
Rest ofMetro
Van----------
TOTALMetro
Van----------
Vancouver
Island----------
Rest ofBC
----------
<$75k----------
$75k+----------
(Z) (A) (B) (C) (D) (E) (F) (G) (H) (I) (J) (K) (L)
823 395 424 225 281 318 127 367 494 132 197 321 389100% 100% 100% 100% 100% 100% 100% 100% 100% 100% 100% 100% 100%
Unweighted Total 823 312 504 234 251 338 281 242 523 138 162 351 351368 165 201 112 131 124 68 185 253 46 69 131 18245% 42% 47% 50% 47% 39% 53% 50% 51% 35% 35% 41% 47%
E IJ IJ IJ363 179 181 89 118 156 50 136 186 72 105 145 16844% 45% 43% 40% 42% 49% 39% 37% 38% 54% 53% 45% 43%
FGH FGH92 51 42 24 32 37 9 46 55 14 23 45 39
11% 13% 10% 11% 11% 12% 7% 13% 11% 11% 12% 14% 10%731 345 382 201 249 281 118 321 439 118 174 276 35089% 87% 90% 89% 89% 88% 93% 87% 89% 89% 88% 86% 90%
No Answer - - - - - - - - - - - - -Comparison Groups: AB/CDE/FGHIJ/KLT-Test for Means, Z-Test for PercentagesUppercase letters indicate significance at the 95% level.
BASE: All respondents
Miss a lot
Miss a little
Do not miss / not applicable
NET: Total miss
P1 - Social distancing and other regulations due to COVID-19 mean that British Columbians have had to give up doing a lot of different things. How much, if at all, do you miss each of the following as a result of the pandemic? - Eating in restaurants
Gender (S1) Age Group (S2) Region (S3) HH Income (Z4)

December 30, 2020 9
Total----------
Male----------
Female----------
18-34----------
35-54----------
55+----------
City ofVancouv
er----------
Rest ofMetro
Van----------
TOTALMetro
Van----------
Vancouver
Island----------
Rest ofBC
----------
<$75k----------
$75k+----------
(Z) (A) (B) (C) (D) (E) (F) (G) (H) (I) (J) (K) (L)
823 395 424 225 281 318 127 367 494 132 197 321 389100% 100% 100% 100% 100% 100% 100% 100% 100% 100% 100% 100% 100%
Unweighted Total 823 312 504 234 251 338 281 242 523 138 162 351 351174 93 79 78 63 32 42 89 131 18 25 71 9021% 24% 19% 35% 23% 10% 33% 24% 27% 13% 13% 22% 23%
DE E IJ IJ IJ269 132 137 65 86 118 45 108 153 54 62 95 13333% 34% 32% 29% 31% 37% 35% 30% 31% 41% 32% 30% 34%
G380 170 207 81 131 167 40 169 209 61 109 155 16546% 43% 49% 36% 47% 53% 31% 46% 42% 46% 56% 48% 43%
C C FH F F FH443 226 216 144 149 150 87 198 285 71 87 166 22354% 57% 51% 64% 53% 47% 69% 54% 58% 54% 44% 52% 57%
DE GHIJ GJNo Answer - - - - - - - - - - - - -Comparison Groups: AB/CDE/FGHIJ/KLT-Test for Means, Z-Test for PercentagesUppercase letters indicate significance at the 95% level.
BASE: All respondents
Miss a lot
Miss a little
Do not miss / not applicable
NET: Total miss
P1 - Social distancing and other regulations due to COVID-19 mean that British Columbians have had to give up doing a lot of different things. How much, if at all, do you miss each of the following as a result of the pandemic? - Going to bars/pubs/nightclubs
Gender (S1) Age Group (S2) Region (S3) HH Income (Z4)
December 30, 2020 10
Total----------
Male----------
Female----------
18-34----------
35-54----------
55+----------
City ofVancouv
er----------
Rest ofMetro
Van----------
TOTALMetro
Van----------
Vancouver
Island----------
Rest ofBC
----------
<$75k----------
$75k+----------
(Z) (A) (B) (C) (D) (E) (F) (G) (H) (I) (J) (K) (L)
823 395 424 225 281 318 127 367 494 132 197 321 389100% 100% 100% 100% 100% 100% 100% 100% 100% 100% 100% 100% 100%
Unweighted Total 823 312 504 234 251 338 281 242 523 138 162 351 351580 255 322 138 193 249 83 242 325 100 155 209 30270% 64% 76% 61% 69% 78% 65% 66% 66% 75% 79% 65% 78%
A CD H FGH K159 94 63 56 60 43 38 74 112 17 30 69 6119% 24% 15% 25% 21% 14% 30% 20% 23% 13% 15% 21% 16%
B E E GHIJ GI85 46 38 31 28 26 6 51 57 15 12 43 26
10% 12% 9% 14% 10% 8% 5% 14% 12% 12% 6% 13% 7%FHJ FJ L
738 349 385 194 253 292 121 316 436 117 185 278 36390% 88% 91% 86% 90% 92% 95% 86% 88% 88% 94% 87% 93%
GH G GH KNo Answer - - - - - - - - - - - - -Comparison Groups: AB/CDE/FGHIJ/KLT-Test for Means, Z-Test for PercentagesUppercase letters indicate significance at the 95% level.
BASE: All respondents
Miss a lot
Miss a little
Do not miss / not applicable
NET: Total miss
P1 - Social distancing and other regulations due to COVID-19 mean that British Columbians have had to give up doing a lot of different things. How much, if at all, do you miss each of the following as a result of the pandemic? - Visiting/seeing family
Gender (S1) Age Group (S2) Region (S3) HH Income (Z4)

December 30, 2020 11
Total----------
Male----------
Female----------
18-34----------
35-54----------
55+----------
City ofVancouv
er----------
Rest ofMetro
Van----------
TOTALMetro
Van----------
Vancouver
Island----------
Rest ofBC
----------
<$75k----------
$75k+----------
(Z) (A) (B) (C) (D) (E) (F) (G) (H) (I) (J) (K) (L)
823 395 424 225 281 318 127 367 494 132 197 321 389100% 100% 100% 100% 100% 100% 100% 100% 100% 100% 100% 100% 100%
Unweighted Total 823 312 504 234 251 338 281 242 523 138 162 351 351651 293 354 191 210 249 101 297 398 98 155 237 32779% 74% 84% 85% 75% 78% 79% 81% 80% 74% 79% 74% 84%
A D K141 78 62 31 54 56 23 56 80 28 33 65 5417% 20% 15% 14% 19% 18% 18% 15% 16% 21% 17% 20% 14%31 24 7 2 16 13 3 14 17 6 8 19 84% 6% 2% 1% 6% 4% 2% 4% 3% 5% 4% 6% 2%
B C C L792 372 416 222 265 305 124 353 477 126 188 302 38196% 94% 98% 99% 94% 96% 98% 96% 97% 95% 96% 94% 98%
A DE KNo Answer - - - - - - - - - - - - -Comparison Groups: AB/CDE/FGHIJ/KLT-Test for Means, Z-Test for PercentagesUppercase letters indicate significance at the 95% level.
BASE: All respondents
Miss a lot
Miss a little
Do not miss / not applicable
NET: Total miss
P1 - Social distancing and other regulations due to COVID-19 mean that British Columbians have had to give up doing a lot of different things. How much, if at all, do you miss each of the following as a result of the pandemic? - Visiting/seeing friends
Gender (S1) Age Group (S2) Region (S3) HH Income (Z4)

December 30, 2020 12
Total----------
Male----------
Female----------
18-34----------
35-54----------
55+----------
City ofVancouv
er----------
Rest ofMetro
Van----------
TOTALMetro
Van----------
Vancouver
Island----------
Rest ofBC
----------
<$75k----------
$75k+----------
(Z) (A) (B) (C) (D) (E) (F) (G) (H) (I) (J) (K) (L)
823 395 424 225 281 318 127 367 494 132 197 321 389100% 100% 100% 100% 100% 100% 100% 100% 100% 100% 100% 100% 100%
Unweighted Total 823 312 504 234 251 338 281 242 523 138 162 351 351359 145 212 111 120 127 71 154 225 45 89 119 19144% 37% 50% 49% 43% 40% 56% 42% 46% 34% 45% 37% 49%
A GHI GI K256 129 126 63 87 106 30 122 152 49 55 99 12331% 33% 30% 28% 31% 33% 24% 33% 31% 37% 28% 31% 32%
F208 121 86 50 74 84 25 91 117 39 53 103 7425% 31% 20% 22% 26% 26% 20% 25% 24% 29% 27% 32% 19%
B L615 274 338 174 207 234 102 276 377 94 144 218 31475% 69% 80% 78% 74% 74% 80% 75% 76% 71% 73% 68% 81%
A KNo Answer - - - - - - - - - - - - -Comparison Groups: AB/CDE/FGHIJ/KLT-Test for Means, Z-Test for PercentagesUppercase letters indicate significance at the 95% level.
BASE: All respondents
Miss a lot
Miss a little
Do not miss / not applicable
NET: Total miss
P1 - Social distancing and other regulations due to COVID-19 mean that British Columbians have had to give up doing a lot of different things. How much, if at all, do you miss each of the following as a result of the pandemic? - Having dinner parties
Gender (S1) Age Group (S2) Region (S3) HH Income (Z4)

December 30, 2020 13
Total----------
Male----------
Female----------
18-34----------
35-54----------
55+----------
City ofVancouv
er----------
Rest ofMetro
Van----------
TOTALMetro
Van----------
Vancouver
Island----------
Rest ofBC
----------
<$75k----------
$75k+----------
(Z) (A) (B) (C) (D) (E) (F) (G) (H) (I) (J) (K) (L)
823 395 424 225 281 318 127 367 494 132 197 321 389100% 100% 100% 100% 100% 100% 100% 100% 100% 100% 100% 100% 100%
Unweighted Total 823 312 504 234 251 338 281 242 523 138 162 351 351225 102 121 89 67 69 46 111 156 20 49 82 11027% 26% 29% 40% 24% 22% 36% 30% 32% 15% 25% 26% 28%
DE IJ I I224 89 135 53 81 90 35 92 127 42 55 80 11027% 23% 32% 24% 29% 28% 28% 25% 26% 31% 28% 25% 28%
A374 204 168 82 133 159 46 164 210 71 93 159 16845% 52% 40% 36% 47% 50% 36% 45% 43% 53% 47% 50% 43%
B C C F449 191 256 143 147 159 81 203 284 62 103 162 22055% 48% 60% 64% 53% 50% 64% 55% 57% 47% 53% 50% 57%
A DE INo Answer - - - - - - - - - - - - -Comparison Groups: AB/CDE/FGHIJ/KLT-Test for Means, Z-Test for PercentagesUppercase letters indicate significance at the 95% level.
BASE: All respondents
Miss a lot
Miss a little
Do not miss / not applicable
NET: Total miss
P1 - Social distancing and other regulations due to COVID-19 mean that British Columbians have had to give up doing a lot of different things. How much, if at all, do you miss each of the following as a result of the pandemic? - Having house parties
Gender (S1) Age Group (S2) Region (S3) HH Income (Z4)

December 30, 2020 14
Total----------
Male----------
Female----------
18-34----------
35-54----------
55+----------
City ofVancouv
er----------
Rest ofMetro
Van----------
TOTALMetro
Van----------
Vancouver
Island----------
Rest ofBC
----------
<$75k----------
$75k+----------
(Z) (A) (B) (C) (D) (E) (F) (G) (H) (I) (J) (K) (L)
823 395 424 225 281 318 127 367 494 132 197 321 389100% 100% 100% 100% 100% 100% 100% 100% 100% 100% 100% 100% 100%
Unweighted Total 823 312 504 234 251 338 281 242 523 138 162 351 351410 179 228 118 149 143 61 192 253 66 91 138 21250% 45% 54% 52% 53% 45% 48% 52% 51% 50% 46% 43% 55%
K304 152 152 80 100 124 54 122 177 48 79 120 14437% 38% 36% 36% 36% 39% 43% 33% 36% 36% 40% 37% 37%109 64 44 27 31 51 11 53 64 18 27 63 3313% 16% 10% 12% 11% 16% 9% 14% 13% 14% 14% 20% 8%
B L714 331 380 198 249 267 116 314 430 114 170 257 35687% 84% 90% 88% 89% 84% 91% 86% 87% 86% 86% 80% 92%
A KNo Answer - - - - - - - - - - - - -Comparison Groups: AB/CDE/FGHIJ/KLT-Test for Means, Z-Test for PercentagesUppercase letters indicate significance at the 95% level.
BASE: All respondents
Miss a lot
Miss a little
Do not miss / not applicable
NET: Total miss
P1 - Social distancing and other regulations due to COVID-19 mean that British Columbians have had to give up doing a lot of different things. How much, if at all, do you miss each of the following as a result of the pandemic? - Travelling in Canada
Gender (S1) Age Group (S2) Region (S3) HH Income (Z4)

December 30, 2020 15
Total----------
Male----------
Female----------
18-34----------
35-54----------
55+----------
City ofVancouv
er----------
Rest ofMetro
Van----------
TOTALMetro
Van----------
Vancouver
Island----------
Rest ofBC
----------
<$75k----------
$75k+----------
(Z) (A) (B) (C) (D) (E) (F) (G) (H) (I) (J) (K) (L)
823 395 424 225 281 318 127 367 494 132 197 321 389100% 100% 100% 100% 100% 100% 100% 100% 100% 100% 100% 100% 100%
Unweighted Total 823 312 504 234 251 338 281 242 523 138 162 351 351449 201 245 145 157 147 90 218 308 52 89 135 25555% 51% 58% 64% 56% 46% 71% 59% 62% 39% 46% 42% 66%
E GHIJ IJ GIJ K195 91 103 58 67 70 32 87 119 35 41 74 8724% 23% 24% 26% 24% 22% 26% 24% 24% 26% 21% 23% 22%180 103 76 23 57 100 5 63 67 46 66 111 4722% 26% 18% 10% 20% 32% 4% 17% 14% 35% 34% 35% 12%
B C CD FH F FGH FGH L643 293 348 202 224 217 122 304 427 87 130 209 34278% 74% 82% 90% 80% 68% 96% 83% 86% 65% 66% 65% 88%
A DE E GHIJ IJ GIJ KNo Answer - - - - - - - - - - - - -Comparison Groups: AB/CDE/FGHIJ/KLT-Test for Means, Z-Test for PercentagesUppercase letters indicate significance at the 95% level.
BASE: All respondents
Miss a lot
Miss a little
Do not miss / not applicable
NET: Total miss
P1 - Social distancing and other regulations due to COVID-19 mean that British Columbians have had to give up doing a lot of different things. How much, if at all, do you miss each of the following as a result of the pandemic? - Travelling outside of Canada
Gender (S1) Age Group (S2) Region (S3) HH Income (Z4)

December 30, 2020 16
Total----------
Male----------
Female----------
18-34----------
35-54----------
55+----------
City ofVancouv
er----------
Rest ofMetro
Van----------
TOTALMetro
Van----------
Vancouver
Island----------
Rest ofBC
----------
<$75k----------
$75k+----------
(Z) (A) (B) (C) (D) (E) (F) (G) (H) (I) (J) (K) (L)
823 395 424 225 281 318 127 367 494 132 197 321 389100% 100% 100% 100% 100% 100% 100% 100% 100% 100% 100% 100% 100%
Unweighted Total 823 312 504 234 251 338 281 242 523 138 162 351 351243 90 150 78 95 70 46 108 155 37 51 78 13530% 23% 35% 35% 34% 22% 37% 29% 31% 28% 26% 24% 35%
A E E K211 97 113 66 73 72 46 105 151 25 36 85 9526% 24% 27% 29% 26% 23% 36% 28% 30% 19% 18% 26% 24%
IJ J IJ369 208 161 80 112 176 35 154 189 70 110 158 15945% 53% 38% 36% 40% 56% 27% 42% 38% 53% 56% 49% 41%
B CD FH F FH FGH454 187 263 145 168 141 92 213 305 62 87 162 23055% 47% 62% 64% 60% 44% 73% 58% 62% 47% 44% 51% 59%
A E E GHIJ J GIJNo Answer - - - - - - - - - - - - -Comparison Groups: AB/CDE/FGHIJ/KLT-Test for Means, Z-Test for PercentagesUppercase letters indicate significance at the 95% level.
BASE: All respondents
Miss a lot
Miss a little
Do not miss / not applicable
NET: Total miss
P1 - Social distancing and other regulations due to COVID-19 mean that British Columbians have had to give up doing a lot of different things. How much, if at all, do you miss each of the following as a result of the pandemic? - Going to the gym/spin/yoga/fitness etc. classes
Gender (S1) Age Group (S2) Region (S3) HH Income (Z4)

December 30, 2020 17
Total----------
Male----------
Female----------
18-34----------
35-54----------
55+----------
City ofVancouv
er----------
Rest ofMetro
Van----------
TOTALMetro
Van----------
Vancouver
Island----------
Rest ofBC
----------
<$75k----------
$75k+----------
(Z) (A) (B) (C) (D) (E) (F) (G) (H) (I) (J) (K) (L)
823 395 424 225 281 318 127 367 494 132 197 321 389100% 100% 100% 100% 100% 100% 100% 100% 100% 100% 100% 100% 100%
Unweighted Total 823 312 504 234 251 338 281 242 523 138 162 351 351170 101 67 79 52 39 31 87 119 21 30 59 9021% 25% 16% 35% 18% 12% 25% 24% 24% 16% 15% 18% 23%
B DE J J IJ183 84 98 50 79 53 48 85 134 19 29 54 9722% 21% 23% 22% 28% 17% 38% 23% 27% 15% 15% 17% 25%
E GHIJ GIJ K471 210 258 95 149 226 47 194 241 92 137 207 20257% 53% 61% 42% 53% 71% 37% 53% 49% 69% 70% 65% 52%
C CD FH F FGH FGH L352 185 165 130 131 92 80 173 253 41 59 114 18743% 47% 39% 58% 47% 29% 63% 47% 51% 31% 30% 35% 48%
DE E GHIJ IJ GIJ KNo Answer - - - - - - - - - - - - -Comparison Groups: AB/CDE/FGHIJ/KLT-Test for Means, Z-Test for PercentagesUppercase letters indicate significance at the 95% level.
BASE: All respondents
Miss a lot
Miss a little
Do not miss / not applicable
NET: Total miss
P1 - Social distancing and other regulations due to COVID-19 mean that British Columbians have had to give up doing a lot of different things. How much, if at all, do you miss each of the following as a result of the pandemic? - Playing sports
Gender (S1) Age Group (S2) Region (S3) HH Income (Z4)

December 30, 2020 18
Total----------
Male----------
Female----------
18-34----------
35-54----------
55+----------
City ofVancouv
er----------
Rest ofMetro
Van----------
TOTALMetro
Van----------
Vancouver
Island----------
Rest ofBC
----------
<$75k----------
$75k+----------
(Z) (A) (B) (C) (D) (E) (F) (G) (H) (I) (J) (K) (L)
823 395 424 225 281 318 127 367 494 132 197 321 389100% 100% 100% 100% 100% 100% 100% 100% 100% 100% 100% 100% 100%
Unweighted Total 823 312 504 234 251 338 281 242 523 138 162 351 351146 55 89 38 47 61 20 67 87 19 40 70 5618% 14% 21% 17% 17% 19% 16% 18% 18% 14% 20% 22% 14%
A L306 141 163 76 120 110 51 136 187 49 70 107 16237% 36% 38% 34% 43% 35% 40% 37% 38% 37% 36% 33% 42%372 199 172 111 114 147 55 165 220 65 87 144 17045% 50% 41% 49% 41% 46% 44% 45% 45% 49% 44% 45% 44%
B451 196 252 114 166 171 71 202 274 68 110 177 21855% 50% 59% 51% 59% 54% 56% 55% 55% 51% 56% 55% 56%
ANo Answer - - - - - - - - - - - - -Comparison Groups: AB/CDE/FGHIJ/KLT-Test for Means, Z-Test for PercentagesUppercase letters indicate significance at the 95% level.
BASE: All respondents
Miss a lot
Miss a little
Do not miss / not applicable
NET: Total miss
P1 - Social distancing and other regulations due to COVID-19 mean that British Columbians have had to give up doing a lot of different things. How much, if at all, do you miss each of the following as a result of the pandemic? - Volunteering
Gender (S1) Age Group (S2) Region (S3) HH Income (Z4)

December 30, 2020 19
Total----------
Male----------
Female----------
18-34----------
35-54----------
55+----------
City ofVancouv
er----------
Rest ofMetro
Van----------
TOTALMetro
Van----------
Vancouver
Island----------
Rest ofBC
----------
<$75k----------
$75k+----------
(Z) (A) (B) (C) (D) (E) (F) (G) (H) (I) (J) (K) (L)
823 395 424 225 281 318 127 367 494 132 197 321 389100% 100% 100% 100% 100% 100% 100% 100% 100% 100% 100% 100% 100%
Unweighted Total 823 312 504 234 251 338 281 242 523 138 162 351 351152 65 87 25 60 68 17 58 75 24 54 63 6519% 16% 21% 11% 21% 21% 14% 16% 15% 18% 27% 20% 17%
C C FGH125 64 61 41 39 45 20 61 82 15 28 46 5715% 16% 14% 18% 14% 14% 16% 17% 17% 11% 14% 14% 15%546 267 275 159 182 205 89 248 338 94 115 212 26766% 67% 65% 71% 65% 65% 70% 68% 68% 71% 58% 66% 69%
J277 128 149 66 99 112 38 119 156 39 82 108 12234% 33% 35% 29% 35% 35% 30% 32% 32% 29% 42% 34% 31%
FNo Answer - - - - - - - - - - - - -Comparison Groups: AB/CDE/FGHIJ/KLT-Test for Means, Z-Test for PercentagesUppercase letters indicate significance at the 95% level.
BASE: All respondents
Miss a lot
Miss a little
Do not miss / not applicable
NET: Total miss
P1 - Social distancing and other regulations due to COVID-19 mean that British Columbians have had to give up doing a lot of different things. How much, if at all, do you miss each of the following as a result of the pandemic? - Visiting family/friends in long term care/hospitals
Gender (S1) Age Group (S2) Region (S3) HH Income (Z4)

December 30, 2020 20
Total----------
Male----------
Female----------
18-34----------
35-54----------
55+----------
City ofVancouv
er----------
Rest ofMetro
Van----------
TOTALMetro
Van----------
Vancouver
Island----------
Rest ofBC
----------
<$75k----------
$75k+----------
(Z) (A) (B) (C) (D) (E) (F) (G) (H) (I) (J) (K) (L)
823 395 424 225 281 318 127 367 494 132 197 321 389100% 100% 100% 100% 100% 100% 100% 100% 100% 100% 100% 100% 100%
Unweighted Total 823 312 504 234 251 338 281 242 523 138 162 351 351108 58 50 43 41 24 23 53 76 16 16 35 5613% 15% 12% 19% 15% 7% 18% 15% 15% 12% 8% 11% 14%
E E J J157 70 87 62 63 32 42 75 118 16 23 58 7519% 18% 21% 28% 22% 10% 33% 21% 24% 12% 12% 18% 19%
E E GHIJ IJ GIJ558 267 287 119 177 262 62 238 300 100 157 228 25868% 68% 68% 53% 63% 82% 49% 65% 61% 76% 80% 71% 66%
CD FH F FGH FGH265 128 137 105 104 56 65 129 194 32 39 93 13132% 32% 32% 47% 37% 18% 51% 35% 39% 24% 20% 29% 34%
E E GHIJ IJ GIJNo Answer - - - - - - - - - - - - -Comparison Groups: AB/CDE/FGHIJ/KLT-Test for Means, Z-Test for PercentagesUppercase letters indicate significance at the 95% level.
BASE: All respondents
Miss a lot
Miss a little
Do not miss / not applicable
NET: Total miss
P1 - Social distancing and other regulations due to COVID-19 mean that British Columbians have had to give up doing a lot of different things. How much, if at all, do you miss each of the following as a result of the pandemic? - Going to the office/work
Gender (S1) Age Group (S2) Region (S3) HH Income (Z4)

December 30, 2020 21
Total----------
Male----------
Female----------
18-34----------
35-54----------
55+----------
City ofVancouv
er----------
Rest ofMetro
Van----------
TOTALMetro
Van----------
Vancouver
Island----------
Rest ofBC
----------
<$75k----------
$75k+----------
(Z) (A) (B) (C) (D) (E) (F) (G) (H) (I) (J) (K) (L)
823 395 424 225 281 318 127 367 494 132 197 321 389100% 100% 100% 100% 100% 100% 100% 100% 100% 100% 100% 100% 100%
Unweighted Total 823 312 504 234 251 338 281 242 523 138 162 351 35179 48 31 22 40 17 18 43 61 7 11 42 28
10% 12% 7% 10% 14% 5% 14% 12% 12% 5% 6% 13% 7%E IJ IJ L
132 67 64 43 49 41 32 56 88 17 27 50 5916% 17% 15% 19% 17% 13% 25% 15% 18% 13% 14% 15% 15%
GHIJ G51 36 15 11 20 20 8 25 33 6 13 18 246% 9% 4% 5% 7% 6% 6% 7% 7% 4% 6% 6% 6%
B34 17 17 6 18 10 2 19 21 5 9 14 134% 4% 4% 3% 6% 3% 1% 5% 4% 4% 4% 4% 3%58 21 36 19 21 17 4 28 32 10 16 22 227% 5% 8% 9% 8% 5% 3% 8% 6% 7% 8% 7% 6%211 116 95 48 74 90 35 97 132 33 46 73 10126% 29% 22% 21% 26% 28% 28% 26% 27% 25% 23% 23% 26%67 40 27 38 14 16 13 37 51 10 7 30 248% 10% 6% 17% 5% 5% 10% 10% 10% 7% 4% 10% 6%
DE J J J442 195 246 91 149 203 51 180 231 83 128 164 22754% 49% 58% 40% 53% 64% 40% 49% 47% 63% 65% 51% 58%
A C CD FGH FGH496 199 294 153 153 191 73 228 301 73 122 195 23760% 50% 69% 68% 54% 60% 58% 62% 61% 55% 62% 61% 61%
A D107 47 61 30 33 45 13 51 64 15 29 48 4613% 12% 14% 13% 12% 14% 10% 14% 13% 11% 15% 15% 12%33 21 12 18 7 8 10 17 27 4 2 11 194% 5% 3% 8% 2% 3% 8% 5% 5% 3% 1% 3% 5%
DE IJ J J148 76 70 28 62 57 15 56 71 32 45 54 7118% 19% 17% 13% 22% 18% 12% 15% 14% 24% 23% 17% 18%
C FH F297 143 153 97 99 101 57 134 191 37 69 99 16636% 36% 36% 43% 35% 32% 45% 36% 39% 28% 35% 31% 43%
E I I K86 31 55 24 33 29 17 39 57 14 15 32 45
10% 8% 13% 11% 12% 9% 14% 11% 11% 11% 8% 10% 12%A
43 28 13 16 11 16 9 19 28 12 4 14 255% 7% 3% 7% 4% 5% 7% 5% 6% 9% 2% 4% 6%
B J J J34 20 13 3 9 22 4 12 17 9 9 27 64% 5% 3% 1% 3% 7% 3% 3% 3% 6% 5% 8% 1%
C L32 13 19 4 11 17 3 12 15 4 13 13 124% 3% 5% 2% 4% 5% 2% 3% 3% 3% 6% 4% 3%26 15 11 16 6 4 11 12 23 4 0 9 103% 4% 3% 7% 2% 1% 8% 3% 5% 3% 0% 3% 3%
E J J J38 20 18 5 15 17 3 13 16 6 15 21 105% 5% 4% 2% 5% 5% 3% 4% 3% 5% 8% 7% 3%
L28 19 9 2 11 15 3 14 17 8 3 13 103% 5% 2% 1% 4% 5% 2% 4% 3% 6% 2% 4% 3%
C CNo Answer - - - - - - - - - - - - -
Nothing
Comparison Groups: AB/CDE/FGHIJ/KLT-Test for Means, Z-Test for PercentagesUppercase letters indicate significance at the 95% level.
Playing sports
Volunteering
Visiting family/friends in long term care/hospitals
Going to the office/work
Other/something else not on this list
Having dinner parties
Having house parties
Travelling in Canada
Travelling outside of Canada
Going to the gym/spin/yoga/fitness etc. classes
Shopping
Eating in restaurants
Going to bars/pubs/nightclubs
Visiting/seeing family
Visiting/seeing friends
BASE: All respondents
Going to movies
Going to concerts, theatre or other performances
Watching professional sporting events
Watching childrens’ events (sports, dance etc.)
P2 Summary - And of these things, which is the number one thing you miss the most, which is the one you miss 2nd most and which do you miss 3rd most - #1/#2/#3 Summary
Gender (S1) Age Group (S2) Region (S3) HH Income (Z4)

December 30, 2020 22
Total----------
Male----------
Female----------
18-34----------
35-54----------
55+----------
City ofVancouv
er----------
Rest ofMetro
Van----------
TOTALMetro
Van----------
Vancouver
Island----------
Rest ofBC
----------
<$75k----------
$75k+----------
(Z) (A) (B) (C) (D) (E) (F) (G) (H) (I) (J) (K) (L)
823 395 424 225 281 318 127 367 494 132 197 321 389100% 100% 100% 100% 100% 100% 100% 100% 100% 100% 100% 100% 100%
Unweighted Total 823 312 504 234 251 338 281 242 523 138 162 351 35121 12 9 4 13 4 6 12 18 2 1 11 83% 3% 2% 2% 4% 1% 5% 3% 4% 2% 1% 3% 2%
J J32 15 17 16 8 8 8 16 23 4 5 13 144% 4% 4% 7% 3% 3% 6% 4% 5% 3% 2% 4% 4%14 9 5 3 4 7 0 6 6 4 4 7 52% 2% 1% 1% 1% 2% 0% 2% 1% 3% 2% 2% 1%
F7 1 6 4 3 1 0 3 3 1 3 2 5
1% 0% 2% 2% 1% 0% 0% 1% 1% 1% 2% 1% 1%11 5 6 2 7 2 1 5 6 2 3 6 11% 1% 1% 1% 2% 1% 1% 1% 1% 2% 1% 2% 0%37 28 9 8 16 14 9 19 28 2 7 11 205% 7% 2% 4% 6% 4% 7% 5% 6% 2% 4% 3% 5%
B I I I17 16 1 13 0 4 1 11 12 2 3 4 102% 4% 0% 6% 0% 1% 1% 3% 2% 2% 2% 1% 2%
B DE312 132 180 46 100 165 32 113 145 62 105 114 15838% 33% 42% 20% 36% 52% 25% 31% 29% 47% 53% 36% 41%
A C CD FGH FGH162 67 92 73 52 38 34 90 124 23 16 62 7120% 17% 22% 32% 18% 12% 27% 24% 25% 17% 8% 19% 18%
DE J J J J16 5 10 8 3 5 4 6 11 3 2 6 92% 1% 2% 4% 1% 2% 3% 2% 2% 3% 1% 2% 2%4 2 2 2 2 - 2 2 4 - - - 4
0% 0% 1% 1% 1% 2% 1% 1% 1%14 7 7 3 7 5 2 4 6 4 3 7 52% 2% 2% 1% 2% 1% 2% 1% 1% 3% 2% 2% 1%80 47 33 27 35 18 14 43 57 7 16 28 42
10% 12% 8% 12% 13% 6% 11% 12% 12% 5% 8% 9% 11%E E I I
28 11 17 8 12 8 2 15 18 2 8 11 113% 3% 4% 3% 4% 3% 2% 4% 4% 1% 4% 3% 3%16 13 2 3 4 9 6 5 11 3 2 7 92% 3% 1% 1% 1% 3% 5% 1% 2% 2% 1% 2% 2%
B GHJ G8 4 4 0 1 7 2 1 3 3 2 8 1
1% 1% 1% 0% 0% 2% 1% 0% 1% 2% 1% 2% 0%16 7 9 1 5 10 2 3 5 3 8 8 42% 2% 2% 1% 2% 3% 2% 1% 1% 2% 4% 3% 1%8 3 5 5 3 0 1 6 7 1 - 3 4
1% 1% 1% 2% 1% 0% 1% 2% 1% 1% 1% 1%12 5 7 - 5 6 1 3 4 1 8 6 41% 1% 2% 2% 2% 1% 1% 1% 0% 4% 2% 1%8 5 3 - 1 6 0 2 2 3 2 4 2
1% 1% 1% 0% 2% 0% 1% 0% 2% 1% 1% 1%No Answer - - - - - - - - - - - - -
Nothing
Comparison Groups: AB/CDE/FGHIJ/KLT-Test for Means, Z-Test for PercentagesUppercase letters indicate significance at the 95% level.
Playing sports
Volunteering
Visiting family/friends in long term care/hospitals
Going to the office/work
Other/something else not on this list
Having dinner parties
Having house parties
Travelling in Canada
Travelling outside of Canada
Going to the gym/spin/yoga/fitness etc.
Shopping
Eating in restaurants
Going to bars/pubs/nightclubs
Visiting/seeing family
Visiting/seeing friends
BASE: All respondents
Going to movies
Going to concerts, theatre or other performances
Watching professional sporting events
Watching childrens’ events (sports, dance etc.)
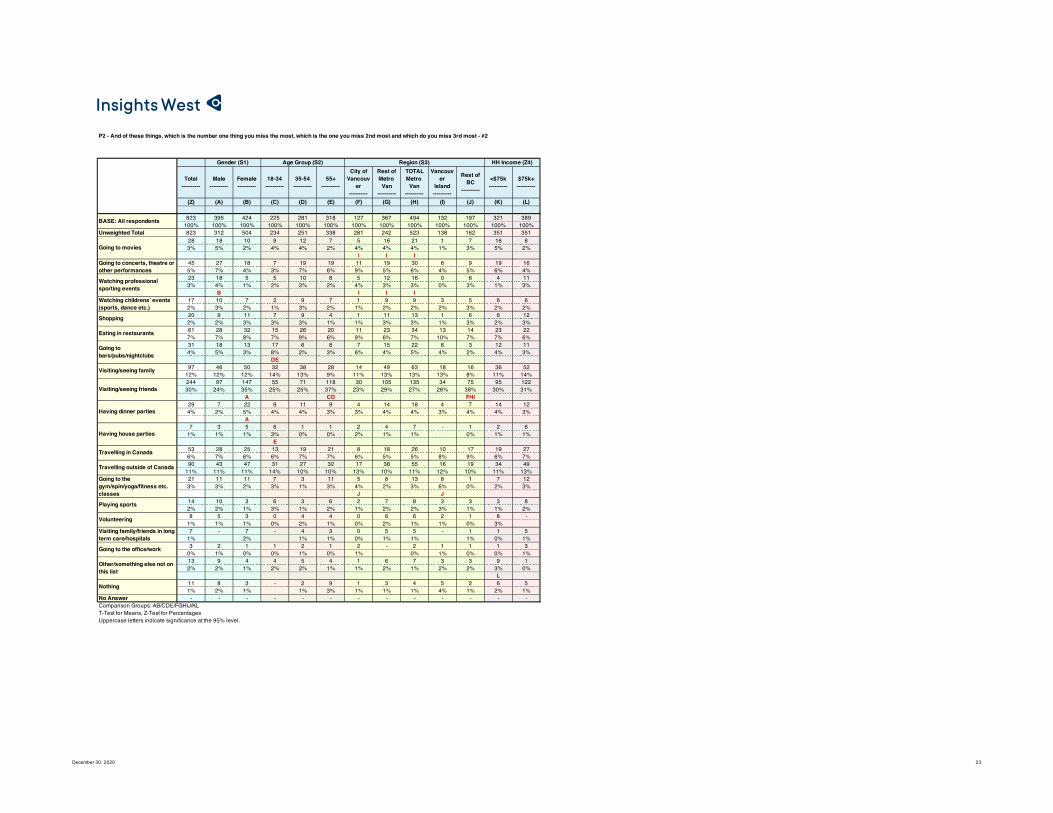
P2 - And of these things, which is the number one thing you miss the most, which is the one you miss 2nd most and which do you miss 3rd most - #1
Gender (S1) Age Group (S2) Region (S3) HH Income (Z4)
December 30, 2020 23
Total----------
Male----------
Female----------
18-34----------
35-54----------
55+----------
City ofVancouv
er----------
Rest ofMetro
Van----------
TOTALMetro
Van----------
Vancouver
Island----------
Rest ofBC
----------
<$75k----------
$75k+----------
(Z) (A) (B) (C) (D) (E) (F) (G) (H) (I) (J) (K) (L)
823 395 424 225 281 318 127 367 494 132 197 321 389100% 100% 100% 100% 100% 100% 100% 100% 100% 100% 100% 100% 100%
Unweighted Total 823 312 504 234 251 338 281 242 523 138 162 351 35128 18 10 9 12 7 5 16 21 1 7 16 83% 5% 2% 4% 4% 2% 4% 4% 4% 1% 3% 5% 2%
I I I45 27 18 7 19 19 11 19 30 6 9 19 165% 7% 4% 3% 7% 6% 9% 5% 6% 4% 5% 6% 4%23 18 5 5 10 8 5 12 16 0 6 4 113% 4% 1% 2% 3% 2% 4% 3% 3% 0% 3% 1% 3%
B I I I17 10 7 2 9 7 1 9 9 3 5 6 62% 3% 2% 1% 3% 2% 1% 2% 2% 2% 3% 2% 2%20 9 11 7 9 4 1 11 13 1 6 6 122% 2% 3% 3% 3% 1% 1% 3% 3% 1% 3% 2% 3%61 28 32 15 26 20 11 23 34 13 14 23 227% 7% 8% 7% 9% 6% 9% 6% 7% 10% 7% 7% 6%31 18 13 17 6 8 7 15 22 6 3 12 114% 5% 3% 8% 2% 3% 6% 4% 5% 4% 2% 4% 3%
DE97 46 50 32 38 28 14 49 63 18 16 36 52
12% 12% 12% 14% 13% 9% 11% 13% 13% 13% 8% 11% 14%244 97 147 55 71 118 30 105 135 34 75 95 12230% 24% 35% 25% 25% 37% 23% 29% 27% 26% 38% 30% 31%
A CD FHI29 7 22 9 11 9 4 14 18 4 7 14 124% 2% 5% 4% 4% 3% 3% 4% 4% 3% 4% 4% 3%
A7 3 5 6 1 1 2 4 7 - 1 2 6
1% 1% 1% 3% 0% 0% 2% 1% 1% 0% 1% 1%E
53 28 25 13 19 21 8 18 26 10 17 19 276% 7% 6% 6% 7% 7% 6% 5% 5% 8% 9% 6% 7%90 43 47 31 27 32 17 38 55 16 19 34 49
11% 11% 11% 14% 10% 10% 13% 10% 11% 12% 10% 11% 13%21 11 11 7 3 11 5 8 13 8 1 7 123% 3% 2% 3% 1% 3% 4% 2% 3% 6% 0% 2% 3%
J J14 10 3 6 3 6 2 7 8 3 3 3 82% 2% 1% 3% 1% 2% 1% 2% 2% 3% 1% 1% 2%8 5 3 0 4 4 0 6 6 2 1 8 -
1% 1% 1% 0% 2% 1% 0% 2% 1% 1% 0% 3%7 - 7 - 4 3 0 5 5 - 1 1 5
1% 2% 1% 1% 0% 1% 1% 1% 0% 1%3 2 1 1 2 1 2 - 2 1 1 1 3
0% 1% 0% 0% 1% 0% 1% 0% 1% 0% 0% 1%13 9 4 4 5 4 1 6 7 3 3 9 12% 2% 1% 2% 2% 1% 1% 2% 1% 2% 2% 3% 0%
L11 8 3 - 2 9 1 3 4 5 2 6 51% 2% 1% 1% 3% 1% 1% 1% 4% 1% 2% 1%
No Answer - - - - - - - - - - - - -
Nothing
Comparison Groups: AB/CDE/FGHIJ/KLT-Test for Means, Z-Test for PercentagesUppercase letters indicate significance at the 95% level.
Playing sports
Volunteering
Visiting family/friends in long term care/hospitals
Going to the office/work
Other/something else not on this list
Having dinner parties
Having house parties
Travelling in Canada
Travelling outside of Canada
Going to the gym/spin/yoga/fitness etc. classes
Shopping
Eating in restaurants
Going to bars/pubs/nightclubs
Visiting/seeing family
Visiting/seeing friends
BASE: All respondents
Going to movies
Going to concerts, theatre or other performances
Watching professional sporting events
Watching childrens’ events (sports, dance etc.)
P2 - And of these things, which is the number one thing you miss the most, which is the one you miss 2nd most and which do you miss 3rd most - #2
Gender (S1) Age Group (S2) Region (S3) HH Income (Z4)

December 30, 2020 24
Total----------
Male----------
Female----------
18-34----------
35-54----------
55+----------
City ofVancouv
er----------
Rest ofMetro
Van----------
TOTALMetro
Van----------
Vancouver
Island----------
Rest ofBC
----------
<$75k----------
$75k+----------
(Z) (A) (B) (C) (D) (E) (F) (G) (H) (I) (J) (K) (L)
823 395 424 225 281 318 127 367 494 132 197 321 389100% 100% 100% 100% 100% 100% 100% 100% 100% 100% 100% 100% 100%
Unweighted Total 823 312 504 234 251 338 281 242 523 138 162 351 35130 18 12 8 15 6 6 16 22 4 3 15 124% 4% 3% 4% 5% 2% 5% 4% 4% 3% 2% 5% 3%55 25 30 20 22 13 13 22 34 7 13 17 297% 6% 7% 9% 8% 4% 10% 6% 7% 5% 7% 5% 7%14 9 5 3 6 5 4 6 10 1 3 7 82% 2% 1% 1% 2% 1% 3% 2% 2% 1% 2% 2% 2%9 6 4 1 7 2 0 7 8 1 1 6 2
1% 1% 1% 0% 2% 1% 0% 2% 2% 1% 0% 2% 1%29 10 18 11 7 11 1 14 15 6 7 12 93% 3% 4% 5% 3% 3% 1% 4% 3% 5% 4% 4% 2%113 60 53 25 32 57 15 54 70 18 25 40 5914% 15% 13% 11% 11% 18% 12% 15% 14% 14% 13% 12% 15%
D19 6 13 8 7 3 5 11 16 2 1 14 42% 2% 3% 4% 3% 1% 4% 3% 3% 1% 1% 4% 1%
J L38 17 21 13 14 10 5 18 24 4 10 14 195% 4% 5% 6% 5% 3% 4% 5% 5% 3% 5% 4% 5%90 35 55 25 30 35 9 33 42 16 31 37 44
11% 9% 13% 11% 11% 11% 7% 9% 9% 12% 16% 12% 11%FH
62 34 28 12 19 31 4 31 35 7 20 28 248% 9% 7% 6% 7% 10% 4% 8% 7% 6% 10% 9% 6%
F22 16 6 10 4 8 5 11 16 4 1 9 93% 4% 1% 5% 1% 2% 4% 3% 3% 3% 1% 3% 2%
B J J82 43 38 13 37 33 6 35 40 17 25 29 39
10% 11% 9% 6% 13% 10% 4% 9% 8% 13% 13% 9% 10%C F F
127 53 74 39 36 51 26 52 78 14 34 37 7515% 13% 17% 17% 13% 16% 21% 14% 16% 11% 17% 12% 19%
I K37 9 28 9 18 10 10 16 26 5 6 14 225% 2% 7% 4% 6% 3% 8% 4% 5% 4% 3% 4% 6%
A13 5 8 7 4 1 1 7 8 5 -1 4 72% 1% 2% 3% 2% 0% 1% 2% 2% 4% 0% 1% 2%
E J J19 10 8 3 4 13 3 5 8 5 6 13 52% 3% 2% 1% 1% 4% 2% 1% 2% 4% 3% 4% 1%9 6 4 3 3 4 0 4 4 1 4 4 4
1% 1% 1% 1% 1% 1% 0% 1% 1% 1% 2% 1% 1%15 10 5 10 2 3 8 6 15 2 -1 5 32% 2% 1% 4% 1% 1% 6% 2% 3% 1% -1% 2% 1%
D GHIJ J GJ13 6 7 2 4 7 1 5 6 3 4 5 52% 2% 2% 1% 2% 2% 1% 1% 1% 2% 2% 2% 1%26 17 8 2 10 14 2 13 15 7 3 11 103% 4% 2% 1% 4% 4% 1% 4% 3% 5% 2% 4% 3%
C CNo Answer - - - - - - - - - - - - -
Nothing
Comparison Groups: AB/CDE/FGHIJ/KLT-Test for Means, Z-Test for PercentagesUppercase letters indicate significance at the 95% level.
Playing sports
Volunteering
Visiting family/friends in long term care/hospitals
Going to the office/work
Other/something else not on this list
Having dinner parties
Having house parties
Travelling in Canada
Travelling outside of Canada
Going to the gym/spin/yoga/fitness etc. classes
Shopping
Eating in restaurants
Going to bars/pubs/nightclubs
Visiting/seeing family
Visiting/seeing friends
BASE: All respondents
Going to movies
Going to concerts, theatre or other performancesWatching professional sporting eventsWatching childrens’ events (sports, dance etc.)
P2 - And of these things, which is the number one thing you miss the most, which is the one you miss 2nd most and which do you miss 3rd most - #3
Gender (S1) Age Group (S2) Region (S3) HH Income (Z4)
December 30, 2020 25
Total----------
Male----------
Female----------
18-34----------
35-54----------
55+----------
City ofVancouv
er----------
Rest ofMetro
Van----------
TOTALMetro
Van----------
Vancouver
Island----------
Rest ofBC
----------
<$75k----------
$75k+----------
(Z) (A) (B) (C) (D) (E) (F) (G) (H) (I) (J) (K) (L)
823 395 424 225 281 318 127 367 494 132 197 321 389100% 100% 100% 100% 100% 100% 100% 100% 100% 100% 100% 100% 100%
Unweighted Total 823 312 504 234 251 338 281 242 523 138 162 351 351575 250 324 155 200 220 82 271 353 88 134 226 27070% 63% 77% 69% 71% 69% 65% 74% 72% 66% 68% 70% 69%
A482 221 259 132 169 180 69 228 297 71 114 203 20959% 56% 61% 59% 60% 57% 54% 62% 60% 53% 58% 63% 54%
L276 122 150 74 102 100 38 133 172 33 71 113 11733% 31% 35% 33% 36% 31% 30% 36% 35% 25% 36% 35% 30%
I560 244 314 156 188 216 84 257 341 84 135 214 26468% 62% 74% 69% 67% 68% 66% 70% 69% 64% 69% 67% 68%
A498 232 264 144 186 169 77 230 307 64 128 155 27261% 59% 62% 64% 66% 53% 60% 63% 62% 48% 65% 48% 70%
E E I I I K448 212 232 127 171 150 71 200 271 55 122 136 24854% 54% 55% 57% 61% 47% 56% 55% 55% 41% 62% 42% 64%
E I I I I K308 150 158 67 122 119 46 146 192 36 81 110 14837% 38% 37% 30% 43% 38% 36% 40% 39% 27% 41% 34% 38%
C I I I332 159 172 87 110 135 47 158 205 46 80 139 15640% 40% 41% 39% 39% 43% 37% 43% 42% 35% 41% 43% 40%647 303 342 174 220 254 97 291 388 98 162 239 32179% 77% 81% 77% 78% 80% 76% 79% 79% 74% 82% 75% 83%
K454 206 246 126 152 176 84 195 279 61 115 173 22555% 52% 58% 56% 54% 55% 66% 53% 56% 46% 58% 54% 58%
GHI G291 154 136 89 94 107 55 124 179 41 70 100 14035% 39% 32% 40% 33% 34% 44% 34% 36% 31% 36% 31% 36%305 128 176 110 108 87 64 143 206 34 65 114 14937% 32% 41% 49% 39% 27% 50% 39% 42% 26% 33% 36% 38%
A E E GHIJ I GI469 206 261 139 160 170 80 205 285 63 121 183 21957% 52% 62% 62% 57% 54% 63% 56% 58% 48% 62% 57% 56%
A I I484 232 250 126 174 185 76 205 281 79 123 180 24459% 59% 59% 56% 62% 58% 60% 56% 57% 60% 63% 56% 63%524 261 260 154 167 204 83 242 325 89 109 183 27064% 66% 61% 68% 59% 64% 65% 66% 66% 68% 56% 57% 70%
J K514 254 260 126 180 208 76 231 307 80 128 195 25362% 64% 61% 56% 64% 65% 60% 63% 62% 60% 65% 61% 65%559 265 292 152 193 214 88 261 349 77 133 209 27068% 67% 69% 68% 69% 67% 69% 71% 71% 58% 68% 65% 70%
I I386 181 204 95 132 160 60 176 237 57 93 154 17247% 46% 48% 42% 47% 50% 48% 48% 48% 43% 47% 48% 44%77 19 58 30 32 15 17 29 46 11 20 38 349% 5% 14% 13% 11% 5% 13% 8% 9% 8% 10% 12% 9%
A E E334 141 190 84 129 120 53 119 172 62 100 134 15941% 36% 45% 37% 46% 38% 42% 32% 35% 47% 51% 42% 41%
A GH GH260 143 116 106 110 44 58 130 188 30 41 88 13032% 36% 27% 47% 39% 14% 46% 35% 38% 23% 21% 27% 33%
B E E IJ IJ IJ363 165 195 144 154 65 89 185 274 37 52 115 19244% 42% 46% 64% 55% 20% 70% 50% 55% 28% 26% 36% 49%
E E GHIJ IJ GIJ K484 219 262 145 160 179 77 231 308 69 107 187 22359% 55% 62% 64% 57% 56% 61% 63% 62% 52% 54% 58% 57%
No Answer - - - - - - - - - - - - -
T-Test for Means, Z-Test for PercentagesUppercase letters indicate significance at the 95% level.
Spent more time with your pet(s)
Focussed more on/improved your career/job
Various benefits of working from home (no commute, comfortable clothing, fewer Done things to be less negative impact on the
Comparison Groups: AB/CDE/FGHIJ/KL
Saved more money
Spent more carefully
Cooked more/better meals or baked more/better instead of eating out
Healthier eating habits
Got a new pet
More creative/made more effort to stay connected to family/friendsImproved fitness/more expercise
Learned new hobby/activity
More time to spend on hobbies/activites you love
Improvements to house/garden (including
Spend more time with people in your household/family
Better relationships with the people in your household
Better relationships with family outside your householdBetter relationships with friends
More appreciation for family/friends
BASE: All respondents
Learned to be more grateful
More time to think/be reflective
Focussed more on/increased spirituality
More focus on what is really important in life
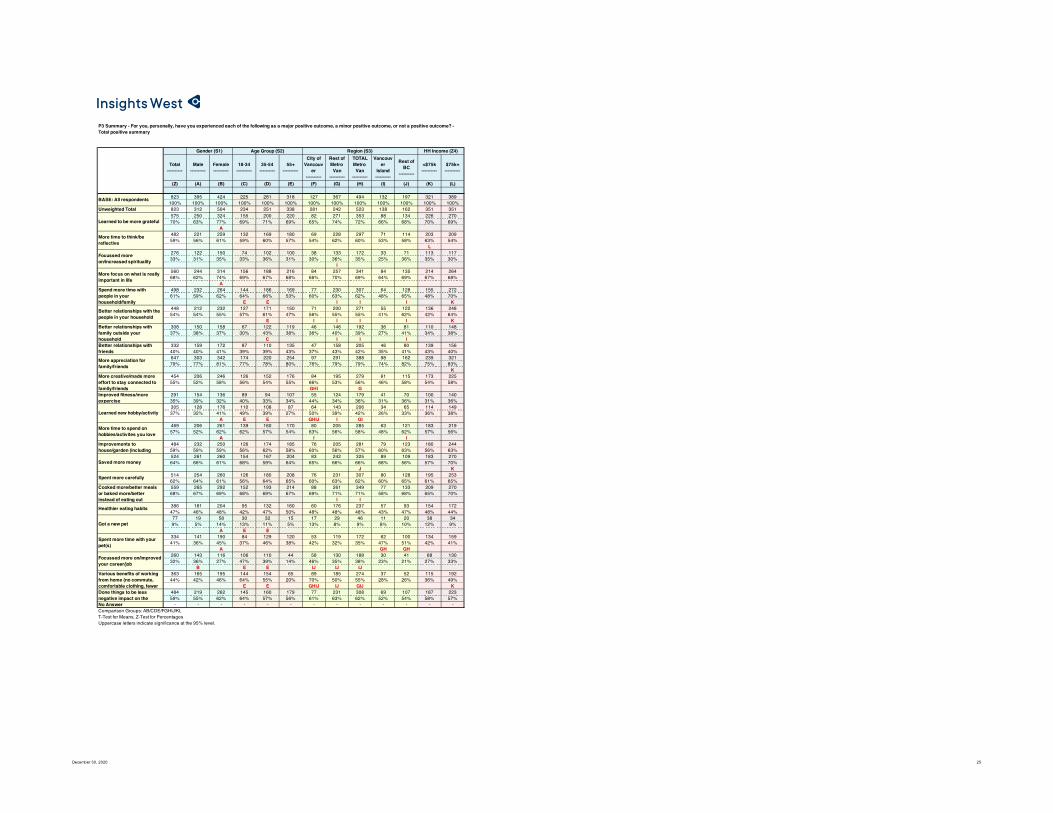
P3 Summary - For you, personally, have you experienced each of the following as a major positive outcome, a minor positive outcome, or not a positive outcome? - Total positive summary
Gender (S1) Age Group (S2) Region (S3) HH Income (Z4)
December 30, 2020 26
Total----------
Male----------
Female----------
18-34----------
35-54----------
55+----------
City ofVancouv
er----------
Rest ofMetro
Van----------
TOTALMetro
Van----------
Vancouver
Island----------
Rest ofBC
----------
<$75k----------
$75k+----------
(Z) (A) (B) (C) (D) (E) (F) (G) (H) (I) (J) (K) (L)
823 395 424 225 281 318 127 367 494 132 197 321 389100% 100% 100% 100% 100% 100% 100% 100% 100% 100% 100% 100% 100%
Unweighted Total 823 312 504 234 251 338 281 242 523 138 162 351 351247 89 158 64 88 95 37 121 158 25 64 89 12430% 22% 37% 28% 31% 30% 29% 33% 32% 19% 33% 28% 32%
A I I I328 161 166 91 112 125 45 150 196 62 70 137 14640% 41% 39% 41% 40% 39% 36% 41% 40% 47% 36% 43% 37%91 54 37 29 28 34 19 31 51 18 23 36 46
11% 14% 9% 13% 10% 11% 15% 9% 10% 13% 12% 11% 12%157 91 62 40 53 64 25 64 90 27 40 59 7219% 23% 15% 18% 19% 20% 20% 18% 18% 21% 20% 18% 19%
B575 250 324 155 200 220 82 271 353 88 134 226 27070% 63% 77% 69% 71% 69% 65% 74% 72% 66% 68% 70% 69%
ANo Answer - - - - - - - - - - - - -
NET: Total positive
Comparison Groups: AB/CDE/FGHIJ/KLT-Test for Means, Z-Test for PercentagesUppercase letters indicate significance at the 95% level.
BASE: All respondents
Major positive
Minor positive
Not a positive outcome
Not applicable / not sure
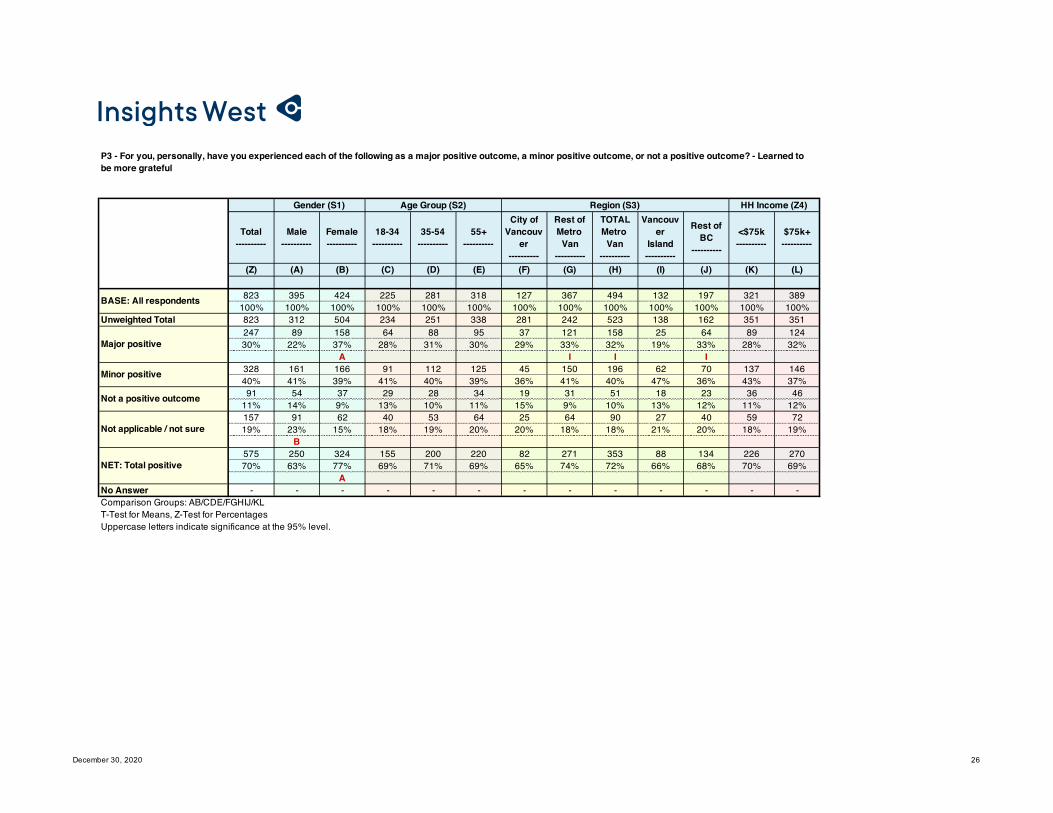
P3 - For you, personally, have you experienced each of the following as a major positive outcome, a minor positive outcome, or not a positive outcome? - Learned to be more grateful
Gender (S1) Age Group (S2) Region (S3) HH Income (Z4)

December 30, 2020 27
Total----------
Male----------
Female----------
18-34----------
35-54----------
55+----------
City ofVancouv
er----------
Rest ofMetro
Van----------
TOTALMetro
Van----------
Vancouver
Island----------
Rest ofBC
----------
<$75k----------
$75k+----------
(Z) (A) (B) (C) (D) (E) (F) (G) (H) (I) (J) (K) (L)
823 395 424 225 281 318 127 367 494 132 197 321 389100% 100% 100% 100% 100% 100% 100% 100% 100% 100% 100% 100% 100%
Unweighted Total 823 312 504 234 251 338 281 242 523 138 162 351 351169 64 103 51 48 71 20 85 105 24 41 72 6621% 16% 24% 23% 17% 22% 15% 23% 21% 18% 21% 22% 17%
A313 157 156 81 122 110 49 143 192 47 74 131 14338% 40% 37% 36% 43% 35% 39% 39% 39% 36% 37% 41% 37%162 90 72 51 55 56 35 57 93 31 39 60 8720% 23% 17% 23% 20% 18% 28% 16% 19% 23% 20% 19% 22%
GH G179 85 92 41 56 81 23 82 104 31 43 57 9222% 21% 22% 18% 20% 25% 18% 22% 21% 23% 22% 18% 24%482 221 259 132 169 180 69 228 297 71 114 203 20959% 56% 61% 59% 60% 57% 54% 62% 60% 53% 58% 63% 54%
LNo Answer - - - - - - - - - - - - -
NET: Total positive
Comparison Groups: AB/CDE/FGHIJ/KLT-Test for Means, Z-Test for PercentagesUppercase letters indicate significance at the 95% level.
BASE: All respondents
Major positive
Minor positive
Not a positive outcome
Not applicable / not sure
P3 - For you, personally, have you experienced each of the following as a major positive outcome, a minor positive outcome, or not a positive outcome? - More time to think/be reflective
Gender (S1) Age Group (S2) Region (S3) HH Income (Z4)

December 30, 2020 28
Total----------
Male----------
Female----------
18-34----------
35-54----------
55+----------
City ofVancouv
er----------
Rest ofMetro
Van----------
TOTALMetro
Van----------
Vancouver
Island----------
Rest ofBC
----------
<$75k----------
$75k+----------
(Z) (A) (B) (C) (D) (E) (F) (G) (H) (I) (J) (K) (L)
823 395 424 225 281 318 127 367 494 132 197 321 389100% 100% 100% 100% 100% 100% 100% 100% 100% 100% 100% 100% 100%
Unweighted Total 823 312 504 234 251 338 281 242 523 138 162 351 35191 38 52 32 35 25 11 50 61 6 24 44 28
11% 10% 12% 14% 12% 8% 9% 14% 12% 5% 12% 14% 7%I I L
184 84 98 42 67 75 27 83 110 27 47 68 8922% 21% 23% 19% 24% 24% 22% 23% 22% 21% 24% 21% 23%98 51 48 33 30 36 21 39 60 14 23 51 34
12% 13% 11% 14% 11% 11% 17% 11% 12% 11% 12% 16% 9%L
449 223 226 118 149 182 68 194 262 85 103 157 23855% 56% 53% 53% 53% 57% 53% 53% 53% 64% 52% 49% 61%
H K276 122 150 74 102 100 38 133 172 33 71 113 11733% 31% 35% 33% 36% 31% 30% 36% 35% 25% 36% 35% 30%
INo Answer - - - - - - - - - - - - -
NET: Total positive
Comparison Groups: AB/CDE/FGHIJ/KLT-Test for Means, Z-Test for PercentagesUppercase letters indicate significance at the 95% level.
BASE: All respondents
Major positive
Minor positive
Not a positive outcome
Not applicable / not sure
P3 - For you, personally, have you experienced each of the following as a major positive outcome, a minor positive outcome, or not a positive outcome? - Focussed more on/increased spirituality
Gender (S1) Age Group (S2) Region (S3) HH Income (Z4)

December 30, 2020 29
Total----------
Male----------
Female----------
18-34----------
35-54----------
55+----------
City ofVancouv
er----------
Rest ofMetro
Van----------
TOTALMetro
Van----------
Vancouver
Island----------
Rest ofBC
----------
<$75k----------
$75k+----------
(Z) (A) (B) (C) (D) (E) (F) (G) (H) (I) (J) (K) (L)
823 395 424 225 281 318 127 367 494 132 197 321 389100% 100% 100% 100% 100% 100% 100% 100% 100% 100% 100% 100% 100%
Unweighted Total 823 312 504 234 251 338 281 242 523 138 162 351 351252 99 151 61 90 100 28 120 148 37 66 84 12931% 25% 36% 27% 32% 32% 22% 33% 30% 28% 34% 26% 33%
A FH F308 145 162 95 98 116 56 137 193 47 69 130 13537% 37% 38% 42% 35% 36% 44% 37% 39% 35% 35% 41% 35%95 52 43 27 39 28 25 30 55 14 26 40 42
12% 13% 10% 12% 14% 9% 19% 8% 11% 11% 13% 13% 11%GHI G
168 99 67 42 53 74 18 80 99 34 36 67 8220% 25% 16% 19% 19% 23% 14% 22% 20% 26% 18% 21% 21%
B F560 244 314 156 188 216 84 257 341 84 135 214 26468% 62% 74% 69% 67% 68% 66% 70% 69% 64% 69% 67% 68%
ANo Answer - - - - - - - - - - - - -
NET: Total positive
Comparison Groups: AB/CDE/FGHIJ/KLT-Test for Means, Z-Test for PercentagesUppercase letters indicate significance at the 95% level.
BASE: All respondents
Major positive
Minor positive
Not a positive outcome
Not applicable / not sure
P3 - For you, personally, have you experienced each of the following as a major positive outcome, a minor positive outcome, or not a positive outcome? - More focus on what is really important in life
Gender (S1) Age Group (S2) Region (S3) HH Income (Z4)

December 30, 2020 30
Total----------
Male----------
Female----------
18-34----------
35-54----------
55+----------
City ofVancouv
er----------
Rest ofMetro
Van----------
TOTALMetro
Van----------
Vancouver
Island----------
Rest ofBC
----------
<$75k----------
$75k+----------
(Z) (A) (B) (C) (D) (E) (F) (G) (H) (I) (J) (K) (L)
823 395 424 225 281 318 127 367 494 132 197 321 389100% 100% 100% 100% 100% 100% 100% 100% 100% 100% 100% 100% 100%
Unweighted Total 823 312 504 234 251 338 281 242 523 138 162 351 351231 89 142 64 101 66 33 122 155 22 54 67 13128% 22% 34% 29% 36% 21% 26% 33% 31% 17% 28% 21% 34%
A E I I I K267 143 122 80 84 103 44 108 152 42 73 88 14132% 36% 29% 35% 30% 32% 34% 29% 31% 32% 37% 27% 36%
K121 68 52 39 36 47 22 48 71 31 20 55 5015% 17% 12% 17% 13% 15% 18% 13% 14% 23% 10% 17% 13%
GHJ204 95 108 42 60 102 28 89 117 38 49 111 6725% 24% 25% 19% 21% 32% 22% 24% 24% 29% 25% 35% 17%
CD L498 232 264 144 186 169 77 230 307 64 128 155 27261% 59% 62% 64% 66% 53% 60% 63% 62% 48% 65% 48% 70%
E E I I I KNo Answer - - - - - - - - - - - - -
NET: Total positive
Comparison Groups: AB/CDE/FGHIJ/KLT-Test for Means, Z-Test for PercentagesUppercase letters indicate significance at the 95% level.
BASE: All respondents
Major positive
Minor positive
Not a positive outcome
Not applicable / not sure
P3 - For you, personally, have you experienced each of the following as a major positive outcome, a minor positive outcome, or not a positive outcome? - Spend more time with people in your household/family
Gender (S1) Age Group (S2) Region (S3) HH Income (Z4)

December 30, 2020 31
Total----------
Male----------
Female----------
18-34----------
35-54----------
55+----------
City ofVancouv
er----------
Rest ofMetro
Van----------
TOTALMetro
Van----------
Vancouver
Island----------
Rest ofBC
----------
<$75k----------
$75k+----------
(Z) (A) (B) (C) (D) (E) (F) (G) (H) (I) (J) (K) (L)
823 395 424 225 281 318 127 367 494 132 197 321 389100% 100% 100% 100% 100% 100% 100% 100% 100% 100% 100% 100% 100%
Unweighted Total 823 312 504 234 251 338 281 242 523 138 162 351 351195 79 116 63 68 65 29 89 118 25 52 59 10624% 20% 27% 28% 24% 20% 23% 24% 24% 19% 27% 18% 27%
A K252 133 116 64 103 85 42 111 153 30 69 78 14231% 34% 27% 29% 37% 27% 33% 30% 31% 23% 35% 24% 36%
E I K112 60 52 36 36 40 19 52 71 22 19 48 5514% 15% 12% 16% 13% 13% 15% 14% 14% 16% 10% 15% 14%264 123 140 61 74 128 37 115 152 56 56 137 8632% 31% 33% 27% 26% 40% 29% 31% 31% 42% 28% 43% 22%
CD FHJ L448 212 232 127 171 150 71 200 271 55 122 136 24854% 54% 55% 57% 61% 47% 56% 55% 55% 41% 62% 42% 64%
E I I I I KNo Answer - - - - - - - - - - - - -
NET: Total positive
Comparison Groups: AB/CDE/FGHIJ/KLT-Test for Means, Z-Test for PercentagesUppercase letters indicate significance at the 95% level.
BASE: All respondents
Major positive
Minor positive
Not a positive outcome
Not applicable / not sure
P3 - For you, personally, have you experienced each of the following as a major positive outcome, a minor positive outcome, or not a positive outcome? - Better relationships with the people in your household
Gender (S1) Age Group (S2) Region (S3) HH Income (Z4)
December 30, 2020 32
Total----------
Male----------
Female----------
18-34----------
35-54----------
55+----------
City ofVancouv
er----------
Rest ofMetro
Van----------
TOTALMetro
Van----------
Vancouver
Island----------
Rest ofBC
----------
<$75k----------
$75k+----------
(Z) (A) (B) (C) (D) (E) (F) (G) (H) (I) (J) (K) (L)
823 395 424 225 281 318 127 367 494 132 197 321 389100% 100% 100% 100% 100% 100% 100% 100% 100% 100% 100% 100% 100%
Unweighted Total 823 312 504 234 251 338 281 242 523 138 162 351 35168 31 38 23 19 26 7 29 35 12 21 26 308% 8% 9% 10% 7% 8% 5% 8% 7% 9% 11% 8% 8%240 119 120 44 103 93 39 117 156 24 60 84 11829% 30% 28% 20% 37% 29% 31% 32% 32% 18% 30% 26% 30%
C C I I I I223 104 117 77 62 84 37 93 130 37 55 91 10627% 26% 28% 34% 22% 26% 29% 25% 26% 28% 28% 28% 27%
D292 141 148 81 97 115 44 128 172 60 61 120 13535% 36% 35% 36% 34% 36% 35% 35% 35% 45% 31% 37% 35%
J308 150 158 67 122 119 46 146 192 36 81 110 14837% 38% 37% 30% 43% 38% 36% 40% 39% 27% 41% 34% 38%
C I I INo Answer - - - - - - - - - - - - -
NET: Total positive
Comparison Groups: AB/CDE/FGHIJ/KLT-Test for Means, Z-Test for PercentagesUppercase letters indicate significance at the 95% level.
BASE: All respondents
Major positive
Minor positive
Not a positive outcome
Not applicable / not sure
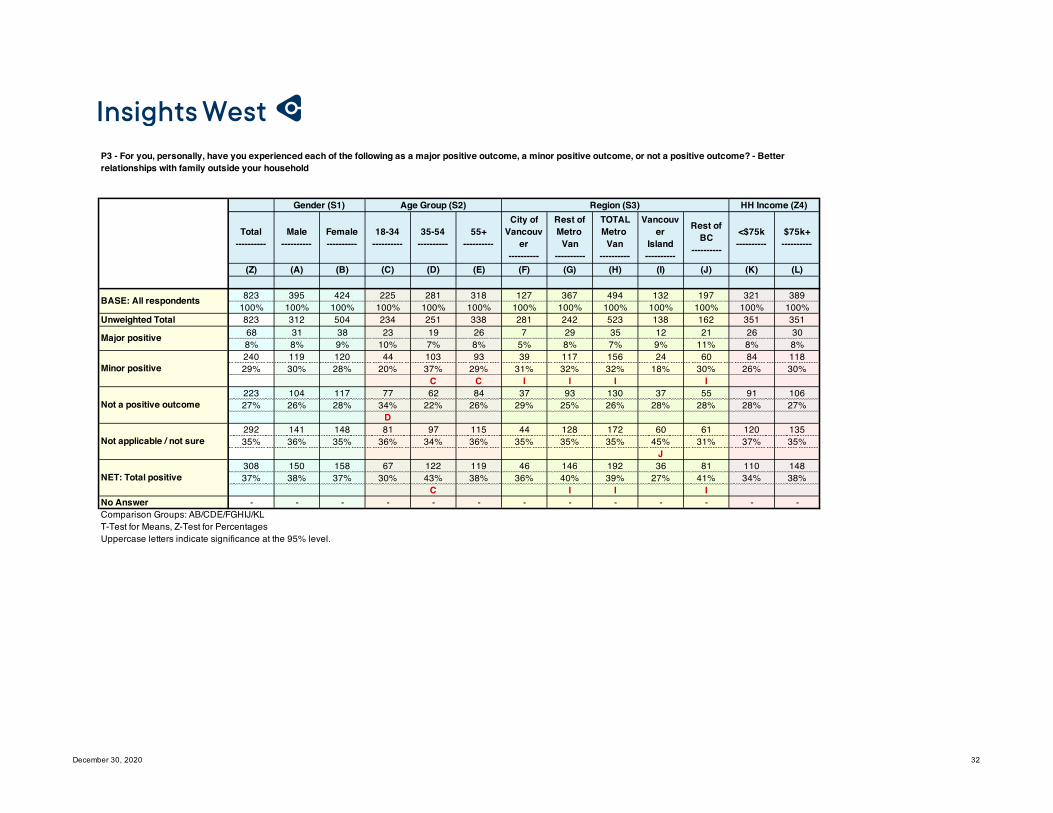
P3 - For you, personally, have you experienced each of the following as a major positive outcome, a minor positive outcome, or not a positive outcome? - Better relationships with family outside your household
Gender (S1) Age Group (S2) Region (S3) HH Income (Z4)
December 30, 2020 33
Total----------
Male----------
Female----------
18-34----------
35-54----------
55+----------
City ofVancouv
er----------
Rest ofMetro
Van----------
TOTALMetro
Van----------
Vancouver
Island----------
Rest ofBC
----------
<$75k----------
$75k+----------
(Z) (A) (B) (C) (D) (E) (F) (G) (H) (I) (J) (K) (L)
823 395 424 225 281 318 127 367 494 132 197 321 389100% 100% 100% 100% 100% 100% 100% 100% 100% 100% 100% 100% 100%
Unweighted Total 823 312 504 234 251 338 281 242 523 138 162 351 35184 29 55 25 28 31 11 43 54 9 21 37 38
10% 7% 13% 11% 10% 10% 8% 12% 11% 7% 11% 12% 10%A
248 130 117 62 82 104 37 114 151 37 60 102 11930% 33% 28% 27% 29% 33% 29% 31% 31% 28% 30% 32% 31%244 119 123 82 78 83 45 103 148 40 55 83 12630% 30% 29% 37% 28% 26% 36% 28% 30% 30% 28% 26% 32%
E247 118 129 55 92 100 34 106 140 46 61 99 10630% 30% 30% 25% 33% 31% 27% 29% 28% 35% 31% 31% 27%332 159 172 87 110 135 47 158 205 46 80 139 15640% 40% 41% 39% 39% 43% 37% 43% 42% 35% 41% 43% 40%
No Answer - - - - - - - - - - - - -
NET: Total positive
Comparison Groups: AB/CDE/FGHIJ/KLT-Test for Means, Z-Test for PercentagesUppercase letters indicate significance at the 95% level.
BASE: All respondents
Major positive
Minor positive
Not a positive outcome
Not applicable / not sure
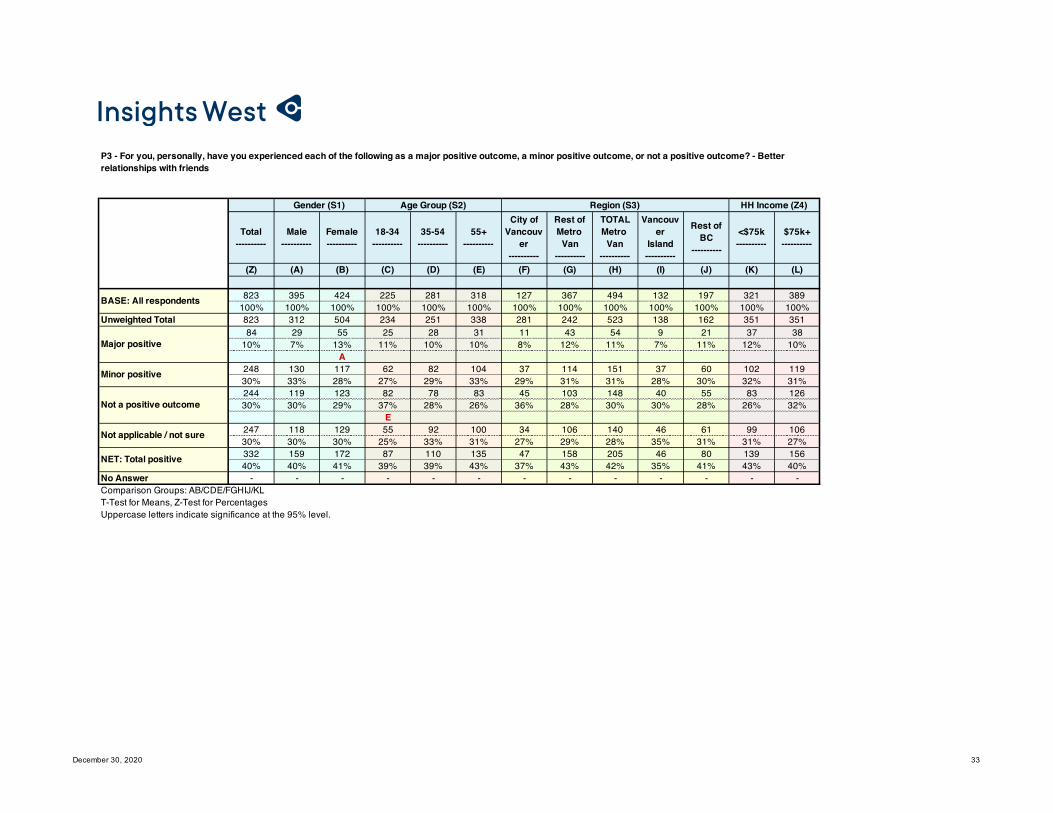
P3 - For you, personally, have you experienced each of the following as a major positive outcome, a minor positive outcome, or not a positive outcome? - Better relationships with friends
Gender (S1) Age Group (S2) Region (S3) HH Income (Z4)

December 30, 2020 34
Total----------
Male----------
Female----------
18-34----------
35-54----------
55+----------
City ofVancouv
er----------
Rest ofMetro
Van----------
TOTALMetro
Van----------
Vancouver
Island----------
Rest ofBC
----------
<$75k----------
$75k+----------
(Z) (A) (B) (C) (D) (E) (F) (G) (H) (I) (J) (K) (L)
823 395 424 225 281 318 127 367 494 132 197 321 389100% 100% 100% 100% 100% 100% 100% 100% 100% 100% 100% 100% 100%
Unweighted Total 823 312 504 234 251 338 281 242 523 138 162 351 351324 130 193 86 104 134 50 140 190 40 94 114 16539% 33% 46% 38% 37% 42% 39% 38% 38% 30% 48% 36% 42%
A I323 173 149 88 116 119 47 151 198 57 68 125 15639% 44% 35% 39% 41% 38% 37% 41% 40% 43% 34% 39% 40%
B59 32 25 24 19 15 12 29 42 11 7 32 237% 8% 6% 11% 7% 5% 10% 8% 8% 8% 3% 10% 6%
J117 60 57 27 41 49 18 47 64 24 28 50 4514% 15% 13% 12% 15% 15% 14% 13% 13% 18% 14% 16% 12%647 303 342 174 220 254 97 291 388 98 162 239 32179% 77% 81% 77% 78% 80% 76% 79% 79% 74% 82% 75% 83%
KNo Answer - - - - - - - - - - - - -
NET: Total positive
Comparison Groups: AB/CDE/FGHIJ/KLT-Test for Means, Z-Test for PercentagesUppercase letters indicate significance at the 95% level.
BASE: All respondents
Major positive
Minor positive
Not a positive outcome
Not applicable / not sure
P3 - For you, personally, have you experienced each of the following as a major positive outcome, a minor positive outcome, or not a positive outcome? - More appreciation for family/friends
Gender (S1) Age Group (S2) Region (S3) HH Income (Z4)

December 30, 2020 35
Total----------
Male----------
Female----------
18-34----------
35-54----------
55+----------
City ofVancouv
er----------
Rest ofMetro
Van----------
TOTALMetro
Van----------
Vancouver
Island----------
Rest ofBC
----------
<$75k----------
$75k+----------
(Z) (A) (B) (C) (D) (E) (F) (G) (H) (I) (J) (K) (L)
823 395 424 225 281 318 127 367 494 132 197 321 389100% 100% 100% 100% 100% 100% 100% 100% 100% 100% 100% 100% 100%
Unweighted Total 823 312 504 234 251 338 281 242 523 138 162 351 351120 36 82 35 42 43 13 53 66 17 36 52 5615% 9% 19% 16% 15% 14% 10% 15% 13% 13% 18% 16% 14%
A335 170 164 91 110 133 70 142 212 44 78 122 16941% 43% 39% 41% 39% 42% 55% 39% 43% 33% 40% 38% 43%
GHIJ G173 91 81 53 56 64 26 78 105 34 34 64 8621% 23% 19% 23% 20% 20% 21% 21% 21% 26% 17% 20% 22%196 98 97 46 73 77 17 93 110 37 48 83 7824% 25% 23% 20% 26% 24% 13% 25% 22% 28% 25% 26% 20%
FH F F F454 206 246 126 152 176 84 195 279 61 115 173 22555% 52% 58% 56% 54% 55% 66% 53% 56% 46% 58% 54% 58%
GHI GNo Answer - - - - - - - - - - - - -
NET: Total positive
Comparison Groups: AB/CDE/FGHIJ/KLT-Test for Means, Z-Test for PercentagesUppercase letters indicate significance at the 95% level.
BASE: All respondents
Major positive
Minor positive
Not a positive outcome
Not applicable / not sure
P3 - For you, personally, have you experienced each of the following as a major positive outcome, a minor positive outcome, or not a positive outcome? - More creative/made more effort to stay connected to family/friends
Gender (S1) Age Group (S2) Region (S3) HH Income (Z4)

December 30, 2020 36
Total----------
Male----------
Female----------
18-34----------
35-54----------
55+----------
City ofVancouv
er----------
Rest ofMetro
Van----------
TOTALMetro
Van----------
Vancouver
Island----------
Rest ofBC
----------
<$75k----------
$75k+----------
(Z) (A) (B) (C) (D) (E) (F) (G) (H) (I) (J) (K) (L)
823 395 424 225 281 318 127 367 494 132 197 321 389100% 100% 100% 100% 100% 100% 100% 100% 100% 100% 100% 100% 100%
Unweighted Total 823 312 504 234 251 338 281 242 523 138 162 351 35183 42 41 33 26 25 20 39 60 9 15 25 38
10% 11% 10% 15% 9% 8% 16% 11% 12% 7% 8% 8% 10%E I
207 112 95 56 68 83 35 84 119 33 55 75 10225% 28% 22% 25% 24% 26% 28% 23% 24% 25% 28% 23% 26%303 134 166 93 108 102 51 148 199 47 57 114 15937% 34% 39% 41% 39% 32% 40% 40% 40% 36% 29% 36% 41%
J J229 108 121 43 78 108 21 95 116 44 70 106 9028% 27% 29% 19% 28% 34% 16% 26% 23% 33% 36% 33% 23%
C FH F F FH L291 154 136 89 94 107 55 124 179 41 70 100 14035% 39% 32% 40% 33% 34% 44% 34% 36% 31% 36% 31% 36%
No Answer - - - - - - - - - - - - -
NET: Total positive
Comparison Groups: AB/CDE/FGHIJ/KLT-Test for Means, Z-Test for PercentagesUppercase letters indicate significance at the 95% level.
BASE: All respondents
Major positive
Minor positive
Not a positive outcome
Not applicable / not sure
P3 - For you, personally, have you experienced each of the following as a major positive outcome, a minor positive outcome, or not a positive outcome? - Improved fitness/more expercise
Gender (S1) Age Group (S2) Region (S3) HH Income (Z4)

December 30, 2020 37
Total----------
Male----------
Female----------
18-34----------
35-54----------
55+----------
City ofVancouv
er----------
Rest ofMetro
Van----------
TOTALMetro
Van----------
Vancouver
Island----------
Rest ofBC
----------
<$75k----------
$75k+----------
(Z) (A) (B) (C) (D) (E) (F) (G) (H) (I) (J) (K) (L)
823 395 424 225 281 318 127 367 494 132 197 321 389100% 100% 100% 100% 100% 100% 100% 100% 100% 100% 100% 100% 100%
Unweighted Total 823 312 504 234 251 338 281 242 523 138 162 351 35194 38 54 45 27 22 24 46 70 5 19 38 40
11% 10% 13% 20% 10% 7% 19% 13% 14% 3% 10% 12% 10%DE IJ I I
211 90 121 65 82 65 40 96 136 29 46 77 10926% 23% 29% 29% 29% 20% 31% 26% 28% 22% 23% 24% 28%
E110 52 57 36 37 38 14 56 71 18 22 47 4713% 13% 14% 16% 13% 12% 11% 15% 14% 13% 11% 15% 12%408 215 191 79 136 193 49 168 217 81 110 159 19350% 54% 45% 35% 48% 61% 39% 46% 44% 61% 56% 50% 50%
B C CD FGH FH305 128 176 110 108 87 64 143 206 34 65 114 14937% 32% 41% 49% 39% 27% 50% 39% 42% 26% 33% 36% 38%
A E E GHIJ I GINo Answer - - - - - - - - - - - - -
NET: Total positive
Comparison Groups: AB/CDE/FGHIJ/KLT-Test for Means, Z-Test for PercentagesUppercase letters indicate significance at the 95% level.
BASE: All respondents
Major positive
Minor positive
Not a positive outcome
Not applicable / not sure
P3 - For you, personally, have you experienced each of the following as a major positive outcome, a minor positive outcome, or not a positive outcome? - Learned new hobby/activity
Gender (S1) Age Group (S2) Region (S3) HH Income (Z4)
December 30, 2020 38
Total----------
Male----------
Female----------
18-34----------
35-54----------
55+----------
City ofVancouv
er----------
Rest ofMetro
Van----------
TOTALMetro
Van----------
Vancouver
Island----------
Rest ofBC
----------
<$75k----------
$75k+----------
(Z) (A) (B) (C) (D) (E) (F) (G) (H) (I) (J) (K) (L)
823 395 424 225 281 318 127 367 494 132 197 321 389100% 100% 100% 100% 100% 100% 100% 100% 100% 100% 100% 100% 100%
Unweighted Total 823 312 504 234 251 338 281 242 523 138 162 351 351150 56 93 65 46 40 29 71 100 16 34 60 6218% 14% 22% 29% 16% 13% 23% 19% 20% 12% 18% 19% 16%
A DE I I319 150 168 74 114 130 51 134 185 47 86 123 15839% 38% 40% 33% 41% 41% 40% 37% 37% 36% 44% 38% 41%121 63 58 37 42 41 21 56 77 21 23 43 6515% 16% 14% 17% 15% 13% 16% 15% 16% 16% 11% 13% 17%233 126 105 49 78 106 26 106 132 48 53 95 10428% 32% 25% 22% 28% 33% 21% 29% 27% 36% 27% 30% 27%
C F469 206 261 139 160 170 80 205 285 63 121 183 21957% 52% 62% 62% 57% 54% 63% 56% 58% 48% 62% 57% 56%
A I INo Answer - - - - - - - - - - - - -
NET: Total positive
Comparison Groups: AB/CDE/FGHIJ/KLT-Test for Means, Z-Test for PercentagesUppercase letters indicate significance at the 95% level.
BASE: All respondents
Major positive
Minor positive
Not a positive outcome
Not applicable / not sure
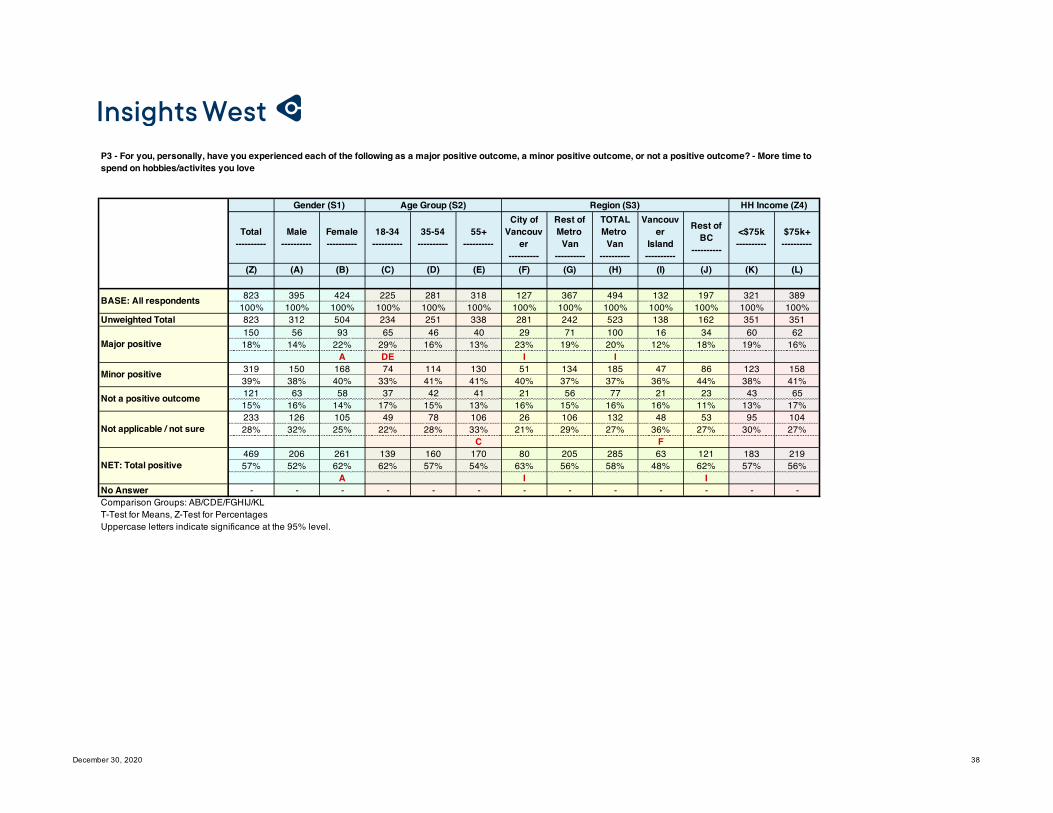
P3 - For you, personally, have you experienced each of the following as a major positive outcome, a minor positive outcome, or not a positive outcome? - More time to spend on hobbies/activites you love
Gender (S1) Age Group (S2) Region (S3) HH Income (Z4)

December 30, 2020 39
Total----------
Male----------
Female----------
18-34----------
35-54----------
55+----------
City ofVancouv
er----------
Rest ofMetro
Van----------
TOTALMetro
Van----------
Vancouver
Island----------
Rest ofBC
----------
<$75k----------
$75k+----------
(Z) (A) (B) (C) (D) (E) (F) (G) (H) (I) (J) (K) (L)
823 395 424 225 281 318 127 367 494 132 197 321 389100% 100% 100% 100% 100% 100% 100% 100% 100% 100% 100% 100% 100%
Unweighted Total 823 312 504 234 251 338 281 242 523 138 162 351 351160 65 95 32 74 54 30 74 104 20 37 44 9119% 16% 22% 14% 26% 17% 24% 20% 21% 15% 19% 14% 24%
CE K324 167 155 94 100 130 46 131 178 59 87 136 15339% 42% 37% 42% 36% 41% 37% 36% 36% 45% 44% 42% 39%93 41 52 33 29 30 13 37 50 11 32 26 54
11% 10% 12% 15% 10% 10% 10% 10% 10% 8% 16% 8% 14%K
246 122 122 66 78 103 38 125 163 42 41 115 9130% 31% 29% 29% 28% 32% 30% 34% 33% 32% 21% 36% 23%
J J L484 232 250 126 174 185 76 205 281 79 123 180 24459% 59% 59% 56% 62% 58% 60% 56% 57% 60% 63% 56% 63%
No Answer - - - - - - - - - - - - -
NET: Total positive
Comparison Groups: AB/CDE/FGHIJ/KLT-Test for Means, Z-Test for PercentagesUppercase letters indicate significance at the 95% level.
BASE: All respondents
Major positive
Minor positive
Not a positive outcome
Not applicable / not sure
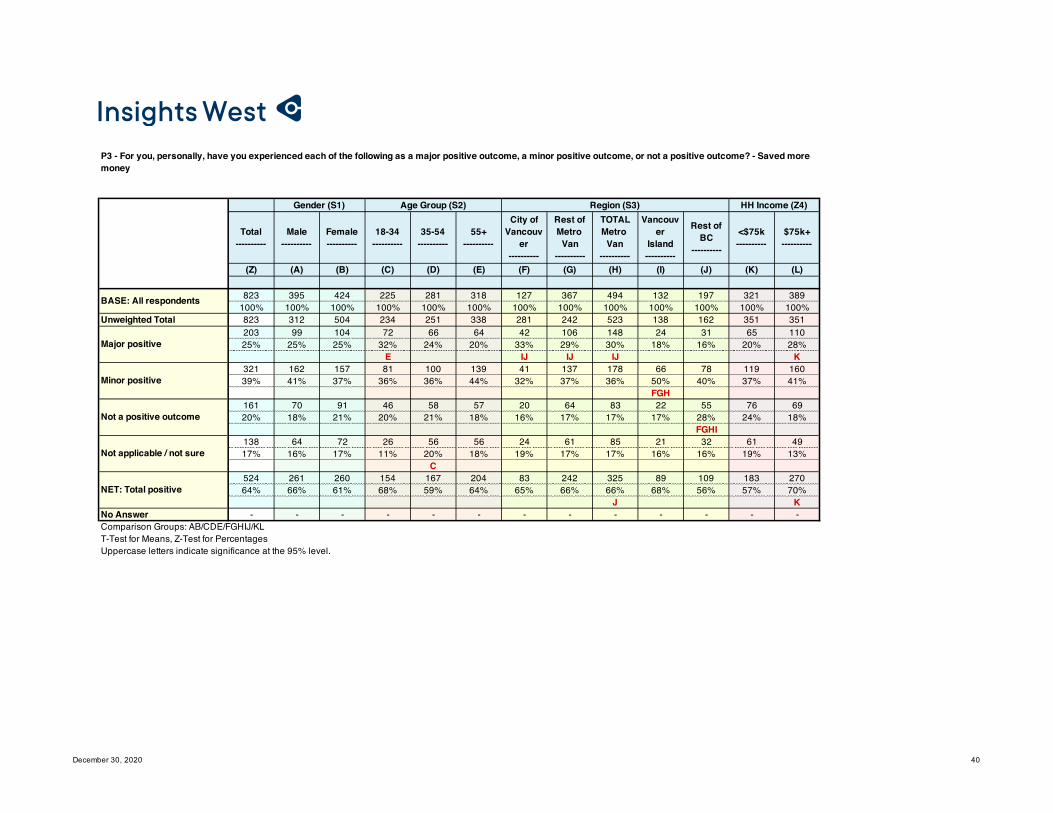
P3 - For you, personally, have you experienced each of the following as a major positive outcome, a minor positive outcome, or not a positive outcome? - Improvements to house/garden (including renovations, decorating, cleanliness etc.)
Gender (S1) Age Group (S2) Region (S3) HH Income (Z4)
December 30, 2020 40
Total----------
Male----------
Female----------
18-34----------
35-54----------
55+----------
City ofVancouv
er----------
Rest ofMetro
Van----------
TOTALMetro
Van----------
Vancouver
Island----------
Rest ofBC
----------
<$75k----------
$75k+----------
(Z) (A) (B) (C) (D) (E) (F) (G) (H) (I) (J) (K) (L)
823 395 424 225 281 318 127 367 494 132 197 321 389100% 100% 100% 100% 100% 100% 100% 100% 100% 100% 100% 100% 100%
Unweighted Total 823 312 504 234 251 338 281 242 523 138 162 351 351203 99 104 72 66 64 42 106 148 24 31 65 11025% 25% 25% 32% 24% 20% 33% 29% 30% 18% 16% 20% 28%
E IJ IJ IJ K321 162 157 81 100 139 41 137 178 66 78 119 16039% 41% 37% 36% 36% 44% 32% 37% 36% 50% 40% 37% 41%
FGH161 70 91 46 58 57 20 64 83 22 55 76 6920% 18% 21% 20% 21% 18% 16% 17% 17% 17% 28% 24% 18%
FGHI138 64 72 26 56 56 24 61 85 21 32 61 4917% 16% 17% 11% 20% 18% 19% 17% 17% 16% 16% 19% 13%
C524 261 260 154 167 204 83 242 325 89 109 183 27064% 66% 61% 68% 59% 64% 65% 66% 66% 68% 56% 57% 70%
J KNo Answer - - - - - - - - - - - - -
NET: Total positive
Comparison Groups: AB/CDE/FGHIJ/KLT-Test for Means, Z-Test for PercentagesUppercase letters indicate significance at the 95% level.
BASE: All respondents
Major positive
Minor positive
Not a positive outcome
Not applicable / not sure
P3 - For you, personally, have you experienced each of the following as a major positive outcome, a minor positive outcome, or not a positive outcome? - Saved more money
Gender (S1) Age Group (S2) Region (S3) HH Income (Z4)

December 30, 2020 41
Total----------
Male----------
Female----------
18-34----------
35-54----------
55+----------
City ofVancouv
er----------
Rest ofMetro
Van----------
TOTALMetro
Van----------
Vancouver
Island----------
Rest ofBC
----------
<$75k----------
$75k+----------
(Z) (A) (B) (C) (D) (E) (F) (G) (H) (I) (J) (K) (L)
823 395 424 225 281 318 127 367 494 132 197 321 389100% 100% 100% 100% 100% 100% 100% 100% 100% 100% 100% 100% 100%
Unweighted Total 823 312 504 234 251 338 281 242 523 138 162 351 351168 75 93 54 57 58 29 82 111 17 41 66 7820% 19% 22% 24% 20% 18% 23% 22% 22% 13% 21% 21% 20%
I I346 179 166 72 124 150 47 149 196 63 87 129 17542% 45% 39% 32% 44% 47% 37% 41% 40% 48% 44% 40% 45%
C C127 50 75 51 44 32 21 59 80 23 25 58 5515% 13% 18% 23% 16% 10% 16% 16% 16% 17% 13% 18% 14%
E182 92 89 48 56 78 30 77 108 30 44 68 8022% 23% 21% 21% 20% 25% 24% 21% 22% 22% 22% 21% 21%514 254 260 126 180 208 76 231 307 80 128 195 25362% 64% 61% 56% 64% 65% 60% 63% 62% 60% 65% 61% 65%
No Answer - - - - - - - - - - - - -
NET: Total positive
Comparison Groups: AB/CDE/FGHIJ/KLT-Test for Means, Z-Test for PercentagesUppercase letters indicate significance at the 95% level.
BASE: All respondents
Major positive
Minor positive
Not a positive outcome
Not applicable / not sure
P3 - For you, personally, have you experienced each of the following as a major positive outcome, a minor positive outcome, or not a positive outcome? - Spent more carefully
Gender (S1) Age Group (S2) Region (S3) HH Income (Z4)

December 30, 2020 42
Total----------
Male----------
Female----------
18-34----------
35-54----------
55+----------
City ofVancouv
er----------
Rest ofMetro
Van----------
TOTALMetro
Van----------
Vancouver
Island----------
Rest ofBC
----------
<$75k----------
$75k+----------
(Z) (A) (B) (C) (D) (E) (F) (G) (H) (I) (J) (K) (L)
823 395 424 225 281 318 127 367 494 132 197 321 389100% 100% 100% 100% 100% 100% 100% 100% 100% 100% 100% 100% 100%
Unweighted Total 823 312 504 234 251 338 281 242 523 138 162 351 351218 86 132 69 66 83 35 105 140 26 52 77 10827% 22% 31% 31% 24% 26% 28% 29% 28% 20% 26% 24% 28%
A341 179 160 83 127 131 53 156 209 51 82 133 16241% 45% 38% 37% 45% 41% 42% 42% 42% 39% 42% 41% 42%101 48 52 29 32 40 13 45 58 23 21 45 4412% 12% 12% 13% 11% 13% 10% 12% 12% 17% 10% 14% 11%162 83 80 43 55 64 26 61 87 33 43 66 7420% 21% 19% 19% 20% 20% 20% 17% 18% 25% 22% 21% 19%559 265 292 152 193 214 88 261 349 77 133 209 27068% 67% 69% 68% 69% 67% 69% 71% 71% 58% 68% 65% 70%
I INo Answer - - - - - - - - - - - - -
NET: Total positive
Comparison Groups: AB/CDE/FGHIJ/KLT-Test for Means, Z-Test for PercentagesUppercase letters indicate significance at the 95% level.
BASE: All respondents
Major positive
Minor positive
Not a positive outcome
Not applicable / not sure
P3 - For you, personally, have you experienced each of the following as a major positive outcome, a minor positive outcome, or not a positive outcome? - Cooked more/better meals or baked more/better instead of eating out
Gender (S1) Age Group (S2) Region (S3) HH Income (Z4)

December 30, 2020 43
Total----------
Male----------
Female----------
18-34----------
35-54----------
55+----------
City ofVancouv
er----------
Rest ofMetro
Van----------
TOTALMetro
Van----------
Vancouver
Island----------
Rest ofBC
----------
<$75k----------
$75k+----------
(Z) (A) (B) (C) (D) (E) (F) (G) (H) (I) (J) (K) (L)
823 395 424 225 281 318 127 367 494 132 197 321 389100% 100% 100% 100% 100% 100% 100% 100% 100% 100% 100% 100% 100%
Unweighted Total 823 312 504 234 251 338 281 242 523 138 162 351 351113 53 58 29 35 49 15 53 68 17 28 35 5814% 14% 14% 13% 13% 15% 12% 14% 14% 12% 14% 11% 15%274 127 146 66 96 111 45 123 168 40 65 119 11433% 32% 34% 29% 34% 35% 36% 34% 34% 30% 33% 37% 29%234 111 121 85 77 72 36 103 138 39 56 87 12428% 28% 29% 38% 27% 23% 28% 28% 28% 30% 29% 27% 32%
DE203 103 99 45 72 85 31 88 119 36 48 81 9325% 26% 23% 20% 26% 27% 24% 24% 24% 28% 24% 25% 24%386 181 204 95 132 160 60 176 237 57 93 154 17247% 46% 48% 42% 47% 50% 48% 48% 48% 43% 47% 48% 44%
No Answer - - - - - - - - - - - - -
NET: Total positive
Comparison Groups: AB/CDE/FGHIJ/KLT-Test for Means, Z-Test for PercentagesUppercase letters indicate significance at the 95% level.
BASE: All respondents
Major positive
Minor positive
Not a positive outcome
Not applicable / not sure
P3 - For you, personally, have you experienced each of the following as a major positive outcome, a minor positive outcome, or not a positive outcome? - Healthier eating habits
Gender (S1) Age Group (S2) Region (S3) HH Income (Z4)

December 30, 2020 44
Total----------
Male----------
Female----------
18-34----------
35-54----------
55+----------
City ofVancouv
er----------
Rest ofMetro
Van----------
TOTALMetro
Van----------
Vancouver
Island----------
Rest ofBC
----------
<$75k----------
$75k+----------
(Z) (A) (B) (C) (D) (E) (F) (G) (H) (I) (J) (K) (L)
823 395 424 225 281 318 127 367 494 132 197 321 389100% 100% 100% 100% 100% 100% 100% 100% 100% 100% 100% 100% 100%
Unweighted Total 823 312 504 234 251 338 281 242 523 138 162 351 35157 12 45 20 24 12 11 21 32 10 15 32 217% 3% 11% 9% 9% 4% 8% 6% 6% 7% 8% 10% 5%
A E20 8 13 9 8 3 6 8 14 2 5 5 132% 2% 3% 4% 3% 1% 5% 2% 3% 1% 2% 2% 3%40 28 12 20 11 9 6 23 29 7 4 13 225% 7% 3% 9% 4% 3% 5% 6% 6% 6% 2% 4% 6%
B E J J706 348 354 176 238 293 104 315 419 114 173 270 33386% 88% 84% 78% 85% 92% 82% 86% 85% 86% 88% 84% 86%
CD77 19 58 30 32 15 17 29 46 11 20 38 349% 5% 14% 13% 11% 5% 13% 8% 9% 8% 10% 12% 9%
A E ENo Answer - - - - - - - - - - - - -
NET: Total positive
Comparison Groups: AB/CDE/FGHIJ/KLT-Test for Means, Z-Test for PercentagesUppercase letters indicate significance at the 95% level.
BASE: All respondents
Major positive
Minor positive
Not a positive outcome
Not applicable / not sure
P3 - For you, personally, have you experienced each of the following as a major positive outcome, a minor positive outcome, or not a positive outcome? - Got a new pet
Gender (S1) Age Group (S2) Region (S3) HH Income (Z4)

December 30, 2020 45
Total----------
Male----------
Female----------
18-34----------
35-54----------
55+----------
City ofVancouv
er----------
Rest ofMetro
Van----------
TOTALMetro
Van----------
Vancouver
Island----------
Rest ofBC
----------
<$75k----------
$75k+----------
(Z) (A) (B) (C) (D) (E) (F) (G) (H) (I) (J) (K) (L)
823 395 424 225 281 318 127 367 494 132 197 321 389100% 100% 100% 100% 100% 100% 100% 100% 100% 100% 100% 100% 100%
Unweighted Total 823 312 504 234 251 338 281 242 523 138 162 351 351199 64 133 54 81 63 37 75 112 36 51 84 9024% 16% 31% 24% 29% 20% 29% 20% 23% 27% 26% 26% 23%
A E135 78 57 30 48 57 16 44 60 26 49 49 7016% 20% 13% 13% 17% 18% 12% 12% 12% 20% 25% 15% 18%
FGH30 19 11 12 4 14 2 17 19 7 4 8 184% 5% 3% 5% 1% 5% 2% 5% 4% 5% 2% 2% 5%
D D460 235 222 129 148 183 72 232 304 64 92 179 21156% 60% 52% 57% 53% 58% 57% 63% 61% 48% 47% 56% 54%
IJ IJ334 141 190 84 129 120 53 119 172 62 100 134 15941% 36% 45% 37% 46% 38% 42% 32% 35% 47% 51% 42% 41%
A GH GHNo Answer - - - - - - - - - - - - -
NET: Total positive
Comparison Groups: AB/CDE/FGHIJ/KLT-Test for Means, Z-Test for PercentagesUppercase letters indicate significance at the 95% level.
BASE: All respondents
Major positive
Minor positive
Not a positive outcome
Not applicable / not sure
P3 - For you, personally, have you experienced each of the following as a major positive outcome, a minor positive outcome, or not a positive outcome? - Spent more time with your pet(s)
Gender (S1) Age Group (S2) Region (S3) HH Income (Z4)
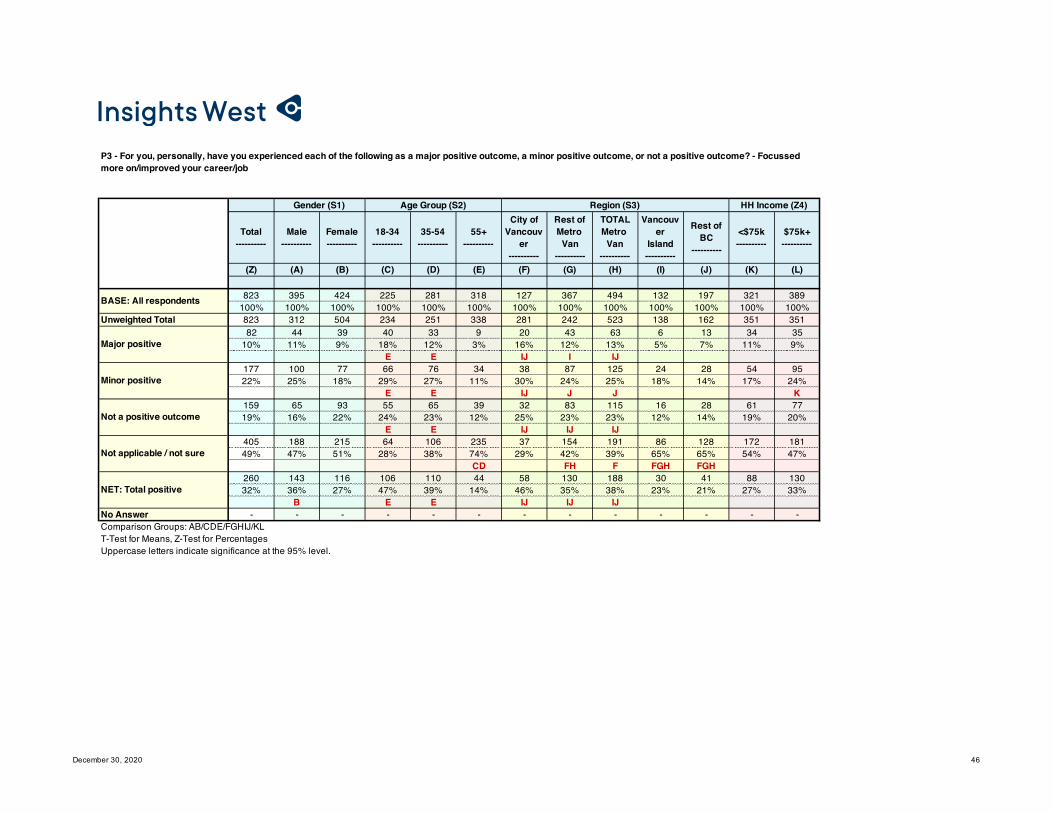
December 30, 2020 46
Total----------
Male----------
Female----------
18-34----------
35-54----------
55+----------
City ofVancouv
er----------
Rest ofMetro
Van----------
TOTALMetro
Van----------
Vancouver
Island----------
Rest ofBC
----------
<$75k----------
$75k+----------
(Z) (A) (B) (C) (D) (E) (F) (G) (H) (I) (J) (K) (L)
823 395 424 225 281 318 127 367 494 132 197 321 389100% 100% 100% 100% 100% 100% 100% 100% 100% 100% 100% 100% 100%
Unweighted Total 823 312 504 234 251 338 281 242 523 138 162 351 35182 44 39 40 33 9 20 43 63 6 13 34 35
10% 11% 9% 18% 12% 3% 16% 12% 13% 5% 7% 11% 9%E E IJ I IJ
177 100 77 66 76 34 38 87 125 24 28 54 9522% 25% 18% 29% 27% 11% 30% 24% 25% 18% 14% 17% 24%
E E IJ J J K159 65 93 55 65 39 32 83 115 16 28 61 7719% 16% 22% 24% 23% 12% 25% 23% 23% 12% 14% 19% 20%
E E IJ IJ IJ405 188 215 64 106 235 37 154 191 86 128 172 18149% 47% 51% 28% 38% 74% 29% 42% 39% 65% 65% 54% 47%
CD FH F FGH FGH260 143 116 106 110 44 58 130 188 30 41 88 13032% 36% 27% 47% 39% 14% 46% 35% 38% 23% 21% 27% 33%
B E E IJ IJ IJNo Answer - - - - - - - - - - - - -
NET: Total positive
Comparison Groups: AB/CDE/FGHIJ/KLT-Test for Means, Z-Test for PercentagesUppercase letters indicate significance at the 95% level.
BASE: All respondents
Major positive
Minor positive
Not a positive outcome
Not applicable / not sure
P3 - For you, personally, have you experienced each of the following as a major positive outcome, a minor positive outcome, or not a positive outcome? - Focussed more on/improved your career/job
Gender (S1) Age Group (S2) Region (S3) HH Income (Z4)

December 30, 2020 47
Total----------
Male----------
Female----------
18-34----------
35-54----------
55+----------
City ofVancouv
er----------
Rest ofMetro
Van----------
TOTALMetro
Van----------
Vancouver
Island----------
Rest ofBC
----------
<$75k----------
$75k+----------
(Z) (A) (B) (C) (D) (E) (F) (G) (H) (I) (J) (K) (L)
823 395 424 225 281 318 127 367 494 132 197 321 389100% 100% 100% 100% 100% 100% 100% 100% 100% 100% 100% 100% 100%
Unweighted Total 823 312 504 234 251 338 281 242 523 138 162 351 351222 81 140 87 98 37 51 116 167 23 31 65 12027% 21% 33% 39% 35% 12% 40% 32% 34% 17% 16% 20% 31%
A E E IJ IJ IJ K141 84 56 57 56 28 38 68 106 14 21 50 7217% 21% 13% 25% 20% 9% 30% 19% 22% 11% 10% 16% 18%
B E E GHIJ IJ GIJ70 33 36 27 24 19 10 31 41 9 19 30 338% 8% 9% 12% 9% 6% 8% 8% 8% 7% 10% 9% 8%
E390 197 192 54 102 234 28 152 179 86 125 176 16447% 50% 45% 24% 36% 74% 22% 41% 36% 65% 64% 55% 42%
C CD FH F FGH FGH L363 165 195 144 154 65 89 185 274 37 52 115 19244% 42% 46% 64% 55% 20% 70% 50% 55% 28% 26% 36% 49%
E E GHIJ IJ GIJ KNo Answer - - - - - - - - - - - - -
NET: Total positive
Comparison Groups: AB/CDE/FGHIJ/KLT-Test for Means, Z-Test for PercentagesUppercase letters indicate significance at the 95% level.
BASE: All respondents
Major positive
Minor positive
Not a positive outcome
Not applicable / not sure
P3 - For you, personally, have you experienced each of the following as a major positive outcome, a minor positive outcome, or not a positive outcome? - Various benefits of working from home (no commute, comfortable clothing, fewer distractions etc.)
Gender (S1) Age Group (S2) Region (S3) HH Income (Z4)

December 30, 2020 48
Total----------
Male----------
Female----------
18-34----------
35-54----------
55+----------
City ofVancouv
er----------
Rest ofMetro
Van----------
TOTALMetro
Van----------
Vancouver
Island----------
Rest ofBC
----------
<$75k----------
$75k+----------
(Z) (A) (B) (C) (D) (E) (F) (G) (H) (I) (J) (K) (L)
823 395 424 225 281 318 127 367 494 132 197 321 389100% 100% 100% 100% 100% 100% 100% 100% 100% 100% 100% 100% 100%
Unweighted Total 823 312 504 234 251 338 281 242 523 138 162 351 351188 70 116 62 71 55 36 80 117 25 46 74 8123% 18% 27% 28% 25% 17% 29% 22% 24% 19% 23% 23% 21%
A E296 150 146 83 90 124 41 151 192 43 61 112 14236% 38% 34% 37% 32% 39% 32% 41% 39% 33% 31% 35% 37%120 74 46 34 42 45 22 42 64 24 33 45 6715% 19% 11% 15% 15% 14% 17% 11% 13% 18% 17% 14% 17%
B219 102 116 47 78 94 28 94 122 40 57 89 9927% 26% 27% 21% 28% 30% 22% 26% 25% 30% 29% 28% 25%484 219 262 145 160 179 77 231 308 69 107 187 22359% 55% 62% 64% 57% 56% 61% 63% 62% 52% 54% 58% 57%
No Answer - - - - - - - - - - - - -
NET: Total positive
Comparison Groups: AB/CDE/FGHIJ/KLT-Test for Means, Z-Test for PercentagesUppercase letters indicate significance at the 95% level.
BASE: All respondents
Major positive
Minor positive
Not a positive outcome
Not applicable / not sure
P3 - For you, personally, have you experienced each of the following as a major positive outcome, a minor positive outcome, or not a positive outcome? - Done things to be less negative impact on the environment/reduced environmental footprint
Gender (S1) Age Group (S2) Region (S3) HH Income (Z4)
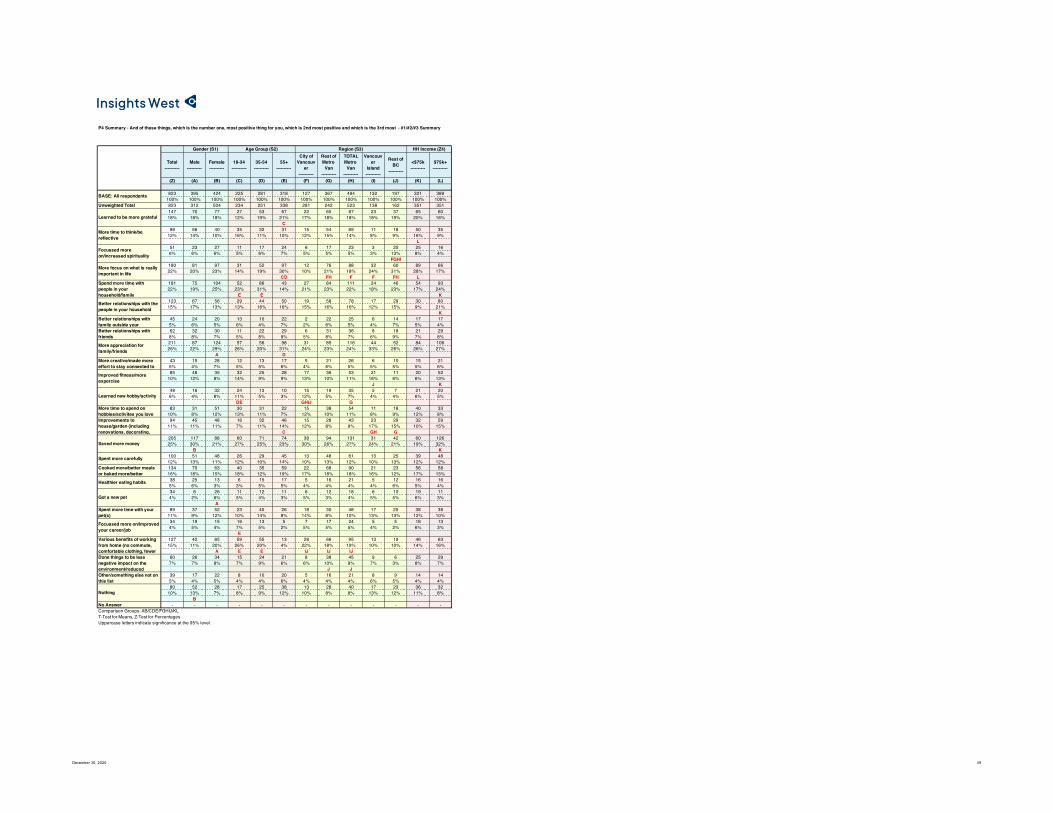
December 30, 2020 49
Total----------
Male----------
Female----------
18-34----------
35-54----------
55+----------
City ofVancouv
er----------
Rest ofMetro
Van----------
TOTALMetro
Van----------
Vancouver
Island----------
Rest ofBC
----------
<$75k----------
$75k+----------
(Z) (A) (B) (C) (D) (E) (F) (G) (H) (I) (J) (K) (L)
823 395 424 225 281 318 127 367 494 132 197 321 389100% 100% 100% 100% 100% 100% 100% 100% 100% 100% 100% 100% 100%
Unweighted Total 823 312 504 234 251 338 281 242 523 138 162 351 351147 70 77 27 53 67 22 65 87 23 37 65 6018% 18% 18% 12% 19% 21% 17% 18% 18% 18% 19% 20% 16%
C98 56 40 35 32 31 15 54 69 11 18 50 35
12% 14% 10% 16% 11% 10% 12% 15% 14% 8% 9% 16% 9%L
51 23 27 11 17 24 6 17 23 3 25 25 166% 6% 6% 5% 6% 7% 5% 5% 5% 3% 13% 8% 4%
FGHI180 81 97 31 52 97 12 76 88 32 60 89 6622% 20% 23% 14% 19% 30% 10% 21% 18% 24% 31% 28% 17%
CD FH F F FH L181 75 104 52 86 43 27 84 111 24 46 54 9322% 19% 25% 23% 31% 14% 21% 23% 22% 18% 23% 17% 24%
E E K123 67 56 29 44 50 19 58 78 17 29 30 8015% 17% 13% 13% 16% 16% 15% 16% 16% 12% 15% 9% 21%
K45 24 20 13 10 22 2 22 25 6 14 17 175% 6% 5% 6% 4% 7% 2% 6% 5% 4% 7% 5% 4%62 32 30 11 22 29 6 31 36 8 18 21 298% 8% 7% 5% 8% 9% 5% 8% 7% 6% 9% 7% 8%211 87 124 57 56 98 31 85 116 44 52 84 10626% 22% 29% 26% 20% 31% 24% 23% 24% 33% 26% 26% 27%
A D43 15 28 12 13 17 5 21 26 6 10 15 215% 4% 7% 5% 5% 6% 4% 6% 5% 5% 5% 5% 6%85 48 35 32 25 28 17 36 53 21 11 20 52
10% 12% 8% 14% 9% 9% 13% 10% 11% 16% 6% 6% 13%J K
48 16 32 24 13 10 15 19 35 5 7 21 206% 4% 8% 11% 5% 3% 12% 5% 7% 4% 4% 6% 5%
DE GHIJ G83 31 51 30 31 22 15 38 54 11 18 40 33
10% 8% 12% 13% 11% 7% 12% 10% 11% 8% 9% 12% 8%94 45 48 16 32 46 15 28 43 23 29 32 59
11% 11% 11% 7% 11% 14% 12% 8% 9% 17% 15% 10% 15%C GH G
205 117 88 60 71 74 38 94 131 31 42 60 12625% 30% 21% 27% 25% 23% 30% 26% 27% 24% 21% 19% 32%
B K100 51 48 26 29 45 13 48 61 13 25 39 4812% 13% 11% 12% 10% 14% 10% 13% 12% 10% 13% 12% 12%134 70 63 40 35 59 22 68 90 21 23 56 5816% 18% 15% 18% 12% 19% 17% 18% 18% 16% 12% 17% 15%38 25 13 6 15 17 5 16 21 5 12 16 165% 6% 3% 3% 5% 5% 4% 4% 4% 4% 6% 5% 4%34 8 26 11 12 11 6 12 18 6 10 19 114% 2% 6% 5% 4% 3% 5% 3% 4% 5% 5% 6% 3%
A89 37 52 23 40 26 18 30 48 17 25 38 38
11% 9% 12% 10% 14% 8% 14% 8% 10% 13% 13% 12% 10%34 19 15 16 13 5 7 17 24 5 5 18 134% 5% 4% 7% 5% 2% 5% 5% 5% 4% 2% 6% 3%
E127 42 85 59 55 13 28 66 95 13 19 46 6315% 11% 20% 26% 20% 4% 22% 18% 19% 10% 10% 14% 16%
A E E IJ IJ IJ60 26 34 15 24 21 8 38 45 9 6 25 297% 7% 8% 7% 9% 6% 6% 10% 9% 7% 3% 8% 7%
J J39 17 22 8 10 20 5 16 21 8 9 14 145% 4% 5% 4% 4% 6% 4% 4% 4% 6% 5% 4% 4%80 52 28 17 25 38 13 28 40 17 23 36 32
10% 13% 7% 8% 9% 12% 10% 8% 8% 13% 12% 11% 8%B
No Answer - - - - - - - - - - - - -
Nothing
Comparison Groups: AB/CDE/FGHIJ/KLT-Test for Means, Z-Test for PercentagesUppercase letters indicate significance at the 95% level.
Spent more time with your pet(s)
Focussed more on/improved your career/job
Various benefits of working from home (no commute, comfortable clothing, fewer Done things to be less negative impact on the environment/reduced Other/something else not on this list
Saved more money
Spent more carefully
Cooked more/better meals or baked more/better
Healthier eating habits
Got a new pet
More creative/made more effort to stay connected to
Improved fitness/more expercise
Learned new hobby/activity
More time to spend on hobbies/activites you loveImprovements to house/garden (including renovations, decorating,
Spend more time with people in your household/family
Better relationships with the people in your household
Better relationships with family outside your Better relationships with friends
More appreciation for family/friends
BASE: All respondents
Learned to be more grateful
More time to think/be reflective
Focussed more on/increased spirituality
More focus on what is really important in life
P4 Summary - And of these things, which is the number one, most positive thing for you, which is 2nd most positive and which is the 3rd most - #1/#2/#3 Summary
Gender (S1) Age Group (S2) Region (S3) HH Income (Z4)

December 30, 2020 50
Total----------
Male----------
Female----------
18-34----------
35-54----------
55+----------
City ofVancouv
er----------
Rest ofMetro
Van----------
TOTALMetro
Van----------
Vancouver
Island----------
Rest ofBC
----------
<$75k----------
$75k+----------
(Z) (A) (B) (C) (D) (E) (F) (G) (H) (I) (J) (K) (L)
823 395 424 225 281 318 127 367 494 132 197 321 389100% 100% 100% 100% 100% 100% 100% 100% 100% 100% 100% 100% 100%
Unweighted Total 823 312 504 234 251 338 281 242 523 138 162 351 35157 29 28 14 19 23 9 22 31 9 17 22 277% 7% 7% 6% 7% 7% 7% 6% 6% 7% 9% 7% 7%33 18 15 14 8 11 7 11 18 5 10 17 134% 4% 4% 6% 3% 3% 5% 3% 4% 4% 5% 5% 3%25 14 11 6 12 7 4 12 15 2 7 10 93% 3% 3% 3% 4% 2% 3% 3% 3% 2% 4% 3% 2%85 41 44 7 22 55 4 33 37 14 34 44 29
10% 10% 10% 3% 8% 17% 3% 9% 7% 11% 17% 14% 7%CD FH F F FGH L
111 43 66 34 51 25 13 58 71 11 28 38 5413% 11% 16% 15% 18% 8% 10% 16% 14% 9% 14% 12% 14%
E E I40 24 15 14 12 14 7 12 19 12 8 10 275% 6% 4% 6% 4% 4% 6% 3% 4% 9% 4% 3% 7%
G12 3 9 0 5 7 0 8 8 2 2 5 31% 1% 2% 0% 2% 2% 0% 2% 2% 2% 1% 2% 1%13 5 7 8 2 3 1 9 10 - 3 7 22% 1% 2% 3% 1% 1% 1% 2% 2% 1% 2% 0%70 26 43 18 15 38 6 32 38 14 18 24 369% 7% 10% 8% 5% 12% 5% 9% 8% 11% 9% 7% 9%
D12 5 6 3 2 6 1 7 8 3 1 4 51% 1% 2% 2% 1% 2% 1% 2% 2% 2% 1% 1% 1%24 16 8 5 9 10 7 9 16 8 0 2 193% 4% 2% 2% 3% 3% 5% 3% 3% 6% 0% 1% 5%
J J J K13 3 11 3 5 5 4 6 10 2 2 9 32% 1% 3% 1% 2% 2% 3% 2% 2% 1% 1% 3% 1%23 16 7 7 10 5 5 10 15 5 3 9 113% 4% 2% 3% 4% 2% 4% 3% 3% 4% 2% 3% 3%27 13 14 3 13 11 4 13 16 5 6 10 173% 3% 3% 1% 5% 3% 3% 3% 3% 3% 3% 3% 4%
C70 43 27 29 21 19 15 31 46 13 12 21 419% 11% 6% 13% 8% 6% 12% 8% 9% 9% 6% 7% 11%
E14 10 5 3 5 7 1 8 9 3 3 6 62% 2% 1% 1% 2% 2% 1% 2% 2% 2% 1% 2% 2%32 15 17 12 3 16 10 14 24 3 5 12 124% 4% 4% 5% 1% 5% 8% 4% 5% 2% 2% 4% 3%
D D IJ10 9 1 - 5 5 0 4 5 2 3 7 31% 2% 0% 2% 1% 0% 1% 1% 1% 2% 2% 1%
B17 7 10 8 5 4 3 6 9 3 5 8 82% 2% 2% 3% 2% 1% 3% 2% 2% 2% 2% 3% 2%26 6 20 2 15 9 5 10 16 5 6 13 113% 2% 5% 1% 5% 3% 4% 3% 3% 3% 3% 4% 3%
A7 4 3 3 3 1 4 2 6 1 - 5 2
1% 1% 1% 1% 1% 0% 3% 0% 1% 1% 1% 1%GH G
47 15 31 19 24 4 11 27 38 3 6 17 256% 4% 7% 9% 9% 1% 8% 7% 8% 3% 3% 5% 6%
E E I I IJ14 6 7 2 3 8 1 9 9 1 3 7 62% 2% 2% 1% 1% 3% 1% 2% 2% 1% 2% 2% 1%10 4 5 3 1 6 2 5 7 1 2 2 51% 1% 1% 1% 0% 2% 1% 1% 1% 1% 1% 1% 1%34 22 12 5 10 19 3 12 15 7 11 12 144% 6% 3% 2% 3% 6% 3% 3% 3% 5% 6% 4% 4%
No Answer - - - - - - - - - - - - -
Nothing
Comparison Groups: AB/CDE/FGHIJ/KLT-Test for Means, Z-Test for PercentagesUppercase letters indicate significance at the 95% level.
Spent more time with your pet(s)
Focussed more on/improved your career/job
Various benefits of working from home (no commute, comfortable clothing, fewer Done things to be less negative impact on the Other/something else not on this list
Saved more money
Spent more carefully
Cooked more/better meals or baked more/better instead of eating out
Healthier eating habits
Got a new pet
More creative/made more effort to stay connected to
Improved fitness/more expercise
Learned new hobby/activity
More time to spend on hobbies/activites you loveImprovements to house/garden (including renovations, decorating,
Spend more time with people in your household/family
Better relationships with the people in your household
Better relationships with family outside your Better relationships with friends
More appreciation for family/friends
BASE: All respondents
Learned to be more grateful
More time to think/be reflectiveFocussed more on/increased spirituality
More focus on what is really important in life
P4 - And of these things, which is the number one, most positive thing for you, which is 2nd most positive and which is the 3rd most - #1
Gender (S1) Age Group (S2) Region (S3) HH Income (Z4)

December 30, 2020 51
Total----------
Male----------
Female----------
18-34----------
35-54----------
55+----------
City ofVancouv
er----------
Rest ofMetro
Van----------
TOTALMetro
Van----------
Vancouver
Island----------
Rest ofBC
----------
<$75k----------
$75k+----------
(Z) (A) (B) (C) (D) (E) (F) (G) (H) (I) (J) (K) (L)
823 395 424 225 281 318 127 367 494 132 197 321 389100% 100% 100% 100% 100% 100% 100% 100% 100% 100% 100% 100% 100%
Unweighted Total 823 312 504 234 251 338 281 242 523 138 162 351 35149 22 27 7 20 22 8 28 36 8 5 23 206% 6% 6% 3% 7% 7% 6% 8% 7% 6% 3% 7% 5%
J J29 16 12 11 10 8 5 19 23 4 2 16 94% 4% 3% 5% 3% 3% 4% 5% 5% 3% 1% 5% 2%
J J20 9 11 3 2 15 1 4 5 1 13 10 62% 2% 3% 1% 1% 5% 1% 1% 1% 1% 7% 3% 2%
CD FGHI55 23 32 16 15 24 5 23 29 7 19 24 257% 6% 8% 7% 5% 8% 4% 6% 6% 6% 10% 7% 6%44 24 21 12 20 12 11 10 21 11 13 10 275% 6% 5% 5% 7% 4% 8% 3% 4% 8% 7% 3% 7%
GH G62 32 30 7 24 31 8 33 41 3 18 18 378% 8% 7% 3% 9% 10% 6% 9% 8% 2% 9% 5% 10%
C C I I I21 14 7 9 3 9 2 9 11 2 9 7 103% 4% 2% 4% 1% 3% 1% 2% 2% 1% 4% 2% 3%30 11 19 1 13 15 1 16 16 5 9 10 154% 3% 4% 1% 5% 5% 1% 4% 3% 4% 4% 3% 4%
C C FH F F82 39 43 23 27 32 13 32 44 17 21 35 42
10% 10% 10% 10% 10% 10% 10% 9% 9% 13% 11% 11% 11%16 6 10 2 10 4 2 7 9 2 5 7 82% 2% 2% 1% 4% 1% 1% 2% 2% 2% 3% 2% 2%28 16 12 9 8 11 6 7 13 9 6 13 133% 4% 3% 4% 3% 3% 5% 2% 3% 7% 3% 4% 3%15 2 13 11 3 1 5 9 15 - - 4 82% 0% 3% 5% 1% 0% 4% 3% 3% 1% 2%
A DE27 5 21 11 7 9 3 14 17 3 6 13 123% 1% 5% 5% 3% 3% 3% 4% 3% 3% 3% 4% 3%
A40 23 17 8 14 18 8 11 18 13 8 11 265% 6% 4% 4% 5% 6% 6% 3% 4% 10% 4% 4% 7%
GH62 31 31 17 19 26 11 33 44 7 12 22 338% 8% 7% 8% 7% 8% 9% 9% 9% 5% 6% 7% 8%39 21 17 12 15 11 4 20 24 4 11 12 215% 5% 4% 5% 5% 4% 3% 5% 5% 3% 6% 4% 5%36 17 18 10 10 16 5 20 24 8 4 17 144% 4% 4% 4% 4% 5% 4% 5% 5% 6% 2% 5% 4%15 7 7 5 4 6 2 8 9 1 4 4 62% 2% 2% 2% 1% 2% 1% 2% 2% 1% 2% 1% 2%6 - 6 3 1 2 0 3 3 - 3 6 -
1% 2% 1% 0% 1% 0% 1% 1% 2% 2%26 12 14 13 10 3 8 8 16 6 4 10 83% 3% 3% 6% 4% 1% 6% 2% 3% 4% 2% 3% 2%
E GH G12 10 2 6 4 2 2 8 10 - 2 5 41% 2% 1% 3% 1% 1% 2% 2% 2% 1% 1% 1%
E41 16 25 16 20 5 7 20 27 5 9 16 195% 4% 6% 7% 7% 2% 5% 6% 5% 4% 5% 5% 5%
E E14 7 7 4 5 5 4 6 9 3 1 5 62% 2% 2% 2% 2% 2% 3% 2% 2% 2% 1% 1% 1%12 7 5 2 2 9 0 6 7 1 4 4 21% 2% 1% 1% 1% 3% 0% 2% 1% 1% 2% 1% 0%42 26 16 9 13 20 6 15 21 12 9 19 175% 7% 4% 4% 5% 6% 5% 4% 4% 9% 4% 6% 4%
No Answer - - - - - - - - - - - - -
Nothing
Comparison Groups: AB/CDE/FGHIJ/KLT-Test for Means, Z-Test for PercentagesUppercase letters indicate significance at the 95% level.
Spent more time with your pet(s)
Focussed more on/improved your career/job
Various benefits of working from home (no commute, comfortable clothing, fewer Done things to be less negative impact on the Other/something else not on this list
Saved more money
Spent more carefully
Cooked more/better meals or baked more/better
Healthier eating habits
Got a new pet
More creative/made more effort to stay connected to Improved fitness/more expercise
Learned new hobby/activity
More time to spend on hobbies/activites you love
Improvements to house/garden (including renovations, decorating,
Spend more time with people in your household/family
Better relationships with the people in your household
Better relationships with family outside your
Better relationships with friends
More appreciation for family/friends
BASE: All respondents
Learned to be more grateful
More time to think/be reflective
Focussed more on/increased spirituality
More focus on what is really important in life
P4 - And of these things, which is the number one, most positive thing for you, which is 2nd most positive and which is the 3rd most - #2
Gender (S1) Age Group (S2) Region (S3) HH Income (Z4)

December 30, 2020 52
Total----------
Male----------
Female----------
18-34----------
35-54----------
55+----------
City ofVancouv
er----------
Rest ofMetro
Van----------
TOTALMetro
Van----------
Vancouver
Island----------
Rest ofBC
----------
<$75k----------
$75k+----------
(Z) (A) (B) (C) (D) (E) (F) (G) (H) (I) (J) (K) (L)
823 395 424 225 281 318 127 367 494 132 197 321 389100% 100% 100% 100% 100% 100% 100% 100% 100% 100% 100% 100% 100%
Unweighted Total 823 312 504 234 251 338 281 242 523 138 162 351 35142 20 22 7 14 22 6 15 21 7 14 20 135% 5% 5% 3% 5% 7% 5% 4% 4% 5% 7% 6% 3%37 23 13 10 15 12 4 24 29 3 6 18 134% 6% 3% 5% 5% 4% 3% 7% 6% 2% 3% 6% 3%
I I6 1 5 2 2 2 1 2 2 - 4 6 1
1% 0% 1% 1% 1% 1% 1% 0% 0% 2% 2% 0%40 17 22 8 15 17 3 19 22 10 7 22 125% 4% 5% 4% 5% 5% 3% 5% 5% 8% 4% 7% 3%26 8 18 6 14 6 3 16 19 2 4 5 123% 2% 4% 3% 5% 2% 3% 4% 4% 2% 2% 2% 3%21 11 10 8 8 5 4 13 18 2 2 3 163% 3% 2% 4% 3% 2% 3% 4% 4% 1% 1% 1% 4%
K12 7 5 4 2 6 1 5 6 2 4 4 51% 2% 1% 2% 1% 2% 1% 1% 1% 1% 2% 1% 1%20 15 4 2 7 11 4 6 10 3 7 4 132% 4% 1% 1% 2% 3% 3% 2% 2% 2% 4% 1% 3%
B60 22 38 17 16 28 12 23 35 13 13 27 287% 6% 9% 7% 6% 9% 9% 6% 7% 10% 6% 8% 7%15 4 11 6 1 8 2 8 10 1 4 5 82% 1% 3% 3% 0% 2% 2% 2% 2% 1% 2% 2% 2%33 16 15 18 9 7 4 19 24 4 5 6 194% 4% 4% 8% 3% 2% 3% 5% 5% 3% 3% 2% 5%
DE19 11 8 10 6 4 6 4 10 3 5 8 82% 3% 2% 4% 2% 1% 5% 1% 2% 3% 3% 2% 2%34 12 22 12 14 8 7 17 23 3 8 17 114% 3% 5% 5% 5% 3% 5% 5% 5% 2% 4% 5% 3%27 10 17 5 5 17 3 5 8 5 15 11 163% 3% 4% 2% 2% 5% 3% 1% 2% 4% 7% 3% 4%
GH73 44 29 14 30 29 12 31 42 12 18 16 519% 11% 7% 6% 11% 9% 9% 8% 9% 9% 9% 5% 13%
K46 20 27 11 9 27 8 21 28 6 12 21 216% 5% 6% 5% 3% 8% 6% 6% 6% 5% 6% 7% 5%
D66 38 28 18 22 26 8 34 42 9 15 27 338% 10% 7% 8% 8% 8% 6% 9% 8% 7% 8% 8% 8%14 9 5 1 6 7 3 4 7 2 5 5 72% 2% 1% 0% 2% 2% 3% 1% 1% 1% 2% 2% 2%11 1 10 - 6 5 2 3 5 4 2 5 41% 0% 2% 2% 1% 2% 1% 1% 3% 1% 1% 1%
A37 18 19 8 15 14 4 12 16 6 15 15 185% 5% 4% 4% 5% 5% 3% 3% 3% 5% 8% 5% 5%15 5 10 6 6 3 0 7 8 5 3 9 62% 1% 2% 3% 2% 1% 0% 2% 2% 4% 1% 3% 2%38 10 28 24 11 4 11 19 30 4 5 13 205% 3% 7% 11% 4% 1% 9% 5% 6% 3% 2% 4% 5%
A DE IJ34 13 20 9 17 8 3 23 26 5 2 14 184% 3% 5% 4% 6% 3% 2% 6% 5% 4% 1% 4% 5%
J J23 11 12 4 8 11 3 11 14 6 3 8 73% 3% 3% 2% 3% 3% 2% 3% 3% 4% 2% 2% 2%73 48 25 16 25 33 12 25 37 17 19 34 289% 12% 6% 7% 9% 10% 9% 7% 7% 13% 10% 11% 7%
BNo Answer - - - - - - - - - - - - -
Nothing
Comparison Groups: AB/CDE/FGHIJ/KLT-Test for Means, Z-Test for PercentagesUppercase letters indicate significance at the 95% level.
Spent more time with your pet(s)Focussed more on/improved your career/jobVarious benefits of working from home (no commute, comfortable clothing, fewer Done things to be less negative impact on the environment/reduced Other/something else not on this list
Saved more money
Spent more carefully
Cooked more/better meals or baked more/better
Healthier eating habits
Got a new pet
More creative/made more effort to stay connected to
Improved fitness/more expercise
Learned new hobby/activity
More time to spend on hobbies/activites you loveImprovements to house/garden (including renovations, decorating,
Spend more time with people in your
Better relationships with the people in your household
Better relationships with family outside your
Better relationships with friends
More appreciation for family/friends
BASE: All respondents
Learned to be more grateful
More time to think/be reflective
Focussed more on/increased spiritualityMore focus on what is really important in life
P4 - And of these things, which is the number one, most positive thing for you, which is 2nd most positive and which is the 3rd most - #3
Gender (S1) Age Group (S2) Region (S3) HH Income (Z4)