csra economic development district comprehensive economic
TRANSCRIPT

CSRA Economic Development District
Comprehensive Economic Development Strategy
2018 -2023
Prepared by:
CSRA Regional Commission
For:
Economic Development Administration

2 Comprehensive Economic Development Strategy | CSRA Regional Commission|
This report was prepared by the Central Savannah River Area Regional Commission (CSRA RC) with financial support from the U.S. Economic Development Administration (EDA), Department of Commerce. The contents reflect the views of the CSRA RC and do not necessarily reflect the views of the U.S. Economic Development Administration.
This report was prepared consistent with the EDA Comprehensive Economic Development Strategies Summary Requirements (2015) https://www.eda.gov/pdf/CEDS_Flyer_Wht_Backround.pdf, EDA Comprehensive Economic Development Strategy Guidelines (2015), https://www.eda.gov/files/ceds/CEDS-Content-
Guidelines-full.pdf, and the Public Works and Economic Development Act of 1965 (as amended by comprehensive amendments made by the reauthorization act, 2004), http://www.eda.gov/PDF/200508PWEDAasAmended.Final.pdf
Data included in this report have been compiled from general sources and are to be
used only as a guide. The CSRA RC assumes no liability for their accuracy or any
decisions users may make based on these documents.
Pictures included in this report were taken by CSRA RC staff or obtained from non-copyrighted
sources on the World Wide Web.

3 Comprehensive Economic Development Strategy | CSRA Regional Commission|
Vision Statement
The CSRA will sustain a strong and diversified economy, with economic prosperity extending
to all parts of the region. Job creation and retention will be the core focus, driven by the
region’s intellectual capital, infrastructure development, workforce, and economic
development organizations. The region will capitalize on its existing resources to grow its
economic base, and ensure its residents have access to quality jobs and wages.
4 Comprehensive Economic Development Strategy | CSRA Regional Commission|
CEDS STRATEGY COMMITTEE
Angela Pringle
Richmond County Board of Education
Gia Hunter
Textron
Dave Brendza
ADP
Michael Lewis
Jefferson County Board of Education
Zack Daffin
Employment Express Pros
Dixie Morris
Georgia Vocational Rehabilitation
Jonathan Davis
Augusta Metro Chamber of Commerce
Angela Mosely
Augusta Technical College
Kathy Dorsey
Coastal Processing
Lynthia Ross
Doctor’s Hospital
James Dubose
IBEW
Charlene Sizemore
Workforce Capital
Kim Elle
Augusta Warrior Project
Lisa Stich
Motion MetalWorks
Nick Fiorre
AFL/CIO
Ed Sturken
Painter’s Union
Matthew Forshee
Georgia Power
Ed Tarver
Enoch & Tarver
Ella Freeman
Ft. Gordon Soldier for Life
Barrett Wimberly
GE Solutions

5 Comprehensive Economic Development Strategy | CSRA Regional Commission|
CONTENTS
List of Figures ................................................................................................................................ 10
List of Tables ................................................................................................................................. 12
1.0 INTRODUCTION ..................................................................................................................... 14
1.1 IMPORTANCE OF ECONOMIC DEVELOPMENT PLANNING .................................................... 14
1.2 WHY IS A CEDS NEEDED? ...................................................................................................... 15
1.3 CEDS REQUIREMENTS ........................................................................................................... 16
1.4 CEDS ANNUAL REPORT .......................................................................................................... 16
1.5 HOW TO USE THIS PLAN ........................................................................................................ 17
1.6 METHODOLOGY .................................................................................................................... 17
1.7 COMMUNITY AND PRIVATE SECTOR PARTICIPATION .......................................................... 18
2.0 REGIONAL OVERVIEW ............................................................................................................ 19
2.1 POPULATION ...................................................................................................................... 19
2.2 LAND USE ................................................................................................................................ 22
2.2 ENVIRONMENTAL .............................................................................................................. 25
Regionally Important Resources ............................................................................................... 25
Land Area and Soils ................................................................................................................... 26
Timber Resources ..................................................................................................................... 26
Aquifer Recharge Areas ............................................................................................................ 26
River Basins and Major Lakes.................................................................................................... 27
3.0 INTRODUCTION .................................................................................................................. 28
3.1 OCCUPATIONAL PROFILE ................................................................................................... 28
3.2 SECTOR AND INDUSTRY TRENDS ....................................................................................... 30
3.3 SUBSECTORS ...................................................................................................................... 36
Manufacturing .......................................................................................................................... 36
Service Sector ............................................................................................................................ 39
Retail ......................................................................................................................................... 42
Farm Sector ............................................................................................................................... 45
Forestry ..................................................................................................................................... 48

6 Comprehensive Economic Development Strategy | CSRA Regional Commission|
Military Sector ........................................................................................................................... 48
Medical/Healthcare .................................................................................................................. 51
Finance, Insurance & Real Estate Sector .................................................................................. 52
Government and Government Enterprises Subsector ............................................................. 54
3.4 REGIONALLY SIGNIFICANT INDUSTRIES ................................................................................ 56
Shift Share Analysis ................................................................................................................... 56
Shift-Share Results for the CSRA ........................................................................................... 57
3.5 BUSINESS CLUSTERS .............................................................................................................. 59
Cyber Command ....................................................................................................................... 59
Retail Clusters ........................................................................................................................... 59
Tourism & Hospitality Cluster ................................................................................................... 59
Manufacturing Clusters............................................................................................................. 60
Military Clusters ........................................................................................................................ 60
Education & Medical Clusters ................................................................................................... 60
3.6 INCOME AND WAGES ........................................................................................................ 60
3.7 LABOR FORCE ESTIMATES .................................................................................................. 62
3.8 PROJECTED JOB GROWTH ..................................................................................................... 65
Workforce Development Area #12 – Richmond & Burke Counties ......................................... 66
Fastest Growing Occupations ............................................................................................... 66
Total Industry Growth ........................................................................................................... 66
WIOA Area #13 – East Central Georgia ..................................................................................... 68
Fastest Growing Occupations ............................................................................................... 68
Total Industry Growth ........................................................................................................... 69
Declining Industries ................................................................................................................... 70
Planned Job Creating Projects .................................................................................................. 71
4.0 INTRODUCTION .................................................................................................................. 73
Strengths, Weaknesses, Opportunities and Threats (SWOT) ................................................... 74
4.2 INSTITUTIONAL CAPACITY ..................................................................................................... 75
Development Agencies ............................................................................................................. 76
County and City Governments .................................................................................................. 80
7 Comprehensive Economic Development Strategy | CSRA Regional Commission|
Chambers of Commerce ........................................................................................................... 81
Development Authorities.......................................................................................................... 83
Development Strategy .......................................................................................................... 84
Downtown Development Authorities ....................................................................................... 85
Regional Development Agencies .............................................................................................. 86
State Government ..................................................................................................................... 87
State Workforce Development Board .................................................................................. 87
Quick Start Program .............................................................................................................. 87
Federal Government ................................................................................................................. 88
4.3 DEVELOPMENT TOOLS .......................................................................................................... 90
4.4 BUSINESS CAPACITY .............................................................................................................. 97
Access to Capital ....................................................................................................................... 97
Commercial and Professional Support Services ....................................................................... 97
4.5 TAXES ..................................................................................................................................... 99
State Taxes ................................................................................................................................ 99
Local Taxes .............................................................................................................................. 101
Assessment ......................................................................................................................... 101
4.6 LABOR FORCE ...................................................................................................................... 101
Distribution of Area Labor Supply ........................................................................................... 102
Labor Force Participation ........................................................................................................ 102
Unemployment ....................................................................................................................... 102
Education Attainment of the Workforce ................................................................................ 103
Labor Costs .............................................................................................................................. 104
4.7 EDUCATION ......................................................................................................................... 106
Public School Systems ............................................................................................................. 106
Georgia End-of-Course Assessments (EOCT) .......................................................................... 107
Higher Education ..................................................................................................................... 109
Assessment ......................................................................................................................... 110
4.8 INFRASTRUCTURE................................................................................................................ 110
Broadband Infrastructure ....................................................................................................... 111
8 Comprehensive Economic Development Strategy | CSRA Regional Commission|
Transportation Infrastructure ................................................................................................. 111
Air Service ........................................................................................................................... 111
Surface Transportation ....................................................................................................... 112
Freight Transportation ........................................................................................................ 115
Ports .................................................................................................................................... 117
4.9 HOUSING ............................................................................................................................ 119
4.10 EXISTING PLANS AND ECONOMIC DEVELOPMENT GOALS .............................................. 121
County Comprehensive Plans ................................................................................................. 121
Augusta Area Diversification Initiative ................................................................................... 121
5.0 INTRODUCTION ................................................................................................................... 125
5.1 ISSUES IN ECONOMIC DEVELOPMENT ................................................................................ 125
National and Global Integration ............................................................................................. 126
Regional Economic Challenges ............................................................................................... 126
5.2 GOALS AND ACTION STRATEGIES........................................................................................ 127
Niche Manufacturing .............................................................................................................. 128
Business Services and Information Technology ...................................................................... 130
Tourism ................................................................................................................................... 131
Downtown Development ........................................................................................................ 132
5.3 BUSINESS RETENTION AND EXPANSION ............................................................................. 133
5.4 THE CLUSTER APPROACH .................................................................................................... 134
Designing and Implementing Cluster-based Approaches ....................................................... 134
5.5 INSTITUTIONAL CAPACITY ................................................................................................... 135
Coordinated Approach ............................................................................................................ 135
Strategic Alliances ................................................................................................................... 136
5.6 EDUCATION AND WORKFORCE DEVELOPMENT ................................................................. 136
5.7 LAND USE AND INFRASTRUCTURE ...................................................................................... 137
Development Patterns ............................................................................................................ 138
5.8 MARKETING AND PROMOTION .......................................................................................... 140
Print Advertising ..................................................................................................................... 140
Trade Shows ............................................................................................................................ 141
9 Comprehensive Economic Development Strategy | CSRA Regional Commission|
Business Missions or Prospecting Trips .................................................................................. 141
Events ...................................................................................................................................... 141
Public Relations ....................................................................................................................... 141
Web Sites ................................................................................................................................ 141
Site Visits / Tours .................................................................................................................... 142
5.9 IMPLEMENTATION .............................................................................................................. 142
Collaborative Approach .......................................................................................................... 143
Performance Monitoring ........................................................................................................ 143
5.10 STRATEGIC PROJECTS .......................................................................................................... 151
Rural Broadband Infrastructure .............................................................................................. 151
Regional Parks ......................................................................................................................... 151
Development of New Exit off 1-20 ......................................................................................... 152
Brownfield Redevelopment .................................................................................................... 152
Maintain and create adequate roadway, water and sewer infrastructure throughout the
region ...................................................................................................................................... 152
Promote High Tech / Biotech Industry Clusters ..................................................................... 152

10 Comprehensive Economic Development Strategy | CSRA Regional Commission|
LIST OF FIGURES
Figure R-1: CSRA Population, 1980-2010 6
Figure R-2: CSRA Population Projection, 2010-2025 8
Figure R-3: CSRA Age Distribution, 1990-2016 8
Figure R-4: CSRA Land Use 9
Figure E-1: CSRA Industry Mix, 2000-2016 15
Figure E-2: Total Jobs by County, 2017 16
Figure E-3: CSRA Urban and Rural Jobs Balance, 2016 17
Figure E-4: Job Growth by County, 1990-2014 17
Figure E-5: Major Employer Job Losses in the CSRA, 2005-2010 18
Figure E-6: Manufacturing Employment in the CSRA, 1990-2016 20
Figure E-7: Manufacturing as a Percentage of Total Employment, 1990-2009 20
Figure E-8: Service Sector Employment in the CSRA, 1990-2016 22
Figure E-9: Service Sector as a Percentage of Total Employment, 1990-2016 22
Figure E-10: CSRA Retail Employment, 1990-2016 24
Figure E-11: CSRA Retail Sector as a Percentage of Total Employment, 1990-2016 24
Figure E-12: CSRA Farm Employment, 1990-2016 27
Figure E-13: CSRA Farm Sector as a Percentage of Total Employment, 1990-2016 28
Figure E-14: Location of Fort Gordon 29
Figure E-15: Total Employment at Fort Gordon, 1997-2016 30
Figure E-16: CSRA FIRE Employment, 1990-2016 31
Figure E-17: CSRA Percentage of FIRE Employment, 1990-2016 31
Figure E-18: CSRA Government Sector Employment, 1990-2016 32
Figure E-19: Percentage of CSRA Employment in the Government Sector, 1990-2016 33
11 Comprehensive Economic Development Strategy | CSRA Regional Commission|
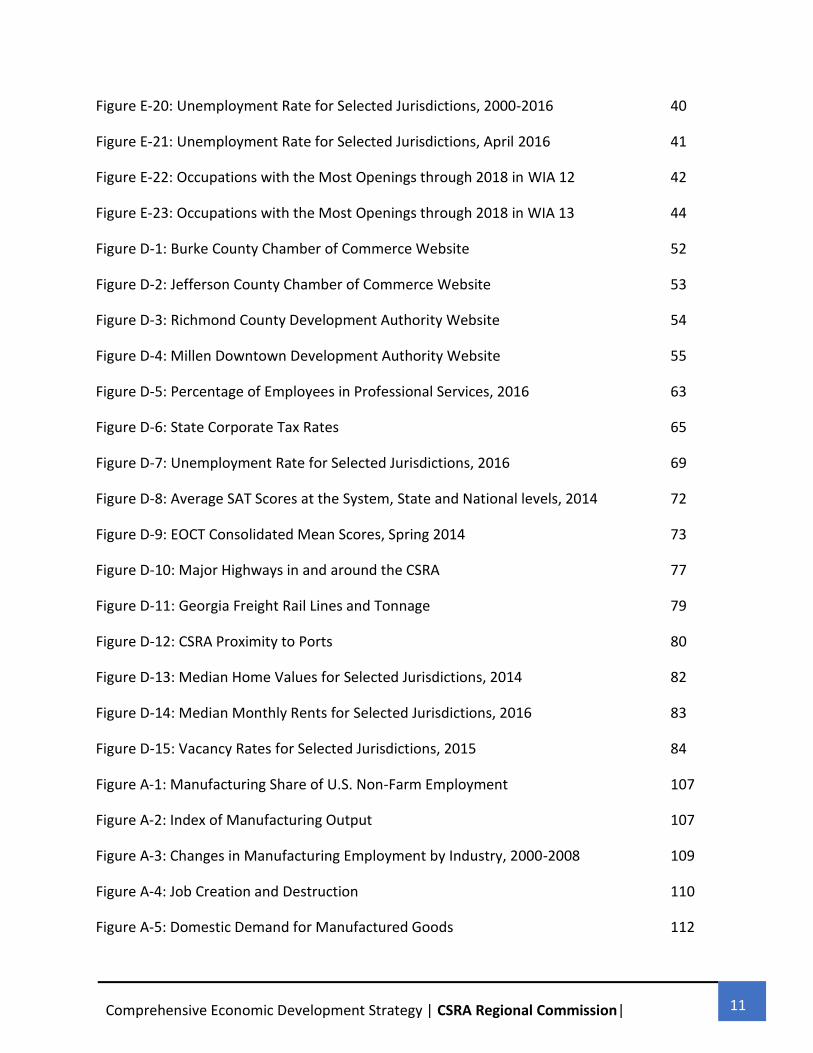
Figure E-20: Unemployment Rate for Selected Jurisdictions, 2000-2016 40
Figure E-21: Unemployment Rate for Selected Jurisdictions, April 2016 41
Figure E-22: Occupations with the Most Openings through 2018 in WIA 12 42
Figure E-23: Occupations with the Most Openings through 2018 in WIA 13 44
Figure D-1: Burke County Chamber of Commerce Website 52
Figure D-2: Jefferson County Chamber of Commerce Website 53
Figure D-3: Richmond County Development Authority Website 54
Figure D-4: Millen Downtown Development Authority Website 55
Figure D-5: Percentage of Employees in Professional Services, 2016 63
Figure D-6: State Corporate Tax Rates 65
Figure D-7: Unemployment Rate for Selected Jurisdictions, 2016 69
Figure D-8: Average SAT Scores at the System, State and National levels, 2014 72
Figure D-9: EOCT Consolidated Mean Scores, Spring 2014 73
Figure D-10: Major Highways in and around the CSRA 77
Figure D-11: Georgia Freight Rail Lines and Tonnage 79
Figure D-12: CSRA Proximity to Ports 80
Figure D-13: Median Home Values for Selected Jurisdictions, 2014 82
Figure D-14: Median Monthly Rents for Selected Jurisdictions, 2016 83
Figure D-15: Vacancy Rates for Selected Jurisdictions, 2015 84
Figure A-1: Manufacturing Share of U.S. Non-Farm Employment 107
Figure A-2: Index of Manufacturing Output 107
Figure A-3: Changes in Manufacturing Employment by Industry, 2000-2008 109
Figure A-4: Job Creation and Destruction 110
Figure A-5: Domestic Demand for Manufactured Goods 112

12 Comprehensive Economic Development Strategy | CSRA Regional Commission|
Figure A-6: Changes in the Import-Penetration Ratio and Employment 113
LIST OF TABLES
Table R-1: CSRA Population by County, 1980-2016 7
Table R-2: CSRA Household Income, 1990-2017 9
Table R-3: CSRA Population Density, 2017 10
Table E-1: Occupational Profile of CSRA Residents, 2016 13
Table E-2: CSRA Residents Employment by Industry, 2016 14
Table E-3: CSRA Total Jobs by Sector, 1990-2016 15
Table E-4: Sample of Major Employer Losses in the CSRA 18
Table E-5: Distribution of CSRA Manufacturing Employers, 2012 19
Table E-6: CSRA Services Subsector, 2015 23
Table E-7: CSRA Retail Subsector, 2012 25
Table E-8: Farm Cash Receipts for Selected Jurisdictions, 2010 26
Table E-9: CSRA FIRE Subsector, 2016 32
Table E-10: CSRA Government Subsector, 2016 33
Table E-11: Location Quotient, CSRA and the United States, 1990-2016 34
Table E-12: Shift Share Analysis, CSRA and the United States, 1990-2014 36
Table E-13: Per Capita Personal Income for Selected Jurisdictions, 1990-2015 37
Table E-14: Weekly Wage Rates for Selected Industries, Q4 2016 39
Table E-15: Labor Force Estimates for Selected Jurisdictions, 2010 40
Table E-16: Top Industry Growth Sectors through 2018 in WIA 12 43
13 Comprehensive Economic Development Strategy | CSRA Regional Commission|
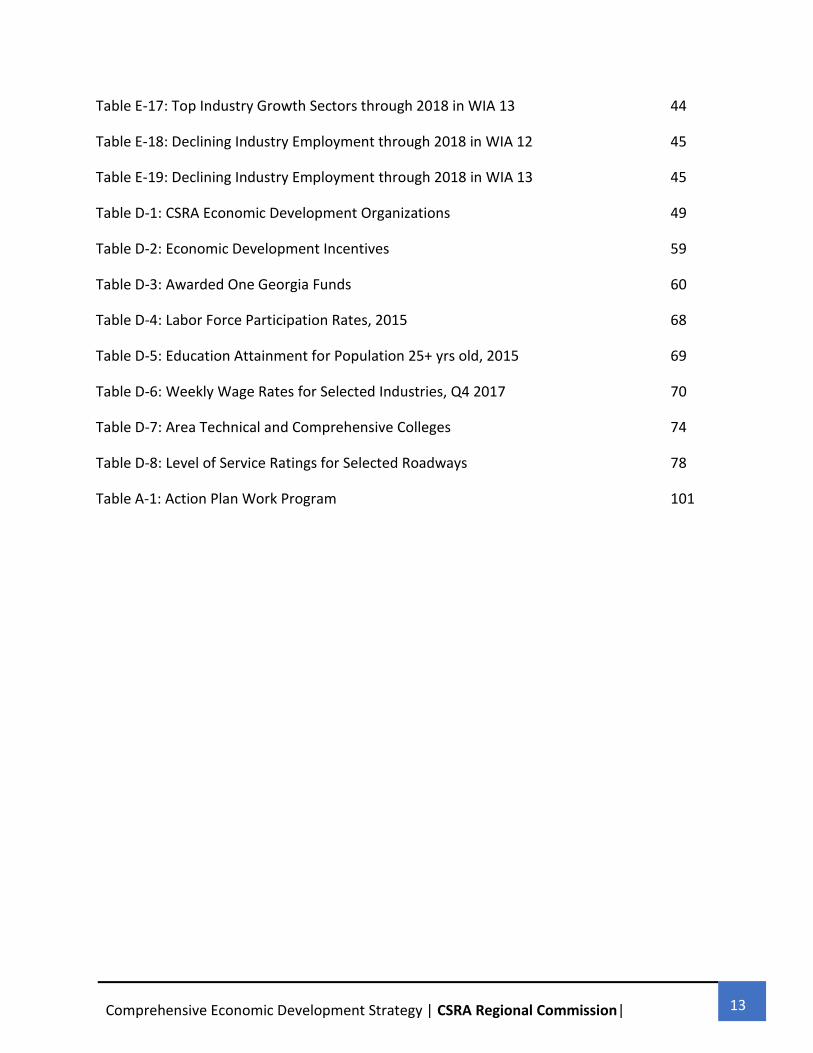
Table E-17: Top Industry Growth Sectors through 2018 in WIA 13 44
Table E-18: Declining Industry Employment through 2018 in WIA 12 45
Table E-19: Declining Industry Employment through 2018 in WIA 13 45
Table D-1: CSRA Economic Development Organizations 49
Table D-2: Economic Development Incentives 59
Table D-3: Awarded One Georgia Funds 60
Table D-4: Labor Force Participation Rates, 2015 68
Table D-5: Education Attainment for Population 25+ yrs old, 2015 69
Table D-6: Weekly Wage Rates for Selected Industries, Q4 2017 70
Table D-7: Area Technical and Comprehensive Colleges 74
Table D-8: Level of Service Ratings for Selected Roadways 78
Table A-1: Action Plan Work Program 101

14 Comprehensive Economic Development Strategy | CSRA Regional Commission|
CSRA COMPREHENSIVE ECONOMIC
DEVELOPMENT STRATEGY 1.0 INTRODUCTION
The CSRA Comprehensive Economic Development Strategy (CEDS) represents the Central
Savannah River Area’s (CSRA) economic development plan. The CEDS analyzes local conditions,
identifies problems and opportunities, defines the vision and goals of the community, designs
the strategies to accomplish these goals, and coordinates activities to implement these
strategies. A successful CEDS process results in a program that creates higher-wage jobs, raises
income levels, and grows and diversifies the economy. The process includes a logical approach
to long-range development while identifying and implementing short-term problem solutions
to achieve early results.
The CEDS document will be readily accessible to economic development stakeholders in the
region. There will be a continuing program of communication and outreach that encourages
broad-based public engagement, participation, and commitment of partners. The general
public, government decision makers, and area businesses will use it as a guide to understand
the regional economy and to take actions to improve it.
The CEDS contains four main elements: analysis, vision, action plan, and evaluation. The
analysis will assess the state of the regional economy, the opportunities and threats posed by
external trends and forces, and the availability of partners and resources for economic
development. The CSRA’s vision and goals, together with an appraisal of the region’s
competitive advantage, will set the strategic direction for the action plan. The action plan
establishes program priorities for implementation. Finally, the CEDS establishes criteria and
performance measures to evaluate the process and for periodic updates to the document.
1.1 IMPORTANCE OF ECONOMIC DEVELOPMENT PLANNING
A healthy economy plays a central role in maintaining vitality and quality of life within the CSRA.
It provides employment opportunities to residents through the creation of jobs and business
opportunities, and creates a municipal tax base that provides schools, community facilities,
services, and other amenities.
At one time, economic planning was principally the responsibility of the private sector,
including banks, railroads, and business organizations. It was associated with distressed or
underdeveloped areas in the nation. In more recent years, economic development planning has

15 Comprehensive Economic Development Strategy | CSRA Regional Commission|
become a critical function of local government and specialized agencies such as development
authorities and chambers of commerce.
Economic development is rooted in evolving economic policy. The national recession of the
1980s caused many local leaders to reexamine their historical economic development policies.
The accompanying financial stress significantly increased competition among states and
communities to attract jobs. This was combined with several significant transformations in the
structure of the nation’s economy, from the production of goods to the delivery of services,
from a national to a global system of trade, and from labor-intensive to technology-intensive
manufacturing.
Throughout the CSRA, there are many communities with small economic bases, and these
communities are extremely vulnerable to economic fluctuations and non-economic influences.
The loss of jobs and income in these areas’ export sectors inevitably spreads to local retail
businesses and financial institutions through multiplier effects. Individual communities have
little control over the events that trigger their economic distress, and rarely have the means to
mitigate the severity of the economic losses sustained by their residents.
1.2 WHY IS A CEDS NEEDED?
Beyond the need for comprehensive economic development planning noted above, a CEDS is
required to qualify for Economic Development Administration (EDA) assistance under its public
works, economic adjustment, and most planning programs, and is a prerequisite for designation
by EDA as an economic development district (EDD):
Public works and economic adjustment grants. Among other eligibility requirements for
assistance under the public works or economic adjustment programs, applicants must
submit the application with a CEDS acceptable to EDA. The proposed project should be
consistent with the CEDS.
EDD designation. As a prerequisite for designation, a proposed EDD must prepare a
CEDS that is approved by EDA, as well as meet all other requirements for designation.
Planning organizations. To receive EDA ongoing planning grants, EDDs must develop and
maintain a CEDS process. The initial CEDS document, subsequent annual reports and
revised CEDS, must be submitted for review and approval by the appropriate EDA
regional office.

16 Comprehensive Economic Development Strategy | CSRA Regional Commission|
1.3 CEDS REQUIREMENTS
The CEDS must be the result of a continuing economic development planning process,
developed with broad-based and diverse community participation, and contain the following:
An analysis of economic and community development problems and opportunities
including incorporation of any relevant material or suggestions from other government
sponsored or supported plans;
Background and history of the economic development situation of the area covered,
with a discussion of the economy, including as appropriate, geography, population,
labor force, resources, and the environment;
A discussion of community participation in the planning efforts;
A section setting forth goals and objectives for taking advantage of the opportunities
and solving the economic development problems of the area serviced;
A plan of action, including suggested projects to implement objectives and goals set
forth in the strategy; and
Performance measures that will be used to evaluate whether and to what extent goals
and objectives have been or are being met.
1.4 CEDS ANNUAL REPORT
An annual report is required following the CEDS’ completion. The annual report documents the
progress achieved on economic development activities and reports on changing economic
conditions. The annual report is used to keep track of the CEDS and its implementation, and
includes the following four components:
Adjust the CEDS as needed. Adjustments to the strategy may be necessary during the
course of the year to take advantage of unforeseen opportunities or address
unexpected problems. These adjustments should be consistent with the overall strategy
and must be documented in the next annual report. Any changes in the structure or
composition of the Strategy Committee or staff should also be described in the annual
report.
Report on the previous year’s economic development activities and any significant
changes in the region’s economic conditions. A report of economic development
activities undertaken in the previous year is related to the needs identified in the
strategy. Doing so will assist EDA and other federal agencies in reporting the benefits
resulting from the use of federal funds.
Evaluate effectiveness in meeting goals. The report contains an evaluation that
measures effectiveness in meeting the goals of the strategy. Performance measures are

17 Comprehensive Economic Development Strategy | CSRA Regional Commission|
identified to evaluate the progress of activities. EDA funded planning grantees conduct
annual evaluations of the performance of the CEDS process and include the results in
the annual report submitted to EDA.
Schedule achievable goals for the coming year. A program of activities is set out in a
format similar to the action plan contained in the CEDS document. The details in the
schedule of activities are as definitive as possible and set the baseline for reporting
performance in the next annual report. The program of activities is also, as appropriate,
incorporated into the work program of EDA funded planning grants.
1.5 HOW TO USE THIS PLAN
The CEDS Plan is intended to serve as a reference point for potential users. A number of
companion planning documents should be used in conjunction with the CEDS. These include:
CSRA Regional Plan
Augusta Area Diversification Initiative
County Comprehensive Plans
Special Economic Development Plans & Studies
1.6 METHODOLOGY
The CEDS is an action document. The aim is to assess various aspects of the regional economy
and propose specific economic development implementation strategies. Various data sets were
compiled to measure the current and future economies. The report provides an assessment of
the major economic, business, and demographic trends likely to influence the future
performance of the CSRA’s economy.
The CEDS is divided into four sections:
Part I: Summary Background: A summary background of the economic conditions of the
region.
Part II: SWOT Analysis: An in-depth analysis of regional strengths, weaknesses,
opportunities and threats.
Part III: Strategic Direction/Action Plan: The strategic direction and action plan should
build on findings from the SWPT analysis and incorporate/integrate elements from
other regionals plans (e.g., land use and transportation, workforce development, etc.)
where appropriate as determined by the EDD or community/regional engagement in
development of the CEDS. The action plan should also identify the stakeholder(s)

18 Comprehensive Economic Development Strategy | CSRA Regional Commission|
responsible for implementation, timetables, and opportunities for the integrated use of
other local, state, and federal funds.
Part IV: Evaluation Framework: Performance measures used to evaluate the
organization’s implementation of the CEDS and impact on the regional economy.
1.7 COMMUNITY AND PRIVATE SECTOR PARTICIPATION
Goals and action strategies were developed through the CSRA RC’s working relationship with
public and private entities who are interested in the region’s economic future. Specifically, a
working committee, comprised of both private and public sector members, collaborated to
create the CEDS Plan. A list of committee members is located following the Vision Plan page of
the CEDS Plan.

19 Comprehensive Economic Development Strategy | CSRA Regional Commission|
2.0 REGIONAL OVERVIEW
2.1 POPULATION
The CSRA’s population is 454,901. Since 1980, the region has enjoyed steady population
growth, increasing by 32.3% (Figure R-1). Anchored by the Augusta-Richmond County core area,
new residents have been attracted by jobs and affordable housing costs.
Source: U.S. Bureau of the Census
Population growth has not been evenly distributed throughout the region. As of the 2016
estimate, six of thirteen CSRA counties have lost population since 2010. Hancock County has
had the highest rate of population decline (8.36%), followed closely by Wilkes County (-7.43%)
and Taliaferro County (-7.22%) (Table R-1). The region’s highest growth rate occurred in
Columbia County, with its population increasing by 18.86% rate since 2010. Richmond County,
the most populous county in the CSRA, has kept adding to its population, albeit at a slower rate
than the regional average. Overall, the region’s population growth rate (32.3%) lags the state
average (77.3%)
343,857
378,512
419,703
454,901
0
100,000
200,000
300,000
400,000
500,000
1980 1990 2000 2010
Figure R-1: CSRA Population, 1980-2010

20 Comprehensive Economic Development Strategy | CSRA Regional Commission|
Table R-1: CSRA Population by County, 1980-2016 Updated*
1980
1990
2000
2010
2010 -
2016 %
change
2016 Estimate
Burke County 19,349 20,579 22,276 23,316 -2.69 22,688
Columbia County 40,118 66,031 89,288 124,053 18.86 147,450
Glascock County 2,382 2,357 2,557 3,082 -2.46 3,006
Hancock County 9,466 8,908 10,069 9,429 -8.36 8,640
Jefferson County 18,403 17,408 17,260 16,930 -5.98 15,916
Jenkins County 8,841 8,247 8,604 8,340 6.10 8,849
Lincoln County 6,716 7,442 8,362 7,996 -2.10 7,828
McDuffie County 18,546 20,119 21,231 21,875 -1.76 21,490
Richmond County 181,629 189,719 199,775 200,549 0.54 201,647
Taliaferro County 2,032 1,915 2,081 1,717 -7.22 1,593
Warren County 6,583 6,078 6,313 5,834 -6.71 5,442
Washington County 18,842 19,112 21,201 21,187 -3.4 20,457
Wilkes County 10,951 10,597 10,686 10,593 -7.43 9,805
CSRA Average 343,857 378,512 419,703 454,901 4.37 474,811
Georgia 5,463,105 6,478,216 8,186,453 9,687,653 1.06 10,310,371
Source: U.S. Bureau of the Census; CSRA Calculations by CSRA RC
The CSRA has enjoyed steady population growth since 1980. Anchored by the Augusta
metropolitan area (Augusta-Richmond and Columbia counties), new residents have been
attracted by initially in the manufacturing sector but recently in the growing services sector –
and the low cost of living. Through Georgia’s Office of Planning and Budget, it is projected, that
the regionals population should increase to 582,976 by 2030 (Figure R-2).

21 Comprehensive Economic Development Strategy | CSRA Regional Commission|
Source: Georgia Office of Planning and Budget 2010
The CSRA contains a diverse age distribution and has changed little since 1990 (Figure R-3). The
CSRA is buckling state and national trends where the proportion of residents aged 65 years or
older is rising much faster than the overall population.
Figure R-3: CSRA Age Distribution, 1990-2016
2010 2015 2020 2025 2030
454,901470,257
488,780508,327
582,976
0
100000
200000
300000
400000
500000
600000
700000
1 2 3 4 5
Figure R-2: CSRA Population Projection, 2010-2030
23.9%
24.3%23.7%
17.6%
10.6%
1990
0-14 yrs
15-29 yrs
30-44 yrs
45-64 yrs
65+ yrs
21%
21%
19%
27%
12%
2016
0-14 yrs
15-29 yrs
30-44 yrs
45-64 yrs
65+ yrs

22 Comprehensive Economic Development Strategy | CSRA Regional Commission|
Household income has increased significantly in the CSRA since 1990. Most pronounced is a
decline in the number of households earning less than $25,000, a threshold that it is either in or
near the poverty level. In 1990, 49.4% of the region’s households were in this income range. By
2022, this rate declined to 28.1% (Table R-2). It is estimated that by 2022, that individuals living
near of below the poverty level will be 25.9%. Higher household income brackets have all
increased since 1990.
Table R-2: CSRA Household Income, 1990 -2017
Table R-2: CSRA Household Income, 1990-2017 1990 2017 2022 Estimate
Number % Number % Number %
< $15,000 41,320 31 29,058 16.0 28,433 14.9
$15,000 - $24,999 24,938 19 22.085 12.1 20,921 11.0
$25,000 - $34,999 21,425 16 19,810 10.9 18,137 9.5
$35,000 - $49,999 22,501 17 25,501 14.0 23,801 12.5
$50,000 - $74,999 16,190 12 33,773 18.5 33,934 17.8
$75,000 - $99,999 4,501 3.4 20,049 11.0 24,549 13.2
$100,000 - $149,999 2,159 1.6 19,717 10.8 25,160 9.2
$150,000+ 1,197 0.9 12,185 6.7 15,426 3.8
Total 134,231 100 182,178 100 190,361 100
Source: U.S. Bureau of the Census; Calculations by CSRARC
2.2 LAND USE
From the early fur trading post along the Savannah River, in 1735, to the growing cotton and
kaolin industry and the expanding medical and science research center, of today ,changes in
population and economic development have led to changing land use patterns in the CSRA. The
Savannah River Site, the Fort Gordon Military Reservation, and the opening of the 1-20
transportation corridor have led to growth in developed and developing land uses, particularly
in the

23 Comprehensive Economic Development Strategy | CSRA Regional Commission|
Augusta metropolitan Yet the CSRA region is largely rural, reflected in that 88% of total land use
falls in this category (Figure R-4).
The primarily rural land uses of the CSRA are also evident when examining the region’s
population density. Statewide, there are 168.4 people per square mile. Only Columbia and
Richmond Counties among the thirteen jurisdictions of the CSRA exceed the state rate. The
region-wide average is 90.2 people per square mile, significantly below the state average (Table
R-3)
Conservation, 119,186, 4%
Developed, 183,431, 6%
Developing, 49,984, 1%
Military, 44,607, 1%
Rural, 2,892,344, 88%
Figure R-4: CSRA Land Use

24 Comprehensive Economic Development Strategy | CSRA Regional Commission|
Table R-3-: CSRA Population Density, 2017
Population
Land Area
(sq. mi)
Population
Density
Burke County 23,316 830 28.2
Columbia County 124,053 290 427.6
Glascock County 3,082 473 21.4
Hancock County 9,429 144 20
Jefferson County 16,930 528 32.2
Jenkins County 8,340 350 24
Lincoln County 7,996 211 38
McDuffie County 21,875 260 85
Richmond County 200,549 324 618.4
Taliaferro County 1,717 195 8.8
Warren County 5,834 286 20.5
Washington County 21,187 680 31.2
Wilkes County 10,593 471 22.6
CSRA Average 454,901 5,042 90.2
Source: Georgia Statistics System
25 Comprehensive Economic Development Strategy | CSRA Regional Commission|
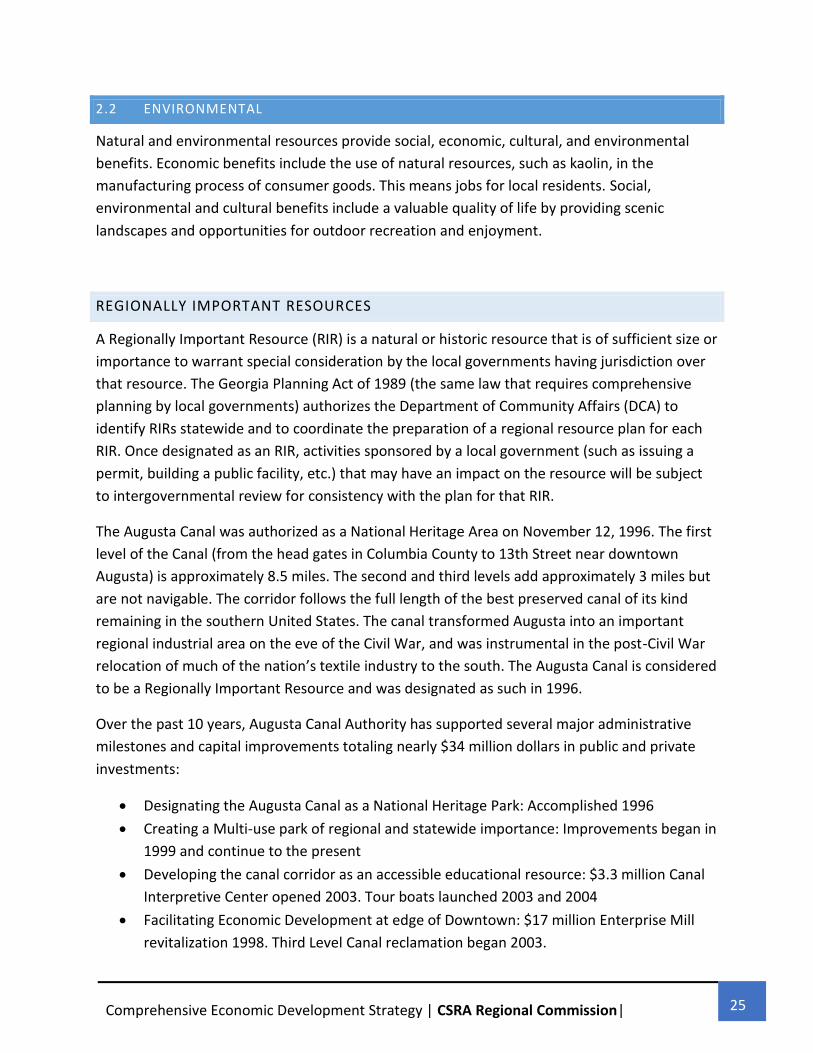
2.2 ENVIRONMENTAL
Natural and environmental resources provide social, economic, cultural, and environmental
benefits. Economic benefits include the use of natural resources, such as kaolin, in the
manufacturing process of consumer goods. This means jobs for local residents. Social,
environmental and cultural benefits include a valuable quality of life by providing scenic
landscapes and opportunities for outdoor recreation and enjoyment.
REGIONALLY IMPORTANT RESOURCES
A Regionally Important Resource (RIR) is a natural or historic resource that is of sufficient size or
importance to warrant special consideration by the local governments having jurisdiction over
that resource. The Georgia Planning Act of 1989 (the same law that requires comprehensive
planning by local governments) authorizes the Department of Community Affairs (DCA) to
identify RIRs statewide and to coordinate the preparation of a regional resource plan for each
RIR. Once designated as an RIR, activities sponsored by a local government (such as issuing a
permit, building a public facility, etc.) that may have an impact on the resource will be subject
to intergovernmental review for consistency with the plan for that RIR.
The Augusta Canal was authorized as a National Heritage Area on November 12, 1996. The first
level of the Canal (from the head gates in Columbia County to 13th Street near downtown
Augusta) is approximately 8.5 miles. The second and third levels add approximately 3 miles but
are not navigable. The corridor follows the full length of the best preserved canal of its kind
remaining in the southern United States. The canal transformed Augusta into an important
regional industrial area on the eve of the Civil War, and was instrumental in the post-Civil War
relocation of much of the nation’s textile industry to the south. The Augusta Canal is considered
to be a Regionally Important Resource and was designated as such in 1996.
Over the past 10 years, Augusta Canal Authority has supported several major administrative
milestones and capital improvements totaling nearly $34 million dollars in public and private
investments:
Designating the Augusta Canal as a National Heritage Park: Accomplished 1996
Creating a Multi-use park of regional and statewide importance: Improvements began in
1999 and continue to the present
Developing the canal corridor as an accessible educational resource: $3.3 million Canal
Interpretive Center opened 2003. Tour boats launched 2003 and 2004
Facilitating Economic Development at edge of Downtown: $17 million Enterprise Mill
revitalization 1998. Third Level Canal reclamation began 2003.

26 Comprehensive Economic Development Strategy | CSRA Regional Commission|
LAND AREA AND SOILS
The CSRA Region is comprised of three major land area types, the Southern Piedmont-
Mountain Province, the Carolina & Georgia Sandhills and the Southern Coastal Plan. Through a
variety of natural processes each of these areas have differing mineral composition, structure,
texture, drainage, and fertility and construction constraints. General characteristics of the land
resources in the CSRA Region are as follows:
The Southern Piedmont is characterized by steep to gently rolling thin, well drained red soils
with sandy loam surface layers over sandy clay to clay sub-soils. Much of the original topsoil has
been eroded by past agricultural abuses, leaving red clay sub-soils exposed in some areas.
Soybeans and forages are grown in remaining topsoil. Small grains and pastures are better
adapted where topsoil is gone. Suitability for building foundations is fair to good; septic tank
suitability is fair to poor.
The Carolina and Georgia Sand Hills, consists of a belt of gently sloping to steep, well drained
and sandy soils originally derived from marine sands, loams, and clays deposited on the
crystalline and metamorphic bedrock of adjacent uplands. Soils in this region are generally
infertile and dry. The land area is largely covered with sparse forest of scrub oak and pines. This
area offers poor to good suitability for residences and industry. The sand hills comprise a rather
narrow strip less than 10 miles wide with very irregular boundaries.
Southern Coastal Plain is characterized by gently sloping, well-drained sandy loam to sandy soils
over friable sandy clay loam to clay sub-soils that are sticky when wet. When fertilized and
limed soils produce high yields of corn, peanuts, tobacco, small grains and soybeans. This
province provides a fair to good suitability for residential and industrial foundations.
TIMBER RESOURCES
Timber is a very important resource in the CSRA, whose 2,898,849- timber land acres account
for 12% of Georgia's total timberland acreage. Timber is the most extensive natural resource in
the CSRA with 67.7% of all CSRA land acres classified as timberland. All CSRA forest has the
potential for timber industry usage.
AQUIFER RECHARGE AREAS
Water resources vary within the CSRA because of the differing soil types and aquifers within the
region. The Coastal Plain is underlain by five major aquifers, including the Principal artisan
aquifer, which may be the world's largest, covering a third of Georgia, most of Florida and parts

27 Comprehensive Economic Development Strategy | CSRA Regional Commission|
of Alabama and South Carolina. There are three major aquifers underlying the CSRA region, the
Crystalline Rock aquifer in the North above the fall line; the Cretaceous aquifer system in the
Center of the region; and the Floridian aquifer system in the southern CSRA. The Cretaceous
Aquifer is a system of sand and gravel. The Floridian aquifer is made of confined limestone,
dolostone and calcarious sand. It supplies approximately 50% of the states groundwater.
RIVER BASINS AND MAJOR LAKES
Georgia's surface hydrology is unique in that no major rivers flow into Georgia from outside its
borders. Rather, runoff from the state's northern mountains and upper Piedmont forms the
headwaters of most of the 2,000 miles of streams and rivers flowing through the state. The
main rivers in the CSRA region include the Savannah, the Little, the Ogeechee and the Ohoopee
Rivers with a combined shoreline of 1,140 miles.
The northern CSRA, which falls in the Southern Piedmont land form has two hydropower
projects, notably the Clarks Hill Dam and Reservoir with a surface area of 78,500 acres. The
Clarks Hill Dam creates a great multipurpose storage reservoir for flood control and
hydroelectric power and in conjunction with the Sevens Creek Dam below it has almost
complete control over the flow to provide a relatively uniform flow for navigation in the Coastal
Plain below Augusta. Practically all of the flow from the area above Clarks Hill Dam is used for
hydroelectric power. Other downstream uses include navigation, irrigation and industry. The
northern border of the Georgia/Carolina Sand Hills region is commonly the head of navigation
for large rivers and the site of water power dams. The flow of larger streams is relatively
uniform with high yields due to groundwater inflow. Larger streams are sluggish, flowing in
deep meandering low banked, tree choked channels. River water is used for steam power
plants and some manufacturing, but artisan wells supply most towns and many industries in
this region. The cretaceous aquifer underlying the Fall Line for a distance of 30-60 miles,
consists mostly of sand and gravel.

28 Comprehensive Economic Development Strategy | CSRA Regional Commission|
3.0 INTRODUCTION
The CSRA region includes a diverse economy that spans thirteen urban and rural counties. The
region contains economic clusters that range from highly concentrated medical industries at
the core of the Augusta area to an industrial/manufacturing beltway that extends throughout
the rural counties of Central Georgia.
The last three decades were a period of sustained economic growth throughout the CSRA.
Economic and employment growth emerged from the addition of new service-providing firms
and expansion of existing industries. While the region’s competitive strengths and location of
new industries have supported the growth of the 1980s, 1990s and the early part of the 2000s,
growth has slowed and even declined in some counties during the past five years. The
manufacturing sector has been especially hard hit, with a number of major plant shutdowns in
the region.
The data presented in this section captures the changing trends of the CSRA economy. Primary
data includes the U.S. Bureau of Economic Analysis, the U.S. Department of Labor, and the
Georgia Department of Labor. Due to the different methods used by these agencies in counting
employment data, some discrepancies in employment totals may occur.
3.1 OCCUPATIONAL PROFILE
The occupational profile of the CSRA reflects the work performed by the region’s residents,
whether they work in the CSRA or another region.
Table E-1 presents the occupational profile of CSRA residents. The workforce is well diversified
with Management/Professional occupations (36.6%) accounting for the highest share of
employment, followed by Sales, Office & Administrative Support (22.2%) and Service Workers
(19%). This reflects strong employment orientation in service and government sectors. The
smallest shares of occupations are found in Farming, Fishing & Forestry (0.6%) and
Construction, Extraction & Maintenance (5.5%), reflecting the decline of agricultural and
natural resource-based industries.

29 Comprehensive Economic Development Strategy | CSRA Regional Commission|
Table E-1: Occupational Profile of CSRA Residents
2010 2016
Number Percent Number Percent
Management/Professional/Financial 67,591 36.6 18,134 8.9
Services 35,087 19 94,927 46.7
Sales, Office & Admin Support 40,997 22.2 34,423 16.9
Farming/Fishing/Forestry 1,108 0.6 482 0.2
Construction/Extraction/Maintenance 10,157 5.5 11,060 5.5
Production/Transportation/Material Moving 29,732 16.1 18,045 8.9
Total 184,672 100 177,071 87.1
Sources: U.S. Bureau of the Census; ESRI Business Analyst; by NAICS Codes; Calculations by CSRA RC
Industry employment trends reflect the region’s occupational profile. Services (64.3%) account
for the highest share of employment among CSRA residents (Table E-2). Other important
sectors include Retail Trade (14.8%) and Manufacturing (6.9%).
Table E-2: CSRA Residents Employment by Industry
2010 2016
Number Percent Number Percent
Agriculture/Forestry/Fishing/Hunting/Mining 3,509 1.9 2,018 1.0
Construction 11,265 6.1 8,195 4.0
Manufacturing 16,805 9.1 13,964 6.9

30 Comprehensive Economic Development Strategy | CSRA Regional Commission|
Wholesale Trade 4,247 2.3 8,001 3.9
Retail Trade 20,683 11.2 30,108 14.8
Transportation/Warehousing/Utilities 10,711 5.8 5,410 2.7
Information 2,955 1.6 4,191 2.1
Finance/Insurance/Real Estate/Rental/Leasing 8,495 4.6 8,970 4.4
Services 95,106 51.5 112,189 64.3
Public Administration 10,896 5.9 13,602 6.7
Total 184,672 100 206,648 110.8
Sources: U.S. Bureau of the Census; ESRI Business Analyst; by NAICS Codes; Calculations by CSRA RC
3.2 SECTOR AND INDUSTRY TRENDS
Sector and industry trends reflect the work within the CSRA region, including out-of-region
residents. The CSRA’s employment base is largely a mix of small businesses across a variety of
sectors. There are 9,394 businesses in the region, employing 233,991 people. The majority of
businesses employ ten or fewer people. The small business sector of the economy is
supplemented by major employers such as manufacturers, education institutions, and
government agencies.
Figure E-1 displays the CSRA’s industry mix in 2000 and 2016. The majority of jobs in the region
are in service-producing industries, which has increased by over 10% since 2000. Over 60% of
the CSRA’s jobs are in this sector, followed by Government (24.4%) and Goods Producing
(14.5%). These data highlight the shift from manufacturing to service industries that has
occurred in the past twenty years.

31 Comprehensive Economic Development Strategy | CSRA Regional Commission|
Figure E-1: CSRA Industry Mix, 2000-2017
Source: Georgia Department of Labor – Local Area Profile
Table E-3 presents a detailed breakdown of employment sectors in the CSRA. Services (37.4%)
and Government & Government Enterprises (23.5%) account for the highest share of
employment. Other important job concentrations include Retail Trade (10.1%) and Finance,
Insurance & Real Estate (5.8%).
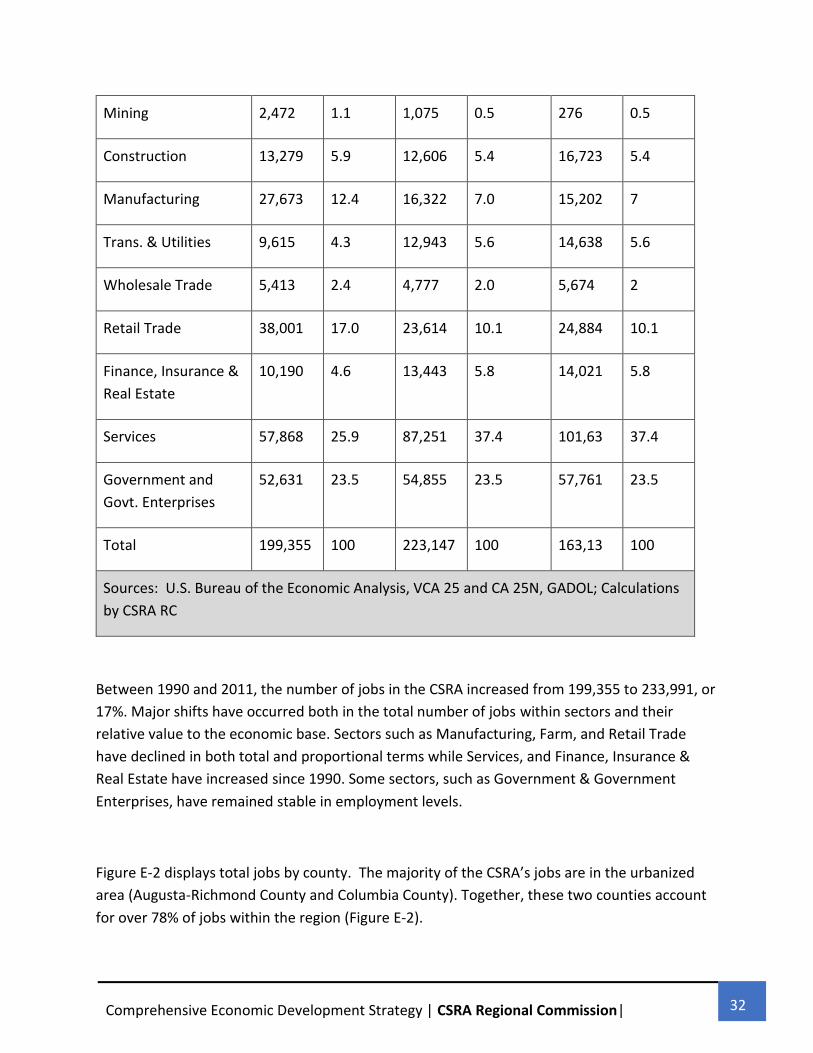
Table E-3: CSRA Total Jobs by Sector, 2000 - 2016
2000 2009 2016
Number Percent Number Percent Number Percent
Farm 4,305 1.9 3,567 1.5 3,279 1.5
Agriculture, Forest &
Fishing
2,061 0.9 2,694 1.2 513 1.2
Goods Producing,
14.5%
Services, 60.8%
Government, 24.4%Goods
Producing, 26.0%
Services, 49.5%
Government, 24.5%
2000 2017
32 Comprehensive Economic Development Strategy | CSRA Regional Commission|
Mining 2,472 1.1 1,075 0.5 276 0.5
Construction 13,279 5.9 12,606 5.4 16,723 5.4
Manufacturing 27,673 12.4 16,322 7.0 15,202 7
Trans. & Utilities 9,615 4.3 12,943 5.6 14,638 5.6
Wholesale Trade 5,413 2.4 4,777 2.0 5,674 2
Retail Trade 38,001 17.0 23,614 10.1 24,884 10.1
Finance, Insurance &
Real Estate
10,190 4.6 13,443 5.8 14,021 5.8
Services 57,868 25.9 87,251 37.4 101,63 37.4
Government and
Govt. Enterprises
52,631 23.5 54,855 23.5 57,761 23.5
Total 199,355 100 223,147 100 163,13 100
Sources: U.S. Bureau of the Economic Analysis, VCA 25 and CA 25N, GADOL; Calculations
by CSRA RC
Between 1990 and 2011, the number of jobs in the CSRA increased from 199,355 to 233,991, or
17%. Major shifts have occurred both in the total number of jobs within sectors and their
relative value to the economic base. Sectors such as Manufacturing, Farm, and Retail Trade
have declined in both total and proportional terms while Services, and Finance, Insurance &
Real Estate have increased since 1990. Some sectors, such as Government & Government
Enterprises, have remained stable in employment levels.
Figure E-2 displays total jobs by county. The majority of the CSRA’s jobs are in the urbanized
area (Augusta-Richmond County and Columbia County). Together, these two counties account
for over 78% of jobs within the region (Figure E-2).

33 Comprehensive Economic Development Strategy | CSRA Regional Commission|
Source: U.S. Bureau of Economic Analysis (CA 25N)
Source: U.S. Bureau of Economic Analysis (CA 25N); Calculations by CSRA RC
Examining job growth rates by county between 2001 and 2016, only Columbia County has
grown at rates comparable to the CSRA and state averages (Figure E-4). Seven of thirteen
counties have fewer jobs in 2009 than in 1990. This is the result of declines in the
manufacturing sector, which has hit hard the rural CSRA counties of Jefferson, Jenkins, Warren
9,635
49,823
818 2,671 7,025 2,535 2,2329,569
144,394
464 2,1989,660 4,571
0
20,000
40,000
60,000
80,000
100,000
120,000
140,000
160,000
Figure E-2: CSRA Total Jobs By County, 2017
Augusta-Richmond & Columbia
Counties78%
Rest of CSRA22%
Figure E-3: CSRA Urban and Rural Jobs Balance, 2016

34 Comprehensive Economic Development Strategy | CSRA Regional Commission|
and Wilkes. By contrast, job gains in Richmond and Columbia Counties were 34,687 during that
same period. Without the creation of service sector jobs, the economic base of rural CSRA
counties would be much worse.
Source: Bureau of Economic Analysis, CA-25 and CA-25N
Major employer loses are reported to the Georgia Department of
Labor (GDOL) for listing in the Business Layoff & Closure listing
directory. Since 2005, there have been 5,175 job losses reported to
GDOL (Figure E-5). It is important to note that these represent only
3.2
5%
52
.06
%
33
.78
%
18
.93
%
-5.3
5%
-26
.00
%
-5.9
6%
-8.5
7%
5.9
9%
14
.20
%
8.5
9%
-6.2
1%
-13
.39
%
17
.40
%
43
.80
%
-30.00%
-20.00%
-10.00%
0.00%
10.00%
20.00%
30.00%
40.00%
50.00%
60.00%
FIGURE 13 CSRA JOB GROWTH BY COUNTY 2001-2014
Burke
Columbia
Glascock
Hancock
Jefferson
Jenkins
Lincoln
McDuffie
Richmond
Taliaferro
Warren
Washington
Wilkes
CSRA
Georgia

35 Comprehensive Economic Development Strategy | CSRA Regional Commission|
major employers which are required to report closures by federal labor law requirements. It
does not include employers that are not
required to report, or jobs impacted by major employer closures, such as suppliers.
Source: GDOL Business Layoff & Closure Listing
http://www.dol.state.ga.us/em/layoff_closure_listing.htm
Table E-4 provides a sample of recent major employer losses by county.
Table E-4: Sample of Major Employer Losses in the CSRA
Company Name County Jobs
Losses Year
South State Bank Richmond 91 2017
Whole Food Market Richmond 70 2017
General Dynamics Richmond 122 2017
Proctor and Gamble Richmond 130 2013
513411
171
765
212
2,037
320
613
133
0
500
1,000
1,500
2,000
2,500
z

36 Comprehensive Economic Development Strategy | CSRA Regional Commission|
Continental Commercial Products Jefferson 121 2013
One Care Company Burke 101 2012
Teleperformance Richmond 248 2011
Thermo King Jefferson 276 2011
FPL Food LLC Richmond 185 2010
Imerys Clay Washington 181 2008
Source: Georgia Department of Labor Business Layoff & Closure Listing
3.3 SUBSECTORS
MANUFACTURING
The manufacturing sector in the CSRA is characterized by diverse production sectors.
Collectively, manufacturers encompass 331 businesses employing over 14,000 people.
Transportation Equipment (2,294) account for the highest share employers, followed by Food
(1,774) and furniture Fabricated Metal Products (Table E-5).
Table E-5: Distribution of CSRA Manufacturing Employers,
2016
Number %
Apparel 439 0.3
Beverage & Tobacco 89 0.1
Chemical 914 0.5

37 Comprehensive Economic Development Strategy | CSRA Regional Commission|
Electrical Equipment & Appliances 636 0.4
Fabricated Metal Products 1,419 0.8
Food 1,774 1.0
Furniture & Related 200 0.1
Machinery 817 0.5
Miscellaneous 674 0.4
Nonmetallic Mineral Products 1,347 0.8
Paper 1,401 0.8
Plastic & Rubber Products 602 0.3
Printing & Related 125 0.1
Textile Mills 643 0.4
Textile Product Mills 660 0.4
Transportation Equipment 2,294 1.3
Wood Products 1,333 0.8
Total 15,581 8.9
Source: Georgia Department of Labor Local Area Profiles
(2016); Calculations by CSRA RC
Consistent with trends in the state and national economies, CSRA counties made a gradual
structural shift away from their traditional manufacturing and industrial base toward a more
service-based economy during the past two decades. Region-wide, the number of

38 Comprehensive Economic Development Strategy | CSRA Regional Commission|
manufacturing jobs between 1990 and 2012 has declined from 29,780 to 15,221 (Figure E-6).
However, from 2012-2016, the region saw a slight incline in manufacturing from 14,150 to
15,221. With the exception of Columbia County, all CSRA jurisdictions have lost manufacturing
employment.
The decline of manufacturing jobs is a growing national issue, affecting all U.S. regions. There
are a number of causes to this decline:
The Recession of 2001: Much of the decline in manufacturing employment since 2000 reflects
the recession that began in 2001 and the relatively weak recovery in demand that followed. The
recession drastically reduced demand for goods in both the United States and the rest of the
world. Those cyclical losses in the sector have persisted ever since.
Manufacturing Productivity: Over recent decades, U.S. manufacturers have continually
invested in better capital goods and manufacturing techniques in order to remain competitive.
There has been a significant increase in manufacturing productivity due to technology, capital
investment, and entrepreneurialism. Those changes have enabled manufacturers to raise their
output and keep pace with overall economic growth without a corresponding increase in the
number of workers that they employ.
Changing Consumption Patterns: The share of consumer spending devoted to manufactured
goods has declined over time both in the United States and in other industrialized nations, even
though demand for manufactured goods has increased in absolute terms. As consumers'
income has risen, they have increased their purchases of goods but boosted their spending on
services even more.
Competition from Foreign Producers: A portion of the long-term decline in employment in
some manufacturing industries can be linked to the expansion of trade. The U.S. trade
problems in manufacturing are caused by longer-run shifts in comparative advantage that favor
lower-cost overseas production. The gains from trade arise as nations specialize in the goods
and services that they can produce efficiently relative to other countries. Thus, the expansion of
trade necessarily involves changes in the mix of products. The United States has specialized in
products requiring a highly skilled labor force even as lesser jobs have shifted to countries
where labor is less skilled. In the apparel sector, for example, the number of jobs in the United
States has declined from over 900,000 in 1990 to less than 300,000 today.
Changes in the Structure of Manufacturing: Finally, manufacturing employers increasingly have
met short-term fluctuations in demand not by adding permanent staff but by hiring temporary
workers through agencies and by contracting with outside firms to provide certain non-core
support functions - for example, cafeteria, janitorial, and payroll-processing services - which

39 Comprehensive Economic Development Strategy | CSRA Regional Commission|
traditionally had been performed in-house and therefore had been counted as manufacturing
jobs.
SERVICE SECTOR
The service sector is an aggregate of several service
industries ranging from Accommodation & Food services to
highly Professional services. The sector’s distribution also
reflects an area’s economic base. For example, localities with
high numbers of service sector jobs in Arts & Entertainment
and Accommodation & Food services tend to be tourism-
oriented while areas with significant Management,
Professional & Technical services tend to have stronger
commercial and industrial bases.
Consistent with state and national trends, the service sector
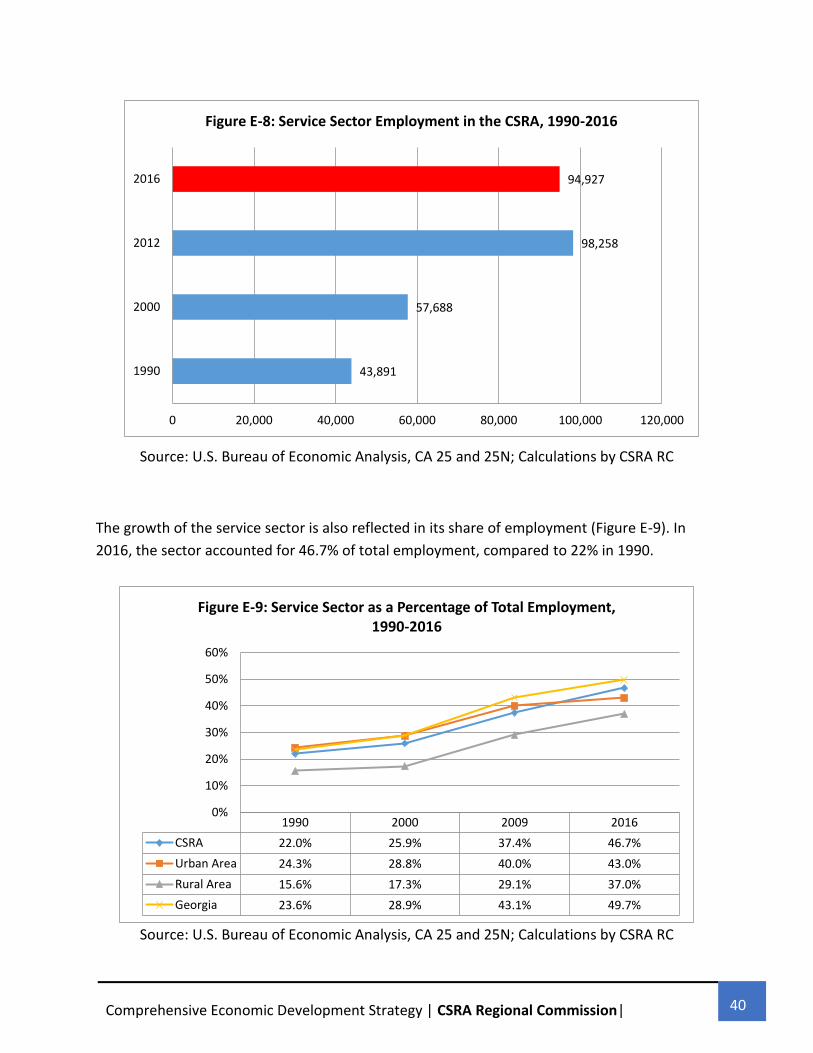
in the CSRA has been responsible for most of the job growth in the past decade. Collectively,
this sector employs 94,927 people (Figure E-8), nearly double employment levels in 1990. It is
the largest of all employment sectors in the CSRA.
40 Comprehensive Economic Development Strategy | CSRA Regional Commission|
Source: U.S. Bureau of Economic Analysis, CA 25 and 25N; Calculations by CSRA RC
The growth of the service sector is also reflected in its share of employment (Figure E-9). In
2016, the sector accounted for 46.7% of total employment, compared to 22% in 1990.
Source: U.S. Bureau of Economic Analysis, CA 25 and 25N; Calculations by CSRA RC
43,891
57,688
98,258
94,927
0 20,000 40,000 60,000 80,000 100,000 120,000
1990
2000
2012
2016
Figure E-8: Service Sector Employment in the CSRA, 1990-2016
1990 2000 2009 2016
CSRA 22.0% 25.9% 37.4% 46.7%
Urban Area 24.3% 28.8% 40.0% 43.0%
Rural Area 15.6% 17.3% 29.1% 37.0%
Georgia 23.6% 28.9% 43.1% 49.7%
0%
10%
20%
30%
40%
50%
60%
Figure E-9: Service Sector as a Percentage of Total Employment, 1990-2016

41 Comprehensive Economic Development Strategy | CSRA Regional Commission|
In 2015, there were 7,164 service sector firms in the CSRA (Table E-6). The sector is primarily
driven by the Health Care and Social Assistance (23.3%), Retail Trade (19.5%) and
Accommodation & Food Services (15.2%).
Table E-6: CSRA Services Sub Sector, 2015
Number
of Firms
Number
Employe
d
Percent
Employed
Utilities 30 2031 2.1
Wholesale Trade 383 4,092 4.2
Retail Trade 1,447 19,126 19.5
Transportation & Warehousing 227 3,180 3.2
Information 116 2,158 2.2
Finance & Insurance 546 3,651 3.7
Real Estate and Rental and Leasing 348 1,513 1.5
Professional, Scientific, and Technical
Services 800 5,911 6.0
Management of Companies & Enterprises 49 1112 1.1
Administrative and Support and Waste
Management and Remediation Services 528 10,487 10.7
Educational Services 84 1,474 1.5
Health Care and Social Assistance 1,058 22,920 23.3

42 Comprehensive Economic Development Strategy | CSRA Regional Commission|
Arts, Entertainment, and Recreation 88 1,784 1.8
Accommodation and Food Services 770 14,941 15.2
Other Services (except Public
Administration) 730 3,877 3.9
Total 7,164 98,258 100
Source: Georgia Department of Labor Area Labor Profiles (2012) Adapted for
Consistency with BEA data; Calculations by CSRA RC
RETAIL
Retail is an important economic sector in the CSRA, with 3,794 retail establishments employing
28,915 people (Figure E-10). Since 2000, however, retail employment in the CSRA has declined
by 24%.

43 Comprehensive Economic Development Strategy | CSRA Regional Commission|
Source: U.S. Bureau of Economic Analysis, CA 25 and 25N
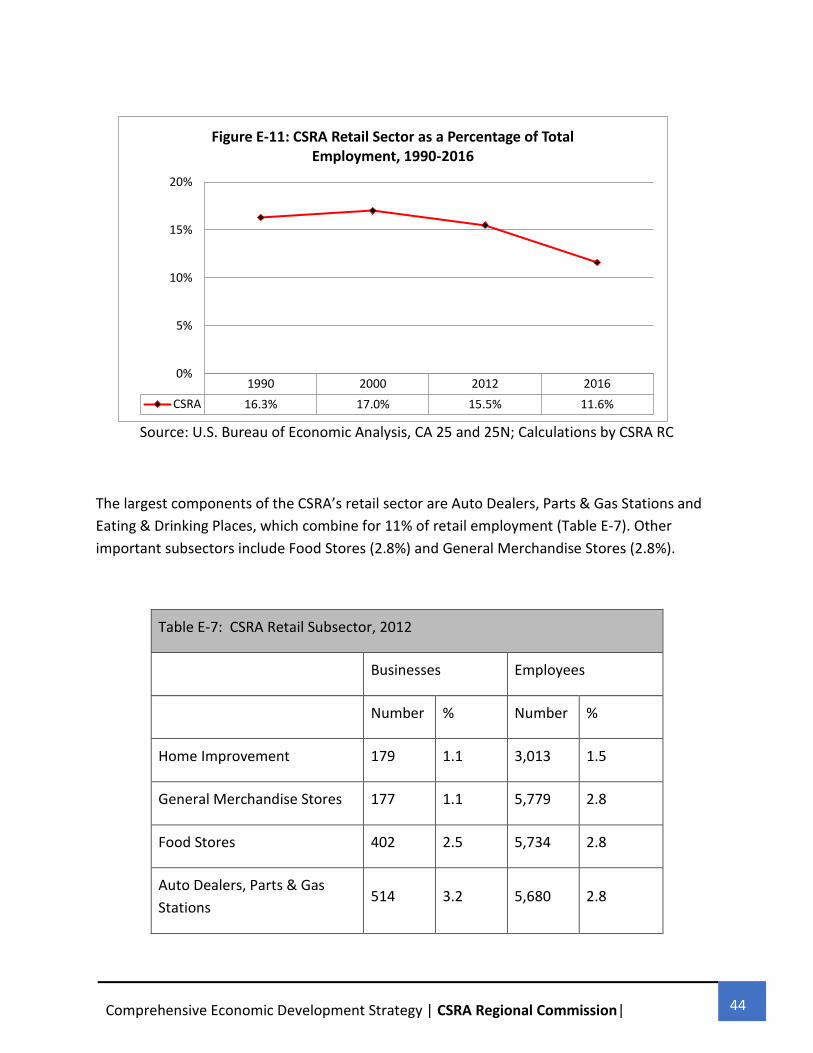
The sector’s employment loss is reflected in its relative value to total employment (Figure E-11).
In 1990, the sector accounted for 16.3% of total employment. By 2016, it declined to 11.1%,
less than one percentage point. One explanation is the BEA jobs reclassification in 2001
resulted in many jobs formerly classified as retail trade now classified as service jobs.
32,461
38,001
28,915
20,335
0
10,000
20,000
30,000
40,000
1990 2000 2012 2016
Figure E-10: CSRA Retail Employment, 1990-2016
44 Comprehensive Economic Development Strategy | CSRA Regional Commission|
Source: U.S. Bureau of Economic Analysis, CA 25 and 25N; Calculations by CSRA RC
The largest components of the CSRA’s retail sector are Auto Dealers, Parts & Gas Stations and
Eating & Drinking Places, which combine for 11% of retail employment (Table E-7). Other
important subsectors include Food Stores (2.8%) and General Merchandise Stores (2.8%).
Table E-7: CSRA Retail Subsector, 2012
Businesses Employees
Number % Number %
Home Improvement 179 1.1 3,013 1.5
General Merchandise Stores 177 1.1 5,779 2.8
Food Stores 402 2.5 5,734 2.8
Auto Dealers, Parts & Gas
Stations 514 3.2 5,680 2.8
1990 2000 2012 2016
CSRA 16.3% 17.0% 15.5% 11.6%
0%
5%
10%
15%
20%
Figure E-11: CSRA Retail Sector as a Percentage of Total Employment, 1990-2016

45 Comprehensive Economic Development Strategy | CSRA Regional Commission|
Apparel & Accessory Stores 257 1.6 2,074 1.0
Furniture & Home Furnishings 234 1.5 1,566 0.8
Eating & Drinking Places 989 6.1 15,711 7.7
Miscellaneous Retail 793 4.9 6,758 3.3
Total 3,545 22.0 46,315 22.8
Source: ESRI Business Analyst, Business Summary (2012); Calculations by
CSRA RC
FARM SECTOR
In rural CSRA counties, the Farm Sector plays an important role in employment. There are over
3,000 farms in the CSRA, accounting for over a million acres of land. Approximately one-third of
all lands in the rural CSRA are occupied by farming production.
Table E-9 displays farm cash receipts for the CSRA. Over $246,000,000 were reported in 2010.
Burke, Jefferson, McDuffie and Wilkes Counties have the largest farming sectors, collectively
accounting for over two-thirds of the CSRA’s total farm cash receipts.
Table E-8: Farm Cash Receipts for Selected
Jurisdictions, 2010
Total Cash
Receipts (in
$000)
Burke County $69,007

46 Comprehensive Economic Development Strategy | CSRA Regional Commission|
Table E-8: Farm Cash Receipts for Selected
Jurisdictions, 2010
Total Cash
Receipts (in
$000)
Columbia County $6,513
Glascock County $3,393
Hancock County $4,416
Jefferson County $39,017
Jenkins County $21,477
Lincoln County $1,958
McDuffie County $35,232
Richmond County $1,882
Taliaferro County $6,202
Warren County $6,404
Washington County $15,103
Wilkes County $36,055
Total 246,659
Source: Georgia County Guide (2010)

47 Comprehensive Economic Development Strategy | CSRA Regional Commission|
The Farm sector accounts for 3,063 jobs in the CSRA (Figure E-12). Since 1990, the sector has
declined from 4,674 jobs to 3,063. Employment in the Farm sector has undergone gradual
decline in the CSRA, mirroring state and national trends (Figure E-13).
Source: U.S. Bureau of Economic Analysis, CA 25 and 25N
4,674
4,305
3,567
3,063
0
1,000
2,000
3,000
4,000
5,000
1990 2000 2009 2016
Figure E-12: CSRA Farm Employment, 1990-2016

48 Comprehensive Economic Development Strategy | CSRA Regional Commission|
In proportional terms, the Farm sector has declined by approximately 0.8% in relation to overall
employment (Figure E-13).
Source: U.S. Bureau of Economic Analysis, CA 25 and 25N; Calculations by CSRA RC
FORESTRY
Timber is a very important resource in the CSRA, whose 2,898,849- timber land acres account
for 12% of Georgia's total timberland acreage. Timber is the most extensive natural resource in
the CSRA with 67.7% of all the region’s land acres classified as timberland. All of the CSRA
forests have the potential for timber industry usage.
MILITARY SECTOR
The U.S military is a major employer in the CSRA, particularly in Richmond and Columbia Counties. Fort
Gordon occupies approximately 55,600 acres in four counties. The majority of the installation
and the entire cantonment area lie within Richmond County, with small portions of the training
areas in Jefferson, Columbia, and McDuffie Counties (Figure E-14).
Fort Gordon is the largest communications training facility in the Armed Forces and is the focal
point for the development of tactical communications and information systems. The Leader
2.3%
1.9%
1.5%
1.1%
0.0%
0.5%
1.0%
1.5%
2.0%
2.5%
1990 2000 2008 2016
Figure E-13: CSRA Farm Sector as a Percentage of Total Employment, 1990-2016

49 Comprehensive Economic Development Strategy | CSRA Regional Commission|
College of Information Technology is the Army’s premiere site for all automation training and
home to the Regimental NCO Academy. The installation is also home to the U.S. Army Garrison,
116th Military Intelligence Group, the Southeast Region Medical Command, the Southeast
Region Dental Command, the Southeast Region Veterinary Command, Eisenhower Army
Medical Center, 249th General Hospital, Regional Training Site-Medical, the National Science
Center-Army, and two deployable brigades: the 93rd Signal Brigade and the 513th Military
Intelligence Brigade.

50 Comprehensive Economic Development Strategy | CSRA Regional Commission|
Figure E-14: Location of Fort Gordon
Source: Augusta Area Diversification Initiative (2006)
Fort Gordon is the Augusta area’s largest employer and drives the regional economy. According
to the Economic Impact of Fort Gordon on Columbia and Richmond Counties, Georgia (2003)
study commissioned by the Alliance for Fort Gordon, Fort Gordon accounts for over 18,000
civilian and military jobs and generates $1.2 billion dollars in economic activity and tax revenue
annually. The Fort provides direct and indirect employment to 27.7% of working individuals in
Augusta and 14% in Columbia County. According to the study, the loss of Fort Gordon would
result in a decline of approximately 24.5% of the Richmond County and 12.6% of the Columbia
County tax base.
The contracting needs of Fort Gordon are substantial and vital to the local economy. With an
annual budget of approximately $900 million, Fort Gordon procures a large amount of contract
work from the private sector for maintenance, supplies, construction, manufacturing,
equipment and materials, transportation, communications, and health & food services. Many
local contractors have intentionally located in proximity to Fort Gordon to benefit from contract
work.
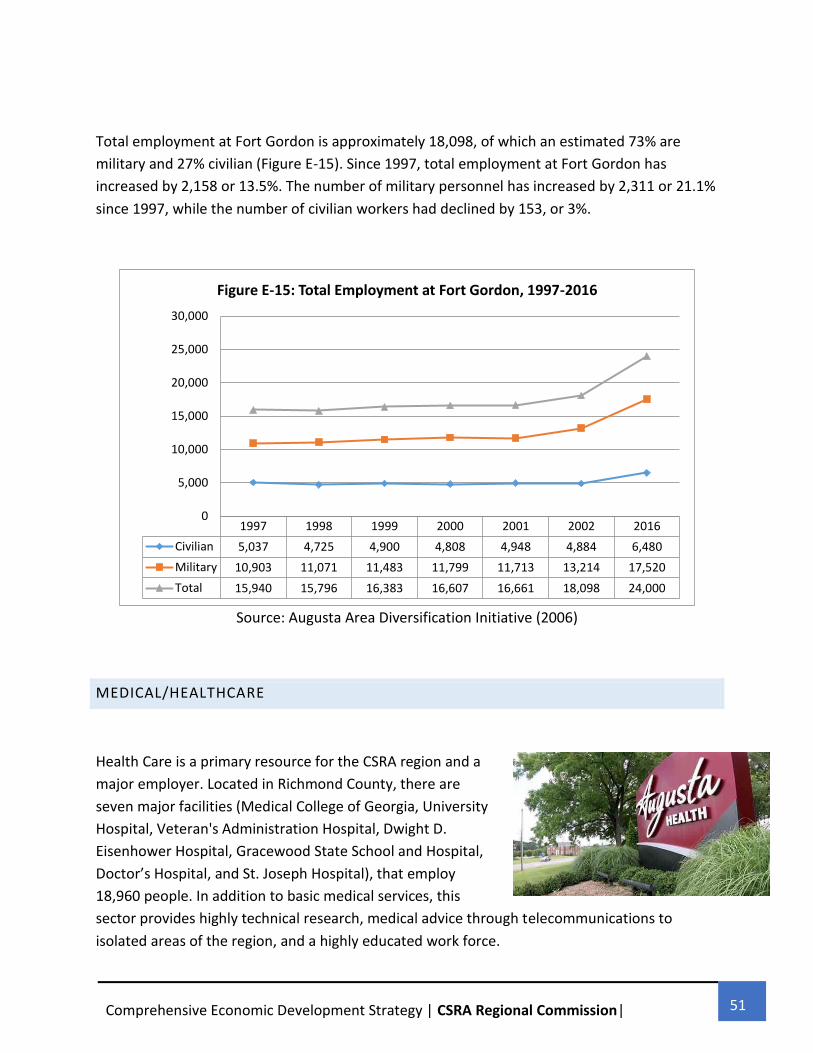
51 Comprehensive Economic Development Strategy | CSRA Regional Commission|
Total employment at Fort Gordon is approximately 18,098, of which an estimated 73% are
military and 27% civilian (Figure E-15). Since 1997, total employment at Fort Gordon has
increased by 2,158 or 13.5%. The number of military personnel has increased by 2,311 or 21.1%
since 1997, while the number of civilian workers had declined by 153, or 3%.
Source: Augusta Area Diversification Initiative (2006)
MEDICAL/HEALTHCARE
Health Care is a primary resource for the CSRA region and a
major employer. Located in Richmond County, there are
seven major facilities (Medical College of Georgia, University
Hospital, Veteran's Administration Hospital, Dwight D.
Eisenhower Hospital, Gracewood State School and Hospital,
Doctor’s Hospital, and St. Joseph Hospital), that employ
18,960 people. In addition to basic medical services, this
sector provides highly technical research, medical advice through telecommunications to
isolated areas of the region, and a highly educated work force.
1997 1998 1999 2000 2001 2002 2016
Civilian 5,037 4,725 4,900 4,808 4,948 4,884 6,480
Military 10,903 11,071 11,483 11,799 11,713 13,214 17,520
Total 15,940 15,796 16,383 16,607 16,661 18,098 24,000
0
5,000
10,000
15,000
20,000
25,000
30,000
Figure E-15: Total Employment at Fort Gordon, 1997-2016

52 Comprehensive Economic Development Strategy | CSRA Regional Commission|
FINANCE, INSURANCE & REAL ESTATE SECTOR
The FIRE sector has enjoyed tremendous growth throughout the
CSRA. Encompassing service products ranging from banking to real
estate, it has been one of the main drivers of the region’s
employment growth. The CSRA’s FIRE jobs increased from 9,029 in
1990 to 18,417 in 2016, or 52.9% (Figure E-16).
Source: U.S. Bureau of Economic Analysis, CA 25 and 25N
The relative of value of the FIRE sector to total employment base is displayed in Figure E-17.
Consistent with the total jobs increase in the sector, the proportional rate has increased by 2%.
9,02910,190
13,443
18,417
0
2,000
4,000
6,000
8,000
10,000
12,000
14,000
16,000
18,000
20,000
1990 2000 2009 2016
Figure E-16: CSRA FIRE Employment, 1990-2016

53 Comprehensive Economic Development Strategy | CSRA Regional Commission|
Source: U.S. Bureau of Economic Analysis, CA 25 and 25N; Calculations by CSRA RC
Table E-10 provides a breakdown of the CSRA’s FIRE subsectors. The Banks, Savings & Lending
Institutions subsector accounts for a majority of employees within the sector (2.0%).
Table E-9: CSRA FIRE Subsector, 2016
Businesses Employees
Number % Number %
Banks, Savings & Lending
Institutions 303 1.9 2,754 1.4
Securities Brokers 112 0.7 522 0.3
Insurance Carriers &
Agents 293 1.8 1,178 0.6
Real Estate, Holding &
Other Investment Offices 634 3.9 4,118 2.0
4.5% 4.6%
5.8%
6.4%
0.0%
1.0%
2.0%
3.0%
4.0%
5.0%
6.0%
7.0%
1990 2000 2009 2016
Figure E-17: CSRA Percentage of FIRE Employment, 1990-2016

54 Comprehensive Economic Development Strategy | CSRA Regional Commission|
Total 1,342 8.3 8,572 4.3
Source: ESRI Business Analyst, Business Summary (2017); Calculations
by CSRA RC
GOVERNMENT AND GOVERNMENT ENTERPRISES SUBSECTOR
The Government sector has long been the most
stable of all employment sectors. While changes in
production and services are common, government
work remain relatively steady and grows in
proportion to population growth. Between 2000
and 2016, employment in Government &
Government Enterprises increased from 52,631to
61,588, or 12.5% (Figure E-18).
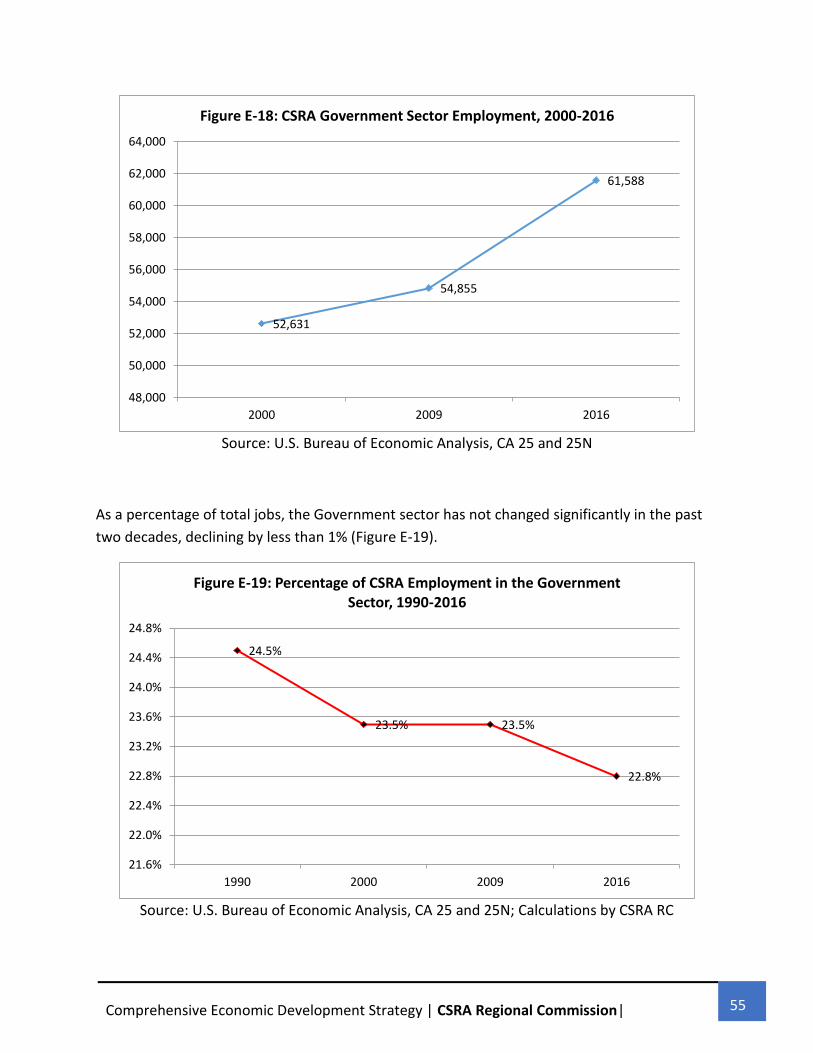
55 Comprehensive Economic Development Strategy | CSRA Regional Commission|
Source: U.S. Bureau of Economic Analysis, CA 25 and 25N
As a percentage of total jobs, the Government sector has not changed significantly in the past
two decades, declining by less than 1% (Figure E-19).
Source: U.S. Bureau of Economic Analysis, CA 25 and 25N; Calculations by CSRA RC
52,631
54,855
61,588
48,000
50,000
52,000
54,000
56,000
58,000
60,000
62,000
64,000
2000 2009 2016
Figure E-18: CSRA Government Sector Employment, 2000-2016
24.5%
23.5% 23.5%
22.8%
21.6%
22.0%
22.4%
22.8%
23.2%
23.6%
24.0%
24.4%
24.8%
1990 2000 2009 2016
Figure E-19: Percentage of CSRA Employment in the Government Sector, 1990-2016

56 Comprehensive Economic Development Strategy | CSRA Regional Commission|
Table E-10 provides a breakdown of the Government subsectors. A majority of Government
employment is in the local government sector (19,500), with most of those in local schools and
municipal government offices.
Table E-10: CSRA Government Subsector, 2016
Number
of Firms
Number
Employe
d
Percent of
Employed
Federal Government 105 8,230 4.7
State Government 174 11,863 6.8
Local Government 275 19,500 11.1
Total 554 39,593 22.6
Source: Georgia Department of Labor Area Labor Profiles
(2016); Calculations by CSRA RC
3.4 REGIONALLY SIGNIFICANT INDUSTRIES
Identifying regionally significant industries is important in considering the strengths,
weaknesses, opportunities and threats of the regional economy, as well as measuring potential
for growth.
The analysis presented below is based on U.S. Department of Labor ‘super sectors’, an
aggregate of all industries falling under broad sectors. These super sectors are used because
the U.S. Bureau of Economic Analysis employment numbers contain too many “Not Disclosed”
sectors, rendering the data difficult to use in this type of analysis.
SHIFT SHARE ANALYSIS
Shift-share analysis is an analytical technique that is used to compare regional growth rates
over time with national growth rates by disaggregating growth into three components:

57 Comprehensive Economic Development Strategy | CSRA Regional Commission|
Employment change due to national growth - i.e. the increase in employment that
would be expected if an industry grew in a local area at the same rate as the national
economy.
Employment change due to the proportional shift - i.e. the change in employment that
would be expected if an industry expanded or contracted at the same rate above or
below the national growth rate locally as nationally.
Growth due to the regional factors that cause a local industry to outpace or grow slower
than the national industry. This value is referred to as the differential shift. The
differential shift can be interpreted as the extent to which an area has a competitive
advantage for that sector. A positive differential shift implies the area has a competitive
advantage.
The number of jobs in the CSRA is a primary indicator of local economic health and
vitality. That is why it is important for the region to understand employment conditions. The
employment data presented in this analysis were obtained from a sample of the U.S. Bureau of
Labor Statistics' Census of Employment and Wages.
SHIFT-SHARE RESULTS FOR THE CSRA
THE INDUSTRIAL MIX COMPONENT
The industrial mix component is found by calculating the percent growth rate for an economic
sector at the national level and subtracting from it the national growth component. Thus, the
industrial mix component measures how well an industry has grown, net of effects from the
business cycle.
Table E-13 lists these components for each sector. The highest industrial mix component was
38.2 percent in the Professional & Business Services sector. If the CSRA’s employment was
concentrated in sectors with higher industrial mix components, then the region could expect
more employment growth. After adding up across all eleven sectors, it appears that the
industrial mix component was responsible for decreasing the region's employment by -527
jobs. This indicates that the CSRA has a concentration of employment in industries that are not
increasing nation-wide, in terms of employment.

58 Comprehensive Economic Development Strategy | CSRA Regional Commission|
THE COMPETITIVE SHARE
Another component of shift-share analysis is the competitive share. It is the remaining
employment change that is left over after accounting for the national and industrial mix
components. If a sector's competitive share is positive, then the sector has a local advantage in
promoting employment growth.
The top three sectors in competitive share were Information (34.2), Education and Health
Services (5.4) and Other Services (2.3) share component is negative (Table E-12). This indicates
that the CSRA can be more competitive in securing additional employment. A positive
competitive share component would indicate that a productive advantage. This advantage
could be due to local firms having superior technology, management, or market access, or the
local labor force having higher productivity.
Table E-12: Shift Share Analysis, CSRA and the United States, 1990-2014
Sector
National
Growth
%
Nationa
l
Growth
Jobs
Indust
rial
Mix
%
Indust
rial
Mix
Jobs
Competi
tive
Share
%
Competitive
Share
Jobs
Education and Health
Services 25.8 7,444 38.0 10,974 5.4 1,548
Leisure and Hospitality 25.8 2,988 30.3 3,515 1.3 154
Information 25.8 520 -26.6 -537 34.2 690
Other Services 25.8 916 -4.2 -149 2.3 81
Financial Activities 25.8 1,434 -13.4 -747 -12.2 -680
Natural Resources &
Mining 25.8 672 -7.5 -194 -45.8 -1,194
Manufacturing 25.8 6,403 -57.7 -
14,324 -11.0 -2,736
Public Administration 25.8 1,339 -12.5 -647 -10.1 -527

59 Comprehensive Economic Development Strategy | CSRA Regional Commission|
Professional & Business
Services 25.8 2,778 55.0 5,930 -5.1 -550
Trade, Transportation,
and Utilities 25.8 7,421 -11.5 -3,296 -8.8 -2,542
Construction 25.8 2,494 -9.0 -875 -42.3 -4,059
Total 25.8 34,409 -19.1 -350 -92.1 -9.845
Source: http://georgia.reaproject.org/analysis/shift-share/
3.5 BUSINESS CLUSTERS
The development of cluster networks facilitates the interaction and sharing of information
among businesses and institutions. More cost effective solutions to common problems may be
achieved, such as training programs, collective purchasing, and shared marketing. The following
clusters were identified in the region:
CYBER COMMAND
Cyber growth in Augusta in expected to grow over the next decade. On January 11, 2017
Governor Nathan Deal announced $50 million in funding to establish the Georgia Cyber
Innovation and Training Center in Augusta. This world-class training facility will combine
expertise in academia, private industry and government to establish statewide cybersecurity
standards.
Augusta’s cyber workforce is estimated to be 2,880 not counting the military. The average pay
for these positions are estimated to be $76,489. When counting the military, Augusta’s cyber
workforce is estimated to be 12,716.
RETAIL CLUSTERS
The Main Streets of incorporated areas in all thirteen counties are home to many retail stores.
These are high traffic areas that attract a significant number of shoppers.
TOURISM & HOSPITALITY CLUSTER
The cultural and historic assets of Main Streets provide attractions to support tourism.
Significant investments in support of this cluster have been made in recent years, such as the

60 Comprehensive Economic Development Strategy | CSRA Regional Commission|
enhancement of walkable areas and the restoration of many historic assets. By promoting a
planned, coordinated tourism effort, the region may use its unique assets to bring dollars from
visitors into its economy.
MANUFACTURING CLUSTERS
The manufacturing sector in the region encompasses a variety of industries and is concentrated
along major arteries such as U.S 25 and U.S 1.
MILITARY CLUSTERS
The areas adjacent to Fort Gordon include significant contractor activity that includes small
manufacturers of specialized electronic equipment.
EDUCATION & MEDICAL CLUSTERS
Education and medical clusters are located within the City of Augusta and encompass over a
dozen major colleges and hospitals.
3.6 INCOME AND WAGES
Incomes rates throughout the CSRA have historically been lower than the state average. With
the exception of Columbia County, average CSRA per capita income is 16.6% below the state
average (Table E-13). However, income levels in eleven of thirteen CSRA counties have
increased at a faster rate than the state average in the past two decades. All of the CSRA has
seen income rates increase since 2000.

61 Comprehensive Economic Development Strategy | CSRA Regional Commission|
Table E-14 presents average weekly wages by industry. Like the other income and wage
indicators noted above, weekly wages are generally below the state average.
Table E-13: Per Capita Personal Income for Selected Jurisdictions, 2000-2015
2000 2009 2015
1990-2015
% Change
Burke County $17,739 $25,666 $31,527 17.7
Columbia County $30,532 $41,943 $44,250 14.4
Glascock County $20,035 $24,230 $27,955 13.9
Hancock County $13,796 $21,208 $25,607 16.2
Jefferson County $18,694 $25,429 $30,327 16.2
Jenkins County $18,042 $23,332 $26,195 14.5
Lincoln County $19,738 $27,980 $32,682 16.5
McDuffie County $22,797 $31,499 $32,096 14.0
Richmond County $22,437 $29,907 $34,015 15.1
Taliaferro County $16,030 $26,037 $25,207 15.7
Warren County $17,972 $28,662 $30,586 17.0
Washington County $20,821 $32,708 $29,553 14.1
Wilkes County $20,863 $28,411 $29,350 14.0
CSRA Average $19,961 $30,706 $30,719 14.5
Georgia Average $28,531 $43,961 $51,244 17.9
Source: U.S. Bureau of Economic Analysis, CA 1-3; Calculations by CSRA RC

62 Comprehensive Economic Development Strategy | CSRA Regional Commission|
Table E-14: Weekly Wage Rates for Selected Industries, Q4 2016
CSRA Georgia
Region vs.
State
Difference
Agriculture, Forestry, Fishing and Hunting $815 $583 28.5
Construction $836 $969 -15.9
Manufacturing $1,019 $1,066 -4.6
Wholesale Trade $944 $1,380 -46.2
Retail Trade $477 $520 -9
Transportation & Warehousing $788 $995 -26.3
Information $917 $1,445 -57.6
Finance and Insurance $972 $1,393 -43.3
Healthcare & Social Assistance $944 $920 2.5
Accommodation & Food Services $269 $328 -21.9
Public Administration $747 $947 -26.8
All Industries $759 $906 -19.4
Source: Georgia Department of Labor - 4th Qtr. 2010 (October, November, December)
Quarterly Census of Employment and Wages, Sector (2 digit) data for SDR 3, Aggregate of all
types.
3.7 LABOR FORCE ESTIMATES

63 Comprehensive Economic Development Strategy | CSRA Regional Commission|
Labor force estimates are presented in Table E-15. The
CSRA’s unemployment rate lies at the statewide average
(6.1%). The region’s unemployment rate has traditionally
been slightly above the state and national averages
(Figure E-20). During the recessions of 1991 and 2001,
the region experienced spikes in the overall
unemployment rate as did the state and nation.
Throughout the 1990s, textile plant closures kept the
CSRA’s unemployment rate higher than the state or
nation, but regional focus on job creation helped the area
to reduce its unemployment rate to a more reasonable level.
Table E-15: Labor Force Estimates for Selected Jurisdictions,
2016
CSRA Georgia
Civilian Labor Force 205,857 4,920,464
Employed 193,315 4,656,255
Unemployed 12,542 264,209
Unemployment Rate 6.1% 5.4%
Source: Georgia Department of Labor - 2016 Labor Force
Estimates

64 Comprehensive Economic Development Strategy | CSRA Regional Commission|
Source: Georgia Department of Labor; U.S Department of Labor
Examining unemployment rates by county with the most recent available U.S. Department of
Labor data (April 2016), it becomes clear that most rural parts of the CSRA are suffering from
unemployment rates that are significantly above the state and national averages (Figure E-21).
Hancock, Jenkins and Warren Counties have been particularly hard hit with plant closures,
reflected in unemployment rates that are double the state and national averages.
2000 2001 2002 2003 2004 2005 2006 2007 2008 2009 2010 2016
CSRA 4.2% 4.9% 5.4% 5.4% 5.4% 6.2% 5.6% 5.7% 7.0% 9.9% 10.1% 6.1%
Georgia 3.5% 4.0% 4.9% 4.8% 4.8% 5.3% 4.4% 4.7% 6.4% 9.7% 10.2% 5.4%
USA 4.0% 4.7% 5.8% 6.0% 5.5% 5.1% 4.6% 4.6% 5.8% 9.3% 9.6% 4.9%
0%
2%
4%
6%
8%
10%
12%
Figure E-20: Unemployment Rate for Selected Jurisdictions, 2000-2016

65 Comprehensive Economic Development Strategy | CSRA Regional Commission|
Source: Georgia Department of Labor; U.S. Department of Labor
3.8 PROJECTED JOB GROWTH
The CSRA economy was built on traditional industries such as manufacturing, which remains a
critical sector. Changes in the regional economy have made growth industries such as health
care, social services as well as finance and information technology, the areas in which job
creation will occur. These industries will play an increasing role in the area’s employment
picture over the next decade.
This following analysis of projected job growth is based on the Georgia Area Workforce Trends:
Projections to 2018. The analysis is at the Workforce Investment Area (WIA) as defined by the
Georgia Department of Labor. WIA #12 includes Richmond and Burke Counties. WIA #13
encompasses 12 counties in east central Georgia: Columbia, Glascock, Hancock, Jefferson,
Jenkins, Lincoln, McDuffie, Taliaferro, Warren, Washington and Wilkes. For analysis purposes,
the two WIAs must be examined separately because WIA #13 includes Screven County, which is
not part of the CSRA.
The Georgia Department of Labor projects approximately 20,000 new jobs in the region
through 2018.
10.2%
6.7%
11.2%
19.5%
13.6%
19.2%
11.1%9.2% 9.3%
12.2%
15.4%13.8%
12.6%12.6%
9.9%9.0%
0%
5%
10%
15%
20%
25%
Figure E-21: Unemployment Rate for Selected Jurisdictions, April 2016

66 Comprehensive Economic Development Strategy | CSRA Regional Commission|
WORKFORCE DEVELOPMENT AREA #12 – RICHMOND & BURKE COUNTIES
FASTEST GROWING OCCUPATIONS
The fast-growing occupations will have better employment prospects than occupations with
slow or declining employment. Most of the annual job openings will result from both the need
to replace workers who change jobs and new job creation. The majority of new job openings in
WIA #12 will be in the service and government sectors (Figure E-22).
Source: Georgia Department of Labor Area Workforce Trends: Projections to 2018
TOTAL INDUSTRY GROWTH
Top industry growth is detailed in Table E-16. The Health Care & Social Assistance and
Educational Services sectors will account for the vast majority of industry growth rates.
Combines, these two sectors will contribute 5,571 new jobs through 2018.
1,597
1,467
1,181
899
826
574
528
514
412
363
0 200 400 600 800 1,000 1,200 1,400 1,600 1,800
Healthcare Practitioners
Education & Training Occupations
Health Diagnosing & Treating
Registered Nurses
Healthcare Support Occupations
Postsecondary Teachers
Nursing & Home Health Aides
Primary, Secondary, Special Ed Teachers
Health Technologists
Nursing Aides, Orderlies & Attendents
Figure E-22: Occupations with the Most Openings Through 2018 in WIA 12 (Richmond-Burke)

67 Comprehensive Economic Development Strategy | CSRA Regional Commission|
Table E-16: Top Industry Growth Sectors through 2018 in Workforce Area 12
2008
Estimated
Employmen
t
2018
Project
Employme
nt
Total 2008-
2018
Employmen
t Change
2008-
2018 %
Change
Health Care & Social Assistance 18,515 21,805 3,290 17.8
Educational Services 13,780 16,061 2,281 16.6
Transportation & Warehousing 2,648 3,223 575 21.7
Professional & Technical Services 3,921 4,474 553 14.1
Utilities 1,149 1,342 193 16.8
Other Services (Except Government) 4,538 4,727 189 4.2
Local Government 3,501 3,549 48 1.4
Management of
Companies/Enterprises 252 269 17 6.7
Arts, Entertainment & Recreation 1,133 1,142 9 0.8
Source: Georgia Department of Labor Area Workforce Trends: Projections to 2018

68 Comprehensive Economic Development Strategy | CSRA Regional Commission|
WIOA AREA #13 – EAST
CENTRAL GEORGIA
FASTEST GROWING
OCCUPATIONS
The fastest growing occupations in
WIA #13 are diverse and associated
with various industry sectors (Figure
E-23). Most of these occupations will
require formal education beyond high school and pay above-average wages.
Source: Georgia Department of Labor Area Workforce Trends: Projections to 2018
590
400
400
320
310
230
210
200
170
160
0 100 200 300 400 500 600 700
Food Preparation & Service Workers
Elementary School Teachers
Teacher Assistants
Retail Salespersons
Waiters & Waitresses
Customer Service Reps.
Registered Nurses
Child Care Workers
Middle School Teachers
Secondary School Teachers
Figure E-23: Occupations with the Most Openings Through 2018 in WIA 13 (East Central Georgia)

69 Comprehensive Economic Development Strategy | CSRA Regional Commission|
TOTAL INDUSTRY GROWTH
Total employment in WIA Area #13 is expected to grow from almost 74,000 jobs in 2006 to
more than 83,000 by the year 2018, which equates to almost 1,000 new jobs added each year.
The top ten industries in this area with the most job growth are listed in Table E-17. Similar to
WIA #12, the Educational Services and Health Care & Social Assistance sectors will lead growth
sectors, accounting for almost half the projected job growth through 2018.
Table E-17: Top Industry Growth Sectors through 2018 in WIA 13 East-Central Georgia
2008 Estimated
Employment
2018 Project
Employment
Total 2008-
2018
Employment
Change
2008-2018
% Change
Educational Services 8,214 10,479 2,265 27.6%
Health Care & Social Assistance 6,061 7,819 1,758 29%
Accommodation & Food Services 5,145 6,439 1,294 25.2%
Professional & Technical Services 1,770 2,316 546 30.8%
Other Services (Except Government) 2,778 3,233 455 16.4%
Arts, Entertainment & Recreation 627 986 359 57.3%
Retail Trade 8,357 8,683 326 3.9%
Government 6,193 6,493 300 4.8%
Transportation & Warehousing 1,610 1,896 286 17.8%
Waste Management & Admin.
Support 3,185 3,422 237 7.4%
Source: Georgia Department of Labor Area Workforce Trends: Projections to 2018

70 Comprehensive Economic Development Strategy | CSRA Regional Commission|
DECLINING INDUSTRIES
Also included in the Georgia Department of Labor’s job projections are industries that are in
decline. Job losses are projected in various sectors, led by Retail Trade (-1,098), Manufacturing
(-787), and Government (-553) (Table E-18).
Table E-18: Declining Industry Employment through 2018 in WIA #12 Richmond-Burke Area
2008
Estimated
Employment
2018 Project
Employment
Total 2008-
2018
Employment
Change
2008-2018
% Change
Retail Trade 11,442 10,344 -1,098 -9.6
Manufacturing 8,647 7,860 -787 -9.1
Government 11,889 11,336 -553 -4.7
Construction 4,469 3,955 -514 -11.5
Federal Government 5,745 5,322 -423 -7.4
Finance & Insurance 2,858 2,478 -380 -13.3
Accommodation & Food Services 9,902 9,678 -224 -2.3
Agriculture, Forestry & Fishing 681 476 -205 -30.1
Wholesale Trade 2,947 2,762 -185 -6.3
State Government 2,128 2,039 -89 -4.2
Source: Georgia Department of Labor - Long Term Industry Projections: 2008-2018
Projected job declines in WIA #13 are primarily in good-producing sectors (Table E-19),
reflecting the strong manufacturing and resource extraction-orientation of the rural CSRA
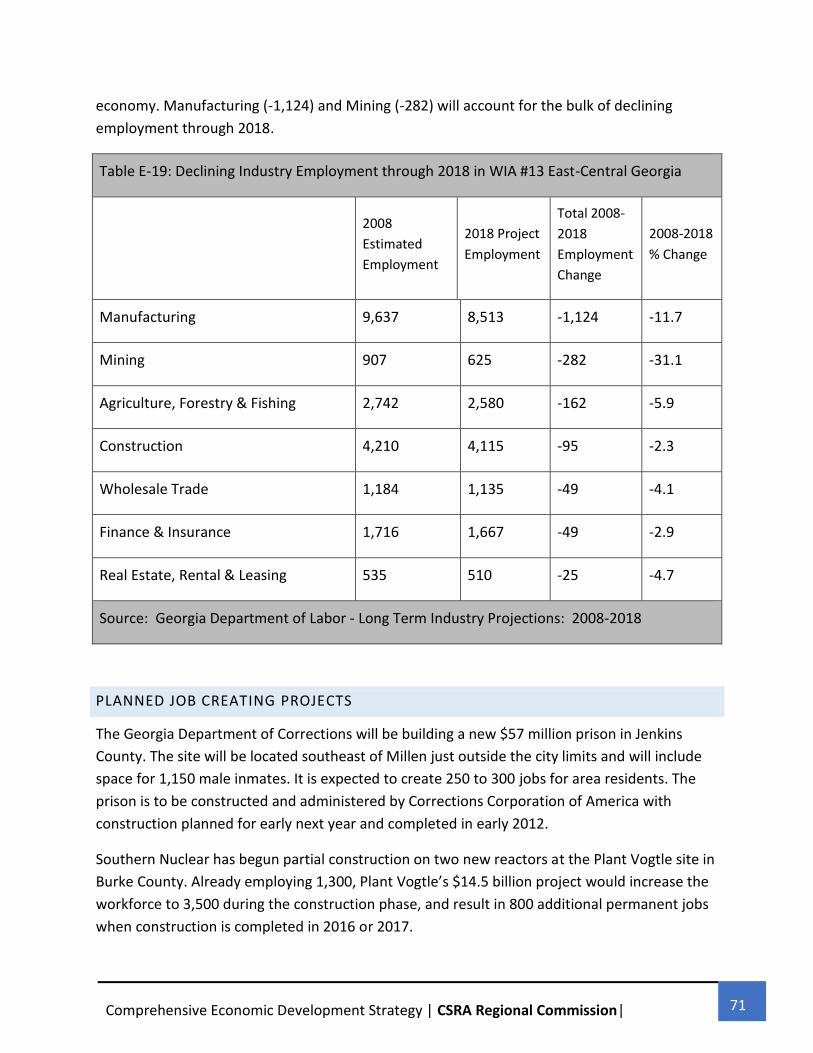
71 Comprehensive Economic Development Strategy | CSRA Regional Commission|
economy. Manufacturing (-1,124) and Mining (-282) will account for the bulk of declining
employment through 2018.
Table E-19: Declining Industry Employment through 2018 in WIA #13 East-Central Georgia
2008
Estimated
Employment
2018 Project
Employment
Total 2008-
2018
Employment
Change
2008-2018
% Change
Manufacturing 9,637 8,513 -1,124 -11.7
Mining 907 625 -282 -31.1
Agriculture, Forestry & Fishing 2,742 2,580 -162 -5.9
Construction 4,210 4,115 -95 -2.3
Wholesale Trade 1,184 1,135 -49 -4.1
Finance & Insurance 1,716 1,667 -49 -2.9
Real Estate, Rental & Leasing 535 510 -25 -4.7
Source: Georgia Department of Labor - Long Term Industry Projections: 2008-2018
PLANNED JOB CREATING PROJECTS
The Georgia Department of Corrections will be building a new $57 million prison in Jenkins
County. The site will be located southeast of Millen just outside the city limits and will include
space for 1,150 male inmates. It is expected to create 250 to 300 jobs for area residents. The
prison is to be constructed and administered by Corrections Corporation of America with
construction planned for early next year and completed in early 2012.
Southern Nuclear has begun partial construction on two new reactors at the Plant Vogtle site in
Burke County. Already employing 1,300, Plant Vogtle’s $14.5 billion project would increase the
workforce to 3,500 during the construction phase, and result in 800 additional permanent jobs
when construction is completed in 2016 or 2017.

72 Comprehensive Economic Development Strategy | CSRA Regional Commission|
The Jefferson County Development Authority recently initiated a project to construct the Kings
Mill Commerce Park near Wrens, Georgia. This industrial park boasts 664 acres of developable
property and is located within 25 miles of Interstate 20. Rail, water, sewer, and natural gas are
readily available at the site.

73 Comprehensive Economic Development Strategy | CSRA Regional Commission|
4.0 INTRODUCTION
Developing and maintaining a healthy economy requires an understanding of the underlying
structures that contribute to individual sectors. It makes little sense to actively recruit very
profit margin-sensitive industries if local and state taxes are substantially higher than other
localities. It is also counter-productive to recruit major distribution centers if highway
infrastructure is limited or in poor condition. Matching economic resources with the right
recruiting strategy is vital to economic development efforts.
This section examines the CSRA’s economic growth potential by assessing a range of variables
businesses use to make location decisions. While determinants vary from industry to industry,
most businesses examine the following issues during the site selection process:
Infrastructure availability and quality
Health of nearby major metropolitan areas
Business friendly atmosphere
Labor availability and costs
Taxes
CSRA counties have active economic development programs and expend substantial resources
providing assistance to their existing business base. Competition for new businesses is fierce,
and local and state incentive packages continue to grow. Increasingly, only communities with
substantial incentive packages to offer are successful in attracting major new employers.
The region’s manufacturing sector has declined in recent years due to changing markets,
corporate downsizing, and free trade. Many low-skill manufacturing jobs have left the CSRA for
lower cost locations overseas. Decisions on facility closures or downsizing are generally not
made locally and are outside of local control or influence. In most cases, local incentives cannot
compete with national or international factors affecting the viability of local facilities.
From an industrial/commercial site selection standpoint, the CSRA remains a very attractive
location. The availability of public infrastructure to support growth is already in place and has
sufficient capacity. The region’s challenges come from other similar communities throughout
the southeast. These areas (for example, Savannah, GA. Charleston, SC, Memphis, TN) offer
many of the same amenities available in the CSRA, and pursue new investment with the same
vigor and focus. Competitors may even view CSRA businesses as potential relocation targets for
their own efforts.

74 Comprehensive Economic Development Strategy | CSRA Regional Commission|
Cyber growth in Augusta in expected to grow over the next decade. On January 11, 2017
Governor Nathan Deal announced $50 million in funding to establish the Georgia Cyber
Innovation and Training Center in Augusta. This world-class training facility will combine
expertise in academia, private industry and government to establish statewide cybersecurity
standards.
Augusta’s cyber workforce is estimated to be 2,880 not counting the military. The average pay
for these positions are estimated to be $76,489. When counting the military, Augusta’s cyber
workforce is estimated to be 12,716.
STRENGTHS, WEAKNESSES, OPPORTUNITIES AND THREATS (SWOT)
A SWOT (strengths, weaknesses, opportunities, and threats) analysis is a technique/method used to
systematically gather and analyze information and identify issues and options facing an area.
The SWOT analysis provides information that is helpful in matching resources and capabilities
to the competitive environment within which a region operates. This framework helps decision-
makers focus activities and resources into areas where they can be most effective, and is a key
step in crafting an economic diversification strategy.

75 Comprehensive Economic Development Strategy | CSRA Regional Commission|
STRENGTHS WEAKNESSES
I
N
T
E
R
N
A
L
F
A
C
T
O
R
S
Strong crossroads between Atlanta, Savannah and Columbia, SC.
Proximity to other major cities and ports.
Continued strong growth of the metropolitan economy.
Availability of adequate long-term water supply.
Affordable housing supply.
Available workforce.
Intellectual capital (higher education opportunities).
International branding of Augusta (Master’s Golf Tournament).
Strong entrepreneurial spirit.
Parallels in strategies among economic development organizations.
Accessible industrial and commercial areas.
Community very responsible to business needs.
Favorable land use and zoning regulations.
Low broadband infrastructure projects in rural areas.
Lack of “living wages” jobs available.
Unfinished infrastructure projects.
Lack of tech-oriented skilled workers.
School test scores.
Weak population growth.
High unemployment.
Week population growth.
Week national economy.
OPPORTUNITIES THREATS
E
X
T
E
R
N
A
L
F
A
C
T
O
R
S
Strong area workforce.
Cyber Command Center.
Fort Gordon mission growth.
Energy sector growth (i.e. Plant Vogtle, Solar).
Area recreational facilities.
Biotech sector growth.
Strong entrepreneurial local business community.
Increased tourism.
Stabilizing and growing national economy.
Growing international markets need trading partners.
Increased foreign investment.
Loss of jobs in rural counties.
Reduction in state/federal funding.
Uncertainty around state/federal programs.
Declining local revenue base.
Loss of anchor industries.
Lack of broadband infrastructure in rural counties.
Future base realignment and closure rounds.
Potential of overlap with other economic development organizations.
Too much regional competition (plentiful supply of well-located office space and land available in the southeast and therefor no compelling need for an employer to located in the studied area).
Fluctuating commodity prices, particularly in natural resources.
Declining Industry Sectors.
Increase in development of automation, robotics and advanced manufacturing.
4.2 INSTITUTIONAL CAPACITY
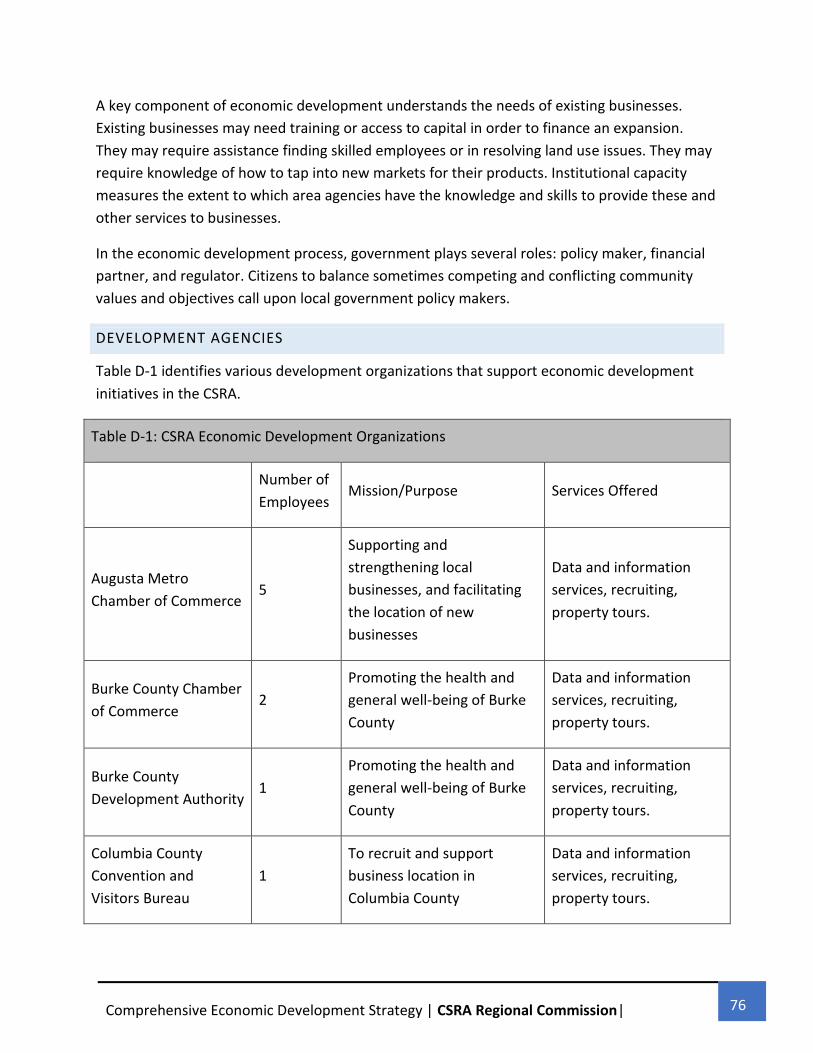
76 Comprehensive Economic Development Strategy | CSRA Regional Commission|
A key component of economic development understands the needs of existing businesses.
Existing businesses may need training or access to capital in order to finance an expansion.
They may require assistance finding skilled employees or in resolving land use issues. They may
require knowledge of how to tap into new markets for their products. Institutional capacity
measures the extent to which area agencies have the knowledge and skills to provide these and
other services to businesses.
In the economic development process, government plays several roles: policy maker, financial
partner, and regulator. Citizens to balance sometimes competing and conflicting community
values and objectives call upon local government policy makers.
DEVELOPMENT AGENCIES
Table D-1 identifies various development organizations that support economic development
initiatives in the CSRA.
Table D-1: CSRA Economic Development Organizations
Number of
Employees Mission/Purpose Services Offered
Augusta Metro
Chamber of Commerce 5
Supporting and
strengthening local
businesses, and facilitating
the location of new
businesses
Data and information
services, recruiting,
property tours.
Burke County Chamber
of Commerce 2
Promoting the health and
general well-being of Burke
County
Data and information
services, recruiting,
property tours.
Burke County
Development Authority 1
Promoting the health and
general well-being of Burke
County
Data and information
services, recruiting,
property tours.
Columbia County
Convention and
Visitors Bureau
1
To recruit and support
business location in
Columbia County
Data and information
services, recruiting,
property tours.

77 Comprehensive Economic Development Strategy | CSRA Regional Commission|
Table D-1: CSRA Economic Development Organizations
Number of
Employees Mission/Purpose Services Offered
Columbia County
Development Authority 2
To encourage new and
expanding economic growth
in the County
Data and information
services, recruiting,
property tours.
Development Authority
of Richmond County 3
Attract new business to the
Augusta-Richmond County
area
Data and information
services, recruiting,
property tours.
Development Authority
of Washington County 1
Leading the economic
development for the county
Data and information
services, recruiting,
property tours.
Forward McDuffie 3 Attract new business to
McDuffie County
Data and information
services, recruiting,
property tours.
Jefferson County
Chamber of Commerce 1
Supporting and
strengthening local
businesses, and facilitating
the location of new
businesses
Data and information
services, recruiting,
property tours.
Jefferson County
Development Authority 2
Supporting and
strengthening local
businesses, and facilitating
the location of new
businesses
Data and information
services, recruiting,
property tours.
Jenkins County
Chamber of Commerce 1
To recruit and support
business location in Jenkins
County
Data and information,
existing business
promotion.

78 Comprehensive Economic Development Strategy | CSRA Regional Commission|
Table D-1: CSRA Economic Development Organizations
Number of
Employees Mission/Purpose Services Offered
Jenkins County
Development Authority 1
To recruit and support
business location in Jenkins
County
Data and information
services, recruiting,
property tours.
Lincoln County
Development Authority 1
Promote economic
development in our county,
to create jobs and enhance
the quality of life for citizens
Data and information
services, recruiting,
property tours.
Lincolnton-Lincoln
County Chamber of
Commerce
1
Supporting and
strengthening local
businesses, and facilitating
the location of new
businesses
Data and information
services, recruiting,
property tours.
Millen Downtown
Development Authority 1
Promoting downtown Millen
for investments and business
location
Data and information
services, recruiting,
property tours.
Warren County
Chamber of Commerce 1
To play an active profitable
role in the community
Data and information
services, recruiting,
property tours.
Warren County
Development Authority 1
To assist existing industries,
and prospective companies
with expansion or site
location.
Data and information
services, recruiting,
property tours.
Washington County
Chamber of Commerce 1
To provide the leadership
necessary for the growth
and development of all East
Central Georgia
Data and information
services, recruiting,
property tours.

79 Comprehensive Economic Development Strategy | CSRA Regional Commission|
Table D-1: CSRA Economic Development Organizations
Number of
Employees Mission/Purpose Services Offered
Washington
Downtown
Development Authority
1 Promote downtown
Washington for investment
Data and information
services, recruiting,
property tours.
Washington Economic
Development Authority 1
Promote the City of
Washington for business
location
Data and information
services, recruiting,
property tours.
Washington Urban
Redevelopment
Authority
1 Revitalize needed parts of
the City of Washington
Data and information
services, grants, project
management.
Washington-Wilkes
Chamber of Commerce 1
Promoting Washington-
Wilkes County for
investments and business
location
Data and information
services, recruiting,
property tours.
Washington-Wilkes
Payroll Development
Authority
1
Promoting Washington-
Wilkes County for
investments and business
location
Data and information
services, recruiting,
property tours.
CSRA Business Lending 3
To assist CSRA small
business through
partnerships with area banks
Loan processing, bank and
Small Business Center
referrals
CSRA Regional
Commission 9
To provide planning,
management and
information services to
members counties in a
professional, ethical, cost
effective and efficient
manner; and to serve as a
forum for addressing local
Data and information,
project planning, grant
writing.

80 Comprehensive Economic Development Strategy | CSRA Regional Commission|
Table D-1: CSRA Economic Development Organizations
Number of
Employees Mission/Purpose Services Offered
government and its citizens’
needs.
The number of development groups reflects the region’s emphasis on economic development.
In the past decade, public and private sector interests in the CSRA have focused increasing
attention on economic development – particularly on job growth. Gradual losses in traditional
manufacturing industries and a declining population base have resulted in concern about the
area’s economic future. The decline in sectors such as manufacturing has also placed pressure
on the region’s tax base. As economic restructuring occurring on the national and international
levels has reduced the number of good paying low-skilled jobs in the manufacturing sector,
rural counties have experienced disproportionately higher rates of unemployment.
COUNTY AND CITY GOVERNMENTS
There are a number of ways that municipalities support economic development efforts. First,
one of the most significant direct actions municipalities can take is to provide the necessary
infrastructure, including:
Developing long-term facility expansion plans.
Designing specific systems and projects.
Raising or borrowing local funds to finance the projects or act as a conduit for state and
federal funds; and
Forming public-private partnerships to jointly develop projects.
Second, municipalities can deliver high quality and cost effective urban services. These
necessary services include police and fire protection, parks & recreation, and a well-run land
use planning and regulatory process. In addition, municipalities can actively participate in
public/private groups designed to help businesses and the development community as they
work their way through state and federal regulatory processes.
Third, municipalities can directly impact economic development by conducting market research
or by investing and developing properties. For example, municipalities could develop, maintain,
81 Comprehensive Economic Development Strategy | CSRA Regional Commission|
and disseminate data and analysis on local development conditions and trends, as well as
monitor important trends and assumptions upon which plans, programs, and strategies are
based. In addition, municipalities can buy land, aggregate parcels, and make necessary
improvement so that it is ready for new development or redevelopment. For some projects,
municipalities (through the use of a development authority) can issue industrial revenue bonds
or other tax-free municipal bonds. This also allows joint ventures with private sector partners
for appropriate development.
Lastly, municipalities’ public investment in urban facilities, such as city/county administrative
offices, community centers, and cultural venues can be a factor in inducing further economic
development. By targeting a sub-area for an infusion of redevelopment investment and
daytime population, nearby businesses may see a greater captive market and also be
encouraged to renovate and improve their establishments. Cultural and recreational facilities
can have a wide range of economic impact, from simply attracting residents to a particular part
of the city (e.g., downtown business district) more frequently to attracting visitors who will
bring new revenue to the local economy through tourist expenditures.
CHAMBERS OF COMMERCE
CSRA counties all have active Chambers of Commerce, whose membership consist of hundreds
of area businesses, and focused on business promotion, retention and expansion. Traditionally,
the Chambers have provided advocacy support, marketing, services and information for their
business members, and resources for start-up and growing businesses. They are the first point
of contact for all non-industrial development.
Marketing – particularly the dissemination of information on the area - is a major function of
area Chambers of Commerce. Most counties have developed chamber websites to provide
visitors and potential businesses with information on their respective counties and the support
programs they offer.
Figure D-1 presents a screen shot of Burke County’s Chamber of Commerce website. The
chamber website is typical of other CSRA chamber websites, and includes information about
the chamber, a directory of area businesses and calendar of events. Contact information is
provided for potential businesses interested in locating in Burke County

82 Comprehensive Economic Development Strategy | CSRA Regional Commission|
Figure D-1: Burke County Chamber of Commerce Website
Source: Burke County Chamber of Commerce https://www.burkechamber.org/
Jefferson County’s Chamber of Commerce website is presented in Figure D-2. This website is
focused on giving visitors an overview of the business climate in the county. In addition to news
on events for current chamber membership, the website includes as very detailed guide on
starting a business in Jefferson County.

83 Comprehensive Economic Development Strategy | CSRA Regional Commission|
Figure D-2: Jefferson County Chamber of Commerce Website
Source: Jefferson County Chamber of Commerce
http://www.jeffersoncounty.org/chamber.htm
DEVELOPMENT AUTHORITIES
There are a number of county Development Authorities in the CSRA. Development Authorities
are non-profit industrial development organizations, supported by a broad-based board of
directors and their respective local governments. Over the years, the Development Authorities
have been instrumental in attracting quality businesses to their respective counties. They
provide confidential services to prospective businesses, including technical assistance,
employee recruitment and training information, site selection services, financial assistance
information, community network assistance, business development information, and retention
and expansion services.
The Development Authorities have administrative funding and staff resources at their disposal
and are charged with overseeing and coordinating all industrial development activities within
their jurisdictions. The Development Authorities work to create and maintain an inventory of
quality industrial and commercial land and buildings sufficient to meet market demand. They
also play a key role in advocating for economic development tools, help organize economic
development stakeholders within their county, and serve as a liaison with regional and state
agencies.
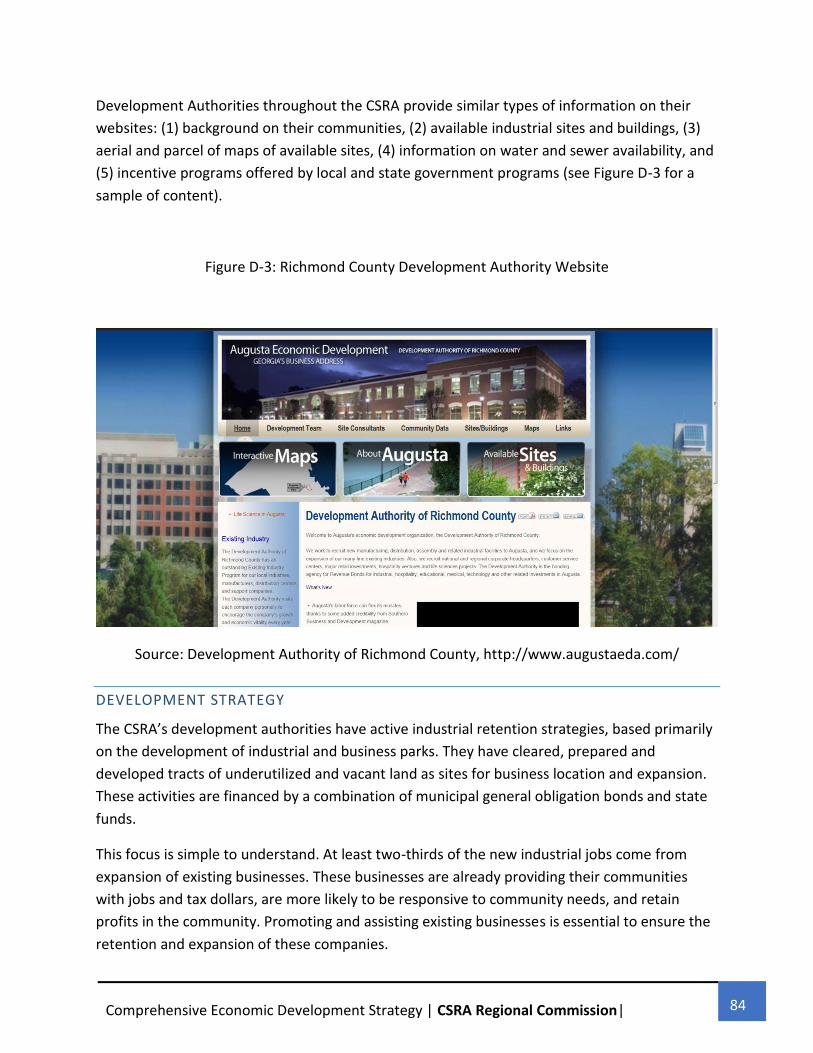
84 Comprehensive Economic Development Strategy | CSRA Regional Commission|
Development Authorities throughout the CSRA provide similar types of information on their
websites: (1) background on their communities, (2) available industrial sites and buildings, (3)
aerial and parcel of maps of available sites, (4) information on water and sewer availability, and
(5) incentive programs offered by local and state government programs (see Figure D-3 for a
sample of content).
Figure D-3: Richmond County Development Authority Website
Source: Development Authority of Richmond County, http://www.augustaeda.com/
DEVELOPMENT STRATEGY
The CSRA’s development authorities have active industrial retention strategies, based primarily
on the development of industrial and business parks. They have cleared, prepared and
developed tracts of underutilized and vacant land as sites for business location and expansion.
These activities are financed by a combination of municipal general obligation bonds and state
funds.
This focus is simple to understand. At least two-thirds of the new industrial jobs come from
expansion of existing businesses. These businesses are already providing their communities
with jobs and tax dollars, are more likely to be responsive to community needs, and retain
profits in the community. Promoting and assisting existing businesses is essential to ensure the
retention and expansion of these companies.

85 Comprehensive Economic Development Strategy | CSRA Regional Commission|
DOWNTOWN DEVELOPMENT AUTHORITIES
Several CSRA cities, including Augusta (Richmond County), Millen (Jenkins County), Sandersville
(Washington County), and Washington (Wilkes County) have active downtown development
authorities (DDA). These were set up with the objective of revitalizing and enhancing distressed
areas of their downtowns but over the years their mission has evolved to support economic
development opportunities across a wide range of activities. As independent public units that
are governed by a board of directors, DDAs work closely with local government and the private
sector to strengthen the economic climate of their downtowns. The DDAs play a leading a
coordinated strategy of economic development and civic design.
Marketing through the dissemination of information is relatively modest when compared to
county chambers of commerce or development authority websites (see sample in Figure D-4).
Figure D-4: Millen Downtown Development Authority Website
Source: Downtown Millen Development Authority
http://www.jenkinscountyga.com/business_dda.html

86 Comprehensive Economic Development Strategy | CSRA Regional Commission|
REGIONAL DEVELOPMENT AGENCIES
CSRA REGIONAL COMMISSION
The CSRA RC is an association of cities and counties, designated by federal
and state law, to engage in regional planning. The agency serves as an
economic development and policy coordinating body within the region,
bringing economic development stakeholders together to articulate a
regional voice for economic development policy direction. The CSRA RC also
seeks funding for economic development projects within the region,
including federal grants from the Economic Development Administration
(EDA), and coordinates with other parties to find additional funding sources
for regional projects. It does not duplicate the activities of local and state operating agencies,
but supports their needs with complementary regional-level planning and advocacy, and serves
as a data center that collects, analyzes, and disseminates information vital to the citizens and
governments in the region.
CSRA UNIFIED DEVELOPMENT AUTHORITY
The CSRA Unified Development Authority (UDA) is a joint
development authority encompassing all 13 CSRA counties. The
CSRA UDA serves to promote the economic development of the
CSRA, encourage cooperation among economic development
organizations within the member counties, and exercise all the
powers and privileges (including tax credits) granted to
development authorities pursuant to Georgia law.
AUGUSTA REGIONAL DEVELOPMENT ALLIANCE
The Augusta Regional Development Alliance (ARDA) is a council of the
Chambers of Commerce and other economic development
organizations throughout the CSRA. The primary purpose of the ARDA is
to offer a forum of discussion and problem-solving for economic
development professionals, who jointly pursue economic marketing, professional training and
enrichment, and other special projects.

87 Comprehensive Economic Development Strategy | CSRA Regional Commission|
STATE GOVERNMENT
The Georgia Department of Economic Development (GDEcD) is the state’s sales
and marketing arm, the lead agency for attracting new business investment,
encouraging the expansion of existing industry and small businesses, aligning
workforce education and training with in-demand jobs, locating new markets
for Georgia products, attracting tourists to Georgia, and promoting the state as
a destination for arts and location for film, music and digital entertainment
projects, as well as planning and mobilizing state resources for economic development
The Georgia Department of Transportation (GDOT) is a key infrastructure provider
in the CSRA, and has significant impacts on the area economy. GDOT works with
multiple public and private stakeholders on economic development related
projects. The State levies a state gasoline tax, a portion of which is administered
by GDOT, including an authorized grant program to fund local government
transportation projects.
The numerous universities, community colleges, technical and vocational institutions, and the
K-12 school system in the region lay the critical groundwork for a skilled workforce and a strong
regional economy. Their major role in educating the current and future labor force and
facilitating research initiatives linked to the private sector is a crucial component to economic
vitality in the region.
STATE WORKFORCE DEVELOPMENT BOARD
The State Workforce Development Board (SWDB), appointed by the Governor, is tasked with
administering Workforce Innovation and Opportunity Act (WIOA) funds across the state and
overseeing the Governor’s state workforce development initiatives. Their guidance is essential
to sustaining Georgia’s competitive advantage nationwide in terms of workforce. The SWDB is
comprised of business owners, members of the Georgia General Assembly, statewide agency
heads, local elected officials, and representatives from other workforce groups.
QUICK START PROGRAM
Quick Start is an innovative economic development program designed to meet the needs of
companies relocating and expanding in Georgia. Quick Start is nationally recognized for
providing high-quality workforce training services at no cost to qualified companies. The

88 Comprehensive Economic Development Strategy | CSRA Regional Commission|
program, administered by the Georgia Department of Technical and Adult Education (GDTAE),
provides flexible, customized training through a network of technical colleges, satellite
campuses and associated universities. Recognized by such publications as Expansion
Management and Fortune, Quick Start has offered services ranging from company orientation
and advanced manufacturing technology training to productivity enhancement. Since 1967,
more than 3,700 companies and 390,000 Georgia workers have benefited from this no-cost
program.
FEDERAL GOVERNMENT
The Department of Housing and Urban Development provides access to community
development block grants and economic development loan guarantees. The purpose of these
programs is to help communities restore, renew, and create the economic base for future
growth.
The Small Business Administration (SBA) provides long-term financial assistance, training
services, and management counseling to small businesses and entrepreneurs. Small business
incubators, technological transfer centers, and similar public-private partnerships use SBA
resources to promote start-ups and nurture growth within the business community. SBA also
provides an array of technical and business assistance through their Small Business
Development Centers (SBDC).
The Department of Justice administers the Job Training Partnership Act (1994), which provides
job training and employment assistance.
The Department of Commerce administers the Economic Development Administration, which
assists distressed communities create jobs and spur economic growth and development
programs. The Minority Business Development
Assistance Agency helps minority groups enter the
private market place or expand their business, and
the International Trade Administration helps
United States exporters compete more effectively
in the world market.
The Department of Agriculture is the primary rural and small town federal economic
development agency. Through its Rural Development Program, the department offers business
and industrial loan guarantees, community facility loans, and water and waste disposal grants
and guarantees.

89 Comprehensive Economic Development Strategy | CSRA Regional Commission|
The Department of Labor administers the Workforce Investment Act of 1998, which works to
consolidate, coordinate, and improve employment, training, literacy, and vocational
rehabilitation programs in the United States.
ASSESSMENT
CSRA Counties benefit from strong and substantial institutional capacity, with highly skilled and
specialized economic development professionals. The primary organizations working to
reinforce and strengthen study area economies (Development Authorities, Chamber of
Commerce, downtown organizations) and their affiliates form a strategic alliance among
themselves and state/federal agencies to advance economic development in the area.
The partnerships between these organizations and the CSRA RC results in local and regional
economic development services needed to implement economic development strategies.
Without such partnerships and coordination, individual counties would be forced to provide
these functions in-house, requiring higher levels of expenditures to pay and support staff.
The region aggressively promote new development and improved public and private amenities
for both existing and prospective businesses. They have invested in infrastructure, land
acquisition, and have collaborated with entrepreneurs, offering tax and other incentives to
promote private investment.
The type of leadership required for the new services-based economy, partnering government,
business and education, has been on-going during the last decade in the area. There are fairly
strong linkages around economic development among public, private, education and nonprofit
leaders and institutions. Such linkages will only strengthen the CSRA economy.
Institutional strengths are also evident at the state level. Georgia was one of the first on the
policy scene with programs to support the transition from manufacturing to the service-based
economy. Georgia’s Small Business Development Centers are considered to be among the best
in the nation and viewed favorably by businesses. The state’s Quick Start program resulted in
Georgia being ranked first in the nation for its workforce training programs by Expansion
Management magazine in 2001. Georgia’s long track record of small business assistance and
workforce development programs has provided the CSRA with a strong competitive advantage.
The CSRA’s jurisdictions generally have well established chamber of commerce and
development authority websites that provide the necessary information new businesses need
to make location decision. The various DDA’s should include website additional content on
available downtown properties and the types of industry they want to attract.

90 Comprehensive Economic Development Strategy | CSRA Regional Commission|
4.3 DEVELOPMENT TOOLS
The CSRA’s Development Authorities have formal business incentive programs and evaluate
each request for assistance on a case by case basis. Decisions on each request are made by the
respective Development Authorities and local governments based on the availability of
resources, and the cost-benefit of providing the incentives.
In Georgia, the direct actions that local governments can take to encourage economic
development have historically been less limited than in other states. In the past two decades,
several important tools have been made available to local communities to help encourage
development and attract or retain jobs. These include:
Community redevelopment financing (similar to tax increment financing)
Tax abatement
Community empowerment zone designation
Community renewal programs
Tax deferrals and exemptions for certain business investments
Industrial revenue bonds
Table D-2 inventories local, state and federal development tools.
Table D-2: Economic Development Incentives
Incentive Provider Explanation
Revenue Bonds Local
Financing instruments issued through Development
Authorities. Both taxable and tax-exempt revenue bond
financing is available at competitive, below-prime interest
rates. RBs provide financing for land, building and
equipment acquisition for new and expanding
manufacturing plants.
SPLOST Funds Local The Development Authorities also have SPLOST funds
available for short-term loans.
TSPLOT Funds Local
In 2012, the communities in the CSRA region approved the
collection of a special purpose local option sales tax for
transportation (TSPLOST) for the next ten years. General
TSPLOST information is available at http://www.ga-tia.com.
A specific list of the region's 84 regional projects that voters

91 Comprehensive Economic Development Strategy | CSRA Regional Commission|
Table D-2: Economic Development Incentives
Incentive Provider Explanation
approved, along with the status of each, is available
at http://www.ga-tia.com/Project/List/csra.
Planning staff work closely with state, local, and
metropolitan planning organizations to provide expertise on
many transportation related projects. The Commission
actively works on projects such as Safe Routes to Schools®,
bike and pedestrian programs, Georgia Scenic Byways,
corridor management plans and the Transportation
Investment Act (TSPLOST) program
CSRA Revolving Loan
Fund Local
CSRA Revolving Loan Fund – An internal revolving loan fund
of CSRA Business Lending. Loans up to $150,000 are
available for most purposes.
One Georgia Edge Fund State
Special financial assistance is provided to eligible applicants
for locating economic development projects. Response to
applications is quick due to the sensitive nature of projects
and their tight timeframes. Eligible applicants include
city/county governments, development authorities or other
public entities.
One Georgia Equity Fund State
The purpose of this fund is to provide a program of financial
assistance that includes grants or loans and any other form
of financial assistance to provide for infrastructure, services,
facilities and improvements.
Georgia's Business
Expansion and Support
Act Job Tax Credit
State
Tax liability for any one-year may be reduced by a maximum
of 100%. Eligible businesses include those involved in
manufacturing, warehousing, distribution, processing,
tourism and research and development. This credit may be
carried forward up to ten years. For Augusta, a $2,500 tax
credit is available for the creation of 10 jobs
Georgia's Business
Expansion and Support
Act Investment Tax Credit
State
Available to manufacturers or telecommunications
companies having a presence in Georgia for at least 5 years.
The company must spend at least $50,000 on an expansion
project.
Optional Investment
Credit State Larger credits can, depending on location, offset up to 90%
of a manufacturer’s increased income tax liability following a
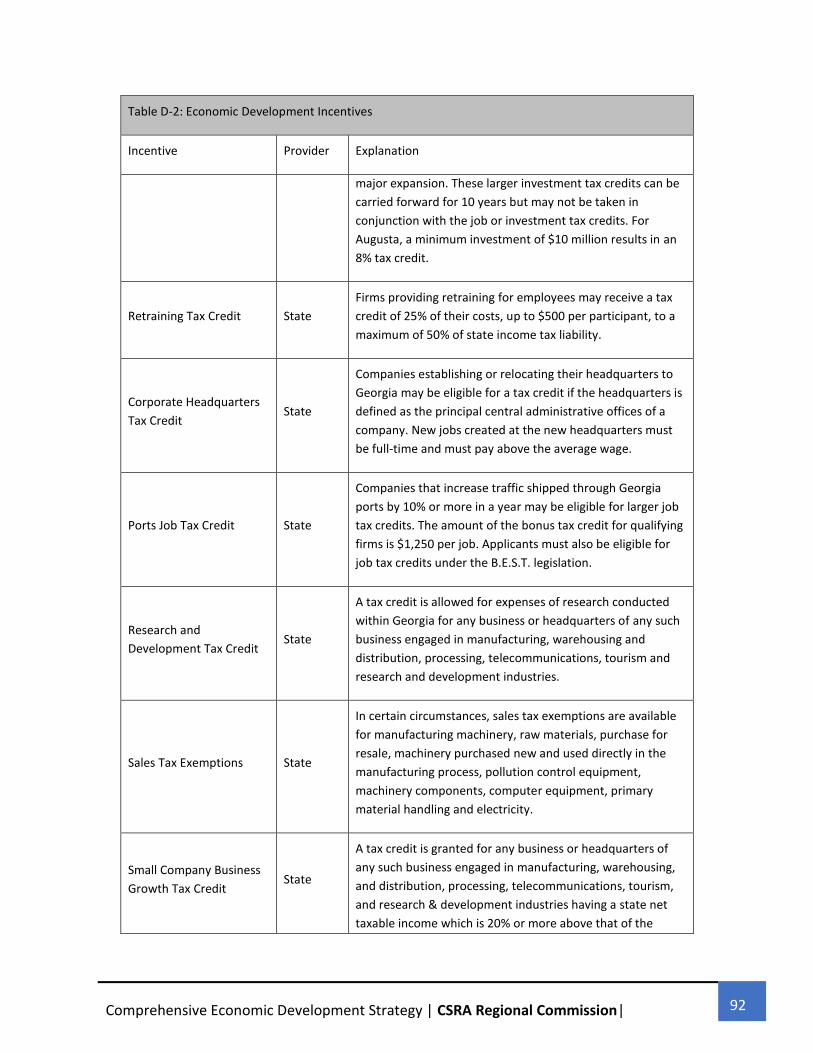
92 Comprehensive Economic Development Strategy | CSRA Regional Commission|
Table D-2: Economic Development Incentives
Incentive Provider Explanation
major expansion. These larger investment tax credits can be
carried forward for 10 years but may not be taken in
conjunction with the job or investment tax credits. For
Augusta, a minimum investment of $10 million results in an
8% tax credit.
Retraining Tax Credit State
Firms providing retraining for employees may receive a tax
credit of 25% of their costs, up to $500 per participant, to a
maximum of 50% of state income tax liability.
Corporate Headquarters
Tax Credit State
Companies establishing or relocating their headquarters to
Georgia may be eligible for a tax credit if the headquarters is
defined as the principal central administrative offices of a
company. New jobs created at the new headquarters must
be full-time and must pay above the average wage.
Ports Job Tax Credit State
Companies that increase traffic shipped through Georgia
ports by 10% or more in a year may be eligible for larger job
tax credits. The amount of the bonus tax credit for qualifying
firms is $1,250 per job. Applicants must also be eligible for
job tax credits under the B.E.S.T. legislation.
Research and
Development Tax Credit State
A tax credit is allowed for expenses of research conducted
within Georgia for any business or headquarters of any such
business engaged in manufacturing, warehousing and
distribution, processing, telecommunications, tourism and
research and development industries.
Sales Tax Exemptions State
In certain circumstances, sales tax exemptions are available
for manufacturing machinery, raw materials, purchase for
resale, machinery purchased new and used directly in the
manufacturing process, pollution control equipment,
machinery components, computer equipment, primary
material handling and electricity.
Small Company Business
Growth Tax Credit State
A tax credit is granted for any business or headquarters of
any such business engaged in manufacturing, warehousing,
and distribution, processing, telecommunications, tourism,
and research & development industries having a state net
taxable income which is 20% or more above that of the

93 Comprehensive Economic Development Strategy | CSRA Regional Commission|
Table D-2: Economic Development Incentives
Incentive Provider Explanation
preceding year if its net taxable income in each of the two
preceding years was also 20% or more.
SBA Loans Federal
SBA 504 can be used for fixed assets, such as land, buildings,
machinery and fixtures. SBA 7(a) and Low-Doc can be used
for most purposes, including inventory, working capital,
vehicles and business acquisitions. CSRA Business Lending
administers the SBA 504 program. A bank is the lender on
the 7(a) and Low-Doc programs, with the SBA guaranteeing
the loans
Source: One Georgia Authority; Georgia Business Expansion and Support Act; SBA Loan Program; CSRA
Business Lending
CSRA counties have historically participated in a variety of state and federal programs and
services designed to foster and promote economic growth. Community Development Block
Grants (CDBG), Georgia Department of Transportation (GDOT) industrial access funding, and
the Governor’s Discretionary Fund (GDF) have all been used to support local economic
development initiatives.
State government also provides assistance through grants and loans to local governments
under the One Georgia program for industrial infrastructure and other economic development
support programs. During the last several years, infrastructure improvements for economic
development have accelerated. Since 2002, One Georgia grants have been awarded to 62 CSRA
projects totaling $30,069,933 (Table D-3).
Table D-3: Awarded One Georgia Funds
Recipient Number
of Awards
Awards
Amount Award Type Major Projects
Burke County 4 $3,020,00
0
BRIDGE,
EDGE Acquisition and
rehabilitation of

94 Comprehensive Economic Development Strategy | CSRA Regional Commission|
Table D-3: Awarded One Georgia Funds
Recipient Number
of Awards
Awards
Amount Award Type Major Projects
former Kwikset
facility
Columbia County 2 $227,968 BRIDGE,
EDGE
Road
improvements
to support John
Deere plant
Glascock County 2 $750,000 EQUITY
Land acquisition
to develop the
county’s first
industrial park
Hancock County 4 $2,915,00
0
EQUITY,
EDGE
Construction of
a 67,000 s.f
facility
Jefferson County 4 $1,539,95
4
EQUITY,
EDGE,
BRIDGE
Land acquisition
and water
infrastructure
Jenkins County 6 $2,848,65
0
EQUITY,
BRIDGE
Airport
improvements,
land
acquisition,
infrastructure
improvements
Lincoln County 6 $2,155,00
5
EQUITY,
EDGE,
BRIDGE
Building
acquisition,
sewer line
extension
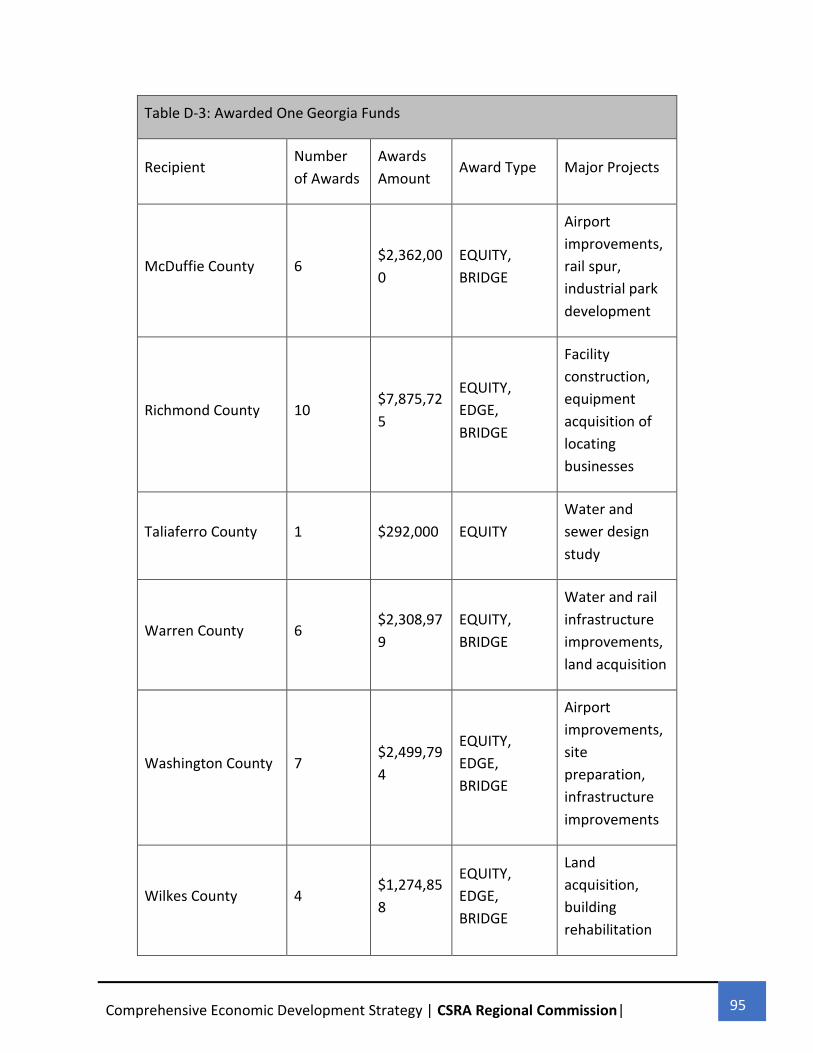
95 Comprehensive Economic Development Strategy | CSRA Regional Commission|
Table D-3: Awarded One Georgia Funds
Recipient Number
of Awards
Awards
Amount Award Type Major Projects
McDuffie County 6 $2,362,00
0
EQUITY,
BRIDGE
Airport
improvements,
rail spur,
industrial park
development
Richmond County 10 $7,875,72
5
EQUITY,
EDGE,
BRIDGE
Facility
construction,
equipment
acquisition of
locating
businesses
Taliaferro County 1 $292,000 EQUITY
Water and
sewer design
study
Warren County 6 $2,308,97
9
EQUITY,
BRIDGE
Water and rail
infrastructure
improvements,
land acquisition
Washington County 7 $2,499,79
4
EQUITY,
EDGE,
BRIDGE
Airport
improvements,
site
preparation,
infrastructure
improvements
Wilkes County 4 $1,274,85
8
EQUITY,
EDGE,
BRIDGE
Land
acquisition,
building
rehabilitation

96 Comprehensive Economic Development Strategy | CSRA Regional Commission|
Table D-3: Awarded One Georgia Funds
Recipient Number
of Awards
Awards
Amount Award Type Major Projects
Total 62 $30,069,9
33
Source: One Georgia Authority, Project Database
http://www.onegeorgia.org/awards-map/all-awards
The One Georgia EDGE Fund provides financial assistance to eligible applicants that are being
considered as a relocation or expansion site and are competing with another state for location
of a project; and, where the EDGE Fund is used when the health, welfare, safety and economic
security of the citizens of the state are promoted through the development and/or retention of
employment opportunities.
The One Georgia Equity Fund provides a program of financial assistance that includes grants,
loans and any other forms of assistance authorized by (O.C.G.A.50-34-1 et seq.) to finance
activities that will assist applicants in promoting the health, welfare, safety, and economic
security of the citizens of the state through the development and retention of employment
opportunities in areas of greater need as defined by the Georgia Business Expansion and
Support Act (1994).
For businesses and individuals seeking long-term, low-interest rate financing for the
construction or improvement of manufacturing facilities, single and multi-family housing
projects, exempt financing is available both at the state and local level. The Georgia
Department of Community Affairs is responsible for implementing a system for allocating the
use of private-activity bonds, as permitted by federal law, in order to further the economic
development of the state, to further the provision of safe, sanitary, and affordable housing, and
otherwise to further the purposes of the laws of the state which provide for the issuance of
such bonds.
ASSESSMENT
CSRA counties have significant track records in providing local incentives to support economic
development projects. Because most economic development tools employ a combination of
local, state and federal sources, it is difficult to compare local and state incentives to other
communities.

97 Comprehensive Economic Development Strategy | CSRA Regional Commission|
CSRA counties use wide discretion in providing public funding to potential businesses. While the
region cannot compete with very big metropolitan areas whose incentive packages can get
much larger, they are not hampered by the state constitutional and regulatory limits on
development incentives in other localities.
4.4 BUSINESS CAPACITY
Business capacity is an important indicator of a community’s ability to diversify its economic
base. While government action can facilitate private investment, individual businesses
ultimately make the decision to invest. Access to capital and support services is critical to
business investment decisions.
ACCESS TO CAPITAL
Financial capital refers to the availability and use of financial resources for new investment.
Financial capital, including information and technical assistance, is particularly important to
entrepreneurial development. Lack of access to capital can make it difficult or even impossible
for investors to start their businesses and for existing businesses to expand and grow their
enterprises. Conversely, regions with a full array of capital resources provide investors with the
opportunity to start and grow their businesses in the same community.
There are dozens of financial institutions that support business growth in the CSRA. These
institutions range in size and scope from national banks such as Wells-Fargo to regional banks
such as Southern Bank, to locally controlled banks such as the Bank of Burke County.
These banks and institutions render an adequate supply of debt capital in the CSRA. The
structure of the banking industry in the region is supportive of capital availability. Typically,
national and regional banks are more conservative lenders. The focus is on larger customers
with less attention to the small business sector. In the CSRA, the reverse is true. Because of the
relatively high number of small businesses, all banks cater to this clientele.
COMMERCIAL AND PROFESSIONAL SUPPORT SERVICES
The commercial and professional support infrastructure includes a number of services that
assist entrepreneurs and existing businesses in their activities. This category includes locally
available legal, accounting, marketing and other business services, but not banking and financial
services (which are included in the previous section on financial capital). Potential investors
need easy access to these services, and a one-stop shop with information about availability of
services and provider expertise.

98 Comprehensive Economic Development Strategy | CSRA Regional Commission|
The CSRA includes dozens of businesses and 8,572 employees in commercial and professional
support services. As a percentage of total employment, commercial and professional support
services in the CSRA (4.2%) accounts for substantially less than the state (6.4%) and national
(6.6%) averages (Figure D-5).
Source: Calculations by CSRA RC based on ESRI Business Summary (2017)
The availability of legal and accounting services is a source of strength for the region. Both
subsectors include a range of independent local firms. Many local accounting and law firms
cooperate with partners from across the state, accessing expertise and resources that may not
be available locally.
Local providers are capable of assisting most types of
businesses either using internal or external resources. The
University of Georgia Small Business Center also provides
commercial and professional support services to
entrepreneurs, assists with business plans, and provides
entrepreneurs the opportunity to present their ideas to
banking representatives. The mentoring and volunteer
counseling program is a major and well known asset.
Cooperation with local universities provides another resource for area businesses. For example,
the accounting program at Augusta State University places students in local businesses for
internships. Both sides benefit from the program - students gain more hands-on experience,
and entrepreneurs and small businesses receive needed assistance. In many cases, businesses
later hire interns as regular employees.
4.2%
6.4% 6.6%
0%
2%
4%
6%
8%
10%
CSRA Georgia U.S.A
Figure D-5: Percentage of Employees in Profesional Services, 2016

99 Comprehensive Economic Development Strategy | CSRA Regional Commission|
ASSESSMENT
Overall, business capacity is fair in the CSRA. The availability of financial capital can assist in
establishing and expanding small and mid-size businesses that contribute to the area
economies. Interest in SBA loan programs (both by banks and non-profit financial organizations)
has increased the area’s institutional capacity, thereby contributing to the CSRA’s competitive
advantage. A significant entrepreneurial base has also been developed over time due to the
availability of financial capital.
An issue for the CSRA is the weak existing commercial and professional support infrastructure,
when compared to other areas and the state average. Both the number of firms and employees
in this area will need to increase in numbers if the sector is to assist existing and new
businesses.
Business linkages are well developed among development agencies and the local and
networked expertise to help entrepreneurs identify a provider that meets their needs.
Consequently, entrepreneurs have to spend less time and energy finding business services with
the appropriate expertise and (with few exceptions) remain embedded within the local and
regional provider network.
4.5 TAXES
State and local tax structures play an influential role in shaping the CSRA’s economic climate.
Tax revenues fund the provision of key public infrastructure and services like transportation,
education, public safety, and social services that are needed to support business activity and
sustain overall quality of life. Yet if the tax burden placed on businesses is prohibitively high,
especially for small businesses and start-ups, it can hinder productivity, cause companies to
relocate, and diminish the region's ability to attract and retain high value industries. The
challenge is to balance the tax burden in a way that is equitable, generating sufficient revenues
to fund essential government services, while providing a competitive tax environment for the
private sector.
STATE TAXES
Georgia's corporate income tax rate (6 percent) has not changed since 1969. This tax applies
only to the portion of income that is earned in Georgia. Its main components consist of state
and local (a) retail sales and use tax, (b) business and occupation tax, and (c) property tax.
Georgia’s license or occupation tax (annual tax based on capital stock and retained earnings
commonly referred to as franchise or privilege tax in other states) is determined on a graduated
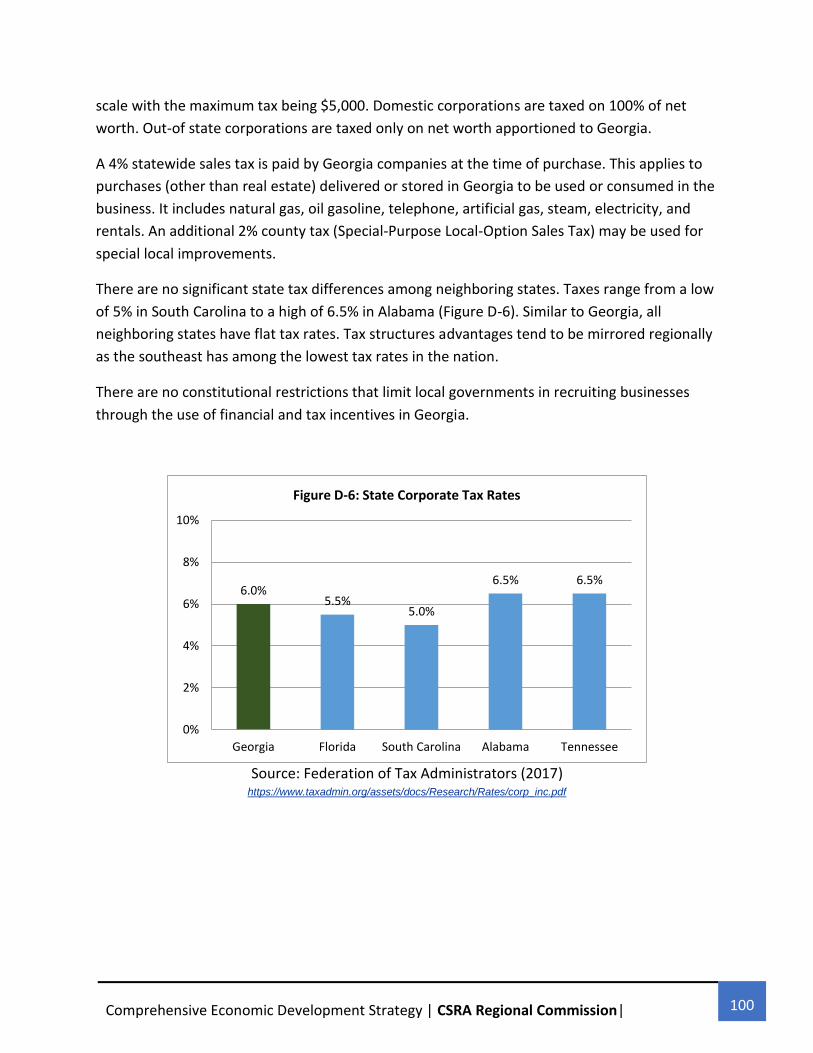
100 Comprehensive Economic Development Strategy | CSRA Regional Commission|
scale with the maximum tax being $5,000. Domestic corporations are taxed on 100% of net
worth. Out-of state corporations are taxed only on net worth apportioned to Georgia.
A 4% statewide sales tax is paid by Georgia companies at the time of purchase. This applies to
purchases (other than real estate) delivered or stored in Georgia to be used or consumed in the
business. It includes natural gas, oil gasoline, telephone, artificial gas, steam, electricity, and
rentals. An additional 2% county tax (Special-Purpose Local-Option Sales Tax) may be used for
special local improvements.
There are no significant state tax differences among neighboring states. Taxes range from a low
of 5% in South Carolina to a high of 6.5% in Alabama (Figure D-6). Similar to Georgia, all
neighboring states have flat tax rates. Tax structures advantages tend to be mirrored regionally
as the southeast has among the lowest tax rates in the nation.
There are no constitutional restrictions that limit local governments in recruiting businesses
through the use of financial and tax incentives in Georgia.
Source: Federation of Tax Administrators (2017) https://www.taxadmin.org/assets/docs/Research/Rates/corp_inc.pdf
6.0%5.5%
5.0%
6.5% 6.5%
0%
2%
4%
6%
8%
10%
Georgia Florida South Carolina Alabama Tennessee
Figure D-6: State Corporate Tax Rates

101 Comprehensive Economic Development Strategy | CSRA Regional Commission|
LOCAL TAXES
CSRA counties and cities receive their tax revenue from two principal
sources: property tax and sales tax. Property tax rates in all three
counties are significantly below average (an average of some $3 less
per $1,000 of property valuation than the national average), and
among the most competitive in the nation.
As important as local taxes are taxes in adjacent metropolitan areas
since many communities like the study area rely on a competitive
economic environment in metropolitan areas to get new residents and
the corresponding economic development opportunities that come
with them. Table D-4 identifies the adjusted property tax rate for
Augusta, Savannah and 15 other cities with similar population and regional characteristics
included in the City of Savannah’s Comparable Cities Survey. The survey was designed to
evaluate Savannah’s financial management goals through analysis of government expenditures
and taxation. For validity purposes, city budgets were adjusted as needed to compare service
delivery differences among local governments.
According to the survey, Augusta and Savannah’s adjusted property tax rates are ranked 13 and
14 respectively among the group of 16 cities, among the best performing in the group. Even
among other Georgia metropolitan (i.e. Athens, Macon, Columbus), Augusta enjoys a
competitive tax advantage.
ASSESSMENT
Taxation levels are difficult to evaluate because of the methods different localities and states
use to calculate them, although it is well known that tax rates in the CSRA are significantly
below the state and national averages. Lower levels of taxation have been credited with the
boom in southeast economies. Within the southeast region, the CSRA region is among the most
competitive.
4.6 LABOR FORCE
Labor is a critical factor in today's global markets. The labor force is defined as the pool of
individuals who are 16 years of age and over, and are either employed or who are actively
seeking employment. Enrolled students, retirees, stay-at-home parents and other persons not
actively seeking employment are excluded from the labor force. It is important to understand
the difference between total jobs (identified in the economic trends section) and labor force
participation rates. Total jobs are the total of all jobs available in a jurisdiction. The labor force
participation rate is the total supply of workers within a jurisdiction (i.e. residents).

102 Comprehensive Economic Development Strategy | CSRA Regional Commission|
DISTRIBUTION OF AREA LABOR SUPPLY
The study area has an abundance of labor within a one-hour commute. A labor supply of
approximately 600,000 resides within a 30-mile radius of the study area central point and over
1,200,000 within a 60-mile radius.
LABOR FORCE PARTICIPATION
The labor force participation rate in the CSRA Burke (43.1%) lies below the state (56.3%) and
national (63.7%) averages (Table D-4). The relatively higher number of retired persons within
those counties results in this substantial differential. Many military retires settle in the region
due to the proximity of the Fort Gordon Army Base.
Table D-4: Labor Force Participation Rates, 2015
CSRA Georgia U.S.A
Work-Eligible
Population 471,845
7,792,05
2
251,221,3
09
In Labor Force 203,231 4,388,27
4
145,747,7
79
% in Labor Force 43.1% 56.3% 63.3%
Source: U.S. Bureau of the Census 2015 Estimates
DP03; ESRI (2015 )
UNEMPLOYMENT
Unemployment rates are another indicator of labor availability. Historically, rural CSRA counties
have had unemployment rates significantly above the state average (1% or higher). That gap
has widened considerably over the last two years and unemployment rate differentials with the
state and national averages now range from 40% to 110% (Figure D-7).

103 Comprehensive Economic Development Strategy | CSRA Regional Commission|
Source: Georgia Department of Labor; U.S. Department of Labor
EDUCATION ATTAINMENT OF THE WORKFORCE
Local workforce educational level is a major factor when companies examine potential
locations for investment. Graduation rates and educational attainment are indicators of
workforce quality.
The CSRA lies below the state and national averages in educational attainment. Approximately
25% of residents failed to complete high school, compared to 21.4% elsewhere in the state and
19.6% in the nation (Table D-5). There is also a significant gap in higher education. An average
of 18.9% of residents earned a bachelor’s degree or higher, compared to 24.3% elsewhere in
the state and 24.4% in the nation.
7.6%
4.7%
6.1%
8.4%
7.5% 7.6%
5.9%
7.2%6.7% 6.5%
7.0%6.4% 6.3% 6.1%
5.4%4.9%
0%
1%
2%
3%
4%
5%
6%
7%
8%
9%
Figure D-7: Unemployment Rate for Selected Jurisdictions, April 2016

104 Comprehensive Economic Development Strategy | CSRA Regional Commission|
Table D-5: Education Attainment for Population 25+ Years, 2015
CSRA
Number
CSRA
%
Georgia
%
U.S.A
%
Less than 9th Grade 16,287 17.6% 5.4% 5.7%
9th Grade – 12th Grade (no
diploma) 33,103 8.1% 9.2% 7.6%
High School Graduate 96,332 21.5% 28.4% 27.8%
Some College (no Degree) 65,762 36.2% 21.0% 21.1%
Associate Degree 24,464 11.4% 7.2% 8.1%
Bachelor’s Degree 42,146 6.2% 18.1% 18.5%
Graduate or Professional
Degree 25,839 10.7% 10.7% 11.2%
Total 303,933 100% 100% 100%
Source: U.S. Bureau of the Census, 2015, S1501
LABOR COSTS
For most industries, labor costs are the highest capital cost and regional differences in labor
costs can result in winning or losing a business. Competitive labor costs in the southeast have
resulted in new auto plants, distribution centers and other large-scale industrial operations
where labor costs are a significant portion of expenditures.
Table D-6 presents average weekly wages by industry. Like the other income and wage
indicators noted above, the general trend is for wages to be significantly below the state
average. While some sectors like Agriculture, Forestry, Fishing & Hunting, and Construction
have higher weekly wages, in other categories the CSRA average is significantly lower.

105 Comprehensive Economic Development Strategy | CSRA Regional Commission|
Table D-6: Weekly Wage Rates for Selected Industries, Q1 2017
CSRA Georgia
Region vs.
State
Difference
Agriculture, Forestry, Fishing and Hunting 834 650 -22%
Construction 1,589 1,074 -32%
Manufacturing 1,083 1,089 0.0%
Wholesale Trade 1,180 1,448 0.2%
Retail Trade 517 567 10%
Transportation & Warehousing 820 1,147 40%
Information 1,142 1,745 53%
Finance and Insurance 1,282 1,671 34%
Healthcare & Social Assistance 916 951 4%
Accommodation & Food Services 291 339 16%
Public Administration 526 662 26%
All Industries 925 1,031 11%
Source: Georgia Department of Labor - 1th Qtr. 2017; Georgia Employment & Wages 2016
GDOL

106 Comprehensive Economic Development Strategy | CSRA Regional Commission|
ASSESSMENT
The labor force presents challenges for the CSRA. Below average labor force participation rates
present a challenge to economic development efforts. Since 1990, labor force growth in the
region has been relatively flat. The more residents are able to participate in the economy, the
higher the probability of attracting new businesses and retaining existing ones.
Education attainment is significantly below the state and national averages. The region’s
weaknesses lies both in high school completion rates end at the upper level of the educational
attainment scale, where the CSRA still lags in the percentage of residents holding bachelor,
graduate and professional degrees. This challenge is especially important in attracting hi-tech
and information technology jobs to the region. Despite the poor economy, some industries
report a shortage of high-skill and high-tech workers. It may simply take time for the skills of
the workforce to improve to the level needed by the region’s higher-tech businesses. On the
other hand, it will also take time for the CSRA’s base of higher-tech businesses to reach a critical
mass that can attract and keep skilled workers in the region. The challenge of balancing the
needs of the region’s employers, large and small, with the skills of the region’s workforce will
continue into the future.
The CSRA’s low labor costs, as expressed in wage rates, provide it with a competitive advantage
over other parts of the state and the nation. The region’s low cost of living will continue to
attract new residents and, by extension, increase the available labor supply available to existing
and prospective businesses.
4.7 EDUCATION
PUBLIC SCHOOL SYSTEMS
Public school systems are important for economic development in three ways. First, it is these
schools that provide the education and skill foundation for future employees and business
leaders in the study area. Secondly, school boards are among the largest employers of area
residents. Increases or decreases in the level of employment by schools will impact the
community’s economic activity. Thirdly, the quality of public schools is a significant
consideration to business leaders that are deciding where to locate their companies.
Conversely, the quality of the public school system may be a key factor to skilled workers that
are considering relocating to an area.
Any economy depends on an educated and healthy labor force. Labor is highly mobile, but the
local systems and institutions that provide ways to support human resources are very
important for community economic development. For example:

107 Comprehensive Economic Development Strategy | CSRA Regional Commission|
Good schools attract families and are an important variable when firms decide where to
locate.
Availability of post-secondary training that can be tailored to a particular employer's or
industry's needs is important for location decisions.
The CSRA counts hundreds of elementary, middle and high schools, and enroll tens of
thousands of students. How these schools perform on state and national standardized tests will
determine readiness for higher education and employment opportunities.
SAT Scores for the CSRA are presented in Figure D-8. At 1,301, SAT scores for the region are
0.9% below the state average and 1.2 % below the national average. Columbia County is the
only county in the CSRA with SAT scores above the state average.
Source: Georgia Department of Education (2010); College Board
GEORGIA END-OF-COURSE ASSESSMENTS (EOCT)
The A+ Educational Reform Act of 2000,O.C.G.A. §20-2-281, mandates that the State Board of
Education adopt end-of-course assessments in grades nine through twelve for core subjects in
math, social studies, science, and English language arts. The assessments provide diagnostic
1,320
1,5391,445
1,084
1,269 1,301
0
1,2901,349
0 0
1,2591,336 1,301
1,450 1,490
0
200
400
600
800
1,000
1,200
1,400
1,600
1,800
Figure D-8: Average SAT Scores at the System, State and National Levels, 2010

108 Comprehensive Economic Development Strategy | CSRA Regional Commission|
information to help students identify strengths and areas of need in learning, therefore
improving performance in all high school courses.
Figure D-9 presents EOCT test scores for CSRA counties. The mean consolidated index shows all
three counties (Columbia, Glascock and Lincoln) are at or above the state average, with the rest
falling slightly below.
Source: Georgia Department of Education (Spring 2014), End-of-Year Course Tests
** Data unavailable for Taliaferro County**
6975
60 58 61 6269
63 66
57
66 6367
81 82
0
20
40
60
80
100
Figure D-9: EOCT Consolidated Mean Scores, Spring 2014

109 Comprehensive Economic Development Strategy | CSRA Regional Commission|
HIGHER EDUCATION
Although many educational institutions have broad missions that include meeting the needs of
a wide range of individuals and employers, it is primarily the local and regional two- and four-
year institutions that are best able to focus on and respond to local economies. Technical
colleges in particular have done an excellent job of responding to the needs of small and mid-
sized businesses, and have demonstrated they can successfully juggle a variety of missions.
Table D-7 presents an inventory of area technical and comprehensive four-year colleges.
Technical colleges graduate thousands of area students annually in over 100 diploma and
certificate programs that include a wide variety of technical skills.
Four-year colleges and universities are important for businesses needing highly-skilled workers
as they provide advanced educational opportunities for the CSRA's residents. They also serve as
major employers, generating significant economic impacts. There are three major colleges in
the CSRA area: Augusta State University, Medical College of Georgia, and Georgia Southern
University. There region is also home to a number of smaller four-year colleges, including the
Paine College and East Georgia College.
Table D-7: Area Technical and Comprehensive Colleges
School Enrolled
Students Program Areas
Augusta University 7,061 Undergraduate degree, some graduate degree
Augusta Technical College 5,028 Certificates and diplomas in technical fields
East Georgia College 2,754 Liberal arts
Jefferson County Campus (Satellite of
Sandersville Technical College) ** Certificates and diplomas in technical fields
Georgia Southern University 19,086 Comprehensive undergraduate, graduate &
professional
McDuffie Campus (Satellite of Augusta
Technical College) ** Certificates and diplomas in technical fields
Medical College of Georgia 2,515 Medicine, health sciences, doctoral
Ogeechee Technical College 1,921 Certificates and diplomas in technical fields

110 Comprehensive Economic Development Strategy | CSRA Regional Commission|
Paine College Undergraduate degree
Sandersville Technical College 776 Certificates and diplomas in technical fields
Swainsboro Technical College 664 Certificates and diplomas in technical fields
University of Phoenix (Augusta Campus) N/A Undergraduate professional programs
Waynesboro/Burke County Campus
(Satellite of Augusta Technical College) ** Certificates and diplomas in technical fields
Source: Collegeboard.com; ** included in flagship college numbers; N/A: Not Available
ASSESSMENT
The K–12 education system in the CSRA is not as strong as it should be compared to elsewhere
in the state. It may be an obstacle to the recruitment of new firms and residents. While SAT
scores continue to climb in the past decade, performance on state achievement tests is still
below the state average. Fortunately, the problem is recognized by leaders and strategies for
improvement are being implemented. The success of these strategies will determine whether
study area counties can turn this challenge into an asset, in support of existing and prospective
businesses.
Area higher education institutions – technical colleges, comprehensive colleges as well as
medical/doctoral institutions - are an asset to the CSRA’s economic development efforts. The
technical colleges are credited with rapid response to industry changes and developing a
technically sophisticated workforce that enhances employment opportunities for residents. The
area’s four year colleges are supplying the region’s industries with highly-skilled technology and
financial service-sector workers that are crucial for the area economy. They are also an intricate
component of institutional and business capacity.
4.8 INFRASTRUCTURE
The availability and quality of physical and communications infrastructure play an important
role in economic development efforts. It is paramount to industrial and commercial
development. While investment in infrastructure is not sufficient to guarantee success, it is
often a necessary baseline.
Local governments play a major role in infrastructure. Beyond direct provisions of infrastructure
such as roadways and utilities, they have the ability to influence infrastructure and investment

111 Comprehensive Economic Development Strategy | CSRA Regional Commission|
decisions through their regulatory role. Market conditions establish lease rates, building and
land availability, and construction costs. Individual counties can impact these costs through
zoning regulations, utility costs, and tax rates. Each industry will have specific infrastructure
needs that they account for in site suitability analyses. There are, however, general
infrastructure issues that are common to most industries.
BROADBAND INFRASTRUCTURE
Explosive growth in wireless and fiber-optic communication has provided many urban areas in
Georgia with excellent broadband infrastructure. In many larger cities of the state, there are
multiple providers who compete by offering lower prices and faster broadband speeds.
However, not all the regions of the state have benefited from fiber-optic growth. Most areas of
the CSRA outside of the urbanized parts of Columbia and Richmond Counties lag in both choice
and quality of service. Most of these areas are not served by any land broadband service
provider, making slower satellite internet service the only option. The CSRA RC considers
broadband the region’s top infrastructure priority and has been aggressively pursuing state and
federal funding to remedy this deficiency by extending broadband infrastructure to areas of the
region that currently lack it.
In today’s hi-tech economy, telecommunications infrastructure is as vital to business
development decisions as water, sewer and road systems. Telecommunications is critical in
attracting and cultivating new employers as well as keeping existing businesses competitive.
From small businesses to large manufacturers, telecommunications is a critical element in
operating efficiency and access to the global marketplace.
TRANSPORTATION INFRASTRUCTURE
AIR SERVICE
The CSRA is served by two commercial services airports- one within the region and the other in
proximity to the CSRA’s southern counties. Augusta Regional Airport currently has 21 daily
departures and 22 daily arrivals to three major hubs (Atlanta, Charlotte and Dallas) from three
carriers (Delta, U.S. Air and American). In Calendar Year 2010, the annual passenger volume at
the Augusta airport was 246,587, compared to 198,489 (24.2% increase) in Calendar Year 2009.
The airport depends heavily on the large companies in the area and the Department of Defense
as customers. Local companies provide passengers on commercial flights, but several of them
also have corporate jets at the airport. These companies need their own jets, because their
destinations (other company locations) are frequently in areas that do not have high quality air
service.

112 Comprehensive Economic Development Strategy | CSRA Regional Commission|
Savannah/Hilton Head International Airport is served by 6 airlines (Delta, U.S. Air and American
Eagle, Allegiant Air, United, and Continental), that provide 37 daily flights to/from Dallas-Fort
Worth, Newark, New York, Miami, Atlanta, Detroit, Washington, Charlotte and Chicago. In
Calendar Year 2010, the annual passenger volume at Savannah/Hilton Head was 798,194,
compared to 799,066, (-0.11%) to Calendar Year 2009. The airport depends on the tourist traffic
and the recession has resulted in decreased passenger volume.
Both airports lobby carriers to offer competitive prices for flights in and out of Augusta and
Savannah. For many business customers, the convenience of a smaller airport (shorter checking
and security check times) offsets higher prices. A direct flight to Atlanta or Charlotte which
leaves early in the morning presents various connection options for business travelers.
Recently completed and planned improvements at both airports include terminal expansion,
and associated runway and road improvements. These improvements could make the airports
more attractive to business customers.
SURFACE TRANSPORTATION
The CSRA includes several U.S. and State Highways, and numerous local streets and roads which
serve regional linkages to other parts of Georgia and the southeast.
Interstates 20 and 520 are major east-west routes that connect the CSRA to South Carolina to
the east and to the all of the nation’s southeastern states to the west (Figure D-10). U.S. Routes
1 and 25 are the CSRA’s major north–south highways that connect the region with Florida to
the south and the Atlantic states to the north. Both these highways are part of the Governors
Road Improvement Program (GRIP), which seeks to extend four-lane highways to all regions of
Georgia. Both highways have been expanded to four lanes throughout the CSRA.
Table D-8 presents Levels of Service (LOS) for major roadway segments in the CSRA. LOS is a
qualitative measure describing operational conditions of a roadway in terms of average speed,
travel time, maneuverability, and traffic interruptions during peak travel periods. The measure
contains six LOS categories, ranging from A to F, each describing the operating conditions
associated with them: LOS A indicates free flow conditions while LOS F indicates excessive
delays resulting in high levels of congestion. LOS is calculated by determining the ratio of traffic
volume to roadway capacity for segments of individual roadways based on accumulated flow
from collector roads within the traffic shed. The typical design level of a road represents an
operational LOS C. This indicates that roads are designed to adequately handle 65% of the
traffic capacity while maintaining a stable flow of traffic.
113 Comprehensive Economic Development Strategy | CSRA Regional Commission|
The data contained in Table D-8 suggests that the CSRA is relatively free of peak-hour traffic
congestion common in nearby metropolitan areas.

114 Comprehensive Economic Development Strategy | CSRA Regional Commission|
Figure D-10: Major Highways in and around the CSRA
Source: Burke/Jefferson/Jenkins Diversification Plan (2010)

115 Comprehensive Economic Development Strategy | CSRA Regional Commission|
Table D-8: Level of Service Ratings for Selected Roadways
Highway Peak AADT LOS Rating
I-520 78,519 C or better
I-20 52,160 C or better
U.S 1 31,270 C or better
U.S 25 29,980 C or better
Source: Georgia Department of Transportation Annual Traffic Counts (2010); Levels of Service
Estimates by CSRA RC
FREIGHT TRANSPORTATION
Rail services can be a critical recruitment tool. The CSRA supports a robust freight
transportation system that makes it a nexus for the movement of goods. Similar to the highway
network, the region is a crossroads of major rail lines. Rail lines
include a north-south Norfolk Southern line linking Augusta
with Savannah and east-west CSX line linking Augusta with
Atlanta. These rail lines support freight transport with daily
trips through the region carrying grain products, clay and
cement, metal & paper products, and minerals, as well as
other materials for various manufacturing processes. Both the
Norfolk Southern and CSX lines carry between 10-24.9 million
gross tons of rail freight (Figure D-11).

116 Comprehensive Economic Development Strategy | CSRA Regional Commission|
Figure D-11: Georgia Freight Rail Lines and Tonnage
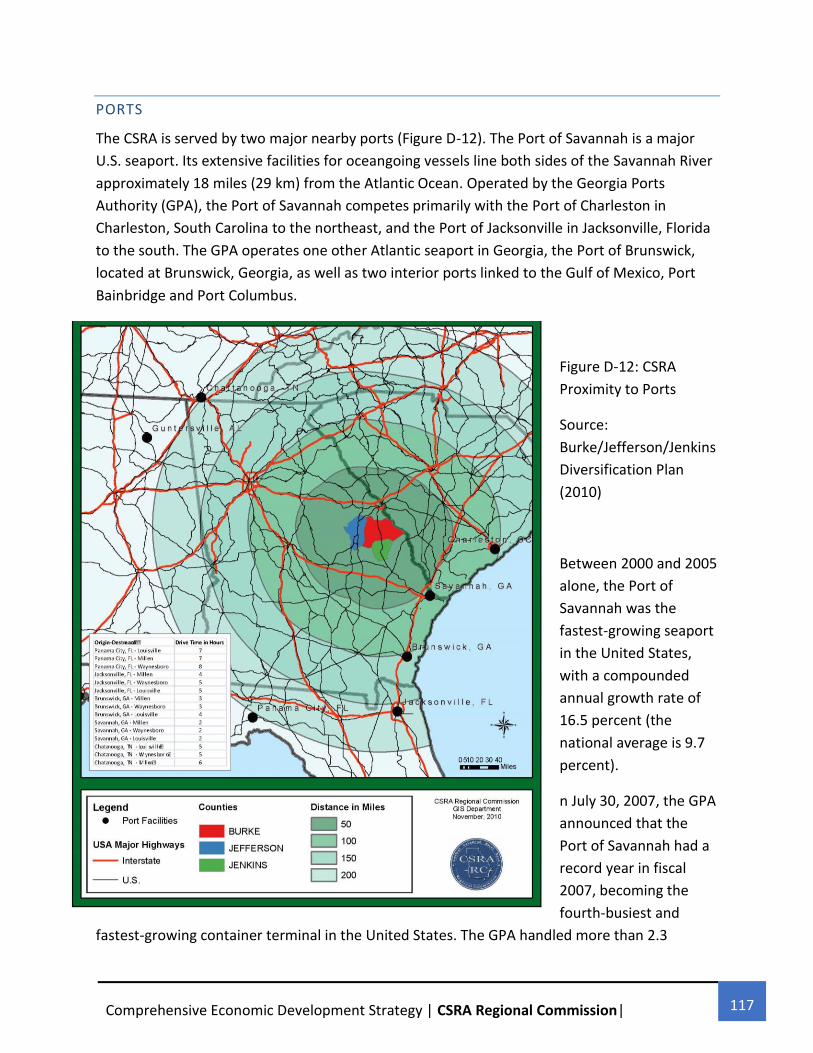
117 Comprehensive Economic Development Strategy | CSRA Regional Commission|
PORTS
The CSRA is served by two major nearby ports (Figure D-12). The Port of Savannah is a major
U.S. seaport. Its extensive facilities for oceangoing vessels line both sides of the Savannah River
approximately 18 miles (29 km) from the Atlantic Ocean. Operated by the Georgia Ports
Authority (GPA), the Port of Savannah competes primarily with the Port of Charleston in
Charleston, South Carolina to the northeast, and the Port of Jacksonville in Jacksonville, Florida
to the south. The GPA operates one other Atlantic seaport in Georgia, the Port of Brunswick,
located at Brunswick, Georgia, as well as two interior ports linked to the Gulf of Mexico, Port
Bainbridge and Port Columbus.
Figure D-12: CSRA
Proximity to Ports
Source:
Burke/Jefferson/Jenkins
Diversification Plan
(2010)
Between 2000 and 2005
alone, the Port of
Savannah was the
fastest-growing seaport
in the United States,
with a compounded
annual growth rate of
16.5 percent (the
national average is 9.7
percent).
n July 30, 2007, the GPA
announced that the
Port of Savannah had a
record year in fiscal
2007, becoming the
fourth-busiest and
fastest-growing container terminal in the United States. The GPA handled more than 2.3

118 Comprehensive Economic Development Strategy | CSRA Regional Commission|
million Twenty-foot equivalent units (TEU) of container traffic during fiscal 2007 -- a 14.5
percent increase and a new record for containers handled at the Port of Savannah. In the past
five years, the port's container traffic has jumped 55 percent from 1.5 million TEU handled in
fiscal 2003 to 2.3 million TEU in fiscal 2007.
The Port of Charleston, owned and operated by the South Carolina Ports Authority, consists of
five terminals. Two are in Charleston, on the Harbor. Two are on the Cooper River in the City of
North Charleston and one is located on the Wando River in the Town of Mt. Pleasant.
Charleston Harbor is home to the deepest channels in the region and regularly handles 8,400-
TEU vessels drafting up to 48 feet. Short transit times to the marine terminals, each within two
hours sailing time from the open ocean, help keep vessel schedule integrity intact and minimize
the risk of canal penalties or missed berthing windows at other ports.
The Port of Charleston is growing its capacity. To prepare for coming years, Charleston is
heavily investing in its new and existing terminals with a 10-year, $1.3-billion capital plan. A
new terminal that will boost total container capacity in the port by 50% is set to open in 2016.
ASSESSMENT
Adequate broadband infrastructure and services available in the CSRA are limited to small parts
of the urban area. The land-based broadband network will need to be greatly expanded in all
rural CSRA counties if these jurisdictions are to be competitive in economic development and
growth initiatives.
The CSRA contains a thorough and efficient surface transportation system, particularly its road
network. Even during peak traffic periods, the LOS in most of the CSRA’s more congested
roadways does not exceed level C. This provides an important competitive advantage as more
and more industrial site locaters select areas void of significant congestion problems.
Given the proximity to transloading facilities in the CSRA and neighboring regions, CSRA
jurisdictions are benefiting from rail service. Existing lines have the capacity to provide
expanded freight service to existing and new businesses desiring such service. The availability of
TRANS-FLO terminal capability with 46 rail car load/unload capacity and projected redesign of
an entire rail terminal area to meet increasing capacity as a result of new industrial tenants in
Augusta highlights the importance of rail to the CSRA.

119 Comprehensive Economic Development Strategy | CSRA Regional Commission|
4.9 HOUSING
The availability of an affordable and adequate housing is critical for the growth of any area.
Median housing values in the CSRA is $106,274, significantly below the state ($203,136) and
national ($270,012) averages (Figure D-13). These values reflect the lower housing values
commonly found in rural parts of Georgia.
Source: U.S. Bureau of the Census (2015), SF3
Rents are similarly more affordable in the CSRA than elsewhere in the state and the nation.
Median monthly rents average approximately ($610), significantly below the state ($879) and
national ($928) averages (Figure D-14).
$106,274
$203,136
$270,012
$0
$40,000
$80,000
$120,000
$160,000
$200,000
$240,000
$280,000
$320,000
CSRA Georgia U.S.A
Figure D-13: Median Home Values for Selected Jurisdictions, 2015

120 Comprehensive Economic Development Strategy | CSRA Regional Commission|
Source: U.S. Bureau of the Census (2000), SF3
The CSRA’s vacancy rates average approximately 14.9%, significantly above the state (13.5%)
and national (12.3%) averages (Figure D-15). Although this may reflect the availability of an
adequate housing supply, the condition of these units is not known.
Source: U.S. Bureau of the Census (2015), SF3
14.9%
13.5%
12.3%
0%
2%
4%
6%
8%
10%
12%
14%
16%
CSRA Georgia U.S.A
Figure D-15: Vacancy Rates for Selected Jurisdictions, 2015
$381 $444 $469
$610
$879 $928
$0
$100
$200
$300
$400
$500
$600
$700
$800
$900
$1,000
CSRA Georgia U.S.A
Figure D-14: Median Monthly Rents for Selected Jurisdictions, 2016

121 Comprehensive Economic Development Strategy | CSRA Regional Commission|
4.10 EXISTING PLANS AND ECONOMIC DEVELOPMENT GOALS
COUNTY COMPREHENSIVE PLANS
The purpose of a comprehensive plan is to offer guidance for the development of a county in
the current and changing economy. Comprehensive plans are designed to analyze development
trends, highlight potential problem areas, and provide possible strategies to the public and local
government officials to use in their efforts to improve their county over the next five years. A
review of all thirteen of the CSRA’s comprehensive plans highlights the following cross-cutting
economic development strategies:
Infrastructure improvements are needed in order to help recruit new businesses.
Build on major employers.
Focus on retaining and expanding existing firms and industries.
Actively support the chambers of commerce and development authorities.
Make the necessary airport improvements.
Focus on downtown commercial and residential development.
Upgrade and expand existing industrial parks and develop new ones.
Recruit small businesses and aggressively as major ones.
Diversify local economies.
AUGUSTA AREA DIVERSIFICATION INITIATIVE
Conceived as a proactive regional endeavor to develop a framework for sound decision-making
in the years ahead, the purpose of the Augusta Area Diversification Initiative (AADI) is to
facilitate the implementation of economic policies designed to avoid overdependence on
defense expenditures. The AADI represents an attempt to deal with short and long-range
economic development issues. The overall plan goal is to foster a strong and diverse economy
through a mix of industries that provide a healthy balance of goods-producing and service-
producing jobs. Objectives and strategies to achieve this goal include:
Target industrial recruitment which enhances economic diversification with a focus on
value-added and niche manufacturing.
o Target available financial resources to value-added and niche manufacturing.
o Enhance labor force skills by guiding technical and occupational training in
cooperation with technical schools and area colleges.
o Survey hi-tech and niche manufacturers about skills needs.

122 Comprehensive Economic Development Strategy | CSRA Regional Commission|
o Work as needed with individual companies on expansion plans.
o Promote the Laney Walker Enterprise Zone for niche manufacturing.
Encourage growth of warehousing and distribution industries within existing industrial parks
and new locations along major highways and interstates.
o Assemble large acre parcels to promote warehousing and distribution.
o Adapt existing industrial parks to meet warehousing and distribution specifications.
o Use federal transportation funds strategically to promote warehousing and
distribution.
Encourage the growth of business services and information technology.
o Promote Augusta’s low business costs to recruiters.
o Encourage capital improvement planning to target office space-oriented
infrastructure improvements.
o Conduct thorough inventory of downtown office space.
o Promote former military IT labor supply to potential recruits.
o Develop matching and mining database to link former military labor with existing
and recruited businesses.
o Coordinate with technical and four-year colleges to respond to increase in business
services and information technology employment.
Encourage the growth of biomedical industries.
o Recruit top-notch biomedical faculty.
o Promote MCG success to encourage venture capital.
o Ensure appropriate land use around MCG to permit biomedical industry growth.
o Encourage growth of existing business incubators.
Expand the Augusta area’s tourism economy.
o Support tourism-oriented projects such as a convention center and performing arts
center.
o Target funding to support the variety of arts programs and festivals which attract
visitors to Augusta.
o Coordinate with the Georgia Department of Economic Development to update the
existing tourist survey.
Encourage the growth of master planned communities.
o Promote the Augusta area as a retirement destination.
o Ensure sufficient land use for large retirement-scale communities.
Develop downtown as a primary residential, office, tourist and retail destination.
o Develop a downtown master plan.
o Establish a Business Improvement District.
o Locate future major tourist venues such as conference centers and performing arts
centers in the downtown area.

123 Comprehensive Economic Development Strategy | CSRA Regional Commission|
o Market city and state funding programs to small businesses.
o Redevelop vacant properties with the use of grants and tax credits.
o Expand existing downtown festivals and special events.
Retain and expand existing businesses.
o Focus business expansion and job retention programs on targeted sectors and
industries.
o Monitor trends, issues and opportunities involving key sectors and industries.
o Assist with targeted sector and industry retention/expansion business plans.
o Host regular meetings with major employers to discuss current operations and
expansion plans.
Develop and nurture industry clusters for targeted sectors and industries.
o Promote business assistance programs that support the cluster approach.
o Expand incubator facilities where entrepreneurs can grow their businesses and
receive specialized assistance during the early phases of their operations.
o Refine the locational and supportive requirements for each cluster.
o Expand the technical and professional training capabilities of area colleges in those
areas supporting targeted sectors and industries.
Strengthen institutional capacity geared towards targeted sectors and industries.
o Ensure that local policies, regulations, and decision-making processes consider
impacts on economic diversification efforts.
o Conduct training sessions for public officials and staff on economic development to
educate individuals regarding private sector perspectives of land development.
o Coordinate among economic development partners to efficiently and effectively
address economic development issues and opportunities and minimize duplication
of effort.
o Develop partnering relationships with other regions throughout the nation to build
economic development coalitions.
Build upon the existing education and workforce training that focuses on targeted sectors
and industries.
o Support cooperative efforts to coordinate education and job training programs
among the school boards, technical and four-year colleges, and state workforce
programs.
o Encourage linkages between area colleges and employers that feature quality
employment opportunities to retain skilled graduates.
o Conduct a survey of employers to determine what targeted sector and industry
certification and programs they would support.
o Work with area business schools to enhance entrepreneurial curriculum.
o Periodically evaluate programs to be responsive to the changing job market.

124 Comprehensive Economic Development Strategy | CSRA Regional Commission|
Provide an adequate supply of commercial and industrial sites to support new and
expanding firms wishing to locate or expand in the Augusta area.
o Develop an infrastructure plan with a focus on the needs of sectors and industries in
target clusters.
o Regularly benchmark local development review processes against competitor
regions with similar target sectors and industries.
o Participate in the capital improvement plan process to lobby for economic
development projects.
o Develop well-planned clustered employment centers in existing areas and
downtown.
o Prepare a market analysis of available infill sites.
o Target financial incentives to encourage the revitalization and utilization of historic
and older commercial and industrial districts for redevelopment.
o Designate the necessary acreage of vacant prime industrial land for a 20-year
planning period.
o Update inventories of industrial lands at least every ten years to reestablish the 20-
year supply of industrial lands.
o Develop industrial land banking system for large sites to preserve large parcels at
key locations for future industrial sites.
Market and promote target sectors and industries.
o Market the Augusta area’s sizable skilled labor force as an economic development
advantage for new and expanding businesses.
o Centralize website information on development statistics, demographics, local
trends, employment statistics, and other data meaningful to developers and site
locators.
o Communicate regularly with key stakeholders and the general public regarding
economic development issues, progress and impact.

125 Comprehensive Economic Development Strategy | CSRA Regional Commission|
5.0 INTRODUCTION
The CSRA’s economy underwent economic changes similar to other regions of the nation. For
the urbanized area, this included the rapid rise of high technology jobs and the support services
that sustain this industry. For rural CSRA areas, the changes resulted in declining manufacturing
activity and the growth of the services sector. Industry growth is key in maintaining the CSRA’s
economic vitality and competitiveness over time. The loss of manufacturing jobs has hurt the
region. These jobs require specific skill sets and are among better paying employment
opportunities. In addition, the loss of manufacturing jobs creates negative ripple effects in
related sectors.
As the CSRA’s economic base shifted, the nature of the businesses also changed. The backbone
of area economies has long been the presence of a number of very large employers – both in
the productions and service sectors. However, in the last 15 years, the number of large
employers has diminished and the importance of small businesses has grown.
In today’s economy, economic development – particularly diversification - is a necessary and
critical undertaking. A healthy and relative independence of sectors can ensure that a downturn
in any area does not necessarily mean a downturn in the whole economy. Entering new
markets and sectors is crucial for future growth and survival of any locality. The challenge of
economic development is to distinguish between issues that can be improved and changed and
issues which are outside the capability of local areas. Resources can then be focused on those
areas within local capabilities and capacities. Therefore, the success of any long-term strategy is
dependent on:
Understanding the risks, capabilities and opportunities involved in a particular economic
development strategy.
Being able to promote and build on the strengths.
Knowing when to overcome a weakness and when to live with it.
Recognizing opportunities and embracing them.
5.1 ISSUES IN ECONOMIC DEVELOPMENT

126 Comprehensive Economic Development Strategy | CSRA Regional Commission|
NATIONAL AND GLOBAL INTEGRATION
Several ongoing trends have resulted in changes to the way economies function, both
nationally and internationally. These include:
Increasingly Global Markets: The world economy is becoming more integrated and the
CSRA has become less immune from national and global economic events. Economic
development policy must therefore consider national and international economic
factors for many of the region’s key employers.
Rapidly Advancing Technological Innovation: Technological innovation is enhancing
productivity and changing the way goods and services are produced. Encouraging
continued growth in productivity (including new investment and a focus on work force
preparedness) is key to study area economies ability to compete.
Combined, these trends, often referred to GCT (globalization, convergence and technology), are
fundamentally reshaping the nature of local and regional economies. Relationships between
businesses are changing – customers are now able to search worldwide for specialized products
or services. Convergence is dissolving the boundaries that traditionally kept industries apart,
and is redefining many industries and markets. Knowledge and expertise are now as important
as business, capital and plant assets.
REGIONAL ECONOMIC CHALLENGES
The CSRA faces several economic development challenges in the coming decades, including
infrastructure needs, declining municipal revenues and needed downtown revitalization. Cities
and counties throughout the region have experienced a decline in revenues due to changes in
federal and state revenue distribution policies. Furthermore, more and more federal and state
mandates are either under-funded or not funded at all, thereby increasing local government
financial burdens. At the same time, residential development has consumed large amounts of
municipal services and tax funds, much more than it contributed to the revenue stream.
Commercial and industrial users, on the other hand, have paid more in taxes than they have
consumed in county services.

127 Comprehensive Economic Development Strategy | CSRA Regional Commission|
Evolving federal economic development policy is also changing. Since the 1970s, the federal
government has withdrawn much of its state and local funding for local economic development
initiatives. Local governments are on their own to a much greater extent than they have been in
the past and are forced to take active roles in sustaining and stimulating job creation in a
complex and interdependent global economy. CSRA jurisdictions have tasked their respective
development authorities and chambers of commerce with this workload. These agencies have
strived to support and retain the economic base that they have and broaden economic
activities to reduce the vulnerabilities to global influences that can occur in any one of their
primary economic activities.
Compounding these regional issues is that metropolitan areas such as Augusta support
localities far beyond the metropolitan areas. There are 13 counties (11 of them rural) in the
CSRA that all depend on the well being of the Augusta economy. Historically, the rural CSRA
localities pursued an undifferentiated, low-cost, commodity producing strategy instead of a
value-added niche strategy. The rural CSRA is now faced with fierce global competition forcing
companies to cut costs by substituting capital for labor to generate productivity improvements.
Unskilled and semi-skilled labor has been hit hard by competition from low wage jurisdictions.
Rural CSRA communities have responded with their own industrial attraction programs but it is
unclear whether the strategy will be successful. Industrial attraction efforts have been stymied
by the downturn in the national economy, the increasing relocation of manufacturing overseas,
and a decline in relocation activity among prospective firms. Companies that have relocated to
Augusta are lured by the facilities and incentives available from their development authorities,
which are beyond the means of rural communities. CSRA communities are not alone in this
situation, as numerous localities in Georgia with newly constructed industrial parks have been
unable to attract tenants.
5.2 GOALS AND ACTION STRATEGIES
The following CEDS Plan goals and action strategies were developed within the framework of
specific sectors and industry areas, which include:
Niche and value-added manufacturing
Warehousing and distribution related industries
Business services and information technology
Tourism
Retiree attraction
Downtown development

128 Comprehensive Economic Development Strategy | CSRA Regional Commission|
NICHE MANUFACTURING
The CSRA has a long, rich heritage in manufacturing, and continues to have a significant
proportion of the work force employed in this sector, particularly when compared to the state
and the national averages. Traditional industries in chemical products and precision
manufacturing will continue to be an important part of the economy for years to come. Many
CSRA manufacturing firms represent high-wage, high-skill, and high-output jobs—jobs that in
many cases are better described as hi-tech as anything else. Advanced manufacturing
processes, involving computer controlled processes, tight logistical planning, and specialized
technical and engineering focus, is the hallmark of many study CSRA employers.
Although manufacturing is a primary employment sector, there have been plant closures,
layoffs, and job losses by larger manufacturers. While CSRA manufacturers will continue to face
challenges to maintain their position in the national and global economy, there are
opportunities in niche market segments.
Many innovative communities and businesses are creating additional manufacturing jobs by
using rather than exporting raw materials as intermediary inputs. This process, known as value-
added manufacturing, is already occurring within the CSRA. Golf cart manufacturers, for
example, use otherwise exportable aluminum and steel to develop golf carts. Existing firms
have created both a skilled work force as well as network of suppliers and business
relationships that will attract and foster the growth of these sub-sectors.
CSRA jurisdictions can further value added manufacturing by profiting from existing forestry
products that are currently exported to other markets. Rural CSRA jurisdictions are among the
highest forestry producing regions in the southeast but very few furniture manufacturers are
located in the region. Manufacturing better products rather than more products, increasing the
production of local by-products and improving the quality of products would generate more
local jobs and spending, spur exports, and potentially reduce the need to import goods-
producing materials from other areas.
Niche manufacturing is centered on developing customized products. Examples include
windows with specific architectural standards, parts for limited edition autos, etc. The CSRA is
ideally placed for this type of activity because of its accessible transportation system and
proximity to major metropolitan areas in the southeast. In addition, these types of services
provide positive spillovers because of their demand for supporting staff, specialized software
applications, and strategic and business consulting services.

129 Comprehensive Economic Development Strategy | CSRA Regional Commission|
Niche manufacturing operations also tend to be smaller in scale and generally do not require
significant land acreage. Existing vacant plants and properties could be improved and
redeveloped in locations within the CSRA’s cities and nearby unincorporated areas. This would
help introduce new employment activities and help stabilize neighborhood conditions as well.
Designated areas for this type of manufacturing would therefore include existing industrial
parks and downtown area sites.
A focus on value-added and niche manufacturing is not easy for economies without the
necessary skill level. However, there are other places to learn from that have managed to
develop this manufacturing subsector. Atlanta, with relatively few business and technology-
focused colleges for a city of its size two decades ago, underwent a dramatic transformation
from a largely low-cost manufacturing economy to a service, pharmaceutical and information
technology economy. Recruitment of highly-skilled manufacturing to the CSRA can be achieved
by ensuring a quality workforce to fill industry needs. Area technical colleges, with substantial
experience in preparing skilled graduates, and the Quick Start program are ideal for this activity.
Goal: Target industrial recruitment which enhances job creation with a focus on value-added
and niche manufacturing.
Action 1: Pursue both mid-size and large regional industrial parks.
Action 2: Target financial resources to value-added and niche manufacturing.
Action 3: Enhance labor force skills by guiding technical and occupational training in
cooperation with technical schools and area colleges.
Action 4: Survey hi-tech and niche manufacturers about skills needs.
Action 5: Promote designated areas in or near CSRA cities for niche and value added
manufacturing.
Performance Measure 1: The number of new niche and value added jobs.
Performance Measure 2: The number of new niche manufacturers located in or in proximity to
established employment clusters.
Performance Measure 3: Satisfaction rates of labor force by value-added and niche
manufacturers.

130 Comprehensive Economic Development Strategy | CSRA Regional Commission|
WAREHOUSING AND DISTRIBUTION RELATED INDUSTRIES
Augusta is a recognized as a mid-regional center for distribution industries. Located in close
proximity, rural CSRA jurisdictions are ideally placed to develop as transportation distribution
hubs. Within a 240-mile radius, there is a market of over 25 million consumers. In addition, with
major four-lane highways and low levels of congestion, rural CSRA areas are competitively
placed to attract and sustain this industry.
Policy: Encourage growth of warehousing and distribution industries within existing industrial
parks and new locations along major highways.
Action 1: Assemble large acre parcels to promote warehousing and distribution.
Action 2: Adapt existing industrial parks to meet warehousing and distribution specifications.
Action 3: Use federal and state transportation funds strategically to make improvements to
support warehousing and distribution.
Performance Measure 1: The number of warehousing and distribution industry jobs.
Performance Measure 2: The number of warehousing and distribution industries benefiting
from road and highway improvements.
BUSINESS SERVICES AND INFORMATION TECHNOLOGY
Industries such as health, business, and financial services currently provide a good share of the
CSRA’s employment and will continue to provide an increasing number of well paid jobs in the
future. Hospitals and business service providers have shown steady employment growth in the
past few years. Information technology will also play an increasingly important role as
automation becomes an integral part of many jobs within these industries.
Because of the expansion of hi-tech and the higher paying jobs associated with the industry,
advanced-technology firms can potentially create new jobs while increasing wealth. High-tech
businesses are sources of ideas and innovations that increase the likelihood of new business

131 Comprehensive Economic Development Strategy | CSRA Regional Commission|
start-ups. This should also make the CSRA a real competitor for small operations whose site
requirements may not be as important as larger businesses.
Office uses will continue to serve a support role for the region’s economies. The market for
office uses in the CSRA will primarily be for small business and professional service firms.
Current demand has been met mostly by storefront space in combination with retail/residential
uses.
Goal: Encourage the growth of business services and information technology.
Action 1: Promote the CSRA’s low business costs to recruiters.
Action 2: Conduct thorough inventory of available office space.
Action 3: Coordinate with technical and four-year colleges to respond to increase in business
services and information technology employment.
Performance Measure 1: The number of business services and information technology jobs.
TOURISM
Tourism is a major industry in Georgia but relatively small in the CSRA when compared to other
historic southern communities. Tourism is an important sector because it is still
underdeveloped with high growth potential. The CSRA has an established cultural tourism
industry, with numerous events, visual performance arts and culture. The region’s location – in
between Atlanta and Charlotte - also provides great potential as a gateway community to
travelers from the southeast and throughout the nation.
It is true that most tourism-related jobs are low paying jobs, but it is also true that these are the
kinds of jobs that are appropriate for the skill level of some segments of the CSRA’s labor force
(including students and low-skilled residents). They are better alternatives than no jobs at all
which very likely would be the case were it not for the area’s tourism industry.
Goal: Expand the CSRA’s tourism economy.

132 Comprehensive Economic Development Strategy | CSRA Regional Commission|
Action 1: Support tourism-oriented projects such as enhancement projects.
Action 2: Target funding to support programs and festivals which attract visitors.
Performance Measure 1: The number of visitors annually.
Performance Measure 2: Levels of grant funding for enhancement projects.
DOWNTOWN DEVELOPMENT
Downtown districts throughout the CSRA are one of the region’s most important assets. Their
historic charm and pedestrian friendly design makes them desirable areas for economic
development. The districts are also easily accessible and centrally located, serving as activity
centers for the residents as well as visitors. These downtowns have great potential as centers
for entertainment, culture, and office-based business development.
Master planning is needed for the CSRA’s downtowns to focus on economic development.
Setting aside land uses for the type of economic growth activities recommended on this Plan
should go hand in hand with planning for public investments and institutional uses.
The presence of so many small businesses in the CSRA’s downtowns illustrates their importance
to the overall economic health of these communities. Considerable potential for small business
growth exists in encouraging business start-ups and enabling them to expand. Businesses that
employ local residents, use local materials, and sell local products are a key component of
economic growth. CSRA jurisdictions should continue efforts to provide land use designations
that provide small businesses opportunities to start and grow. Although local assistance to help
finance private business start-ups and expansion is limited, several state and some federal
financing programs (i.e. tax credits, SBA loans, etc.) are available.
Goal: Develop downtowns as a primary residential, office, tourist and retail destinations.
Action 1: Develop economical development-focused master plans as part of the comprehensive
planning process.

133 Comprehensive Economic Development Strategy | CSRA Regional Commission|
Action 2: Explore Business Improvement Districts.
Action 3: Locate future tourist venues in or near the downtown areas.
Action 4: Market city and state funding programs to small businesses.
Action 5: Redevelop vacant properties with the use of grants and tax credits.
Action 6: Expand existing downtown festivals and special events.
Performance Measure 1: The number of new residents annually.
Performance Measure 2: The number of tourists annually.
Performance Measure 3: The amount of retail sales annually.
5.3 BUSINESS RETENTION AND EXPANSION
Providing support for existing businesses is an important component of sustaining jobs. Existing
businesses provide over two-thirds of new jobs in the CSRA. Encouraging and nurturing these
businesses is the key to a stable economic base and the long-term viability.
Goal: Retain and expand existing businesses.
Action 1: Focus business expansion and job retention programs on targeted sectors and
industries.
Action 2: Monitor trends, issues and opportunities involving key sectors and industries.
Action 3: Assist with targeted sector and industry retention/expansion business plans.
Action 4: Host regular meetings with employers to discuss current operations and expansion
plans.
Action 5: Preserve Fort Gordon’s operating environment by implementing the Joint Land Use
Plan and utilizing appropriate land use tools to present encroachment.
Performance Measure 1: The number of retained and expanded targeted businesses.

134 Comprehensive Economic Development Strategy | CSRA Regional Commission|
Performance Measure 2: The number of assisted industries with expansion plans.
Performance Measure 3: The number of meetings with major employers held annually.
5.4 THE CLUSTER APPROACH
There is a new emerging economy that is entrepreneurial, knowledge intensive and niche-
based. The growth and development of significant industry clusters can serve as the basis to
capitalize on the new emerging economy.
Business clusters center on a strategy that builds upon the natural economic linkages between
sectors. Simultaneous development of sectors creates a more optimal outcome than if those
sectors developed separately and without linked approaches. Focusing economic development
on clusters can facilitate information exchange and build stronger ties among firms within
clusters. By promoting stronger ties among businesses, companies can realize benefits such as
lower operating costs, integrated products, shared transportation expenses, more efficient
production, and increased access to a specialized workforce.
DESIGNING AND IMPLEMENTING CLUSTER-BASED APPROACHES
In Cluster-Based Economic Development: A Key to Regional Competitiveness (1997), the U.S.
Economic Development Administration identifies five overall imperatives for any successful
cluster-focused effort:
1) Recruit highly committed leadership.
2) Develop a strategy to ensure adequate resources throughout the process.
3) Choose the right geographic level of focus.
4) Find tools to sustain momentum between stages.
5) Engage potential implementing institutions from the earliest stages of the process.
Cluster implementation centers of four mutually reinforcing principles:
Proving collective service delivery (i.e., cluster-wide entrepreneurial support, one-stop
shops, joint lobbying)
Targeting funding and investment to clusters (i.e. cluster-based infrastructure, multi-
firm public funding options)
Coordinate networking among cluster businesses (i.e. workshops and conferences)
Adapt workforce to cluster environment (i.e. specialized skills centers, cluster-college
training agreements)

135 Comprehensive Economic Development Strategy | CSRA Regional Commission|
A good example of the successful implementation of the cluster-based approach is in Augusta,
where area workforce adaptation to business clusters is seen in the biomedical cluster. Here,
some technical and four-college enrollment is driven by the cluster. Augusta Tech, Augusta
State University and the Medical College of Georgia have adapted curricula collaboratively with
cluster firms and allowed the demand and supply to be driven by businesses. Skills have
become more specialized, resulting in high rates of employment for graduates. The curricula
also emphasize industry-led instruction, resulting in colleges operating as continually learning
knowledge networks.
Goal: Develop and nurture industry clusters for targeted sectors and industries.
Action 1: Promote business assistance programs that support the cluster approach.
Action 2: Develop small-scale incubator facilities where entrepreneurs can grow their
businesses and receive specialized assistance during the early phases of their operations.
Action 3: Refine the locational and supportive requirements for each cluster.
Action 4: Tap into the technical and professional training capabilities of area colleges in those
areas supporting targeted sectors and industries.
Performance Measure 1: Growth of business clusters firms and employees.
5.5 INSTITUTIONAL CAPACITY
Business support needs often fit into several broad categories: property selection and
development, workforce procurement and training, infrastructure improvements, facility
modernization, and financial support. Institutional capacity is a major determinant of successful
job creation. Without the skill and knowledge base of economic development organizations,
economic initiatives will not succeed.
COORDINATED APPROACH
For institutional support, critical organizations are local governments, development authorities
and chambers of commerce. These agencies have clearly delineate roles and responsibilities for
various economic development functions (i.e., downtown revitalization, industrial park
development, business retention, marketing, administration of grants/loans) that create
focused, efficient and effective delivery of economic development services.
136 Comprehensive Economic Development Strategy | CSRA Regional Commission|
Economic development initiatives efforts depend, in large part, on the support of the local
governments to carry out planning policies. Local governments play a key role in providing
leadership to ensure that economic development plans and policies of other organizations
working to strengthen the economy are coordinated, implemented, and monitored.
A coordinated and cooperative approach to economic development initiatives should be
institutionalization in the planning process. It is important to use the skills and abilities of
participating partners internally within economic development agencies and externally in the
community. Local governments have numerous untapped resources, which for the most part
are dissipated in many directions. The challenge is to harness this interest and energy, focus it
in a common direction and use it to drive economic development initiatives.
STRATEGIC ALLIANCES
Most CSRA jurisdictions lack any formal strategic alliances with other regions throughout the
state. These relationships would allow CSRA communities to tap into an economic development
knowledge base that would assist in business recruitment and retention.
Goal: Strengthen institutional capacity geared towards targeted sectors and industries.
Action 1: Ensure that local policies, regulations, and decision-making processes consider
impacts on economic development efforts.
Action 2: Conduct training sessions for public officials and staff on economic development to
educate individuals regarding private sector perspectives of land development.
Action 3: Coordinate among economic development partners to efficiently and effectively
address economic development issues and opportunities and minimize duplication of effort.
Action 4: Develop partnering relationships with other regions throughout the nation to build
economic development coalitions.
Action 5: Provide training for local development authority board members.
Performance Measure 1: The number of training sessions conducted.
Performance Measure 2: The number of meetings among economic development officials.
Performance Measure 3: The number of economic development partnerships.
Performance Measure 4: The number of trainings offered to development authority board
members.
5.6 EDUCATION AND WORKFORCE DEVELOPMENT

137 Comprehensive Economic Development Strategy | CSRA Regional Commission|
The development of job skills needed by the current and future workforce must be a constant
priority for schools and businesses. As technology advances, business and industry continue to
experience a shift in needed employee skills. The information age has produced a shift from
production skills to information-processing and problem-solving skills. Most new jobs demand
an ability to adjust to forces requiring continual changes in products, processes, and
management structures. Schools and business colleges should examine their effectiveness in
producing entrepreneurs and managers capable of competing in the global economy.
Sustained long-run economic growth requires technological transformation and structural
change. The leading technology regions are investing heavily in programs to enable the
workforce to learn and re-learn competencies and skills required in that dynamic economic
world. In addition, an unprecedented requirement for adult retraining and continuous adult
learning to keep pace with the changing needs of business and industry is now present. Low
and semi-skilled workers can no longer command the wages they once did as a result of global
competition and labor cost pressures. Given the number of manufacturing jobs lost in the last
decade, workforce training is a necessary element to assist with worker transitions as well as
offering a diverse labor pool for businesses.
Goal: Build upon the existing education and workforce training that focuses on targeted
sectors.
Action 1: Support cooperative efforts to coordinate education and job training programs among
the school boards, technical and comprehensive colleges, and state workforce programs.
Action 2: Encourage linkages between area colleges and employers that feature quality
employment opportunities to retain skilled graduates.
Action 3: Conduct a survey of employers to determine what targeted sector and industry
certification and programs they would support.
Action 4: Work with area business schools to enhance entrepreneurial curriculum.
Action 5: Periodically evaluate programs to be responsive to the changing job market.
Performance Measure 1: Educational attainment of resident population.
Performance Measure 2: Performance of K-12 systems.
Performance Measure 3: The number of entrepreneurial courses at business schools.
5.7 LAND USE AND INFRASTRUCTURE
138 Comprehensive Economic Development Strategy | CSRA Regional Commission|
Land is a basic requirement for commercial and industrial activity. CSRA jurisdictions encourage
economic growth in locations suited for those uses based upon available public facilities, land
capability and an orderly development pattern. Economic growth in the industrial sector is
dependent on, among other factors, the availability of lands that are suitable for industrial use,
served by required urban services, and of adequate size for business expansion or the location
of new industries.
Traditionally, infrastructure for economic development was thought to revolve around water
and sewer projects. Since industrial recruitment formed the core economic development
strategy, this made sense. As the economy has shifted to a more service-based focus,
infrastructure requirements have changed. Broadband internet is critical for the economic
health of any community. Many CSRA communities lack the proper broadband capacity to be
successful in attracting targeted sectors. While incorporated areas are often serviced by an ISP
provider, there is usually a monopoly that renders the service cost-prohibitive. In the
unincorporated areas, there is very little broadband coverage.
DEVELOPMENT PATTERNS
Redevelopment of abandoned or underutilized sites where infrastructure and services are
readily available provides a wider range of opportunities for business location. Older
commercial and industrial districts offer great potential as alternative venues to more suburban
locations for economic growth. The downtown business districts are good examples of venues
with such potential. By limiting new development through the extension of infrastructure,
existing underdeveloped properties can be appropriately repaired and utilized.
Many of these locations are in the heart of impoverished neighborhoods that have many
underutilized, older commercial and industrial buildings. Redevelopment provides the
opportunity for nearby job-training and employment to those in the neediest areas, adds tax
revenues to municipalities, and stimulate other revitalization efforts.
In addition to vacant and underutilized sites that are suitable for redevelopment, rehabilitation
of historic or older buildings is another option for business location. The CSRA contains a
significant number of unique historic structures that provide an ideal location for small
businesses. Smaller spaces, lower costs, and central location all contribute to attracting and
retaining small businesses. By maintaining an inventory of older buildings, cities and downtown
development authorities can assist potential businesses to identify structures that meet their
needs.
It is clear that existing revenue streams are not sufficient to keep up with demand for public
services and facilities. In the past, CSRA jurisdictions dispersed their capital improvement
expenditures throughout their areas strategically, thereby avoiding the problem of providing

139 Comprehensive Economic Development Strategy | CSRA Regional Commission|
partial solutions to multiple areas. Given the limited resources available for infrastructure, local
governments have to continue their adopted strategic approaches to investment of public
funds.
The resurgence of compact, self-sufficient neighborhoods where people meet their lifestyle
needs has created a renewed interest in mixed-use development. The economics of mixed-use
derive from the notion that mutually supporting activities have a synergistic effect on each
other. If housing and office uses are combined, for example, a market is created for shops and
services that could not be supported by either alone. In addition, combining these activities in a
more compact and focused growth environment, provides additional land for economic growth
within an area.
Mixed-use development can fill an important market niche. At a smaller scale, mixed-use
provides a way to introduce commercial and office use into residential areas. Within mixed-use
centers, the possibility exists for business owners to occupy living space above their business
establishments. The concept can be used as to support infill projects in existing areas and as
magnet projects to stimulate neighborhood development.
Goal: Provide an adequate supply of commercial sites to support new and expanding firms
wishing to locate or expand.
Action 1: Develop an infrastructure plan with a focus on the needs of target sectors.
Action 2: Participate in the capital improvement plan process to lobby for economic
development projects.
Action 3: Promote enhanced infrastructure that is suitable for attracting industry.
Action 4: Educate community leaders on the need for suitable infrastructure for job creation.
Action 5: Apply for state and federal infrastructure grants – particularly for broadband, water &
sewer projects.
Action 6: Support local revenue generating policies, such as SPLOST, to help fund infrastructure
improvements.
Action 7: Encourage regional infrastructure sharing between counties.
Action 8: Develop well-planned clustered employment centers in existing areas and
downtowns.
Action 9: Prepare a market analysis of available infill sites.

140 Comprehensive Economic Development Strategy | CSRA Regional Commission|
Action 10: Target financial incentives to encourage the revitalization and utilization of historic
and older commercial and industrial districts for redevelopment.
Action 11: Designate the necessary acreage of vacant commercial land for a 20-year planning
period.
Action 12: Update inventories of commercial lands and properties at least every ten years.
Action 13: Increase the number and quality of affordable housing units by developing action
plans, and partnering with developers.
Action 14: Support the construction and expansion of roadways projects such as I-20, I-520, GA
17, Fall Line Freeway and the Savannah River Parkway.
Action 15: Support regional transportation funding.
Action 16: Expand capacity and runway lengths of CSRA airports.
Performance Measure 1: Funds targeted for revitalization efforts.
Performance Measure 2: Designated commercial acreage in future comprehensive plans.
Performance Measure 3: Amount of state and federal infrastructure funds obtained in the
CSRA.
Performance Measure 4: Amount of local revenue generating funds targeted to economic
development projects.
Performance Measure 5: The number of quality affordable housing units.
Performance Measure 6: Amount of regional transportation funding.
5.8 MARKETING AND PROMOTION
There are a number of techniques CSRA jurisdictions can use to market and promote targeted
industries. These include:
PRINT ADVERTISING
Print advertising typically has two objectives: (1) increase awareness as a business location, and
(2) generate inquiries. Advertising in economic development magazines is the overwhelming
favorite among economic developers. Targeting ads directly to new facility decision makers is
important to avoid the message getting lost.

141 Comprehensive Economic Development Strategy | CSRA Regional Commission|
TRADE SHOWS
Trade shows are a very cost-effective way of generating a high number of development leads.
These are typically coordinated with state agencies. Economic development organizations can
attend key trade shows. Trade shows provide an opportunity to contact a large concentration
of prospects for target sectors and industries.
BUSINESS MISSIONS OR PROSPECTING TRIPS
These are trips outside the area, focusing on a source area for economic development leads. To
keep travel costs down, missions are often held in conjunction with trade shows, or with the
state development groups.
EVENTS
Events are a way to communicate to a broad audience. They are most useful for retention
purposes, but can also serve as effective attraction techniques. Events generally include new
business receptions, awards for existing businesses, and executive tours for industrial prospects
and key site consultants.
PUBLIC RELATIONS
Many communities use public relations as a central component of their economic development
strategy. Public relations include news releases, articles about CSRA economies, success stories
in magazines, newspapers, and other media. Press coverage adds credibility and name-
recognition, encouraging targeted industries to respond. Public service announcements are
typically released for new company recruitment, funding, survey and study results, and
accomplishments of agency staff.
WEB SITES
Most communities have their own web site with clear links to data useful to corporate site
selectors and their consultants. This means including community profiles in addition to in-depth
facts such as economic profiles, data books, site and building inventories, infrastructure,
business climate factors, and industry profiles. Including such data requires coordination among
different stakeholders. This is particularly true for buildings and sites. The major area real
estate companies maintain excellent databases of all existing inventory, trends in the market,
costs and usually historical information on sites or buildings.
Presently, no website exists to provide centralized information for the entire region. The
development authority and chamber of commerce websites are the most detailed but other
economic development organizations maintain their own data and information.

142 Comprehensive Economic Development Strategy | CSRA Regional Commission|
SITE VISITS / TOURS
Prospect visits are very important in the decision making process. They provide the opportunity
to show firsthand what an area has to offer. Many prospects lack a perception of the areas they
are considering. Site visits provide prospects a chance to evaluate a region’s strengths,
weaknesses and potential for its future. Site visits typically include meetings with economic
development leaders, discussion of permitting process and general economic trends.
Goal: Market and promote target sectors and industries.
Action 1: Enhance the marketing capabilities of each CSRA county to attract new industry and
employment opportunities.
Action 2: Market the CSRA’s available labor force as an economic development advantage for
new and expanding businesses.
Action 3: Centralize website information on development statistics, demographics, local trends,
employment statistics, industrial lands and buildings inventories, and other data meaningful to
developers and site locators.
Action 4: Communicate regularly with key stakeholders and the general public regarding
economic development issues, progress and impact.
Action 5: Educate local companies about financial and business development resources
available from government sources.
Performance Measure 1: The number of press articles, print advertisements, trade shows,
direct mail, and business mission trips annually.
Performance Measure 2: The number of website hits annually.
Performance Measure 3: Number of information packets on available government financial and
business resources.
5.9 IMPLEMENTATION
For economic development strategies to succeed, it is necessary to be realistic about the
strengths, weaknesses, opportunities and threats. There is considerable energy in the CSRA to
make things happen – smart people, unique economic specialty areas, counter-cyclical business
activity that provides a stable base – and to sustain a vibrant, dynamic and diversified regional
economy.

143 Comprehensive Economic Development Strategy | CSRA Regional Commission|
COLLABORATIVE APPROACH
It is not until all of the above-mentioned factors are combined and integrated that the CSRA will
achieve its economic development vision. A focus on integrated education, entrepreneurship,
and enhancement of existing sectors and industries, can drive the regional economy to success.
For this strategy to succeed, each key entity involved in the implementation of the strategy
must have clear accountabilities for implementing the strategy and the capacity to commit the
resources required.
The primary form of implementation will be through an increased level of co-operation
between the partners and relevant agencies. The objective is that a greater understanding of
activities and areas of expertise can be learned and drawn upon to respond to situations as
they arise. The form that these initiatives take will vary according to individual requirements,
but specific projects, joint approaches for funding, and collaboration on recruiting are just a few
of elements which come to the fore.
PERFORMANCE MONITORING
Economic development stakeholders will monitor and ensure the implementation of the CEDS
Plan, undertaking periodic reviews, identifying appropriate modifications required in the
strategy content and/or implementation mechanisms, and reporting back to all interested
parties. This enables stakeholders to monitor progress toward meeting economic development
goals.
These actions will be carried out in recognition that the CEDS Plan must be flexible and that
changes may have to be made for a variety of reasons, including:
Responding to changes in the CSRA’s economies.
Responding to consultation with other organizations.
The effectiveness of the partners’ overall objectives and activities.
Benchmarks are a way to measure and evaluate progress toward economic development goals.
The preceding section contains a list of performance measures that will be used to assess the
success and progress of the economic development action strategies.
Table A-1 details an action plan work program detailing specific actions needed to meet the
economic development vision.

144 Comprehensive Economic Development Strategy | CSRA Regional Commission|
Table A-1: Action Plan Work Program
Activity Implementation Timeline*
Responsible Party
TOPIC: TARGETED SECTORS (MANUFACTURING)
Goal: Target business recruitment which enhances economic development with a focus on value-added and niche manufacturing.
A. Develop mid-size and large regional industrial parks
Ongoing City/county governments; Development Authorities
B. Target available financial resources to value-added and niche manufacturing.
Ongoing City/county governments; Development Authorities
C.
Enhance labor force skills by guiding technical and occupational training in cooperation with technical schools and area colleges.
Ongoing Development Authorities; area colleges
D. Survey hi-tech and niche manufacturers about skills needs.
Ongoing Development Authorities
E. Promote designated areas in or near cities for niche and value added manufacturing.
Ongoing Development Authorities
TOPIC: TARGETED SECTORS (WAREHOUSING AND DISTRIBUTION)
Goal: Encourage growth of warehousing and distribution industries within existing industrial parks and new locations along major highways and interstates.
A. Assemble large acre parcels to promote warehousing and distribution.
Ongoing City/county governments; Development Authorities
B. Adapt existing industrial parks to meet warehousing and distribution specifications.
Ongoing City/county governments; Development Authorities
C. Use federal/state transportation funds strategically to promote warehousing and distribution.
Ongoing CSRA RC; City/county governments; Development Authorities
TOPIC: TARGETED SECTORS (BUSINESS SERVICES / INFORMATION TECHNOLOGY)
Goal: Encourage the growth of business services and information technology.

145 Comprehensive Economic Development Strategy | CSRA Regional Commission|
Table A-1: Action Plan Work Program
Activity Implementation Timeline*
Responsible Party
A. Promote low business costs to recruiters. Ongoing Development Authorities
B. Conduct thorough inventory of available office space.
Short-Range City/county governments; Development Authorities
C.
Coordinate with technical and four-year colleges to respond to increase in business services and information technology employment.
Ongoing Development Authorities
TOPIC: TARGETED SECTORS (TOURISM)
Goal: Expand the region’s tourism economy
A. Support tourism-oriented projects such as enhancements projects.
Long-Range Chambers of Commerce; downtown development authorities
B. Target funding to support the variety of arts programs and festivals which attract visitors.
Ongoing
City/county governments; chamber of commerce; downtown development authorities
TOPIC: TARGETED SECTORS (DOWNTOWN DEVELOPMENT)
Goal: Develop downtown as a primary residential, tourist and retail destination.
A. Develop economical development-focused master plans as part of the comprehensive planning process.
Short-Range
CSRA RC; City/county governments; chamber of commerce; development authorities; downtown development authorities
B. Explore Business Improvement Districts. Short-Range Downtown Development Authorities
C. Locate future major tourist venues in or near downtown areas.
Long-Range Chambers of commerce, downtown development authorities
D. Market city and state funding programs to small businesses.
Ongoing City/county governments; chambers

146 Comprehensive Economic Development Strategy | CSRA Regional Commission|
Table A-1: Action Plan Work Program
Activity Implementation Timeline*
Responsible Party
of commerce, downtown development authorities
E. Redevelop vacant properties with the use of grants and tax credits.
Ongoing
CSRA RC; City/county governments; chambers of commerce, downtown development authorities
F. Expand existing downtown festivals and special events.
Ongoing
City/county governments; chambers of commerce, downtown development authorities
TOPIC: BUSINESS RETENTION AND EXPANSION
Goal: Retain and expand existing businesses.
A. Focus business expansion and job retention programs on targeted sectors and industries.
Ongoing Development Authorities; chambers of commerce
B. Monitor trends, issues and opportunities involving key sectors and industries.
Ongoing Development Authorities; chambers of commerce
C. Assist with targeted sector and industry retention/expansion business plans.
Ongoing Development Authorities; chambers of commerce
D. Host regular meetings with major employers to discuss current operations and expansion plans.
Ongoing Development Authorities; chambers of commerce
E. Preserve Fort Gordon’s operating environment
Ongoing CSRA RC; City and County Governments
TOPIC: BUSINESS CLUSTERS
Goal: Develop and nurture industry clusters for targeted sectors and industries.
A. Promote business assistance programs that support the cluster approach.
Ongoing Development Authorities; chambers of commerce

147 Comprehensive Economic Development Strategy | CSRA Regional Commission|
Table A-1: Action Plan Work Program
Activity Implementation Timeline*
Responsible Party
B.
Develop small-scale incubator facilities where entrepreneurs can grow their businesses and receive specialized assistance during the early phases of their operations.
Ongoing Development Authorities; chambers of commerce
C. Refine the location and supportive requirements for each cluster.
Ongoing Development Authorities; chambers of commerce
D.
Tap into the technical and professional training capabilities of area colleges in those areas supporting targeted sectors and industries
Ongoing Development Authorities; chambers of commerce
TOPIC: INSTITUTIONAL CAPACITY
Goal: Strengthen institutional capacity geared towards targeted sectors and industries.
A. Ensure that local policies, regulations, and decision-making processes consider impacts on economic planning efforts.
Ongoing Development Authorities; chambers of commerce
B.
Conduct training sessions for public officials and staff on economic development to educate individuals regarding private sector perspectives of land development.
Ongoing CSRA RC; Development Authorities; chambers of commerce
C.
Coordinate among economic development partners to efficiently and effectively address economic development issues and opportunities and minimize duplication of effort.
Ongoing CSRA RC; Development Authorities; chambers of commerce
D. Develop partnering relationships with other regions throughout the nation to build economic development coalitions.
Ongoing Development Authorities; chambers of commerce
E. Provide training for local development authority board members
Ongoing CSRA RC; Development Authorities
TOPIC: EDUCATION AND WORKFORCE DEVELOPMENT

148 Comprehensive Economic Development Strategy | CSRA Regional Commission|
Table A-1: Action Plan Work Program
Activity Implementation Timeline*
Responsible Party
Goal: Build upon the existing education and workforce training that focuses on targeted sectors and industries.
A.
Support cooperative efforts to coordinate education and job training programs among the school boards, technical and four-year colleges, and state workforce programs.
Ongoing Development Authorities; chambers of commerce
B.
Encourage linkages between area colleges and employers that feature quality employment opportunities to retain skilled graduates.
Ongoing Development Authorities; chambers of commerce
C.
Conduct a survey of employers to determine what targeted sector and industry certification and programs they would support.
Ongoing Development Authorities; chambers of commerce
D. Work with area business schools to enhance entrepreneurial curriculum.
Ongoing Development Authorities; chambers of commerce
TOPIC: LAND USE AND INFRASTRUCTURE
Goal: Provide an adequate supply of commercial and industrial sites to support new and expanding firms wishing to locate or expand in the CSRA area.
A. Develop an infrastructure plan with a focus on the needs of sectors and industries in target clusters.
Short-Term
Development Authorities; downtown development authorities; chambers of commerce
B. Participate in the capital improvement plan process.
Ongoing
Development Authorities; downtown development authorities; chambers of commerce
C. Promote enhanced infrastructure to attract industry
Ongoing CSRA RC; Development Authorities; downtown development

149 Comprehensive Economic Development Strategy | CSRA Regional Commission|
Table A-1: Action Plan Work Program
Activity Implementation Timeline*
Responsible Party
authorities; chambers of commerce
D. Educate community leaders on suitable infrastructure for job creation
Ongoing
CSRA RC; Development Authorities; downtown development authorities; chambers of commerce
E. Apply for state and federal infrastructure grants – especially for broadband, water, and sewer projects.
Ongoing
CSRA RC; Development Authorities; downtown development authorities; chambers of commerce
F. Support local revenue generating policies Ongoing
CSRA RC; Development Authorities; downtown development authorities; chambers of commerce
G. Encourage regional infrastructure sharing between counties
Ongoing
CSRA RC; Development Authorities; downtown development authorities; chambers of commerce
H. Develop well-planned clustered employment centers in or near existing downtowns.
Ongoing
Development Authorities; downtown development authorities; chambers of commerce
I. Prepare a market analysis of available infill sites.
Short-Term
CSRA RC; Development Authorities; downtown development authorities; chambers of commerce
J.
Target financial incentives to encourage the revitalization and utilization of historic and older commercial districts for redevelopment.
Ongoing Development Authorities; downtown development
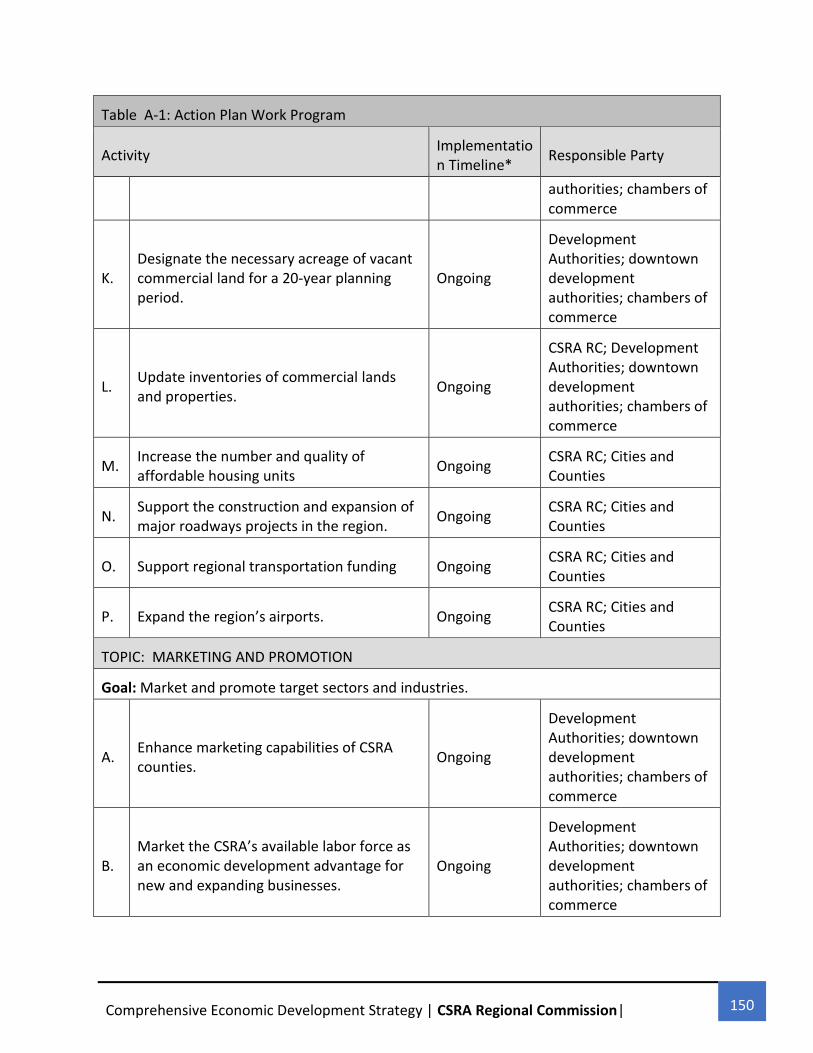
150 Comprehensive Economic Development Strategy | CSRA Regional Commission|
Table A-1: Action Plan Work Program
Activity Implementation Timeline*
Responsible Party
authorities; chambers of commerce
K. Designate the necessary acreage of vacant commercial land for a 20-year planning period.
Ongoing
Development Authorities; downtown development authorities; chambers of commerce
L. Update inventories of commercial lands and properties.
Ongoing
CSRA RC; Development Authorities; downtown development authorities; chambers of commerce
M. Increase the number and quality of affordable housing units
Ongoing CSRA RC; Cities and Counties
N. Support the construction and expansion of major roadways projects in the region.
Ongoing CSRA RC; Cities and Counties
O. Support regional transportation funding Ongoing CSRA RC; Cities and Counties
P. Expand the region’s airports. Ongoing CSRA RC; Cities and Counties
TOPIC: MARKETING AND PROMOTION
Goal: Market and promote target sectors and industries.
A. Enhance marketing capabilities of CSRA counties.
Ongoing
Development Authorities; downtown development authorities; chambers of commerce
B. Market the CSRA’s available labor force as an economic development advantage for new and expanding businesses.
Ongoing
Development Authorities; downtown development authorities; chambers of commerce

151 Comprehensive Economic Development Strategy | CSRA Regional Commission|
Table A-1: Action Plan Work Program
Activity Implementation Timeline*
Responsible Party
C.
Centralize website information on development statistics, demographics, local trends, employment statistics, and other data meaningful to developers and site locators.
Ongoing
CSRA RC; Development Authorities; downtown development authorities; chambers of commerce
D.
Communicate regularly with key stakeholders and the general public regarding economic development issues, progress and impact.
Ongoing
Development Authorities; downtown development authorities; chambers of commerce
E. Educate local companies about financial and business development resources
Ongoing
Development Authorities; downtown development authorities; chambers of commerce
* Short-Range (5 year period) Long-Range (10 year period)
5.10 STRATEGIC PROJECTS
RURAL BROADBAND INFRASTRUCTURE
There is a lack of broadband availability and subscription rates throughout the rural CSRA,
resulting in communities struggling to recruit new internet-dependent industries. In March,
2010, the CSRA Unified Development Authority created a non-profit entity, Fibernet, for the
sole purpose of developing a regional middle mile network to increase broadband access to
rural CSRA areas. Fibernet applied for federal ARRA funding through the Department of
Commerce’s BTOP program, but did not receive funding. The EDD is committed to working with
local communities and diverse funding sources to implement this crucial project. It is the most
critical economic development priority in the CSRA.
REGIONAL PARKS
The development of one to two regional parks is paramount to maximizing resources and
promoting the CSRA area. A large tract of land has been identified and preliminary discussions

152 Comprehensive Economic Development Strategy | CSRA Regional Commission|
have begun among UDA members. Additionally, the support and development of a mega-site
industrial park is a regional priority. The EDD will work with individual counties, cities, the UDA
to coordinate the development of these crucial regional parks as well as smaller multi-county
endeavors.
DEVELOPMENT OF NEW EXIT OFF 1-20
A new exit west of the City of Thompson presents an opportunity for new development in
McDuffie County. Land is readily available at this site, but water and sewer are needed. The
development of this exit will create another access point to McDuffie County as well as the area
surrounding Clarks Hill Lake.
BROWNFIELD REDEVELOPMENT
Abandoned Brownfield sites once provided economic vitality and jobs to communities and are
now avoided by new industry, developers and lenders. Productively reusing Brownfield sites
prevents sprawl, encourages revitalization and creates new jobs for the region. Cleaning up,
reinvesting in and redeveloping these properties shifts development pressures away from
undeveloped land and links economic vitality and jobs with environmental protection. The EDD
will work with local governments to identify and seek out funding for potential redevelopment
projects. This will include increasing the number of Brownfield Assessment and Cleanup
projects and creating a regional revolving loan fund.
MAINTAIN AND CREATE ADEQUATE ROADWAY, WATER AND SEWER
INFRASTRUCTURE THROUGHOUT THE REGION
One of the challenges of the region is keeping infrastructure current and maintaining the
capacity needed for new businesses. The EDD supports infrastructure improvement projects
throughout the region and considers each project essential to creating and retaining jobs.
Particularly important are the CSRA’s water and sewer projects and widening GA 17 from I-16
and I-85 in order to better serve companies that use the Port of Savannah.
PROMOTE HIGH TECH / BIOTECH INDUSTRY CLUSTERS
Thousands of highly-skilled, signal-trained, soldiers end their military service at Ft. Gordon and
leave the area in order to find work. National Science Center Foundation and Global
Emergency Resources are hoping to draw from that resource by developing a high tech,
science-oriented park adjacent to Fort Gordon. The region is now home to Army Cyber
Command and all of the spin off industries that relate. In the next planning cycle the EDD will
better be able to set goals and plans related to this rapidly emerging sector.

153 Comprehensive Economic Development Strategy | CSRA Regional Commission|