ct techniques for imaging the lung: recommendations for ... journal of radiology 52 (2004) 119–136...
TRANSCRIPT

European Journal of Radiology 52 (2004) 119–136
CT techniques for imaging the lung: recommendationsfor multislice and single slice computed tomography
Z.A. Aziz a,1, S.P. Padleyb, D.M. Hansella,∗a Department of Radiology, Royal Brompton Hospital, Sydney Street, London SW3 6NP, UK
b Department of Radiology, Chelsea and Westminster Hospital, 369 Fulham Road, London SW10 9NH, UK
Received 5 September 2003; received in revised form 8 January 2004; accepted 15 January 2004
Abstract
The introduction of multislice computed tomography (MSCT) has provided the thoracic radiologist with a powerful tool with which toimage the lungs. Enthusiasm for new protocols should be tempered with concerns over the potential increase in radiation dose, and beforeolder protocols are abandoned there should be good evidence that newer protocols are objectively superior. Ultimately, the best protocol isone that provides the most relevant clinical information at the lowest dose possible.© 2004 Elsevier Ireland Ltd. All rights reserved.
Keywords:Multislice computed tomography; Single slice computed tomography; Lung; Protocols
1. Introduction
The main developments in computed tomography (CT)in thoracic imaging have been the introduction of HRCT,spiral/volumetric CT and more recently, multislice CT(MSCT). The introduction of each technique has broughtdifferent opportunities but also exposed some limitations.Undoubtedly, the most exciting development in CT technol-ogy has been the MSCT. MSCT permits shorter acquisitiontimes, greater coverage and image resolution, and also pro-vides a substrate to better exploit the potential of currentlyavailable three-dimensional (3D) techniques. However, thesubstantial increase in the number of images generated bycertain protocols will continue to challenge both radiolo-gists and those involved with image storage. The adventof MSCT technology has led to increasing choice in theselection of parameters for the examination of the lungs.Some areas such as the investigation of suspected pul-monary embolism have received considerable attention andin these situations there is good evidence to support the CT
∗ Corresponding author. Tel.:+44-20-73528121;fax: +44-20-73518098.
E-mail addresses:[email protected] (Z.A. Aziz),[email protected] (S.P. Padley), [email protected](D.M. Hansell).
1 Tel.: +44-20-73528121; fax:+44-20-73518098.
protocols that are currently used. However, in many othersituations standard protocols do not yet exist. It is the aimof this article to review the literature for support, if nothard evidence, for specific CT lung protocols. Commonlyencountered clinical conditions/situations are dealt with in-dividually and each section starts with a summary of typicalprotocols (for single and four-channel multislice CT) de-scribed in the literature; additional refinements to the basicprotocol are discussed separately in full. Two definitions ofpitch are used with multislice CT, depending on whether asection, or the total collimation of the detector array is cho-sen as a reference[1]. In this review, the latter definition isused (table increment per 360◦ rotation divided by the totalbeam width) as this definition is applicable to both singleand multislice CT systems. It also should be emphasisedthat protocols for MSCT are scanner-specific and thereforethe type of scanner used is indicated where appropriate.
2. Diffuse infiltrative lung disease
2.1. Recommendations
Currently, it is not clear from the published literature whatMSCT protocols are being used in everyday practice to eval-uate diffuse lung disease. Protocols that have been used inrecent studies are outlined below.
0720-048X/$ – see front matter © 2004 Elsevier Ireland Ltd. All rights reserved.doi:10.1016/j.ejrad.2004.01.005

120 Z.A. Aziz et al. / European Journal of Radiology 52 (2004) 119–136
Technique[reference]
kV/mA s Detectorcollimation(mm)
Sectionthickness(mm)
Reconstructioninterval (mm)
Pitch IVcontrast
MSCTa [2] 40/140 4× 1 1.25 1.25 mm sections at10 mm incrementsand 5 mmcontiguous sections
1.5, scan time:0.75 s/rotation
N/A
MSCTa [3] Not specified 4× 1 1.25 As above 2, scan time:0.5 s/rotation
Single slice CT(SSCT)[4,5]
120–140/280–340 1 10 N/A
Schoepf et al.[2], Mastora et al.[3], Mayo et al.[4], Murata et al.[5].a Somatom Volume Zoom unit (Siemens, Forcheim, Germany).
2.2. Discussion
High resolution computed tomography plays a central rolein the evaluation of interstitial lung disease with establishedadvantages over plain chest radiography with regard to con-fidence and accuracy of diagnosis[6–8]. Nevertheless, whatconstitutes the optimal HRCT technique remains undecided.Historically, most authorities have recommended sectionwidths of between 1 and 1.5 mm from the thoracic inlet tothe lung bases, with sections spaced 10–20 mm apart and thepatient breath-holding at near total lung capacity. Studieshave shown that an accurate diagnosis can be achieved in pa-tients with a wide spectrum of interstitial lung disease usinga more limited technique[9,10]; with a more minimalist ap-proach, images are typically obtained at the level of the arch,tracheal carina and 2 cm above the right hemidiaphragm.In reality however, even experienced radiologists need thereassurance that confirmatory or ancillary features are notbeing missed by keeping the interspace distance to less than2 cm.
The patient with suspected combined focal and diffuselung disease (e.g. the familiar scrambled questions on a re-quest form: “haemoptysis, short of breath? nodule on CXR”)formerly posed a problem, as both contiguous volumetricCT as well as HRCT was required. Multislice CT offers theconvenience of a single protocol for the evaluation of thesepatients. Schoepf et al.[2] acquired scans with 1 mm colli-mation with multislice CT and reconstructed 5mm contigu-ous and 1.25 mm high-resolution CT sections from the orig-inal data. Image quality (assessed subjectively) of the 5 mm‘fused’ images was significantly superior to the 5 mm singleslice CT images, and the 1.25 mm images were of similarquality to conventional HRCT (1 mm sections acquired at10 mm increments) using single detector CT. Mastora et al.[3] used a similar protocol for 86 patients being evaluatedfor diffuse lung disease. They found that the contiguous5 mm thick reconstructed sections provided additional diag-nostic information in 13% of cases, most often by detecting
solitary lung nodules that were not evident on the HRCTstudy. For the occasional patient in whom such a comprehen-sive examination is required, this may be an appropriate anduseful technique (Fig. 1). However, for the majority of pa-tients being evaluated for suspected interstitial lung disease,conventional HRCT would still appear to be the most appro-priate examination. An HRCT examination usually yields 30images; a protocol involving the reconstruction of 5 mm con-tiguous sections and 1.25 mm sections at 10 mm increments(from a volumetric set acquired with 1 mm detector collima-tion) would yield approximately 90 images. In an attemptto reduce the number of images that need to be interrogatedusing this protocol, Remy-Jardin et al.[11] evaluated the di-agnostic accuracy of coronal thin sections as an alternativeto transverse HRCT scans. Reconstructions in the coronalplane result in fewer images (owing to the overall confor-mation of the thorax) and diagnostic accuracy was as pre-cise when compared with transverse HRCT. Nevertheless,protocols that involve scanning the entire chest with 1 mmcollimation are considerably more radiation intensive thana HRCT examination and the tendency to replace HRCTwith a volumetric protocol should be resisted. The issue ofdose with respect to MSCT is an important one. Volumetricimaging of the chest with 1 mm collimation (performed ona MSCT Somatom Plus 4 Volume Zoom scanner; Siemens,Erlangen, Germany) produces an effective dose of between7.5 and 7.8 mSv even when a low 70 mA s is used[12]. Thisis considerably higher than the effective dose of a conven-tional (1.5 mm at 10 mm intervals) HRCT which is approx-imately 0.98 mSv (140 kVp and 175 mA s).
2.3. Technique refinements
2.3.1. Prone scansInterspaced high-resolution CT sections in the supine po-
sition are usually sufficient for the diagnosis of diffuse lungdisease. Additional scans obtained with the patient prone areoccasionally necessary to detect or exclude subtle disease

Z.A. Aziz et al. / European Journal of Radiology 52 (2004) 119–136 121
Fig. 1. An example of a patient with known emphysema presenting with a cough and an incidental nodule at the right apex on chest radiography.Images were acquired using MSCT (4 mm× 1 mm detectors) with reconstructions at (a, b) 3/3 mm and (c) 1.25/10 mm. The 3 mm sections demonstrateda calcified nodule at the right apex (a) and revealed several smaller nodules (b) (arrowheads) not demonstrated on the interspaced 1.25 mm sections.However, thin sections showed mild cylindrical bronchiectasis within the lingula and left lower lobe.
122 Z.A. Aziz et al. / European Journal of Radiology 52 (2004) 119–136
in the posterior parts of the lung. Many centres only obtainprone scans when normal physiologic dependent opacifica-tion needs to be differentiated from a true pathologic abnor-mality [13], but this requires either close monitoring of thescans (not always practical) or recalling patients for addi-tional scans.
Volpe et al.[14] found that prone scans were indicatedwhen chest radiographs were normal, questionably abnormalor showed minimal abnormality. In patients with an obvi-ous diffuse abnormality on chest radiography, supine HRCTwas diagnostic in 44/46 (96%) and prone scans were onlyhelpful in two cases. As chest radiographs are frequentlyreviewed prior to HRCT, patients in whom prone scanningis likely to be of benefit can be selected. The exception tothis is in the investigation of patients with asbestos expo-sure and suspected (but not clinically obvious) asbestosis,where routine prone scanning is probably indicated (Fig. 2).This disease has a typically basal distribution and early lungfibrosis may be missed without prone scans[15].
2.3.2. ECG gatingSome scanners are capable of prospective ECG-gating.
Schoepf et al.[16] subjectively assessed image quality, diag-
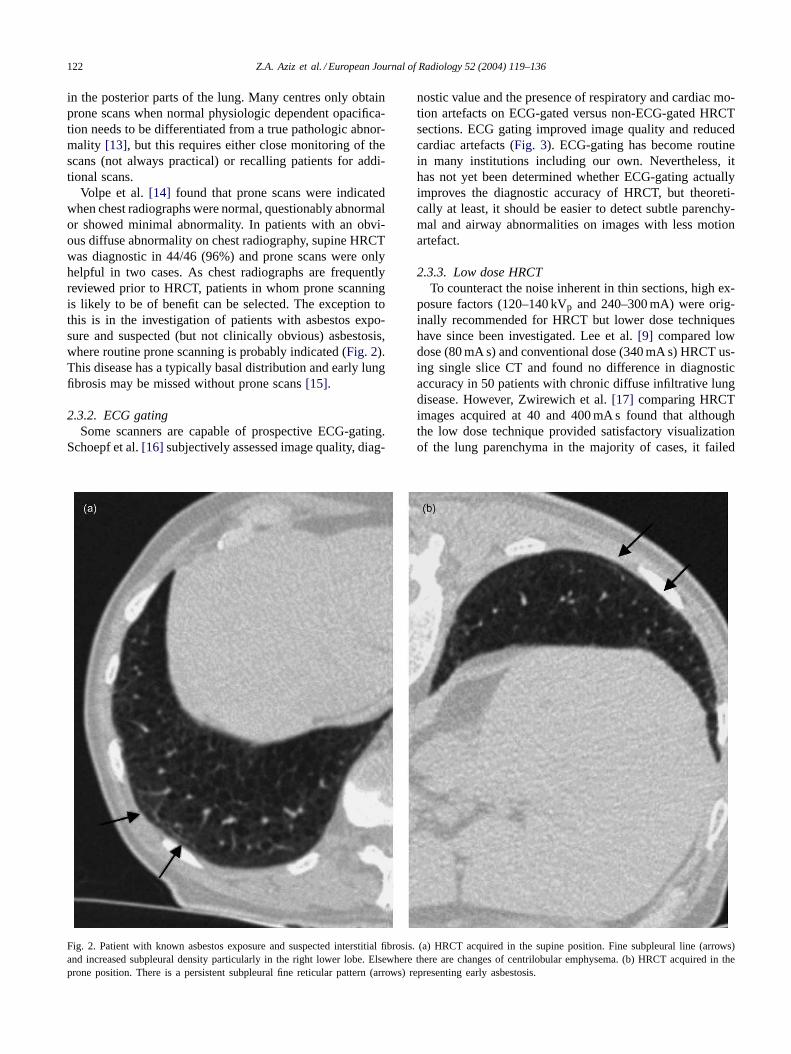
Fig. 2. Patient with known asbestos exposure and suspected interstitial fibrosis. (a) HRCT acquired in the supine position. Fine subpleural line (arrows)and increased subpleural density particularly in the right lower lobe. Elsewhere there are changes of centrilobular emphysema. (b) HRCT acquired intheprone position. There is a persistent subpleural fine reticular pattern (arrows) representing early asbestosis.
nostic value and the presence of respiratory and cardiac mo-tion artefacts on ECG-gated versus non-ECG-gated HRCTsections. ECG gating improved image quality and reducedcardiac artefacts (Fig. 3). ECG-gating has become routinein many institutions including our own. Nevertheless, ithas not yet been determined whether ECG-gating actuallyimproves the diagnostic accuracy of HRCT, but theoreti-cally at least, it should be easier to detect subtle parenchy-mal and airway abnormalities on images with less motionartefact.
2.3.3. Low dose HRCTTo counteract the noise inherent in thin sections, high ex-
posure factors (120–140 kVp and 240–300 mA) were orig-inally recommended for HRCT but lower dose techniqueshave since been investigated. Lee et al.[9] compared lowdose (80 mA s) and conventional dose (340 mA s) HRCT us-ing single slice CT and found no difference in diagnosticaccuracy in 50 patients with chronic diffuse infiltrative lungdisease. However, Zwirewich et al.[17] comparing HRCTimages acquired at 40 and 400 mA s found that althoughthe low dose technique provided satisfactory visualizationof the lung parenchyma in the majority of cases, it failed

Z.A. Aziz et al. / European Journal of Radiology 52 (2004) 119–136 123
Fig. 3. The effects of ECG-gating on HRCT image quality. (a) Non-ECG-gated and (b) ECG-gated thin-section HRCT in a 72-year-old man. The absenceof ECG-gating may cause cardiac motion to distort pulmonary vessels in the lingula. The adjacent transradiancy (arrow) may be misinterpreted as abronchiectatic airway[16]. The non-ECG gated image also has a blurred left ventricular border.
in some cases to demonstrate subtle ground glass opacity(20%) and emphysema (11%). A compromise might be touse 80–90 mA s for the initial HRCT and to use the lowerdose (40–50 mA s) for subsequent follow up.
The mA s used in high-resolution protocols with MSCTvaries with reported values ranging from 70[12] to 140 mA s[2]. At our institution, 90 mA s is used and this is reduced tobetween 50 and 70 mA s in our low dose protocol for youngfemale patients (Fig. 4).
It has been established that increasing pitch propor-tionately reduces patient radiation dose on a single sliceCT if all other parameters are kept constant, though thisrelationship does not apply to all multislice systems. Ma-hesh et al.[1] showed that on a Somatom Plus 4 VolumeZoom scanner (Siemens, Erlanger, Germany) the mea-sured radiation dose was identical for all pitch selections.This CT system automatically produces a proportionateincrease in tube current when the pitch selection is in-creased, presumably to maintain a similar level of noise.Caution should be exercised when extrapolating dosereduction strategies from single slice to multislice CTsystems.
2.3.4. Maximum intensity projectionsOne of the early reported limitations of HRCT for the
assessment of diffuse infiltrative lung disease was theperception that micronodules were more reliably distin-guished from blood vessels on standard collimation sections[6,18], although the problem of making this distinction hasprobably been overstated in the past. Maximum intensityprojection (MaxIP) images have been advocated as an ad-ditional tool in the evaluation of diffuse infiltrative lungdiseases. Remy-Jardin et al.[19] compared conventionalCT (1 mm and 8 mm collimation) with MaxIP images(sliding slabs of 3, 5 and 8 mm thickness generated fromvolumetric CT performed at the level of the region of in-terest (ROI)) in patients with a suspicion of micronodularinfiltration. MIP images showed micronodular disease in-volving less than 25% of the lung when conventional CTwas inconclusive and better defined the profusion and dis-tribution of micronodules when they were identified onconventional images. However, in patients with normal 1and 8 mm images, sliding-thin-slab MIPs did not reveal ad-ditional lung abnormalities. Bhalla et al.[20] used MaxIPreconstruction in 20 patients with known diffuse lung dis-

124 Z.A. Aziz et al. / European Journal of Radiology 52 (2004) 119–136
Fig. 4. HRCT of patient being evaluated for suspected interstitial lung disease. (a) HRCT image obtained with 90 mA s demonstrating posterior emphysemaand subtle areas of ground glass (arrowhead) in the right upper lobe anteriorly. (b) HRCT image obtained with 40 mA s show no appreciable change indiagnostic quality, but there is an almost imperceptible increase in image noise.

Z.A. Aziz et al. / European Journal of Radiology 52 (2004) 119–136 125
ease and found two main advantages over thin-section CT:more precise identification of nodules and more accuratecharacterization of nodule distribution (perivascular versuscentrilobular).
3. Staging of lung cancer
3.1. Recommendations
Technique [reference] kV/mA s Detectorcollimation(mm)
Sectionthickness(mm)
Reconstructioninterval (mm)
Pitch IV contrast
MSCTa (protocol atour institution)
120/90 (chest)120/165 (abdo)
4 × 2.5 3 and 5 3 and 5 1.5 90 mls 240 mg/ml3 mls/s
SSCT[21–23] 140/140–200 5 or 10 5 or 10 1.6 or 1 See discussion
Patz et al.[21], ATS/ERS guidelines[22], Zeman et al.[23].a Somatom Volume Zoom; Siemens Erlangen, Germany.
3.2. Discussion
Computed Tomography is the standard imaging modalityused to stage lung cancer, but a survey of 520 radiologydepartments in the U.S. revealed that there is no consis-tency in the CT protocol used, and the optimal and mostcost effective imaging parameters have yet to be established[24]. Opinion remains divided over the use of intravenous(IV) contrast in this situation. Recent guidelines publishedby Silvestri et al. suggest that IV contrast is unnecessaryfor staging chest CT scans[25]. It is acknowledged that IVcontrast can be helpful in distinguishing vascular structuresfrom lymph nodes, but the limitations of CT as a tool forstaging the mediastinum are well recognized and in practice,mediastinoscopy and tissue sampling are usually required.There is further support for abandoning the routine use ofIV contrast from a study by Patz et al.[26] who showed thatin only 2/84 patients was there any disagreement in nodalstage between non-enhanced and contrast-enhanced tho-racic CT. Of note, histology from these 2 cases showed thatcontrast-enhanced CT understaged 1case and overstaged theother.
The ATS/ERS statement[22] on the pre-treatment eval-uation of non-small-cell lung cancer recommends contrastonly for central tumours with probable mediastinal invasion,or if there is difficulty differentiating mediastinal vessels
Technique [ref.] kV/mAs Detector collimation(mm)
Sectionthickness (mm)
Reconstructioninterval (mm)
Pitch IVcontrast
MSCTa [36] 120–140/20–60 4× 1 or 4× 2.5 1.25–3 1–2.5 1.5–3.75 N/AMSCTb [37] 120/40 4× 3.75 5 3.75 1.5 N/ASSCT[32–34] 120/50–80 3–7 2.5–5 2
Aberle et al.[36], Swensen et al.[37], Henschke et al.[32], Kaneko[33], Diedrich et al.[34].a Not specified.b LightSpeed Model QX/I; GE Medical Systems, Milwaukee, WI.
from enlarged lymph nodes. In practice, it appears that in-travenous contrast is widely used in CT lung cancer exam-inations (86% of the respondents in the survey by Chen etal) [24]. It is anticipated that multislice CT using protocolswith a detector collimation of 1 or 1.25 mm will substan-tially improve the evaluation of chest wall and mediastinalinvasion although this has yet to be quantified in terms ofsensitivity and specificity[27].
Despite some evidence to suggest that a routine searchfor extrathoracic metastases may not be necessary inasymptomatic patients with stage I or II disease[28,25],contrast enhanced scanning of the adrenals, liver and brainis commonly performed[24]. A typical protocol is to scanthe thorax with intravenous contrast using 5 mm-sectioncollimation, acquiring the images after a 25 s delay; the ac-quisition of abdominal images is started at 60 s for optimalliver enhancement. Unfortunately this phase of enhance-ment does not allow distinction between adrenal metastasesand adenomas, and patients in whom adrenal masses arefound will need either delayed contrast enhanced CT[29],MRI [30] or FDG-PET[31] for further characterisation.
4. Low dose screening for NSCLC
Investigators have recently used low dose computed tomo-graphy for screening asymptomatic high-risk individuals forlung cancer. Authors of these studies[32,33–35]have sug-gested that screening with CT can depict lung cancers thatare of a smaller size (<2 cm in diameter) and earlier stage(85–93% at stage I) than those observed at chest radiogra-phy. Protocols used in some of the larger lung cancer screen-ing trials and those recommended in a consensus statementof the Society of Thoracic Radiology are outlined below.

126 Z.A. Aziz et al. / European Journal of Radiology 52 (2004) 119–136
4.1. Recommendations
4.2. Discussion
Itoh et al.[38] have shown that images obtained at an ef-fective tube current of 20 mA s are of equal diagnostic util-ity to those obtained at 50 mA s for the detection of 6mmsimulated nodules. Schoepf et al.[39] recommend a proto-col that comprises acquisition of the entire chest using 1 mmcollimation (MSCT) at 120 kVp and 10–40 mA s depend-ing on the body type of the screened individual. At a tubecurrent of 10 mA s, the effective radiation dose is 0.27 mSvwhich is approximately equivalent to two conventional chestradiographs. These studies have encouraged the acceptance
Technique [ref.] kV/mA s Detectorcollimation(mm)
SectionThickness(mm)
Reconstructioninterval (mm)
Pitch IV contrast
MSCTa [42] 120/120 4× 1 1.25 1 1.5 120 mls, 300 mg/ml, 5 mls/sMSCTb [43] Not given 4× 2.5 3 2.5 1.5 70 mls, 320 mg/ml, 3.5 mls/sSSCT[44,45] 140/200 2 2 2 120 mls. 240 mg/ml, 4-5 mls/s
Schoepf et al.[42], Raptopoulos et al.[43], Remy-Jardin et al.[44], Kuzo et al.[45].a Somatom Volume Zoom; Siemens Medical Solutions, Forcheim, Germany.b LightSpeed; GE Medical Systems, Milwaukee, WI.
of low dose CT as a screening tool. For most screening cheststudies, the 1 mm images can be fused into 5–10 mm max-imal intensity projections to limit the number of individualaxial images that need to be interrogated. If detailed scrutinyof a lung nodule is required, 1 mm sections may be used[39].
The possibility that lung cancers may be missed by lowdose CT has recently been raised by Li et al.[40] who com-pared the clinical, histopathological and imaging features oflung cancers missed at CT screening in a general popula-tion (which included non-smokers and women). Of 83 pri-mary lung cancers (histopathologically confirmed) that werefound during an annual low dose screening program, 32 hadpreviously been missed on 39 CT scans. In 23 cases, this wasdue to detection error and in 16, due to interpretative error.In the detection error group, lesions were most frequentlymissed in non-smoking women, and nearly all these lesionswere well-differentiated adenocarcinomas. Of the 23 cancersmissed owing to detection error, the lesions generally ap-peared as faint nodules of ground glass density (91%). Mostof these (83%) lesions were closely related to normal struc-tures and were considered to be pulmonary vessels, or wereobscured by adjacent hilar structures. Cancers missed ow-ing to interpretative error either mimicked benign disease orwere present against a background of other lung disease (forexample emphysema, tuberculosis and lung fibrosis). Whileradiologists can be made aware of these potential pitfalls, ul-timately, the interpretation made by human observers is lim-ited by the information conveyed on the images. Attempts
have been made to develop automated computerized systemsto improve detection of lung nodules. Armato et al.[41] haveshown that with an automated lung nodule detection method,32 of 38 (84%) missed cancers in a database of low dose CTscans were subsequently correctly detected. An understand-ing of the radiological and histopathological characteristicsof missed cancers and the incorporation of computerized de-tection methods has the potential to reduce the number oflung cancers missed by radiologists on CT images.
5. Suspected pulmonary embolism
5.1. Recommendations
5.2. Contrast-enhancement protocol
Options for scan delay:
1. Automated triggering – preset threshold in region of in-terest centred on pulmonary artery.
2. Test bolus of contrast and evaluation of resultingtime-density curve.
3. Operator-selected “best guess” delay (usually 10–20 s).
Between 120 and 140 mls of 24–30% contrast is gen-erally used and this is injected at a rate of 3–5 mls/s.The use of higher concentrations of contrast can resultin streak artefacts originating from the superior venacava, which can degrade image quality in the adjacentright pulmonary artery. Most scanners come equippedwith programs that allow continuous monitoring of theattenuation within a region of interest. When a set levelof contrast enhancement (increase in attenuation of usu-ally >100 HU) is reached within the pulmonary artery,the diagnostic scan is automatically initiated. There havebeen proponents of determining the scan delay in eachindividual patient by using a test bolus of contrast anda time-density curve,[45] but this is at the cost of in-creased radiation dose and contrast. In a study comparingimage quality (subjective assessment) of images obtainedby individual contrast timing with a fixed scan delay of20 s, no important differences were observed[46]. Recentstudies have used a fixed delay ranging from 12 to 20 s[42,47]. Review of the literature suggests that standard

Z.A. Aziz et al. / European Journal of Radiology 52 (2004) 119–136 127
settings (window width 350–500 HU and window centre50–80 HU) are most frequently employed in CT pulmonaryangiogram studies, although the use of wider window set-tings (600–700 HU) is useful in identifying smaller embolithat may be obscured by high-density contrast material(Fig. 5).
5.3. Discussion
CT pulmonary angiography (CTPA) is now an estab-lished technique for investigating patients with suspectedpulmonary embolism and its accuracy has steadily improvedas advances have been made in CT technology. Initiallyperformed with 5 mm collimation[48,49], CTPA providedaccurate evaluation of central pulmonary arteries, but thedetection of smaller filling defects was limited because ofthe effect of partial volume on small-sized vessels. A size-able proportion (at least 10%) of segmental vessels are notadequately demonstrated with 5 mm collimation[50].
Subsecond gantry rotation was a significant breakthroughwhich enabled longerz-axis coverage for an exposure ofequivalent duration, and more relevant to CTPA, an equiva-lentz-axis coverage with thinner (2–3 mm) collimation. Theuse of thinner collimation resulted in marked improvementin the demonstration of the segmental and subsegmentalarteries, but limitations remained with respect to the smallersubsegmental arteries even with 2 mm collimation[44].This inability to depict subsegmental clot has been a sourceof controversy, despite uncertainty over the clinical signif-icance of small peripheral emboli. The significance of themissed small PE and the problem of whether patients witha negative CTPA can be safely left without long-term anti-coagulation has been intensely investigated. Several recentstudies[51–53] have looked at the frequency of venousthromboembolic episodes in a three month period subse-quent to a negative CTPA and concluded that patients witha clinical suspicion of acute PE, stable vital signs and anegative CTPA could be safely left untreated. Of note, be-tween 3 and 5 mm collimation was used in the studies. Thevalue of a negative CTPA has, however, not been evaluatedexclusively in patients with poor cardiopulmonary reservewhere a small additional PE may be fatal. As long as theaccuracy of CT for the detection of peripheral emboli isquestioned, efforts to improve the quality of CT pulmonaryangiography are likely to continue.
Several investigators have evaluated multislice CT[42,43,47]. The use of 1 mm detector collimation (1.25section width) allows an increase in the rate of detection ofsubsegmental emboli and the shorter duration of data ac-quisition with MSCT results in optimal image quality evenwith a dyspnoeic patient.
Meticulous technique is needed in CTPA as the possibilityof producing suboptimal or entirely non-diagnostic studies isvery real. Particular attention should be paid to concentrationof contrast, rate of injection, collimation and selection ofthe scan delay. When arterial opacification of part of the
Fig. 5. CTPA of a 45-year-old woman with symptoms suggestive of pul-monary embolism. (a) Representative image (1.25 mm section thickness)viewed at window width 400 HU and level 40 HU showing possible fillingdefects within segmental arteries of the left upper lobe (arrowheads). (b)Image viewed at window width 1000 HU and level 100 HU as describedby Brink et al.[99]. The filling defects are better appreciated with a widerwindow setting.

128 Z.A. Aziz et al. / European Journal of Radiology 52 (2004) 119–136
pulmonary arterial tree is suboptimal, a second acquisitionwith more limited anatomical coverage can be undertakenafter modification of the start delay.
5.4. Technique refinements
5.4.1. Multiplanar reconstructionsMultiplanar and curved mutilplanar (MPR and CMPR)
are two-dimensional (2D) techniques that provide alter-
Technique [ref.] kV/mA s Detectorcollimation (mm)
SectionThickness (mm)
Reconstructioninterval (mm)
Pitch IVcontrast
MSCTa (see discussion)[57] 120/80 4× 2.5 3 3 1.75 N/ASSCT[58–60] 140/140–200 1 10 N/A N/A
Remy-Jardin et al.[57], Hansell et al.[58], Grenier et al.[59], Kang et al.[60].a Somatom Volume Zoom unit; Siemens, Forcheim, Germany.
nate viewing perspectives usually with conventional windowsettings. Remy-Jardin et al.[54] demonstrated that combin-ing both transverse and 2D reformatted images improvedthe accuracy of CT in depicting pulmonary embolism. Themain indications for multiplanar 2D reformatted images areinterpretative difficulties on transverse CT sections eitherdue to partial volume averaging or the inability to differen-tiate periarterial form endoluminal abnormalities.
5.4.2. “Paddle-wheel display”Simon et al.[55] have recently described a novel method
of reconstructing images from an axial data set (acquiredwith MSCT using 2.5 mm collimation with a 1.25 mmreconstruction interval) called a “paddle-wheel” displaywhich may be used to evaluate the pulmonary arteries.Each planar slab (of 5 mm thickness) passes through acentral horizontal axis between the two lungs and hila andconsequently, the large hilar structures of interest appearon every image. Unlike the standard sagittal and coronalreconstructions that display only short segments of vesselsand airways, the paddle-wheel reformations display branch-ing structures in continuity from hilum to pleura. In a studyby Chiang et al, the 5 mm paddle-wheel images had similardetection rates of pulmonary embolism when compared toconventional 2.5 mm axial images[56]. Importantly, thepaddle-wheel technique reduces the number of images forreview compared with standard axial images. Other advan-tages are an increase in reader confidence (vascular conti-nuity is demonstrated to a greater degree) and a more ac-curate assessment of clot burden (the paddle-wheel imagesoften display the craniocaudad extent of clot on a singleimage). Large-scale studies comparing the paddle-wheeldisplay method with more traditional imaging methods inthe evaluation of pulmonary embolism are awaited. Cur-rently, the authors suggest that the paddle-wheel methodis used as a complement to, rather than a replacementfor axial images in the diagnosis of pulmonary embolism[56].
6. Imaging of the patient with obstructive airwaysdisease
6.1. Bronchiectasis
6.1.1. Recommendations
6.2. Discussion
The standard HRCT protocol (1–1.5 mm) collimation at10 mm intervals in a supine position) has, over the yearsproved reliable (sensitivity of 96% and specificity of 93%using bronchography as the reference standard) for the diag-nosis of bronchiectasis, with satisfactory interobserver vari-ation [61]. Although there is no single optimal windowfor the depiction of abnormalities of the bronchi and lungparenchyma, most studies use a level of−500 to−700 HUwith a window width of 1000–1500 HU[59,60]. A windowwidth less than a 1000 HU causes a spurious appearance ofbronchial wall thickening[62].
Lack of tapering of the bronchial lumen has been sug-gested as the most reliable sign of cylindrical bronchiecta-sis [60], but this is difficult to perceive for vertically ori-entated bronchi on interspaced trans-axial thin-section CT.Several reports have suggested a role for volumetric dataacquisition in the investigation of suspected bronchiectasis[63,64]. Lucidarme et al.[63] compared HRCT (1.5 mmsections at 10 mm intervals) with helical CT using 3 mmcollimation, pitch of 1.6 and 2 mm reconstruction inter-vals. Perhaps unsurprisingly, the number of patients andsegments considered to be affected by bronchiectasis werehigher on the volumetrically acquired examination. Addi-tionally, interobserver agreement was better with volumet-ric scans for the identification of segments that were pos-itive for bronchiectasis, the extent of bronchiectasis in agiven lobe and the distribution of disease in a given seg-ment. However, the increased radiation dose required forvolumetric acquisitions has so far prevented it from re-placing conventional HRCT for the diagnosis of bronch-iectasis.
The role of MSCT in the diagnosis of bronchiectasis hasrecently been evaluated. Remy-Jardin et al.[57] demon-strated comparable accuracy of 3 and 1.25 mm images (re-constructed from a volumetric data set acquired with 1 mmdetector collimation) in the detection and characterizationof bronchiectasis. These results suggest a potential useful-

Z.A. Aziz et al. / European Journal of Radiology 52 (2004) 119–136 129
ness of 3 mm thick images generated from 4 mm× 2.5 mmacquisitions in the screening of bronchiectasis. This wouldallow a 20% reduction in radiation dose compared to4 mm× 1 mm acquisitions. However not unexpectedly, the3 mm images led to underrecognition of mild cylindricalbronchiectasis at the subsegmental level and consequentlythe authors recommend this section thickness for screeningand the follow-up of bronchiectasis, with high-resolutionCT remaining the imaging standard of reference prior tosurgery for bronchiectasis.
7. Imaging of the patient with suspected small airwaysdisease
7.1. Recommendations
There have been no studies evaluating MSCT in suspectedsmall airways disease. The protocol used at our institutionis outlined below.
Technique [ref.] kV/mA s Detectorcollimation (mm)
Section thickness(mm)
Reconstructioninterval (mm)
Pitch IVcontrast
MSCTa (protocol at ourinstitution)
120/90 2× 0.5 1 10 N/A
SSCT[65,66] 120–140/200–350 1 10 N/A
Hansell et al.[65], Stern et al.[66].a Somatom Volume Zoom unit (Siemens, Forcheim, Germany).
7.2. Discussion
HRCT is currently regarded as the imaging method ofchoice for the detection of small airways disease. Stan-dard HRCT technique is satisfactory for demonstratingconstrictive bronchiolitis and diffuse panbronchiolitis. Theformer requires attention to appropriate contrast resolu-tion to demonstrate sometimes subtle regional attenuationdifferences caused by air-trapping (mosaic attenuation pat-tern) The latter is more dependent on adequate spatialresolution to depict the small branching structures thatcharacterise panbronchiolitis (tree-in-bud pattern)[67]. Asuggested HRCT protocol is 1–1.5 mm collimation sec-tions every 10 mm from apices to costophrenic angleswith the patient breath-holding at full inspiration[68,69].Care should be exercised when choosing window widthsas minor differences in lung attenuation may only bevisible when narrow (<1000) window widths are used[66].
7.3. Technique refinements
7.3.1. Expiratory scans: end-expiratoryThe necessity of expiratory CT sections is somewhat con-
troversial. The regional inhomogeneity of the lung densityis accentuated and small or subtle areas of air-trapping maybe revealed on CT performed at end-expiration[70,71].
Expiratory CT may be helpful in differentiating betweenthe three main causes of a mosaic pattern (infiltrative lungdisease, small airways disease and occlusive pulmonaryvascular disease) which may be problematic on inspiratoryCT ([72,73]. However, a recent study by Arakawa et al.[74] has shown that air-trapping is common (seen in 60%)on expiratory scans in acute pulmonary embolism, high-lighting the fact that expiratory air-trapping may not beas discriminatory as previously thought in distinguishingbetween a mosaic pattern caused by small airways diseaseversus occlusive vascular disease.
Although regional inhomogeneity is accentuated on ex-piratory images and occasionally may reveal the presenceof air-trapping not suspected on the inspiratory images,in most patients with clinically significant small airwaysdisease inhomogeneity is readily apparent on inspiratoryimages.
The use of expiratory scans for the detection of con-strictive bronchiolitis following lung transplantation is also
controversial with conflicting results from several studies[75–77]. In a study by Leung et al.[75], air-trapping on ex-piratory CT was the most sensitive sign (sensitivity 91%) ofconstrictive bronchiolitis in 11 patients with transbronchialbiopsy confirmation. In a recent prospective study that in-cluded 111 expiratory scans in 38 heart–lung transplantrecipients, the presence of air-trapping occupying morethan 32% of lung parenchyma had a sensitivity of 83%and a specificity of 89% for the diagnosis of bronchiolitissyndrome (BOS), and in some patients this preceded thespirometric criteria for BOS[77]. However, Lee et al.[76]have questioned the sensitivity and specificity of expira-tory CT. In their study, the air-trapping score in patientswith biopsy proven bronchiolitis obliterans was not signif-icantly different to biopsy-negative patients with air-flowlimitation.
Nevertheless, expiratory thin-section CT may depictair-trapping in some patients with constrictive bronchioli-tis who have false-negative transbronchial biopsy resultsowing to the patchy distribution of this disease; further-more expiratory scans obtained prior to biopsy may allowthe biopsy to be targeted to the most abnormal lung re-gions. It is likely that expiratory CT will at least for nowcontinue to play a role in the evaluation of complicationsrelated to, and the surveillance of, graft function in lungtransplants.

130 Z.A. Aziz et al. / European Journal of Radiology 52 (2004) 119–136
7.3.2. Dynamic expiratory computed tomographyDynamic studies where sections are obtained in rapid
succession at a given level during forced expiration mayimprove the conspicuity and apparent extent of air-trapping[78]. A recent study that compared low dose (40 mA)dynamic expiratory CT with the more conventional end-expiratory CT technique demonstrated that the densitychanges were significantly greater with the dynamic tech-nique [79]. The authors routinely use dynamic expiratorylow dose thin-section CT in evaluating lung transplant pa-tients in conjunction with scans obtained at full inspiration.Each dynamic sequence (acquired at the level of the arch,carina and 2 cm above the right hemidiaphragm) is obtainedas a 6 s cine-acquisition without table incrementation, andreconstructed at 1 s intervals. Window level/width settingsof −700/1000 HU are recommended.
7.3.3. Minimum intensity projections (MinIP)The contrast differences between normal and low atten-
uation lung parenchyma in patients with constrictive oblit-erative bronchiolitis may be extremely subtle on inspiratoryHRCT images and image processing techniques such as min-imum intensity projections (MinIPs) can improve the con-spicuity of subtle changes in density of the lung parenchyma[80,20]. In a study by Fotheringham et al.[80], MinIP im-ages showed good correlation with pulmonary function testsand had the lowest observer variation when compared withinspiratory and expiratory images. The acquisition of thincontiguous images (1–1.5 mm) is a pre-requisite for pro-ducing MinIP images and for centres without MSCT, thedata set can be acquired through areas thought to be inde-terminate on the initial HRCT examination[20]. Windowsettings for the interpretation of MinIP slabs have not beenstandardized; window widths of 350–500 HU and a win-dow level of−750 to−900 HU have been used in previousstudies.
8. Focal pulmonary disease
The investigation of the solitary pulmonary nodule willnot be reviewed in any detail given the comprehensive re-views which address this subject[81,82].
8.1. Recommendations
Technique [ref.] kV/mA s Detectorcollimation(mm)
Sectionthickness(mm)
Reconstructioninterval (mm)
Pitch IVcontrast
MSCTa (protocol atour institution)
120–140/90–120 4× 2.5 3 or 5 3 or 5 1.5 Dependant on nature ofsuspected abnormality
SSCT[83] 140/140–280 5 or 7–8 5 or 7–8 1.6 or 1.5 As above
Leung et al.[83].a Somatom Volume Zoom unit (Siemens, Erlangen, Germany).
8.2. Discussion
The type of CT protocol employed to investigate a sus-pected focal pulmonary radiographic abnormality dependsto some extent on the nature of the abnormality and the clin-ical setting. In most cases, the entire lung is usually imaged,with or without intravenous contrast, to exclude other lungabnormalities and to assess the hilar and mediastinal struc-tures[84].
Variables such as section thickness, table speed andthe reconstruction interval should be tailored to the in-dividual case, and with single slice CT, if review of theexamination demonstrates pathology requiring further char-acterization then a limited volumetric acquisition throughthe area of interest may be acquired with thin-section(1 mm) collimation[83]. With multislice computed tomog-raphy contiguous 5 mm sections are usually adequate fora “general lung CT examination”, and if the images areacquired using 2.5 mm collimation, then retrospective re-constructions at 3 mm can be viewed for further charac-terization.
The frequency with which CT is now used to further evalu-ate a suspected focal abnormality seen on a chest radiographhas prompted efforts to investigate low dose techniques.Takahashi et al.[85] using low dose (50 mA) CT demon-strated diminished low-contrast resolution and increasednoise levels when compared with standard dose (250 mA)CT, but focal pulmonary abnormalities were visualizedequally well with the low dose technique, apart from subtleground glass opacity. There was no difference for the detec-tion mediastinal abnormalities, although only a few caseswere included in this study. Wildberger et al.[86] using aMSCT (Somatom Volume Zoom; Siemens, Forchheim, Ger-many) have derived a mathematical relationship between X-ray attenuation and patient weight. They found that adapta-tion of the mA s based on the (body weight of a patient (kg),– 10), produced an examination with image quality compa-rable to the standard dose (120 mA s), the latter being themanufacturer’s recommendation. Such a manoeuvre resultedin approximately a 45% reduction in radiation dose. In theface of existing evidence, it is surprising that more centreshave not adopted such a simple radiation reducing strategy.

Z.A. Aziz et al. / European Journal of Radiology 52 (2004) 119–136 131
9. Imaging of patient with central airway abnormalities
9.1. Recommendations
Technique [ref.] kV/mA s Detectorcollimation(mm)
Sectionthickness(mm)
ReconstructionInterval (mm)
Pitch IVcontrast
MSCTa [87] Not specified 4× 2.5 3 1.25 1.5 N/AMSCTb [88] 140/100 4× 1 (2.5 mm detectors may
be selected for faster coverageand less noisy images)
1.25 1 1.5 N/A
SSCT[89–91] 120–140/140–280 2–3 30–50%overlap index
1.5–2 N/A
Boiselle et al.[87], Lawler et al.[88], Naidich et al.[89], Ferretti et al.[90], Grenier et al.[91].a Light Speed QX/I; General Electric Medical Systems, Milwaukee, WI.b Siemens Plus 4 Volume Zoom (Siemens Medical Systems, Iselin, NJ).
9.2. Discussion
The high quality volume data sets that can be rapidlyacquired with current multislice CT coupled with the latestadvances in volume rendering software has made routinethree-dimensional airway imaging a reality. Although axialimaging currently remains the standard for evaluating thecentral airways, several limitations are associated with axialimages: difficulty in detecting subtle airway stenoses, under-estimation of the craniocaudal extent of disease, difficultydisplaying the complex 3D relationships of the airways andinadequate representation of the airways that are orientedobliquely to the axial plane[89,92–94]. Two-dimensionalmultiplanar and three-dimensional reconstruction imageshave the potential to facilitate the assessment of a widevariety of airway diseases[87] (Fig. 6).
9.2.1. Multiplanar reconstructionsQuint et al.[95] evaluated CT images from 27 patients
following lung transplantation using 3 mm collimation, pitchof 1, and a 1.5 mm reconstruction interval and found ax-ial images were 91% accurate in the detection of bronchialstenoses. By comparison, viewing the axial images with mul-tiplanar reconstructions (sagittal and coronal) improved ac-curacy, albeit marginally to 94%. However, observers foundit easier to visualize mild stenoses (<25% narrowing) onthe multiplanar images; reflecting the perceptual difficultyof accurately assessing luminal calibre on sequential axialimages (Fig. 7). Multiplanar reconstructions also depict thelengths of stenotic segments more clearly due to the orien-tation of these images along the long axis of the airway.
9.2.2. Surface shaded displayThree-dimensional surface shaded display (3D SSD) has
also been used as a additional technique to identify bronchialstenoses. This technique displays a subset of the volumet-ric data by including voxels in a range of attenuation valuesto determine surfaces. A large amount of data is lost in the
final reconstruction, limiting the overall utility of the tech-nique. Kauczor et al.[96] assessed the benefits of using 3DSSD compared with bronchoscopy in patients with suspected
stenoses. Advantages of 3D SSD images included the moreaccurate evaluation of both the presence and the length ofcentral stenoses as well as depicting the spatial orientation,branching angles and patency of distal air-filled bronchi;features not accessible bronchoscopically. However, two outof three segmental stenoses were missed using 3D SSD, aproblem not usually encountered with the simpler multipla-nar reconstruction technique.
9.2.3. Volume renderingImprovements in the computational speed of computers
have led to the replacement of shaded surface display rendi-tions with 3D-volume rendering. Volume rendering convertsthe volume of information acquired by MSCT into a sim-ulated three-dimensional form that surpasses the previoustechnique of surface-shaded display which is limited bythreshold voxel selection. The volume-rendered 3D imageis the computed sum of voxels along a ray projected throughthe data set in a specific orientation thus using all the MSCTdata to form the final image. The volume rendering tech-nique assigns a continuous range of values to a voxel allow-ing the percentage of different tissue types to be reflected inthe final image while maintaining three-dimensional spatialrelationships. Remy-Jardin et al.[93] compared overlappingaxial CT images with volume-rendered bronchographic im-ages for the detection of airway abnormalities and identifica-tion of lesion morphology. Findings on the volume-renderedimages were concordant but added no complementary valueto those on the transverse CT images in half of the cases.However, volume-rendered images provided supplementalinformation in a third and could correct potential inter-pretative errors from viewing only transverse CT imagesin 5%.
The most recent technique to be applied to airway imagingis ‘virtual bronchoscopy’. These images are obtained usingvolume rendering techniques that allow internal renderingof the tracheo-bronchial tree producing appearance similarto that seen by a bronchoscopist (Fig. 8). Despite these ex-

132 Z.A. Aziz et al. / European Journal of Radiology 52 (2004) 119–136
Fig. 6. A 22-year-old patient being evaluated for stridor post-tracheostomy.(a) Axial and (b) 2D coronal reformation. The narrowing of the subglottictrachea is seen on the axial image. The coronal reformatted image enablesthe longitudinal extent and severity of the stenosis to be appreciated moreeasily on a single section.
Fig. 7. A 54-year-old woman with a tracheal carcinoid tumour. Axial CT(a) and virtual bronchoscopy simulation (b) demonstrate a lobulated softtissue mass protruding into the lumen of the distal trachea just above thelevel of the carina. The VB image more clearly shows the mass extendinginto and narrowing the left main bronchus.
citing possibilities, virtual bronchoscopy remains just that,and despite software advances, the technique has not foundwidespread acceptance in airway imaging. Studies using thistechnique have revealed several limitations. Summers et al.[97] used virtual bronchoscopy to assess 14 patients witha variety of airway abnormalities. They found that overall,90% of segmental bronchi that were measurable at CT couldbe measured at VB. However, of the total bronchi expectedto be visible, only 82% could be evaluated at VB and only76% of segmental bronchi were demonstrated compared

Z.A. Aziz et al. / European Journal of Radiology 52 (2004) 119–136 133
Fig. 8. A 60-year-old woman with an undifferentiated small cell tumour.Axial CT (a) shows abnormal soft tissue surrounding and narrowing thebronchus intermedius (arrowhead). Craniocaudal extent and severity ofstenosis can be underestimated on axial CT images and these features arebetter appreciated with a volume-rendered reconstruction (b).
with 91 and 85% respectively for multiplanar CT images.Axial CT and the ‘virtual’ images were of similar accuracyin estimating the maximal luminal diameter and cross-sectional area of the central airways. These authors used3 mm sections, pitch of 2, a field of view of 26 cm or lessand 1 mm-reconstruction intervals. Virtual bronchoscopydemonstrates stenoses of the central airways (proved withfibreoptic bronchoscopy) in most cases[90,98], but in theformer study[90], all the stenoses demonstrated by VBwere also shown on the axial CT images. In addition, eval-uation of the length of the stenoses and surrounding tissuesrequired simultaneous display of multiplanar reformations.
Naidich et al.[89] have suggested that endoluminal imag-ing may be of potential benefit in the follow up of patientswith known malignant airway obstruction after laser or radi-ation therapy and in cases in which axial images are incon-clusive regarding the presence or absence of endobronchialdisease. However, this is a very specific and limited appli-cation of the technique.
The use of airway stents for benign and malignant stenoticdisease provides another potential, but limited use for vol-ume rendering techniques. As stents require frequent follow-up, 3DCT of the airway offers an easier way to monitor casesuntil adjustment requires direct intervention[88]. From aclinical perspective it is fair to say that for many lesions3DCT does not have a greater sensitivity than conventionalaxial images, but it does confer advantage in describing spa-tial relationships of airway disease and importantly, com-municating this to the clinicians[89].
10. Conclusion
There have been exciting advances in thoracic CT imag-ing, and while this has undoubtedly produced a prolifera-tion of new protocols, these protocols should be validatedagainst established ones. Ultimately, the ‘best’ protocol isone that makes a measurable difference to patient outcomeby providing the most clinically relevant information at thelowest possible dose.
The large number of images generated by multislice CTis a major issue for workstation performance, film displayand PACS archiving and ideally all images need to be re-viewed in a cine-paging format at a workstation for diagnos-tic purposes. The hundreds of thin sections acquired usingMSCT are incompatible with traditional viewing practice;thus MSCT may in the next few years force a rapid transi-tion from two-dimensional to volumetric imaging. Althoughtwo-dimensional axial interpretation will remain fundamen-tal in practice for some time, the concept of both volumeacquisition and interpretation will undoubtedly play an in-creasing role.
References
[1] Mahesh M, Scatarige JC, Cooper J, Fishman EK. Dose and pitchrelationship for a particular multislice CT scanner. Am J Roentgenol2001;177(6):1273–5.
[2] Schoepf UJ, Bruening RD, Hong C, et al. Multislice helical CTof focal and diffuse lung disease: comprehensive diagnosis withreconstruction of contiguous and high-resolution CT sections froma single thin-collimation scan. Am J Roentgenol 2001;177:179–84.
[3] Mastora I, Remy-Jardin MJ, Masson P, Bonnel F, Remy J. In:Proceedings of the Radiological Society of North America 86thAnnual Meeting (Abstracts Radiology). 26 November–1 December2000, Chicago, IL, USA, Suppl 384, p. 217.
[4] Mayo JR, Webb WR, Gould R, et al. High-resolution CT of thelungs: an optimal approach. Radiology 1987;163:507–10.

134 Z.A. Aziz et al. / European Journal of Radiology 52 (2004) 119–136
[5] Murata K, Khan A, Rojas KA, Herman PG. Optimization of com-puted tomography technique to demonstrate the fine structure of thelung. Invest Radiol 1988;23:170–5.
[6] Mathieson JR, Mayo JR, Staples CA, Muller NL. Chronic diffuseinfiltrative lung disease: comparison of diagnostic accuracy of CTand chest radiography. Radiology 1989;171:111–6.
[7] Padley SPG, Hansell DM, Flower CDR, Jennings P. Comparativeaccuracy of high resolution computed tomography and chest radio-graphy in the diagnosis of chronic diffuse infiltrative lung disease.Clin Radiol 1991;44:227–31.
[8] Grenier P, Valeyre D, Cluzel P, Brauner MW, Lenoir S, ChastangC. Chronic diffuse interstitial lung disease: diagnostic value of chestradiography and high-resolution CT. Radiology 1991;179:123–32.
[9] Lee KS, Primack SL, Staples CA, Mayo JR, Aldrich JE, Muller NL.Chronic infiltrative lung disease: comparison of diagnostic accura-cies of radiography and low- and conventional-dose thin-section CT.Radiology 1994;191(3):669–73.
[10] Leung AN, Staples CA, Muller NL. Chronic diffuse infiltrative lungdisease: comparison of diagnostic accuracy of High-resolution andConventional CT. Am J Roentgenol 1991;157:693–6.
[11] Remy-Jardin M, Campistron P, Amara A, et al. Usefulness of coronalreformations in the diagnostic evaluation of infiltrative lung disease.J Comput Assist Tomogr 2003;27(2):266–73.
[12] Cohnen M, Poll LJ, Puettmann C, Ewen K, Saleh A, Modder U.Effective doses in standard protocols for multi-slice CT scanning.Eur Radiol 2003;13(5):1148–53.
[13] Remy-Jardin M, Remy J, Cortet B, Mauri F, Delcambre B.Lung changes in rheumatoid arthritis: CT findings. Radiology1994;193(2):375–82.
[14] Volpe J, Storto ML, Lee K, Webb WR. High-resolution CT of thelung: determination of the usefulness of CT scans obtained with thepatient prone based on plain radiographic findings. Am J Roentgenol1997;169(2):369–74.
[15] Aberle DR, Gamsu G, Ray CS. High-resolution CT of benignasbestos-related diseases: clinical and radiographic correlation. AmJ Roentgenol 1988;151:883–91.
[16] Schoepf UJ, Becker CR, Bruening RD, et al. Electrocardiographicallygated thin-section CT of the lung. Radiology 1999;212(3):649–54.
[17] Zwirewich CV, Mayo JR, Muller NL. Low dose High ResolutionCT of lung parenchyma. Radiology 1991;180:413–7.
[18] Remy-Jardin M, Degreef JM, Beuscart R, Voisin C, Remy J. Coalworker’s pneumoconiosis: CT assessment in exposed workers andcorrelation with radiographic findings. Radiology 1990;177:363–71.
[19] Remy-Jardin M, Remy J, Gosselin B, Copin MC, Wurtz A, DuhamelA. Sliding thin slab, minimum intensity projection technique in thediagnosis of emphysema: histopathologic-CT correlation. Radiology1996;200(3):665–71.
[20] Bhalla M, Naidich DP, McGuinness G, Gruden JF, LeitmanBS, McCauley DI. Diffuse lung disease: assessment with helicalCT—preliminary observations of the role of maximum and minimumintensity projection images. Radiology 1996;200:341–7.
[21] Patz Jr EF, Erasmus JJ, McAdams HP, et al. Lung cancer stagingand management: comparison of contrast-enhanced and nonenhancedhelical CT of the thorax. Radiology 1999;212(1):56–60.
[22] The American Thoracic Society and The European Respiratory So-ciety. Pretreatment evaluation of non-small-cell lung cancer. Am JRespir Crit Care Med 1997; 156(1):320–32.
[23] Zeman RK, Baron RL, Jeffrey Jr RB, Klein J, Siegel MJ, Silver-man PM. Helical body CT: evolution of scanning protocols. Am JRoentgenol 1998;170:1427–38.
[24] Chen MY, Chiles C, Choplin RH, Aquino SL. Bronchogenic carci-noma: a survey of CT protocols for staging disease. Acad Radiol1997;4(10):687–92.
[25] Silvestri GA, Tanoue LT, Margolis ML, Barker J, Detterbeck F. Thenoninvasive staging of non-small cell lung cancer: the guidelines.Chest 2003;123(1 Suppl):147S–56S.
[26] Patz Jr EF. Imaging bronchogenic carcinoma. Chest 2000;117(4Suppl 1):90S–5S.
[27] Schaefer-Prokop C, Prokop M. New imaging techniques in the treat-ment guidelines for lung cancer. Eur Respir J Suppl 2002;35:71s–83s.
[28] Ichinose Y, Hara N, Ohta M, et al. Preoperative examination to detectdistant metastasis is not advocated for asymptomatic patients withstages 1 and 2 non-small cell lung cancer. Preoperative examinationfor lung cancer. Chest 1989;96(5):1104–9.
[29] Caoili EM, Korobkin M, Francis IR, Cohan RH, Platt JF, DunnickNR, Raghupathi KI. Adrenal masses: characterization with combinedunenhanced and delayed enhanced CT. Radiology 2002;222(3):629–33.
[30] Heinz-Peer G, Honigschnabl S, Schneider B, Niederle B, Kaserer K,Lechner G. Characterization of adrenal masses using MR imagingwith histopathologic correlation. Am J Roentgenol 1999;173(1):15–22.
[31] Yun M, Kim W, Alnafisi N, Lacorte L, Jang S, Alavi A. 18F-FDGPET in characterizing adrenal lesions detected on CT or MRI. J NuclMed 2001;42(12):1795–9.
[32] Henschke CI, McCauley DI, Yankelevitz DF, et al. Early LungCancer Action Project: overall design and findings from baselinescreening. Lancet 1999;354(9173):99–105.
[33] Kaneko M, Eguchi K, Ohmatsu H, et al. Peripheral lung cancer:screening and detection with low-dose spiral CT versus radiography.Radiology 1996;201(3):798–802.
[34] Diederich S, Wormanns D, Lenzen H, Semik M, Thomas M, PetersPE. Screening for asymptomatic early bronchogenic carcinoma withlow dose CT of the chest. Cancer 2000;89(11 Suppl):2483–4.
[35] Sone S, Takashima S, Li F, et al. Mass screening for lungcancer with mobile spiral computed tomography scanner. Lancet1998;351(9111):1242–5.
[36] Aberle DR, Gamsu G, Henschke CI, Naidich DP, Swensen SJ. Aconsensus statement of the Society of Thoracic Radiology: screeningfor lung cancer with helical computed tomography. J Thorac Imaging2001;16:65–8.
[37] Swensen SJ, Jett JR, Sloan JA, et al. Screening for lung cancer withlow-dose spiral computed tomography. Am J Respir Crit Care Med2002;165(4):508–13.
[38] Itoh S, Ikeda M, Arahata S, et al. Lung cancer screening: minimumtube current required for helical CT. Radiology 2000;215(1):175–83.
[39] Schoepf UJ, Becker CR, Obuchowski NA, et al. Multi-slice com-puted tomography as a screening tool for colon cancer. Eur Radiol2001;11(10):1975–85.
[40] Li F, Sone S, Abe H, MacMahon H, Armato III SG, Doi K. Lungcancers missed at low-dose helical CT screening in a general popu-lation: comparison of clinical, histopathologic, and imaging findings.Radiology 2002;225(3):673–83.
[41] Armato III SG, Li F, Giger ML, MacMahon H, Sone S, DoiK. Lung cancer: performance of automated lung nodule detectionapplied to cancers missed in a CT screening program. Radiology2002;225(3):685–92.
[42] Schoepf UJ, Holzknecht N, Helmberger TK, et al. Subsegmentalpulmonary emboli: improved detection with thin-collimation multi-detector row spiral CT. Radiology 2002;222:483–90.
[43] Raptopoulos V, Boiselle PM. Multi-detector row spiral CT pulmonaryangiography: comparison with single-detector row spiral CT. Radi-ology 2001;221:606–13.
[44] Remy-Jardin M, Remy J, Artaud D, Deschildre F, Duhamel A. Pe-ripheral pulmonary arteries: optimization of the spiral CT acquisitionprotocol. Radiology 1997;204(1):157–63.
[45] Kuzo RS, Goodman LR. CT evaluation of pulmonary embolism:technique and interpretation. Am J Roentgenol 1997;169(4):959–65.
[46] Hartmann IJ, Lo RT, Bakker J, De Monye W, van Waes PF, PattynamaPM. Optimal scan delay in spiral CT for the diagnosis of acutepulmonary embolism. J Comput Assist Tomogr 2002;26:21–5.
[47] Remy-Jardin M, Tillie-Leblond I, Szapiro D, et al. CT angiography ofpulmonary embolism in patients with underlying respiratory disease:

Z.A. Aziz et al. / European Journal of Radiology 52 (2004) 119–136 135
impact of multislice CT on image quality and negative predictivevalue. Eur Radiol 2002;12:1971–8.
[48] Remy-Jardin M, Remy J, Wattinne L, Giraud F. Central pulmonarythromboembolism: diagnosis with spiral volumetric CT with thesingle-breath-hold technique—comparison with pulmonary angiog-raphy. Radiology 1992;185(2):381–7.
[49] Goodman LR, Curtin JJ, Mewissen MW, et al. Detection of pul-monary embolism in patients with unresolved clinical and scinti-graphic diagnosis: helical CT versus angiography. Am J Roentgenol1995;164(6):1369–74.
[50] Remy-Jardin M, Remy J, Deschildre F, et al. Diagnosis of pulmonaryembolism with spiral CT: comparison with pulmonary angiographyand scintigraphy. Radiology 1996;200(3):699–706.
[51] Nilsson T, Olausson A, Johnsson H, Nyman U, Aspelin P. Negativespiral CT in acute pulmonary embolism. Acta Radiol 2002;43:486–91.
[52] Gottsater A, Berg A, Centergard J, Frennby B, Nirhov N, NymanU. Clinically suspected pulmonary embolism: is it safe to withholdanticoagulation after a negative spiral CT? Eur Radiol 2001;11:65–72.
[53] Swensen SJ, Sheedy PF, Ryu JH, et al. Outcomes after withholdinganticoagulation from patients with suspected acute pulmonary em-bolism and negative computed tomographic findings: a cohort study.Mayo Clin Proc 2002;77:130–8.
[54] Remy-Jardin M, Remy J, Cauvain O, Petyt L, Wannebroucq J,Beregi JP. Diagnosis of central pulmonary embolism with helical CT:role of two-dimensional multiplanar reformations. Am J Roentgenol1995;5:1131–8.
[55] Simon M, Boiselle PM, Choi JR, Rosen MP, Reynolds K, Rap-topoulos V. Paddle-wheel CT display of pulmonary arteries andother lung structures: a new imaging approach. Am J Roentgenol2001;177(1):195–8.
[56] Chiang EE, Boiselle PM, Raptopoulos V, Reynolds KF, Rosen MP,Simon M. Detection of pulmonary embolism: comparison of paddle-wheel and coronal CT reformations—initial experience. Radiology2003;228(2):577–82.
[57] Remy-Jardin M, Amara A, Campistron P, et al. Diagnosis ofbronchiectasis with multislice spiral CT: accuracy of 3 mm-thickstructured sections. Eur Radiol 2003;13(5):1165–71.
[58] Hansell DM. Bronchiectasis. Radiol Clin N Am 1998;36(1):107–28.
[59] Grenier P, Maurice F, Musset D, Menu Y, Nahum H. Bronchiectasis:assessment by thin-section CT. Radiology 1986;161:95–9.
[60] Kang EY, Miller RR, Muller NL. Bronchiectasis: comparison ofpreoperative thin-section CT and pathologic findings in resectedspecimens. Radiology 1995;195(3):649–54.
[61] Diederich S, Jurriaans E, Flower CDR. Interobserver variation in thediagnosis of bronchiectasis on high-resolution computed tomography.Eur Radiol 1996;6:801–6.
[62] Bankier AA, Fleischmann D, Mallek R, et al. Bronchial wall thick-ness: appropriate window settings for thin-section CT and radiologic-anatomic correlation. Radiology 1996;199(3):831–6.
[63] Lucidarme O, Grenier P, Coche E, Lenoir S, Aubert B, BeigelmanC. Bronchiectasis: comparative assessment with thin-section CT andhelical CT. Radiology 1996;200(3):673–9.
[64] van der Bruggen-Bogaarts BAHA, van der Bruggen HMJG, vanWaes PFGM, Lammers JW-J. Assessment of bronchiectasis: com-parison of HRCT and spiral volumetric CT. J Comput Assist Tomogr1996;20(1):15–9.
[65] Hansell DM, Rubens MB, Padley SPG, Wells AU. Obliterative bron-chiolitis: individual CT signs of small airways disease and functionalcorrelation. Radiology 1997;203:721–6.
[66] Stern EJ, Frank MS. Small-airways disease of the lungs: findings atexpiratory CT. Am J Roentgenol 1994;163:37–41.
[67] Hansell DM. HRCT of obliterative bronchiolitis and other smallairways diseases. Semin Roentgenol 2001;36:51–65.
[68] Padley SP, Adler BD, Hansell DM, Muller NL. Bronchiolitis oblit-erans: high resolution CT findings and correlation with pulmonaryfunction tests. Clin Radiol 1993;47:236–40.
[69] Miller Jr WT, Kotloff RM, Blumenthal NP, Aronchick JM, GefterWB, Miller WT. Utility of high resolution computed tomographyin predicting bronchiolitis obliterans syndrome following lung trans-plantation: preliminary findings. J Thorac Imaging 2001;16:76–80.
[70] Arakawa H, Webb WR, McCowin M, Katsou G, Lee KN, Seitz RF.Inhomogeneous lung attenuation at thin-section CT: diagnostic valueof expiratory scans. Radiology 1998;206(1):89–94.
[71] Lucidarme O, Coche E, Cluzel P, Mourey-Gerosa I, Howarth N,Grenier P. Expiratory CT scans for chronic airway disease: cor-relation with pulmonary function test results. Am J Roentgenol1998;170:301–7.
[72] Arakawa H, Niimi H, Kurihara Y, Nakajima Y, Webb WR. Expiratoryhigh-resolution CT: diagnostic value in diffuse lung diseases. Am JRoentgenol 2000;175(6):1537–43.
[73] Stern EJ, Swensen SJ, Hartman TE, Frank MS. CT mosaic pattern oflung attenuation: distinguishing different causes. Am J Roentgenol1995;165:813–6.
[74] Arakawa H, Kurihara Y, Sasaka K, Nakajima Y, Webb WR. Air trap-ping on CT of patients with pulmonary embolism. Am J Roentgenol2002;178:1201–7.
[75] Leung AN, Fisher K, Valentine V, Girgis RE, Berry GJ, RobbinsRC, Theodore J. Bronchiolitis obliterans after lung transplantation:detection using expiratory HRCT. Chest 1998;113(2):365–70.
[76] Lee ES, Gotway MB, Reddy GP, Golden JA, Keith FM, Webb WR.Early bronchiolitis obliterans following lung transplantation: accuracyof expiratory thin-section CT for diagnosis. Radiology 2000;216:472–7.
[77] Bankier AA, Van Muylem A, Knoop C, Estenne M, Gevenois PA.Bronchiolitis obliterans syndrome in heart-lung transplant recipients:diagnosis with expiratory CT. Radiology 2001;218:533–9.
[78] Lucidarme O, Grenier PA, Cadi M, Mourey-Gerosa I, BenaliK, Cluzel P. Evaluation of air trapping at CT: comparison ofcontinuous-versus suspended-expiration CT techniques. Radiology2000;216(3):768–72.
[79] Gotway MB, Lee ES, Reddy GP, Golden JA, Webb WR. Low-dosedynamic expiratory thin-section CT of the lungs using a spiral CTscanner. J Thorac Imaging 2000;15:168–72.
[80] Fotheringham T, Chabat F, Hansell DM, et al. A comparison ofmethods for enhancing the detection of areas of decreased attenu-ation on CT caused by airways disease. J Comput Assist Tomogr1999;23:385–9.
[81] Tan BB, Flaherty KR, Kazerooni EA, Iannettoni MD. The solitarypulmonary nodule. Chest 2003;123(1 Suppl):89S–96S.
[82] Tang AW, Moss HA, Robertson RJ. The solitary pulmonary nodule.Eur J Radiol 2003;45(1):69–77.
[83] Leung AN. Spiral CT of the thorax in daily practice: optimizationof technique. J Thorac Imaging 1997;12(1):2–10.
[84] Swensen SJ. Focal lung disease: CT and high-resolution CT appli-cations. Radiographics 1994;14(1):169–81.
[85] Takahashi M, Maguire WM, Ashtari M, et al. Low-dose spiral com-puted tomography of the thorax: comparison with the standard-dosetechnique. Invest Radiol 1998;33(2):68–73.
[86] Wildberger JE, Mahnken AH, Schmitz-Rode T, et al. Individuallyadapted examination protocols for reduction of radiation exposure inchest CT. Invest Radiol 2001;36(10):604–11.
[87] Boiselle PM, Reynolds KF, Ernst A. Multiplanar and three-dimensional imaging of the central airways with multidetector CT.Am J Roentgenol 2002;179(2):301–8.
[88] Lawler LP, Corl FM, Haponik EF, Fishman EK. Multidetector rowcomputed tomography and 3-dimensional volume rendering for adultairway imaging. Curr Probl Diagn Radiol 2002;31(4):115–33.
[89] Naidich DP, Gruden JF, McGuinness G, McCauley DI, Bhalla M.Volumetric (helical/spiral) CT (VCT) of the airways. J Thorac Imag-ing 1997;12(1):11–28.

136 Z.A. Aziz et al. / European Journal of Radiology 52 (2004) 119–136
[90] Ferretti GR, Knoplioch J, Bricault I, Brambilla C, CoulombM. Central airway stenoses: preliminary results of spiral-CT-generated virtual bronchoscopy simulations in 29 patients. Eur Ra-diol 1997;7(6):854–9.
[91] Grenier PA, Beigelman-Aubry C, Fetita C, Preteux F, Brauner MW,Lenoir S. New frontiers in CT imaging of airway disease. Eur Radiol2002;12(5):1022–44.
[92] Ravenel JG, McAdams HP, Remy-Jardin M, Remy J. Multidimen-sional imaging of the thorax: practical applications. J Thorac Imaging2001;16:269–81.
[93] Remy-Jardin M, Remy J, Artaud D, Fribourg M, Duhamel A.Volume rendering of the tracheobronchial tree: clinical eval-uation of bronchographic images. Radiology 1998;208(3):761–70.
[94] Remy-Jardin M, Remy J, Artaud D, Fribourg M, Naili A. Tracheo-bronchial tree: assessment with volume rendering—technical aspects.Radiology 1998;208(2):393–8.
[95] Quint LE, Whyte RI, Kazerooni EA. Stenosis of the central airways:evaluation by using helical CT with multiplanar reconstructions.Radiology 1995;194:871–7.
[96] Kauczor HU, Wolcke B, Fischer B, Mildenberger P, Lorenz J, ThelenM. Three-dimensional helical CT of the tracheobronchial tree: eval-uation of imaging protocols and assessment of suspected stenoseswith bronchoscopic correlation. Am J Roentgenol 1996;167:419–24.
[97] Summers RH, Feng DH, Holland SM, Sneller MC, Shelhamer JH.Virtual bronchoscopy: segmentation method for real-time display.Radiology 1996;200:857–62.
[98] Fleiter T, Merkle EM, Aschoff AJ, et al. Comparison ofreal-time virtual and fiberoptic bronchoscopy in patients withbronchial carcinoma: opportunities and limitations. Am J Roentgenol1997;169(6):1591–5.
[99] Brink JA, Woodard PK, Horesh L, et al. Depiction of pulmonaryemboli with spiral CT: optimization of display window settings in aporcine model. Radiology 1997;204(3):703–8.